Seismogenic Source Model of the 2019, Mw 5.9, East-Azerbaijan Earthquake (NW Iran) through the Inversion of Sentinel-1 DInSAR Measurements

 , , , , ,
  , and
, and
Abstract
:
1. Introduction
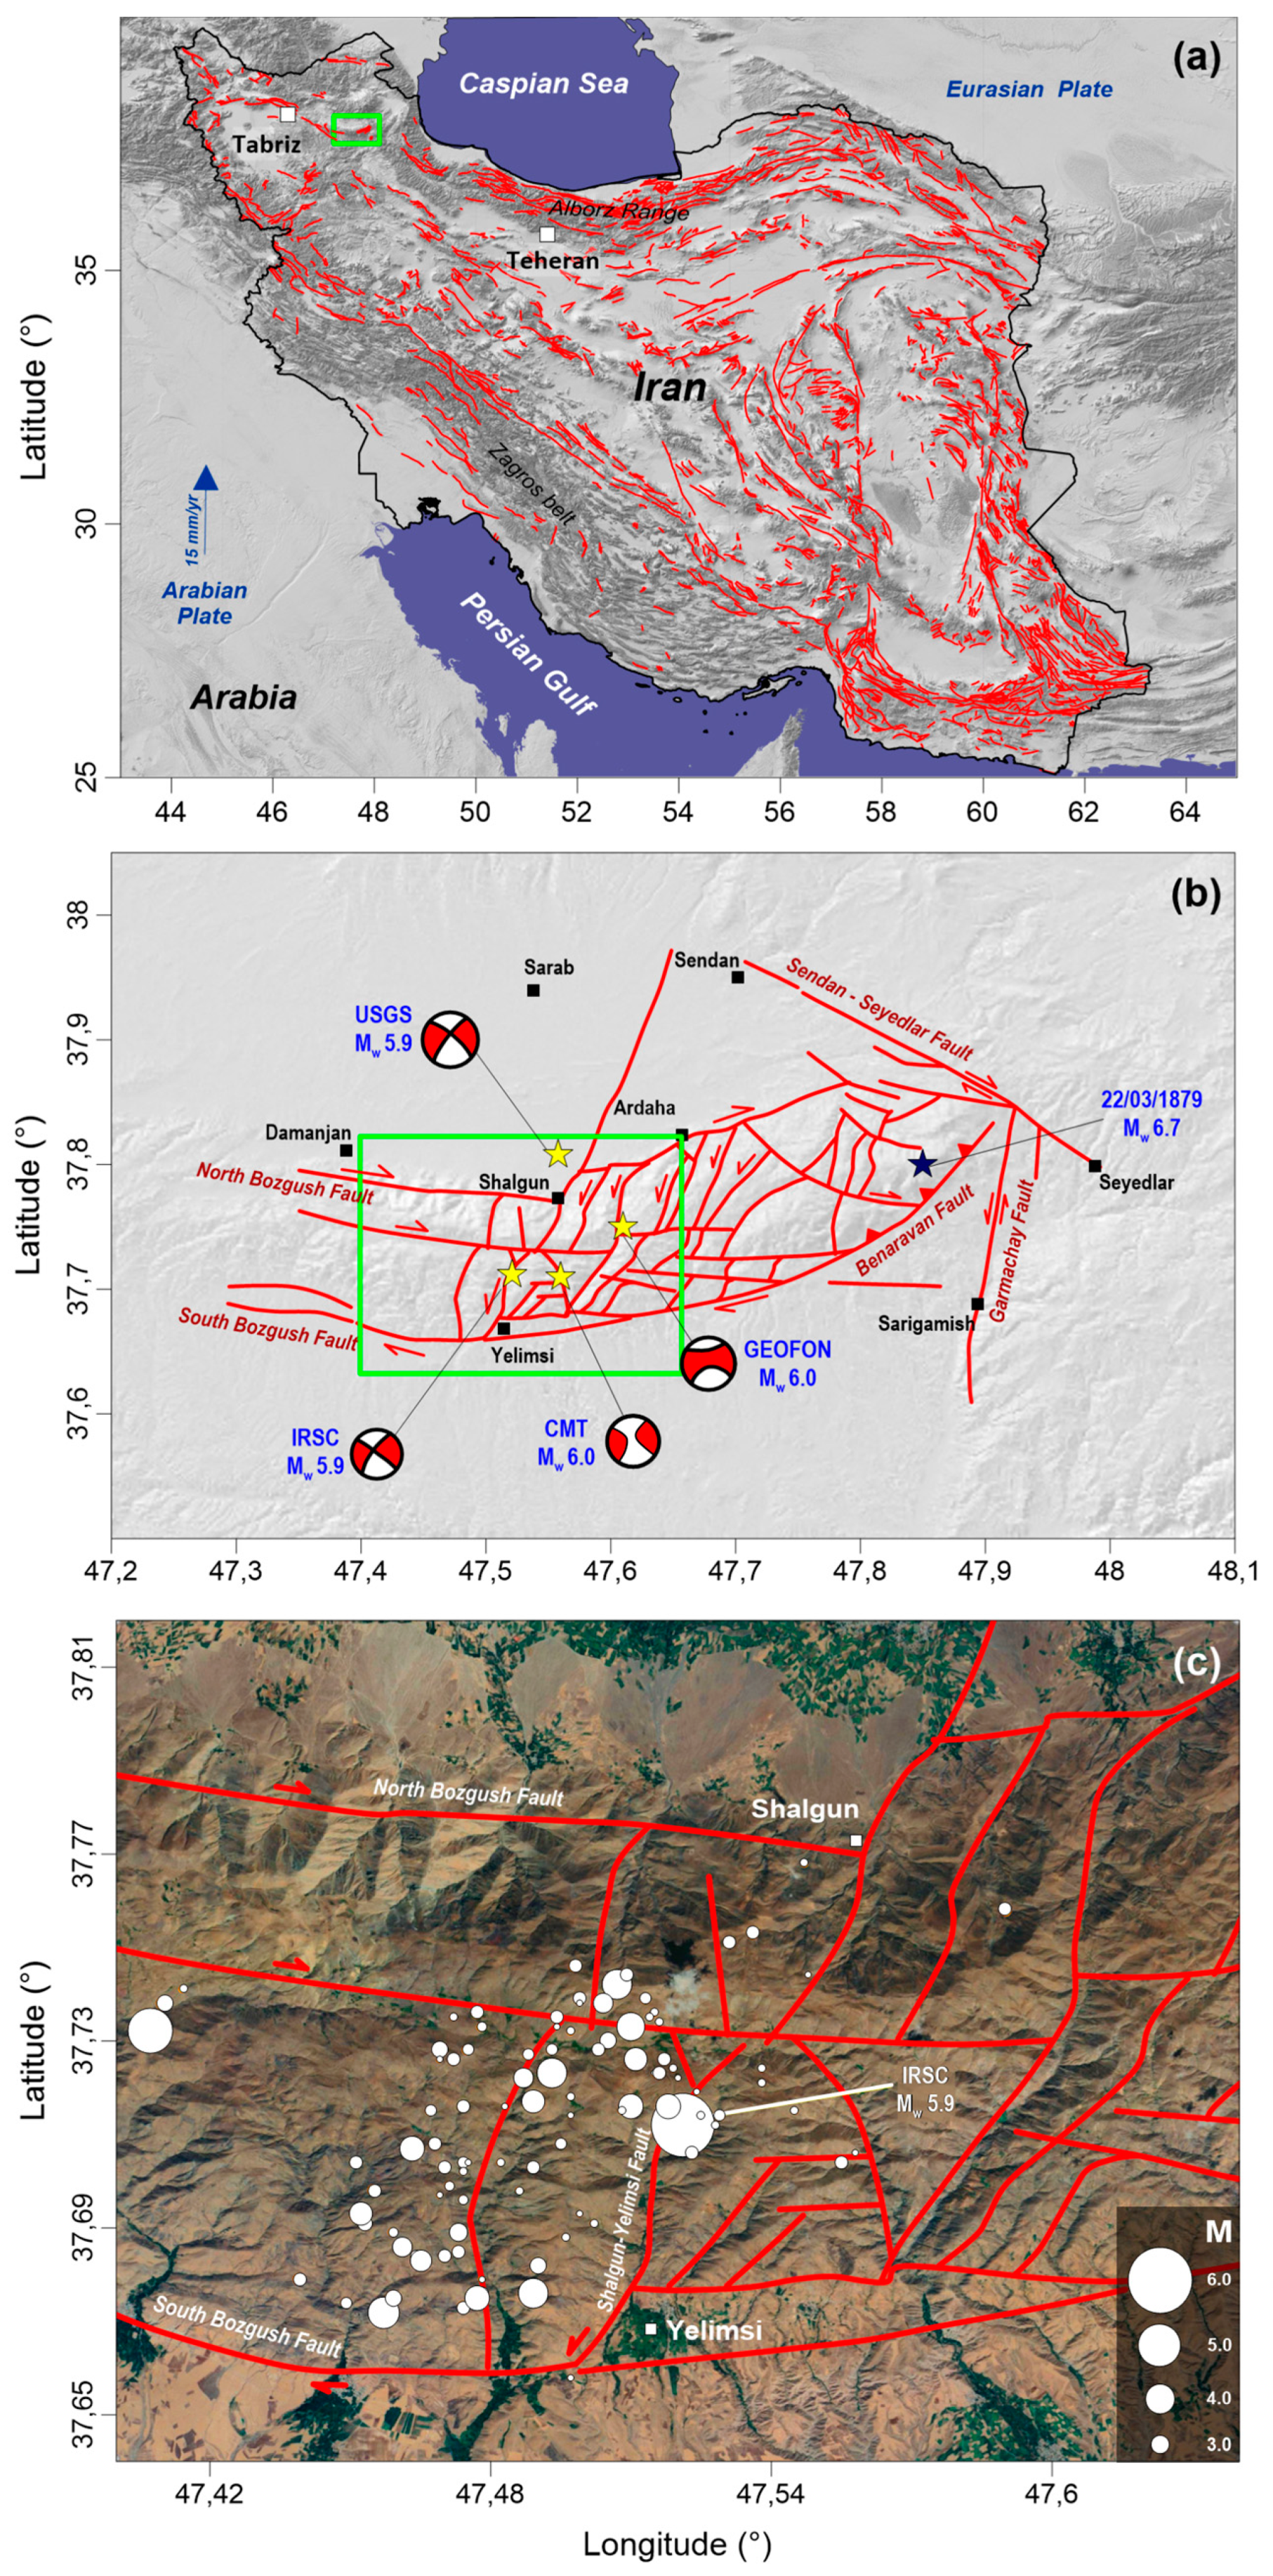
2. Tectonic Setting
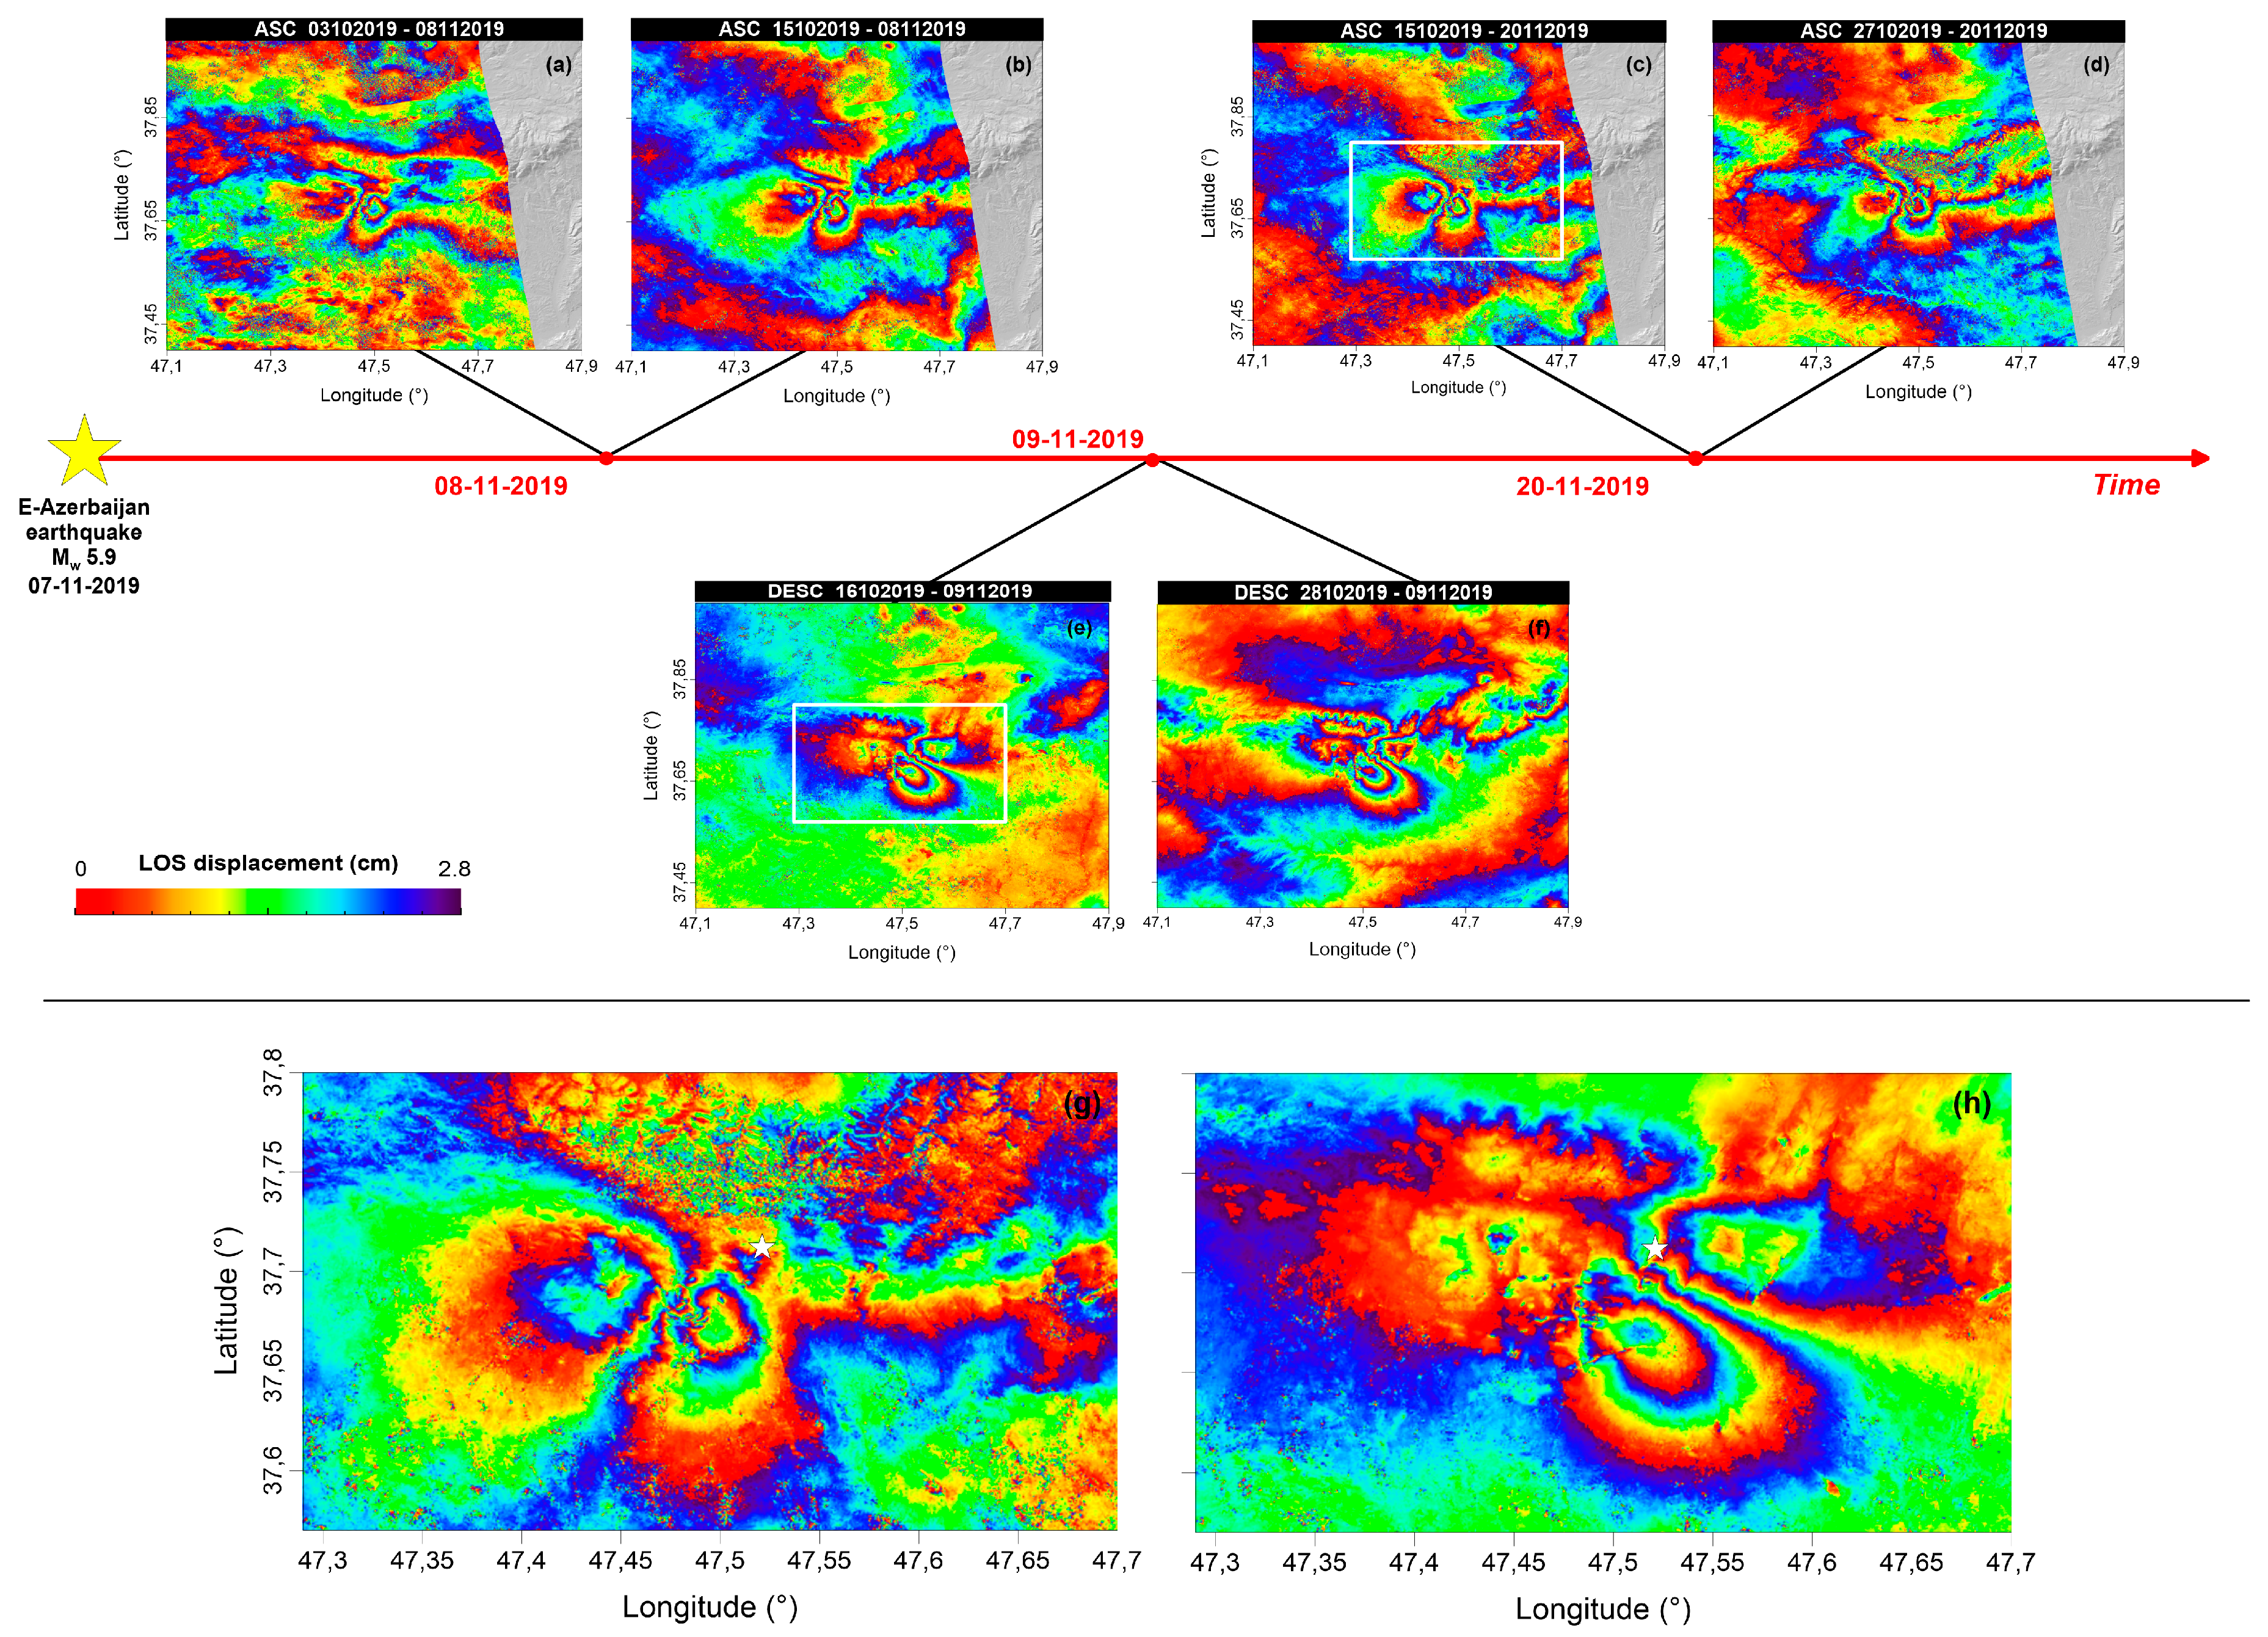
3. DInSAR Measurements
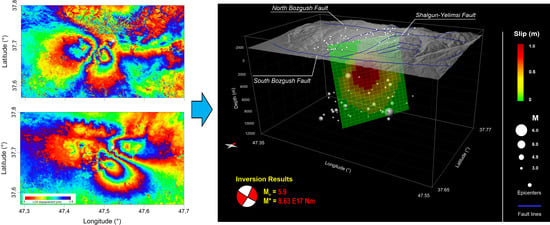
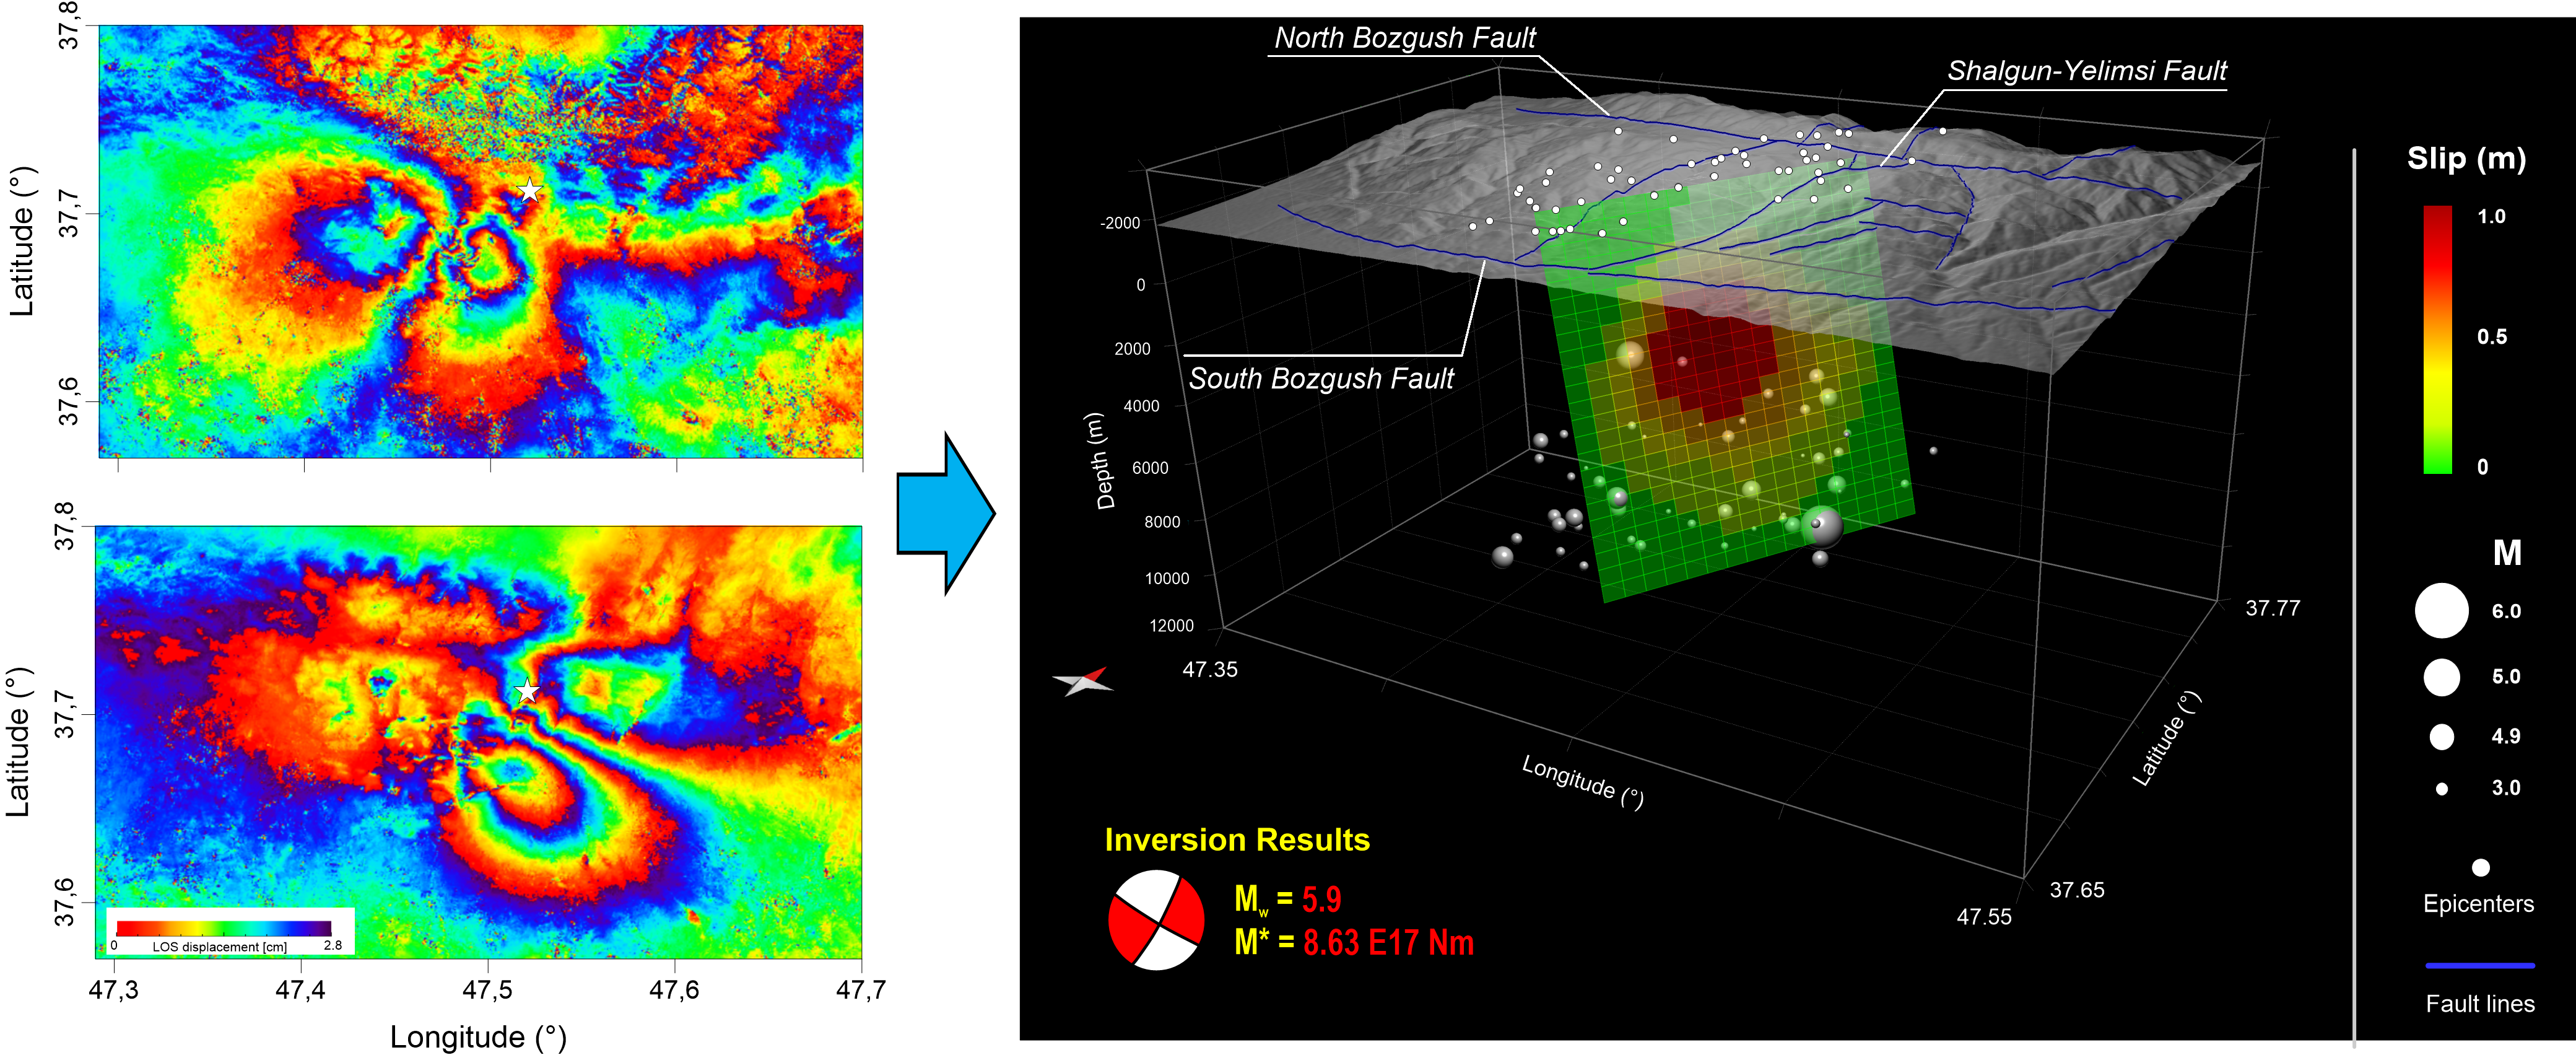
4. Modelling
4.1. Analytical Modelling
4.2. Coulomb Failure Function
5. Discussion
6. Conclusions
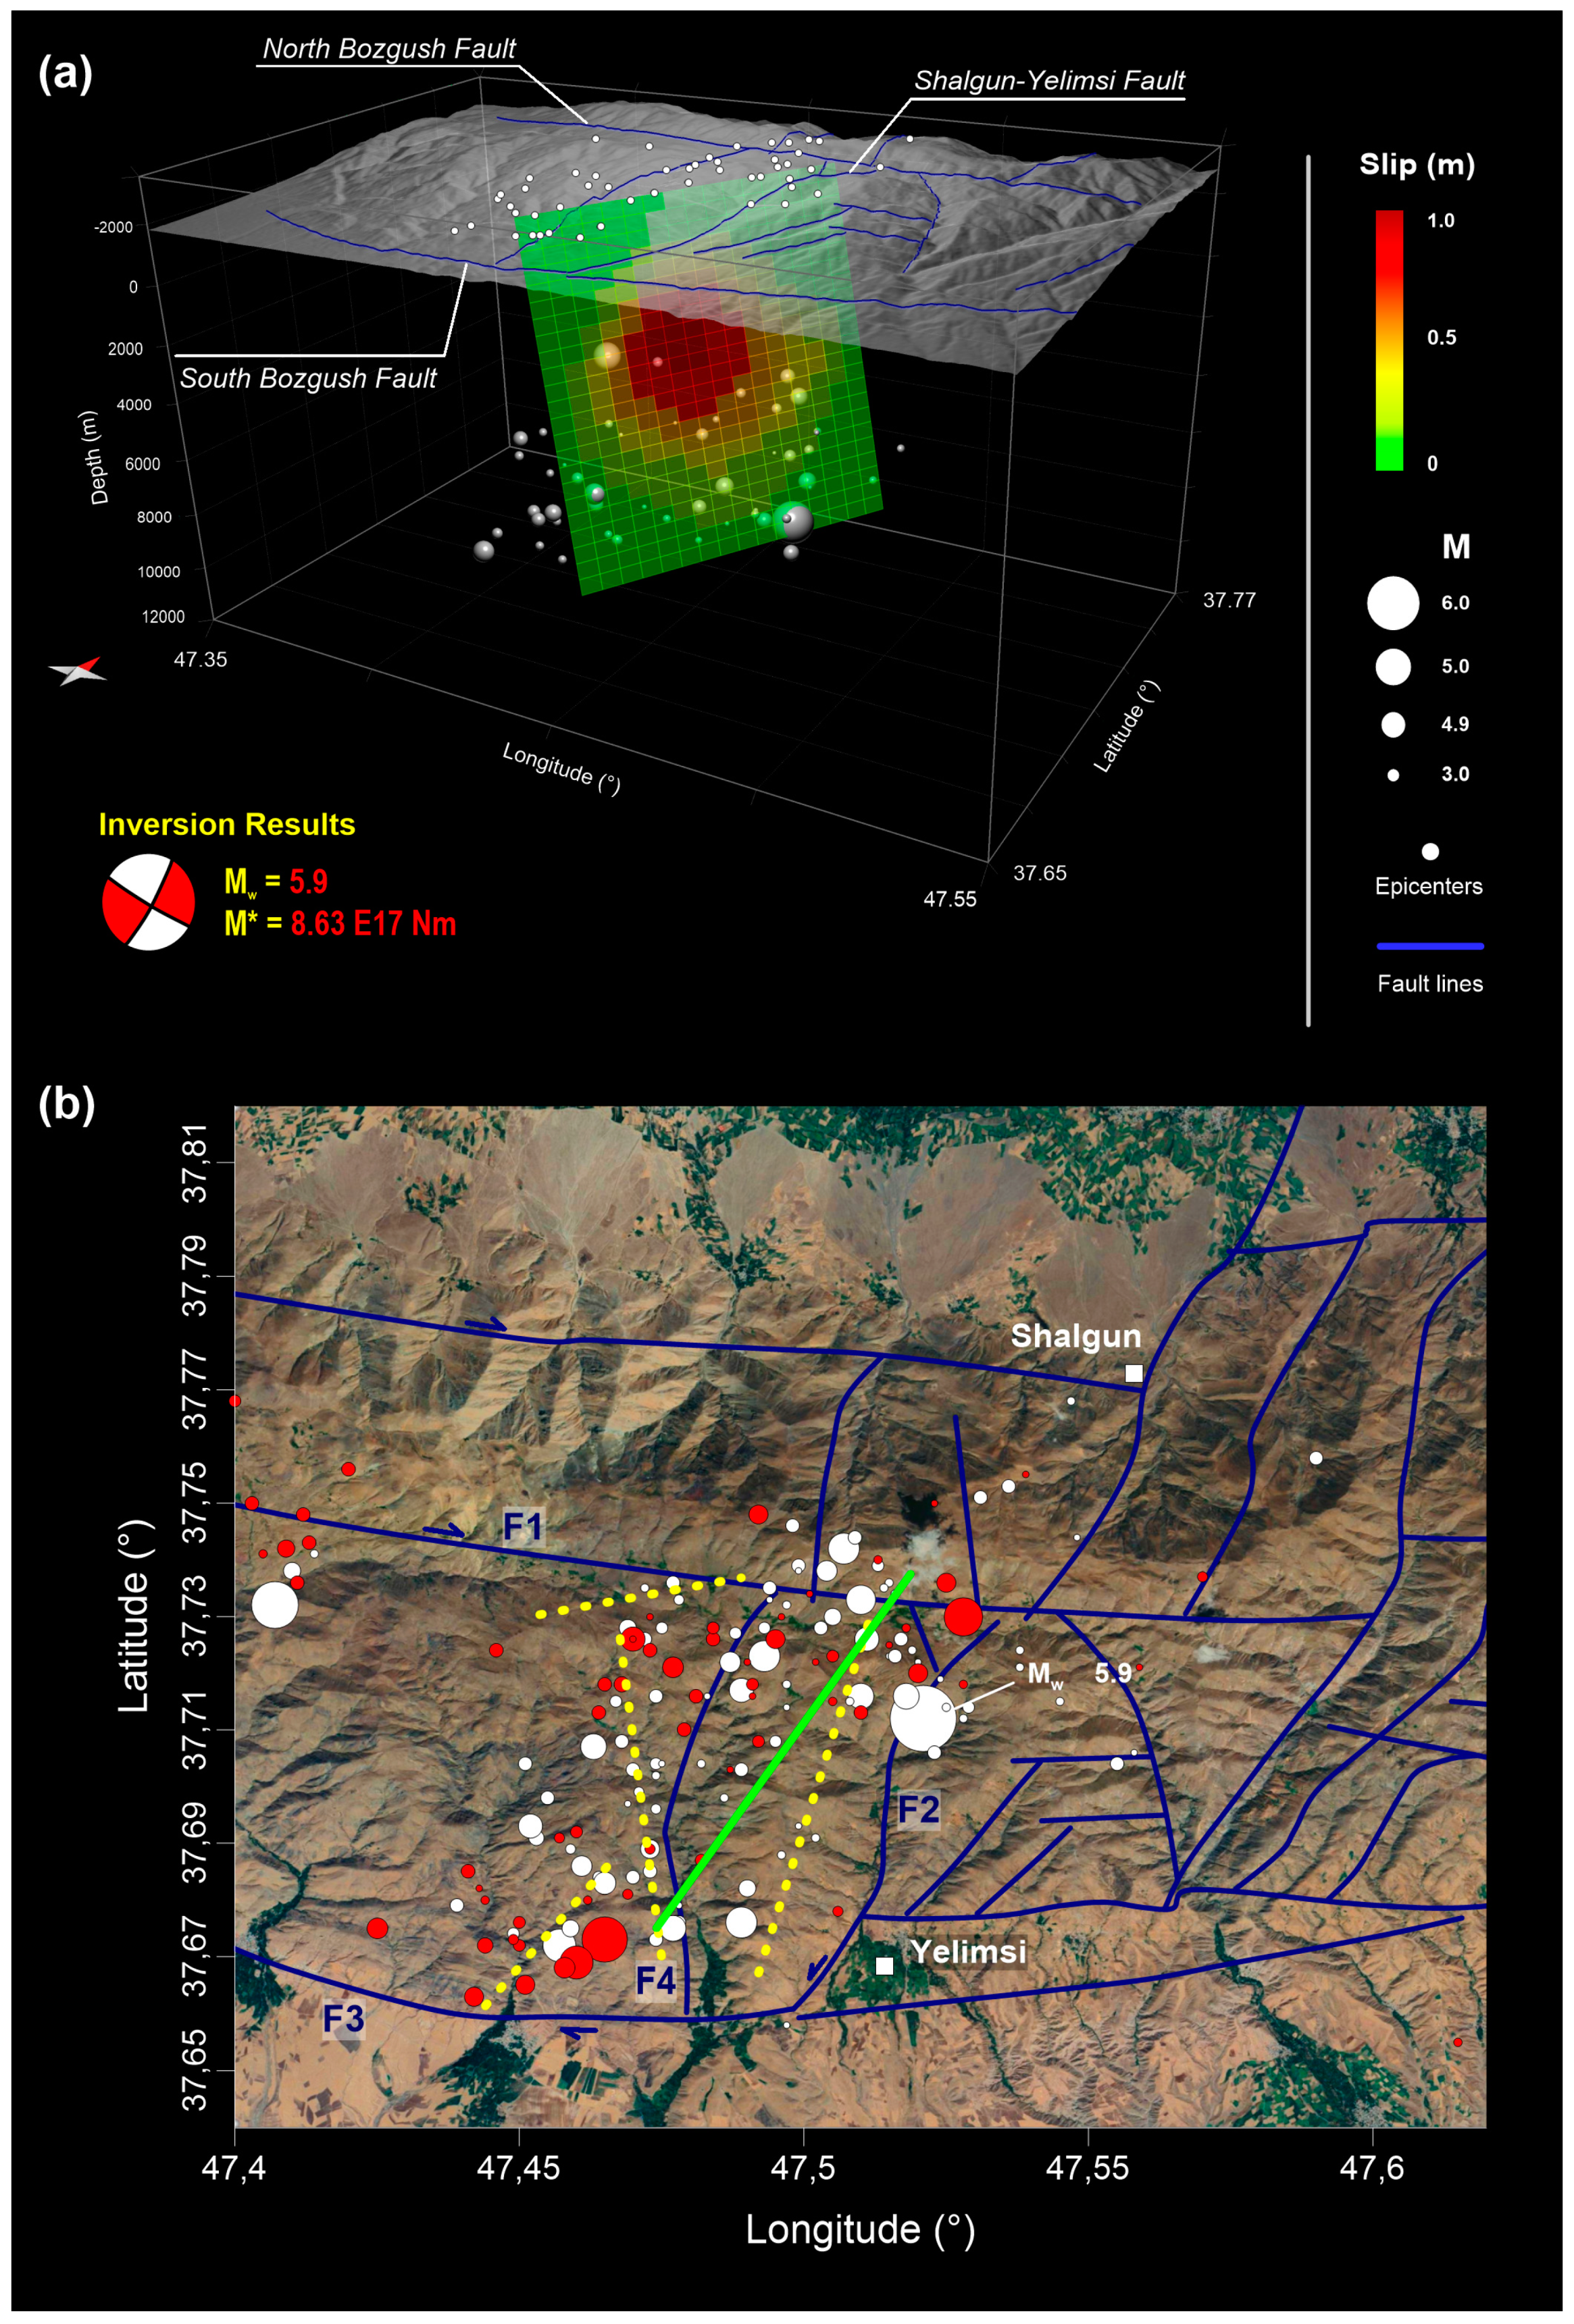
- The source model reveals a rather shallow seismic structure approximately NE–SW-striking and characterized by a left-lateral strike-slip, southeast-dipping faulting mechanism. The retrieved source reveals a minor fault not mapped in the geological maps available in the open literature, but it is characterized by a kinematics compatible with that of the surrounding structures, the local and regional stress states and with some of the field observations.
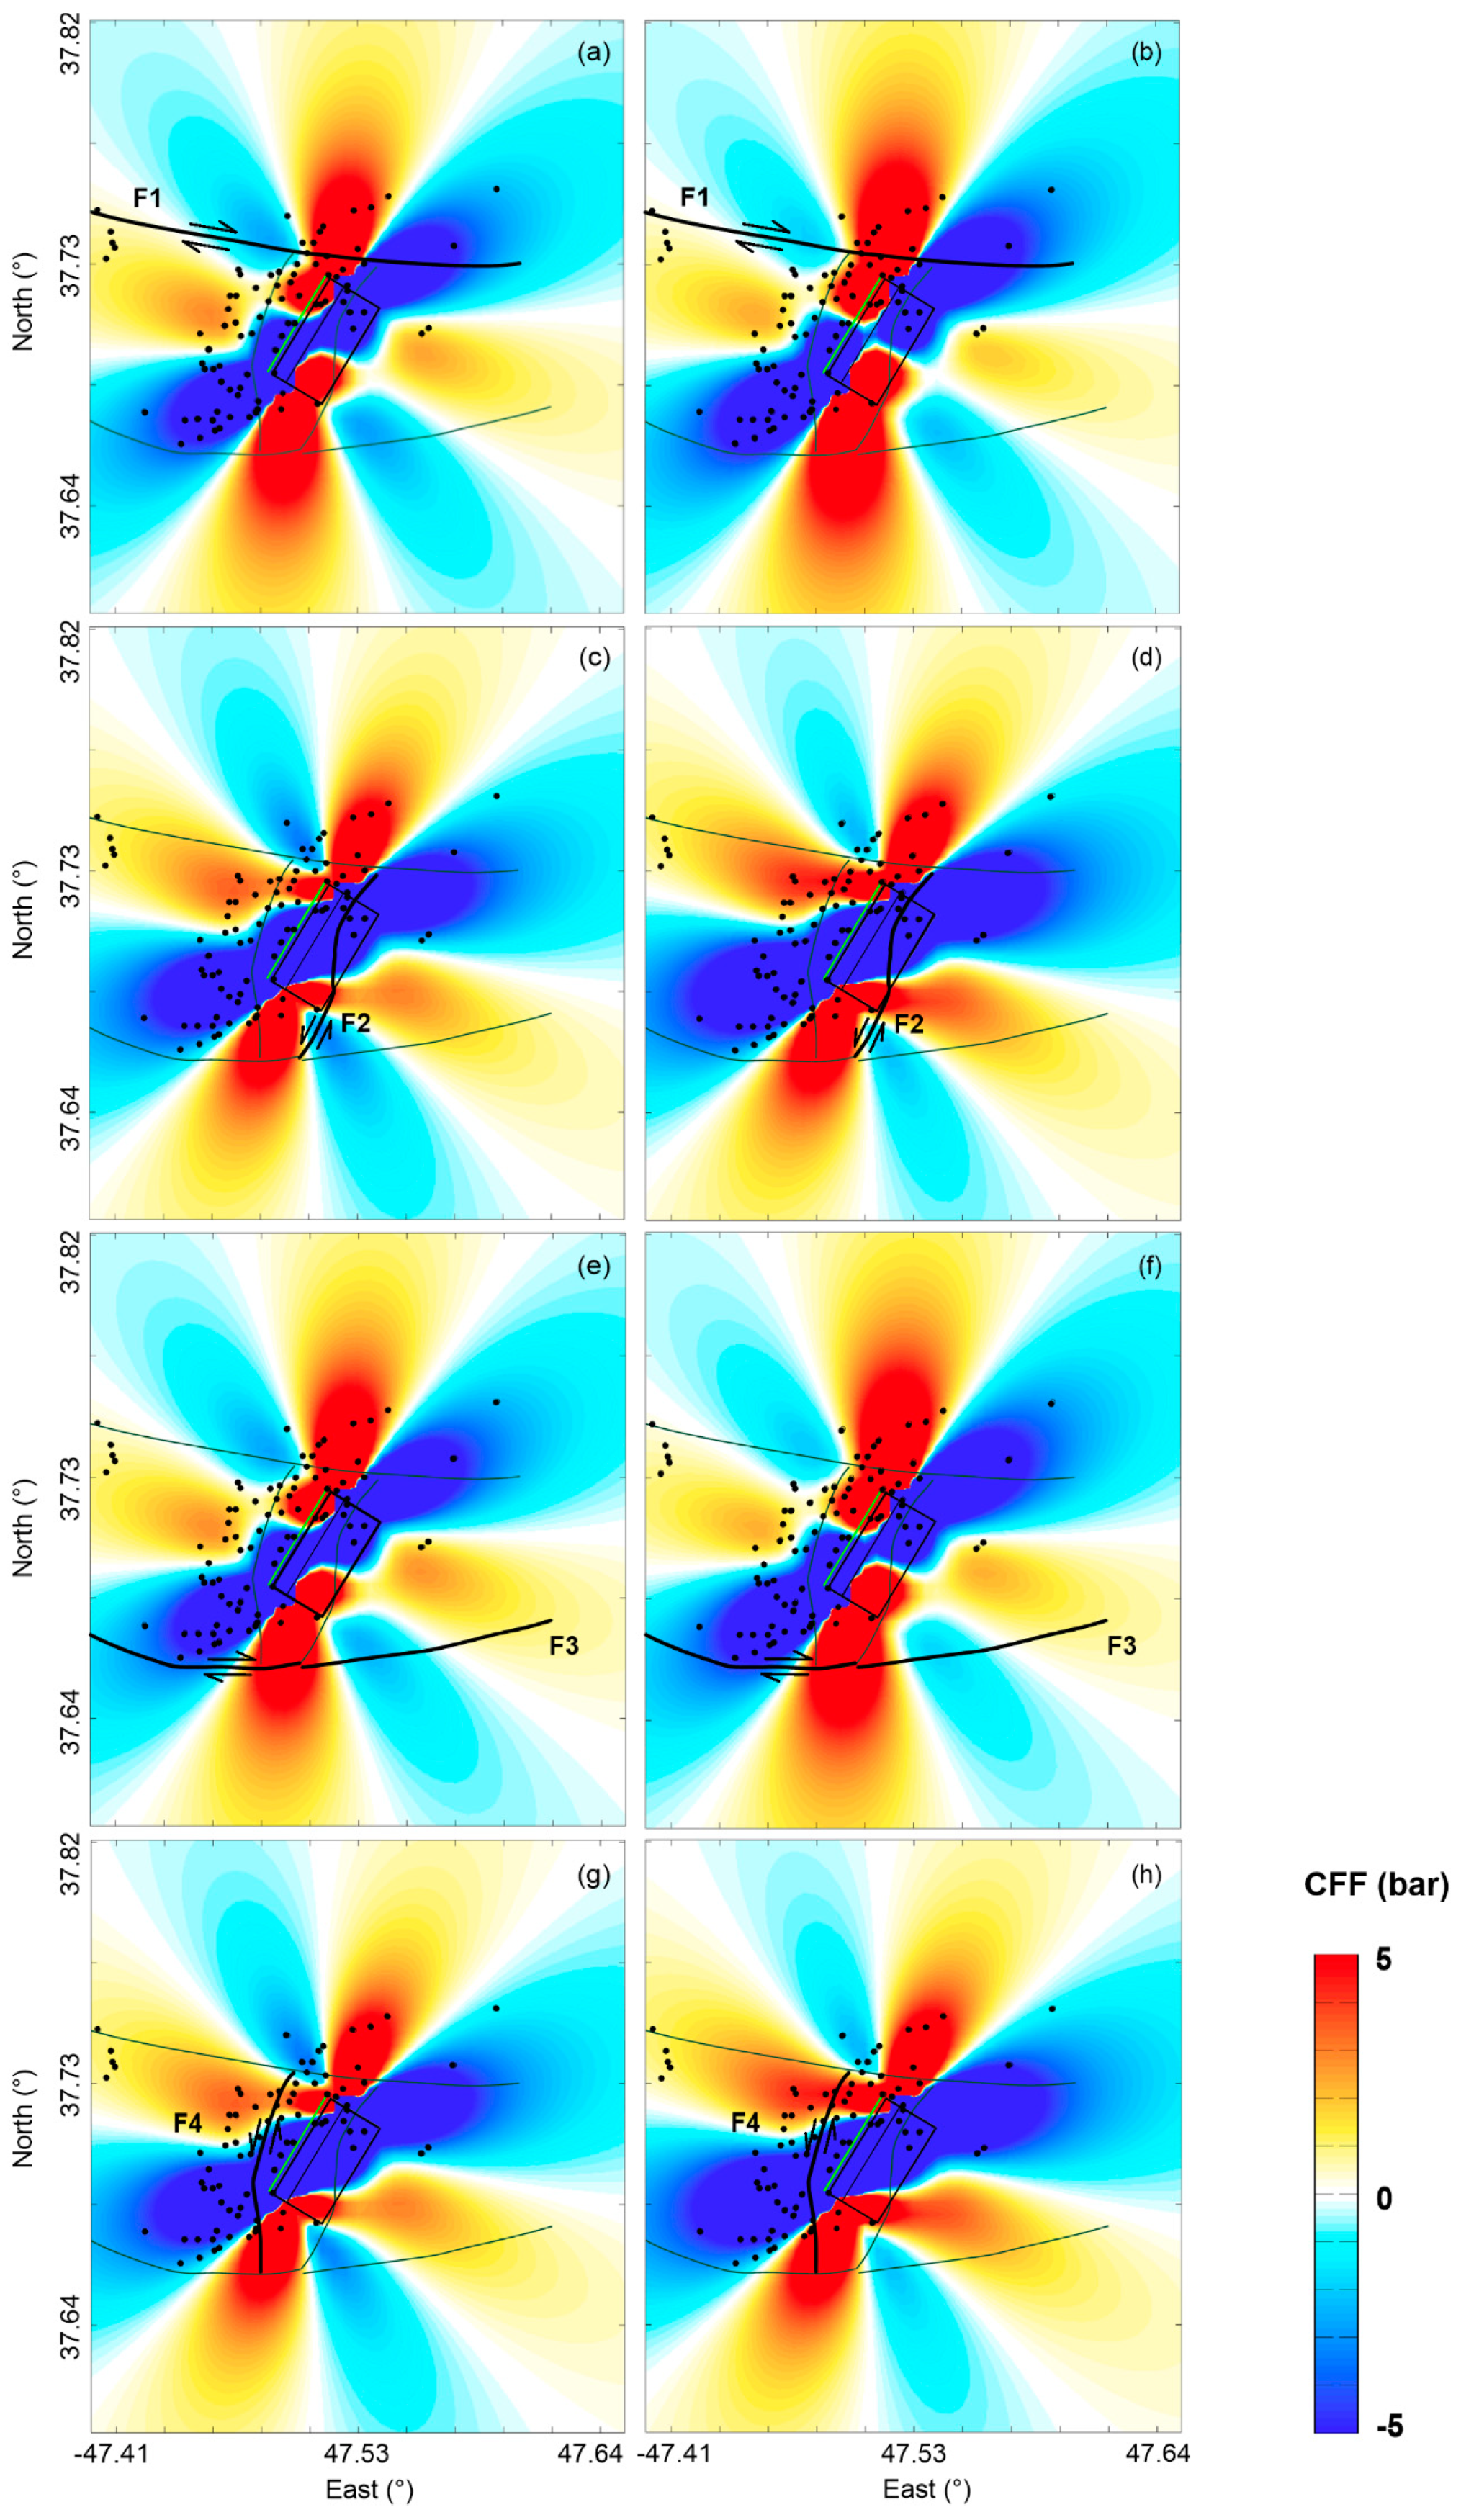
- Starting from the retrieved fault model characteristics and by considering the known surrounding geological structures, we have performed an analysis of the Coulomb stress transfer on the nearby faults, in order to investigate possible fault interaction processes. Our results indicate that the considered receiver faults may have been positively stressed by the main event and this is confirmed by the aftershocks distribution.
- The analysis of the seismic events nucleated along the left-lateral strike-slip minor faults of the East-Azerbaijan Plateau, such as the one analyzed in this work, is essential to improve our knowledge of the seismic hazard estimation in northwestern Iran.
Supplementary Materials
Author Contributions
Funding
Acknowledgments
Conflicts of Interest
References
- Broadband Iranian Network. Available online: http://www.iiees.ac.ir/en/iranian-national-broadband-seismic-network/ (accessed on 15 January 2020).
- Iranian Seismological Center. Available online: http://irsc.ut.ac.ir/ (accessed on 15 January 2020).
- U.S. Geological Survey. Earthquake Facts and Statistics. 2017. Available online: https://earthquake.usgs.gov/earthquakes/browse/stats.php (accessed on 22 March 2018).
- GEOFON Data Centre. GEOFON Seismic Network. Deutsches GeoForschungsZentrum GFZ. Other/Seism. Netw. 1993. [Google Scholar] [CrossRef]
- Dziewonski, A.M.; Chou, T.A.; Woodhouse, J.H. Determination of earthquake source parameters from waveform data for studies of global and regional seismicity. J. Geophys. Res. 1981, 86, 2825–2852. [Google Scholar] [CrossRef]
- Ekström, G.; Nettles, M.; Dziewonski, A.M. The global CMT project 2004–2010: Centroid-moment tensors for 13,017 earthquakes. Phys. Earth Planet. Inter. 2012, 200–201, 1–9. [Google Scholar] [CrossRef]
- Zamani, B.; Masson, F. Recent tectonics of East (Iranian) Azerbaijan from stress state reconstructions. Tectonophysics 2014, 611, 61–82. [Google Scholar] [CrossRef]
- Faridi, M.; Burg, J.P.; Nazari, H.; Talebian, M.; Ghorashi, M. Active faults pattern and interplay in the Azerbaijan region (NW Iran). Geotectonics 2017, 51, 428–437. [Google Scholar] [CrossRef]
- Berberian, M.; Yeats, R.S. Patterns of historical earthquake rupture in the Iranian Plateau. Bull. Seism. Soc. Am. 1999, 89, 120–139. [Google Scholar]
- Jackson, J.; McKenzie, D. Active tectonics of the Alpine-Himalayan Belt between western Turkey and Pakistan. Geophys. J. Int. 1984, 77, 185–264. [Google Scholar] [CrossRef]
- Jackson, J.; McKenzie, D. The relationship between plate motions and seismic moment tensors, and the rates of active deformation in the Mediterranean and Middle East. Geophys. J. Int. 1988, 93, 45–73. [Google Scholar] [CrossRef] [Green Version]
- Jackson, J. Partitioning of strike-slip and convergent motion between Eurasia and Arabia in eastern Turkey and Caucasus. J. Geophys. Res. 1992, 97, 12471–12479. [Google Scholar] [CrossRef]
- McClusky, S.; Balassanian, S.; Barka, A.; Demir, C.; Ergintav, S.; Georgiev, I.; Gurkan, O.; Hamburger, M.; Hurst, K.; Kahle, H.; et al. Global Positioning System constraints on plate kinematics and dynamics in the eastern Mediterranean and Caucasus. J. Geophys. Res. Solid Earth 2000, 105, 5695–5719. [Google Scholar] [CrossRef]
- Vernant, P.; Nilforoushan, F.; Hatzfeld, D.; Abbassi, M.R.; Vigny, C.; Masson, F.; Nankali, H.; Martinod, J.; Ashtiani, A.; Bayer, R.; et al. Present-day crustal deformation and plate kinematics in the Middle East constrained by GPS measurements in Iran and northern Oman. Geophys. J. Int. 2004, 157, 381–398. [Google Scholar] [CrossRef] [Green Version]
- Copley, A.; Jackson, J. Active tectonics of the Turkish–Iranian Plateau. Tectonics 2006, 25. [Google Scholar] [CrossRef]
- Reilinger, R.; McClusky, S.; Vernant, P.; Lawrence, S.; Ergintav, S.; Cakmak, R.; Ozener, H.; Kadirov, F.; Guliev, I.; Stepanyan, R.; et al. GPS constraints on continental deformation in the Africa–Arabia–Eurasia continental collision zone and implications for the dynamics of plate interactions. J. Geophys. Res. Solid Earth 2006, 111. [Google Scholar] [CrossRef]
- Copley, A.; Faridi, M.; Ghorashi, M.; Hollingsworth, J.; Jackson, J.; Nazari, H.; Oveisi, B.; Talebian, M. The 2012 August 11 Ahar earthquakes: Consequences for tectonics and earthquake hazard in the Turkish–Iranian Plateau. Geophys. J. Int. 2013, 196, 15–21. [Google Scholar] [CrossRef] [Green Version]
- Jackson, J.; Haines, J.; Holt, W. The accommodation of Arabia-Eurasia plate convergence in Iran. J. Geophys. Res. Solid Earth 1995, 100, 15205–15219. [Google Scholar] [CrossRef]
- Engdahl, E.R.; van der Hilst, R.; Buland, R. Global teleseismic earthquake relocation with improved travel times and procedures for depth determination. Bull. Seism. Soc. Am. 1998, 88, 722–743. [Google Scholar]
- Engdahl, E.R.; Jackson, J.A.; Myers, S.C.; Bergman, E.A.; Priestley, K. Relocation and assessment of seismicity in the Iran region. Geophys. J. Int. 2006, 167, 761–778. [Google Scholar] [CrossRef] [Green Version]
- Solaymani Azad, S.; Esmaeili, C.; Roustai, M.; Vajedian, S.; Sartipi, A.; Khosh Zare, T.; Rajab Zadeh, H.R. The Geological features of the Torkmanchai NW Iran Earthquake on November 8, 2019 (Mw=5.9). Geol. Surv. Miner. Exploit. Iran 2019. Available online: https://www.gsi.ir/en/news/24204/the-geological-features-of-the-torkmanchai-nw-iran-earthquake-on-november-8-2019-mw-5.9- (accessed on 4 March 2020).
- Major Faults in Iran (flt2cg), U.S. Government’s Open Data. Available online: https://catalog.data.gov/dataset/major-faults-in-iran-flt2cg-73f76 (accessed on 1 April 2020).
- Djamour, Y.; Vernant, P.; Nankali, H.; Tavakoli, F. NW Iran–eastern Turkey present-day kinematics: Results from the Iranian permanent GPS network. Earth Planet. Sci. Lett. 2011, 307, 27–34. [Google Scholar] [CrossRef]
- Berberian, M.; Arshadi, S. On the evidence of the youngest activity of the North Tabriz Fault and the seismicity of Tabriz city. Geol. Surv. Iran Rep. 1976, 39, 397–418. [Google Scholar]
- Ambraseys, N.N.; Melville, C.P. A History of Persian Earthquakes; Cambridge University Press: Cambridge, UK, 2005. [Google Scholar]
- Solaymani Azad, S.; Philip, H.; Dominguez, S.; Hessami, K.; Shahpasandzadeh, M.; Foroutan, M.; Tabassi, H.; Lamothe, M. Paleoseismological and morphological evidence of slip rate variations along the North Tabriz fault (NW Iran). Tectonophysics 2015, 640–641, 20–38. [Google Scholar] [CrossRef] [Green Version]
- Massonnet, D.; Rossi, M.; Carmona, C.; Adragna, F.; Peltzer, G.; Feigl, K.; Rabaute, T. The displacement field of the Landers earthquake mapped by radar interferometry. Nature 1993, 364, 138. [Google Scholar] [CrossRef]
- Fornaro, G.; Franceschetti, G.; Lanari, R.; Rossi, D.; Tesauro, M. Interferometric SAR phase unwrapping using the finite element method. IEE Proc. Radar Sonar Navig. 1997, 144, 266–274. [Google Scholar] [CrossRef]
- Costantini, M. A novel phase unwrapping method based on network programming. IEEE Trans. Geosci. Remote Sens. 1998, 36, 813–821. [Google Scholar] [CrossRef]
- Atzori, S.; Hunstad, I.; Chini, M.; Salvi, S.; Tolomei, C.; Bignami, C.; Stramondo, S.; Trasatti, E.; Antonioli, A.; Boschi, E. Finite fault inversion of DInSAR coseismic displacement of the 2009 L’Aquila earthquake (Central Italy). Geophys. Res. Lett. 2009, 36, L15305. [Google Scholar] [CrossRef]
- Okada, Y. Surface deformation due to shear and tensile faults in a half-space. Bull. Seism. Soc. Am. 1985, 75, 1135–1154. [Google Scholar]
- Marquardt, D.W. An algorithm for least-squares estimation of nonlinear parameters. J. Soc. Ind. Appl. Math. 1963, 11, 431–441. [Google Scholar] [CrossRef]
- Menke, W. Geophysical Data Analysis: Discrete Inverse Theory, 1st ed.; Academic Press Inc.: New York, NY, USA, 1984; ISBN 9780080507323. [Google Scholar]
- Harris, R.A. Introduction to Special Section: Stress Triggers, Stress Shadows, and Implications for Seismic Hazard. J. Geophys. Res. Solid Earth 1998, 103, 24347–24358. [Google Scholar] [CrossRef]
- Stein, R.S. The role of stress transfer in earthquake occurrence. Nature 1999, 402, 605–609. [Google Scholar] [CrossRef]
- Hill, D.P. Dynamic stresses, Coulomb failure, and remote triggering. Bull. Seism. Soc. Am. 2008, 98, 66–92. [Google Scholar] [CrossRef]
- Stein, R.; King, G.C.P.; Lin, J. Change in failure stress on the southern San Andreas fault system caused by the 1992 magnitude 7.4 Landers earthquake. Science 1992, 258, 1328–1332. [Google Scholar] [CrossRef] [PubMed]
- King, G.C.P.; Stein, R.S.; Lin, J. Static stress changes and the triggering of earthquakes. Bull. Seismol. Soc. Amer. 1994, 84, 935–953. [Google Scholar]
- Reasenberg, P.; Simpson, R. Response of regional seismicity to the static stress change produced by the Loma Prieta Earthquake. Science 1992, 255, 1687–1690. [Google Scholar] [CrossRef] [PubMed]
- Lin, J.; Stein, R.S. Stress triggering in thrust and subduction earthquakes, and stress interaction between the southern San Andreas and nearby thrust and strike-slip faults. J. Geophys. Res. 2004, 109, B02303. [Google Scholar] [CrossRef] [Green Version]
- Toda, S.; Stein, R.S.; Richards-Dinger, K.; Bozkurt, S. Forecasting the evolution of seismicity in southern California: Animations built on earthquake stress transfer. J. Geophys. Res. 2005, 110. [Google Scholar] [CrossRef]
- Su, Z.; Yang, Y.; Li, Y.; Xu, X.; Zhang, J.; Zhou, X.; Ren, J.; Wang, E.; Hu, J.-C.; Zhang, S.; et al. Coseismic displacement of the 5 April 2017 Mashhad earthquake (Mw 6.1) in NE Iran through Sentinel-1A TOPS data: New implications for the strain partitioning in the southern Binalud Mountains. J. Asian Earth Sci. 2019, 169, 244–256. [Google Scholar] [CrossRef]
- Ghods, A.; Shabanian, E.; Bergman, E.A.; Faridi, M.; Donner, S.; Mortezanejad, G.; Zanjani, A.A. The Varzaghan–Ahar, Iran, Earthquake Doublet (Mw 6.4, 6.2): Implications for the geodynamics of northwest Iran. Geophys. J. Int. 2015, 203, 522–540. [Google Scholar] [CrossRef] [Green Version]


| Sensor | Dinsar Pair | Orbit | Perpendicular Baseline (m) | Track |
|---|---|---|---|---|
| Sentinel-1 | 15102019–20112019 | ASC | 149 | 174 |
| Sentinel-1 | 16102019–09112019 | DESC | −12.19 | 6 |
| Parameter | Best-fit |
|---|---|
| Length (m) | 6219.80 (±1540) |
| Width (m) | 5629.90 (±2530) |
| Center Depth (m) | 3096.60 (±633) |
| Dip (deg) | 79.29 (±7) |
| Strike (deg) | 29.17 (±5) |
| Rake (deg) | −4.94 (±7) |
| East (m) | 720,969.80 (±667) |
| North (m) | 4,176,230.30 (±737) |
| Slip (m) | 0.73 (±0.23) |
© 2020 by the authors. Licensee MDPI, Basel, Switzerland. This article is an open access article distributed under the terms and conditions of the Creative Commons Attribution (CC BY) license (http://creativecommons.org/licenses/by/4.0/).
Share and Cite
Valerio, E.; Manzo, M.; Casu, F.; Convertito, V.; De Luca, C.; Manunta, M.; Monterroso, F.; Lanari, R.; De Novellis, V. Seismogenic Source Model of the 2019, Mw 5.9, East-Azerbaijan Earthquake (NW Iran) through the Inversion of Sentinel-1 DInSAR Measurements. Remote Sens. 2020, 12, 1346. https://0-doi-org.brum.beds.ac.uk/10.3390/rs12081346
Valerio E, Manzo M, Casu F, Convertito V, De Luca C, Manunta M, Monterroso F, Lanari R, De Novellis V. Seismogenic Source Model of the 2019, Mw 5.9, East-Azerbaijan Earthquake (NW Iran) through the Inversion of Sentinel-1 DInSAR Measurements. Remote Sensing. 2020; 12(8):1346. https://0-doi-org.brum.beds.ac.uk/10.3390/rs12081346
Chicago/Turabian StyleValerio, Emanuela, Mariarosaria Manzo, Francesco Casu, Vincenzo Convertito, Claudio De Luca, Michele Manunta, Fernando Monterroso, Riccardo Lanari, and Vincenzo De Novellis. 2020. "Seismogenic Source Model of the 2019, Mw 5.9, East-Azerbaijan Earthquake (NW Iran) through the Inversion of Sentinel-1 DInSAR Measurements" Remote Sensing 12, no. 8: 1346. https://0-doi-org.brum.beds.ac.uk/10.3390/rs12081346