Article

Nonlinear Relationship Between the Yield of Solar-Induced Chlorophyll Fluorescence and Photosynthetic Efficiency in Senescent Crops

1
State Key Laboratory of Remote Sensing Science, Beijing Normal University, Beijing 100875, China
2
Faculty of Geographical Science, Beijing Normal University, Beijing 100875, China
3
Beijing Key Laboratory for Remote Sensing of Environment and Digital Cities, Beijing 100875, China
4
College of Water Sciences, Beijing Normal University, Beijing 100875, China
*
Author to whom correspondence should be addressed.
Submission received: 2 March 2020 / Revised: 26 April 2020 / Accepted: 5 May 2020 / Published: 9 May 2020

Abstract

:
It has been demonstrated that solar-induced chlorophyll fluorescence (SIF) is linearly related to the primary production of photosynthesis (GPP) in various ecosystems. However, it is unknown whether such linear relationships have been established in senescent crops. SIF and GPP can be expressed as the products of absorbed photosynthetically active radiation (APAR) with the SIF yield and photosystem II (PSII) operating efficiency, respectively. Thus, the relationship between SIF and GPP can be represented by the relationship between the SIF yield and PSII operating efficiency when the APAR has the same value. Therefore, we analyzed the relationship between the SIF yield and the PSII operating efficiency to address the abovementioned question. Here, diurnal measurements of the canopy SIF (760 nm, F760) of soybean and sweet potato were manually measured and used to calculate the SIF yield. The PSII operating efficiency was calculated from measurements of the chlorophyll fluorescence at the leaf level using the FluorImager chlorophyll fluorescence imaging system. Meanwhile, field measurements of the gas exchange and other physiological parameters were also performed using commercial-grade devices. The results showed that the SIF yield was not linearly related to the PSII operating efficiency at the diurnal scale, reflecting the nonlinear relationship between SIF and GPP. This nonlinear relationship mainly resulted from the heterogeneity and diurnal dynamics of the PSII operating efficiency and from the intrinsic diurnal changes in the maximum efficiency of the PSII photochemistry and the proportion of opened PSII centers. Intensifying respiration was another factor that complicated the response of photosynthesis to the variation in environmental conditions and negatively impacted the relationship between the SIF yield and the PSII operating efficiency. The nonlinear relationship between the SIF yield and PSII efficiency might yield errors in the estimation of GPP using the SIF measurements of senescent crops.

1. Introduction

Solar-induced chlorophyll fluorescence (SIF) is emitted at 650–850 nm by leaf pigments (i.e., chlorophyll a) when absorbed photosynthetically active radiation (APAR) in the 400–700 nm range cannot be fully used for photosynthesis. SIF has shown a strong link with photosynthesis because it competes with two other fates of absorbed photons in the pigment bed (i.e., photochemistry and heat dissipation) for the same excitation energy [1]. Pioneer applications of SIF have sought to diagnose the impacts of environmental stress (e.g., water stress, heat stress, and chemical stress) on photosynthesis and plant growth [2,3,4,5,6,7]. In recent years, relevant studies have tried to explore the detailed relationship between SIF and the gross primary production of photosynthesis (GPP) over various ecosystems at different spatial–temporal scales [8,9,10,11,12,13,14]. A linear relationship between SIF and GPP was successfully found based on the measurements of spaceborne, airborne, and continuous ground-based conditions [11,15,16]. Therefore, such empirical linear relationships of SIF have been successfully used to directly estimate the GPP.
The underlying mechanism for the linear relationship between SIF and GPP is interpreted from the rationale of the GPP and SIF. The GPP and SIF can be expressed as GPP = PAR × fPAR × L U E P and SIF   ( λ ) = PAR × fPAR × L U E F ( λ ) × f e s c ( λ ) , where PAR is received photosynthetically active radiation, λ is the spectral wavelength, fPAR is the fraction of absorbed PAR, L U E P and L U E F ( λ ) are the efficiencies with which the absorbed PAR is used for photosynthesis and re-emitted as SIF at wavelength λ , and f e s c ( λ ) denotes the fraction of SIF escaping from the canopy [1,15]. Combining these two equations, GPP can be rewritten as GPP = SIF ( λ ) × L U E P L U E F ( λ ) × f e s c ( λ ) ; therefore, the relationship between SIF and GPP is related to the product of L U E P L U E F ( λ ) and f e s c ( λ ) . Commonly used SIF is always at a far-red wavelength (e.g., the O2-A band of 760 nm), at which the f e s c can be approximated as a constant of 1 due to the low reabsorption by chlorophyll pigments of leaves [15]. Thus, the linear relationship between SIF and GPP is briefly determined by the ratio L U E P / L U E F ( λ ) . A mass of evidence based on experimental measurements has shown that the relationship between L U E P and L U E F ( λ ) (i.e., the SIF yield at 760 nm) is linear [17,18], which means that the value of L U E P / L U E F ( λ ) remains relatively constant and GPP is linearly related to SIF in a specific ecosystem.
However, photosynthesis is a finely regulated process, whereby plants seek to assimilate maximum energy under optimum conditions and minimize short- and long-term photochemical damage under adverse conditions, such as high light or temperature [19]. Under favorable conditions, the linear relationship between SIF and GPP is robust, since the bulk of APAR is used for carbon assimilation by photochemistry [20]. In contrast, a suboptimal environmental and biotic conditions might reduce the photosynthetic activity and trigger photoprotective mechanisms by dissipating excess solar energy as heat [20]. The linear relationship between SIF and GPP is thus sensitive to the dynamics of physiological stress and photoprotective mechanisms induced by environmental factors [1]. Comparing the satellite results, it can be found that drought stress lowers the linear relationship between SIF and GPP (e.g., for normal and drought vegetation, R2 = 0.87 and 0.53, respectively) [5,15]. At the leaf level, the results based on cotton and tobacco measurements revealed a clearly nonlinear relationship between SIF and GPP under different environmental conditions due to the nonlinear relationship between the SIF yield and photosynthesis efficiency [21]. Despite an exponential rise in the number of studies exploring the linear relationship between SIF and GPP associated with environmental conditions, very little is known about SIF and its relationship with GPP in senescent crops.
In annual crop plants, senescence is a developmental process that overlaps with the reproductive phase [22]. It involves a well-orchestrated degradation and remobilization and thus affects the productivity of crop plants. It is well documented that delayed senescence should yield a higher crop production [23]. However, crop plants frequently encounter varying degrees of environmental abiotic and biotic stress, which might induce the premature senescence of leaves [24]. The premature senescence may lead to a shortage of assimilates, ultimately causing an acceleration in the whole-plant maturation process and strongly lowering crop productivity in the end [22]. In the context of climate change, particularly of warming, the growth period is shortened and senescence is advanced [25,26]. As a new tool for remote sensing, SIF has been used for estimating crop production for a whole growth period based on its linear relationship with GPP [27]. Their relationship in the phase of senescence is always omitted or considered as linear, like that of other growth phases. However, their relationship in senescence maybe not linear due to the rapid down-regulation of photosynthesis and other complicated physiological processes. Thus, to get a more accurate estimation of crop production from SIF, it is necessary to validate whether their relationship is linear or not.
As we described above, the relationship between SIF at a far-red wavelength and GPP is mainly determined by the relationship between L U E P and L U E F ( λ ) . Therefore, to determine their relationship at senescence, we sought to explore the relationship between the SIF yield and photosynthetic efficiency and how this relationship is mediated by photosynthesis processes. A field campaign was conducted in which photosynthesis measurements by CO2 exchange were combined with fluorescence at the leaf and canopy levels (i.e., SIF). Leaf chlorophyll fluorescence data were collected using the pulse amplitude modulation (PAM) measuring principle, which allowed us to quantify the probability of each of the three alternative fates of absorbed photons in the pigment bed: photochemistry, heat dissipation, and fluorescence. The canopy SIF was obtained with a manual ground system. Other physiological parameters, including the leaf area index and pigment content, were also simultaneously collected. Based on these measurements, we aimed to address the following questions: (1) Does SIF show a linear relationship with GPP in senescent crops? (2) If the relationship is nonlinear, what caused the result? Answers to these questions can provide a further understanding of the application of SIF in the large-scale detection of GPP.

2. Materials and Methods

2.1. Canopy Spectral Measurements

The experiments were performed on autumn soybean and sweet potato, which were separately planted in a 3 × 3 m2 grid in the Huailai Comprehensive Experimental Station, Beijing Normal University. All of these plants were rainfed during their growth periods. The soil was loamy soil and was considered to have a high level of nutrient status, since it had a mass of 3.10~31.20 g organic matter/kg (mean 12.85 g/kg), a storage of 576.6~1542.8 mg N/kg (mean 956.08 mg/kg), 572~3101.5 mg P/kg (mean 1288.44 mg/kg), and 21.70~ 31.0 g K2O/kg (mean 25.36 g/kg) [28]. Furthermore, differences in the nutrient content significantly affect the photochemical process of photosynthesis and play a crucial role in plant growth and development [29]. Therefore, considering such high nutritional status and to avoid the nutritional difference between the two plots, the same amount of ~174 g/m2 of Urea-fertilizer was applied to each crop as ground fertilizer.
In this experiment, two diurnal courses of canopy solar-induced chlorophyll fluorescence and reflectance were acquired from the soybean and sweet potato on 22 and 23 September 2019, respectively. Since that harvest time for soybean and sweet potato is always in early October, we could consider that all these crops were at the period of senescence.
The SIF at the canopy level was measured in the middle of each plot with a diameter of ~0.65 m using a manual spectrum system. This system is similar to our previously described one, which is described in Liu et al. (2018a, 2018b) [30,31]. Specifically, a high-resolution spectrometer (HR4000, 720~810 nm, OceanOptics, Inc., Largo, FL, USA) was used to collect down-welling solar flux and up-welling canopy flux with two optical fibers, one attached to a cosine corrector (CC-3, OceanOptics, Inc., USA) and the other as a bare fiber (field of view, FOV, 25°). An electrical shutter (FOS-2 × 2-TTL, OceanOptics, Inc., USA) was connected to these two fibers to collect the signal from either the canopy or sky at one time. The spectrometer first collected solar irradiance and then canopy radiance within 5 minutes. The mean values of 4 measurements of solar irradiance and 60 measurements of canopy radiance were recorded in each cycle. Dark currents corresponding to the solar irradiance and canopy radiance were collected afterward. However, without temperature control, wavelength correction and radiance correction were conducted before each measurement cycle. All of these processes were performed using OceanView software (OceanOptics, Inc., Largo, FL, USA).
After the collection of SIF was finished, in the subsequent 5 minutes, canopy reflectance of the same vegetation target was also measured using another spectrometer (USB 2000, OceanOptics, Inc., USA) equipped with one optical fiber. This spectrometer measured the reflected radiance of the vegetation target and a Spectralon reference panel between 200 and 1000 nm, with a spectral sampling interval of 1.5 nm and a full width at half maximum (FWHM) of 3.0 nm. The reflected radiance was also measured using OceanView software. The mean values of ≥30 measurements of the canopy and Spectralon reference panel were separately recorded in each cycle.

2.2. SIF Retrieval and Vegetation Indices Calculation

In this study, the SIF at 760 nm (F760) was used to quantify the emitted canopy fluorescence according to the Spectral Fitting Methods (SFM) proposed by Meroni et al. (2010) [32]. A wavelength range of 759–762 nm was applied in our study, with the assumption that the canopy reflectance and SIF are linear functions of wavelength. We only used the data when the fitting algorithm R2 > 0.99. As a result, only 8 SIF values (4 values/day/crop) were successfully retrieved, although 10 measurements were collected.
A canopy reflectance of between 200 and 1000 nm was used to calculate the vegetation index. In this study, a vegetation index named the normalized difference vegetation index (NDVI) at Red edge (RNDVI) was used to approximate the fraction of absorbed photosynthetically active radiation (fAPAR) in PAR [33]. The RNDVI was calculated using the following Equation (1).
R N D V I = ( R 750 ~ 757.5 R 703.75 ~ 713.75 ) / ( R 750 ~ 757.5 + R 703.75 ~ 713.75 ) .
Based on the F760 results, the SIF yield at 760 nm (Fy760) was calculated as Fy760 = F760/APAR. Without the direct measurements of APAR, it was calculated as the product of PAR and fAPARgreen. The PAR was not directly measured due to the damaged probe of the meteorological station. The value of the solar irradiance between 761~763 nm was selected as a proxy of the PAR because of their significantly and perfectly linear relationship (R2 = 0.92, P < 0.0001; Figure 1). The value of fAPARgreen can be represented by the Rededge NDVI. The detailed calculation of APAR is described in the following Equation (2). Furthermore, the apparent SIF yield at 760 nm (AF760) was also calculated as AF760 = F760/PAR using the solar irradiance between 761~763 nm as a proxy of PAR.
{ A P A R = P A R × f P A R g r e e n P A R = 232.47 + 0.52 × S o l a r   i r r d i a n c e   ( 761 ~ 763   n m ) f P A R g r e e n = 1.33 × R N D V I 0.15 ,

2.3. Chlorophyll Fluorescence at Leaf Level

Simultaneously with the spectral measurements, one or two leaves around the FOV of the fiber were clipped and immediately delivered to the lab. When the detached leaves were delivered to the lab, they were first placed on a platform in the dark for 30 minutes. Then, the dark-adapted leaves were exposed to a weak measuring pulse (0.32 μ mol · m 2 · s 1 ) to detect the initial minimum fluorescence ( F o ). The maximum fluorescence of the dark-adapted leaves ( F m ) was recorded during a short pulse at an actinic light (800 ms, 6174 μ mol · m 2 · s 1 ). The maximum fluorescence of the light-adapted leaves ( F m ) was also measured at the same light intensity as that of the F m , and the fluorescence at a stable state ( F ) was measured at a light intensity of 80 μ mol · m 2 · s 1 .
The FluorImager chlorophyll fluorescence imaging system (Technologica Ltd., Colchester, UK) was used to obtain the images of chlorophyll fluorescence of the isolated leaves [34,35]. The excitation beam of FluorImager was produced by 16 banks of 100 blue pulsed diodes (peak output of 470 nm). The pulsed diode was modulated at a constant voltage and could maintain a constant spectral output. Fluorescent images were taken by an asynchronous progressive scan CCD camera, which was synchronized to the measuring pulses from the emitting light. With FluorImager, many parameters of chlorophyll fluorescence could be measured, including the F o and F m in dark-adapted leaves; the minimum fluorescence ( F o ), F m , and F in light-adapted leaves; and the ratios of these fluorescence measures, e.g., F v / F m ( F v = F m F o ), F q / F m ( F q = F m F ), F v / F m ( F v = F m F o , where F o = F o / ( F v / F m + F o / F m ) ), F q / F v , and F m / F m 1 (a fluorescence parameter to quantify the capacity of non-photochemical quenching of excitation energy via regulated thermal energy dissipation, NPQ). Each chlorophyll fluorescence parameter could reflect physiological states. To provide a better understanding for readers, details about their significance in the physiological state are described in Table 1, which has been described by Neil R. Baker and Eva Rosenqvist (2004) [35].

2.4. Gas Exchange Measurements

Mature and fully expanded leaves were randomly selected to measure the net photosynthetic rate (A), intercellular carbon dioxide concentration (Ci), and stomatal conductance (gsw). At least seven measurements were taken in parallel with the measurements of the canopy fluorescence using an Li-6800 IRGA instrument (LI-COR, Lincoln, NE, USA) under natural conditions.

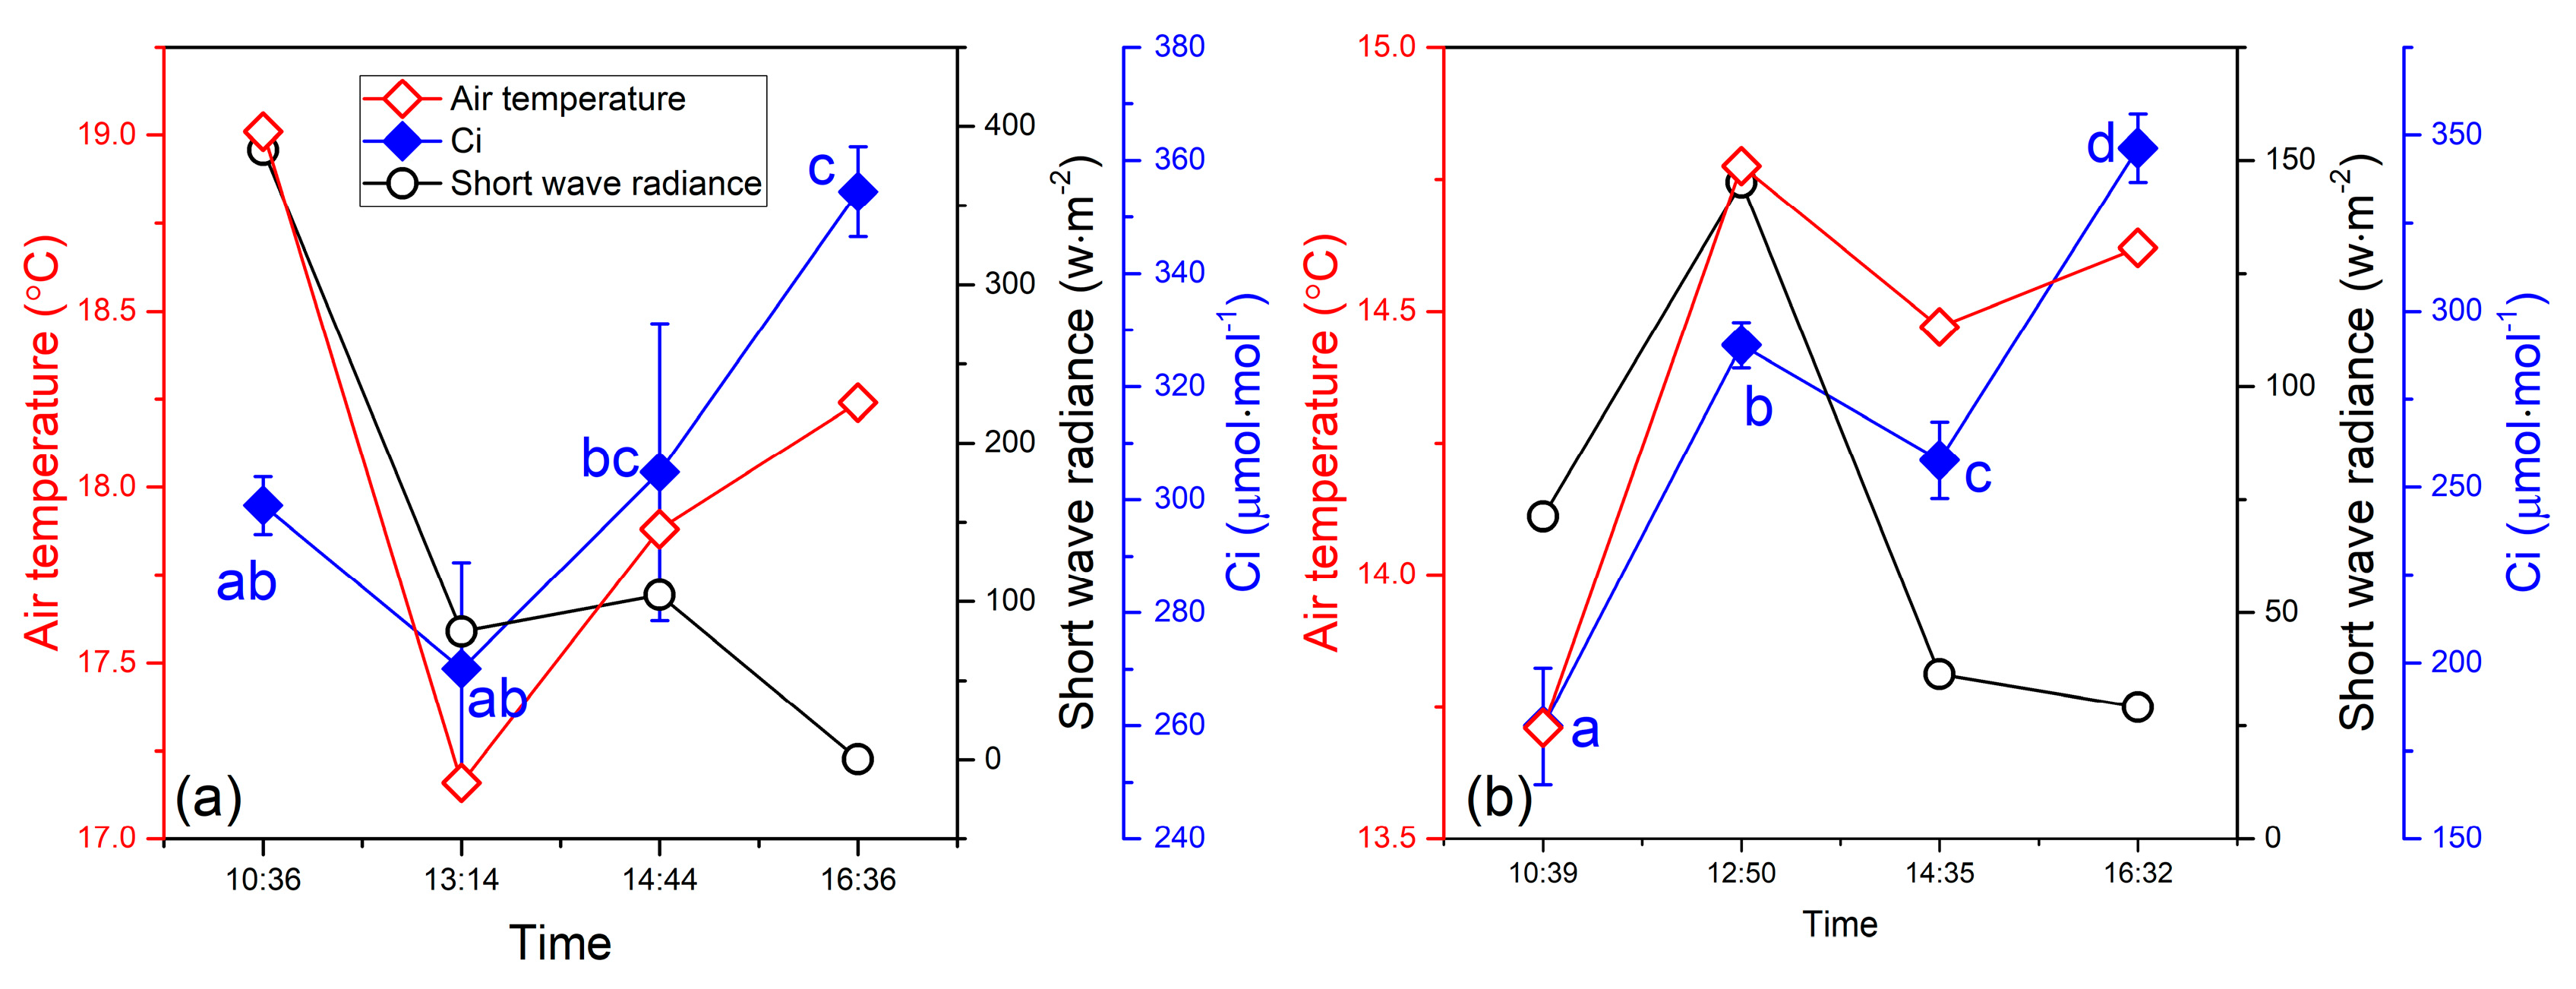
2.5. Other Measurements

For measuring pigment contents, leaves were also collected in parallel with the SIF measurements. Three leaves were clipped when the spectral measurements were collected and preserved in liquid-nitrogen before the pigment extraction. Chlorophyll a and b (Chl a and Chl b) and the total carotenoid content (Car) were determined in the acetone extracts, and the absorbances were read at 480, 645, and 663 nm, respectively, on a spectrophotometer [36,37]. The coefficients in Lichtenthaler et al. (1983) were used to calculate the pigment concentration [36].
The leaf area index (LAI) of each crop was also measured using a Plant Canopy Analyzer (LAI-2200C, LI-COR, Inc.) in the late afternoon when the sun was near the horizon [18]. Following the instruction manual for row crops, ground measurements were made along diagonal transects between the rows [38]. At least three repeats were made for each measurement, with at least six above the canopy and seven below the canopy readings. For the below canopy measurements, the instrument was held about 5 cm above the background soil. A 270° view cap was used to shield the sensor from the operator. In the present study, three LAI measurements were obtained for each crop and were averaged to represent the LAI of each crop.
To analyze the impact of air temperature to the variation of crop photosynthesis, the hourly air temperature and short-wave radiance of solar were collected in a meteorological station, which was 300 m away from our experimental site.

3. Results

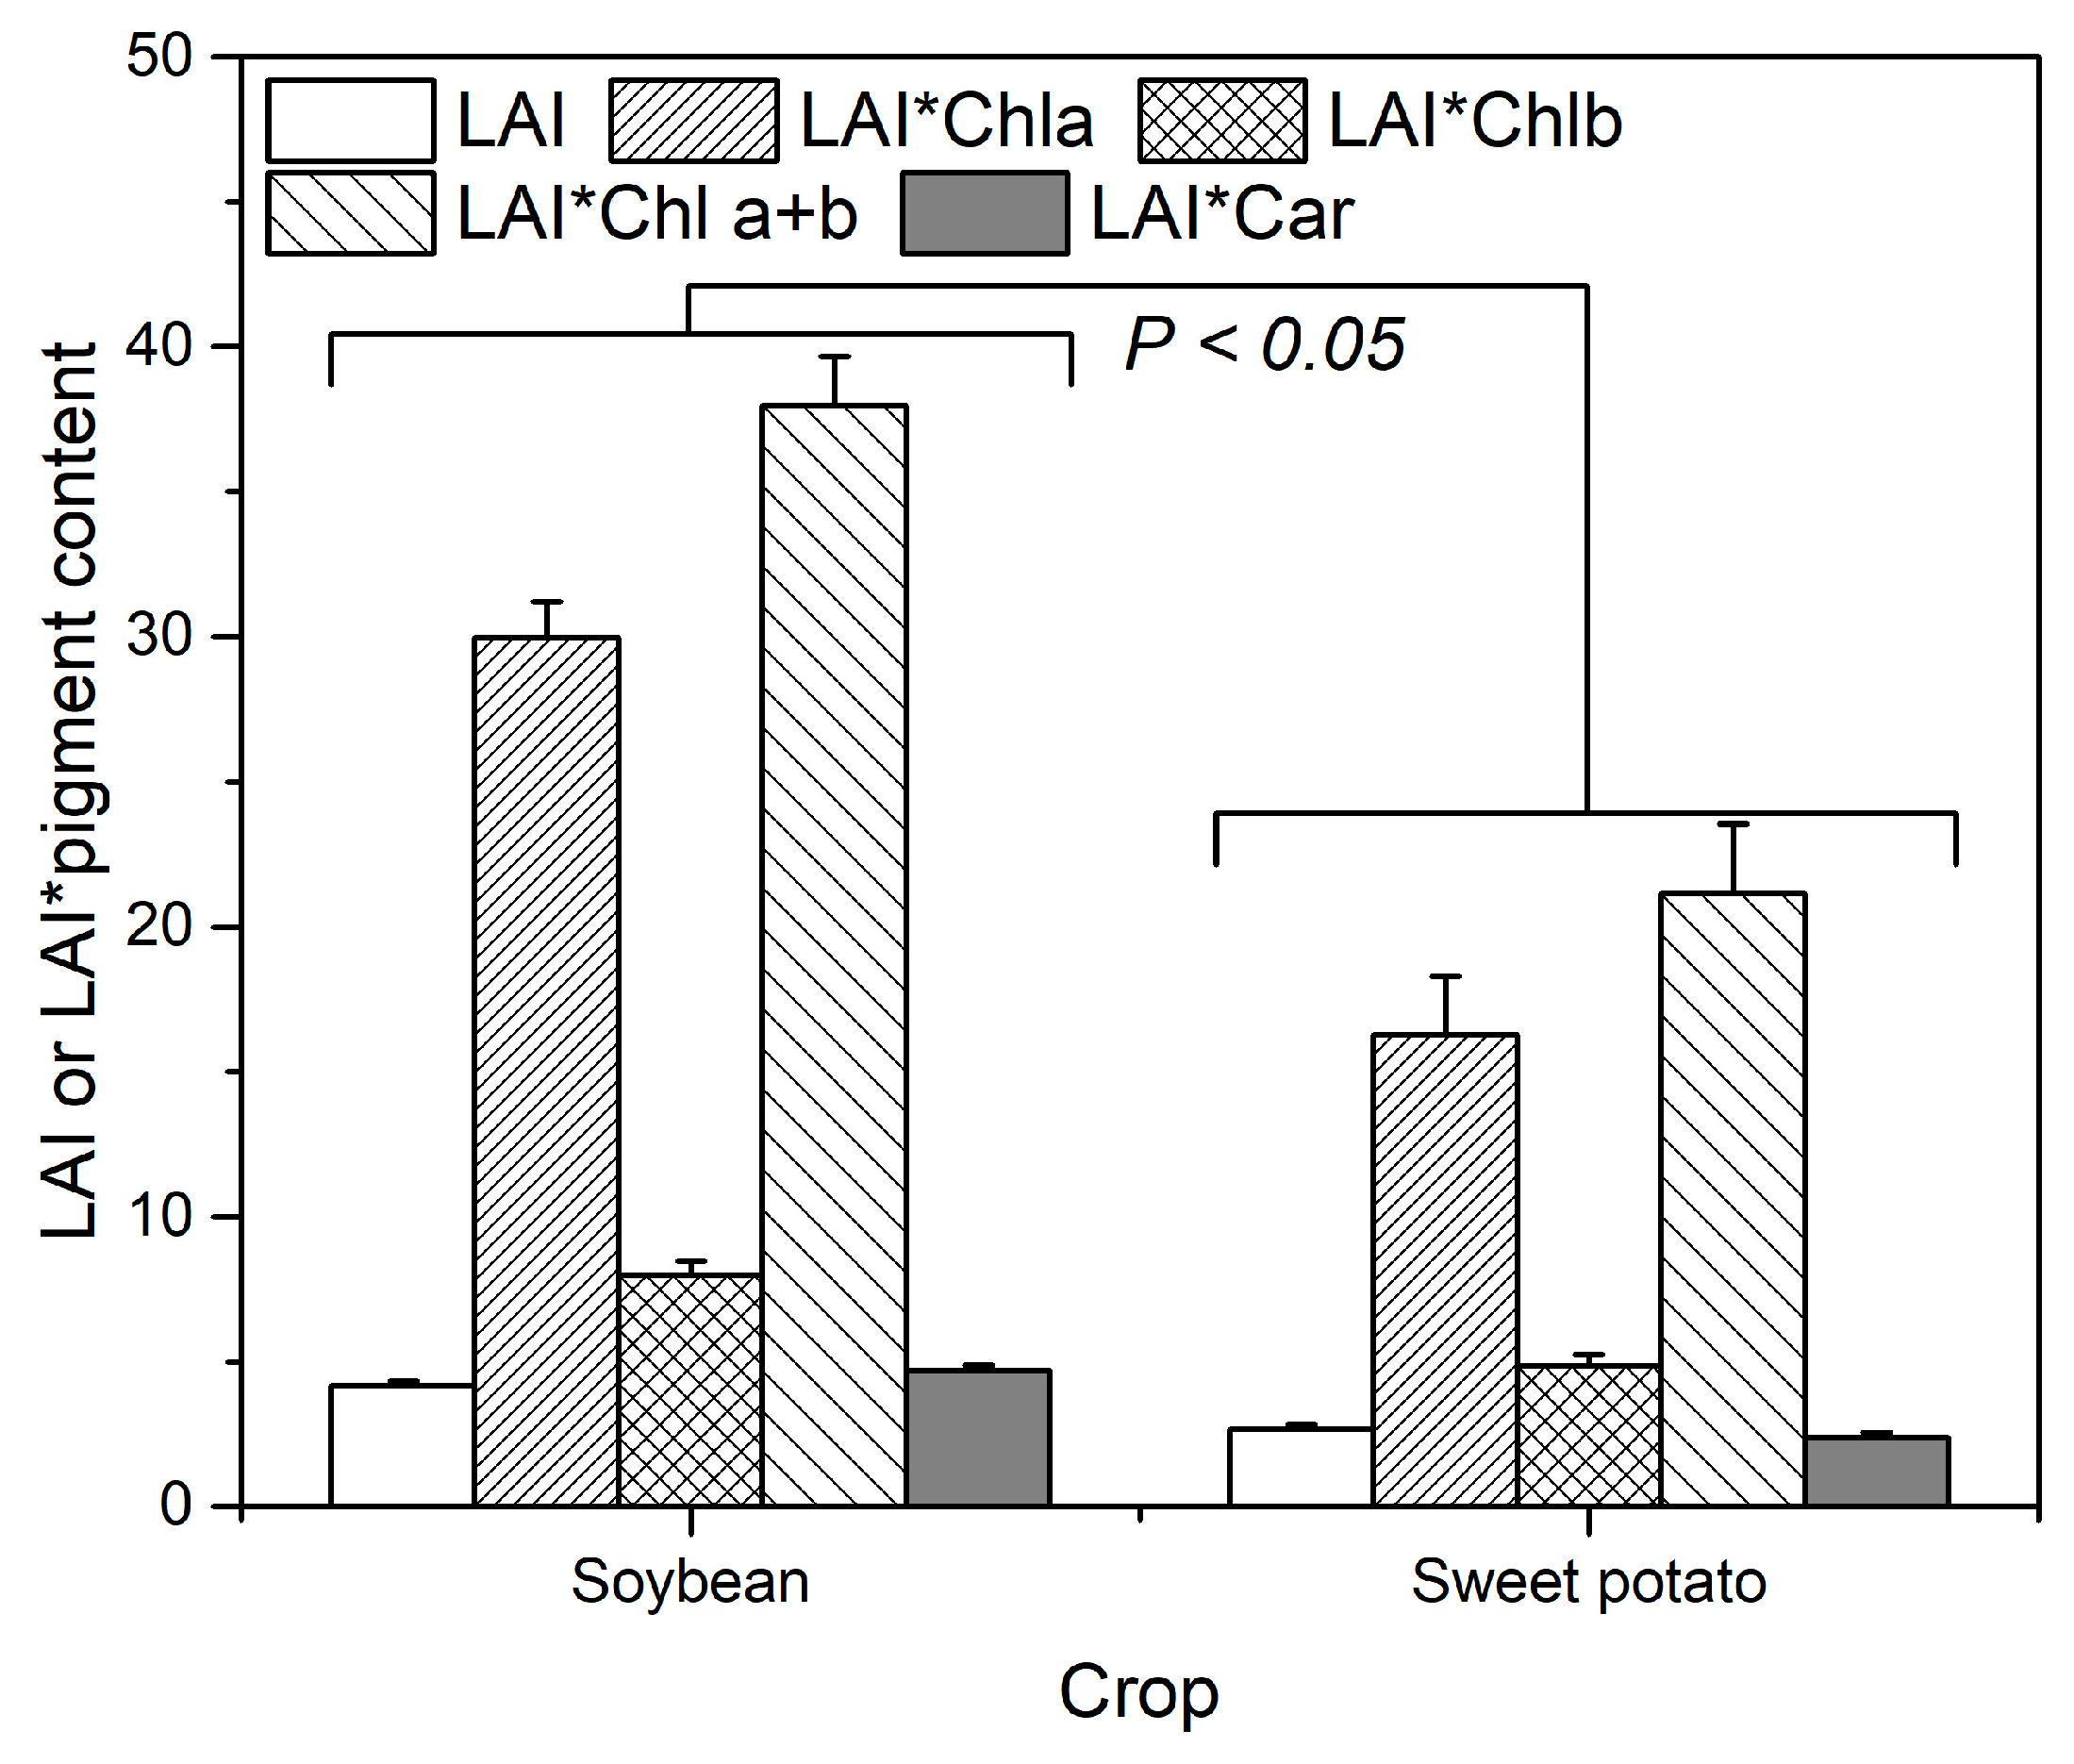
3.1. Comparison of Pigment Concentrations Among Species

At the leaf level, the dominant pigment was Chl a and total Chl (i.e., Chl a + Chl b), with values of 7.18 ± 0.29 and 9.09 ± 0.40 μ g / mL for soybean, 6.10 ± 0.75 and 7.91 ± 0.90 μ g / mL for sweet potato, respectively (Table 2). Leaves from the sweet potato contained Chl a and Chl b at a ratio of 3.32 ± 0.21 , which was significantly lower than the values of Chl a/Chl b in soybean (i.e., 3.76 ± 0.09 ). Compared to the content of Chl, Car remained at a relatively low level both in soybean and sweet potato, with values of 1.13 ± 0.04 and 0.89 ± 0.07   μ g / mL , respectively. However, a higher ratio of Chl to Car was found in sweet potato, while soybean showed relatively lower values of Chl/Car ( 8.80 ± 0.55 and 8.09 ± 0.24 , respectively).
The pigment content at the canopy level was also compared. As shown in Figure 2, the LAI of soybean was significantly higher than that of sweet potato ( 4.18 ± 0.18 and 2.67 ± 0.18 , respectively), indicating that more green leaves could be used for photosynthesis in soybean. Due to the higher LAI, the soybean showed a higher content of canopy pigments, with approximately two-fold Chl a and total Chl relative to that of sweet potato (the ratios were 1.84 and 1.80 μ g / mL , for LAI*Chl a and LAI* total Chl, respectively). Thus, at the canopy level, the pigment pool size of soybean was much greater than that of sweet potato.

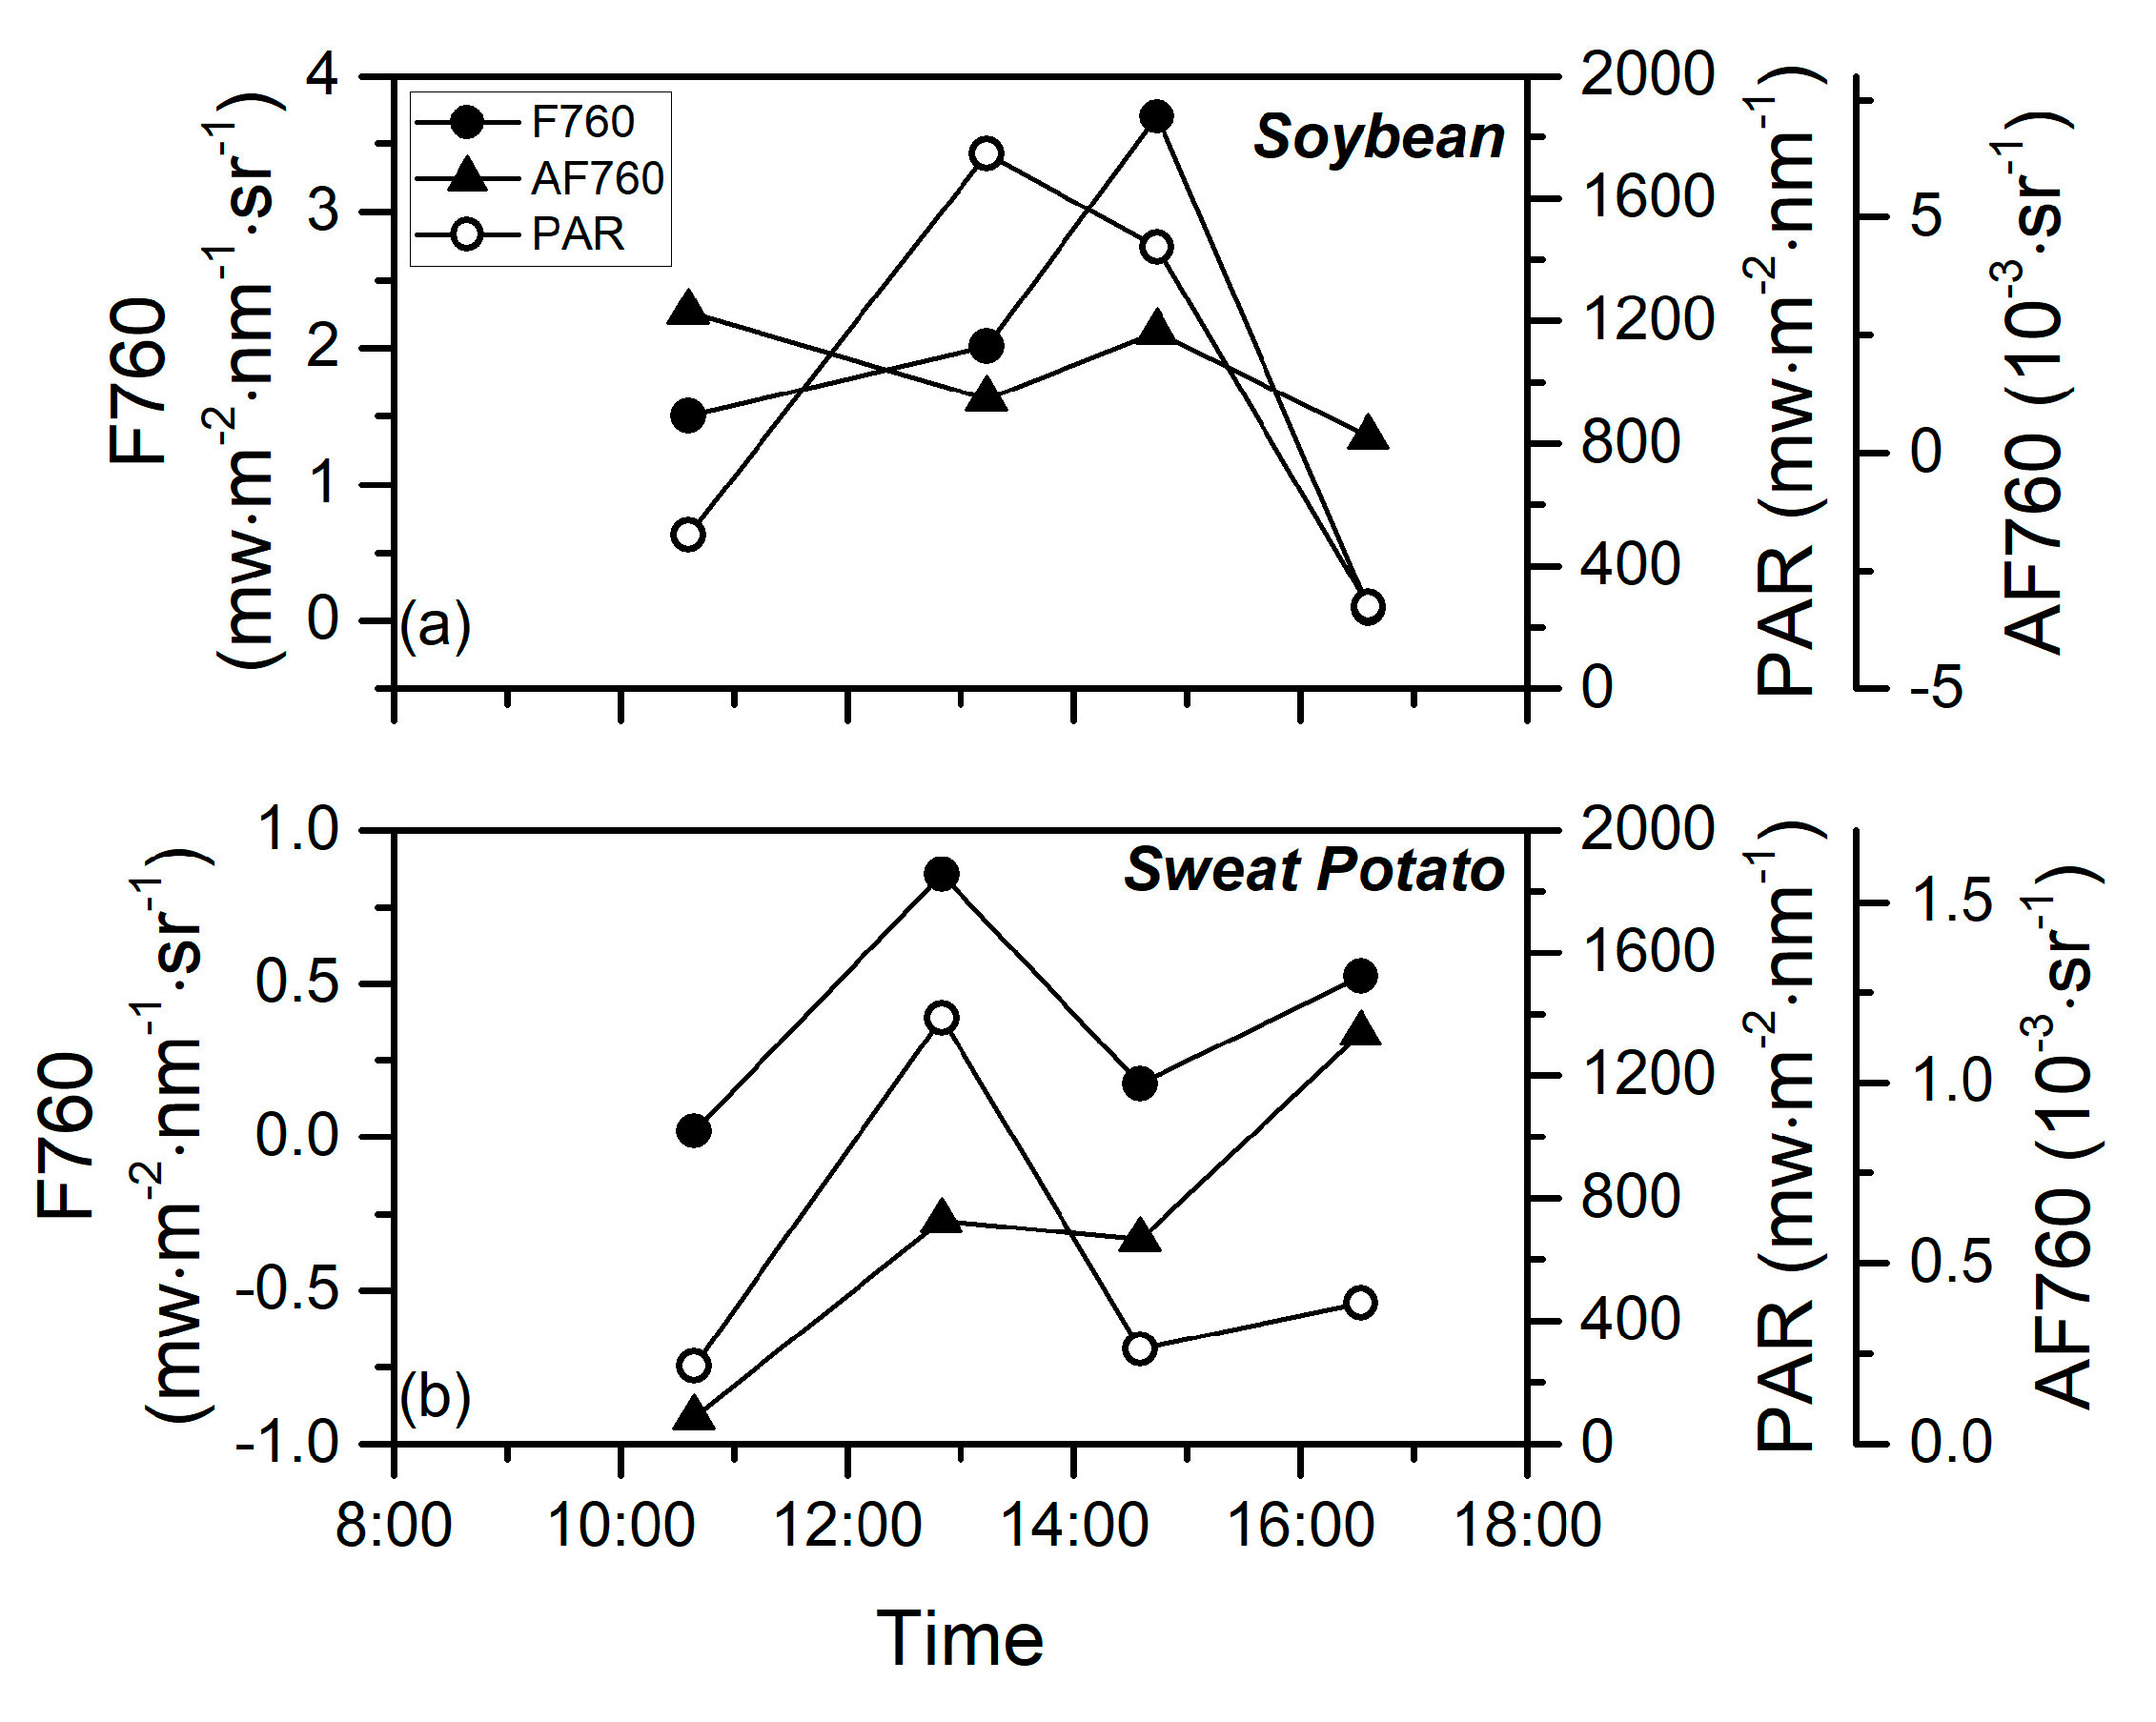
3.2. Diurnal Patterns of SIF

Due to the different canopy pigment contents, both F760 and AF760 in soybean and sweet potato showed different values (Figure 3). As expected, soybean showed larger daily values of F760 and AF760 (1.83 mw · m 2 · n m 1 · s r 1 and 0.0018 s r 1 for soybean, 0.39 mw · m 2 · n m 1 · s r 1 and 0.00060 s r 1 for sweet potato) because of its larger canopy pigment levels. In addition, the intensity of daily averaged PAR for the soybean measurements was stronger than that for the sweet potato measurements (989.98 and 602.72 mw · m 2 · n m 1 , respectively). This difference in PAR may lead to a partial deviation of SIF between soybean and sweet potato. However, the difference in SIF between these two crops still existed even when the parallel PAR measurements were similar, such as the soybean measurements at 14:44 and the sweet potato measurements at 12:50 (1441.58 and 1387.93 mw · m 2 · n m 1 , respectively; Figure 3). Thus, SIF differences among species were mainly determined by the difference in the canopy levels of pigment. We further noted that the ratios of the daily mean F760 and AF760 values between the soybean and sweet potato was approximately 4.69 and 2.94, respectively, which were much higher than the ratios of daily canopy pigment contents among these two crops (1.84 and 1.80, for LAI*Chl a and LAI* total Chl, respectively). This finding suggested that other factors (maybe intracellular physiological processes) were causing the observed SIF differences between the plant functional types.
Although PAR was not the main driver of the differences in F760 and AF760 among species, the diurnal dynamics of PAR were clearly driving the diurnal patterns of both F760 and AF760 (Figure 3). A consistent diurnal pattern was found between F760 and PAR in all species. However, only AF760 in sweet potato followed the diurnal patterns of PAR relatively well. The measurements of AF760 in soybean inversely related to the PAR value in the morning but positively related to the PAR in the late afternoon. These different behaviors of AF760 in responding to the PAR variations between the soybean and sweet potato indicated that the regulation of the SIF efficiency in response to the PAR changes was different for various species. This different regulation of the SIF efficiency in responding to the PAR variations might provide an explanation for the different magnitude of the SIF values between soybean and sweet potato.

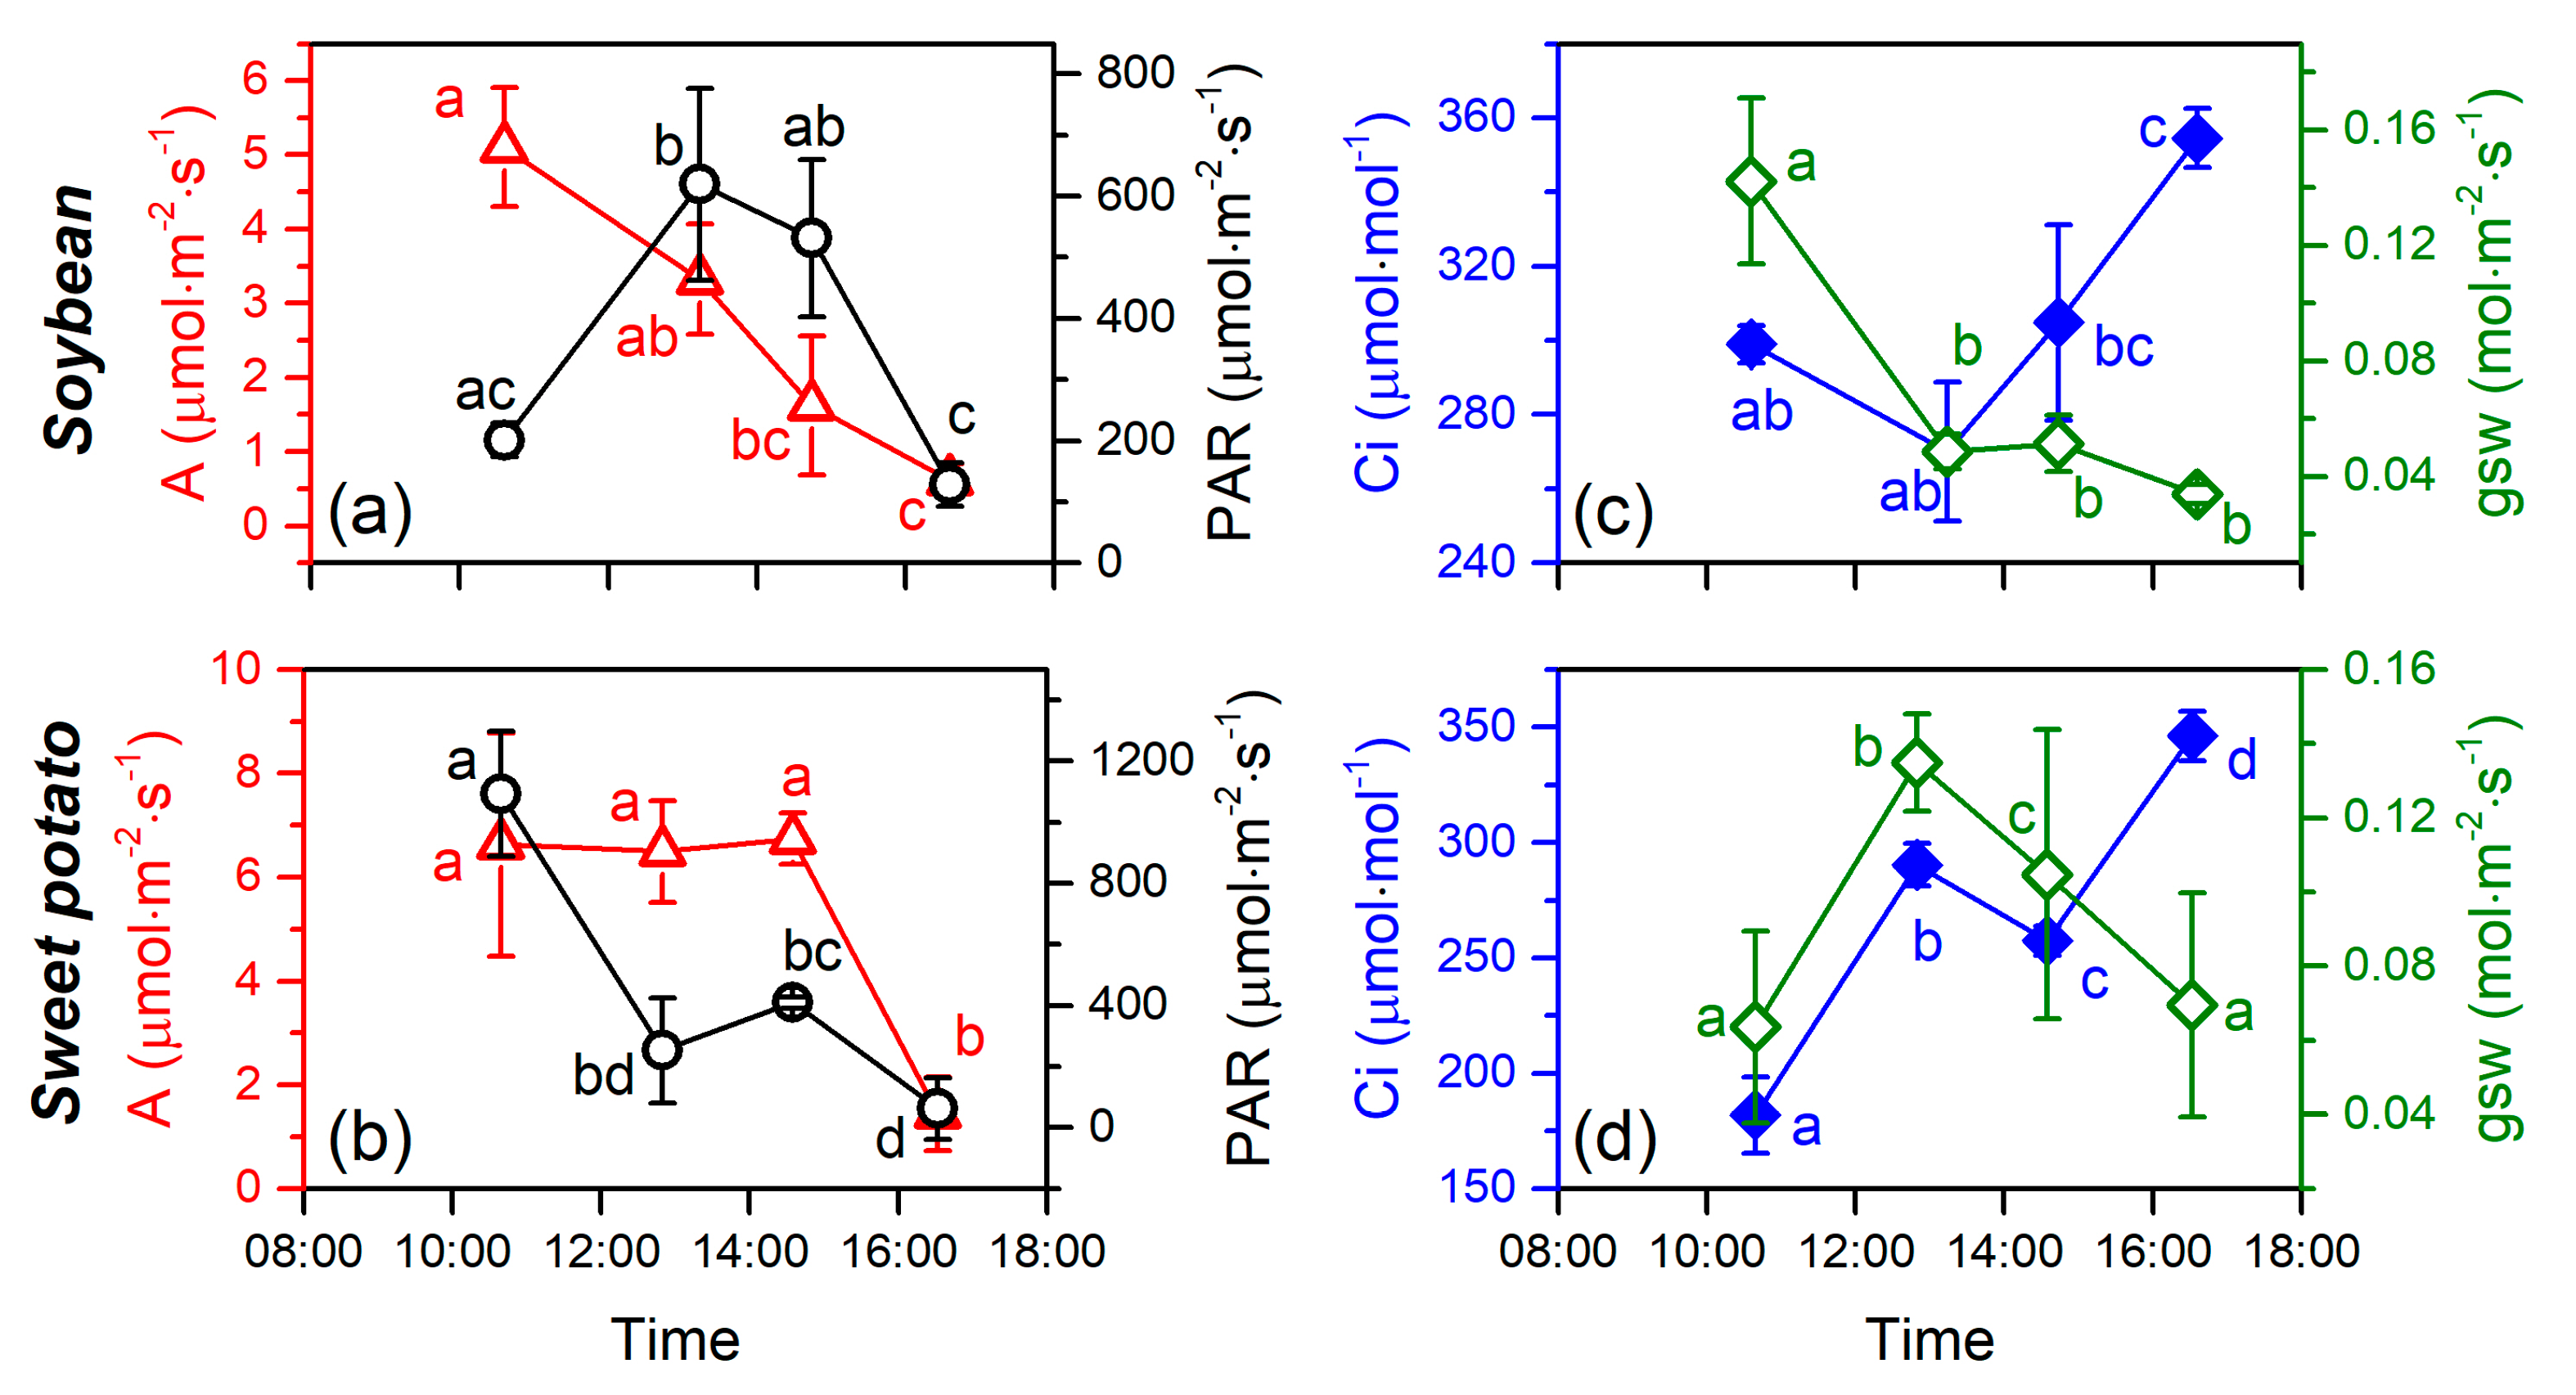
3.3. Relationship Between the SIF Yield and Photosynthetic Efficiency

Similar to the diurnal patterns of AF760, Fy760 showed different responses to the APAR variation in the morning and afternoon for the soybean measurements but tracked positively with the diurnal dynamics of APAR for the sweet potato measurements (Figure 4a,b), which further revealed that different crops show a different regulation of the SIF efficiency when the PAR changes. Simultaneously with the regulation of the SIF efficiency, the PSII operating efficiency also changed continually but irregularly with the APAR variation. The regulation of the PSII operating efficiency was also discrepant between soybean and sweet potato. For the soybean, the value of F q / F m progressively increased no matter how the APAR changed, while the F q / F m in sweet potato tracked well with the variation of APAR, except for the measurements in the early morning (Figure 4). These complicated responses of the SIF efficiency and PSII operating efficiency to the APAR variations made their relationship indistinct; therefore, a linear relationship was not found between them in our study (Figure 5a).
This nonlinear relationship between the SIF efficiency (Fy760) and PSII operating efficiency ( F q / F m ) can be explained by the concurrent variation in non-photochemical quenching ( F m / F m 1 , NPQ), which is another way of excess energy dissipation. In our study, we found that NPQ was also gradually changing in the diurnal pattern but without any correlation with the APAR variation (Figure 4), which also resulted in the unfixed relationship between the F q / F m and NPQ for different crops (Figure 5b). It can be seen that the NPQ in soybean tended to decrease first and then increase with an increased F q / F m (Figure 5b). In contrast, the NPQ in sweet potato exponentially declined when the F q / F m was increasing (Figure 5b). Since APAR is used for photochemistry (with efficiency Φ P ), nonradiatively as heat and SIF (with efficiency Φ N and Φ F , respectively), the sum of the above efficiency can be approximatively expressed as: Φ P + Φ N + Φ F = 1 [39]. Thus, the relationship between the SIF yield and PSII operating efficiency was mainly determined by way of NPQ in relating to the PSII operating efficiency. This finding of an unfixed and nonlinear relationship between the F q / F m and NPQ resulted in the nonlinear relationship between the SIF yield and the F q / F m .
The measurements of gas exchange could provide further insights into the photosynthetic processes responsible for the nonlinear relationship between the SIF efficiency and the F q / F m . Similar to Fy760, the net photosynthetic rates (A) of soybean and sweet potato were not linearly related to the variation in PAR (Figure 6a,b). This response might be attributed to the complicated variations in intercellular carbon dioxide concentration (Ci) and stomatal conductance (gsw). It was expected that Ci should track well with gsw variation [40]; however, we found that the diurnal variations in Ci were not similar to the gsw dynamics but were contrary to the PAR variations (Figure 6c,d), which means that Ci was not only determined by gsw but also by other internal physiological processes that might be affected by PAR, such as respiration. Respiration is a process that consumes photosynthetically assimilated carbon and produces active chemical energy and CO2 [41]. On one hand, the produced CO2 may accumulate in the cell interior as part of Ci, which was evident when the PAR was decreasing and the gsw was relatively lower, such as the measurements for soybean and sweet potato after 12:30. On the other hand, the consumption of the assimilated carbon led to a decrease in A even in the case of increasing F q / F m (Figure 4 and Figure 6). This complicated response of photosynthesis to ambient factors may directly alter the partition of APAR for photochemistry and SIF and consequently led to the nonlinear relationship between Fy760 and F q / F m [1].
The non-linear relationship between the SIF efficiency and PAR also resulted from the heterogeneity of the higher PSII operating efficiency distributed in a whole leaf. Clearly, the higher F q / F m in soybean was distributed in the sites along the leaf vein, while such sites with higher F q / F m values in sweet potato were distributed away from the leaf vein (Figure 7). Furthermore, the heterogeneity of the distribution of higher PSII operating efficiency was unstable over the course of a single day. This instability was especially evident in the measurements of sweet potato. At the times of 10:39 and 16:32, the F q / F m was almost even in a whole leaf surface, except the sites adjacent to the leaf vein. When the time was near noon (i.e., 12:50 and 14:35), the higher values of F q / F m were only observed at the tip and margins of the leaf, but the pixel values at the middle part of the leaf were so negligible that they were not captured by the imaging system. The heterogeneity of the PSII operating efficiency and its variation in a single day could be explained by the characteristics of F v / F m and F q / F v , since F q / F m can be expressed as the product of F v / F m and F q / F v . It can be seen that the variations in F q / F m in the distribution at different solar times were always accompanied by the distributed variations in F v / F m , both for soybean and sweet potato. Similar evident variations in F q / F v were also observed for all the measured results of sweet potato but only for the measurements of soybean at 16:36, which means that the variation in the PSII operating efficiency for soybean was mainly due to the regulation of PSII efficiency, while the result for sweet potato was attributed to the concurrent variation in the photosynthesis regulation and capacity for electron transfer.

4. Discussion

In this study, the diurnal variations of SIF and photosynthesis were systematically analyzed based on the ground measurements of soybean and sweet potato. Using these measurements, we found that the SIF yield (i.e., Fy760) was not linearly related to the PSII operating efficiency (i.e., F q / F m ) at the diurnal scale for senescent crops. Their relationship was affected by the dynamics of non-photochemical quenching (heat dissipation, i.e., NPQ), which were further influenced by the variation in carbon dioxide concentration (Ci) and stomatal conductance (gsw). The heterogeneity and temporal variation in the PSII operating efficiency in a whole leaf were other explanations for their non-linear relationship. To understand the intrinsic theory for these results, the relationship between the SIF yield and photosynthesis at the diurnal scale was further discussed. The implications of the nonlinear relationship between the APAR and the SIF yield is also further investigated in this section.

4.1. Further Understanding the Relationship Between SIF and the PSII Operating Efficiency

Our measurements of autumn senescent crops showed that F760 and PAR were similar in their diurnal patterns, which was consistent with the results of previous studies [11,30]. However, F q / F m did not show similar diurnal patterns to PAR in a single day (Figure 4). This finding indicated that the relationship between F760 and F q / F m was not linear in senescent crops. It was further found that Fy760 was not linearly related to F q / F m (Figure 4), although Fy760 is more linked to photosynthesis than F760 [1]. This nonlinear relationship between F q / F m and F760 (or Fy760) revealed that photosynthesis at autumn senescence might not be precisely captured by the canopy SIF.
Simultaneously measured leaf-based photosynthesis parameters could provide a further understanding of the nonlinear relationship between the SIF and F q / F m . The values of Ci showed contrary diurnal dynamics with the PAR variation but did not show consistent diurnal patterns with gsw (Figure 6c,d). It can be concluded that Ci is not only determined by the aperture of leaf stomata but also by intracellular processes related to the PAR variation. It has been demonstrated that respiration is dependent on the ambient temperature and also on the PAR values, since the PAR values drive the diurnal variation in temperature [27,41], which was also found in our study based on their diurnal patterns (Figure 8). Therefore, respiration also plays a role in determining the concentration of Ci. The role of respiration also increased, especially in the late afternoon, when the PAR values were relatively lower and the air temperature was lower, as well, which could be explained by the fact that enhanced respiration at lower temperatures can provide more chemical energy for plants to prevent the damage of lower temperatures on plant organs [27,41]. This synchronous variation in respiration with lowering temperatures could be supported by the diurnal changes in Ci and air temperatures, particularly for the measurements of sweet potato (Figure 8b). The effect of respiration on photosynthesis was also revealed by inconsistent variations between A and F q / F m . The continued decrease in A in soybean and the sharp decrease in A in sweet potato, contrary to the increase in the synchronously measured F q / F m (Figure 4 and Figure 6), indicated that the respiration intensity was increasing, and more photosynthesis products (i.e., sugar) were consumed to provide the chemical energy required by other intracellular processes.
In addition, we found that the intensity of the PSII operating efficiency in the autumn leaves was not constant and changed with the solar time (Figure 7). This heterogeneity of F q / F m means that the different sites of the leaf surface did not provide the same levels of chlorophyll fluorescence to canopy SIF, even at the same time. Further, when the local time changed, the contribution of the same leaf site to canopy SIF was not at the same magnitude, which resulted in a nonlinear relationship between the SIF and F q / F m . Considering that the F q / F m can be calculated as the product of F v / F m and F q / F v , its nonlinear relationship with F q / F m should be affected by the diurnal dynamics of F v / F m and F q / F v . From images of the leaf chlorophyll fluorescence, F v / F m clearly showed heterogeneity over time both in soybean and sweet potato, which means that the maximum quantum efficiency of the PSII photochemistry was not even across the leaf and not stable in a day. That is, the capacity of the light-harvesting of antennae in PSII at different sites was discrepant and also changed with the solar time. It should be noted that, although F q / F v in soybean did not always show large variations in a day, the sweet potato results of F q / F v showed similar patterns of heterogeneity to F v / F m . This finding suggested that the proportion of PSII centers that are open also affected the diurnal dynamics of the PSII operating efficiency. Thus, the nonlinear relationship between the F q / F m and SIF was intrinsically determined by the status of the maximum quantum efficiency of the PSII photochemistry and the proportion of PSII centers that were open. Previous studies have indicated that autumn senescent plants rapidly down-regulate photosynthesis accompanied by pigment decomposition to protect the photosynthetic apparatus from the damage of more light energy [42]. Our results also support the dynamics of photosynthesis when plants are in autumn senescence.
It should be noted that the yield of full-wavelength SIF at 650–850 nm should be the best proxy for indicating the proportion of APAR that was used for dissipating as SIF [39]. However, the SIF yield was only measured at 760 nm in our study, which cannot well indicate the full SIF efficiency at all. This may be another reason for the nonlinear relationship between the SIF efficiency at 760 nm (Fy760) and the photosynthetic efficiency ( F q / F m ).
This nonlinear relationship between the SIF efficiency and photosynthetic efficiency is related to the gene expression and plastic responses of the photosynthetic apparatus. Specific sets of genes (known as those nuclear genes encoding the chlorophyll a/b-binding proteins, an enzyme catalyzing the first committed step of anthocyanin biosynthesis and the small subunit of ribulose bisphosphate carboxylase) mediate the etiolation and abscission of leaves, which may alter the relationship between SIF efficiency and photosynthetic efficiency [43]. This was demonstrated by our finding that Fy760 of soybean and sweet potato with different pigment contents showed different relationships with F q / F m (Figure 4a,b). The expressions of such genes may be further regulated by circadian rhythms; for example, the genes encoding the chlorophyll a/b-binding proteins may be upregulated at dawn and downregulated before sunset [44]. This means that circadian rhythms may be another factor in altering the relationship between the SIF efficiency and photosynthetic efficiency. Circadian rhythms also affect their relationship by controlling the stomatal opening, photosynthetic light harvesting, and photosynthetic efficiency [45]. Furthermore, it has been suggested that the reorganization of the photosynthetic apparatus during fall and winter allows Scots pine to maintain a large fraction of chlorophyll in a quenched, photo-protected state, allowing the rapid recovery of photosynthesis in the spring [43]. This might also explain our observed pattern that SIF efficiency and photosynthetic efficiency is not linear.

4.2. Implications from the Nonlinear Relationship Between SIF and the PSII Operating Efficiency

Numerous studies have found that the leaf F q / F m is linearly related to the canopy SIF based on ground measurements [17,18]. This linear relationship is the scientific basis for the application of SIF in detecting the gross primary productivity (GPP) at various ecosystem levels, because SIF and GPP can be separately calculated as: SIF = S I F y i e l d × A P A R and GPP = PSII   operating   efficiencey × APAR . Indeed, a linear relationship between SIF and GPP was found in various ecosystems at different spatial–temporal scales [10,11,13,15]. Some scientists further utilized SIF to estimate the GPP and obtained more accurate results than that of traditional remote sensing. However, almost all of these studies were conducted over a long time series that covered several plant growth periods, such as green-up, maturity, and senescence. The distributions of leaf pigments during the green-up and mature periods are relatively more homogeneous than at senescence, during which more and more chlorophyll pigment is rapidly broken down and transferred to other organs (e.g., stem and root) [42]. Thus, during the growth stage that covers the green-up and mature periods, the PSII operating efficiency may be relative even at different sites across the leaf and should be more linearly related to the SIF yield. In other words, the goodness of fit of the linear relationship between the SIF yield and the GPP was underestimated when measurements at senescence were considered, since their relationship was not linear in senescent stage as we mentioned above. Therefore, growth stages should be considered when we try to use the SIF to estimate the GPP.
Furthermore, the linear relationship between the SIF yield and GPP has not always been established, especially when the time scale becomes smaller. Zhang et al. (2016) [46] demonstrated that the relationships between the flux tower GPP and the field-measured SIF (760 nm) at hourly time scales are curvilinear. They further demonstrated that the GPP–SIF relationship showed an increasing linearity when the time scale became larger (R2 = 0.42, 0.74, and 0.84 for hourly, daily, and 16-day measurements) [46]. Similar results were also found based on the ground measurements at different observation regions over different plant types [11,13,17,18]. Our measurements in a diurnal pattern also found a nonlinear relationship between the SIF yield and GPP. This finding indicated that estimating the GPP from the SIF at sub-daily timescales may lead to relatively inaccurate results. Due to the diurnal dynamics of the heterogeneity of the PSII operating efficiency in autumn senescence, such errors of inaccurate estimation of diurnal GPP might become larger. Therefore, more attention should be paid to this situation.

5. Conclusions

Our study explored the diurnal patterns of SIF accompanied by photosynthesis and revealed their relationship in senescent crops. A nonlinear relationship between the SIF yield and PSII operating efficiency was found, reflecting that the relationship between the SIF and GPP is not linear. This nonlinear relationship may be caused by the heterogeneity and diurnal dynamics of the PSII operating efficiency. This uneven distribution and regulation of photosynthesis was mainly triggered by changes in the maximum efficiency of the PSII photochemistry and the proportion of opened PSII centers. Intensifying respiration was another factor that complicated the response of photosynthesis to the variation in environmental conditions and decreased the relationship between the SIF yield and PSII operating efficiency. The uncertain relationship between the SIF yield and PSII efficiency might yield errors in the estimation of GPP using SIF measurements.
It should be noted that the measurements in this study did not cover the whole period of senescence, during which much more information is needed to be explored in subsequent work. The following fieldwork will be conducted to collect many more measurements for providing more information about the relationship between the SIF yield and the photosynthetic efficiency.

Author Contributions

Conceptualization, L.L. and J.W.; methodology, L.L.; software, L.L.; formal analysis, W.Z.; investigation, W.Z. and Q.S.; resources, J.W.; writing—original draft preparation, L.L.; writing—review and editing, L.L., W.Z., Q.S., J.W., Y.T., J.Y. and X.H.; visualization, F.T.; supervision, J.W.; project administration, J.W.; funding acquisition, J.W. All authors have read and agreed to the published version of the manuscript.

Funding

This research was funded by the National Key Research and Development Program of China (No. 2017YFB0504102), the National Natural Science Foundation of China (No. 41671424), the China Postdoctoral Science Foundation (No. 2019M650521) and the Beijing Advanced Innovation Program for Land Surface Science.

Conflicts of Interest

We declare that we have no competing interests.

References

  1. Porcar-Castell, A.; Tyystjärvi, E.; Atherton, J.; van der Tol, C.; Flexas, J.; Pfündel, E.E.; Moreno, J.; Frankenberg, C.; Berry, J.A. Linking chlorophyll a fluorescence to photosynthesis for remote sensing applications: Mechanisms and challenges. J. Exp. Bot. 2014, eru191. [Google Scholar] [CrossRef]
  2. Pérez-Priego, O.; Zarco-Tejada, P.J.; Miller, J.R.; Sepulcre-Cantó, G.; Fereres, E. Detection of water stress in orchard trees with a high-resolution spectrometer through chlorophyll fluorescence in-filling of the O/sub 2/-A band. IEEE Trans. Geosci. Remote Sens. 2005, 43, 2860–2869. [Google Scholar] [CrossRef]
  3. Rossini, M.; Nedbal, L.; Guanter, L.; Ač, A.; Alonso, L.; Burkart, A.; Cogliati, S.; Colombo, R.; Damm, A.; Drusch, M. Red and far red Sun-induced chlorophyll fluorescence as a measure of plant photosynthesis. Geophys. Res. Lett. 2015, 42, 1632–1639. [Google Scholar] [CrossRef] [Green Version]
  4. Sun, Y.; Fu, R.; Dickinson, R.; Joiner, J.; Frankenberg, C.; Gu, L.; Xia, Y.; Fernando, N. Drought onset mechanisms revealed by satellite solar-induced chlorophyll fluorescence: Insights from two contrasting extreme events. J. Geophys. Res. Biogeosci. 2015, 120, 2427–2440. [Google Scholar] [CrossRef]
  5. Yoshida, Y.; Joiner, J.; Tucker, C.; Berry, J.; Lee, J.-E.; Walker, G.; Reichle, R.; Koster, R.; Lyapustin, A.; Wang, Y. The 2010 Russian drought impact on satellite measurements of solar-induced chlorophyll fluorescence: Insights from modeling and comparisons with parameters derived from satellite reflectances. Remote Sens. Environ. 2015, 166, 163–177. [Google Scholar] [CrossRef]
  6. Song, L.; Guanter, L.; Guan, K.; You, L.; Huete, A.; Ju, W.; Zhang, Y. Satellite sun-induced chlorophyll fluorescence detects early response of winter wheat to heat stress in the Indian Indo-Gangetic Plains. Glob. Chang. Biol. 2018, 24, 4023–4037. [Google Scholar] [CrossRef] [PubMed] [Green Version]
  7. Zarco-Tejada, P.J.; Berni, J.A.J.; Suárez, L.; Sepulcre-Cantó, G.; Morales, F.; Miller, J.R. Imaging chlorophyll fluorescence with an airborne narrow-band multispectral camera for vegetation stress detection. Remote Sens. Environ. 2009, 113, 1262–1275. [Google Scholar] [CrossRef]
  8. Damm, A.; Elbers, J.A.N.; Erler, A.; Gioli, B.; Hamdi, K.; Hutjes, R.; Kosvancova, M.; Meroni, M.; Miglietta, F.; Moersch, A. Remote sensing of sun-induced fluorescence to improve modeling of diurnal courses of gross primary production (GPP). Glob. Chang. Biol. 2010, 16, 171–186. [Google Scholar] [CrossRef]
  9. Rossini, M.; Meroni, M.; Migliavacca, M.; Manca, G.; Cogliati, S.; Busetto, L.; Picchi, V.; Cescatti, A.; Seufert, G.; Colombo, R. High resolution field spectroscopy measurements for estimating gross ecosystem production in a rice field. Agric. For. Meteorol. 2010, 150, 1283–1296. [Google Scholar] [CrossRef]
  10. Perez-Priego, O.; Guan, J.; Rossini, M.; Fava, F.; Wutzler, T.; Moreno, G.; Carvalhais, N.; Carrara, A.; Kolle, O.; Julitta, T. Sun-induced Chlorophyll fluorescence and PRI improve remote sensing GPP estimates under varying nutrient availability in a typical Mediterranean savanna ecosystem. Biogeosciences Discuss. 2015, 12, 11891–11934. [Google Scholar] [CrossRef] [Green Version]
  11. Yang, X.; Tang, J.; Mustard, J.F.; Lee, J.E.; Rossini, M.; Joiner, J.; Munger, J.W.; Kornfeld, A.; Richardson, A.D. Solar-induced chlorophyll fluorescence that correlates with canopy photosynthesis on diurnal and seasonal scales in a temperate deciduous forest. Geophys. Res. Lett. 2015, 42, 2977–2987. [Google Scholar] [CrossRef]
  12. Duveiller, G.; Cescatti, A. Spatially downscaling sun-induced chlorophyll fluorescence leads to an improved temporal correlation with gross primary productivity. Remote Sens. Environ. 2016, 182, 72–89. [Google Scholar] [CrossRef]
  13. Goulas, Y.; Fournier, A.; Daumard, F.; Champagne, S.; Ounis, A.; Marloie, O.; Moya, I. Gross primary production of a wheat canopy relates stronger to far red than to red solar-induced chlorophyll fluorescence. Remote Sens. 2017, 9, 97. [Google Scholar] [CrossRef] [Green Version]
  14. Liu, L.; Guan, L.; Liu, X. Directly estimating diurnal changes in GPP for C3 and C4 crops using far-red sun-induced chlorophyll fluorescence. Agric. For. Meteorol. 2017, 232, 1–9. [Google Scholar] [CrossRef]
  15. Guanter, L.; Zhang, Y.; Jung, M.; Joiner, J.; Voigt, M.; Berry, J.A.; Frankenberg, C.; Huete, A.R.; Zarco-Tejada, P.; Lee, J.-E. Global and time-resolved monitoring of crop photosynthesis with chlorophyll fluorescence. Proc. Natl. Acad. Sci. USA 2014, 111, E1327–E1333. [Google Scholar] [CrossRef] [Green Version]
  16. Zarco-Tejada, P.J.; Morales, A.; Testi, L.; Villalobos, F.J. Spatio-temporal patterns of chlorophyll fluorescence and physiological and structural indices acquired from hyperspectral imagery as compared with carbon fluxes measured with eddy covariance. Remote Sens. Environ. 2013, 133, 102–115. [Google Scholar] [CrossRef]
  17. Xu, S.; Liu, Z.; Zhao, L.; Zhao, H.; Ren, S. Diurnal Response of Sun-Induced Fluorescence and PRI to Water Stress in Maize Using a Near-Surface Remote Sensing Platform. Remote Sens. 2018, 10, 1510. [Google Scholar] [CrossRef] [Green Version]
  18. Yang, H.; Yang, X.; Zhang, Y.; Heskel, M.A.; Lu, X.; Munger, J.W.; Sun, S.; Tang, J. Chlorophyll fluorescence tracks seasonal variations of photosynthesis from leaf to canopy in a temperate forest. Glob. Chang. Biol. 2017, 23, 2874–2886. [Google Scholar] [CrossRef]
  19. Renger, G. Overview of primary processes of photosynthesis. In Primary Processes of Photosynthesis; Part 1; Elsevier: Amsterdam, The Netherlands, 2007; pp. 5–35. [Google Scholar] [CrossRef]
  20. Verma, M.; Schimel, D.; Evans, B.; Frankenberg, C.; Beringer, J.; Drewry, D.T.; Magney, T.; Marang, I.; Hutley, L.; Moore, C. Effect of environmental conditions on the relationship between solar-induced fluorescence and gross primary productivity at an OzFlux grassland site. J. Geophys. Res. Biogeosci. 2017, 122, 716–733. [Google Scholar] [CrossRef] [Green Version]
  21. Van, d.T.C.; Berry, J.A.; Campbell, P.K.E.; Rascher, U. Models of fluorescence and photosynthesis for interpreting measurements of solar-induced chlorophyll fluorescence. J. Geophys. Res. Biogeosci. 2014, 119, 2312–2327. [Google Scholar]
  22. Gregersen, P.L.; Culetic, A.; Boschian, L.; Krupinska, K. Plant senescence and crop productivity. Plant Mol. Biol. 2013, 82, 603–622. [Google Scholar] [CrossRef] [PubMed]
  23. Borrell, A.K.; Hammer, G.L.; Douglas, A.C.L. Does maintaining green leaf area in sorghum improve yield under drought? I. Leaf growth and senescence. Crop Sci. 2000, 40, 1026–1037. [Google Scholar] [CrossRef]
  24. Lobell, D.B.; Sibley, A.; Ortiz-Monasterio, J.I. Extreme heat effects on wheat senescence in India. Nat. Clim. Chang. 2012, 2, 186–189. [Google Scholar] [CrossRef]
  25. Peñuelas, J.; Filella, I. Responses to a warming world. Science 2001, 294, 793–795. [Google Scholar] [CrossRef] [PubMed]
  26. Tian, Y.; Chen, J.; Chen, C.; Deng, A.; Song, Z.; Zheng, C.; Hoogmoed, W.; Zhang, W. Warming impacts on winter wheat phenophase and grain yield under field conditions in Yangtze Delta Plain, China. Field Crop. Res. 2012, 134, 193–199. [Google Scholar] [CrossRef]
  27. Guan, K.; Berry, J.A.; Zhang, Y.; Joiner, J.; Guanter, L.; Badgley, G.; Lobell, D.B. Improving the monitoring of crop productivity using spaceborne solar-induced fluorescence. Glob. Chang. Biol. 2016, 22, 716–726. [Google Scholar] [CrossRef]
  28. Zhang, T. The Study on Spatial Variability of Soil Elements and Its Environment Risk Assessment in Grape Producing Area in Zhang Jia Kou; Hebei Agricultural University: Baoding, China, 2010. [Google Scholar]
  29. Kalaji, H.M.; Bąba, W.; Gediga, K.; Goltsev, V.; Samborska, I.A.; Cetner, M.D.; Dimitrova, S.; Piszcz, U.; Bielecki, K.; Karmowska, K. Chlorophyll fluorescence as a tool for nutrient status identification in rapeseed plants. Photosynth. Res. 2018, 136, 329–343. [Google Scholar] [CrossRef] [Green Version]
  30. Liu, L.; Yang, X.; Zhou, H.; Liu, S.; Zhou, L.; Li, X.; Yang, J.; Han, X.; Wu, J. Evaluating the utility of solar-induced chlorophyll fluorescence for drought monitoring by comparison with NDVI derived from wheat canopy. Sci. Total Environ. 2018, 625, 1208–1217. [Google Scholar] [CrossRef]
  31. Liu, L.; Yang, X.; Zhou, H.; Liu, S.; Zhou, L.; Li, X.; Yang, J.; Wu, J. Relationship of root zone soil moisture with solar-induced chlorophyll fluorescence and vegetation indices in winter wheat: A comparative study based on continuous ground-measurements. Ecol. Indic. 2018, 90, 9–17. [Google Scholar] [CrossRef]
  32. Meroni, M.; Busetto, L.; Colombo, R.; Guanter, L.; Moreno, J.; Verhoef, W. Performance of Spectral Fitting Methods for vegetation fluorescence quantification. Remote Sens. Environ. 2010, 114, 363–374. [Google Scholar] [CrossRef]
  33. Viña, A.; Gitelson, A.A. New developments in the remote estimation of the fraction of absorbed photosynthetically active radiation in crops. Geophys. Res. Lett. 2005, 32. [Google Scholar] [CrossRef] [Green Version]
  34. Baker, N.R.; Oxborough, K.; Lawson, T.; Morison, J.I.L. High resolution imaging of photosynthetic activities of tissues, cells and chloroplasts in leaves. J. Exp. Bot. 2001, 52, 615–621. [Google Scholar] [CrossRef] [PubMed]
  35. Baker, N.R.; Rosenqvist, E. Applications of chlorophyll fluorescence can improve crop production strategies: An examination of future possibilities. J. Exp. Bot. 2004, 55, 1607–1621. [Google Scholar] [CrossRef] [Green Version]
  36. Lichtenthaler, H.K.; Wellburn, A.R. Determinations of Total Carotenoids and Chlorophylls a and b of Leaf Extracts in Different Solvents; Portland Press Limited: London, UK, 1983. [Google Scholar]
  37. Sudhakar, P.; Latha, P.; Reddy, P.V. Plant Pigments. Phenotyping Crop Plants for Physiological and Biochemical Traits; Elsevier: Amsterdam, The Netherlands, 2016; pp. 121–127. [Google Scholar] [CrossRef]
  38. Fang, H.; Li, W.; Wei, S.; Jiang, C. Seasonal variation of leaf area index (LAI) over paddy rice fields in NE China: Intercomparison of destructive sampling, LAI-2200, digital hemispherical photography (DHP), and AccuPAR methods. Agric. For. Meteorol. 2014, 198, 126–141. [Google Scholar] [CrossRef]
  39. Frankenberg, C.; Berry, J. Solar Induced Chlorophyll Fluorescence: Origins, Relation to Photosynthesis and Retrieval; Elsevier: Amsterdam, The Netherlands, 2018. [Google Scholar] [CrossRef]
  40. Ocheltree, T.W.; Nippert, J.B.; Prasad, P.V.V. Stomatal responses to changes in vapor pressure deficit reflect tissue-specific differences in hydraulic conductance. Plant Cell Environ. 2014, 37, 132–139. [Google Scholar] [CrossRef] [PubMed]
  41. Lambers, H. Plant Respiration: From Cell to Ecosystem; Springer Science & Business Media: Berlin, Germany, 2005; Volume 18. [Google Scholar]
  42. Biswal, B.; Krupinska, K.; Biswal, U.C. Plastid Development in Leaves during Growth and Senescence; Springer: Berlin, Germany, 2013. [Google Scholar]
  43. Aro, E.-M.; Andersson, B. Regulation of Photosynthesis; Springer Science & Business Media: Berlin, Germany, 2006; Volume 11. [Google Scholar]
  44. Millar, A.J.; Kay, S.A. Integration of circadian and phototransduction pathways in the network controlling CAB gene transcription in Arabidopsis. Proc. Natl. Acad. Sci. USA 1996, 93, 15491–15496. [Google Scholar] [CrossRef] [Green Version]
  45. Dodd, A.N.; Salathia, N.; Hall, A.; Kévei, E.; Tóth, R.; Nagy, F.; Hibberd, J.M.; Millar, A.J.; Webb, A.A.R. Plant circadian clocks increase photosynthesis, growth, survival, and competitive advantage. Science 2005, 309, 630–633. [Google Scholar] [CrossRef] [Green Version]
  46. Zhang, Y.; Guanter, L.; Berry, J.A.; van der Tol, C.; Yang, X.; Tang, J.; Zhang, F. Model-based analysis of the relationship between sun-induced chlorophyll fluorescence and gross primary production for remote sensing applications. Remote Sens. Environ. 2016, 187, 145–155. [Google Scholar] [CrossRef] [Green Version]
Figure 1. The relationship between the received photosynthetically active radiation (PAR) and the accumulated irradiance from 761 to 763 nm. All the measurements were collected for wheat from 20 April to 19 May 2017.
Remotesensing 12 01518 g001
Figure 2. Comparisons of canopy pigment contents between soybean and sweet potato. The difference in the values between soybean and sweet potato were significant at the level of P < 0.05, which was determined using the one-way ANOVA (Tukey test). Error bars show the standard error of the mean.
Remotesensing 12 01518 g002
Figure 3. Diurnal patterns of F760, AF760 and simultaneously measured PAR in (a) soybean and (b) sweet potato.
Remotesensing 12 01518 g003
Figure 4. Diurnal patterns of (a) and (b) Fy760 accompanied by the absorbed photosynthetically active radiation (APAR), (c) and (d) PSII operating efficiency ( F q / F m ) accompanied by NPQ in soybean (upper panel) and sweet potato (lower panel). The values of APAR in left column was calculated based on Equation (2).
Remotesensing 12 01518 g004
Figure 5. Relationship of the PSII operating efficiency ( F q / F m ) with (a) the solar-induced chlorophyll fluorescence (SIF) yield (Fy760) and (b) non-photochemical quenching ( F m / F m 1 , NPQ) based on the diurnal measurements of soybean (black) and sweet potato (red).
Remotesensing 12 01518 g005
Figure 6. Diurnal patterns of the gas exchange measurements: (a) and (b) the net photosynthetic rate (A) accompanied by photosynthetically active radiation (PAR), (c) and (d) intercellular carbon dioxide concentration (Ci) accompanied by stomatal conductance (gsw). The upper panel shows the soybean results, and the lower panel shows the sweet potato results. The PAR in the left column was measured synchronously with the gas exchange measurements using Li-6800. Significant differences (P < 0.05) between the mean values in the figure are marked by different letters above the symbols, while the letters with a same letter showed that the difference is not significant. For example, as shown in Figure a, the letters “a” and “ab” corresponding to first and second measurement of A represent that their difference is insignificant, while the letters “a” and “bc” corresponding to the first and third one represent that the difference is significant.
Remotesensing 12 01518 g006
Figure 7. Diurnal patterns of Fy760 accompanied by the photosynthesis parameters and gas exchange measurements. The upper panel shows the soybean results, and the lower panel shows the sweet potato results. Images of F q / F m (PSII operating efficiency), F v / F m (PSII maximum efficiency), and F q / F v (PSII efficiency factor) were from soybean and sweet potato.
Remotesensing 12 01518 g007
Figure 8. Diurnal patterns of intercellular carbon dioxide concentration (Ci) accompanied by the air temperature and short-wave radiation for (a) soybean results and (b) sweet potato results. The air temperature and short-wave radiation were collected with an interval time of one hour in a meteorological station that was ~300 meters away from our experimental site. Significant differences (P < 0.05) between the mean values in the figure are marked by different letters above symbols, while the letters with a same letter showed that the difference is not significant. For example, as shown in Figure a, the letters “ab” and “bc” corresponding to the second and third measurement of Ci represent that their difference is insignificant, while the letters “ab” and “c” corresponding to the second and fourth one represent that the difference is significant.
Remotesensing 12 01518 g008
Table 1. Fluorescence parameters of FluorImager [35].
Fluorescence ParametersDefinitionPhysiological Significance
F o Minimum fluorescence from dark-adapted leafLevel of fluorescence when the primary quinone electron acceptors of PSII (QA) are maximally oxidized (PSII centers are open).
F o Minimum fluorescence from light-adapted leaf
F m Maximal fluorescence from dark-adapted leafLevel of fluorescence when the QA is maximally reduced (PSII centers are closed).
F m Maximal fluorescence from light-adapted leaf
F v Variable fluorescence from dark-adapted leafIndicates the ability of PSII to perform primary photochemistry (photoreduction in QA).
F v Variable fluorescence from light-adapted leaf
F q Difference in fluorescence between
F m and F
Photochemical quenching of fluorescence due to open PSII centers.
F v / F m Maximum quantum efficiency of PSII photochemistryMaximum efficiency at which light absorbed by light-harvesting antennae of PSII is converted to chemical energy (QA reduction).
F q / F m PSII operating efficiencyEstimates the efficiency at which light absorbed by PSII antennae is used for photochemistry (QA reduction). At a given light intensity, it provides a measure of the quantum efficiency of linear electron transport through PSII.
F v / F m PSII maximum efficiencyProvides an estimate of the maximum efficiency of the PSII photochemistry at a given light intensity, which is the PSII operating efficiency if all the PSII centers are open (QA oxidized).
F q / F v PSII efficiency factorIs non-linearly related to the proportion of PSII centers that are open (with QA oxidized). Relates the PSII maximum efficiency to the PSII operating efficiency. Mathematically identical to the coefficient of photochemical quenching, qP.
NPQNon-photochemical quenchingEstimates the non-photochemical quenching from F m to F m . Monitors the apparent rate constant for non-radiative decay (heat loss) from PSII and its antennae.
Table 2. Pigment concentrations ( μ g / mL   of   plant   extract ) with values of mean ± stand   error   of   mean .
PigmentsSoybeanSweet Potato
Chl a 7.18 ± 0.29 6.10 ± 0.75
Chl b 1.92 ± 0.11 1.81 ± 0.16
Chl a + Chl b 9.09 ± 0.40 7.91 ± 0.90
Chl a/Chl b 3.76 ± 0.09 3.32 ± 0.21
Car 1.13 ± 0.04 0.89 ± 0.07
Chl/Car 8.09 ± 0.24 8.80 ± 0.55

