1. Introduction
The type III bursts [
1] belong to the most frequently observed radio events in the outer layer of the Sun’s atmosphere—the corona. They are observed over a broad frequency range, from 10 kHz up to 1 GHz. Type III bursts appear in groups of numerous bursts, with total duration from few minutes up to a whole day or even longer, in case of a storm [
2]. In dynamic spectra the type III bursts look like fast drifting, almost perpendicular structures. The small inclination indicates the direction of fast moving electron beams accelerated in the corona, which are responsible for the generation of type III bursts due to plasma emission mechanism [
3]. The relationship between the drift rate
measured at the frequency
f and the radial source velocity
is given by:
where
N is the number density [
4]. For type III bursts drift rates correspond to the electron beams velocity ranging typically between
and
[
2] (where
c is the speed of light). Drift rates decrease is directly proportional to the frequency and in the meter range are about several hundred MHz/s (see e.g., [
5]). The duration of individual bursts varies inversely as a function of frequency. Time profiles of the type III bursts radio flux show rapid rise and slow decay. Additionally, decay seems to have an exponential distribution [
6].
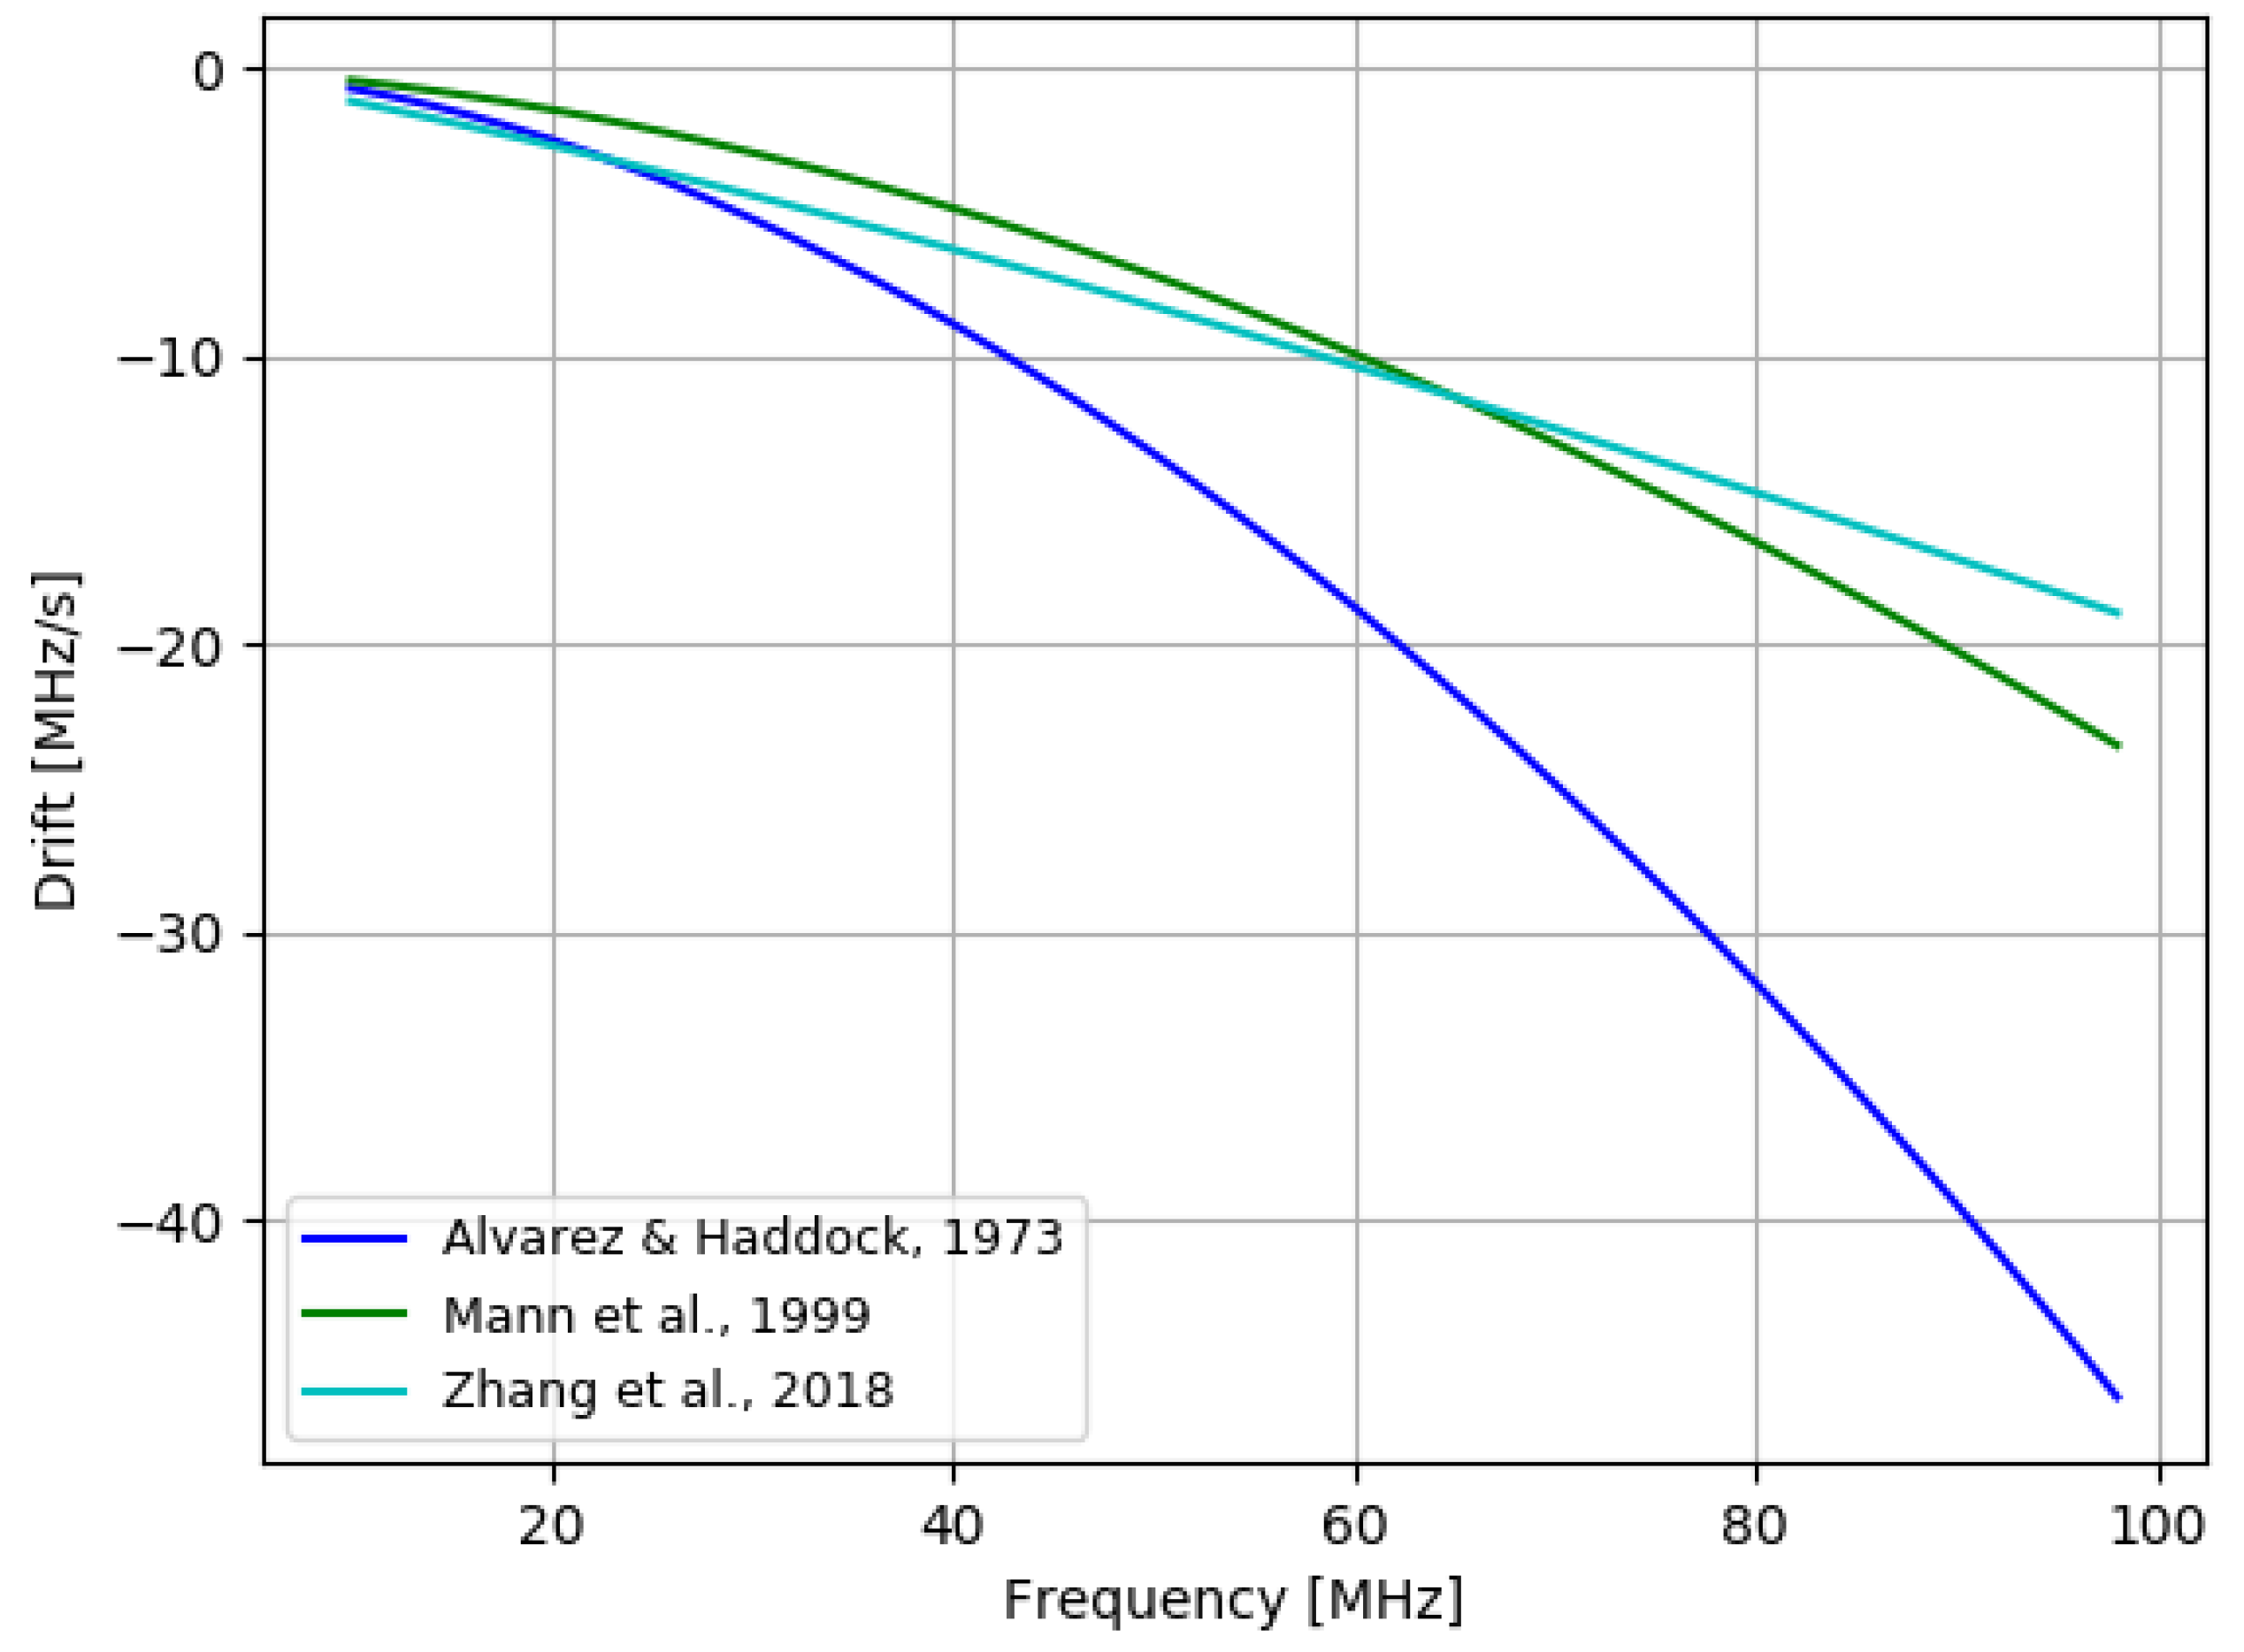
One of the characteristic features of a type III solar radio bursts is high drift rate, measured in MHz/s (see
Table 1). In the
Figure 1 we present drift rates as a function of frequency presented in publications listed in the
Table 1. The drift rate was limited up to 10–90 MHz frequency band, which corresponds to the frequency range of our research. The drift rates as a function of frequency obtained by [
4,
7] are similar, while the ones presented in [
8] are somewhat different.
For the proper velocity estimation of the electrons beams responsible for the type III solar radio bursts generation, besides the drift rate, knowledge about the electron density in the solar corona is also required. Several models of electron density in the solar corona, like for example [
4,
9,
10,
11,
12,
13], are currently in use. Four of them were presented in the
Figure 2. In this study, the radial velocity have been computed employing the two most commonly used electron density models proposed by [
4,
11].
In the Mann et al. coronal density model [
4] (hereafter called Mann et al. model) the radial velocity
is computed with the following formula:
where
km/s,
f is the frequency,
MHz,
(for the fundamental emission,
would correspond to harmonic emission, but here we assume fundamental emission) and
is the drift rate. In the Newkirk coronal density model [
11] (hereafter called Newkirk model) the radial velocity
is expressed as:
where:
where
N is the number density,
is the drift rate,
f is the frequency and
r is a distance from the center of the Sun in solar radius units [
14]. For estimation of the type III radio burst parameters we assume they are emitted at the fundamental plasma frequency.
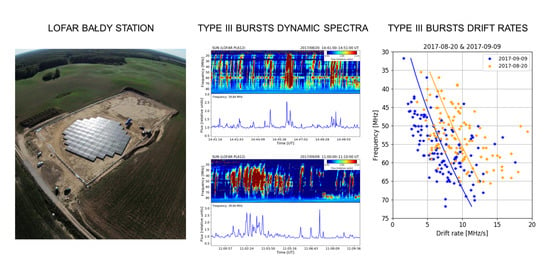
The main objectives of our work was: (1) to determine the parameters of type III events, such as drift velocity, (2) to estimate the velocity of electrons responsible for the formation of such type of events and (3) to compare them with the results obtained by other authors. Furthermore, the additional goal was to add more detail to already established knowledge on type III radio bursts. For this task LOFAR telescope is extremely useful. This instrument is very sensitive with high frequency resolution that observes a broad bandwidth of very low radio frequencies (10–90 MHz). Such combination of parameters is extremely rare, hence the direct comparison of the results with other radio data sources is not always possible. For this purpose we used observations from a single LOFAR station in Bałdy (Poland). For better understanding of the conditions under which type III events are generated, we also used the data obtained by the IRIS and SDO satellites.
2. Instruments
In this work we use the data from LOFAR, the LOw-Frequency ARray telescope (radio range), IRIS (ultraviolet range) and from SDO (ultraviolet range).
2.1. LOFAR Telescope
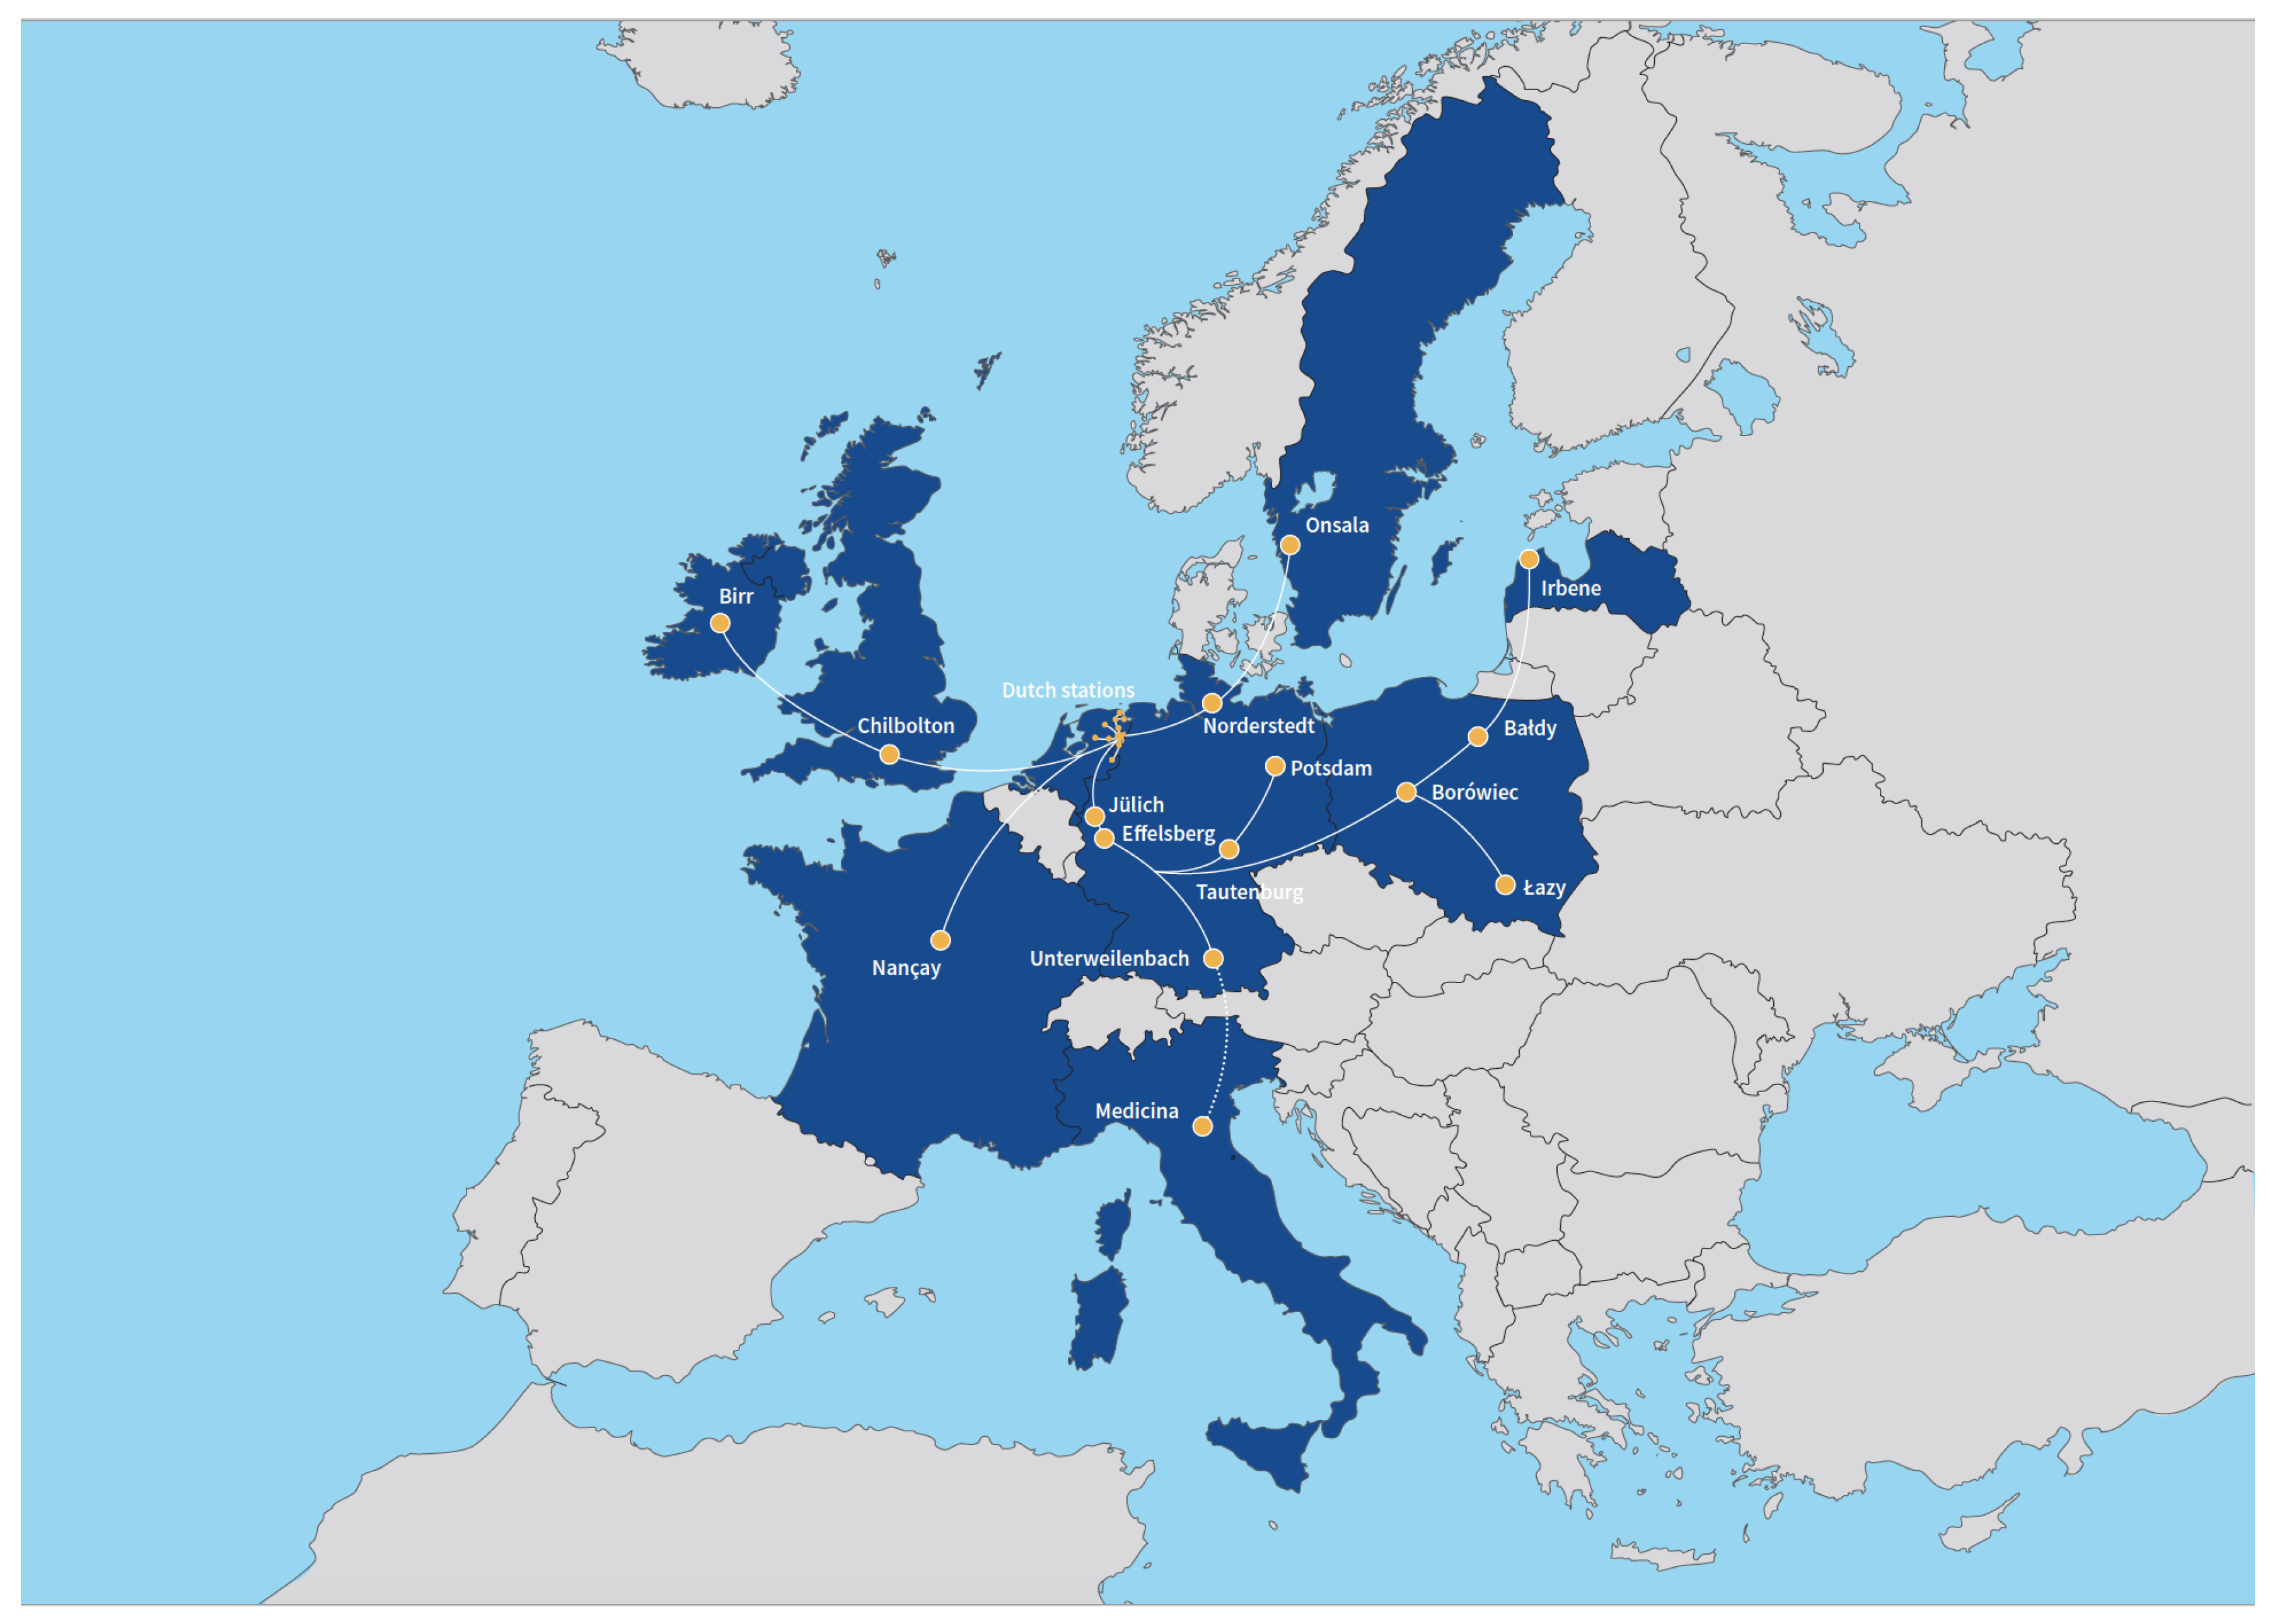
LOFAR is a large radio interferometer working in a broad frequency range 10–240 MHz. LOFAR consists of over 50 stations, which are spread all over Europe (
Figure 3). The LOFAR “core” consists of 24 stations located near Exloo, The Netherlands. Six of these stations are placed on an artificial island with diameter of about 350 m called “Superterp”. 14 so called “remote” stations are located at a distance of up to 90 km from the core. In addition, LOFAR is extended with 14 “international” stations in Germany (6 stations), Poland (3 stations), and one station each in France, Sweden, United Kingdom, Ireland and Latvia. The largest baselines are of the order of 2000 kilometres, resulting in the 0.1 arc second resolution imaging in the 110–240 MHz range. The LOFAR stations are connected by a high speed network. The data centres are located in Amsterdam, Jülich and Poznan. The correlator is located in Groningen (The Netherlands). A single station of the LOFAR telescope consists of few thousands of dipole antennas connected together. They are grouped in two fields (1) Low Band Antennas (LBA) operating in the frequency range of 10–90 MHz and (2) High Band Antennas (HBA) operating in the range of 110–240 MHz. Each station type: international, core or remote, has a different configuration and number of LBA and HBA antennas [
15,
16].
Each international LOFAR station can operate as an individual instrument, which can be used, for example, for spectroscopic solar observations. Ref. [
17,
18] have described a methodology of simultaneous observations with both LBA and HBA, covering the entire frequency range of the LOFAR telescope, which we have used in this work. A part of data is recorded at the Bałdy station Local Computing Unit, while the main string is recorded at the University of Warmia and Mazury in Olsztyn data center.
Spectroscopic solar observation with the use of the Bałdy LOFAR station (Poland) in a local mode, started from February 2017 [
19]. Since then, observations are performed regularly, usually one or two days per week—the station runs also other observations programs, especially in the ILT (International LOFAR Telescope) mode. The temporal and frequency resolutions of observations presented here are 1 s and 0.39 MHz, respectively. The LOFAR single station has unique capabilities which are the (1) high frequency resolution, (2) high sensitivity, and (3) wide frequency bandwidth.
2.2. IRIS
The Interface Region Imaging Spectrograph (IRIS), launched on 27th June 2013, is a Small Explorer mission (SMEX) realized by NASA. It observed the Sun in the ultraviolet spectral range and performed images and spectra simultaneously. The main aim of IRIS observations is to answer the questions about the structure, dynamics and processes in the solar atmosphere, like type of non-thermal energy in the chromosphere and in the upper layers, mechanism of coronal heating, acceleration of the solar wind, role of magnetic flux emergence in the solar flares and coronal mass ejections (CMEs). The IRIS is a perfect tool to study the solar atmosphere from the level of photosphere, across chromosphere, transition region up to the corona because of its high spatial (0.33–0.4 arcsec), temporal (1 s) and spectral resolution (1 km/s). These observations correspond to the range of temperatures from
to
K. The IRIS telescope is constructed in the Cassegrain system. The diameter of the primary mirror is equal to 19 cm and effective focal length is approximately 7 m. The solar atmosphere is observed by the IRIS cameras in four bands: C II 1330 Å, Si IV 1400 Å (both explore the transition region), Mg II k 2796 Å (chromosphere) and 2832 Å containing the wing of Mg II line (photosphere). Passbands of the Slit-Jaw Images (SJI) cover a field-of-view (FOV) up to
arcsec. On board of IRIS, the Czerny-Turner spectrograph with a slit of 0.33 arcsec in width and 175 arcsec in length is mounted. The spectrograph of IRIS covers two FUV ranges, FUVS (1331.6–1358.4 Å) and FUVL (1390.0–1406.8 Å) and one NUV range (2782.6–2833.9 Å). The strongest lines observed in these spectral ranges are Mg II h and k and C II (both are optically thick), and Si IV (optically thin lines). Other optically thin lines, like O I, Cl I, O IV, S IV, Fe XII and Fe XXI, are also observed. The detailed description the IRIS mission can be found in [
20].
2.3. SDO
The Solar Dynamics Observatory (SDO) launched on 11th February 2010, is NASA’s mission under the Living With a Star (LWS) program [
21]. The telescopes on board SDO observe the solar activity and its influence on Earth and near Earth space. The mission consists of three experiments: Atmospheric Imaging Assembly (AIA), Extreme Ultraviolet Variability Experiment (EVE), and Helioseismic and Magnetic Imager (HMI). AIA contains four telescopes, each one has 20 cm diameter and effective focal length of 4.125 m. They image the solar atmosphere in seven Extreme Ultraviolet (EUV) channels: 94, 131, 171, 193, 211, 304, 335 Å, which covers the temperature range from
to
K, and in 1600, 1700 and 4500 Å [
22]. EVE measures the Sun’s EUV irradiance in range of wavelengths from 0.1 to 105 nm [
23]. HMI studies the magneitic field (Doppler shift, intensity and vector of the field) of the solar surface and observed the Sun at 6173 Å [
24].
3. Observations
For our analyzis, we chose two type III solar radio events observed in the frequency range of 10–90 MHz. The first one occurred on 20th August 2017 (shown in the
Figure 4 and
Figure 5) and the second one on 9th September 2017 (shown in the
Figure 6 and
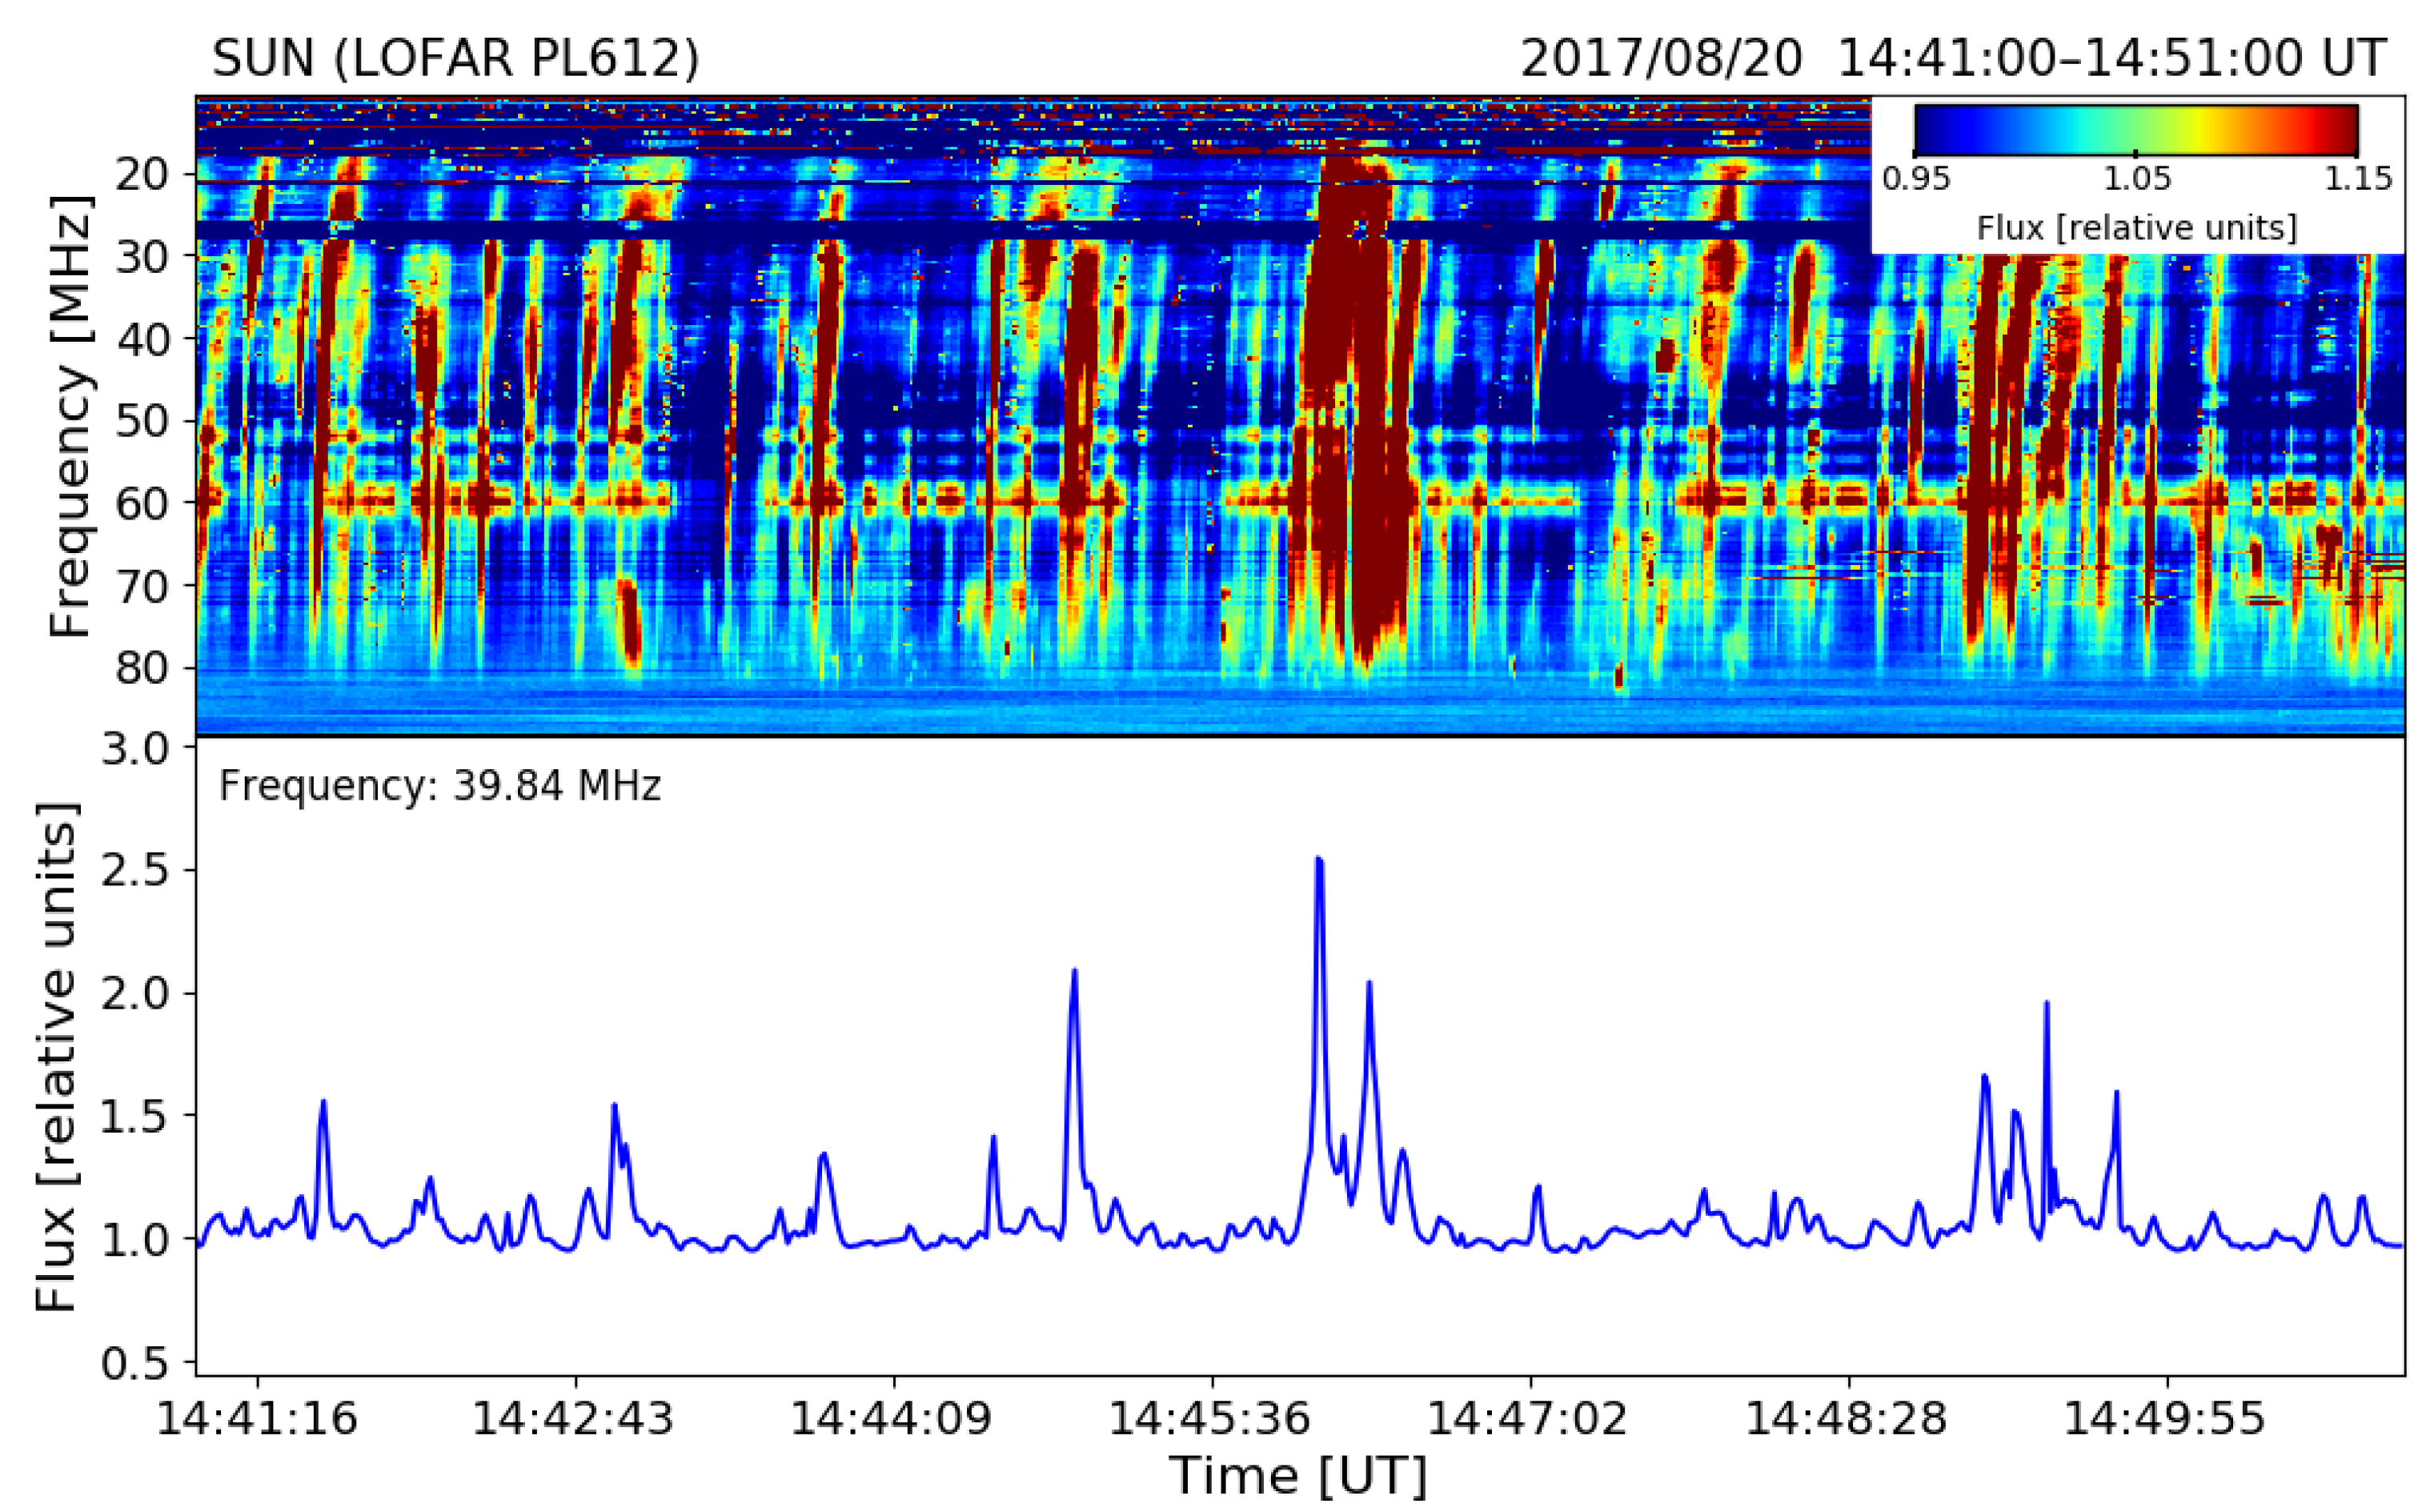
Figure 7). In both cases, we were unable to observe the beginning or ending of the event, because the Sun was already too low over the horizon or the observation program for Bałdy station was set to observations of another radio source. On bottom panels of
Figure 4 and
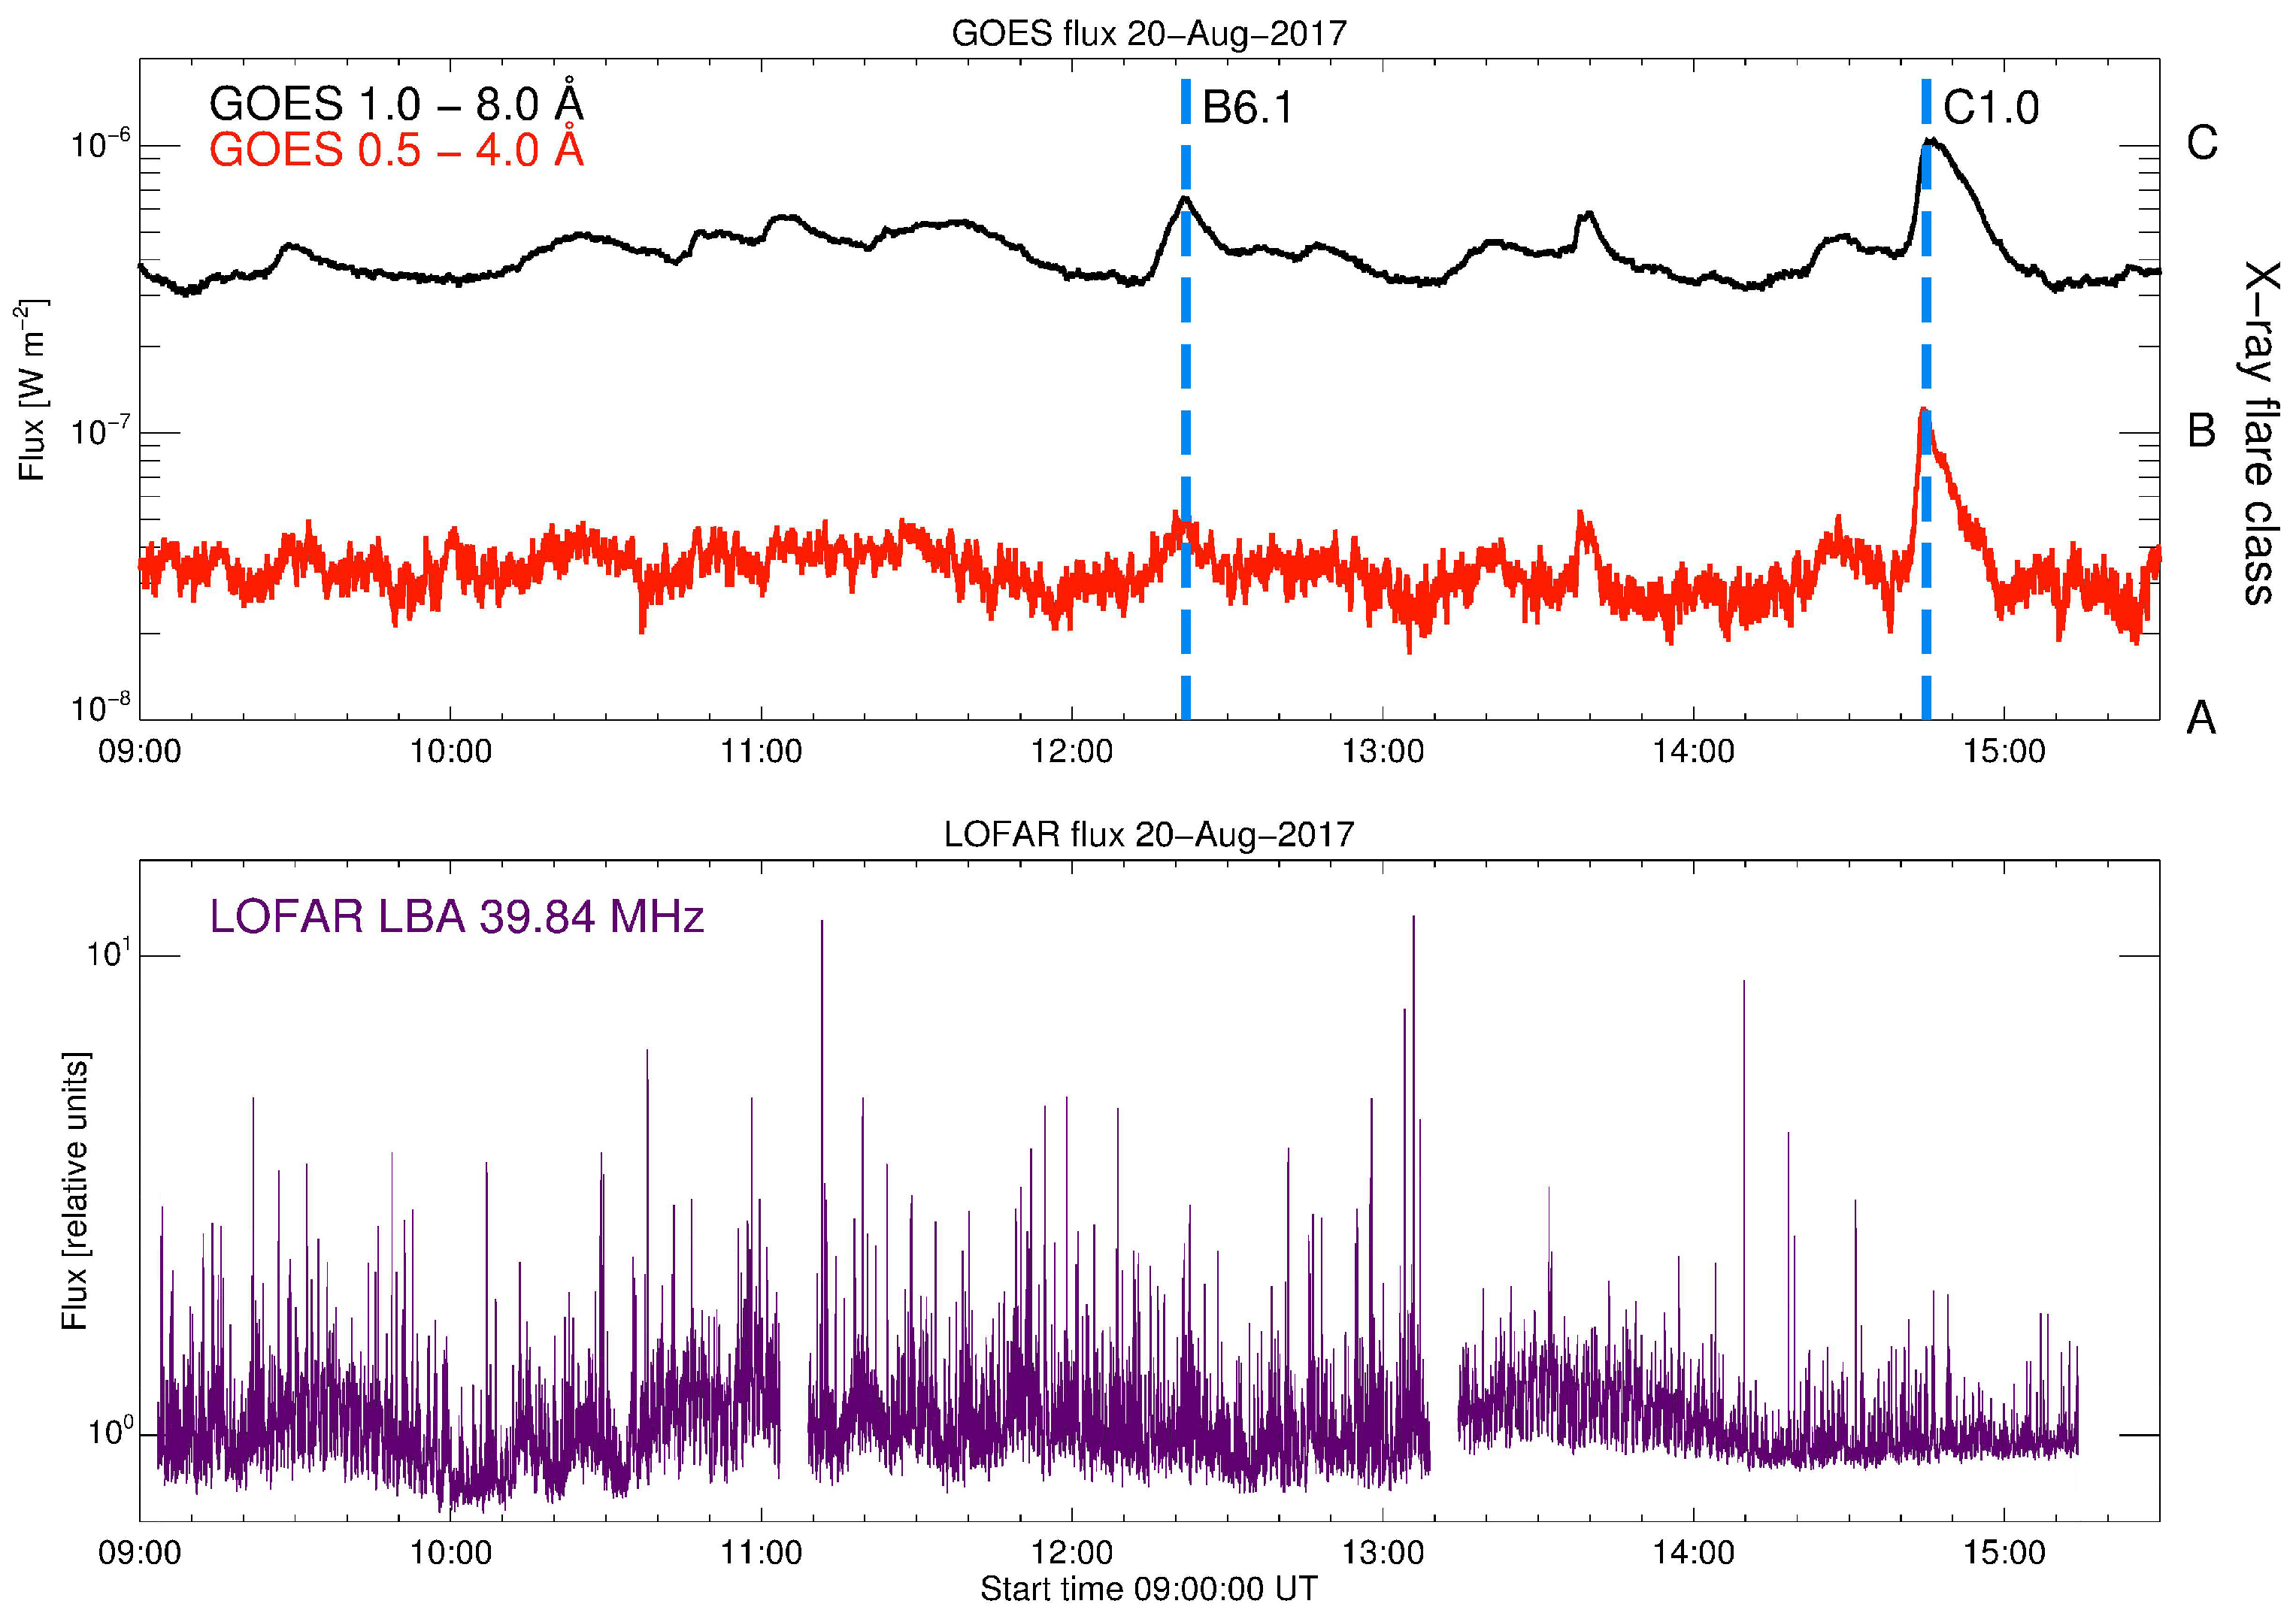
Figure 6 radio flux from LOFAR at 39.84 MHz frequency has been selected as it roughly corresponds to the middle of our frequency band. However, we note that the events on 20th August 2017 and 9th September 2017 were also embedded in the type III storms lasting for several days, related with the activity from active regions NOAA 12671 and NOAA 12673, respectively. The type III event on 20th August 2017 was observed between 09:03:32 UT and 15:14:36 UT and the event on 9th September 2017 was observed between 10:03:32 UT and 14:09:08 UT. During the event on 20th August 2017 the GOES satellite registered two flares. The first one is B6.1 flare which originated from the NOAA 12671 active region. The flare started at 12:16 UT, reached the maximum at 12:21 UT and ended at 12:26 UT (
Figure 5, upper panel). The second one C1.0 flare originated from the NOAA 12672 active region. The flare started at 14:40 UT, reached the maximum at 14:45 UT and ended at 14:52 UT (
Figure 5, upper panel). The solar flares were localized in two different AR’s. One of the flare appeared close to the centre of the solar disk, and the second one were observed on the east solar limb. Due to the lack of an interferometric Sun image, it was impossible to identify the radio sources. During the event on 9th September 2017 the GOES satellite registered the M3.7 flare which originated from the NOAA 12673 active region located close to the solar limb at coordinates (187”S 883”W). The flare started at 10:50 UT, reached the maximum at 11:04 UT and ended at 11:42 UT (
Figure 7, upper panel). The main details regarding both events are summarized in the
Table 2.
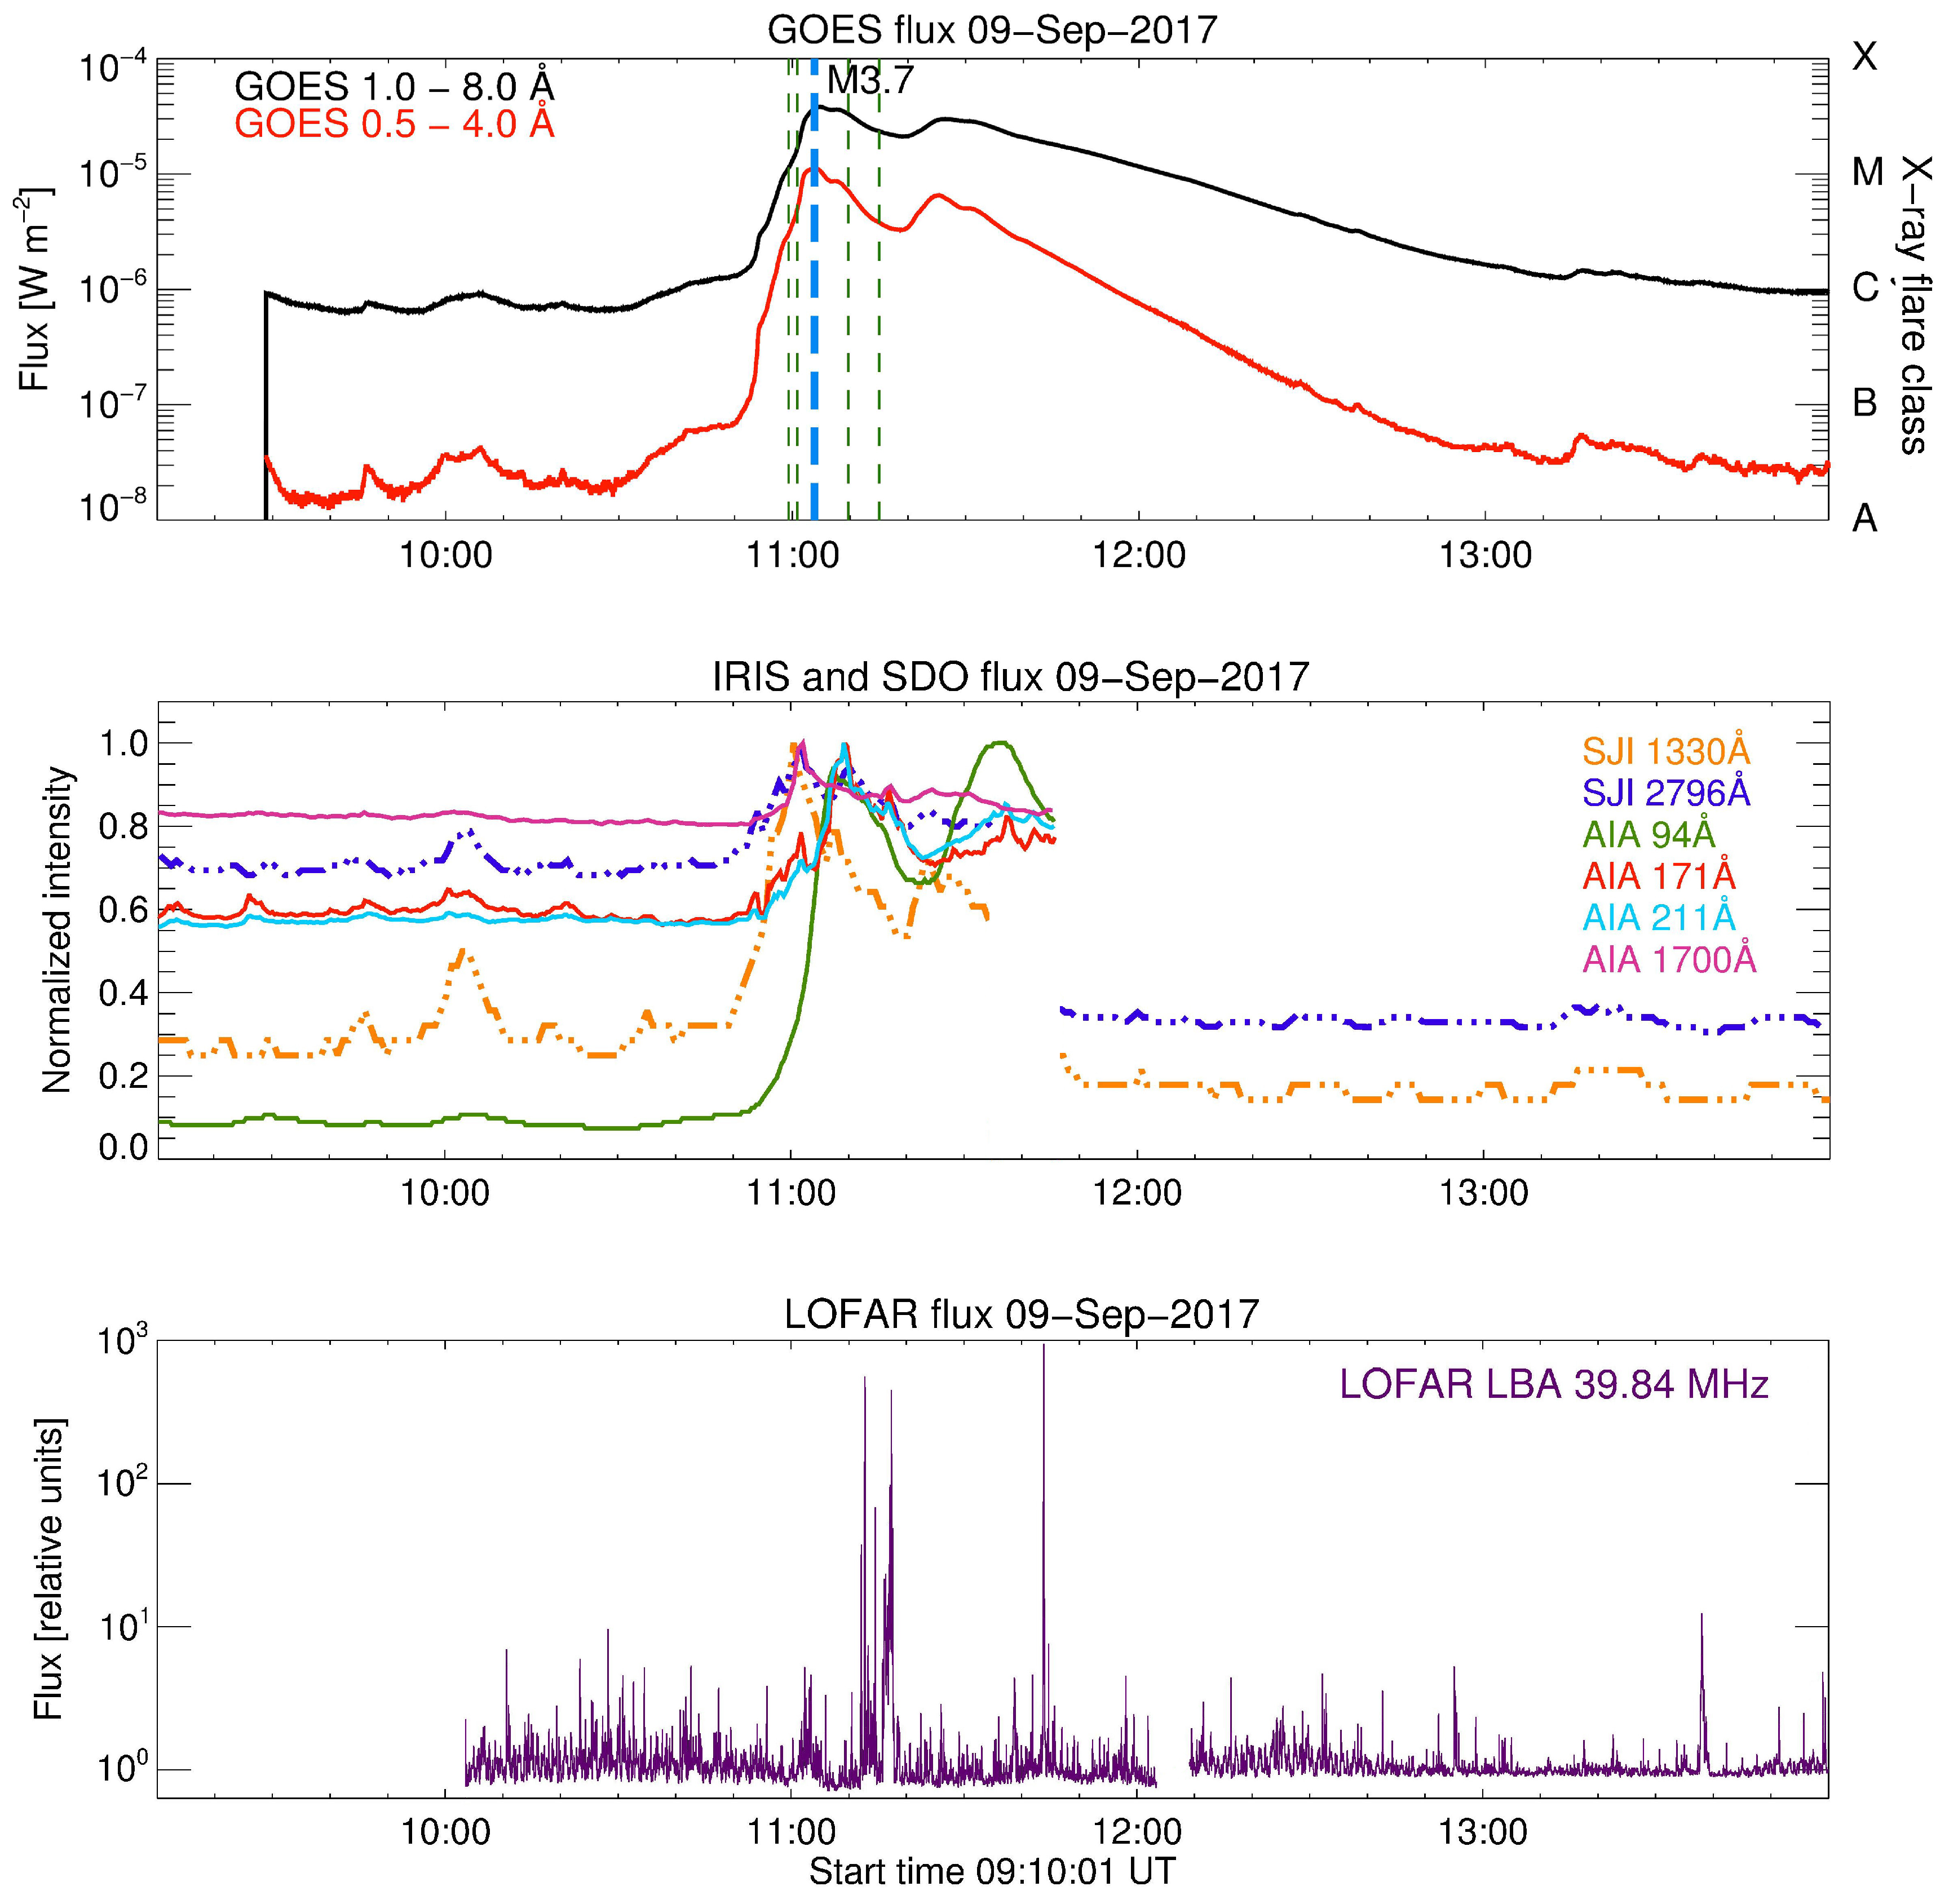
One of the three GOES solar flares which appeared during studied radio events was also registered by the IRIS and SDO satellites. It was an M3.7 GOES class solar flare registered on 9th September 2017 (
Figure 7, second panel). One can see two peaks, the first one at 11:04 UT and the second one at 11:23 UT. The second peak appeared in the same active region, but it was not fully visible in the FOV of the SJIs. After these two peaks we observed gradual phase of the solar flare lasting over 2 hours. IRIS performed the observations from 5:20 to 11:36 UT and it contains the impulsive, maximum phase and part of the gradual phase of the flare. The observations contain SJIs in three passbands with a FOV
arcsec—C II 1330 Å (transition region), Mg II k 2796 Å (chromosphere) and wing of the Mg II line centered at 2832 Å (photosphere). IRIS recorded 800 SJIs with a 28 s cadence in every passband (examples are showed on the
Figure 8): 1330 Å—upper panel, 2796 Å—middle panel, 2832 Å—lower panel. In our research we used IRIS level 2 data, which are corrected for i.a. dark current, flat-field, geometric distortion and scattered light [
25]. In the upper panel of
Figure 7 we marked also moments, for which SDO/AIA maps were obtained (green vertical dotted lines). In the
Figure 8 we can see the active region just before the flare triggered at 10:59 UT in the images at 1330 Å and 2796 Å. Some small brightenings in one of the sunspots in the photospheric filter are clearly visible. The flare ribbon was well visible in the IRIS maps at around 11:01 UT in the impulsive phase. After the flare onset, at 11:10 UT and 11:15 UT, the small flare loops system also appeared. There are no visible structures at 2832 Å in the photosphere layer. The characteristic feature of the SJIs is also worth mentioning. The bright vertical line in the middle of the transition region maps and the same line, but dark visible in the other maps (
Figure 8), is a shadow of the slit of the IRIS spectrograph.
The comparison of GOES 1–8 Å with IRIS 1330 Å and 2796 Å SJIs, counted from the whole FOV of every SJI and divided by its exposure times (
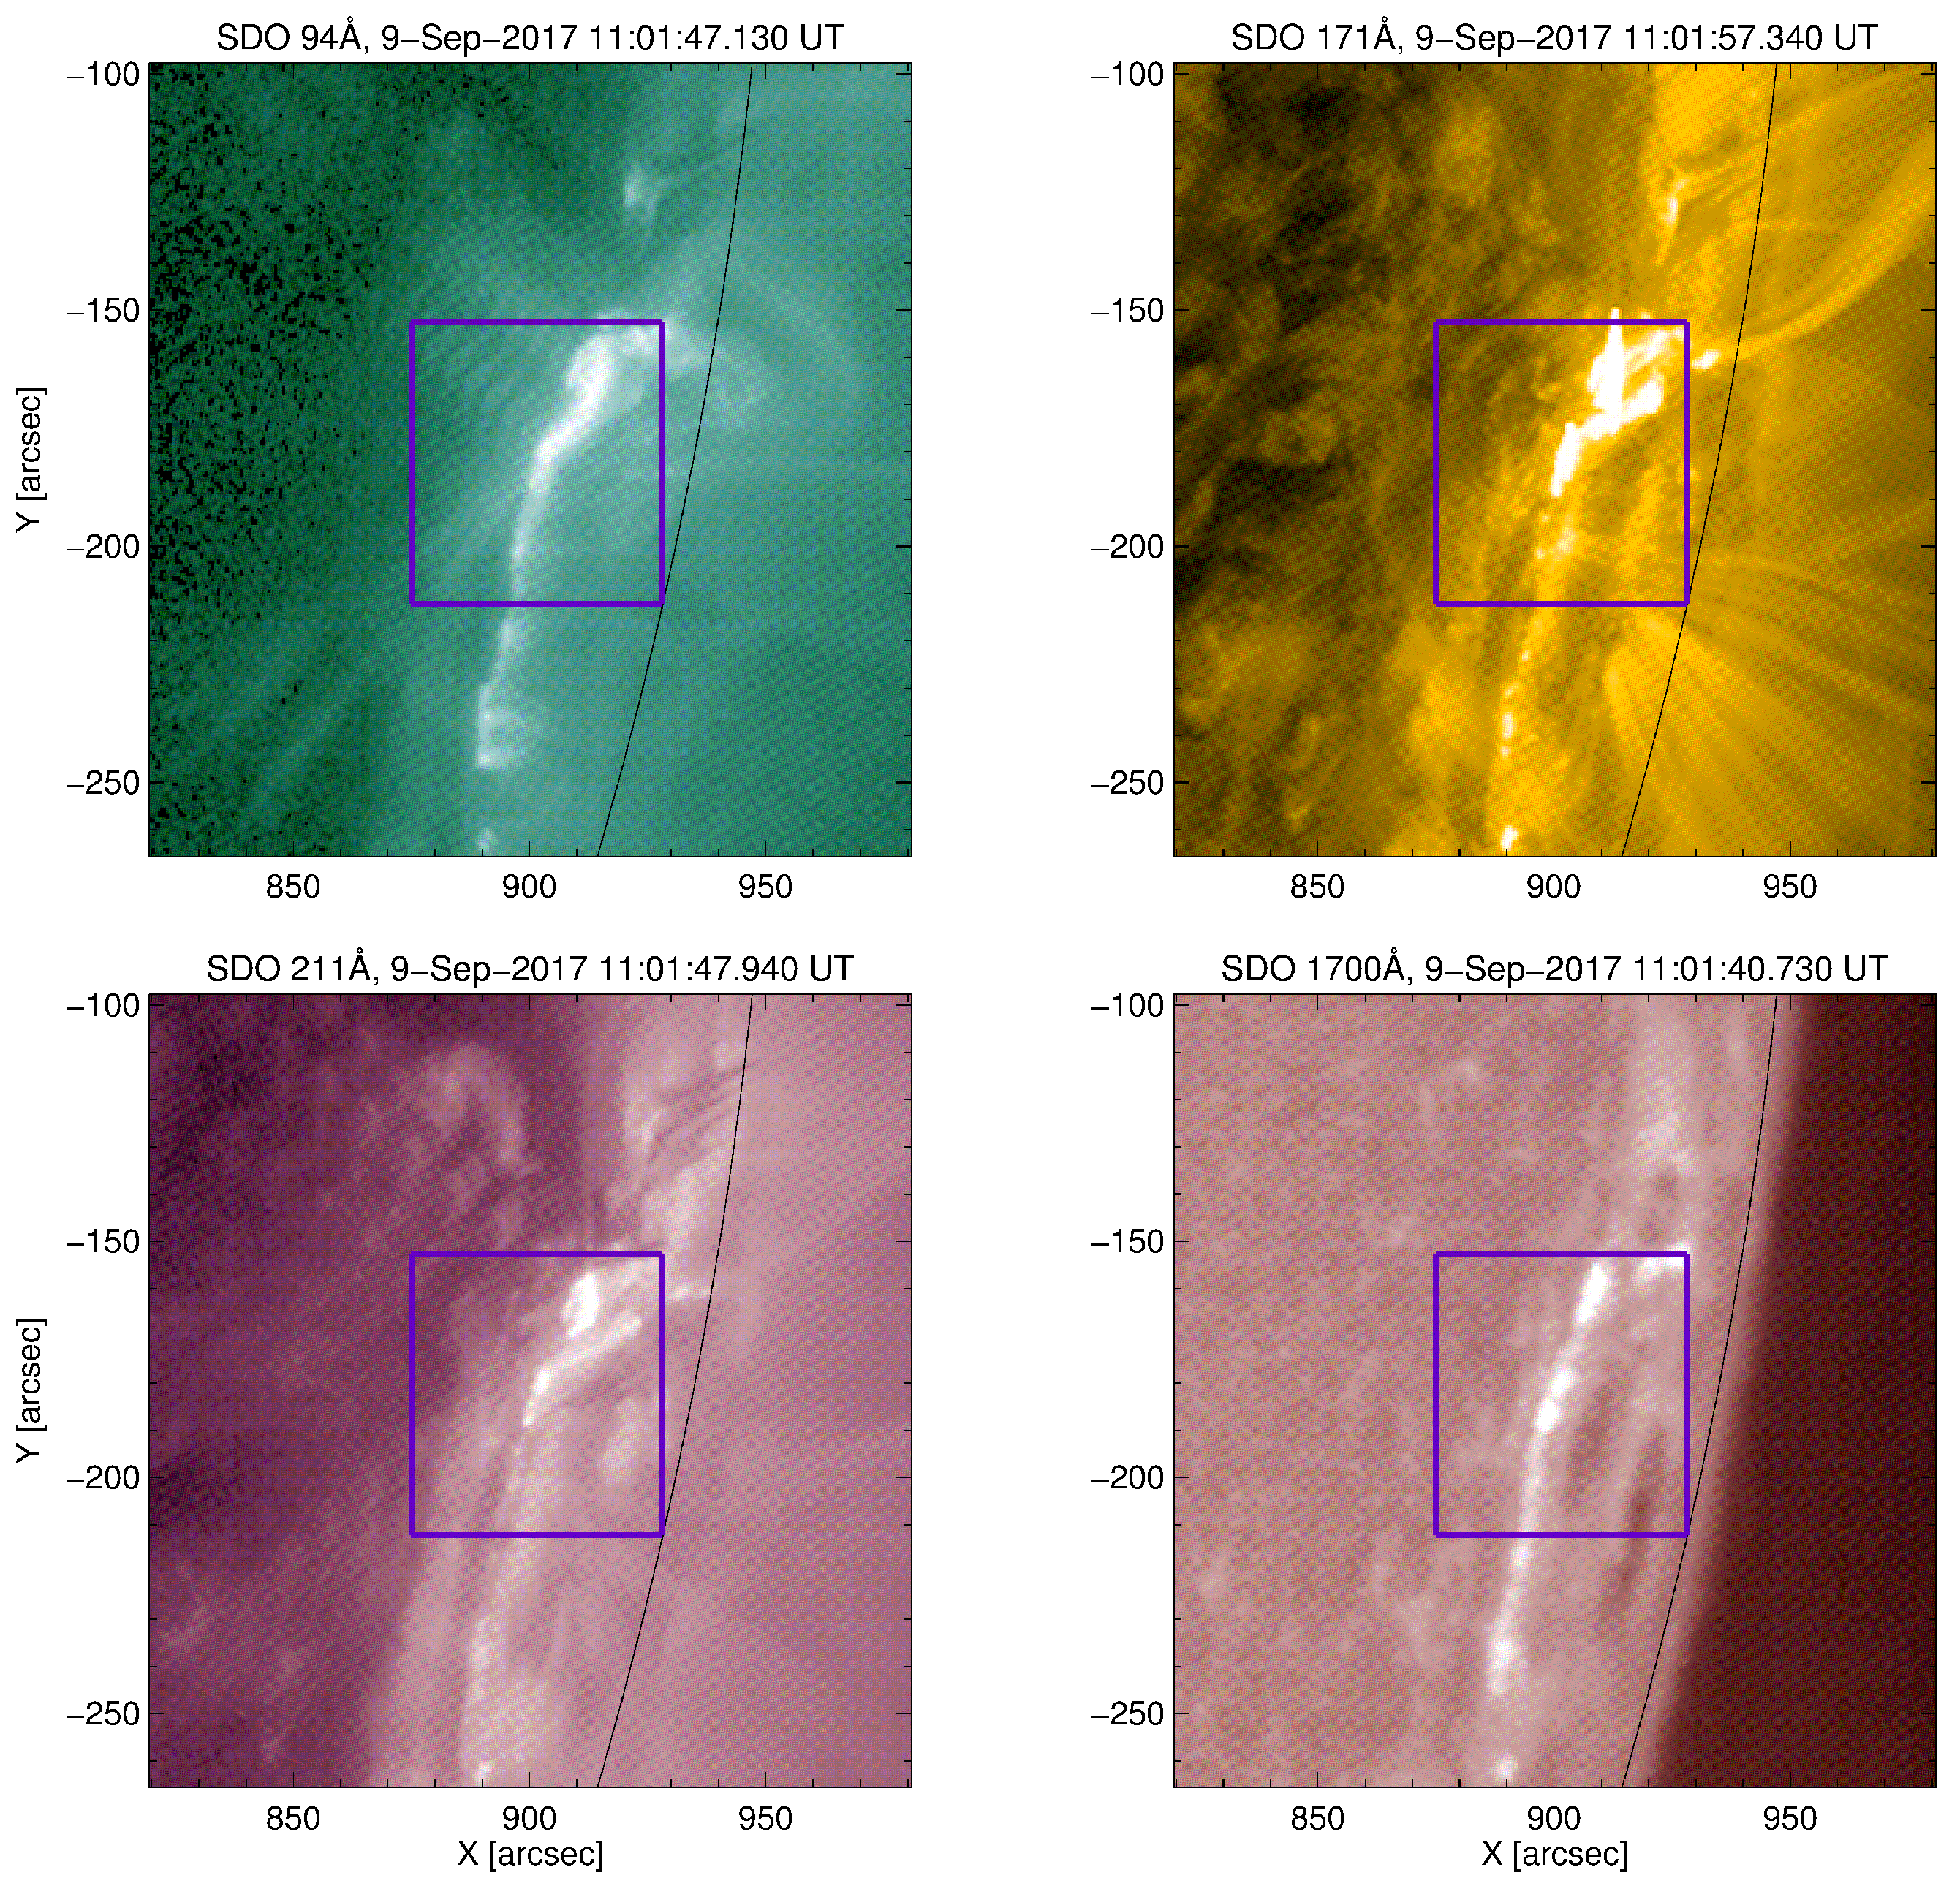
Figure 7), shows that for both of these wavelengths the lightcurves during radio event on 9th September 2017 are similar to each other (showing the impulsive phase and two peaks of the solar flare). Unfortunately, the complete gradual phase of the flare in UV was not observed because of the gap in the IRIS observations. We also present SDO maps at selected channels AIA (94, 171, 211, 1700 Å showed flaring regions of the solar corona, upper transition region, active regions of the corona and photosphere/temperature minimum region, respectively) with the full visible active region NOAA 12673 during the impulsive phase of the flare with overplotted IRIS FOV (rectangle,
Figure 9). On these maps one can see the detailed location of the active region with solar flare (the solar limb is overplotted by black solid line). The
Figure 7 (middle panel) also shows the lightcurves from SDO obtained in the same way as the IRIS lightcurves. We can see a delay between the UV and radio emission is about 3 min. The delay between the individual UV channels and X-ray is smaller than the delay between UV and the type III radio bursts. The SDO/AIA wavelengths follow the X-ray flux. The differences between the maxima in IRIS and SDO fluxes are due to the fact that we observe plasma at different temperatures.
4. Results
The studied radio events consisted of numerous type III solar radio bursts that show a visible drift rate in frequency. For the analyzis, we selected well isolated type III bursts, so that their drift rates could be easily determined. The determination of this parameter would not be possible for examples when two or more type III burst were overlapping. Bursts were isolated by an approximate visual assessment, resulting in a search window for each isolated burst, defined in time and frequency domain. Then four parameters have been estimated for each burst by determination of the local flux maxima in consecutive frequency channels – first the frequencies of the burst beginning and end, nextly corresponding times. This allowed us to determine a constant, linear drift rate for each burst. Due to bursts durations close to the time resolution of the observations (1 s) it was not possible to determine time and frequency for intermediate points of the bursts. We applied this procedure for several dozens of well isolated type III bursts in both studied events.
Figure 10 shows the drift rate change as a function of frequency for the studied events. The lines correspond with the power-law fit to the data. We found that the frequency drift rate for 124 type III bursts within 10–90 MHz for 20th August 2017 can be described by
and the mean value of drift rate was
MHz/s. The frequency drift rate for 131 type III bursts within 10–90 MHz for 9th September 2017 can be described by
and the mean value of drift rate was
MHz/s.
Assuming the Mann et al. coronal density model we found that radial velocity of the type III bursts related electrons amounts around 43,704 km/s (the drift rate was
MHz/s), that corresponds to
and 30,960 km/s (the drift rate was
MHz/s), that corresponds to
on 20th August 2017 and 9th September 2017, respectively. When using the Newkirk coronal density model, then the radial velocity of the type III bursts related electrons for event observed on 20th August 2017 (the drift rate was
MHz/s) is 54,287 km/s (which corresponds to
) and for event on 9th September 2017 (the drift rate was
MHz/s) is 38,119 km/s (which corresponds to
). We found that the radial velocity of the type III bursts related electrons for radio event observed on 20th August 2017 is a little bigger in comparison to the velocity of the type III bursts related electrons event observed on 9th September 2017. Other authors suggest, that the electron beams velocities are in the range of
and
[
2], while herein obtained results suggest, that they rather remain in the lower part of that range.
During the event observed on 20th August 2017, the type III bursts drift rate ranged from
MHz/s to
MHz/s, with the average value of
MHz/s. No significant change of the drift rate was observed during the B6.1 flares (the maximum of which was observed at 12:21 UT) and C1.0 (with a maximum at 14:45 UT). During the event observed on 9th September 2017, the type III bursts drift rate ranged from
MHz/s to
MHz/s, with the average value being
MHz/s. During the M3.7 flare (the maximum of which was observed at 11:04 UT according to the GOES flux), the drift rate did not change significantly. In general, in both analyzed radio events the drift rate cover very similar ranges of values. However, it seems that the drift rate of type III bursts observed on 20th August 2017 is slightly higher (
Figure 10).
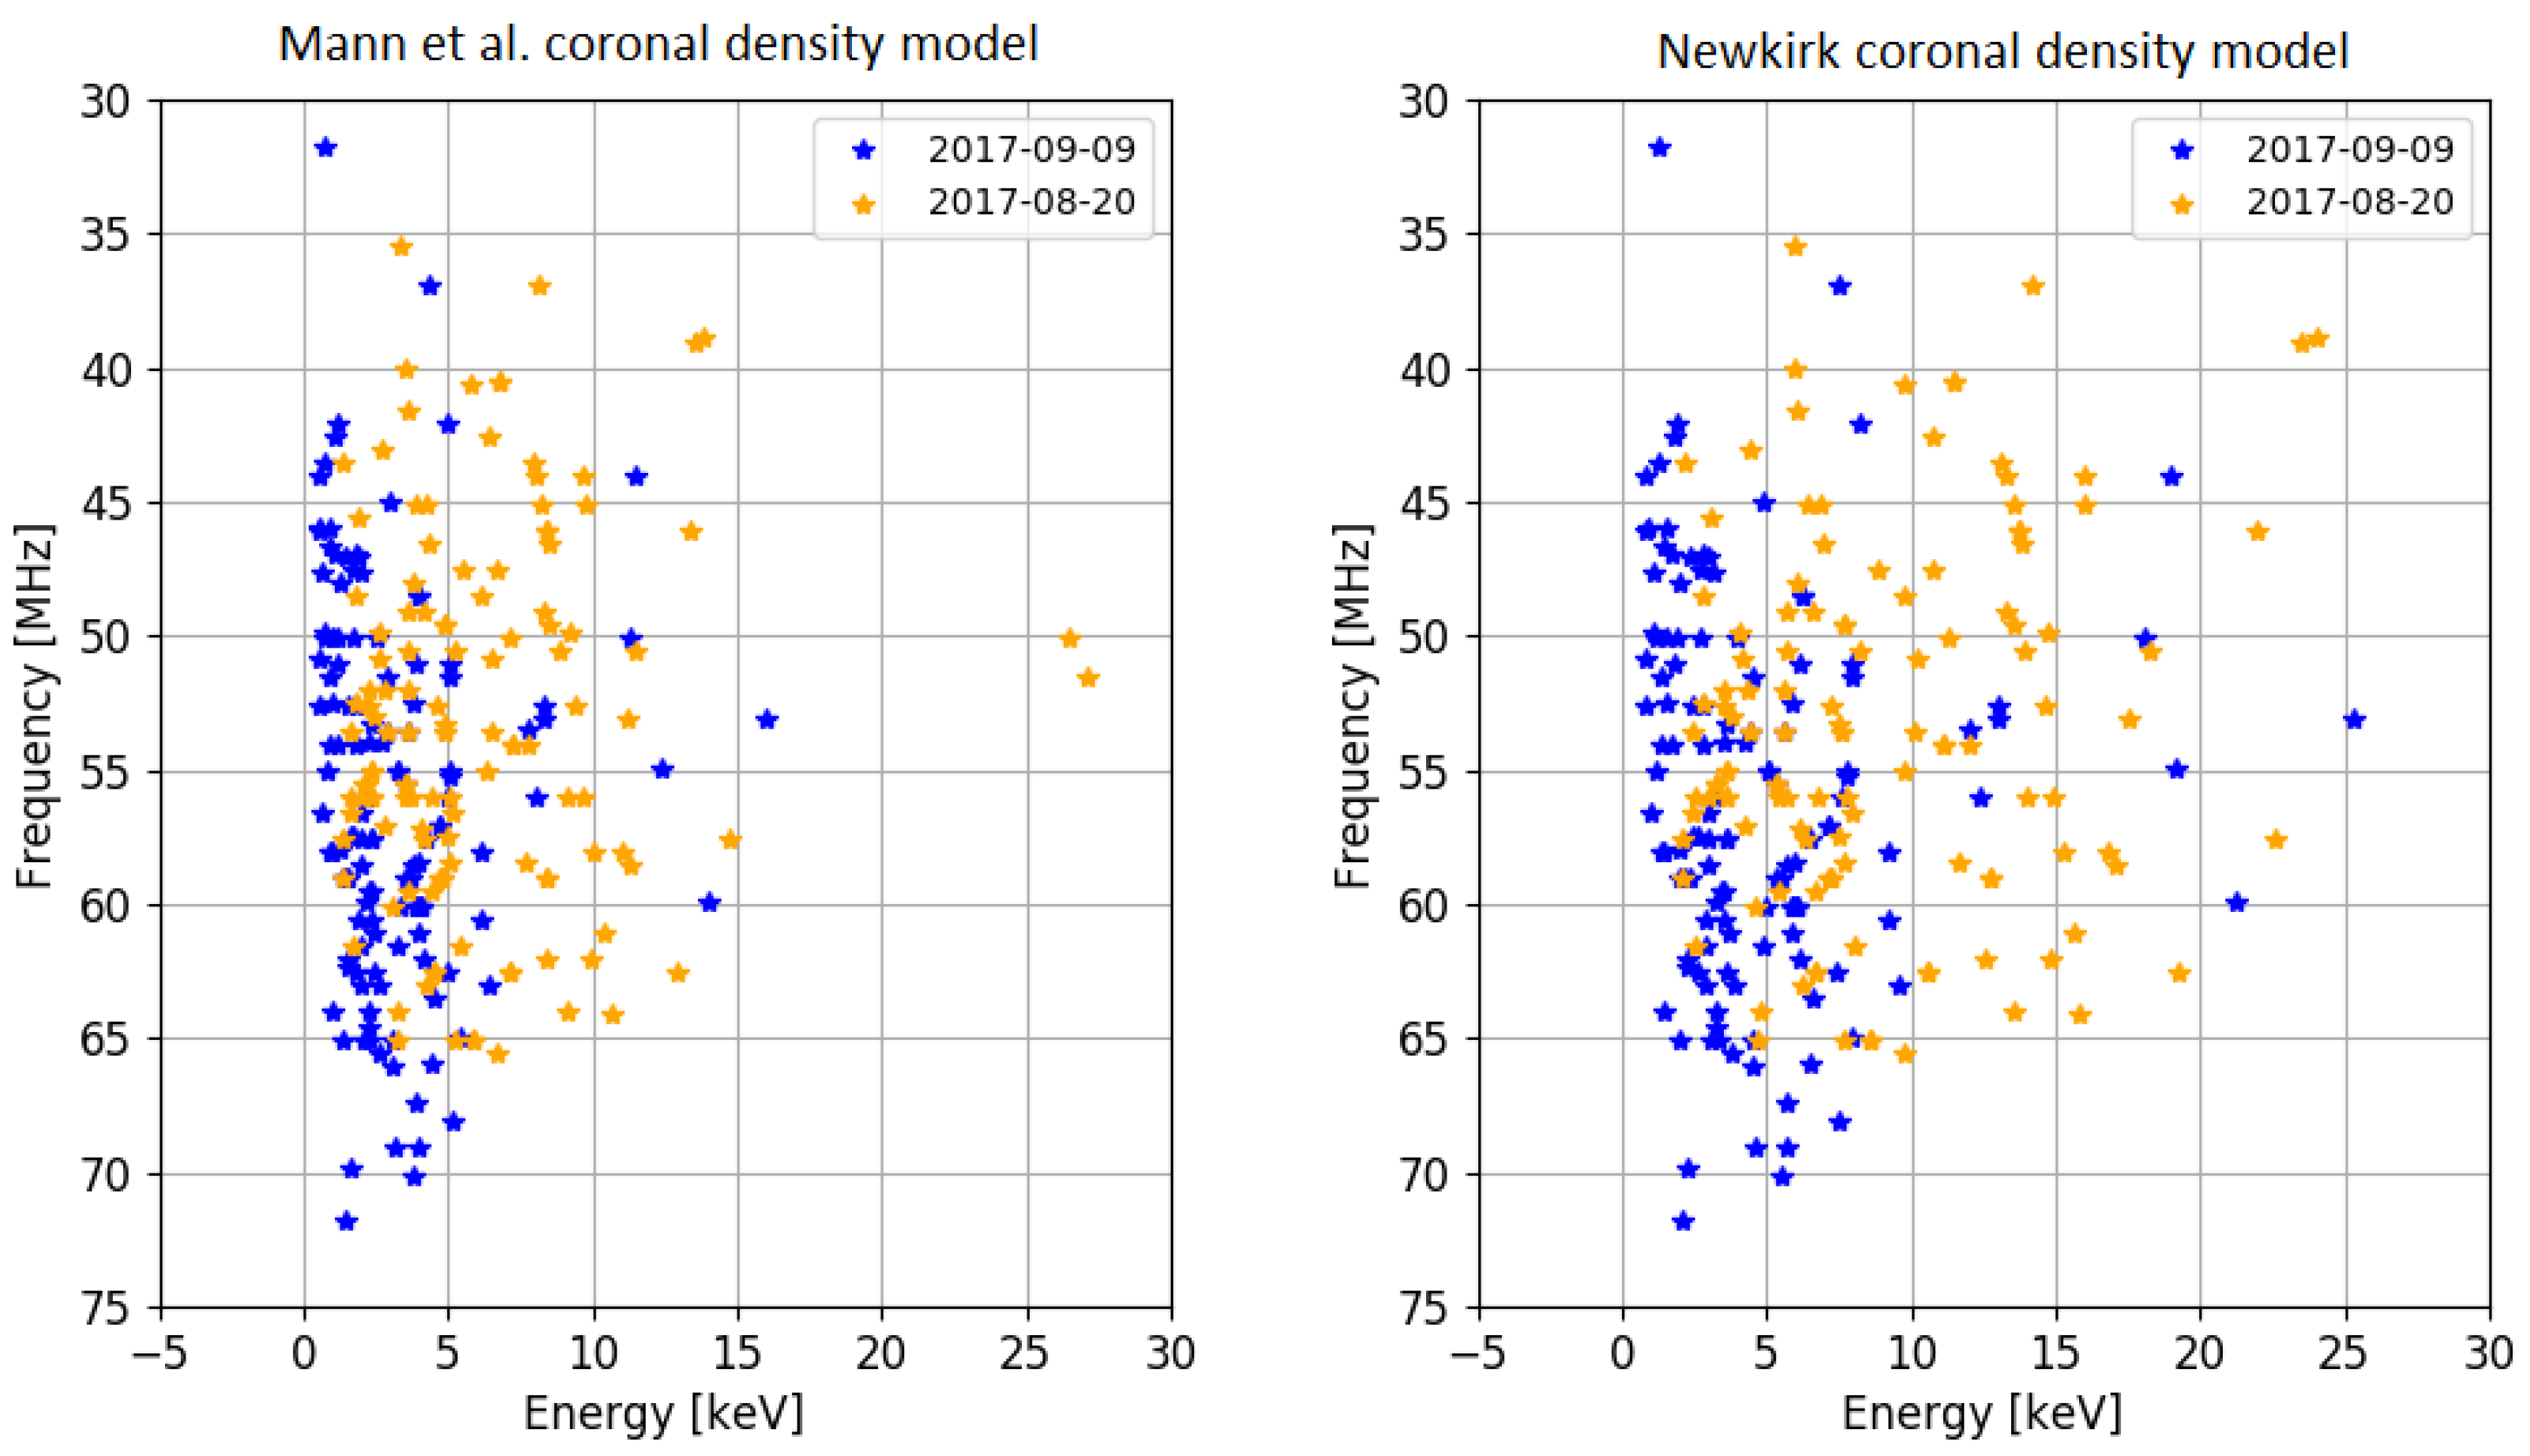
The energy of electrons exciting type III bursts amounts 6.09 keV and 9.55 keV (for Mann et al. model and Newkirk model, respectively) for radio event observed on 20th August 2017 is twice as large in comparison to the energy of electrons exciting type III bursts which is 3.16 keV and 4.83 keV (for Mann et al. model and Newkirk model, respectively) for radio event observed on 9th September 2017 (
Figure 11). The results of our analyzes have been collected in
Table 3.
5. Discussion
We find that the frequency drift rate for type III radio bursts within 10–90 MHz band for event on 20th August 2017 can be described by
and for the event on 9th September 2017 by
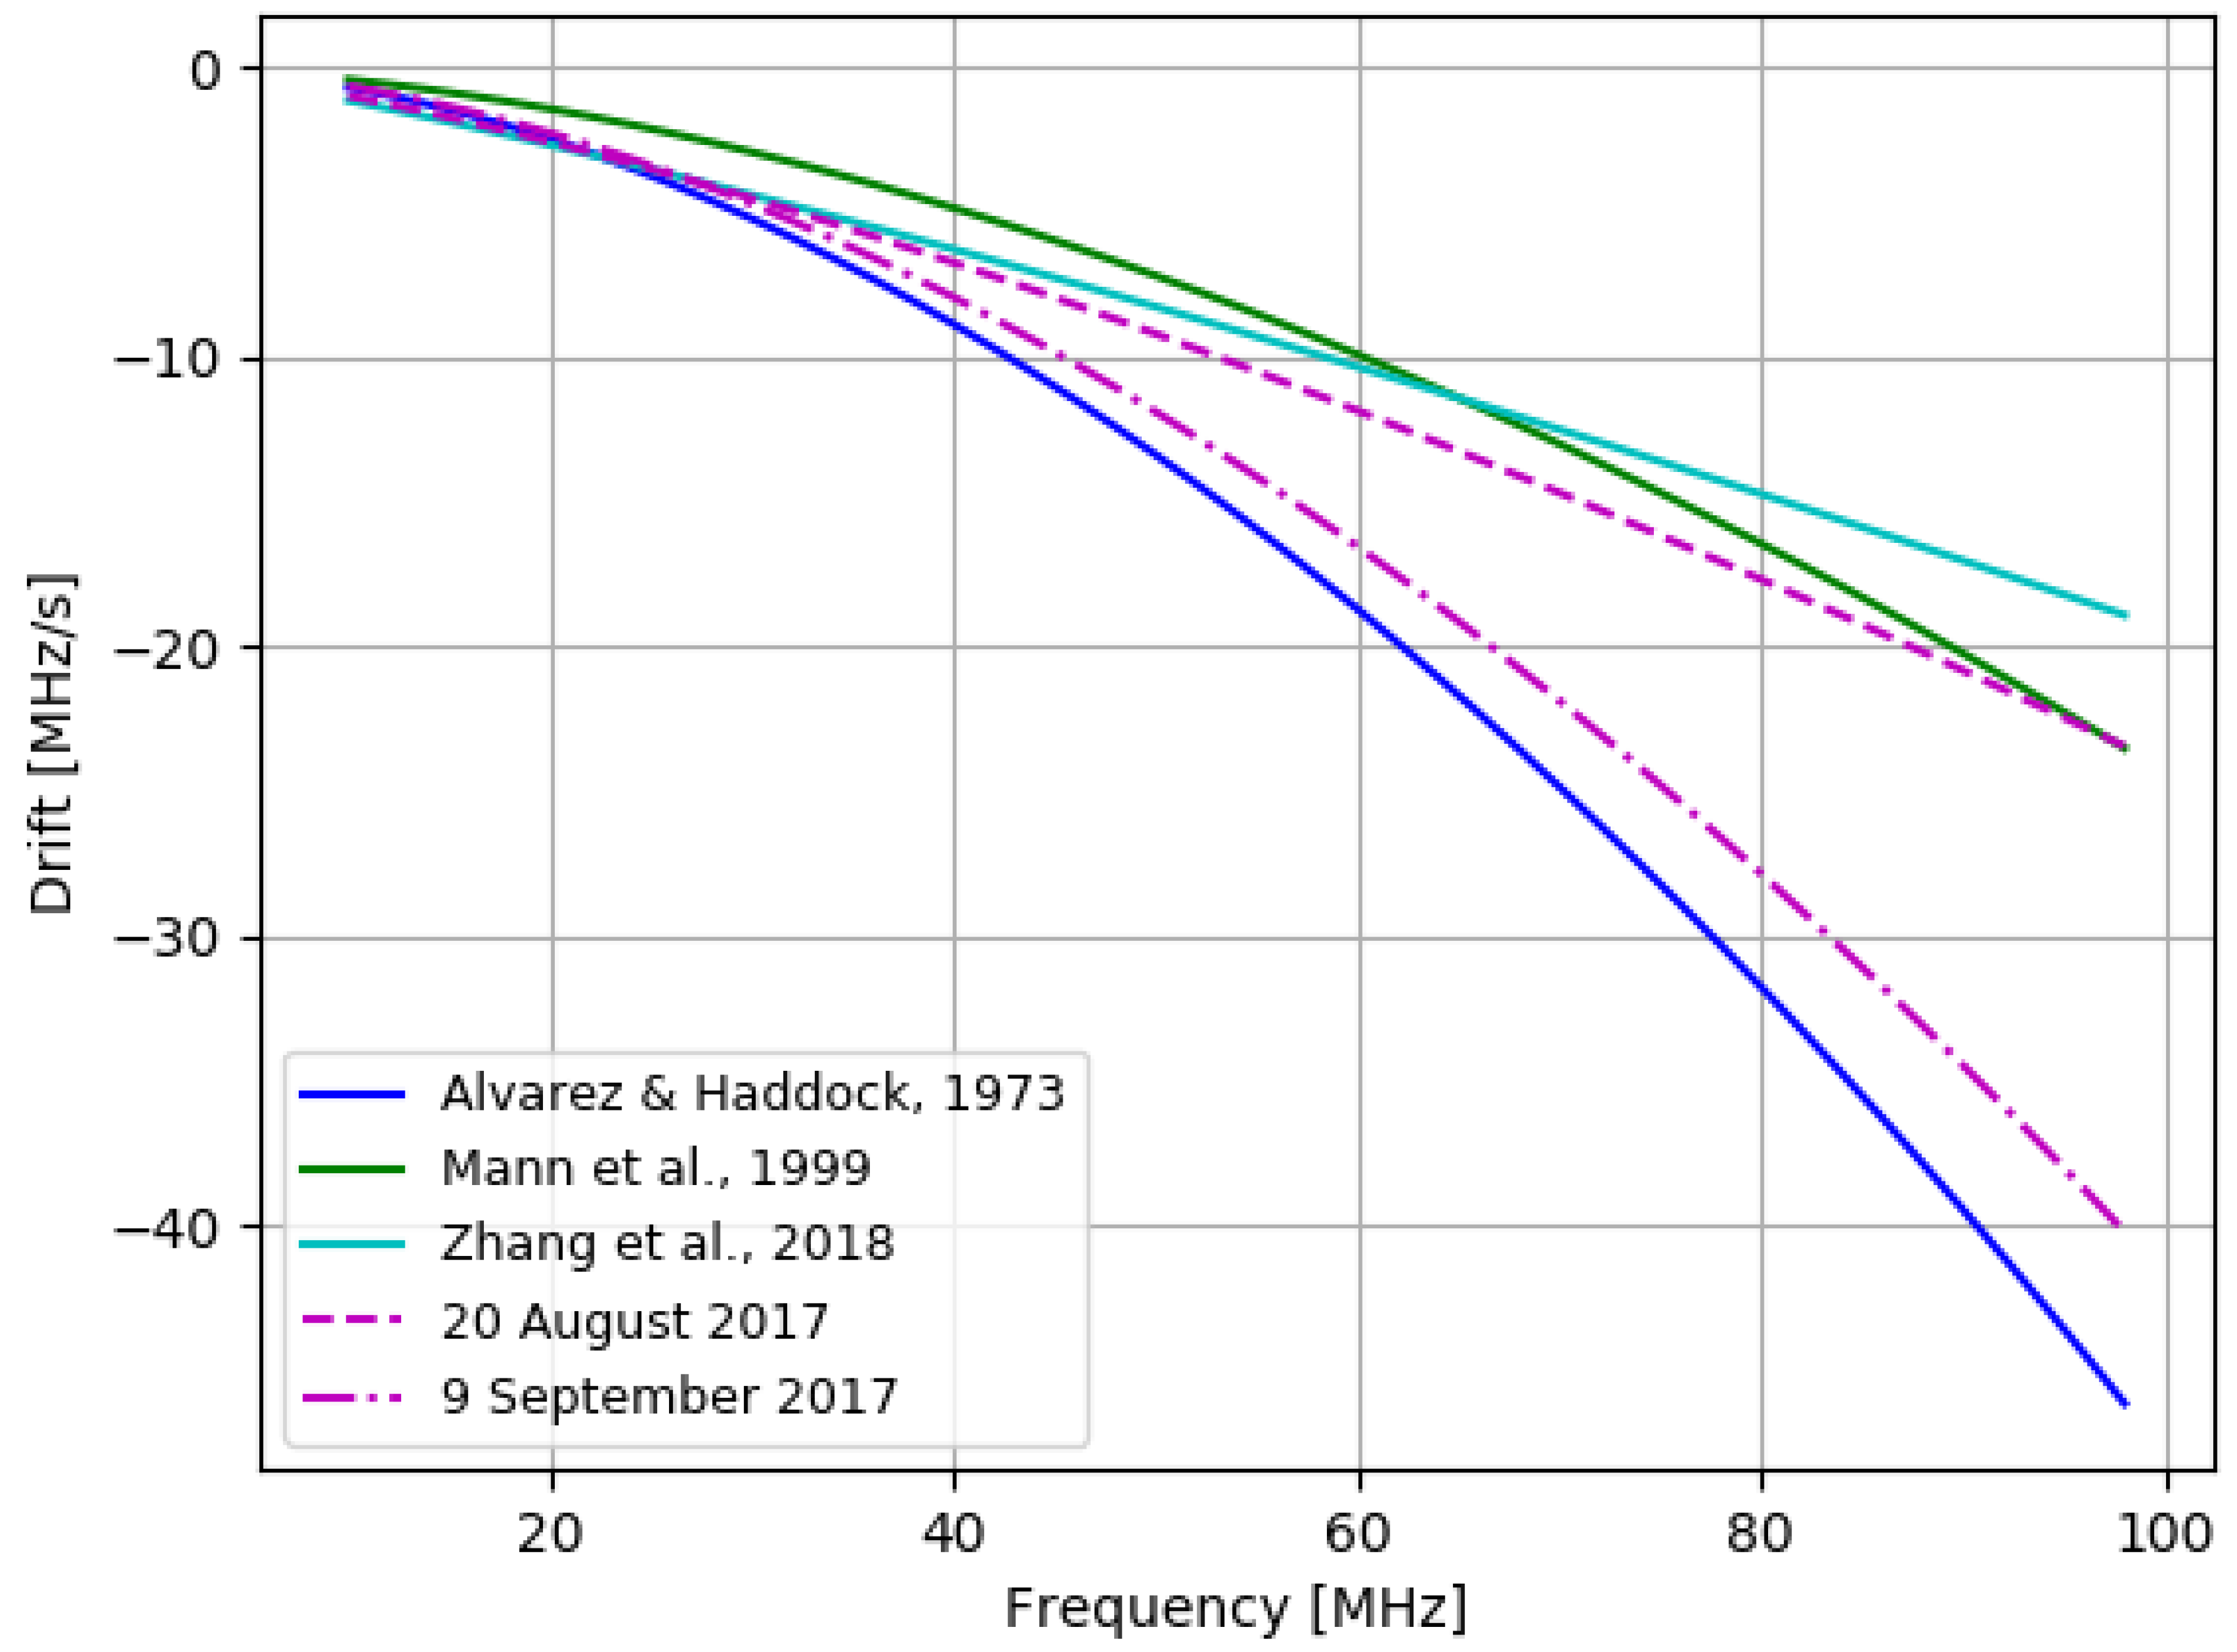
. Our results show that the drift rate for 20th August 2017 radio event is very similar to the drift rate obtained by [
4,
7]. On the other hand, the drift rate for 9th September 2017 radio event is very similar to the drift rate obtained by [
8] (
Figure 12).
The average drift rate of type III bursts during the event observed on 20th August 2017 was somewhat stronger than during the event observed on 9th September 2017 despite the association of the type III burst on the 9th September 2017 with the stronger flare (GOES M3.7).
Regarding velocities of electron beams accelerated in the corona—responsible for the generation of type III bursts due to plasma emission mechanism—it turned out that electrons in event on 20th August 2017 achieve greater velocity which is
and
(for Mann et al. model and Newkirk model, respectively) than the electrons in the 9th September 2017 radio event which is
and
(for Mann et al. model and Newkirk model, respectively). Other authors suggest, that the electron beams velocities are in the range of
and
[
2], while herein obtained results suggest, that they rather remain in the lower part of that range. It seems that the velocity of the electrons is not related to the GOES flare class. The electrons responsible for the generation of type III bursts achieved greater velocities during the event on 20th August 2017 than during 9th September 2017 event despite the observation of B and C type flares on the former one and M type flares on the latter. It is possible that the electron velocity depends on physical conditions in solar active regions, from which they originate.
The energy of electrons exciting type III bursts for radio event observed on 20th August 2017 is twice as large in comparison to the energy of electrons exciting type III bursts for radio event observed on 9th September 2017. It is possible that the difference is related to different configuration of the magnetic fields of the active regions.
The type III radio bursts during the event observed on 20th August 2017 in the 10–90 MHz band were distributed fairly evenly. No increase of their number was observed during a B6.1 and C1.0 flare. In the case of the event on 9th September 2017, observed in the 10–90 MHz band, they were also distributed fairly evenly. Similarly, no increase of their number was observed during the M3.7 flare.
Comparison of the radio flux at frequency 39.84 MHz from LOFAR with X-ray (GOES) and UV (IRIS and SDO) fluxes on 9th September 2017 shows that radio flux increased around 3 min after increasing of UV fluxes (around 11:09 UT). Storing the energetic electrons in the lower corona before they are released into the upper corona, that is covered by LOFAR frequencies, or a slow, diffusive transport of type III radiation near its source region seem implausible to explain the delay. The most plausible explanation is that the type III bursts we observe are not associated with the initial increase in X-ray and UV fluxes. We happen to see the radio emission later in the flare, but miss radio bursts from the flare onset. A possible explanation is that fundamental plasma emission is not emitted isotropically, but in some preferred directions. On top of this, coronal density structures can refract the radio waves and act as a wave guide. So the geometry has to be right for type III emission being able to reach us on Earth. This condition was met for some time 3 min after the flare onset, but not at the start of the flare. Unfortunately, we do not see any correlation with X-ray flux for the event on 20th August 2017. The reason for this are probably weak solar flares, classified as B6.1 and C1.0, during this event.
6. Conclusions
In this work we presented study of the two solar radio events consisting of type III bursts, observed by LOFAR station in Bałdy in the single mode. Both of them were observed in the frequency range of 10–90 MHz. The first one occurred on 20th August 2017 and the second one on 9th September 2017. Additionally, we also inspected the data recorded by instruments on boards of IRIS and SDO (in UV range) and GOES (X-ray range) which complement observations in the radio field.
Different values of drift rates resulting from our research for the both analysed radio events suggest that electron beams (responsible for the generation of the type III bursts) propagate through the plasma in solar corona with different density, temperature, velocity and the geometric configuration of the magnetic field.
In the work, among others, we focused on the temporal evolution of the event on selected SJIs. Comparison of the LOFAR radio data with X-ray (GOES) and UV (IRIS and SDO) observations allowed us for tracing of solar events related with the type III radio bursts. Unfortunately, the comparison could only be done for radio event observed on 9th September 2017, because only for this event there exist UV data recorded by IRIS and SDO. During this event the type III of radio bursts were observed between 10:04 UT and 14:09 UT. No increase in the number of individual radio bursts was observed during the M3.7 flare (with maximum at 11:04 UT).
The comparison of fluxes on 9th September 2017 shows that the type III bursts we observed were not associated with the initial increase in X-ray and UV fluxes. Unfortunately, we do not see any correlation for the event on 20th August 2017. The reason for this are probably weak solar flares, classified as B6.1 and C1.0, during this event.
Author Contributions
Conceptualization: B.D., K.M., A.K.; Methodology: B.D., K.M.; Software: P.F., B.D., A.F., K.M.; Validation: B.D., A.K.; Formal analysis: B.D., P.F., K.M., A.F., C.V., J.M., A.K., P.Z. (PeiJin Zhang), P.Z. (Pietro Zucca), G.M.; Investigation, resources and data curation: B.D., P.F., K.M., A.F., C.V., J.M., A.K., P.Z. (PeiJin Zhang), P.Z. (Pietro Zucca), G.M.; Writing—original draft preparation: B.D., P.F., K.M., A.F., C.V., J.M., A.K., P.Z. (PeiJin Zhang), P.Z. (Pietro Zucca), G.M.; Writing—review and editing: B.D., P.F., K.M., A.F., C.V., J.M., A.K., P.Z. (PeiJin Zhang), P.Z. (Pietro Zucca), G.M.; Visualization: B.D., P.F., K.M., A.F.; Supervision: B.D., C.V., A.K.; Project administration: B.D., C.V., A.K.; Funding acquisition: B.D., C.V., A.K. All authors have read and agreed to the published version of the manuscript.
Funding
The Ministry of Science and Higher Education (MSHE) of the Republic of Poland for granting funds for the Polish contribution to the International LOFAR Telescope (MSHE decision No. DIR/WK/2016/2017/05-1) and for maintenance of the LOFAR PL-612 Bałdy (MSHE decision No. 59/E-383/SPUB/SP/2019.1). We also thank the National Science Centre, Poland, and the Deutsche Forschungsgemeinschaft (DFG, German Research Foundation) for granting “LOFAR observations of the solar corona during Parker Solar Probe perihelion passages” in the Beethoven Classic 3 funding initiative under project numbers 2018/31/G/ST9/01341 and VO 2123/1-1, respectively.
Institutional Review Board Statement
Not applicable.
Informed Consent Statement
Not applicable.
Data Availability Statement
The data presented in this study are available on request from the corresponding author.
Acknowledgments
The authors thank Richard Fallows (ASTRON—The Netherlands Institute for Radio Astronomy), Derek McKay-Bukowski (Sodankylä Geophysical Observatory and STFC Rutherford Appleton Laboratory, Didcot, UK) and KSP team for support in solar LOFAR research. IRIS is a NASA small explorer mission developed and operated by LMSAL with mission operations executed at NASA Ames Research center and major contributions to downlink communications funded by ESA and the Norwegian Space Centre. The AIA data used are courtesy of SDO (NASA).
Conflicts of Interest
The authors declare no conflict of interest.
Abbreviations
The following abbreviations are used in this manuscript:
| AIA | Atmospheric Imaging Assembly |
| CME | Coronal Mass Ejection |
| ESA | European Space Agency |
| EUV | Extreme Ultraviolet |
| EVE | Extreme ultraviolet Variability Experiment |
| FOV | Field-of-View |
| FUV | Far Ultraviolet |
| FUVL | Far Ultraviolet Long wavelength band |
| FUVS | Far Ultraviolet Short wavelength band |
| HBA | High Band Antennas |
| HMI | Helioseismic and Magnetic Imager |
| ILT | International LOFAR Telescope |
| IRIS | Interface Region Imaging Spectrograph |
| LBA | Low Band Antennas |
| LMSAL | Lockheed Martin Solar and Astrophysics Laboratory |
| LOFAR | LOw-Frequency ARray |
| LWS | Living With a Star |
| NASA | National Aeronautics and Space Administration |
| NUV | Near Ultraviolet |
| SDO | Solar Dynamics Observatory |
| SJI | Slit-Jaw Images |
| SMEX | Small Explorer mission |
References
- Wild, J.P.; McCready, L.L. Observations of the spectrum of high-intensity solar radiation at metre wavelengths. I. The apparatus and spectral types of solar burst observed. Aust. J. Sci. Res. Phys. Sci. 1950, 3, 387. [Google Scholar] [CrossRef]
- Benz, A. (Ed.) Plasma Astrophysics, 2nd ed.; Astrophysics and Space Science Library; Kluwer Academic Publishers: Dordrecht, The Netherlands, 2002; Volume 279. [Google Scholar] [CrossRef]
- Warmuth, A.; Mann, G. The application of radio diagnostics to the study of the solar drivers of space weather. In Lecture Notes in Physics; Scherer, K., Fichtner, H., Heber, B., Mall, U., Eds.; Springer: Berlin/Heidelberg, Germany, 2005; Volume 656, p. 49. [Google Scholar]
- Mann, G.; Jansen, F.; MacDowall, R.J.; Kaiser, M.L.; Stone, R.G. A heliospheric density model and type III radio bursts. Astron. Astrophys. 1999, 348, 614–620. [Google Scholar]
- Suzuki, S.; Dulk, G.A. Bursts of type III and type V. In Solar Radiophysics: Studies of Emission from the Sun at Metre Wavelengths; Cambridge University Press: New York, USA, 1985; pp. 289–332. [Google Scholar]
- Reid, H.A.S.; Ratcliffe, H. A review of solar type III radio bursts. Res. Astron. Astrophys. 2014, 14, 773–804. [Google Scholar] [CrossRef]
- Zhang, P.J.; Wang, C.B.; Ye, L. A type III radio burst automatic analysis system and statistic results for a half solar cycle with Nançay Decameter Array data. Astron. Astrophys. 2018, 618, A165. [Google Scholar] [CrossRef] [Green Version]
- Alvarez, H.; Haddock, F.T. Solar Wind Density Model from km-Wave Type III Bursts. Sol. Phys. 1973, 32929, 197–209. [Google Scholar] [CrossRef]
- Allen, C.W. Interpretation of Electron Densities from Corona Brightness. Mon. Not. R. Astron. Soc. 1947, 107, 426. [Google Scholar] [CrossRef]
- Baumbach, S. Strahlung, Ergiebigkeit und Elektronendichte der Sonnenkorona. Astron. Nachrichten 1937, 263, 121–134. [Google Scholar] [CrossRef]
- Newkirk, G., Jr. The Solar Corona in Active Regions and the Thermal Origin of the Slowly Varying Component of Solar Radio Radiation. Astrophys. J. 1961, 133, 983. [Google Scholar] [CrossRef]
- Saito, K.; Poland, A.I.; Munro, R.H. A study of the background corona near solar minimum. Sol. Phys. 1977, 55, 121–134. [Google Scholar] [CrossRef]
- Saito, K.; Makita, M.; Nishi, K.; Hata, S. A non-spherical axisymmetric model of the solar K corona of the minimum type. Ann. Tokyo Astron. Obs. 1970, 12, 51–173. [Google Scholar]
- Chrysaphi, N.; Kontar, E.P.; Holman, G.D.; Temmer, M. CME-driven Shock and Type II Solar Radio Burst Band Splitting. Astrophys. J. 2018, 868, 79. [Google Scholar] [CrossRef] [Green Version]
- Van Haarlem, M.P.; Wise, M.W.; Gunst, A.W.; Heald, G.; McKean, J.P.; Hessels, J.W.T.; de Bruyn, A.G.; Nijboer, R.; Swinbank, J.; Fallows, R.; et al. LOFAR: The LOw-Frequency ARray. Astron. Astrophys. 2013, 556, A2. [Google Scholar] [CrossRef] [Green Version]
- Dabrowski, B.P.; Krankowski, A.; Błaszkiewicz, L.; Rothkaehl, H. Prospects for Solar and Space Weather Research with Polish Part of the LOFAR Telescope. Acta Geophys. 2016, 64, 825–840. [Google Scholar] [CrossRef]
- McKay-Bukowski, D.; Vierinen, J.; Virtanen, I.I.; Fallows, R.; Postila, M.; Ulich, T.; Wucknitz, O.; Brentjens, M.; Ebbendorf, N.; Enell, C.; et al. KAIRA: The Kilpisjärvi Atmospheric Imaging Receiver Array—System Overview and First Results. IEEE Trans. Geosci. Remote. Sens. 2015, 53, 1440–1451. [Google Scholar] [CrossRef]
- Mckay-Bukowski, D. Making Observations with Mode-357. In Technical Note KAIRA-SGO-INF-011; 2013. [Google Scholar]
- Dabrowski, B.P.; Morosan, D.E.; Fallows, R.A.; Blaszkiewicz, L.; Krankowski, A.; Magdalenic, J.; Vocks, C.; Mann, G.; Zucca, P.; Sidorowicz, T.; et al. Observations of the Sun using LOFAR Baldy station. Adv. Space Res. 2018, 62, 1895–1903. [Google Scholar] [CrossRef]
- De Pontieu, B.; Title, A.M.; Lemen, J.R.; Kushner, G.D.; Akin, D.J.; Allard, B.; Berger, T.; Boerner, P.; Cheung, M.; Chou, C.; et al. The Interface Region Imaging Spectrograph (IRIS). Sol. Phys. 2014, 289, 2733–2779. [Google Scholar] [CrossRef]
- Pesnell, W.D.; Thompson, B.J.; Chamberlin, P.C. The Solar Dynamics Observatory (SDO). Sol. Phys. 2012, 275, 3–15. [Google Scholar] [CrossRef] [Green Version]
- Lemen, J.R.; Title, A.M.; Akin, D.J.; Boerner, P.F.; Chou, C.; Drake, J.F.; Duncan, D.W.; Edwards, C.G.; Friedlaender, F.M.; Heyman, G.F.; et al. The Atmospheric Imaging Assembly (AIA) on the Solar Dynamics Observatory (SDO). Sol. Phys. 2012, 275, 17–40. [Google Scholar] [CrossRef] [Green Version]
- Woods, T.N.; Eparvier, F.G.; Hock, R.; Jones, A.R.; Woodraska, D.; Judge, D.; Didkovsky, L.; Lean, J.; Mariska, J.; Warren, H.; et al. Extreme Ultraviolet Variability Experiment (EVE) on the Solar Dynamics Observatory (SDO): Overview of Science Objectives, Instrument Design, Data Products, and Model Developments. Sol. Phys. 2012, 275, 115–143. [Google Scholar] [CrossRef] [Green Version]
- Schou, J.; Scherrer, P.H.; Bush, R.I.; Wachter, R.; Couvidat, S.; Rabello-Soares, M.C.; Bogart, R.S.; Hoeksema, J.T.; Liu, Y.; Duvall, T.L.; et al. Design and Ground Calibration of the Helioseismic and Magnetic Imager (HMI) Instrument on the Solar Dynamics Observatory (SDO). Sol. Phys. 2012, 275, 229–259. [Google Scholar] [CrossRef] [Green Version]
- Wülser, J.P.; Jaeggli, S.; De Pontieu, B.; Tarbell, T.; Boerner, P.; Freeland, S.; Liu, W.; Timmons, R.; Brannon, S.; Kankelborg, C.; et al. Instrument Calibration of the Interface Region Imaging Spectrograph (IRIS) Mission. Sol. Phys. 2018, 293, 149. [Google Scholar] [CrossRef] [PubMed] [Green Version]
Figure 1.
Compilation of drift rates versus frequency presented by different authors, listed in the
Table 1. The lines correspond to: Alvarez & Haddock, 1973 [
8], Mann et al., 1999 [
4] and Zhang et al., 2018 [
7]. The negative value of the drift rates indicates that electron beams are moving upwards in the corona.
Figure 2.
Compilation of generally used models of electron density in the solar corona presented by different authors. The lines correspond to: Baumbach, 1937 [
10], Allen, 1947 [
9], Newkirk, 1961 [
11], Saito et al., 1970 [
13], Saito et al., 1977 [
12] and Mann et al., 1999 [
4]).
Figure 2.
Compilation of generally used models of electron density in the solar corona presented by different authors. The lines correspond to: Baumbach, 1937 [
10], Allen, 1947 [
9], Newkirk, 1961 [
11], Saito et al., 1970 [
13], Saito et al., 1977 [
12] and Mann et al., 1999 [
4]).
Figure 3.
Locations of the LOFAR stations. With stations in The Netherlands, Germany, Poland, France, Sweden, United Kingdom, Ireland and Latvia, the LOFAR telescope is an European instrument. In the near future, it is planned to open a station in Medicina (Italy)—operated by Italian National Institute for Astrophysics (credit: ASTRON).
Figure 4.
Upper panel: a ten-minutes part of the solar dynamic spectrum of the storm of type III radio bursts recorded on 20th August 2017 with LOFAR Bałdy station. Bottom panel: radio flux at frequency of 39.84 MHz, extracted from dynamic spectrum on the upper panel, shows the time profiles of individual type III bursts.
Figure 5.
The GOES 1–8 Å and 0.5–4 Å fluxes recorded during the studied radio event with type III radio bursts. The upper panel shows GOES X-ray fluxes observed on 20th August 2017 from 9:00 to 15:30 UT. In this time GOES registered two solar flares B6.1 and C1.0 (the maxima of both of these flares were marked by the blue vertical dotted lines). The second panel shows the radio flux at 39.84 MHz frequency from LOFAR in the time of GOES’ registered flares. LOFAR observations were not continuous, therefore there are two gaps in the signal.
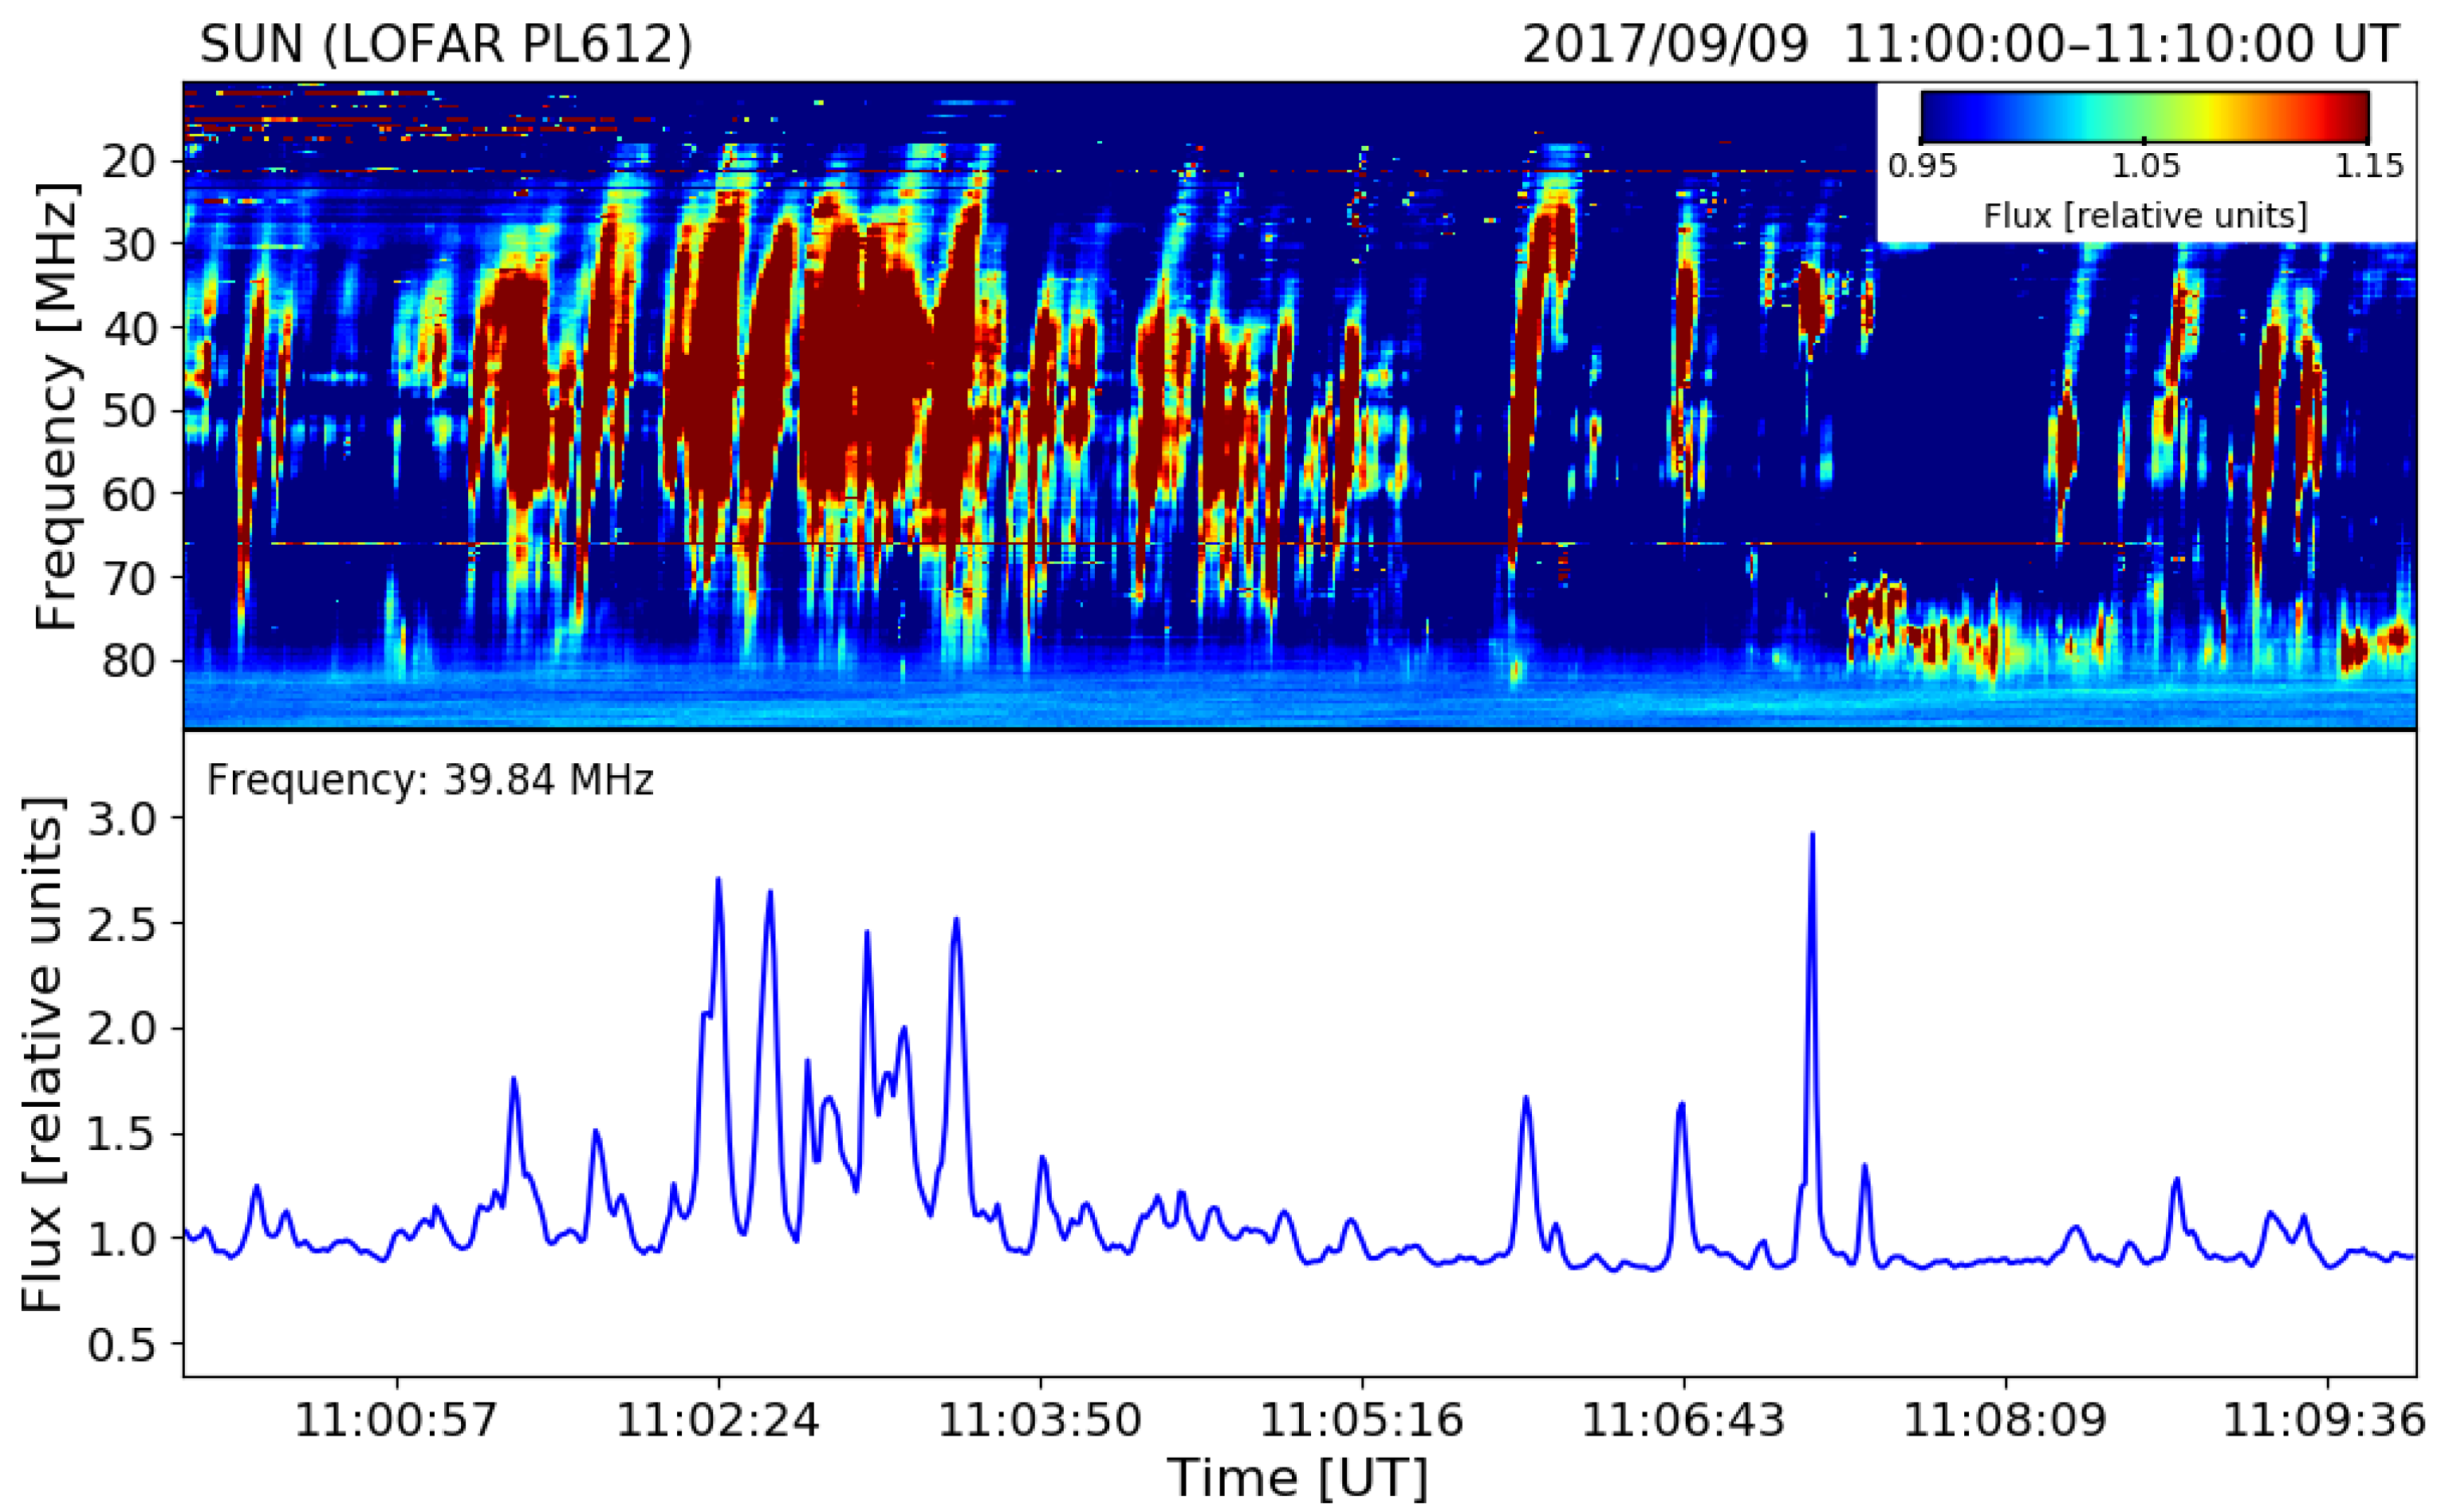
Figure 6.
Upper panel: a ten-minutes part of the solar dynamic spectrum of the storm of type III radio bursts recorded on 9th September 2017 with LOFAR Bałdy station. Bottom panel: radio flux at frequency of 39.84 MHz, extracted from dynamic spectrum on the upper panel, shows the time profiles of individual type III bursts.
Figure 7.
The comparison of the GOES X-ray and radio fluxes with IRIS and SDO UV signals during the radio event observed on 9th September 2017. The upper panel shows the GOES 1–8 Å and 0.5–4 Å fluxes observed from 9:10 to 14:00 UT. We can see an M3.7 solar flare with peak at 11:04 UT (marked by the blue vertical dotted line). The flare was also observed in the ultraviolet spectral range. The green vertical dotted lines indicate the moments for which we showed SJIs from the IRIS satellite in three passbands: 1330 Å, 2796 Å and 2832 Å on
Figure 8. The middle panel shows the lightcurves determined from IRIS SJIs recorded in 1330 Å (orange dashed-dotted line) and 2796 Å (blue dashed-dotted line) passbands. IRIS observations were not continuous, therefore there is a gap in the signal. The panel also presents the lightcurves from SDO/AIA recorded in 94, 171, 211 and 1700 Å channels (green, red, blue and violet solid lines respectively). SDO observations ended at 11:46 UT. The third panel shows the radio flux at 39.84 MHz frequency from LOFAR in the time of GOES’ registered flare. LOFAR observations were not continuous, therefore there is a gap in the signal.
![Remotesensing 13 00148 g007]()
Figure 8.
Examples of the SJIs at C II (centered at 1330 Å; upper panel), Mg II k (2796 Å; middle panel) and window centered at 2832 Å (wing of Mg II line; lower panel) obtained by IRIS satellite in the active region NOAA 12673 on 9th September 2017 during observational time 5:20–11:36 UT. The images show the observed flaring region in four times of the observations: at 10:59 UT and 11:01 UT during the impulsive phase of the flare, at 11:10 UT after the flare maximum, and 11:15 UT at the beginning of the gradual phase with the flare loops. The bright vertical line in maps at 1330 Å and dark one at 2796 and 2832 Å is a shadow of the slit of spectrograph. The SJI image is forming, when the light is reflected off the area around the slit, and one can see in the images the feature from spectrograph.
Figure 9.
Examples of the SDO/AIA maps obtained on 9th September 2017 (NOAA 12673) at four channels during the impulsive phase of the flare presented different heights in the solar atmosphere: 94 Å (shows flaring region present in the solar corona, the primary ion in this channel is Fe XVIII), 171 Å (upper tranistion region, the primary ion: Fe IX), 211 Å (active regions in the corona, the primary ion: Fe XIV) and 1700 Å (show the photosphere and temperature minimum region, we observe in the channel mainly the continuum emission). Maps include the whole active region visible close to the west solar limb (black solid line). The FOV of the SJIs is overplotted in every SDO map (blue rectangle). We can see the IRIS FOV cover the middle part of the region.
Figure 10.
The drift rate as a function of frequency for the both analyzed type III solar radio events. The blue asterisks mark the 131 type III bursts observed on 9th September 2017 and the yellow asterisks mark the 124 type III bursts observed on 20th August 2017. The blue and yellow lines show the fitting results to the bursts described by and for 9th September 2017 and 20th August 2017, respectively.
Figure 11.
The electron energy as a function of frequency for the both analyzed type III solar radio events. On the left panel the blue asterisks mark the 131 type III bursts observed on 9th September 2017 and the yellow asterisks mark the 124 type III bursts observed on 20th August 2017, assuming the Mann et al. coronal density model. On the right panel the blue asterisks mark the 131 type III bursts observed on 9th September 2017 and the yellow asterisks mark the 124 type III bursts observed on 20th August 2017, assuming the Newkirk coronal density model.
Figure 12.
Comparison of drift rates versus frequency presented by different authors, listed in the
Table 1. The dashed line correspond to the 20th August 2017 radio event and the dash-dot line to the 9th September 2017. We can see that drift rate for 20th August 2017 radio event is very similar to the drift rate obtained by [
4,
7]. On the other hand, the drift rate for 9th September 2017 radio event is very similar to the drift rate obtained by [
8].
Table 1.
Drift rates for type III solar radio bursts.
Table 1.
Drift rates for type III solar radio bursts.
| Drift () | Frequency Range | Reference |
|---|
| | |
| 0.075–550 | [8] |
| 0.04–85 | [4] |
| 10–80 | [7] |
Table 2.
Type III radio events and corresponding GOES flares.
Table 2.
Type III radio events and corresponding GOES flares.
| Type III Events | Flare Class | Time (Start-Max-End) | NOAA | Location |
|---|
| 2017-08-20 | B6.1 | 12:16-12:21-12:26 UT | 12671 | 34″N 144″W |
| 09:03:32–15:14:36 UT | C1.0 | 14:40-14:45-14:52 UT | 12672 | 75″N 945″E |
2017-09-09
10:03:32–14:09:08 UT | M3.7 | 10:50-11:04-11:42 UT | 12673 | 187″S 883″W |
Table 3.
Physical parameters of the studied events on 20th August 2017 and 9th September 2017.
Table 3.
Physical parameters of the studied events on 20th August 2017 and 9th September 2017.
| | | | | Mann et al. Model | Newkirk Model |
|---|
| Events | Number of | Drift () | Central Freq. (f) | | Energy | | Energy |
|---|
| | Type III Bursts | [MHz/s] | [MHz] | [km/s] | [keV] | [km/s] | [keV] |
|---|
| 2017-08-20 | 124 | | 53.3 | 43,704 () | 6.09 | 54,287 () | 9.55 |
| 2017-09-09 | 131 | | 56.0 | 30,960 () | 3.16 | 38,119 () | 4.83 |
| Publisher’s Note: MDPI stays neutral with regard to jurisdictional claims in published maps and institutional affiliations. |
© 2021 by the authors. Licensee MDPI, Basel, Switzerland. This article is an open access article distributed under the terms and conditions of the Creative Commons Attribution (CC BY) license (http://creativecommons.org/licenses/by/4.0/).

 ,
, 


