Spatial Heterogeneity in Dead Sea Surface Temperature Associated with Inhomogeneity in Evaporation


Department of Geophysics, Tel Aviv University, Tel Aviv 69978, Israel
*
Author to whom correspondence should be addressed.
Remote Sens. 2021, 13(1), 93; https://0-doi-org.brum.beds.ac.uk/10.3390/rs13010093
Submission received: 2 December 2020
/
Revised: 22 December 2020
/
Accepted: 26 December 2020
/
Published: 30 December 2020
(This article belongs to the Special Issue Remote Sensing of Lake Properties and Dynamics)
Abstract
:Spatial heterogeneity in Dead Sea surface temperature (SST) was pronounced throughout the daytime, based on METEOSAT geostationary satellite data (2005–2015). In summer, SST peaked at 13 LT (local time), when SST reached 38.1 °C, 34.1 °C, and 35.4 °C being averaged over the east, middle, and west parts of the lake, respectively. In winter, daytime SST heterogeneity was less pronounced than that in summer. As the characteristic feature of the diurnal cycle, the SST daily temperature range (the difference between daily maxima and minima) was equal to 7.2 °C, 2.5 °C, and 3.8 °C over the east, middle, and west parts of the Dead Sea, respectively, in summer, compared to 5.3 °C, 1.2 °C, and 2.3 °C in winter. In the presence of vertical water mixing, the maximum of SST should be observed several hours later than that of land surface temperature (LST) over surrounding land areas due to thermal inertia of bulk water. However, METEOSAT showed that, in summer, maxima of SST and LST were observed at the same time, 13 LT. This fact is evidence that there was no noticeable vertical water mixing. Our findings allowed us to consider that, in the absence of water mixing and under uniform solar radiation in the summer months, spatial heterogeneity in SST was associated with inhomogeneity in evaporation. Maximal evaporation (causing maximal surface water cooling) took place at the middle part of the Dead Sea, while minimum evaporation took place at the east side of the lake.

1. Introduction
The Dead Sea is a terminal hypersaline lake at a unique location at ~400 m below sea level. Over the last several decades the Dead Sea has been drying up: its water level has dropped at the rate of ~1 m year−1 [1]. The Dead Sea drying up is due to climate change in the Eastern Mediterranean, which is expressed by strong and increasing evaporation; a decreasing tendency in rainfall over the last 40 years [2]; and the lack of water inflow from the Jordan River. According to Kishcha et al. [1], climate change in the Eastern Mediterranean is accompanied by a positive feedback loop between the shrinking of the Dead Sea and the increasing trend in Dead Sea surface temperature (SST) of 0.6 °C per decade. This positive feedback loop leads to acceleration in the Dead Sea water level drop: this causes a continuing hazard to this unique hypersaline lake, located at ~400 m below sea level. Investigation of spatial patterns of SST and its diurnal variations can contribute to our understanding of spatial distribution of Dead Sea evaporation.
Because of high salinity of Dead Sea water (~300 PSU), the absorption of solar radiation is strong and nonlinear. In particular, in the Dead Sea, at a depth of 0.5 m, solar radiation is ~50% of its surface value, at a depth of 1 m ~30%, and at a depth of 2 m, solar radiation is ~10% [3]. Therefore, in the hypersaline Dead Sea, a significant part of solar radiation is absorbed in the narrow layer near the surface producing considerable surface water heating. Using MODIS data of 5 × 5 km resolution on board the Terra and Aqua satellites from 2002 to 2016, Kishcha et al. [4] showed spatial non-uniformity in SST under uniform solar radiation in the summer months. The SST non-uniformity could be caused by intralake heterogeneity in evaporation. The above mentioned non-uniformity in Dead Sea SST was observed at 10:30 local time (LT) and 13:30 LT, when the Terra and Aqua satellites covered the Dead Sea [4]. It would be important to investigate diurnal behavior of this SST spatial non-uniformity.
There is a lack of knowledge about spatial patterns of both surface winds and evaporation over the Dead Sea. The winds are the result of a complex combination of katabatic winds, local sea breeze, and the arrival of the Mediterranean Sea breeze [5,6,7,8]. Although, there are several studies of Dead Sea winds, practically all were carried out on data acquired on the shore [9,10]. To analyze patters of surface winds over the sea, regular measurements from a moored buoy network are necessary; however, such a network is unavailable for various reasons. With respect to evaporation, all measurements were carried out at a limited number of sites [11,12]. No measurements of spatial distribution of Dead Sea evaporation have ever been conducted, either in situ or from space.
Available remote sensing satellite observations of surface temperature on board the geostationary METEOSAT satellites [13] provide us with an opportunity to investigate the diurnal cycle of surface temperature over the Dead Sea and adjacent land areas. Our study was aimed at investigating the diurnal cycle of spatial heterogeneity in SST using the 11-year period of METEOSAT records of surface temperature (2005 to 2015). We are going to prove that, in the summer months, spatial inhomogeneity in SST was associated with intralake heterogeneity in evaporation. Moreover, the influence was analyzed of spatial inhomogeneity in SST on diurnal behavior of surface temperature over land areas adjacent to the Dead Sea.
2. Materials and Methods
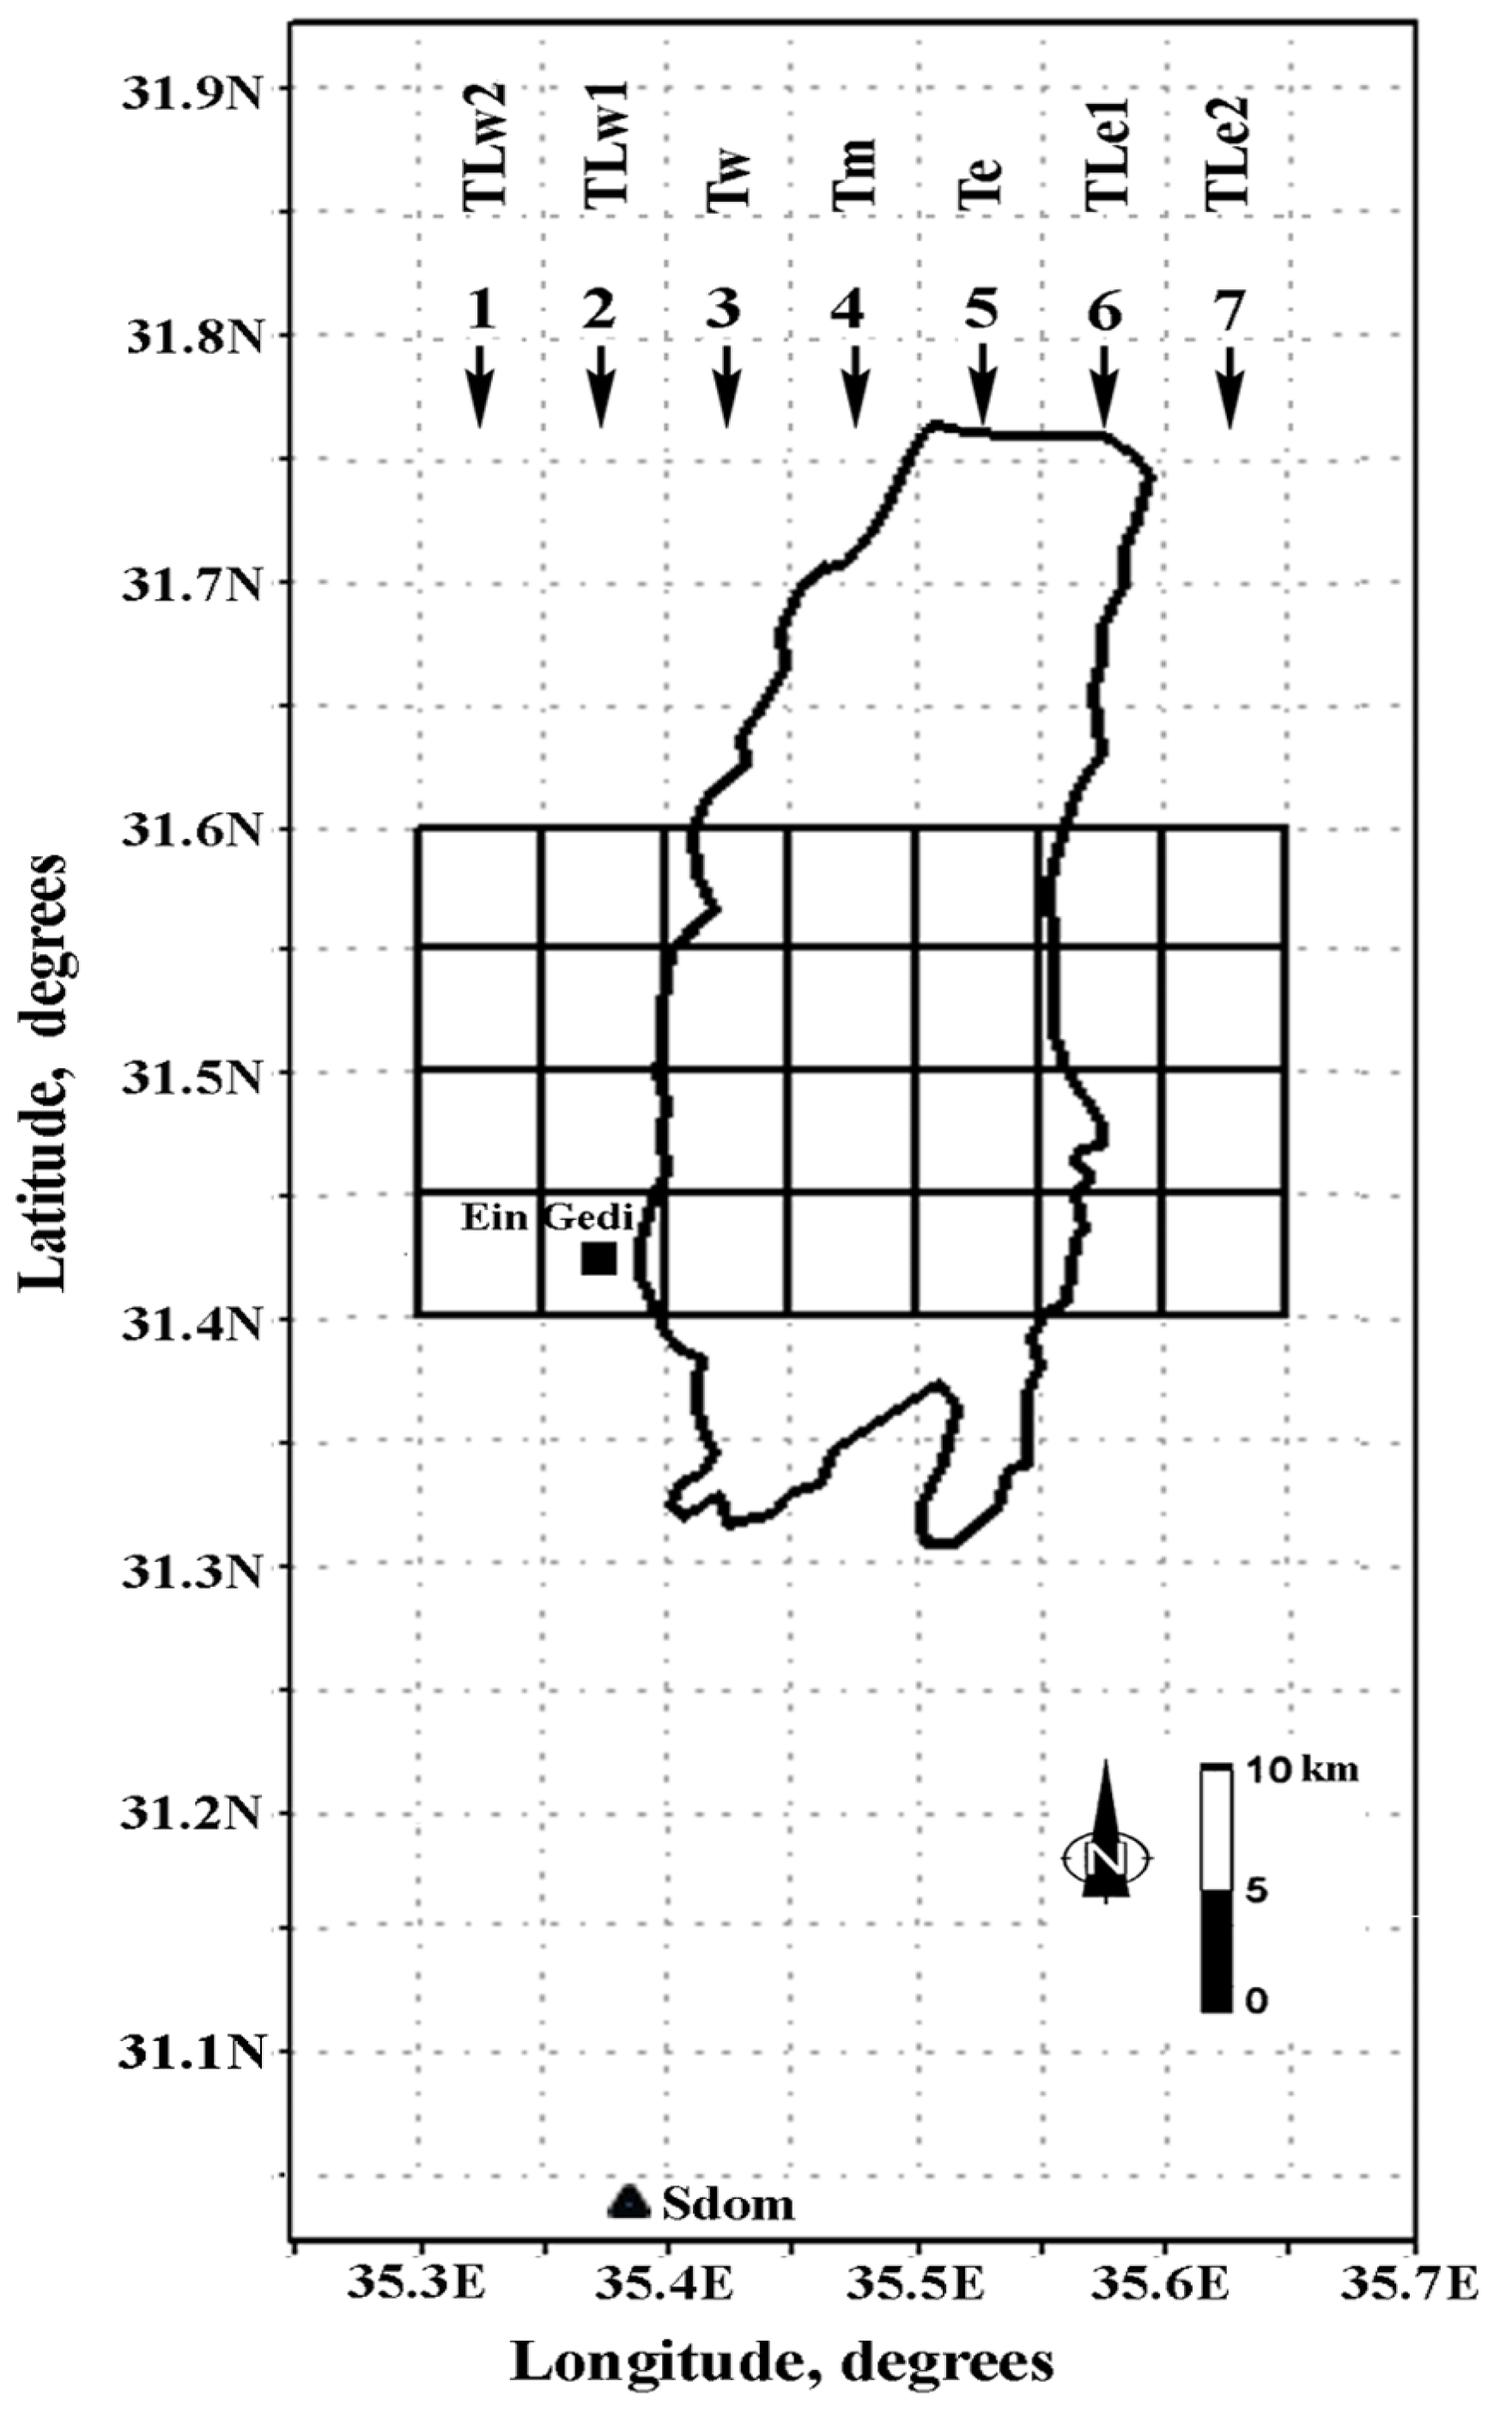
In the current study, we investigated spatial non-uniformity of Dead Sea surface temperature separately, pixel by pixel, over the region under investigation. We focused on the region (31.4°N–31.6°N, 35.3°E–35.65°E) covering the western, middle, and eastern Dead Sea, as well as pixels covering land areas adjacent to the west and east sides of the Dead Sea (Figure 1). In this figure we used the same designations as in Kishcha et al. [4].
Monthly data derived from the Spinning Enhanced Visible and Infra-Red Imager (SEVIRI) onboard the geostationary METEOSAT Second Generation satellites were used in this study [13,14]. The data of the physical land surface temperature (LST) monthly product during the 11-year period of METEOSAT LST records (2005–2015) were analyzed in summer and winter months. This product is based on radiative transfer calculations. The product is presented as hourly data and as monthly averaged diurnal cycle composites on a 0.05° × 0.05° grid (approximately a 5 × 5 km grid) covering the entire METEOSAT disk (Africa, Europe, and the Atlantic Ocean) [13]. In accordance with Duguay–Tetzlaff et al. [14], validations against in situ LST measurements showed that METEOSAT LST retrievals reached a 1 °K overall accuracy. The in situ calibration of METEOSAT LST record over the Dead Sea was carried out by Nehorai et al. [15]. Note that the METEOSAT LST product includes surface temperature data over both Dead Sea water areas and surrounding land areas. These data were obtained by the same retrieval algorithm. Hereafter, we use the designation of SST for METEOSAT data over the Dead Sea while the designation of LST for METEOSAT data over land areas surrounding the lake.
Being presented as hourly data of monthly means, METEOSAT LST products allowed us to investigate diurnal cycles of spatial non-uniformity in surface temperature of the Dead Sea and adjacent land areas. To this end, we analyzed separately the diurnal cycle of SST over the east, middle, and west parts of the Dead Sea (Te, Tm, and Tw, respectively), as well as that of LST over land areas adjacent to the east and west sides of the lake (TLe1, TLe2, TLw1, and TLw2).
Surface heat flux from land to sea is proportional to surface temperature gradients between LST over remote land areas (TLe2, TLw2) and LST over land areas adjacent to the lake (TLe1, TLw1). We investigated diurnal variations of these surface temperature gradients. On the regular grid of METEOSAT data, we used the land surface temperature differences (TLe2–TLe1) and (TLw2–TLw1) in order to determine the surface temperature gradients over land areas adjacent to the east and west sides of the Dead Sea, respectively. The surface heat flow at the east side is proportional to the temperature difference (TLe2–TLe1), while the surface heat flow at the west side is proportional to the temperature difference (TLw2–TLw1). Positive temperature differences (TLw2–TLw1) and (TLe2–TLe1) indicate the presence of surface heat flow from land to sea in the daytime when land surfaces are significantly warmer than sea surfaces. Negative temperature differences (TLw2–TLw1) and (TLe2–TLe1) indicate the presence of surface heat flow from sea to land in the nighttime because land surfaces get cold at a faster rate than sea surfaces.
To explain specific features of diurnal variations of SST over the middle part of the Dead Sea, we used available hourly measurements of 2-m air temperature, during the 11-year study period taken at the Ein Gedi meteorological station, located just near the west coastline of the Dead Sea (31.42°N, 35.39°E) (Figure 1). Moreover, to investigate possible distortions of diurnal variations of SST with respect to the solar cycle, we used available hourly pyranometer measurements of surface solar radiation during the study period taken at the Sdom meteorological station (31.03°N, 35.39°E), located in the vicinity of the Dead Sea (Figure 1).
3. Results
3.1. Diurnal Cycle of Summer SST
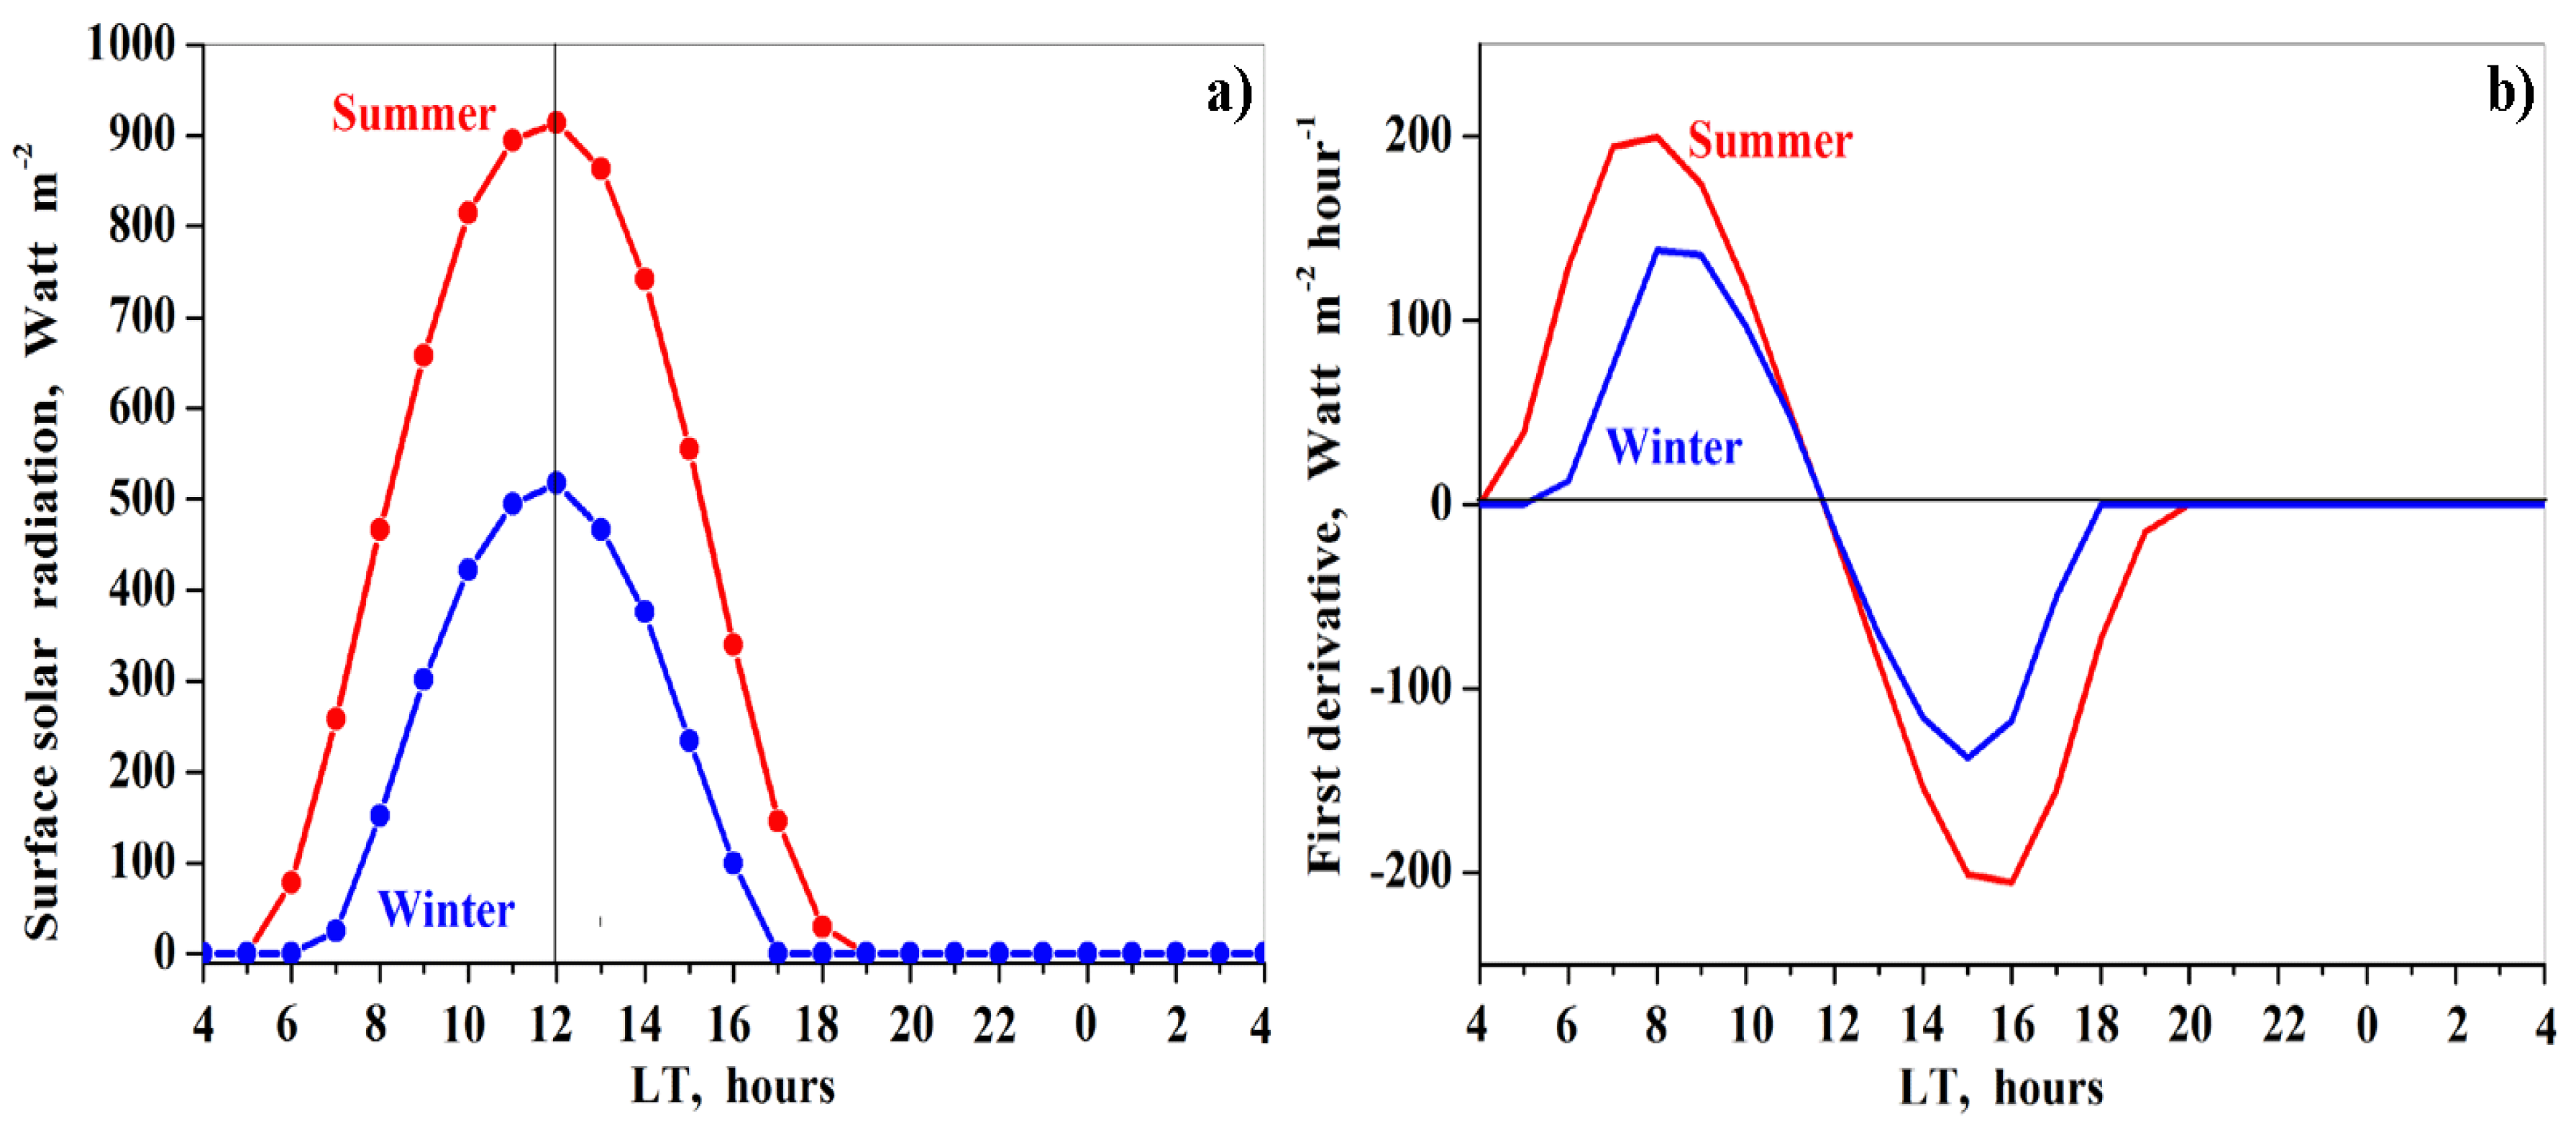
The investigation of diurnal cycles of SST over the east, middle and west parts of the Dead Sea was carried out in the JAS summer months (July, August, and September) from 2005 to 2015. In these months, cloud cover over the Dead Sea is insignificant and does not influence solar insolation [4]. Based on hourly pyranometer data in the JAS summer months (2005–2015) at the Sdom meteorological station, the diurnal variation of solar insolation was symmetrical with respect to its maximum at 12 LT (Figure 2a and Table A1). The diurnal variation of the first derivative of solar insolation shows that this derivative is positive before noon, indicating increasing solar insolation; and this derivative is negative after noon, indicating decreasing solar insolation (Figure 2b). As an instantaneous rate of change, amplitudes of the first derivative show that the most significant changes of solar insolation occur at ~9 LT at its growth stage and at ~16 LT at its decreasing stage (Figure 2a,b).
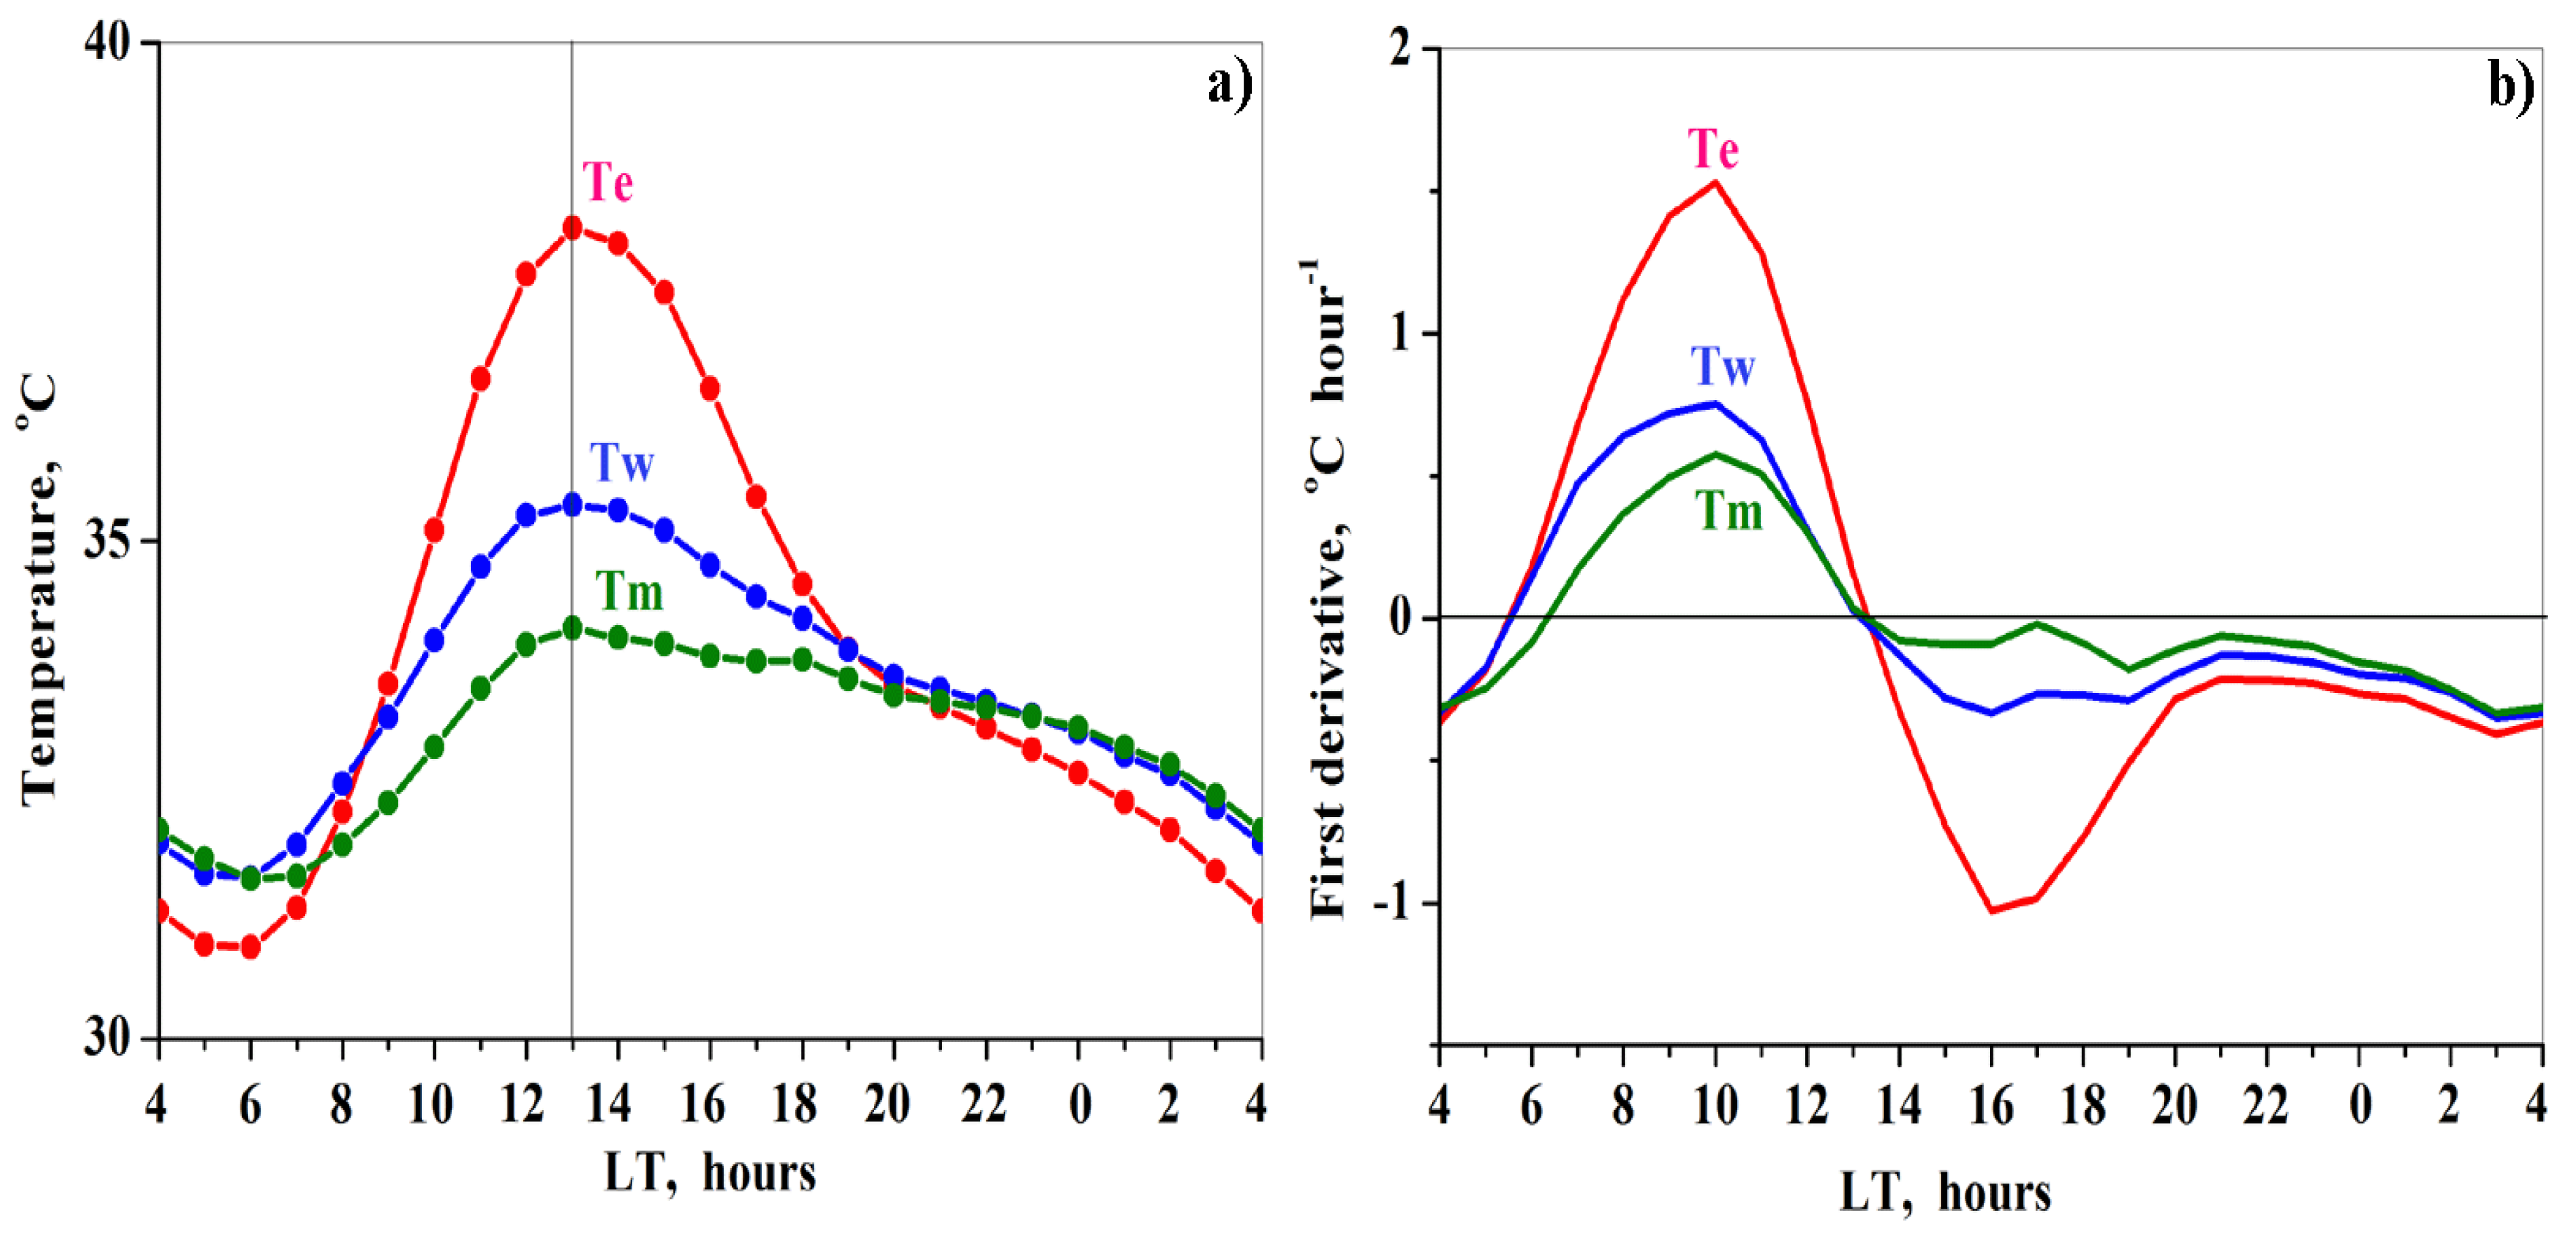
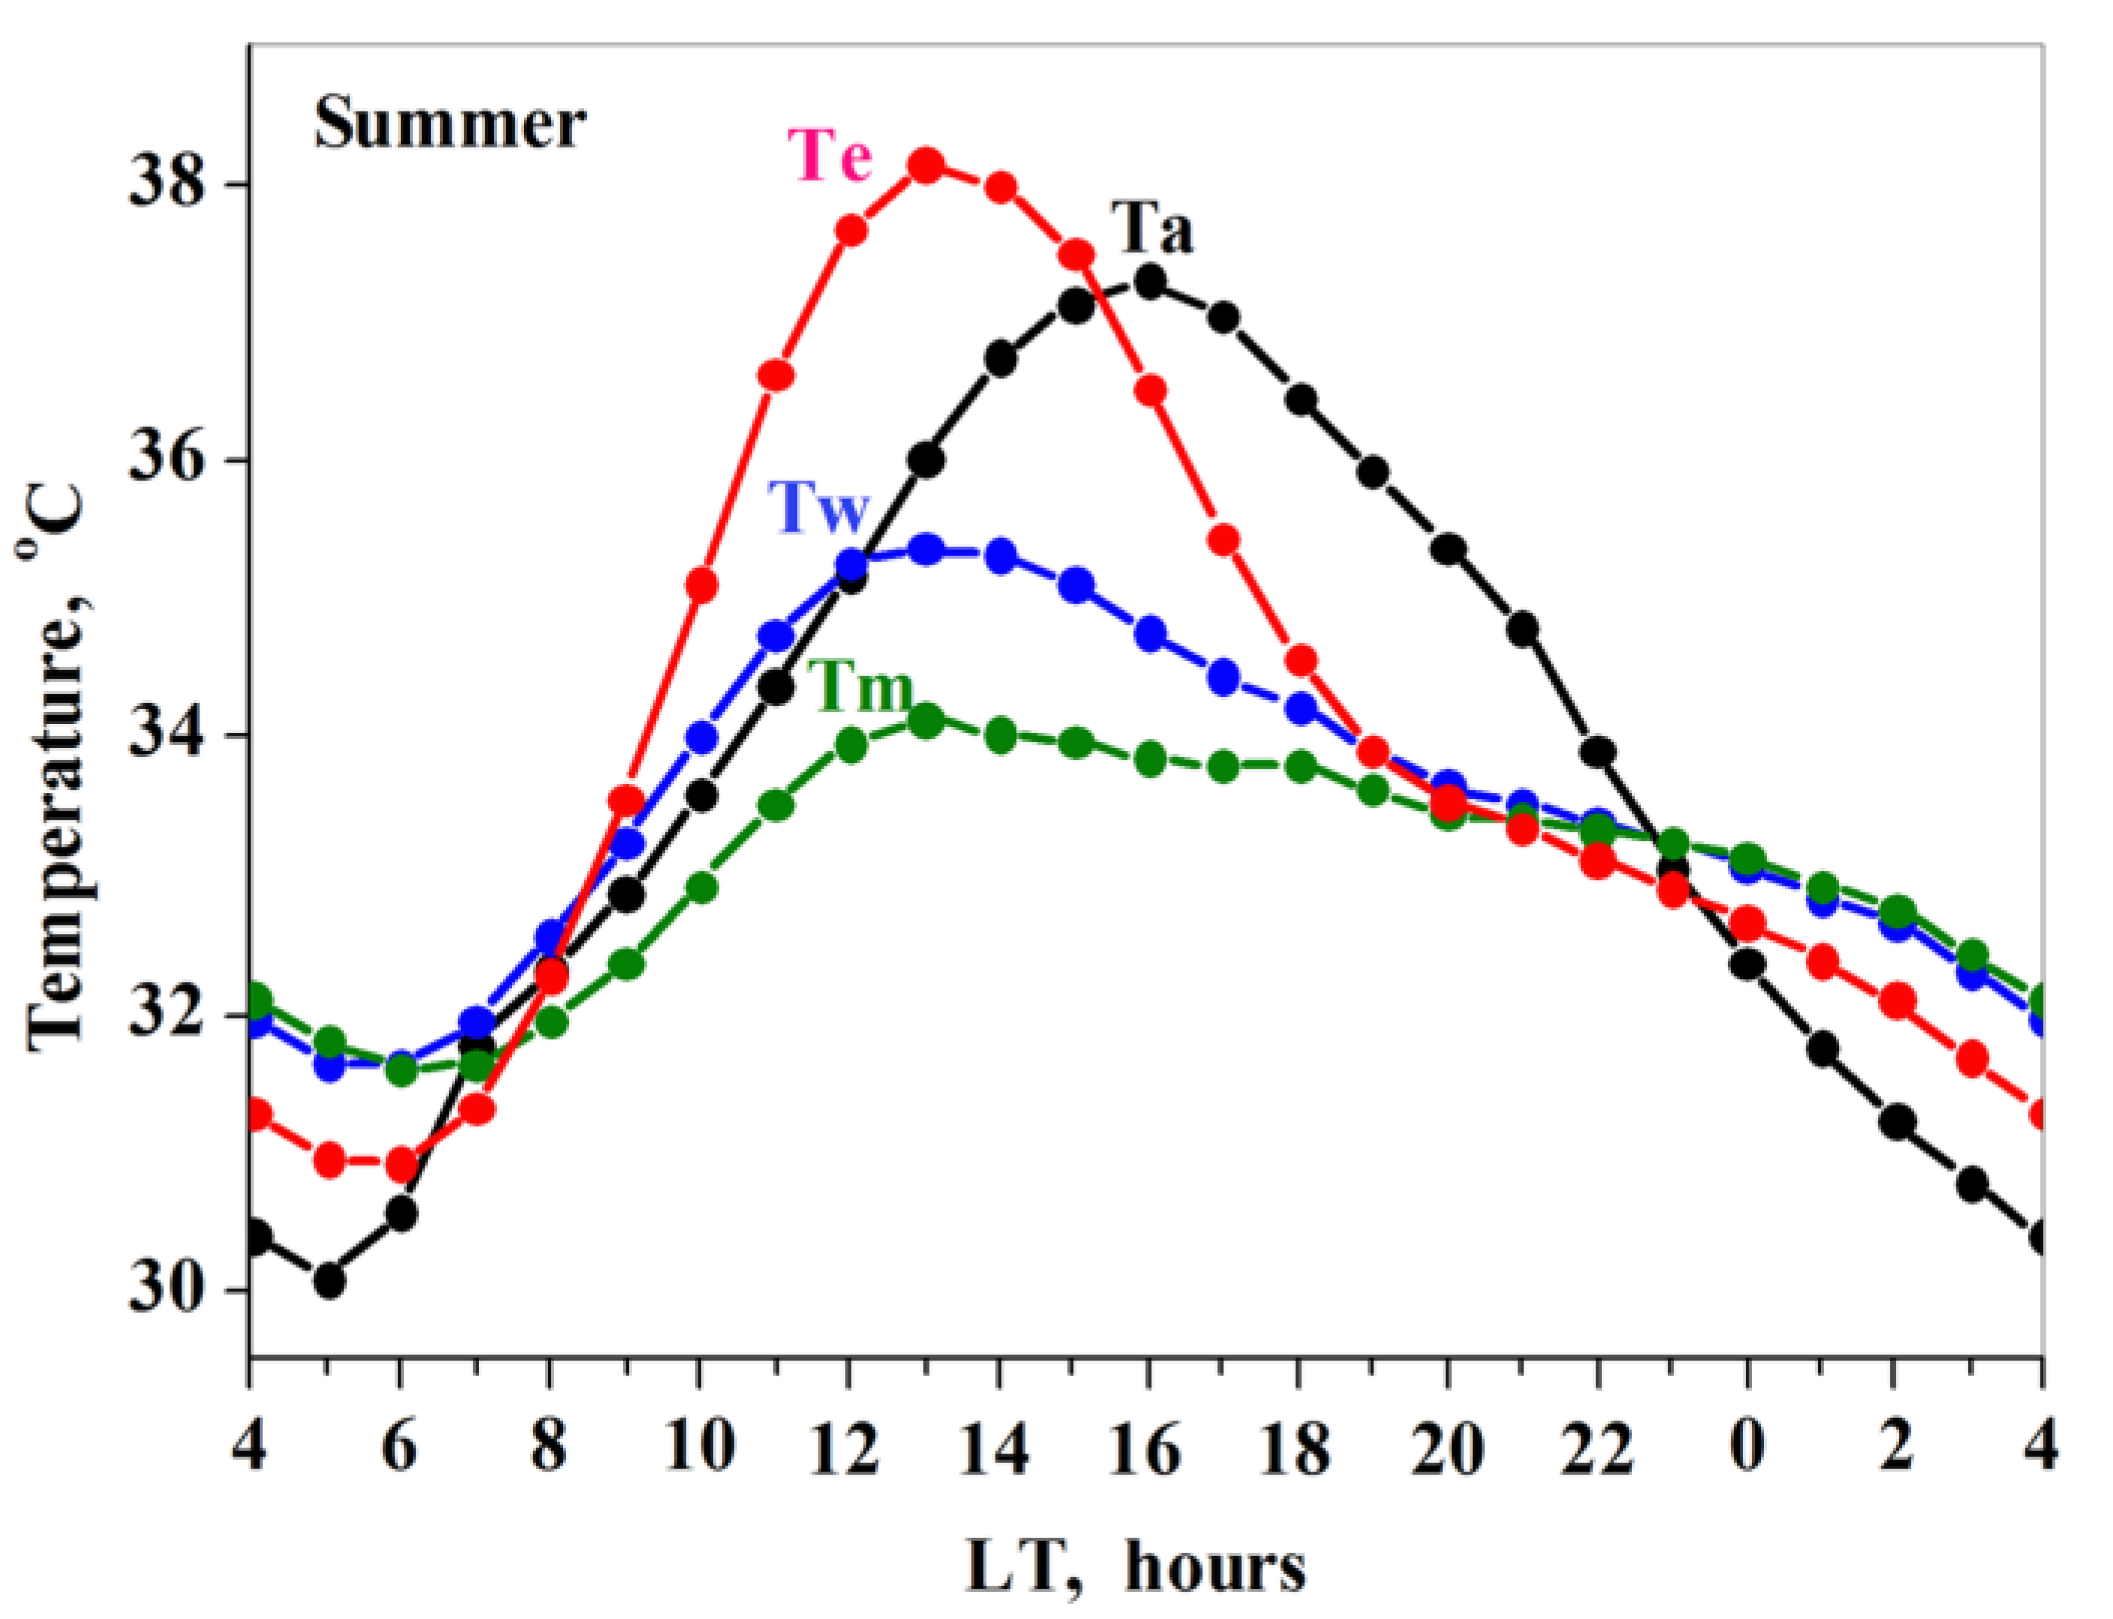
METEOSAT data showed that, in the JAS summer months, maximum SST was observed at 13 LT over all parts of the Dead Sea, which was one hour later than the maximum of solar insolation measured by pyranometers. Our analysis of 11-year mean METEOSAT data revealed an essential difference between the diurnal cycles of SST over the east (Te), middle (Tm), and west (Tw) parts of the Dead Sea, in the JAS summer months (Figure 3). In particular, the diurnal variation of Te and its first derivative (Figure 3a,b) corresponded well to those of solar insolation (Figure 2a,b). In the morning, at 6 LT just after sunrise, Te started increasing. In the daytime, the Te variations followed the solar cycle with the maximum observed at 13 LT (Figure 3a). Moreover, amplitudes of the Te first derivative showed that the most significant changes of Te occurred at ~10 LT at its growth stage and at ~16 LT at its decreasing stage.
The diurnal variation of Tm differed from that of Te (Figure 3a,b; and Table A2). Specifically, although Te started increasing at 6 LT just after sunrise, Tm started increasing one hour later at 7 LT (Figure 3). Next, from 7 LT to ~14 LT, Tm followed the solar cycle reaching maximum at 13 LT. From 6 LT to 13 LT, the increase in Tm was essentially lower than that in Te (Figure 3a). However, after 14 LT, Tm did not follow the solar cycle. In particular, from 14 LT to 18 LT, Tm hardly changed with time in spite of decreasing solar insolation. The features of the diurnal variation of Tw was closer to the features of Tm than to those of Te (Figure 3a,b). Specifically, from 6 LT to ~15 LT, Tw followed the solar cycle reaching its maximum at 13 LT. In so doing, from 6 LT to 13 LT, the increase in Tw was noticeably lower than that in Te (Figure 3a). From 15 LT to 19 LT, the decrease in Tw was much more gradual than that in Te, because of the contribution of air–sea temperature differences to the Tw diurnal variations.
In summer, after 13 LT, solar radiation decreases whereas evaporation increases reaching its daytime maximum of approximately 0.2 mm/hour from 14 LT to 18 LT, in accordance with evaporation measurements [11]. These two factors should seemingly lead to a decrease in SST. However, from 14 LT to 18 LT, Tm hardly changed in spite of decreasing solar radiation and maximal evaporation, in contrast to decreasing Te and Tw. Using hourly air temperature measurements taken at the Ein Gedi station during the study period, we found that air temperature was maximal from 14 LT to 18 LT (air temperature lag) exceeding by several degrees SST over the middle part of the lake (Figure 4). The observed exceedance of air temperature over Tm created essentially higher heating surface water over the middle part of the lake (by thermal long-wave radiation) than that at the east and west sides. This surface water heating by the atmosphere compensated for the surface water cooling due to decreasing solar radiation and maximal evaporation from 14 LT to 18 LT. This explains the behavior of Tm from 14 LT to 18 LT. METEOSAT showed that, despite the above mentioned heating from the atmosphere, Tm was lower than Te and Tw (Figure 3a). This highlights the main role of evaporation in the formation of spatial heterogeneity in SST (see Section 4.1 for details).
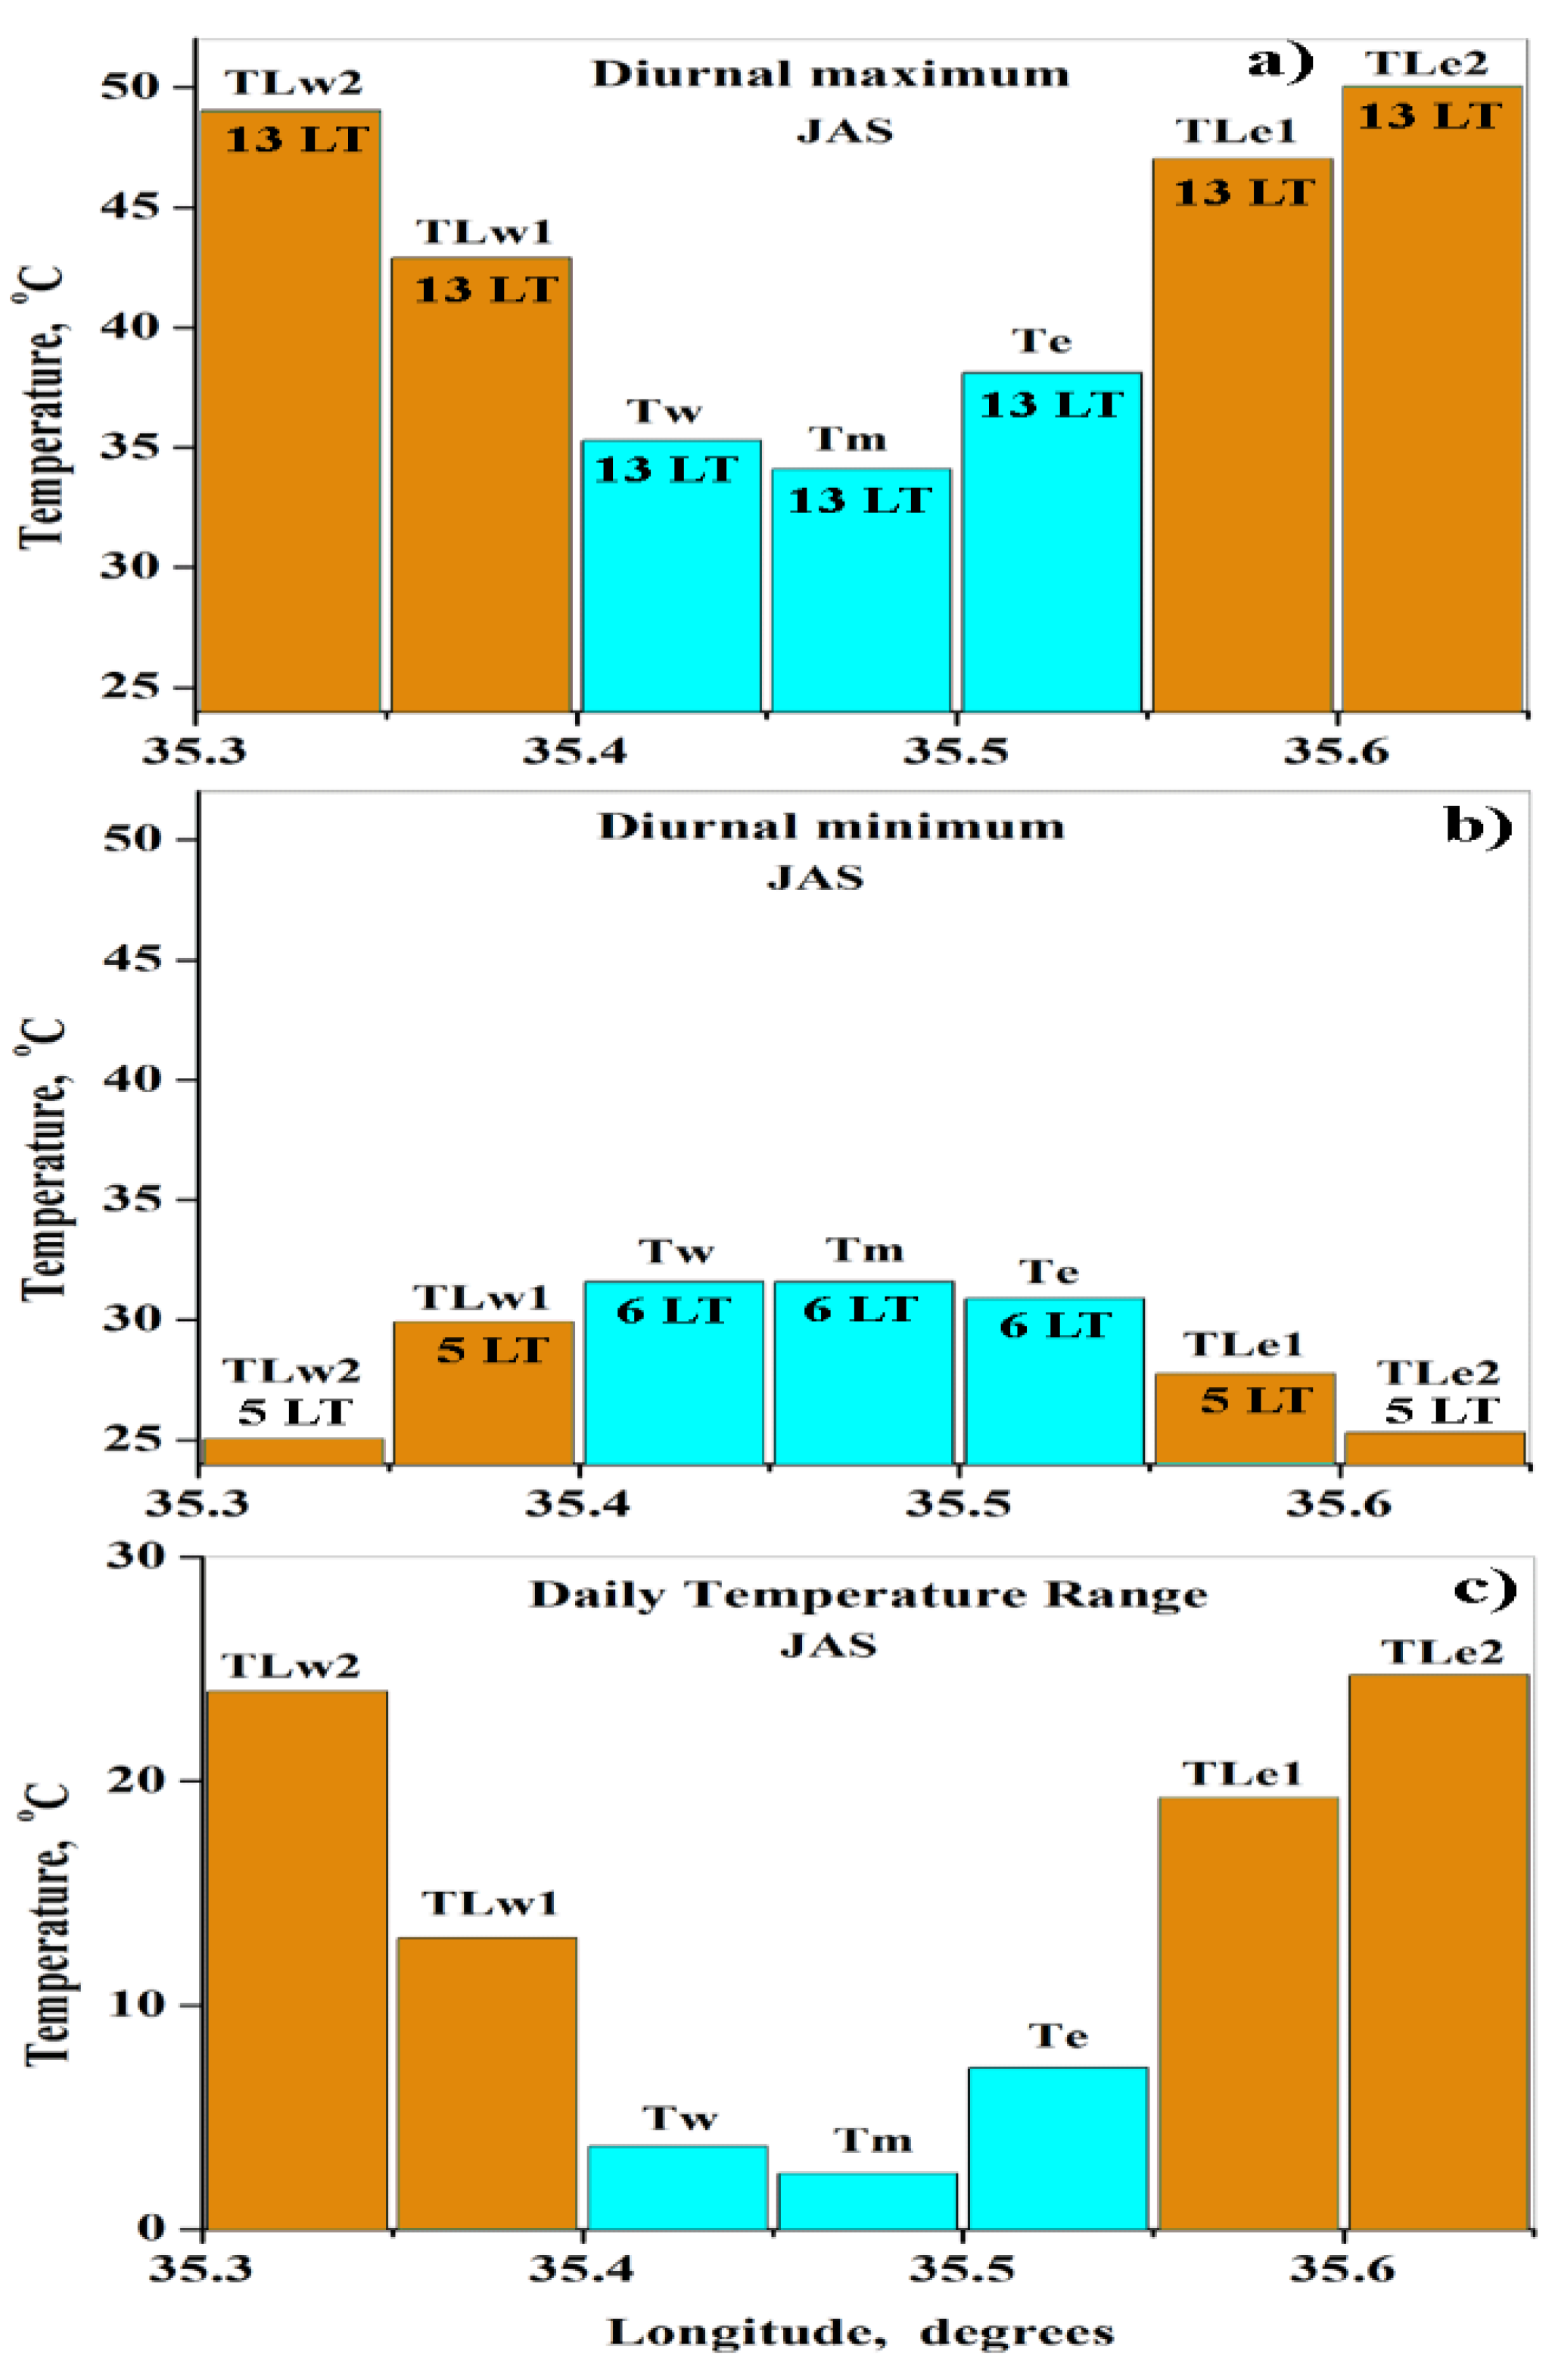
METEOSAT data showed that SST spatial non-uniformity was observed throughout the daytime and peaked at 13 LT, when SST reached their diurnal maxima over the east, middle and west parts simultaneously. At 13 LT, on average over the summer months, the diurnal maximum of SST was equal to 38.1 °C, 34.1 °C, and 35.4 °C for Te, Tm, and Tw, respectively (Figure 5a and Table A2). Thus, the characteristic feature of maximal spatial non-uniformity in daytime SST, on average for the summer months, was as follows: at 13 LT, SST at the east part of the Dead Sea exceeded by 4 °C SST at the middle part of the Dead Sea and by ~3 °C SST at the west part of the lake.
In the nighttime, METEOSAT data showed that SST values were minimal and SST spatial distribution was much more uniform compared to the daytime (Figure 3). At 6 LT, on average over the summer months, the diurnal minima of SST was equal to 30.9 °C, 31.6 °C, and 31.6 °C for Te, Tm, and Tw, respectively (Figure 5b and Table A2). The almost uniform distribution of nighttime SST was the result of vertical water mixing under strong nighttime winds in the Dead Sea valley [15,16]. Taking into account the almost uniform distribution of nighttime SST in summer, the diurnal temperature range (DTR) of SST (calculated as the difference between the diurnal SST maxima and minima) can be used as a measure of spatial non-uniformity in daytime SST. METEOSAT data showed that DTR of Te (7.2 °C) exceeded by a factor of three DTR of Tm (2.5 °C), and by a factor of two DTR of Tw (3.8 °C) (Figure 5c). The fact that DTR of Tm was lower than both DTR of Te and of Tw indicated the presence of significant evaporation over the middle part of the Dead Sea (See Section 4 Discussion). The fact that DTR of Te was larger than DTR of Tw indicated the minimal evaporation over the east part of the lake in the daytime.
3.2. Maps of Spatial Heterogeneity in SST
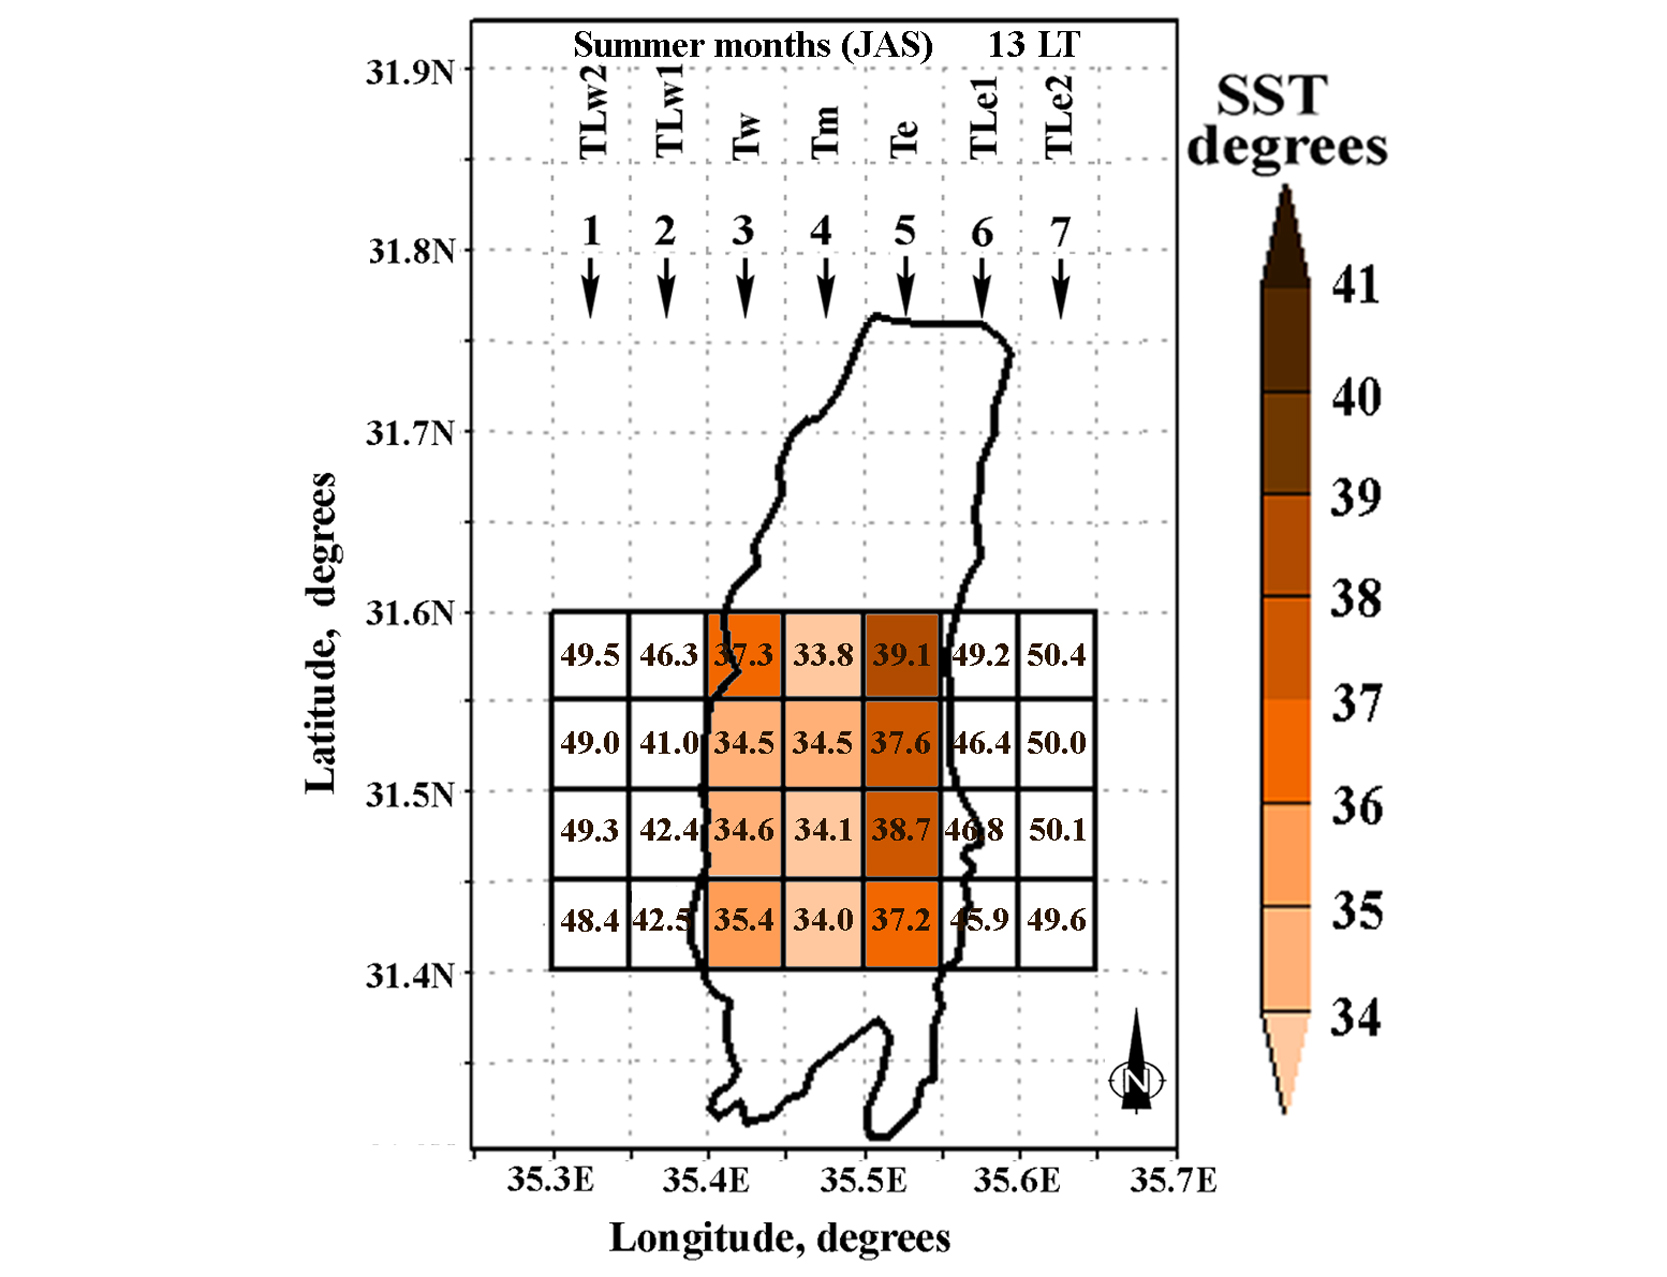
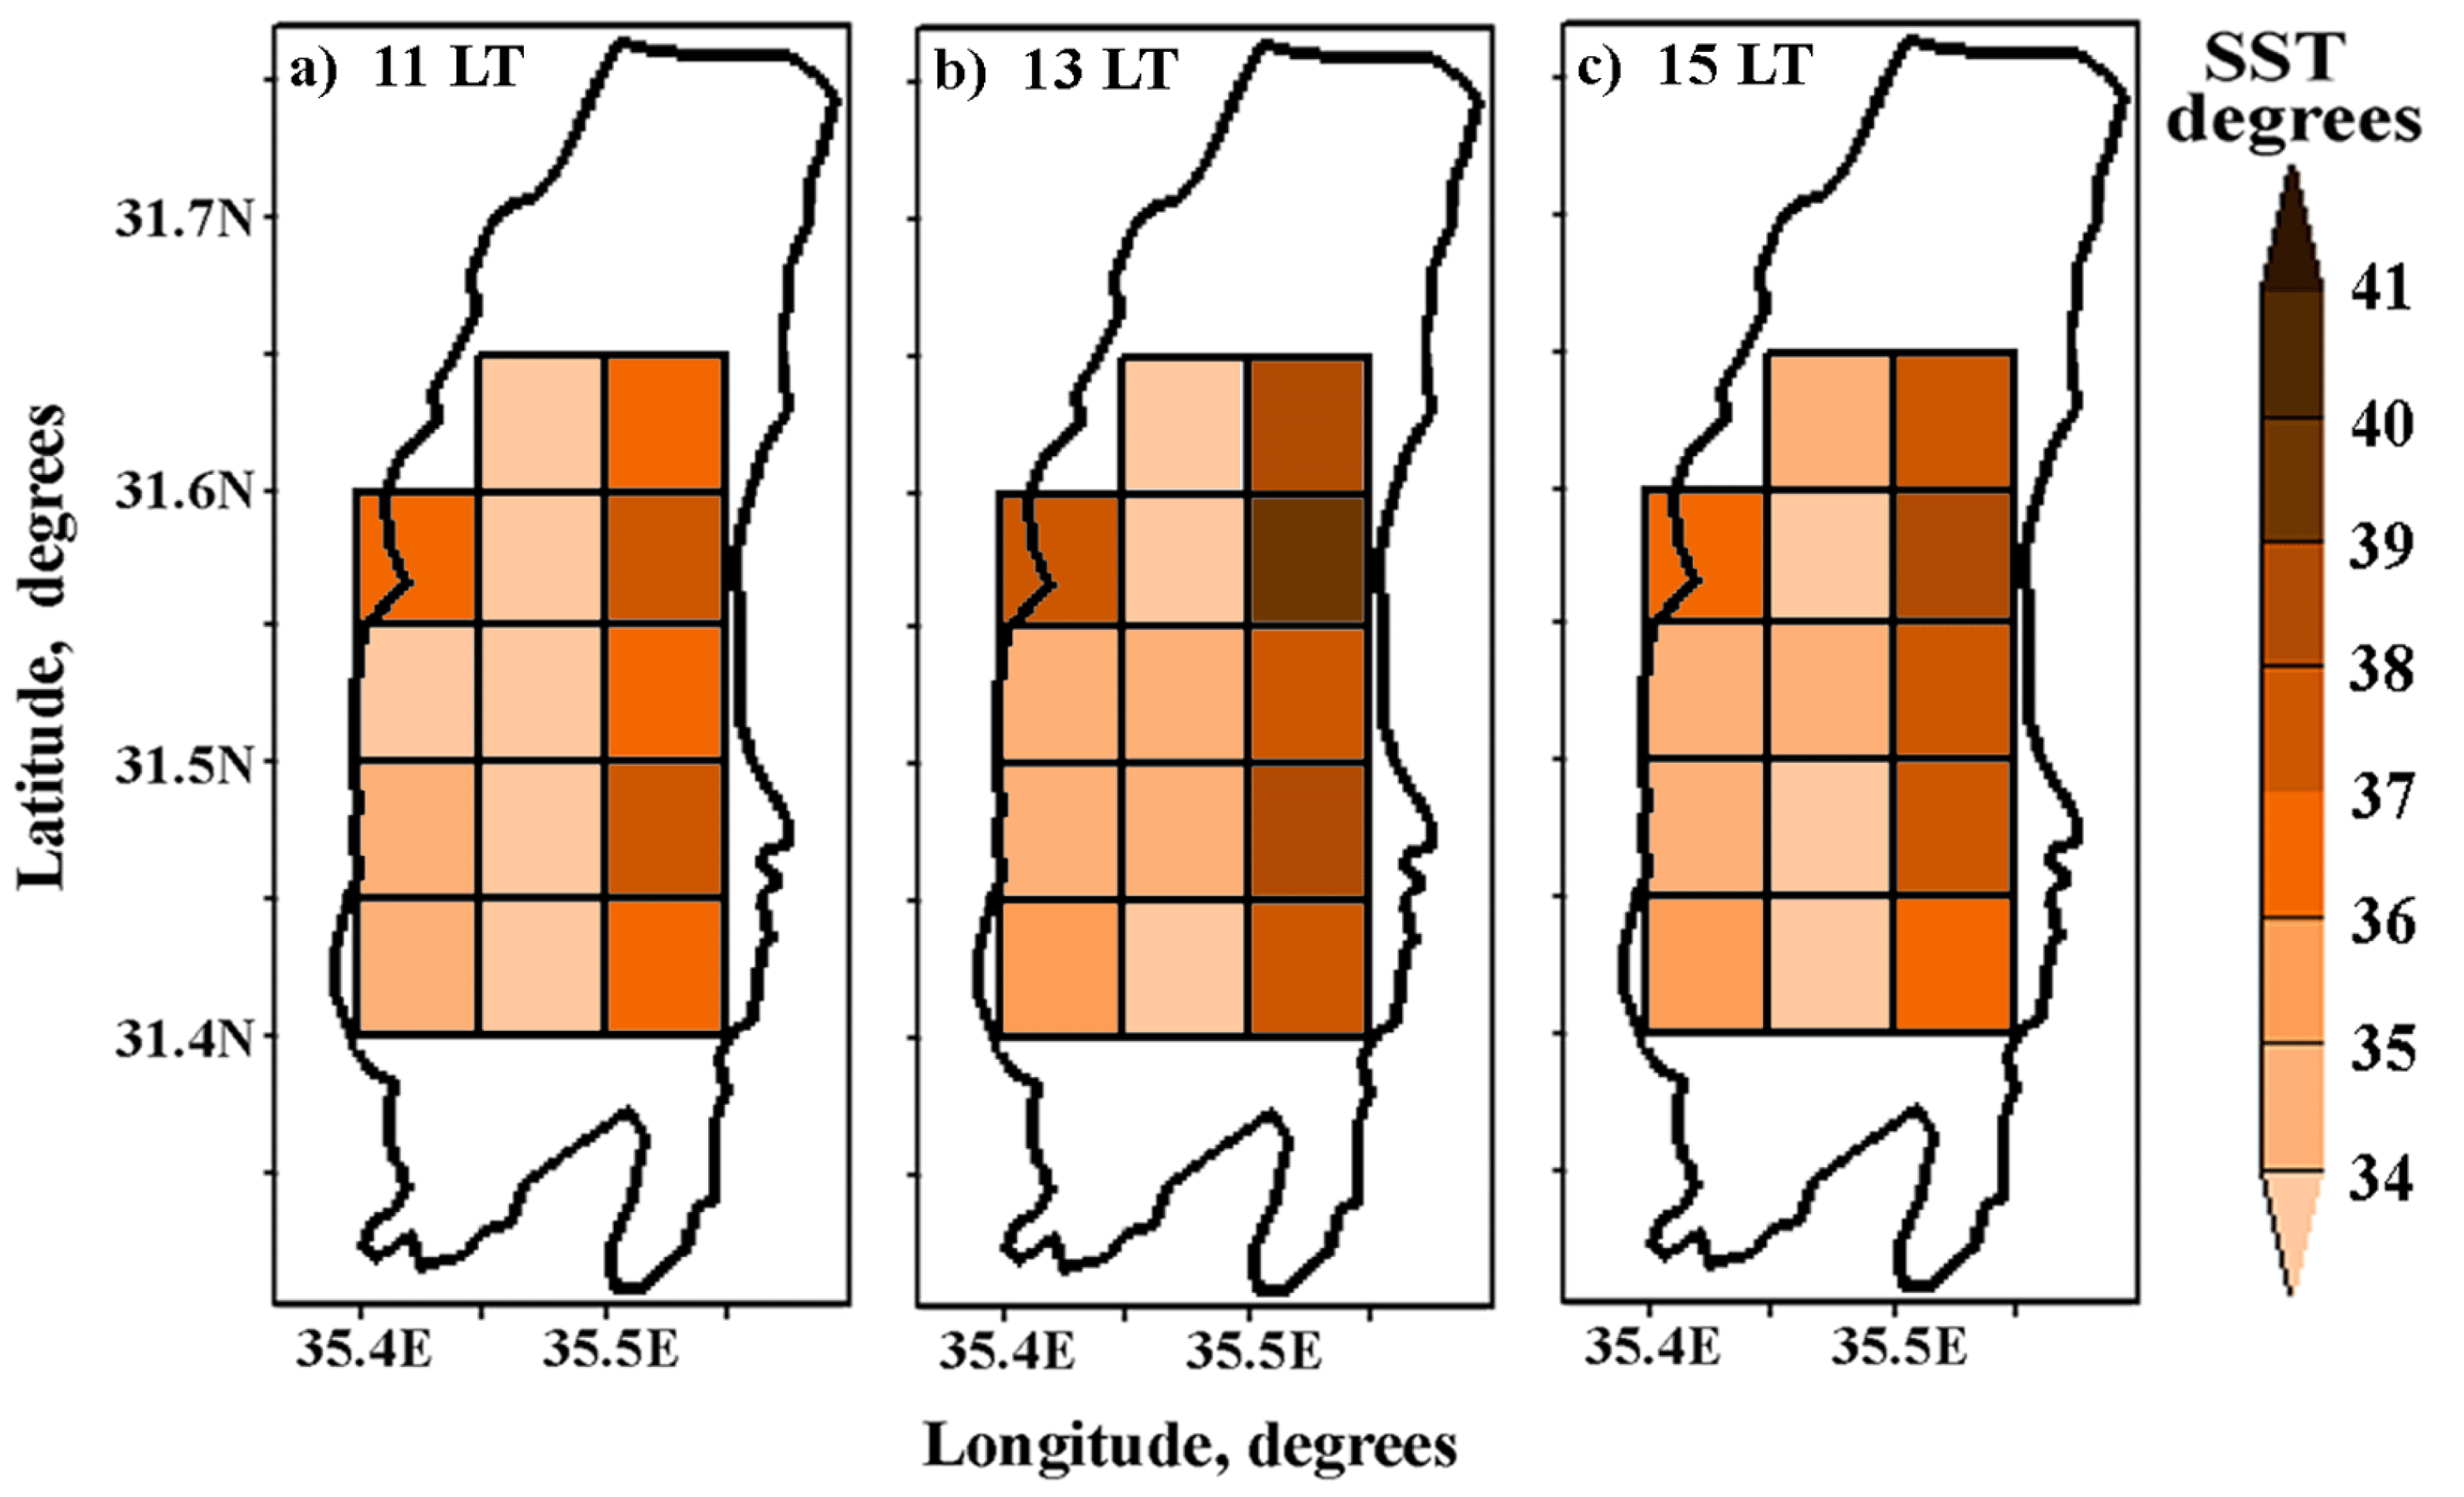
We investigated maps of spatial distribution of daytime SST in the summer months. Figure 6a–c represent the 11-year mean spatial heterogeneity in daytime SST, based on METEOSAT data. On these maps, SST is shown separately for each of the 14 pixels covering the east, middle, and west parts of the Dead Sea. One can see minimum SST over the pixels covering the middle part of the lake at 11 LT, 13 LT, and 15 LT. Moreover, over the pixels covering the east part of the Dead Sea, SST was essentially higher than that over the pixels covering the west part of the lake. The observed spatial heterogeneity in SST, based on METEOSAT data, was in line with that based on MODIS data on board the Terra and Aqua satellites [4].
3.3. Diurnal Cycle of Summer LST
We investigated diurnal cycles of LST separately over land areas adjacent to the east and west sides of the lake. METEOSAT showed that LST reached its diurnal maximum at the same time as SST (Figure 3 and Figure 7). We will give attention to this important finding in Section 4 Discussion.
At 13 LT, on average over the summer months, the diurnal maximum of land surface temperature was equal to 49.0 °C, 42.9 °C, 47.0 °C, and 50.0 °C for TLw2, TLw1, TLe1, and TLe2, respectively. These diurnal maxima over the land were essentially higher than those over the sea (Figure 5a and Figure 7).
In the nighttime, land surface temperatures decreased, reaching their diurnal minima one hour earlier than SST, at 5 LT (Figure 5b and Table A2). At 5 LT, on average over the summer months, the diurnal minima were equal to 25.0 °C, 29.9 °C, 27.8 °C, and 25.3 °C for TLw2, TLw1, TLe1, and TLw2, respectively. These diurnal minima of LST over land surfaces were lower than those of SST, indicating more pronounced cooling of land surface in the nighttime than that of sea surface (Figure 5b).
DTR of surface temperature over remote land areas were essentially higher than DTR of SST over the Dead Sea. The 11-year mean daily temperature range (DTR) of TLw2 (24.0 °C) was approximately equal to DTR of TLe2 (24.7 °C), while DTR of TLw1 (13 °C) was lower than that of TLe1 (19.2 °C) (Figure 5c). DTR values over remote land areas were essentially higher than DTR over the sea: by a factor of three than DTR of Te and by a factor of 10 than DTR of Tm.
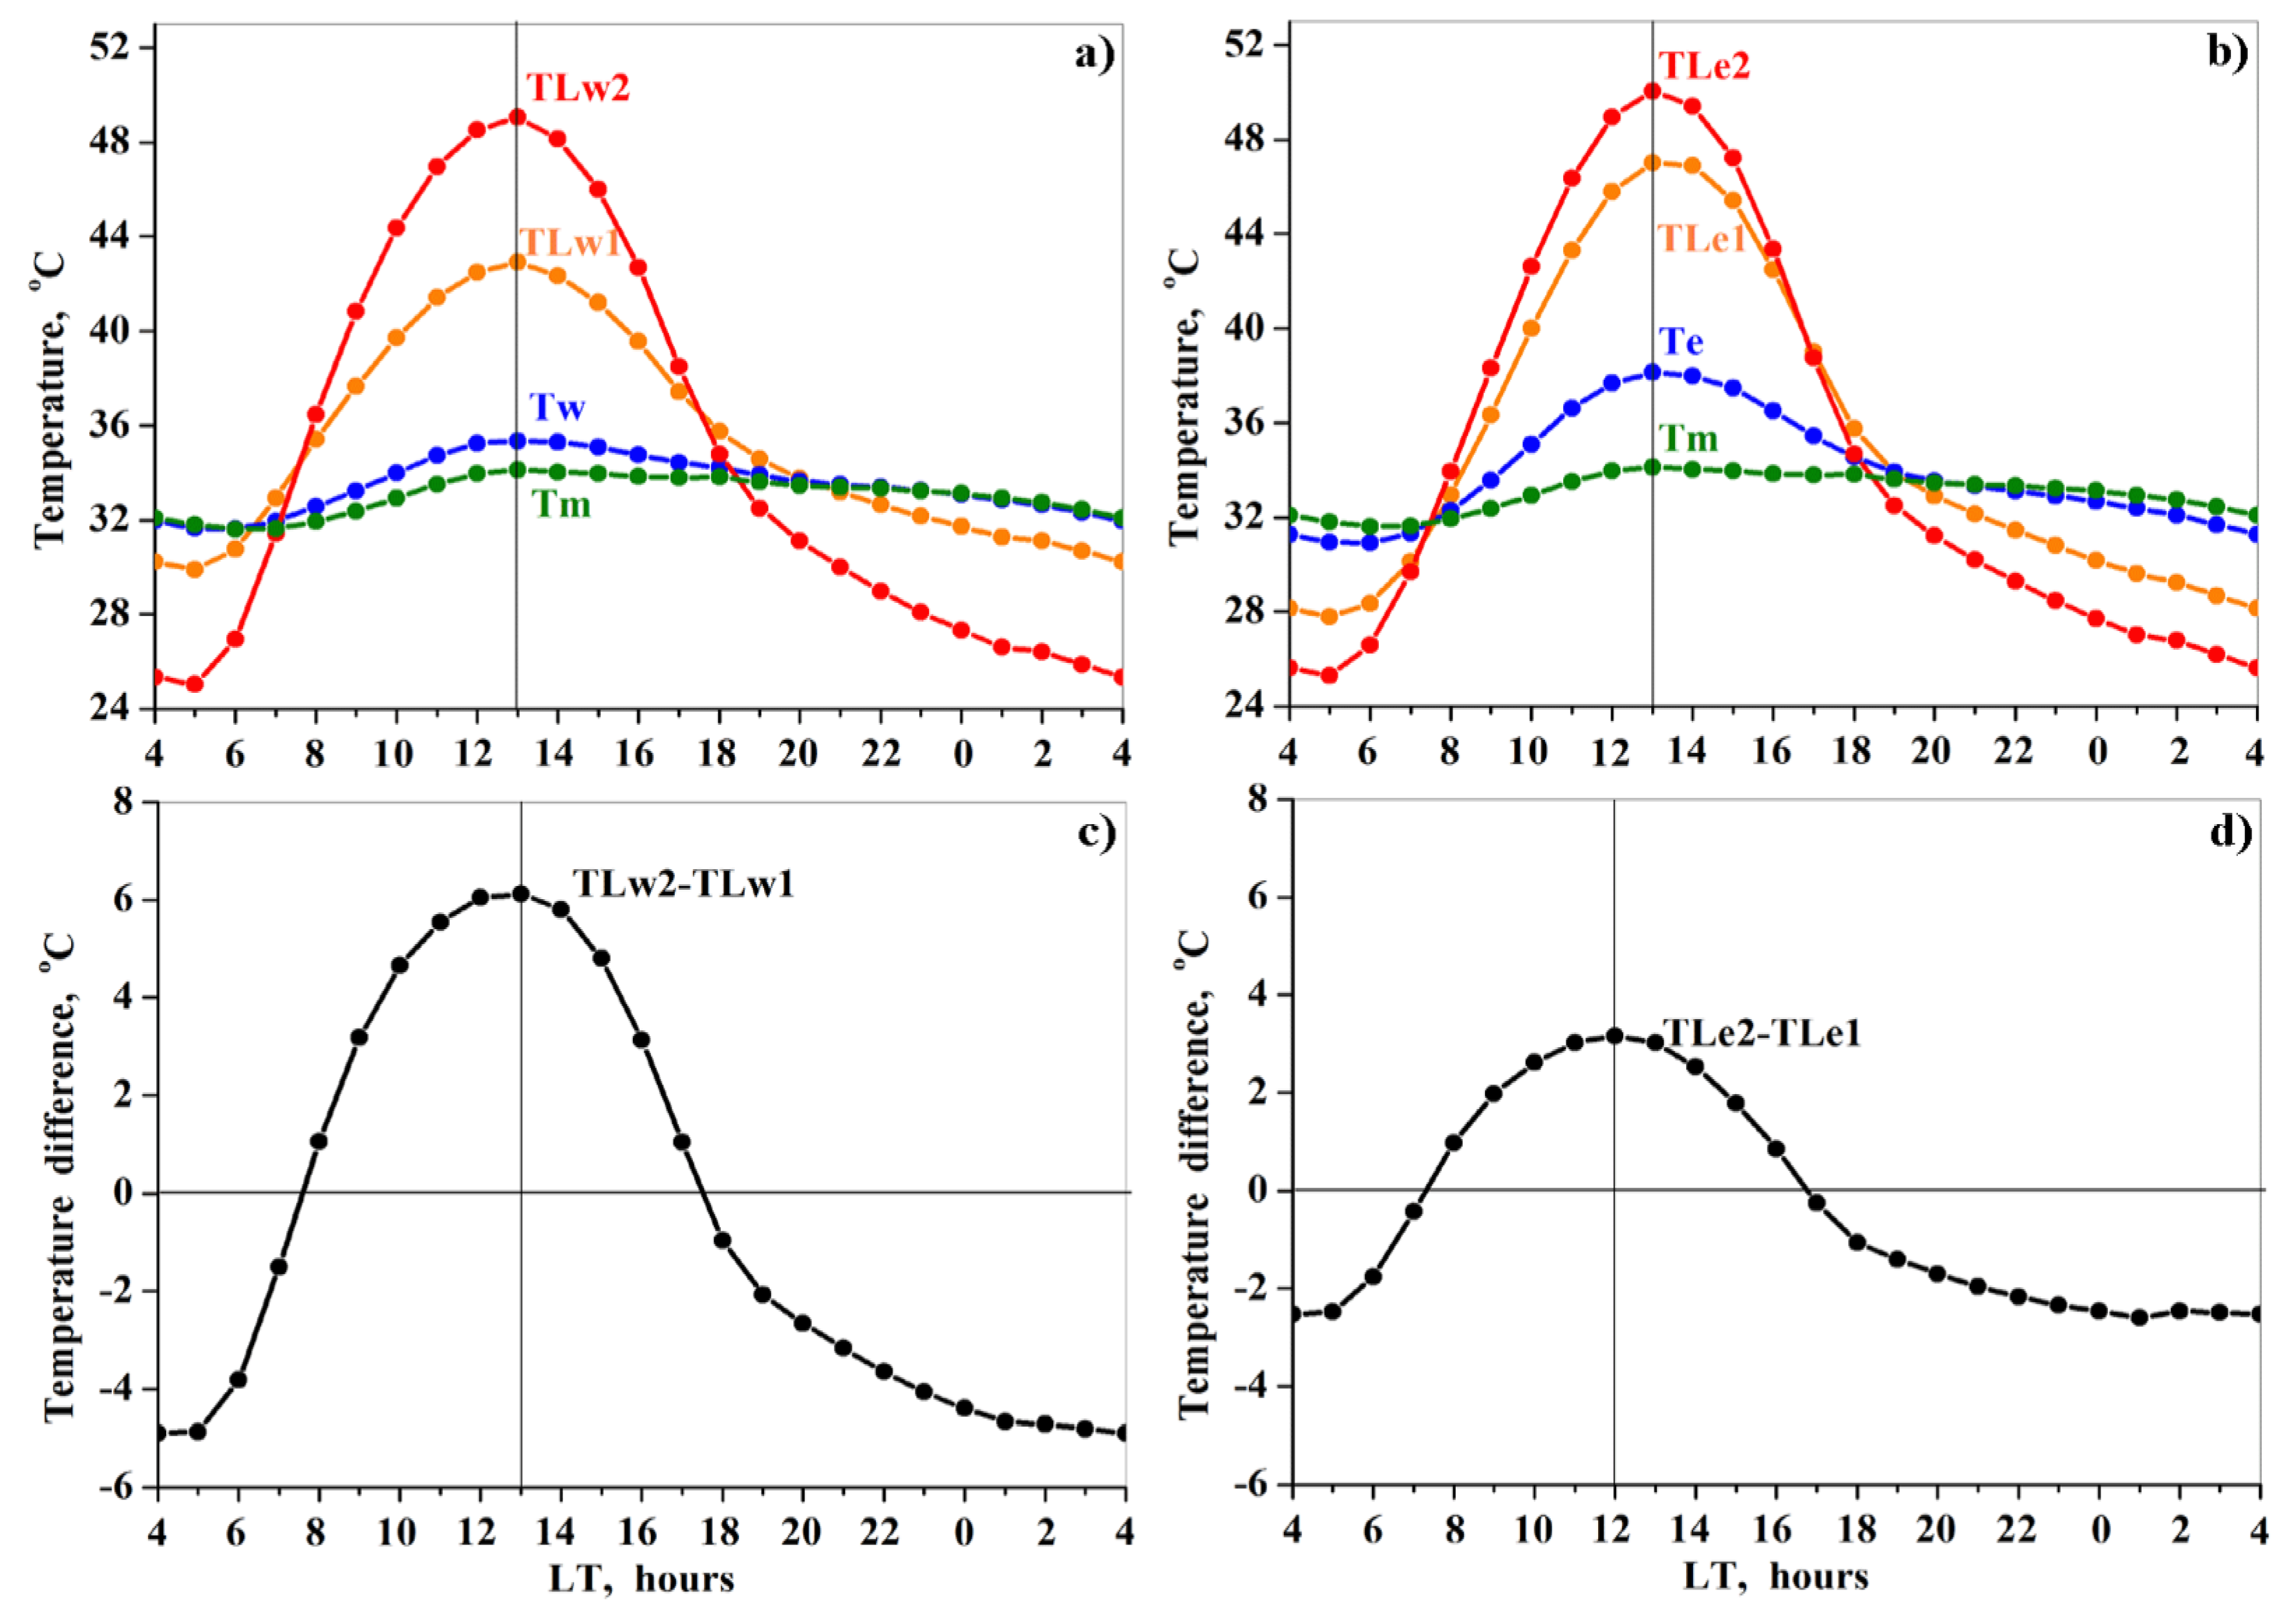
METEOSAT data showed that, in the summer months, the spatial non-uniformity in daytime SST caused a pronounced asymmetry in land surface temperature between land areas adjacent to the east (TLe1) and west (TLw1) sides of the lake. In particular, from 10 LT to 18 LT, TLe1 exceeded TLw1 (Figure 7a). At 13 LT, when TLe1 and TLw1 reached their diurnal maxima, the temperature difference (TLe1–TLw1) was equal to ~4 °C. In contrast, diurnal variations of surface temperature over land areas remote from the east and west parts of the Dead Sea behaved similarly, in spite of the presence of spatial non uniformity of SST. As shown in Figure 7b, the diurnal variations of TLe2 and TLw2 almost coincided, on average over the summer months. Therefore, surface temperatures over remote land areas (TLe2 and TLw2) were insensitive to the SST non-uniformity.
This situation when TLe1 and TLw1 were sensitive to the above mentioned SST spatial non-uniformity, whereas TLe2 and TLw2 were not sensitive to it should result in a difference in land surface temperature gradients over land areas at the east and west sides of the Dead Sea in the summer months. To this end, we analyzed diurnal variations of land surface temperature gradients using diurnal variations of temperature differences (TLe2–TLe1) and (TLw2–TLw1) (Figure 8).
We found that, at the west side of the Dead Sea, from 8 LT to 17 LT, the temperature difference (TLw2–TLw1) was positive, indicating the presence of daytime surface heat flow from land to sea (Figure 8c). At the east side, from 8 LT to 16 LT, the temperature difference (TLe2–TLe1) was also positive, indicating the presence of daytime surface heat flow from land to sea, similarly to the west side (Figure 8d). In the daytime in summer, diurnal variations of temperature differences (TLe2–TLe1) and (TLw2–TLw1) showed that the surface temperature difference at the west side (TLw2–TLw1) was larger than that at the east side (TLe2–TLe1) (Figure 8c,d). This implies that, in the daytime, surface heat flow from land to sea at the west side was stronger than at the east side. Therefore, heat flux from land to sea could not be responsible for the exceedance of Te over Tw.
In the nighttime, both temperature differences (TLw2–TLw1) and (TLe2–TLe1) were negative, indicating the presence of nighttime surface heat flow from sea to land at both west and east sides of the lake (Figure 8c,d).
3.4. Diurnal Cycle of Winter SST
In the DJF winter months (December, January, and February), pyranometer measurements from 2005 to 2015 in Sdom showed the 11-year mean diurnal cycle of solar insolation (Figure 2). One can see that solar insolation peaked at noon reaching ~500 W m−2, which was only half of the maximal solar insolation (~900 W m−2) in the summer months (Figure 2). The observed halving solar insolation in winter with respect to summer can be explained by the noticeable decrease in solar elevation angles: ~78° in July and ~35° in December.
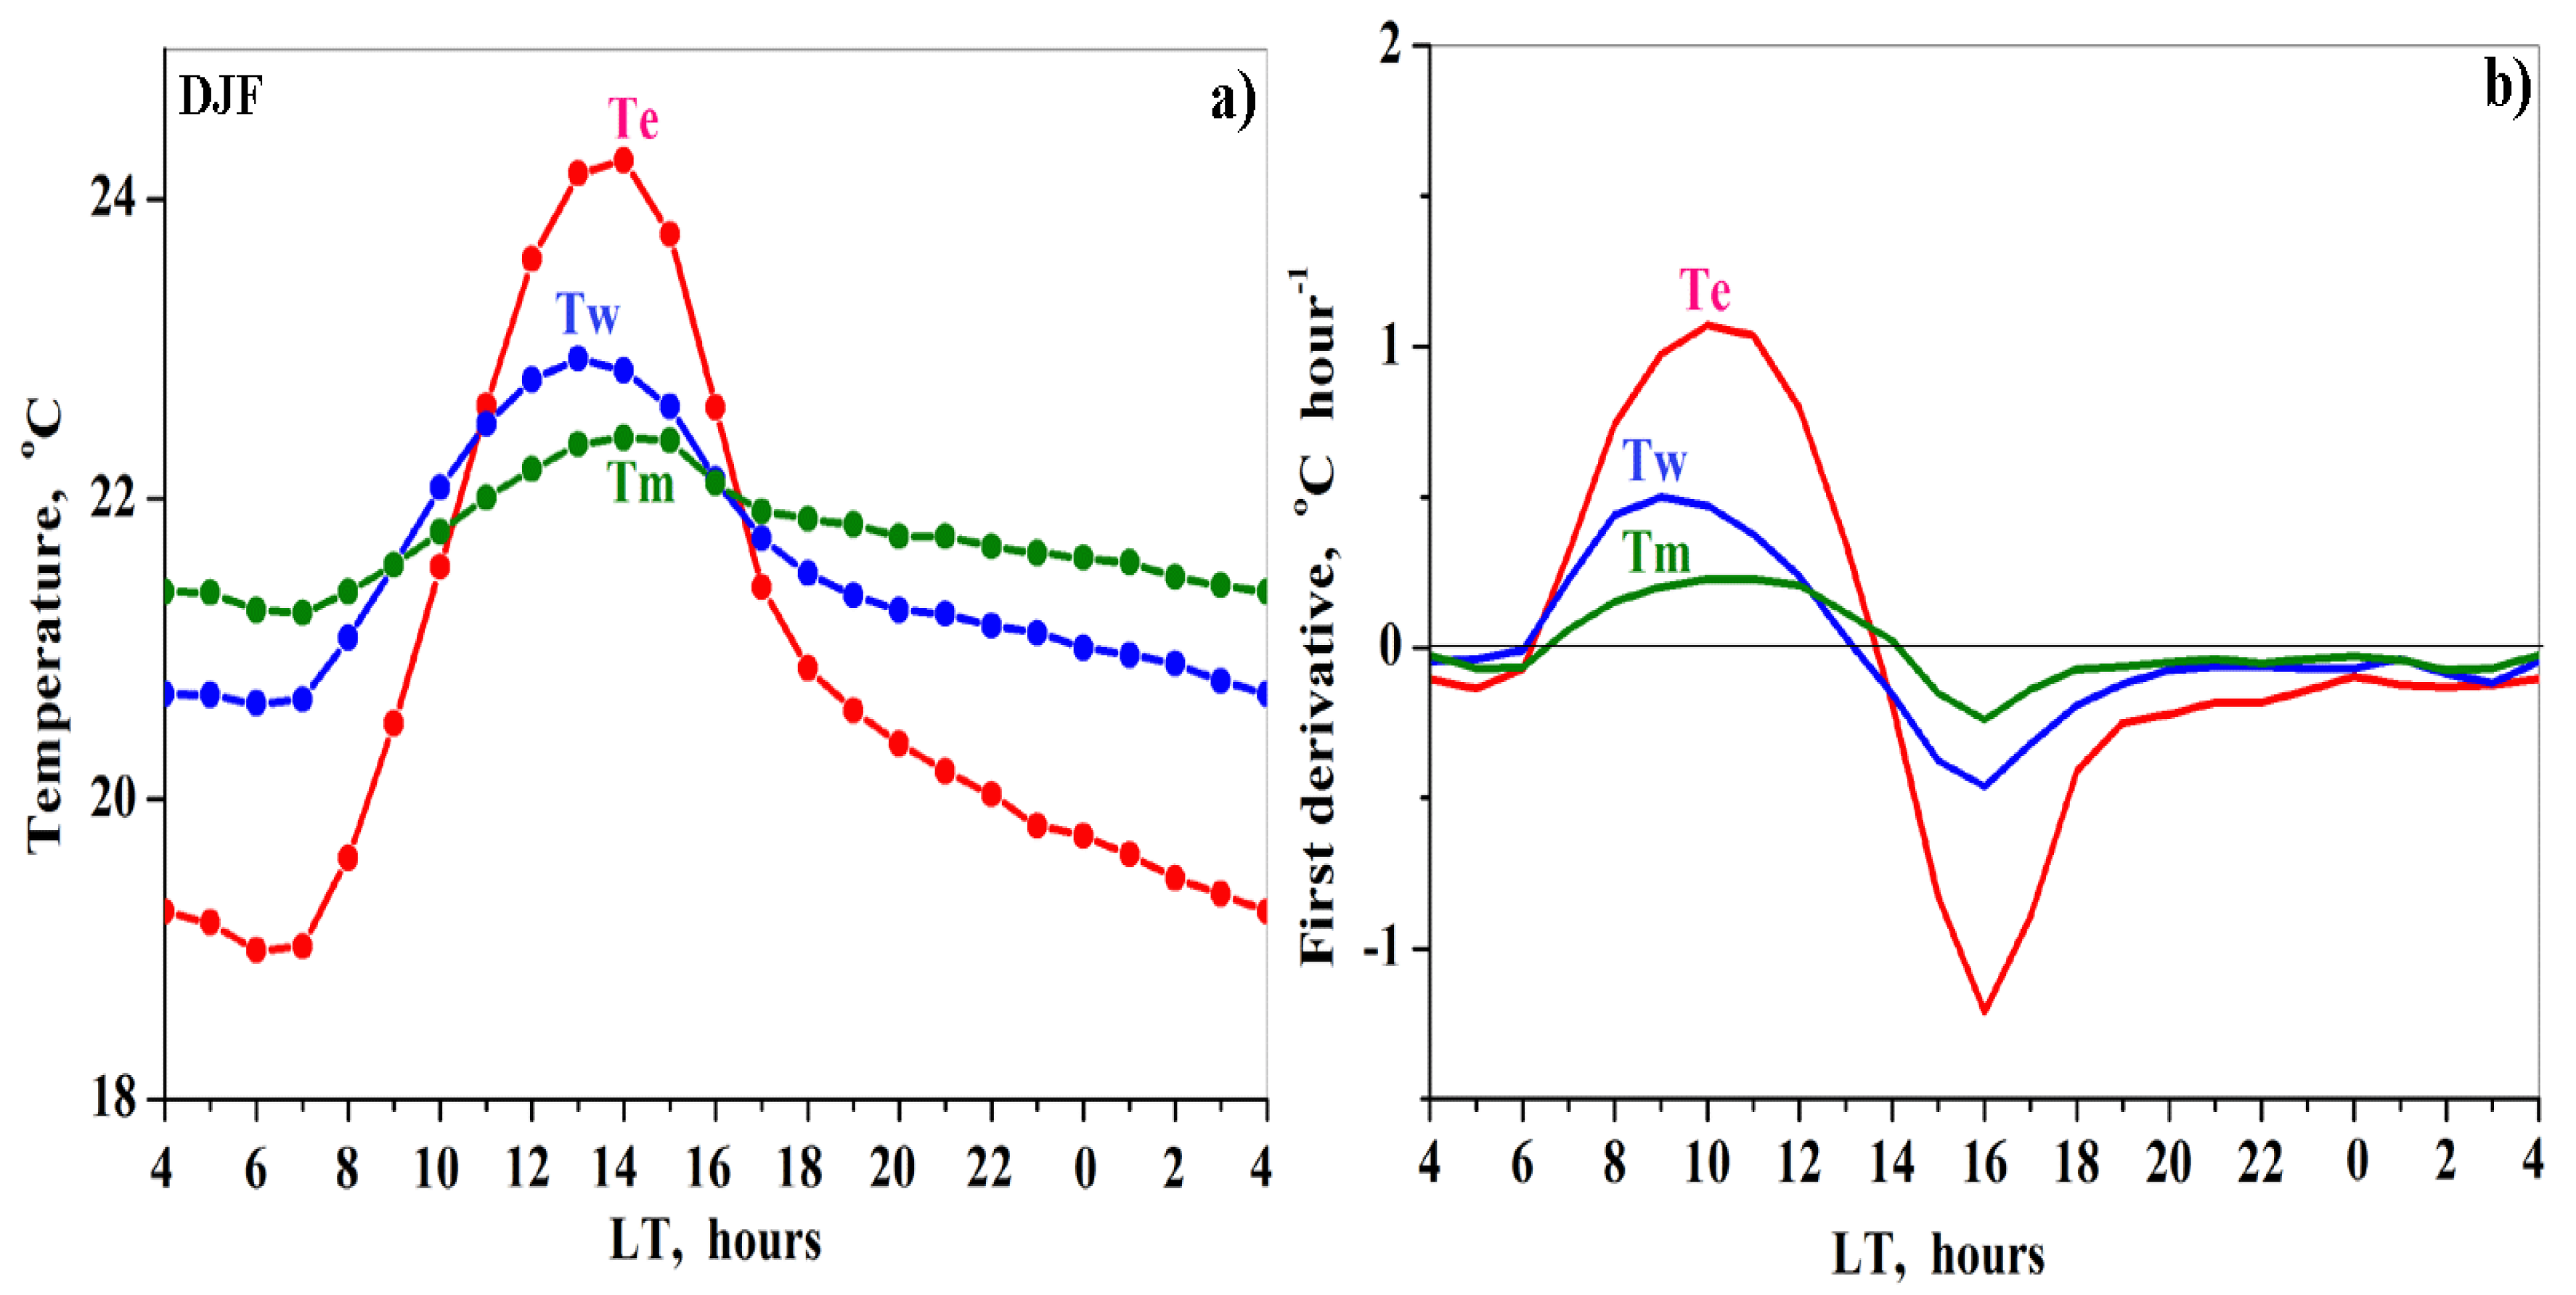
As for the spatial non-uniformity in daytime SST, our analysis of METEOSAT data revealed that this phenomenon was observed not only in summer but also in winter, although less pronounced. In winter, over all parts of the Dead Sea, diurnal variations of SST followed the solar cycle (Figure 9a,b).
Moreover, in contrast to summer (when SST over all parts of the Dead Sea peaked at the same time 13 LT), in winter, SST peaked not simultaneously over various parts of the Dead Sea. The maximum in SST over the west part of the Dead Sea (Tw) was observed at 13 LT, when Tw reached 22.9 °C (Figure 9a and Table A3). Over the east part, Te reached its maximum one hour later at 14 LT, when Te was equal to 24.3 °C. Over the middle part of the lake, Tm revealed a flat maximum from 13 LT to 15 LT when Tm was the same and equal to 22.4 °C (Figure 9a).
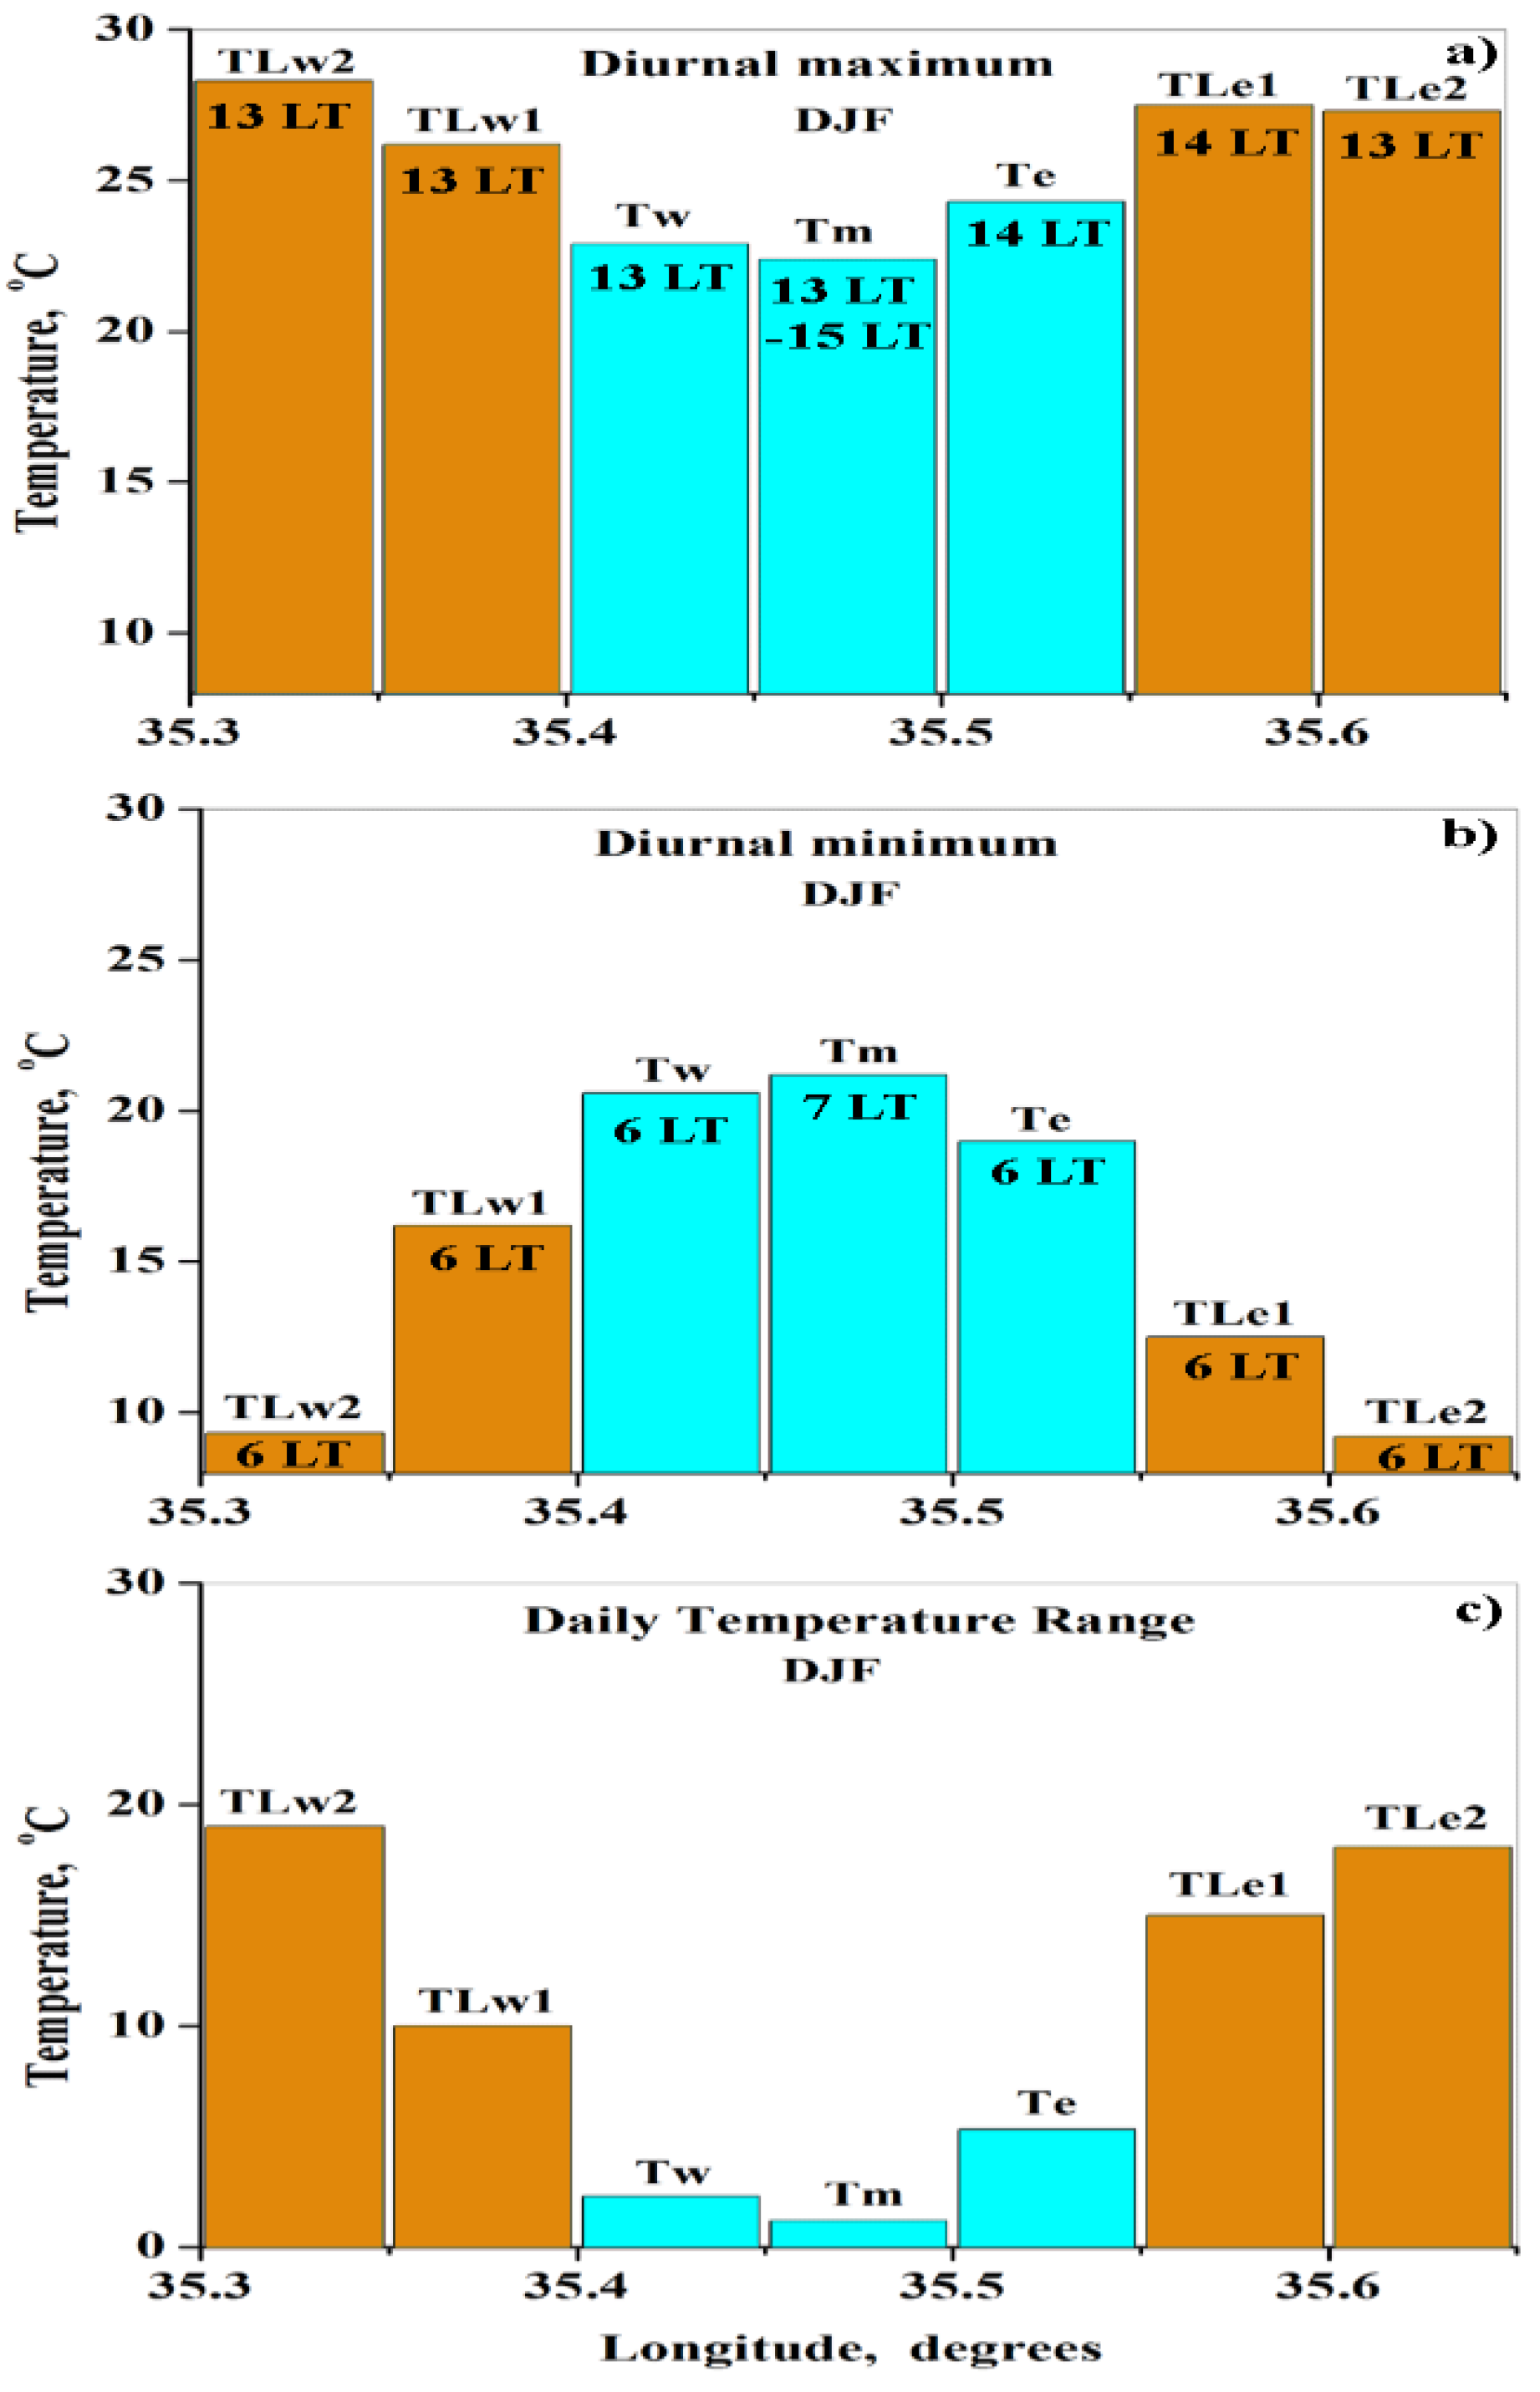
In winter, when maximal solar radiation reached ~500 W/m2 compared to ~900 W/m2 in summer, daytime SST non-uniformity was less pronounced than that in summer: at 13 LT, Tm was equal to 22.4 °C, which was lower than maxima of Tw (22.9 °C) and Te (24.2 °C) (Figure 10a and Table A3). In the nighttime in winter, mild spatial non-uniformity in SST was observed: at around 6 LT, SST was minimal and equal to 19.0 °C, 21.2 °C, and 20.6 °C over the east, middle, and west parts, respectively (Figure 10b and Table A3). The SST daily temperature range was equal to 7.2 °C, 2.5 °C, and 3.8 °C over the east, middle, and west parts of the Dead Sea, respectively, in summer, compared to 5.3 °C, 1.2 °C, and 2.3 °C in winter respectively (Figure 10c). The low DTR value over the middle part of the lake in winter indicated that water cooling due to evaporation to a large extent compensated for water heating due to solar radiation. Over the east part of the lake, where evaporation was minimal, water heating significantly exceeded water cooling in both summer and winter.
3.5. Diurnal Cycle of Winter LST
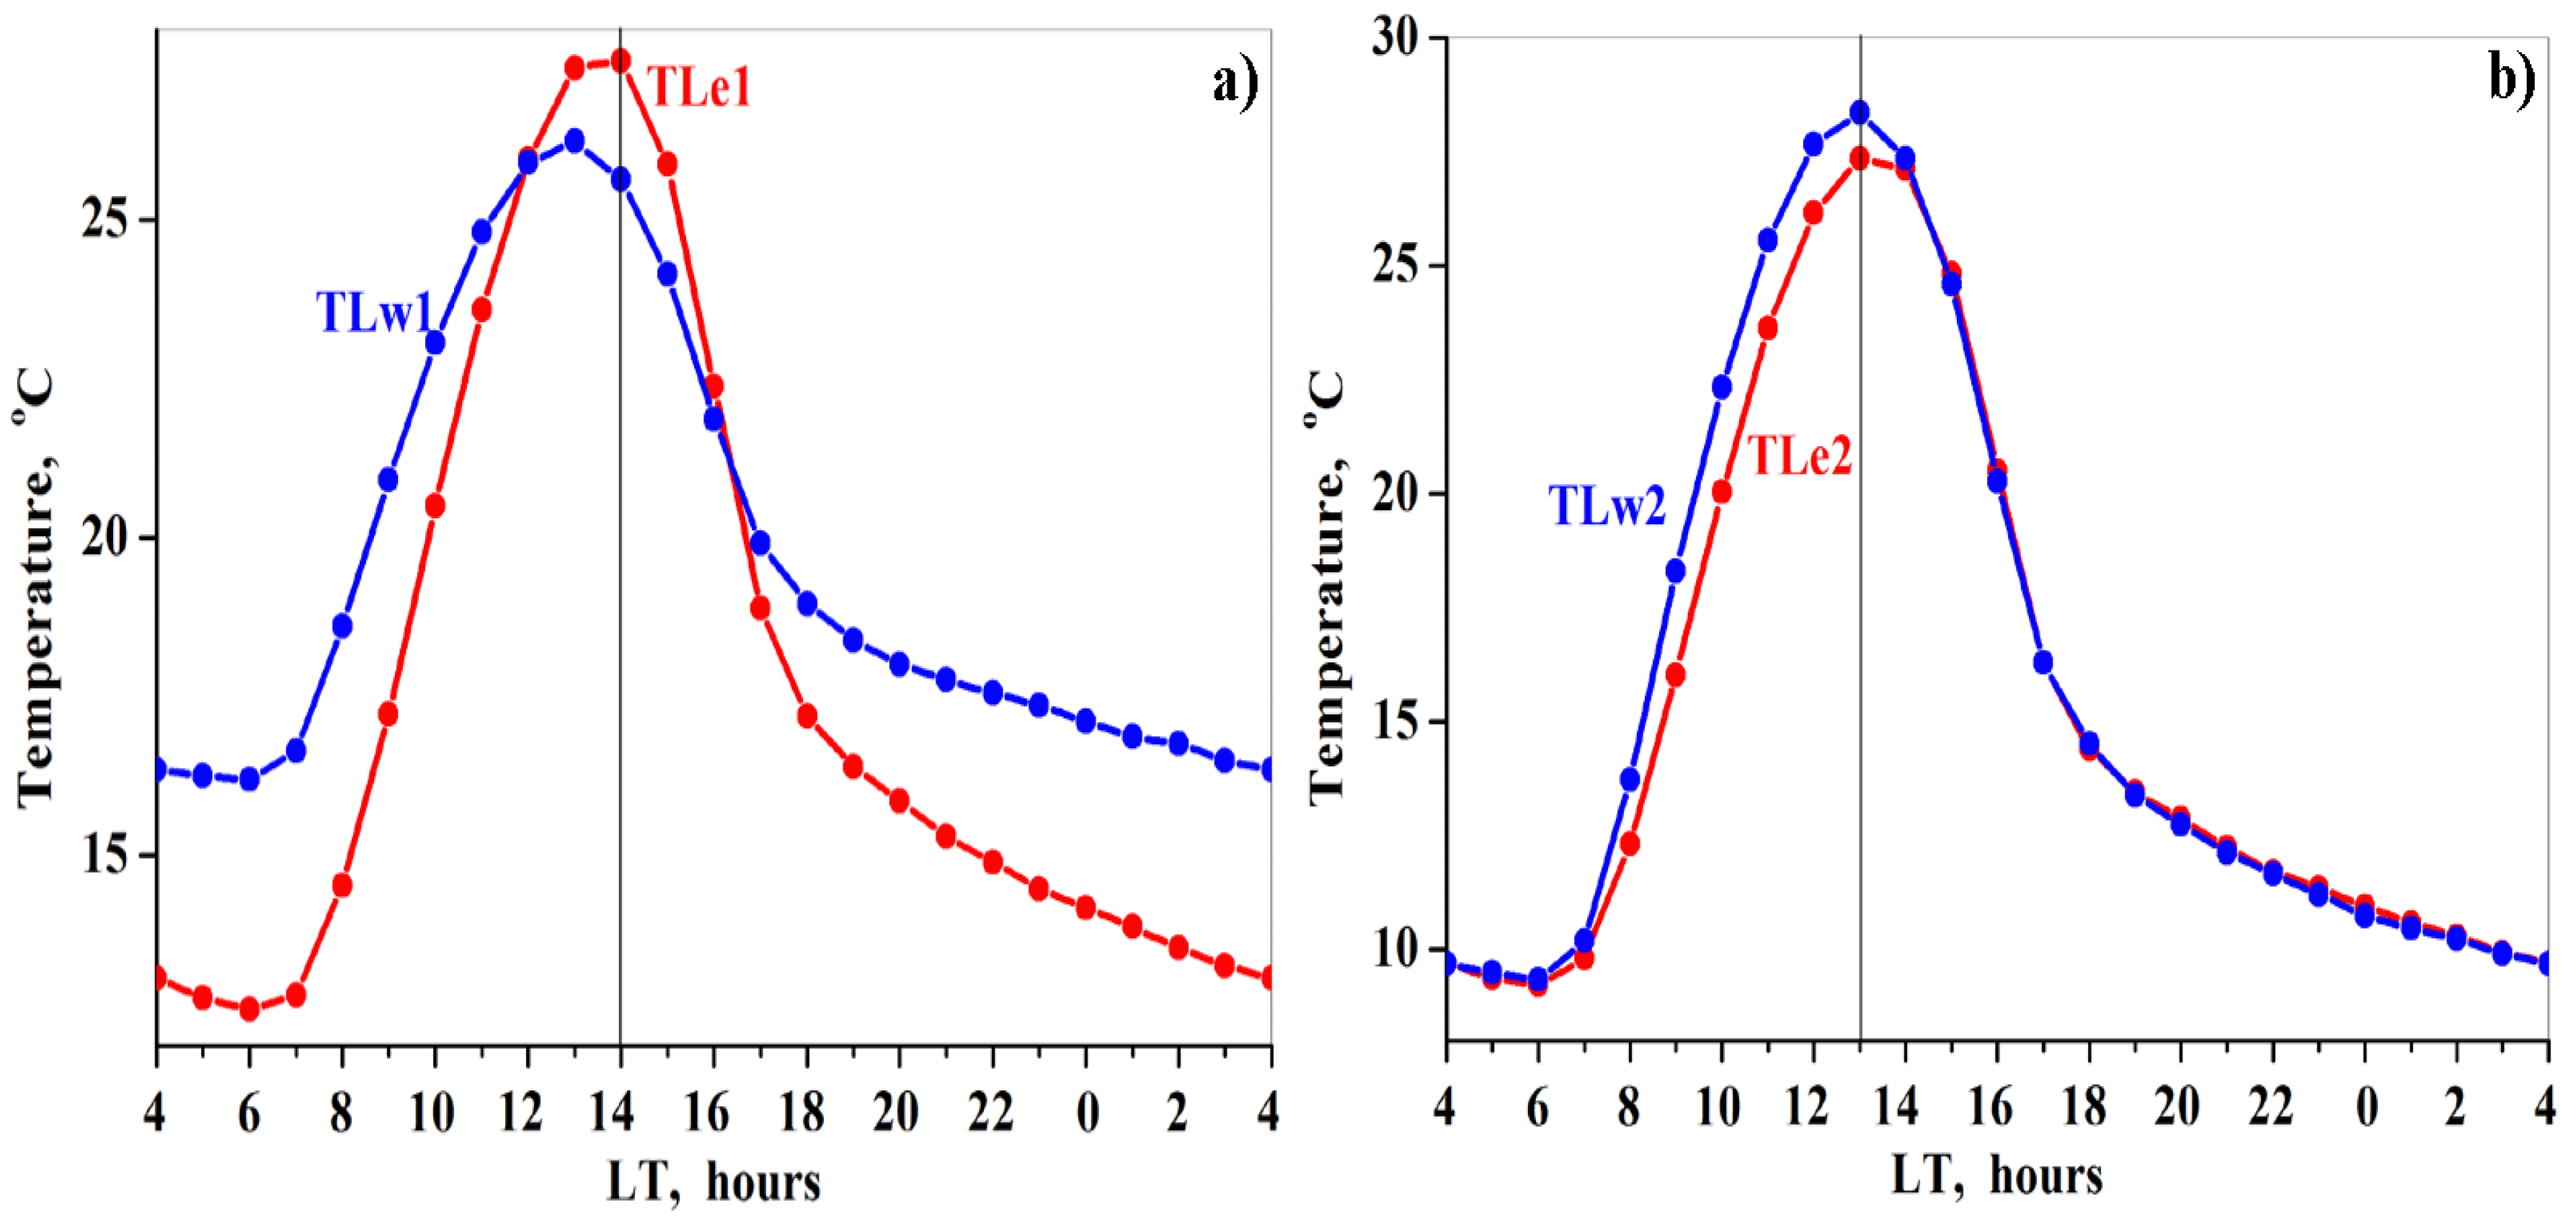
METEOSAT data showed that, similarly to summer, in winter, diurnal variations of surface temperature over land areas adjacent to the east and west side (TLe1 and TLw1) were sensitive to SST non-uniformity. The observed spatial asymmetry between daytime Te and Tw was accompanied by the asymmetry in land surface temperature between land areas adjacent to the east (TLe1) and west (TLw1) sides of the lake: TLe1 exceeded TLw1 from 12 LT to 15 LT (Figure 11a). Diurnal variations of surface temperature over land areas remote from the east and west side (TLe2 and TLw2) were insensitive to the SST non-uniformity. In particular, diurnal variations of TLe2 and TLw2 behaved similarly (Figure 11b).
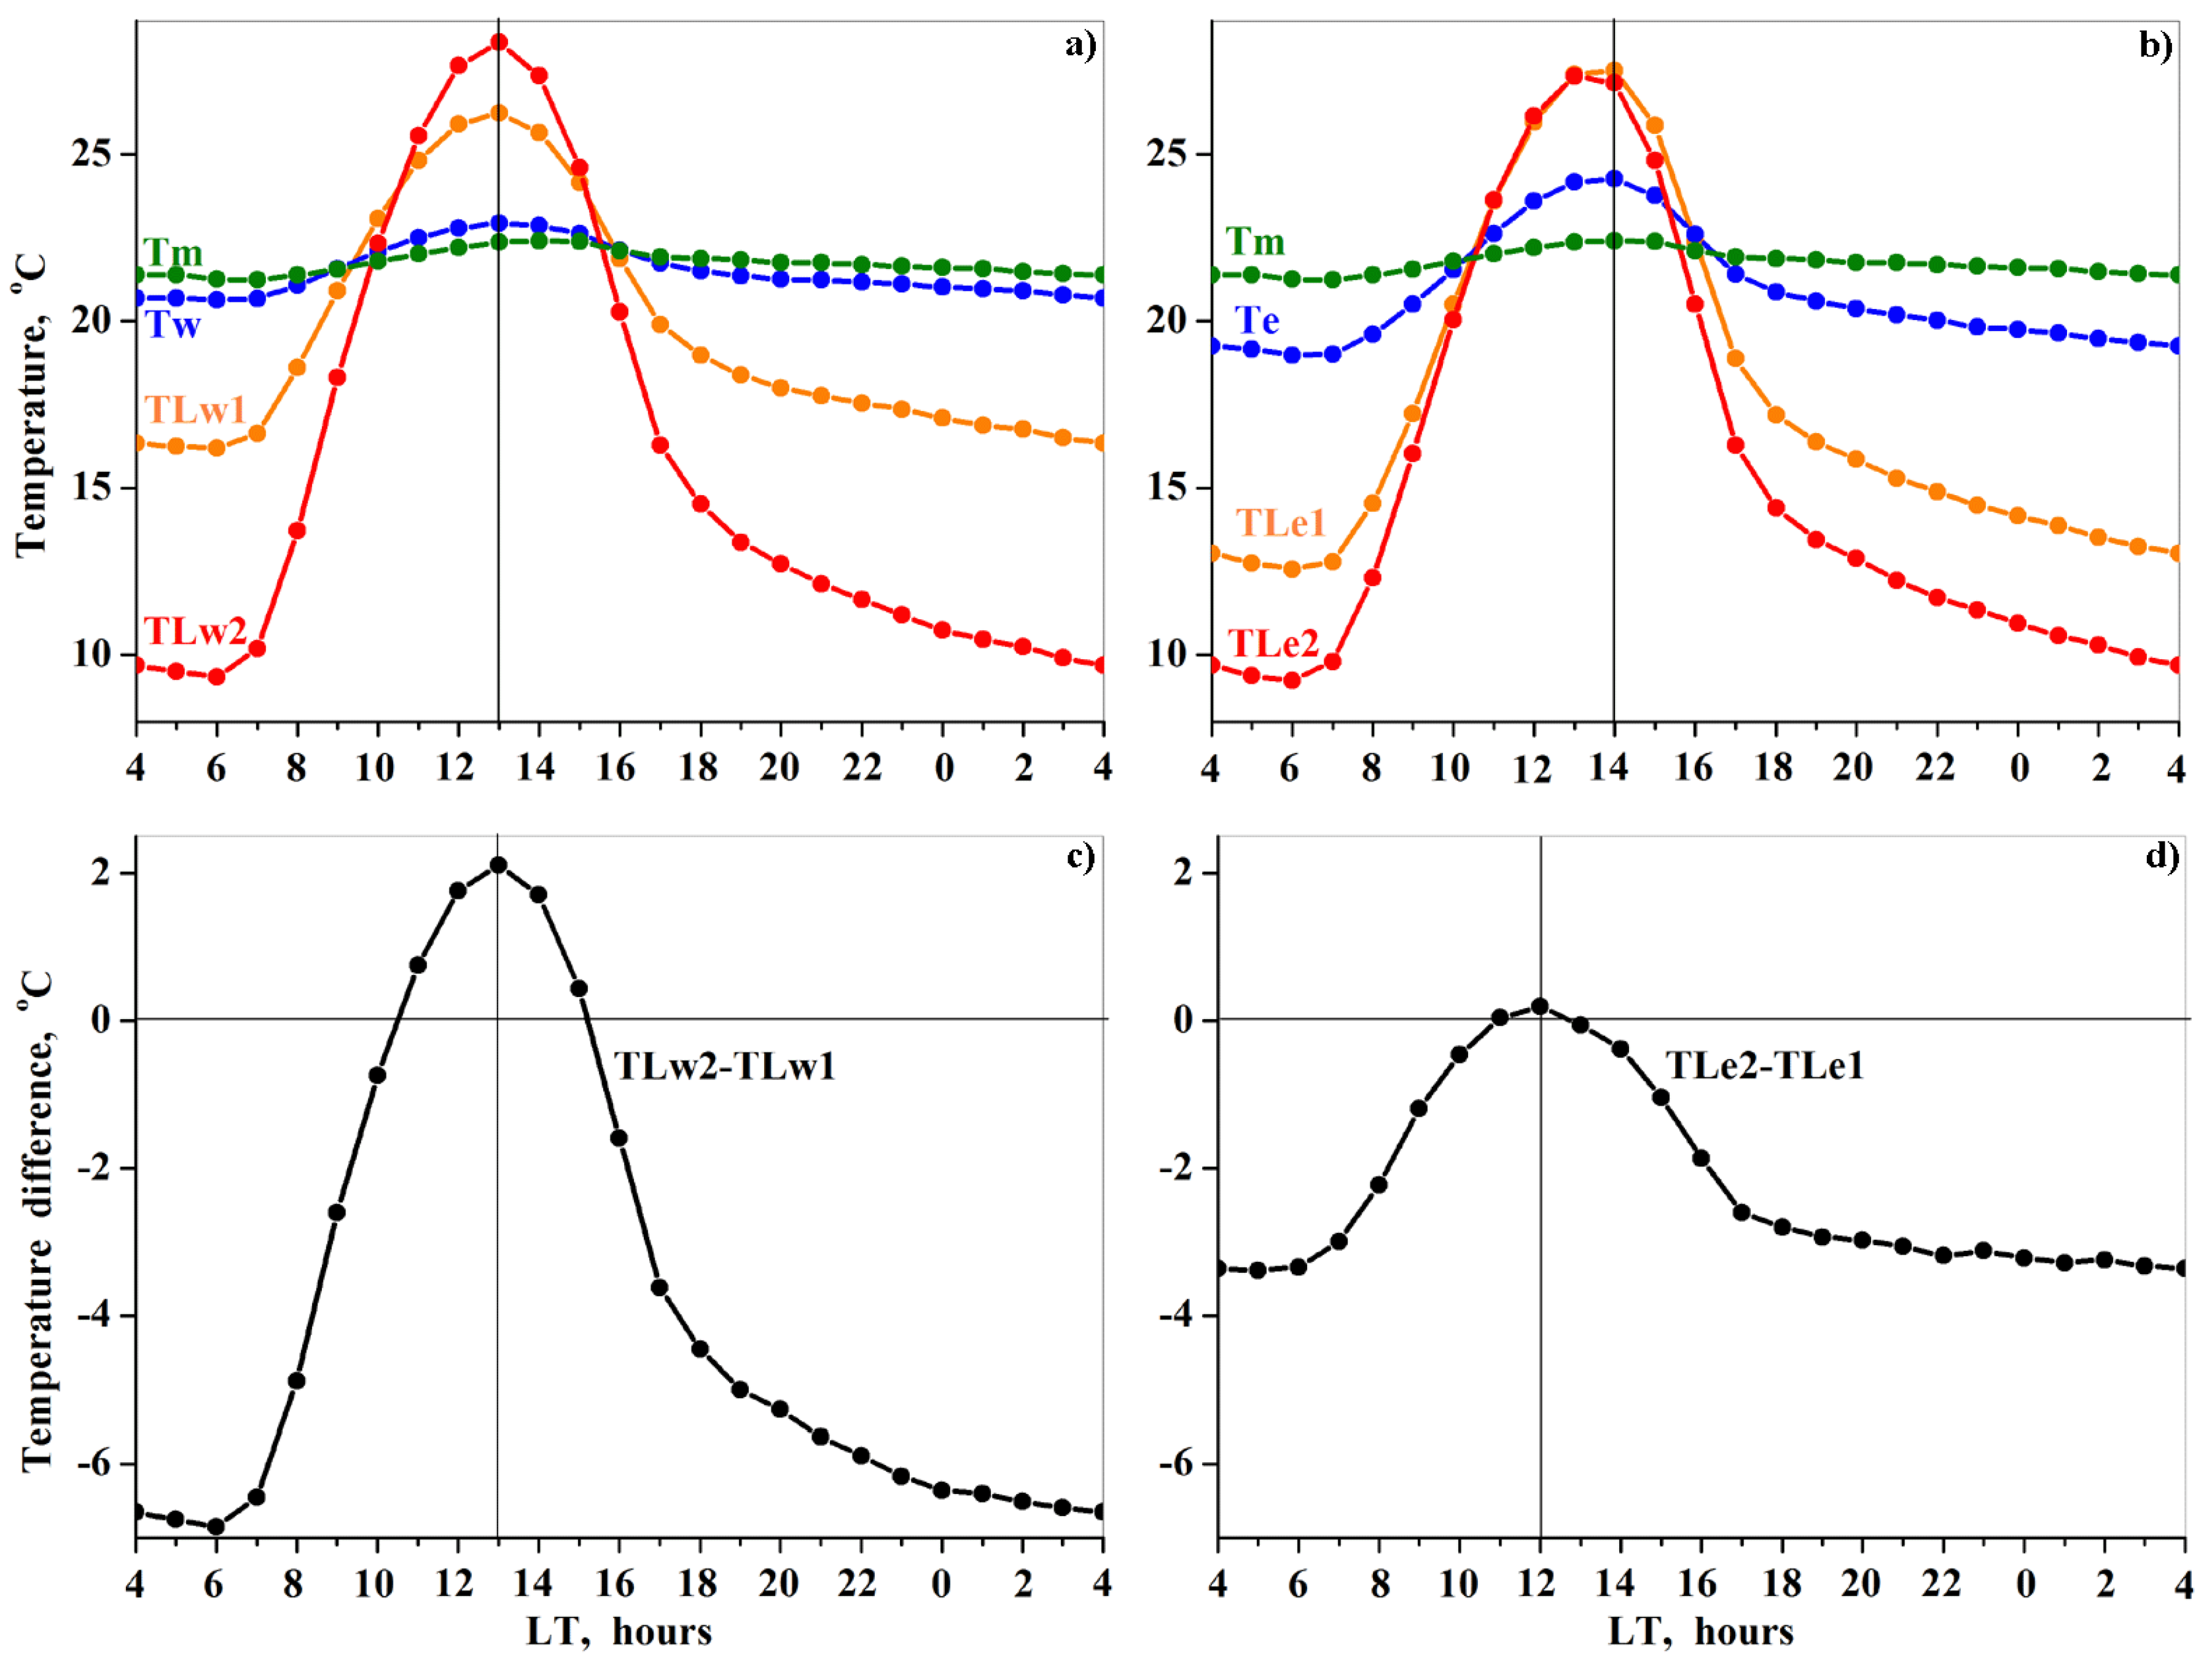
This situation in the winter months when TLe1 and TLw1 were sensitive to SST non-uniformity, whereas TLe2 and TLw2 were not sensitive to it should result in a difference in land surface temperature gradients over land areas at the east and west sides of the Dead Sea. We analyzed diurnal variations of land surface temperature gradients using those of temperature differences (TLe2–TLe1) and (TLw2–TLw1) (Figure 12).
At the west side of the Dead Sea, METEOSAT data showed that the temperature difference TLw2–TLw1 was positive from 11 LT to 15 LT, indicating the presence of daytime surface heat flow from land to sea (Figure 12c). This heat flow peaked at 13 LT, when the full sequence of surface heat transfer from land to sea was characterized by the following temperature conditions: at 13 LT, TLw2 (28.3 °C) > TLw1 (26.2 °C) > Tw (22.9 °C) (Figure 12a and Table A3).
At the east side, temperature differences between TLe2 and TLe1 were always negative or equal to zero, by contrast to the west side (Figure 12d). From 11 LT to 13 LT, METEOSAT data showed that there was no temperature difference between TLe2 and TLe1. In particular, at 11 LT, TLe2 (23.6 °C) = TLe1 (23.6 °C) while at 12 LT, TLe2 (26.1 °C) ≈ TLe1 (26.0 °C) (Figure 12b and Table A3). After 14 LT, METEOSAT data showed that the temperature difference (TLe2–TLe1) was even slightly negative (Figure 12d). For example, at 14 LT, TLe2 (27.1 °C) < TLe1 (27.5 °C), and at 15 LT, TLe2 (24.8 °C) < TLe1 (25.9 °C) (Table A3). This indicates the absence of noticeable daytime surface heat flow from land to sea at the east side and its presence at the west side. Although, METEOSAT showed that daytime Te exceeded Tw (Figure 12a,b).
4. Discussion
Note that there are no in situ measurements of spatial distribution of SST over the whole Dead Sea water area. Satellite data allowed us to investigate spatial distribution of SST. In our previous study by Kishcha et al. [4], MODIS data of 5 × 5 km resolution on board the Terra and Aqua satellites showed the presence of spatial heterogeneity in SST under uniform solar radiation in the summer months. In particular, MODIS showed that, on average for the 15-year study period (2002–2016), daytime SST at the east side of the lake exceeded by several degrees that at the west side. This SST heterogeneity was observed at 10:30 LT and 13:30 LT, when the Terra and Aqua satellites covered the Dead Sea [4]. The diurnal cycle of the observed SST heterogeneity has not been discussed so far. SEVIRI LST data on board the geostationary METEOSAT satellites provide us with the opportunity to investigate the diurnal cycle of spatial heterogeneity in Dead Sea SST. Using METEOSAT data, we found that spatial heterogeneity in SST, characterized by the exceedance of Te > Tw > Tm, was pronounced throughout the daytime.
We found that the above mentioned spatial heterogeneity in SST was not caused by vertical water mixing. Indeed, METEOSAT data showed that maxima of SST and LST over surrounding land areas were observed at the same time, 13 LT (Figure 8a,b; and Table A2). This was unexpected because, in contrast to LST, SST is essentially influenced by vertical water mixing. Due to thermal inertia, changes in water temperature in the layers below the surface are delayed with respect to SST. The deeper the layer, the longer the water temperature delay. In particular, at a depth of 1 m, water temperature peaks at ~17 LT, in accordance with buoy measurements, by Hecht and Gertman ([8], their Figure 20). The fact that METEOSAT-based LST and SST peaked at the same time, 13 LT, is evidence that, in the daytime in the summer months, there was no noticeable vertical water mixing. This finding is supported by the presence of thermal layering in the Dead Sea, from the water surface down to a depth of ~4 m, in the daytime in the summer months, in accordance with Nehorai et al. [15]. Our findings raise questions about causal factors of the observed spatial inhomogeneity in SST under uniform solar radiation in the summer months.
4.1. Explanaition of Spatial Inhomogeneity in SST
Our findings allowed us to consider that, in the absence of noticeable vertical water mixing and under uniformly distributed solar radiation, the obtained spatial inhomogeneity in SST: Te > Tw > Tm (Figure 3a) was associated with intralake heterogeneity in evaporation, but not with heat flow from land to sea. Specifically, we consider that minimal SST at the middle part of the Dead Sea was associated with maximal evaporation (causing maximal surface water cooling), while maximal SST at the east side of the lake was associated with minimal evaporation.
As mentioned in Section 2, surface heat flux from land to sea is proportional to the temperature gradient between LST over remote land areas (TLe2, TLw2) and LST over land areas adjacent to the lake (TLe1, TLw1). In the daytime, in the summer months, METEOSAT data showed that Tw was lower than Te. This was despite the fact that the heat flow from land to sea at the west side (proportional to the temperature difference TLw2–TLw1) was higher than the heat flow from land to sea at the east side (proportional to the temperature difference TLe2–TLe1) (Figure 8c,d). This is in line with our previous paper based on MODIS LST data on board the two orbital satellites Terra and Aqua, by Kishcha et al. [4]. Therefore, heat flux from land to sea could not be responsible for the exceedance of Te over Tw. Evaporation was the main causal factor of the observed spatial heterogeneity of Dead Sea SST, in the summer months. Note that, in the nighttime, both temperature differences (TLw2–TLw1) and (TLe2–TLe1) were negative, indicating the presence of nighttime surface heat flow from sea to land at both west and east sides of the lake (Figure 8c,d).
Both SST and LST are determined not only by solar radiation but also by net long-wave thermal radiation. The cumulative effect of both solar radiation and net long-wave thermal radiation leads to the maximum in SST and LST at 13 LT, in accordance with the METEOSAT measurements. This explains the one-hour delay between the maximum solar insolation (measured by the pyranometer at 12 LT) and the maxima SST and LST. Note that the pyranometer measures solar radiation flux within the interval of wavelengths from 0.285 µm to 2.8 µm; the pyranometer is insensitive to the above-mentioned long-wave thermal radiation flux. We consider that outgoing long-wave thermal radiation cannot be responsible for the observed asymmetry in SST between the east and west sides of Dead Sea SST. Indeed, as Te > Tw, outgoing long-wave thermal radiation from the water surface at the east side of the Dead Sea was higher than that at the west side of the lake. Despite this higher radiative cooling at the east side than at the west side, Te exceeded Tw.
5. Conclusions
In this study we investigated the diurnal cycle of spatial heterogeneity in Dead Sea SST using METEOSAT geostationary satellite data (2005–2015). METEOSAT showed that spatial heterogeneity in SST was pronounced throughout the daytime. In summer, SST peaked at 13 LT, when SST reached 38.1 °C, 34.1 °C, and 35.4 °C being averaged over the east, middle, and west parts of the lake, respectively. The above mentioned spatial heterogeneity in daytime SST caused a pronounced asymmetry in land surface temperature between land areas adjacent to the east and west sides of the lake. In the nighttime, METEOSAT data showed that SST values were minimal and SST spatial distribution was much more uniform compared to the daytime. We found that, in winter, when maximal solar radiation reached ~500 W/m2 compared to ~900 W/m2 in summer, daytime SST non-uniformity was less pronounced than that in summer. As the characteristic feature of the diurnal cycle, SST daily temperature range was equal to 7.2 °C, 2.5 °C, and 3.8 °C over the east, middle and west parts of the Dead Sea, respectively, in summer, compared to 5.3 °C, 1.2 °C, and 2.3 °C in winter.
METEOSAT data showed that, in the summer months, LST over surrounding land areas peaked at the same time, 13 LT, as SST. In the presence of water mixing, the maximum of SST should be observed several hours later than that of LST due to thermal inertia of bulk water. The fact that SST and LST peaked at the same time, 13 LT, is evidence that there was no noticeable vertical water mixing. We consider that, in the absence of noticeable water mixing and under uniform solar radiation in the summer months, inhomogeneity in evaporation was the main causal factor of the observed spatial heterogeneity in Dead Sea SST (shown in Figure 6a–c). Maximal evaporation (causing maximal surface water cooling) took place at the middle part of the Dead Sea, while minimum evaporation took place at the east side of the lake.
Evaporation causes significant drying up of the Dead Sea, especially in the summer months, as the main contributor to maximal water level drop in the lake [1,12]. However, no measurements of spatial distribution of Dead Sea evaporation have ever been conducted. Our findings allowed us to visualize intralake heterogeneity in evaporation using the obtained spatial inhomogeneity in Dead Sea SST.
Author Contributions
Both co-authors equally contributed to methodology and writing of the current research article, P.K. and B.S. All authors have read and agreed to the published version of the manuscript.
Funding
This research received no external funding.
Institutional Review Board Statement
Not applicable.
Informed Consent Statement
Not applicable.
Data Availability Statement
Acknowledgments
We thank the Satellite Application Facility on Climate Monitoring (CM SAF) team for METEOSAT LST records [14]. We thank the Israel Meteorological Service for hourly measurements of 2-m air temperature and pyranometer measurements of surface solar radiation during the 11-year study period taken at the Ein Gedi SPA meteorological station [17]. We thank all reviewers for their helpful comments.
Conflicts of Interest
The authors declare no conflict of interest.
Appendix A

Table A1.
Diurnal variations of 11-year mean surface solar radiation and air temperature, averaged over the summer and winter months, together with their standard deviations.
Table A1.
Diurnal variations of 11-year mean surface solar radiation and air temperature, averaged over the summer and winter months, together with their standard deviations.
| LT, Hours | Surface Solar Radiation (W m−2) | Air Temperature (°C) | ||
|---|---|---|---|---|
| Summer | Winter | Summer | Winter | |
| 1 | 0 ± 0 | 0 ± 0 | 31.7 ± 1.0 | 18.1 ± 1.0 |
| 2 | 0 ± 0 | 0 ± 0 | 31.2 ± 0.9 | 17.8 ± 1.0 |
| 3 | 0 ± 0 | 0 ± 0 | 30.8 ± 0.9 | 17.5 ± 1.0 |
| 4 | 0 ± 0 | 0 ± 0 | 30.4 ± 0.9 | 17.2 ± 1.0 |
| 5 | 0 ± 0 | 0 ± 0 | 30.1 ± 0.9 | 17.0 ± 1.0 |
| 6 | 78 ± 30 | 0 ± 0 | 30.5 ± 0.9 | 16.7 ± 1.0 |
| 7 | 260 ± 45 | 25 ± 10 | 31.7 ± 0.9 | 16.7 ± 1.0 |
| 8 | 468 ± 45 | 152 ± 30 | 32.3 ± 0.9 | 17.9 ± 1.0 |
| 9 | 661 ± 50 | 306 ± 45 | 32.8 ± 0.9 | 19.0 ± 1.0 |
| 10 | 814 ± 50 | 425 ± 55 | 33.5 ± 0.9 | 19.9 ± 1.0 |
| 11 | 896 ± 50 | 502 ± 60 | 34.3 ± 0.9 | 20.6 ± 1.0 |
| 12 | 916 ± 60 | 522 ± 60 | 35.1 ± 0.9 | 21.2 ± 1.0 |
| 13 | 863 ± 60 | 477 ± 60 | 36.0 ± 0.9 | 21.7 ± 1.0 |
| 14 | 742 ± 60 | 381 ± 60 | 36.7 ± 1.0 | 22.0 ± 1.0 |
| 15 | 557 ± 60 | 239 ± 60 | 37.1 ± 1.0 | 22.1 ± 1.0 |
| 16 | 343 ± 60 | 103 ± 40 | 37.2 ± 1.0 | 21.9 ± 1.0 |
| 17 | 147 ± 60 | 0 ± 0 | 37.0 ± 1.0 | 21.0 ± 1.0 |
| 18 | 44 ± 15 | 0 ± 0 | 36.4 ± 1.0 | 20.3 ± 1.0 |
| 19 | 0 ± 0 | 0 ± 0 | 35.9 ± 1.0 | 19.8 ± 1.0 |
| 20 | 0 ± 0 | 0 ± 0 | 35.3 ± 1.0 | 19.5 ± 1.0 |
| 21 | 0 ± 0 | 0 ± 0 | 34.7 ± 1.0 | 19.3 ± 1.0 |
| 22 | 0 ± 0 | 0 ± 0 | 33.9 ± 1.0 | 19.0 ± 1.0 |
| 23 | 0 ± 0 | 0 ± 0 | 33.0 ± 1.0 | 18.7 ± 1.0 |
| 24 | 0 ± 0 | 0 ± 0 | 32.3 ± 1.0 | 18.4 ± 1.0 |
Table A2.
11-year mean surface temperatures and their standard deviations (SD) over the Dead Sea and adjacent land areas, averaged over the JAS summer months. In each column, the bold numbers designate diurnal maxima and minima.
Table A2.
11-year mean surface temperatures and their standard deviations (SD) over the Dead Sea and adjacent land areas, averaged over the JAS summer months. In each column, the bold numbers designate diurnal maxima and minima.
| LT, Hours | Surface Temperature (°C) | ||||||
|---|---|---|---|---|---|---|---|
| TLw2 ± SD | TLw1 ± SD | Tw ± SD | Tm ± SD | Te ± SD | TLe1 ± SD | TLe2 ± SD | |
| 1 | 26.6 ± 0.6 | 31.3 ± 0.5 | 32.8 ± 0.5 | 32.9 ± 0.5 | 32.4 ± 0.5 | 29.6 ± 0.6 | 27.0 ± 0.6 |
| 2 | 26.4 ± 0.6 | 31.1 ± 0.5 | 32.7 ± 0.4 | 32.8 ± 0.4 | 32.1 ± 0.5 | 29.2 ± 0.6 | 26.8 ± 0.6 |
| 3 | 25.9 ± 0.6 | 30.7 ± 0.5 | 32.3 ± 0.4 | 32.4 ± 0.4 | 31.7 ± 0.5 | 28.7 ± 0.5 | 26.2 ± 0.6 |
| 4 | 25.3 ± 0.6 | 30.2 ± 0.5 | 32.0 ± 0.4 | 32.1 ± 0.4 | 31.3 ± 0.4 | 28.1 ± 0.5 | 25.6 ± 0.6 |
| 5 | 25.0 ± 0.6 | 29.9 ± 0.5 | 31.7 ± 0.4 | 31.8 ± 0.4 | 30.9 ± 0.4 | 27.8 ± 0.5 | 25.3 ± 0.6 |
| 6 | 26.9 ± 0.6 | 30.8 ± 0.5 | 31.6 ± 0.4 | 31.6 ± 0.4 | 30.9 ± 0.4 | 28.3 ± 0.5 | 26.6 ± 0.6 |
| 7 | 31.4 ± 0.6 | 32.9 ± 0.5 | 31.9 ± 0.4 | 31.6 ± 0.4 | 31.3 ± 0.4 | 30.1 ± 0.5 | 29.7 ± 0.6 |
| 8 | 36.5 ± 0.6 | 35.4 ± 0.5 | 32.6 ± 0.4 | 31.9 ± 0.4 | 32.3 ± 0.4 | 33.0 ± 0.5 | 33.9 ± 0.6 |
| 9 | 40.8 ± 0.6 | 37.7 ± 0.5 | 33.2 ± 0.4 | 32.4 ± 0.4 | 33.6 ± 0.4 | 36.3 ± 0.5 | 38.3 ± 0.6 |
| 10 | 44.4 ± 0.6 | 39.7 ± 0.5 | 34.0 ± 0.4 | 32.9 ± 0.4 | 35.1 ± 0.4 | 40.0 ± 0.6 | 42.6 ± 0.7 |
| 11 | 47.0 ± 0.7 | 41.4 ± 0.6 | 34.7 ± 0.4 | 33.5 ± 0.4 | 36.6 ± 0.5 | 43.3 ± 0.6 | 46.3 ± 0.7 |
| 12 | 48.5 ± 0.8 | 42.5 ± 0.6 | 35.3 ± 0.4 | 34.0 ± 0.4 | 37.7 ± 0.5 | 45.8 ± 0.7 | 49.0 ± 0.7 |
| 13 | 49.0 ± 0.8 | 42.9 ± 0.5 | 35.4 ± 0.4 | 34.1 ± 0.4 | 38.1 ± 0.5 | 47.0 ± 0.6 | 50.0 ± 0.7 |
| 14 | 48.2 ± 0.8 | 42.3 ± 0.5 | 35.3 ± 0.4 | 34.0 ± 0.4 | 38.0 ± 0.5 | 46.9 ± 0.6 | 49.4 ± 0.7 |
| 15 | 46.0 ± 0.7 | 41.2 ± 0.5 | 35.1 ± 0.4 | 34.0 ± 0.4 | 37.5 ± 0.4 | 45.4 ± 0.6 | 47.2 ± 0.6 |
| 16 | 42.7 ± 0.6 | 39.6 ± 0.5 | 34.8 ± 0.4 | 33.8 ± 0.4 | 36.5 ± 0.4 | 42.5 ± 0.6 | 43.4 ± 0.6 |
| 17 | 38.5 ± 0.6 | 37.4 ± 0.5 | 34.4 ±0.4 | 33.8 ± 0.4 | 35.4 ± 0.4 | 39.0 ± 0.6 | 38.7 ± 0.6 |
| 18 | 34.8 ± 0.6 | 35.8 ± 0.5 | 34.2 ± 0.4 | 33.8 ± 0.4 | 34.6 ± 0.4 | 35.8 ± 0.6 | 34.7 ± 0.6 |
| 19 | 32.5 ± 0.6 | 34.6 ± 0.5 | 33.9 ± 0.4 | 33.6 ± 0.5 | 33.9 ± 0.4 | 33.9 ± 0.6 | 32.5 ± 0.6 |
| 20 | 31.1 ± 0.6 | 33.8 ± 0.5 | 33.6 ± 0.5 | 33.4 ± 0.5 | 33.5 ± 0.5 | 32.9 ± 0.6 | 31.2 ± 0.6 |
| 21 | 30.0 ± 0.6 | 33.2 ± 0.5 | 33.5 ± 0.5 | 33.4 ± 0.5 | 33.3 ± 0.5 | 32.2 ± 0.6 | 30.2 ± 0.6 |
| 22 | 29.0 ± 0.6 | 32.6 ± 0.5 | 33.4 ± 0.5 | 33.3 ± 0.5 | 33.1 ± 0.5 | 31.4 ± 0.6 | 29.3 ± 0.6 |
| 23 | 28.1 ± 0.6 | 32.2 ± 0.5 | 33.2 ± 0.5 | 33.2 ± 0.5 | 32.9 ± 0.5 | 30.8 ± 0.6 | 28.5 ± 0.6 |
| 24 | 27.3 ± 0.6 | 31.7 ± 0.5 | 33.1 ± 0.5 | 33.1 ± 0.5 | 32.7±0.5 | 30.2 ± 0.6 | 27.7 ± 0.6 |
Table A3.
11-year mean surface temperatures and their standard deviations over the Dead Sea and adjacent land areas, averaged over the December, January, and February (DJF) winter months. In each column, the bold numbers designate diurnal maxima and minima.
Table A3.
11-year mean surface temperatures and their standard deviations over the Dead Sea and adjacent land areas, averaged over the December, January, and February (DJF) winter months. In each column, the bold numbers designate diurnal maxima and minima.
| LT, Hours | Surface Temperature (°C) | ||||||
|---|---|---|---|---|---|---|---|
| TLw2 ± SD | TLw1 ± SD | Tw ± SD | Tm ± SD | Te ± SD | TLe1 ± SD | TLe2 ± SD | |
| 1 | 10.5 ± 1.0 | 16.9 ± 0.6 | 21.0 ± 0.5 | 21.6 ± 0.5 | 19.6 ± 0.5 | 13.9 ± 0.9 | 10.6 ± 1.0 |
| 2 | 10.2 ± 1.0 | 16.8 ± 0.6 | 20.9 ± 0.5 | 21.5 ± 0.5 | 19.5 ± 0.5 | 13.5 ± 0.9 | 10.3 ± 1.0 |
| 3 | 9.9 ± 1.0 | 16.5 ± 0.6 | 20.8 ± 0.5 | 21.4 ± 0.5 | 19.4 ± 0.5 | 13.3 ± 0.9 | 9.9 ± 1.0 |
| 4 | 9.7 ± 1.0 | 16.3 ± 0.6 | 20.7 ± 0.5 | 21.4 ± 0.5 | 19.3 ± 0.5 | 13.1 ± 0.9 | 9.7 ± 1.0 |
| 5 | 9.5 ± 1.0 | 16.2 ± 0.6 | 20.7 ± 0.5 | 21.4 ± 0.5 | 19.2 ± 0.5 | 12.8 ± 0.9 | 9.4 ± 1.0 |
| 6 | 9.3 ± 1.0 | 16.2 ± 0.6 | 20.6 ± 0.4 | 21.3 ± 0.5 | 19.0 ± 0.5 | 12.6 ± 0.9 | 9.2 ± 1.0 |
| 7 | 10.2 ± 1.0 | 16.6 ± 0.7 | 20.7 ± 0.4 | 21.2 ± 0.5 | 19.0 ± 0.5 | 12.8 ± 0.9 | 9.8 ± 1.0 |
| 8 | 13.7 ± 1.0 | 18.6 ± 0.7 | 21.1 ± 0.4 | 21.4 ± 0.5 | 19.6 ± 0.5 | 14.5 ± 1.0 | 12.3 ± 1.0 |
| 9 | 18.3 ± 1.0 | 20.9 ± 0.7 | 21.6 ± 0.4 | 21.6 ± 0.5 | 20.5 ± 0.5 | 17.2 ± 1.0 | 16.0 ± 1.0 |
| 10 | 22.3 ± 1.0 | 23.1 ± 0.7 | 22.1 ± 0.4 | 21.8 ± 0.5 | 21.5 ± 0.5 | 20.5 ± 1.0 | 20.0 ± 1.0 |
| 11 | 25.6 ± 1.0 | 24.8 ± 0.7 | 22.5 ± 0.4 | 22.0 ± 0.5 | 22.6 ± 0.5 | 23.6 ± 1.0 | 23.6 ± 1.0 |
| 12 | 27.7 ± 1.0 | 25.9 ± 0.7 | 22.8 ± 0.4 | 22.2 ± 0.5 | 23.6 ± 0.5 | 26.0 ± 1.0 | 26.1 ± 1.0 |
| 13 | 28.3 ± 1.0 | 26.2 ± 0.7 | 22.9 ± 0.4 | 22.4 ± 0.5 | 24.2 ± 0.5 | 27.4 ± 1.0 | 27.3 ± 1.0 |
| 14 | 27.4 ± 1.0 | 25.6 ± 0.7 | 22.9 ± 0.4 | 22.4 ± 0.5 | 24.3 ± 0.5 | 27.5 ± 1.0 | 27.1 ± 1.0 |
| 15 | 24.6 ± 1.0 | 24.2 ± 0.7 | 22.6 ± 0.4 | 22.4 ± 0.5 | 23.8 ± 0.5 | 25.9 ± 1.0 | 24.8 ± 1.0 |
| 16 | 20.3 ± 1.0 | 21.9 ± 0.7 | 22.1 ± 0.5 | 22.1 ± 0.5 | 22.6 ± 0.5 | 22.4 ± 1.0 | 20.5 ± 1.0 |
| 17 | 16.3 ± 1.0 | 19.9 ± 0.7 | 21.7 ± 0.5 | 21.9 ± 0.5 | 21.4 ± 0.5 | 18.9 ± 1.0 | 16.3 ± 1.0 |
| 18 | 14.5 ± 1.0 | 19.0 ± 0.7 | 21.5 ± 0.5 | 21.9 ± 0.5 | 20.9 ± 0.5 | 17.2 ± 0.9 | 14.4 ± 1.0 |
| 19 | 13.4 ± 1.0 | 18.4 ± 0.6 | 21.4 ± 0.5 | 21.8 ± 0.5 | 20.6 ± 0.5 | 16.4 ± 0.9 | 13.5 ± 1.0 |
| 20 | 12.7 ± 1.0 | 18.0 ± 0.6 | 21.3 ± 0.5 | 21.8 ± 0.5 | 20.4 ± 0.5 | 15.9 ± 0.9 | 12.9 ± 1.0 |
| 21 | 12.1 ± 1.0 | 17.8 ± 0.6 | 21.2 ± 0.5 | 21.8 ± 0.5 | 20.2 ± 0.5 | 15.3 ± 0.9 | 12.2 ± 1.0 |
| 22 | 11.7 ± 1.0 | 17.6 ± 0.6 | 21.2 ± 0.5 | 21.7 ± 0.5 | 20.0 ± 0.5 | 14.9 ± 0.9 | 11.7 ± 1.0 |
| 23 | 11.2 ± 1.0 | 17.4 ± 0.6 | 21.1 ± 0.5 | 21.6 ± 0.5 | 19.8 ± 0.5 | 14.5 ± 0.9 | 11.4 ± 1.0 |
| 24 | 10.7 ± 1.0 | 17.1 ± 0.6 | 21.0 ± 0.5 | 21.6 ± 0.5 | 19.8 ± 0.5 | 14.2 ± 0.9 | 11.0 ± 1.0 |
References
- Kishcha, P.; Pinker, R.T.; Gertman, I.; Starobinets, B.; Alpert, P. Observations of positive sea surface temperature trends in the steadily shrinking Dead Sea. Nat. Hazards Earth Syst. Sci. 2018, 18, 3007–3018. [Google Scholar] [CrossRef] [Green Version]
- Ziv, B.; Saaroni, H.; Pargament, R.; Harpaz, T.; Alpert, P. Trends in rainfall regime over Israel, 1975–2010, and their relationship to large-scale variability. Reg. Environ. Chang. 2013, 14, 1751–1764. [Google Scholar] [CrossRef]
- Oren, A.; Shilo, M. Population dynamics of Dunaliella parva in the Dead Sea1. Limnol. Oceanogr. 1982, 27, 201–211. [Google Scholar] [CrossRef]
- Kishcha, P.; Starobinets, B.; Pinker, R.T.; Kunin, P.; Alpert, P. Spatial Non-Uniformity of Surface Temperature of the Dead Sea and Adjacent Land Areas. Remote Sens. 2019, 12, 107. [Google Scholar] [CrossRef] [Green Version]
- Kottmeier, C.; Agnon, A.; Al-Halbouni, D.; Alpert, P.; Corsmeier, U.; Dahm, T.; Eshel, A.; Geyer, S.; Haas, M.; Holohan, E.P.; et al. New perspectives on interdisciplinary earth science at the Dead Sea: The DESERVE project. Sci. Total Environ. 2016, 544, 1045–1058. [Google Scholar] [CrossRef] [PubMed] [Green Version]
- Shafir, H.; Alpert, P. Regional and local climatic effects on the Dead-Sea evaporation. Clim. Chang. 2010, 105, 455–468. [Google Scholar] [CrossRef]
- Shafir, H.; Jin, F.J.; Lati, Y.; Cohen, M.; Alpert, P. Wind Channeling by the Dead-Sea Wadis. Open Atmos. Sci. J. 2008, 2, 139–152. [Google Scholar] [CrossRef]
- Hecht, A.; Gertman, I. Dead Sea meteorological climate. In Book Fungal Life in the Dead Sea; Nevo, E., Oren, A., Wasser, S.P., Eds.; A.R.G. Ganter: Ruggell, Lichtenstein, 2003; pp. 68–114. [Google Scholar]
- Bitan, A. The wind regime in the north-west section of the Dead-Sea. Arch. Meteorol. Geophys. Bioklimatol. Ser. B 1974, 22, 313–335. [Google Scholar] [CrossRef]
- Bitan, A. The influence of the special shape of the dead-sea and its environment on the local wind system. Arch. Meteorol. Geophys. Bioklimatol. Ser. B 1976, 24, 283–301. [Google Scholar] [CrossRef]
- Lensky, N.G.; Lensky, I.M.; Peretz, A.; Gertman, I.; Tanny, J.; Assouline, S. Diurnal Course of Evaporation from the Dead Sea in Summer: A Distinct Double Peak Induced by Solar Radiation and Night Sea Breeze. Water Resour. Res. 2018, 54, 150–160. [Google Scholar] [CrossRef]
- Metzger, J.; Nied, M.; Corsmeier, U.; Kleffmann, J.; Kottmeier, C. Dead Sea evaporation by eddy covariance measurements vs. aerodynamic, energy budget, Priestley–Taylor, and Penman estimates. Hydrol. Earth Syst. Sci. 2018, 22, 1135–1155. [Google Scholar] [CrossRef] [Green Version]
- Duguay-Tetzlaff, A.; Bento, V.A.; Göttsche, F.-M.; Stöckli, R.; Martins, J.P.A.; Trigo, I.; Olesen, F.-S.; Bojanowski, J.S.; Dacamara, C.C.; Kunz, H. Meteosat Land Surface Temperature Climate Data Record: Achievable Accuracy and Potential Uncertainties. Remote Sens. 2015, 7, 13139–13156. [Google Scholar] [CrossRef] [Green Version]
- Duguay-Tetzlaff, A.; Stöckli, R.; Bojanowski, J.; Hollmann, R.; Fuchs, P.; Werscheck, M. CM SAF Land SUrface Temperature dataset from METeosat First and Second Generation—Edition 1 (SUMET Ed. 1); Satellite Application Facility on Climate Monitoring, DWD: Germany, 2017; Available online: https://0-doi-org.brum.beds.ac.uk/10.5676/EUM_SAF_CM/LST_METEOSAT/V001 (accessed on 22 December 2020).
- Nehorai, R.; Lensky, I.M.; Lensky, N.G.; Shiff, S. Remote sensing of the Dead Sea surface temperature. J. Geophys. Res.-Ocean 2009, 114, 05021. [Google Scholar] [CrossRef]
- Kunin, P.; Alpert, P.; Rostkier-Edelstein, D. Investigation of sea-breeze/foehn in the Dead Sea valley employing high reso-lution WRF and observations. Atmos. Res. 2019, 229, 240–254. [Google Scholar] [CrossRef]
- IMS—Israel Meteorological Service. Measurements of 2-m Air Temperature and Pyranometer Measurements of Surface Solar Radiation at Two Meteorological Stations Located in the Vicinity of the Dead Sea: Sdom and Ein Gedi Spa. Available online: https://ims.data.gov.il/ims/7 (accessed on 22 December 2020).
Figure 1.
Map of the region under study (31.4°N–31.6°N, 35.3°E–35.65°E) consisting of four similar longitudinal rows of pixels covering west, middle and east parts of the Dead Sea as well as land areas adjacent to the west and east sides of the Dead Sea. Columns 1 and 2 represent pixels covering land areas to the west of the Dead Sea, while columns 6 and 7 represent pixels covering land areas to the east of the lake. Column 3 shows pixels covering the west part, while column 5 shows pixels covering the east part of the lake. Pixels covering the middle part of the lake are represented by column 4. Sea surface temperature (SST) averaged over the western, middle, and eastern Dead Sea is designated by Tw, Tm, Te, respectively. Land surface temperature (LST) averaged over land areas to the west and east of the Dead Sea is designated by TLw1, TLw2, TLe1, TLe2, respectively. The black triangle and square show the location of two meteorological stations Sdom (31.03°N, 35.39°E) and Ein Gedi (31.42°N; 35.38°E), respectively.

Figure 2.
Diurnal variations of (a) solar insolation and (b) its first derivative, based on pyranometer measurements in the summer (in red) and winter (in blue) months, during the study period, at the Sdom meteorological station.
Figure 2.
Diurnal variations of (a) solar insolation and (b) its first derivative, based on pyranometer measurements in the summer (in red) and winter (in blue) months, during the study period, at the Sdom meteorological station.

Figure 3.
The 11-year mean diurnal variations of (a) METEOSAT summer surface temperature over the eastern (Te), western (Tw), and central (Tm) Dead Sea; and (b) their first derivatives.
Figure 3.
The 11-year mean diurnal variations of (a) METEOSAT summer surface temperature over the eastern (Te), western (Tw), and central (Tm) Dead Sea; and (b) their first derivatives.

Figure 4.
The 11-year mean diurnal variation of air temperature together with diurnal variations of SST over the east, middle, and west parts of the Dead Sea in the July, August, and September (JAS) summer months.
Figure 4.
The 11-year mean diurnal variation of air temperature together with diurnal variations of SST over the east, middle, and west parts of the Dead Sea in the July, August, and September (JAS) summer months.

Figure 5.
The 11-year mean of diurnal (a) maxima, (b) minima, and (c) diurnal temperature range of surface temperature over the sea (in blue) and over the land (in brown), averaged over the summer months. The designations of temperature are the same as in Figure 1. The numbers with local time (LT) represent time moments when surface temperatures reached their diurnal maxima and minima.

Figure 6.
Maps of the 11-year mean spatial distribution of daytime Dead Sea SST at (a) 11 LT, (b) 13 LT and (c) 15 LT, based on METEOSAT data (2005–2015), averaged over the JAS summer months.
Figure 6.
Maps of the 11-year mean spatial distribution of daytime Dead Sea SST at (a) 11 LT, (b) 13 LT and (c) 15 LT, based on METEOSAT data (2005–2015), averaged over the JAS summer months.

Figure 7.
The 11-year mean diurnal variations METEOSAT surface temperature over (a) land areas adjacent to the east (TLe1) and west (TLw1) sides of the Dead Sea, and (b) land areas remote from the east (TLe2) and west (TLw2) sides of the lake, in the summer months.
Figure 7.
The 11-year mean diurnal variations METEOSAT surface temperature over (a) land areas adjacent to the east (TLe1) and west (TLw1) sides of the Dead Sea, and (b) land areas remote from the east (TLe2) and west (TLw2) sides of the lake, in the summer months.

Figure 8.
The 11-year mean diurnal variations of summer (a,b) METEOSAT surface temperature over sea and land areas together with (c,d) land surface temperature differences TLw2–TLw1 and TLe2–TLe1. The left panel corresponds to the west side of the Dead Sea, while the right panel corresponds to the east side of the lake.

Figure 9.
The 11-year mean diurnal variations of (a) METEOSAT winter surface temperatures over the eastern (Te), western (Tw), and central (Tm) Dead Sea and (b) their first derivatives.
Figure 9.
The 11-year mean diurnal variations of (a) METEOSAT winter surface temperatures over the eastern (Te), western (Tw), and central (Tm) Dead Sea and (b) their first derivatives.

Figure 10.
The 11-year means of diurnal (a) maxima, (b) minima, and (c) diurnal temperature range of surface temperature over the sea (in blue) and over the land (in brown), averaged over the winter months. The designations are the same as in Figure 1. The numbers with LT represent time moments when surface temperatures reached their diurnal maxima and minima.

Figure 11.
The 11-year mean diurnal variations of METEOSAT surface temperature (a) over land areas adjacent to the east (TLe1) and west (TLw1) sides of the Dead Sea, and (b) over land areas remote from the east (TLe2) and west (TLw2) sides of the lake, in the winter months.
Figure 11.
The 11-year mean diurnal variations of METEOSAT surface temperature (a) over land areas adjacent to the east (TLe1) and west (TLw1) sides of the Dead Sea, and (b) over land areas remote from the east (TLe2) and west (TLw2) sides of the lake, in the winter months.

Figure 12.
The 11-year mean diurnal variations of winter (a,b) METEOSAT surface temperature over sea and land areas together with (c,d) land surface temperature differences TLw2–TLw1 and TLe2–TLe1. The left panel corresponds to the west side of the Dead Sea, while the right panel corresponds to the east side of the lake.

Publisher’s Note: MDPI stays neutral with regard to jurisdictional claims in published maps and institutional affiliations. |
© 2020 by the authors. Licensee MDPI, Basel, Switzerland. This article is an open access article distributed under the terms and conditions of the Creative Commons Attribution (CC BY) license (http://creativecommons.org/licenses/by/4.0/).
Share and Cite
MDPI and ACS Style
Kishcha, P.; Starobinets, B. Spatial Heterogeneity in Dead Sea Surface Temperature Associated with Inhomogeneity in Evaporation. Remote Sens. 2021, 13, 93. https://0-doi-org.brum.beds.ac.uk/10.3390/rs13010093
AMA Style
Kishcha P, Starobinets B. Spatial Heterogeneity in Dead Sea Surface Temperature Associated with Inhomogeneity in Evaporation. Remote Sensing. 2021; 13(1):93. https://0-doi-org.brum.beds.ac.uk/10.3390/rs13010093
Chicago/Turabian StyleKishcha, Pavel, and Boris Starobinets. 2021. "Spatial Heterogeneity in Dead Sea Surface Temperature Associated with Inhomogeneity in Evaporation" Remote Sensing 13, no. 1: 93. https://0-doi-org.brum.beds.ac.uk/10.3390/rs13010093
Note that from the first issue of 2016, this journal uses article numbers instead of page numbers. See further details here.