
RegARD: Symmetry-Based Coarse Registration of Smartphone’s Colorful Point Clouds with CAD Drawings for Low-Cost Digital Twin Buildings


Abstract
:
1. Introduction
2. Literature Review
2.1. Point Cloud Registration
2.2. Point Cloud Processing with Architectural Regularities
2.3. Digital Twinning of Building Interiors
3. Methodology
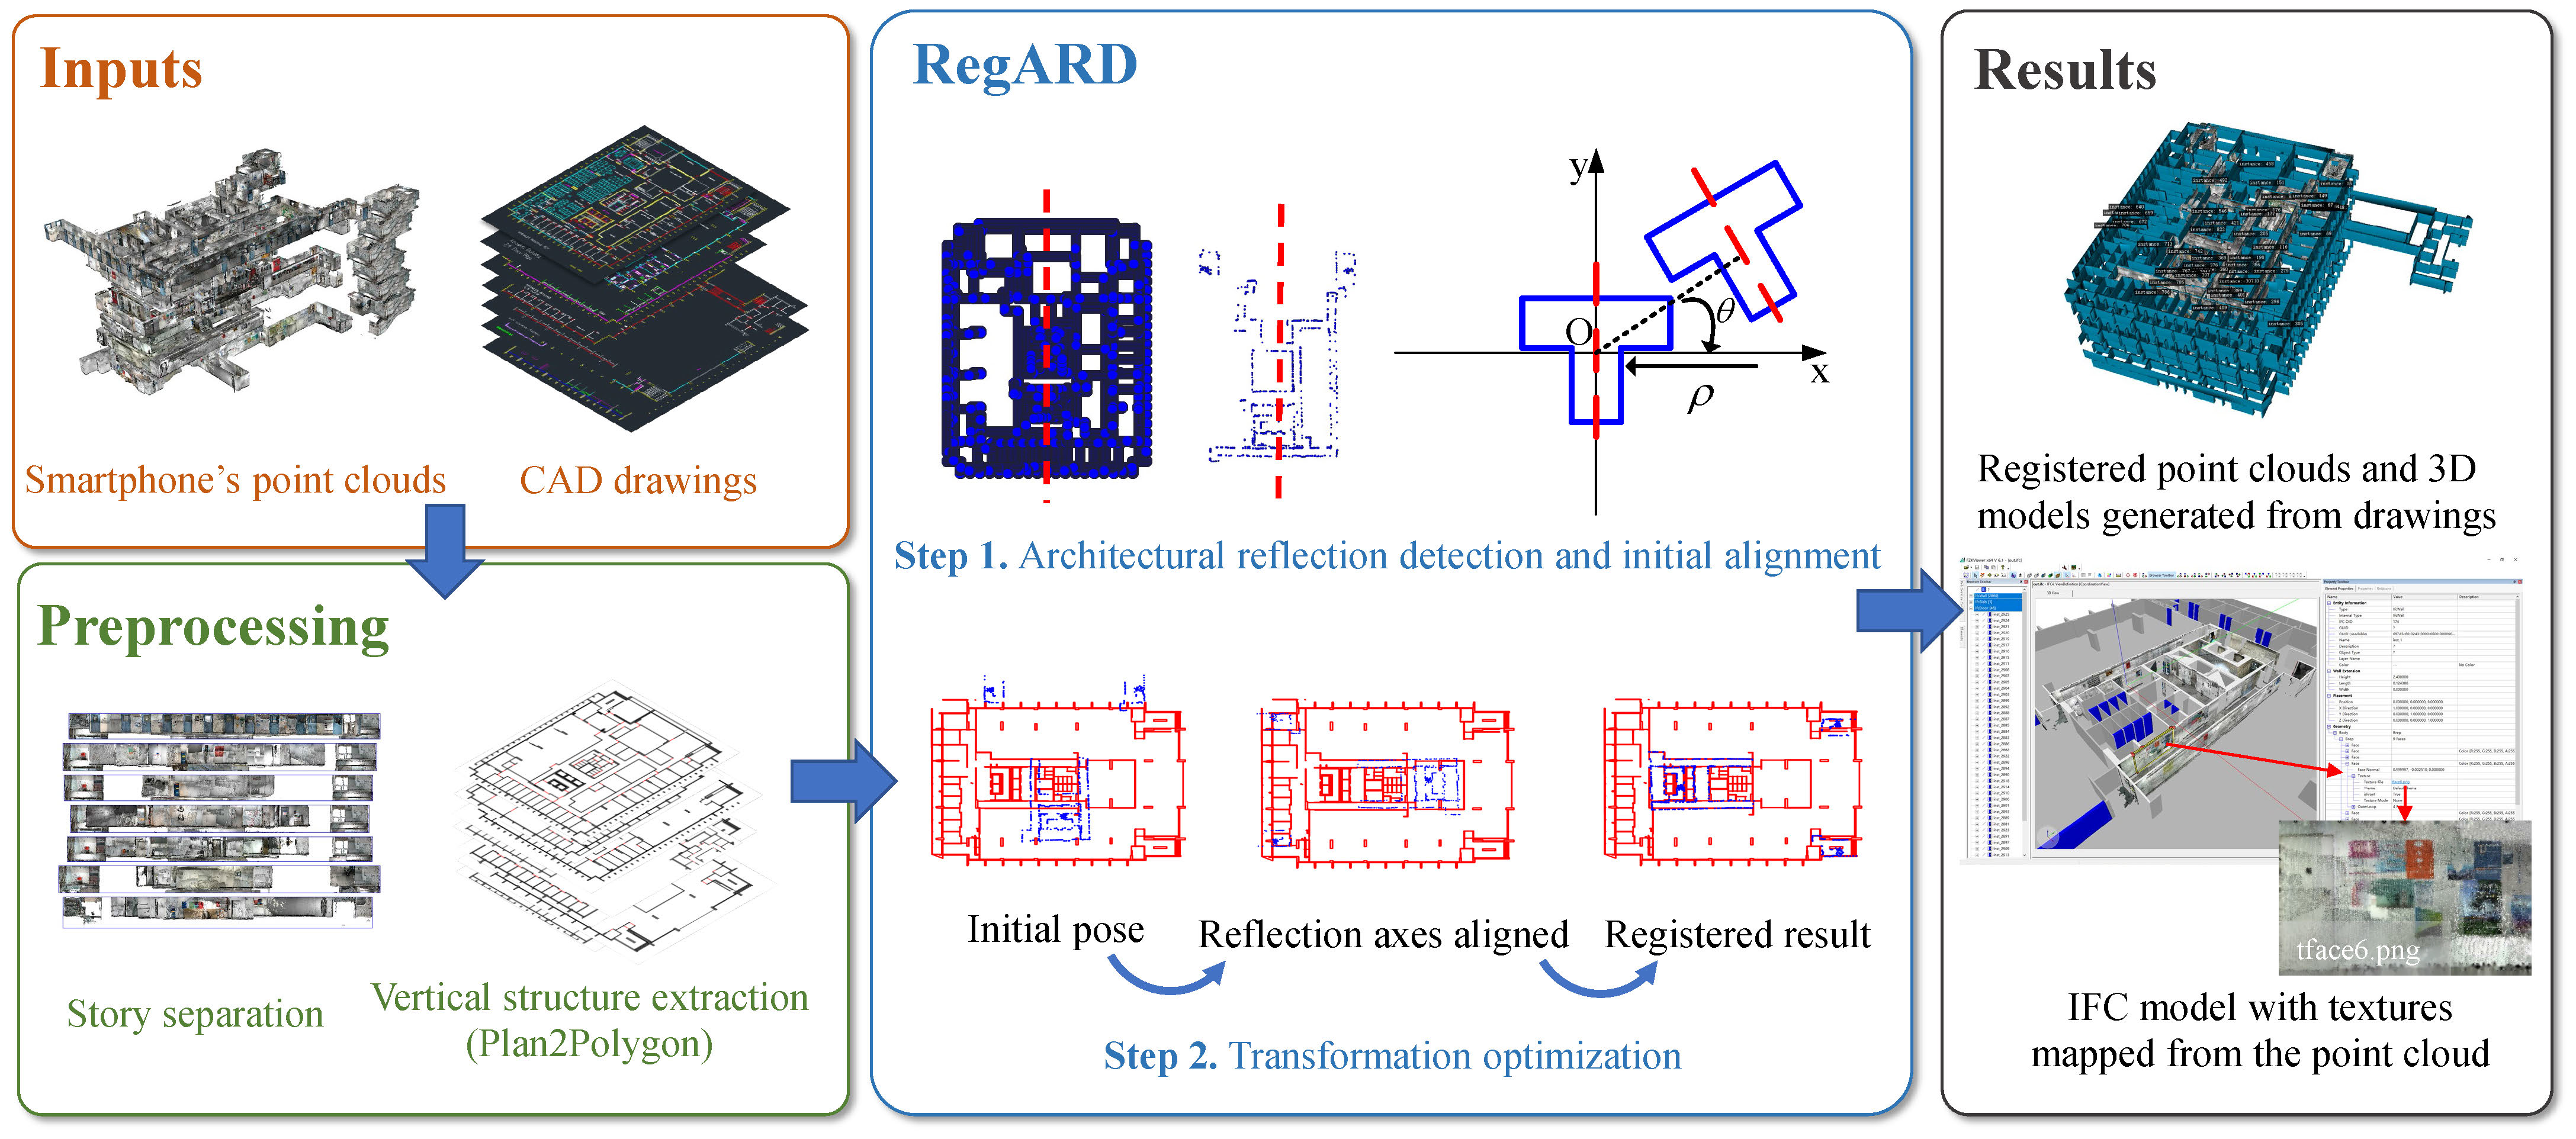
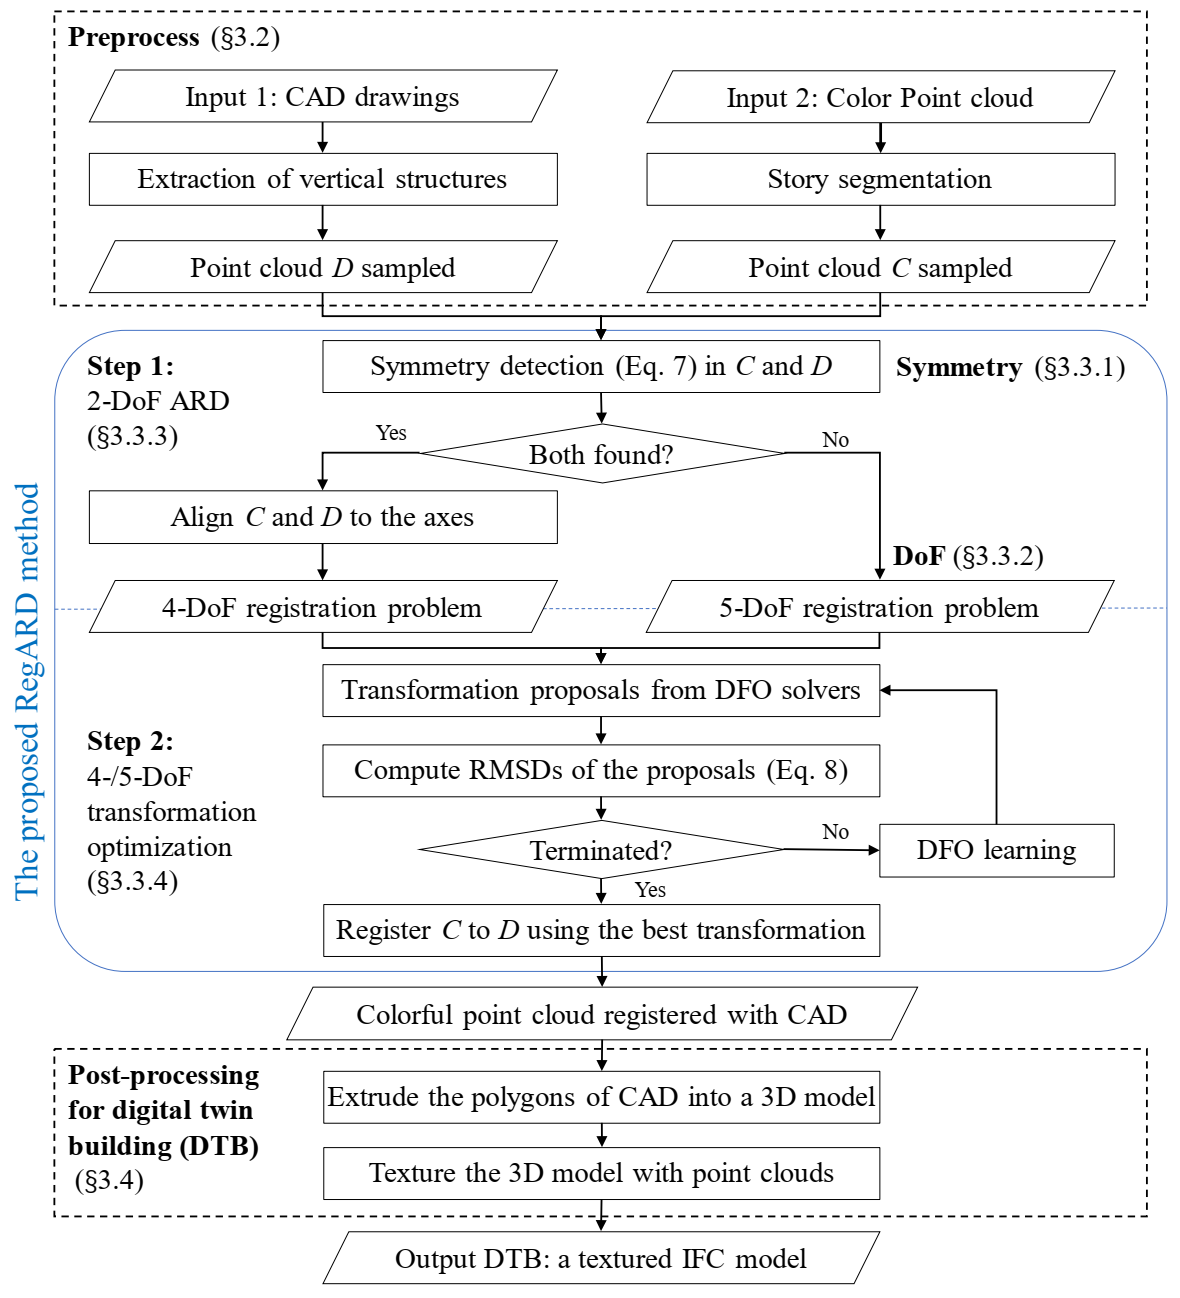
3.1. Overview
3.2. Preprocessing
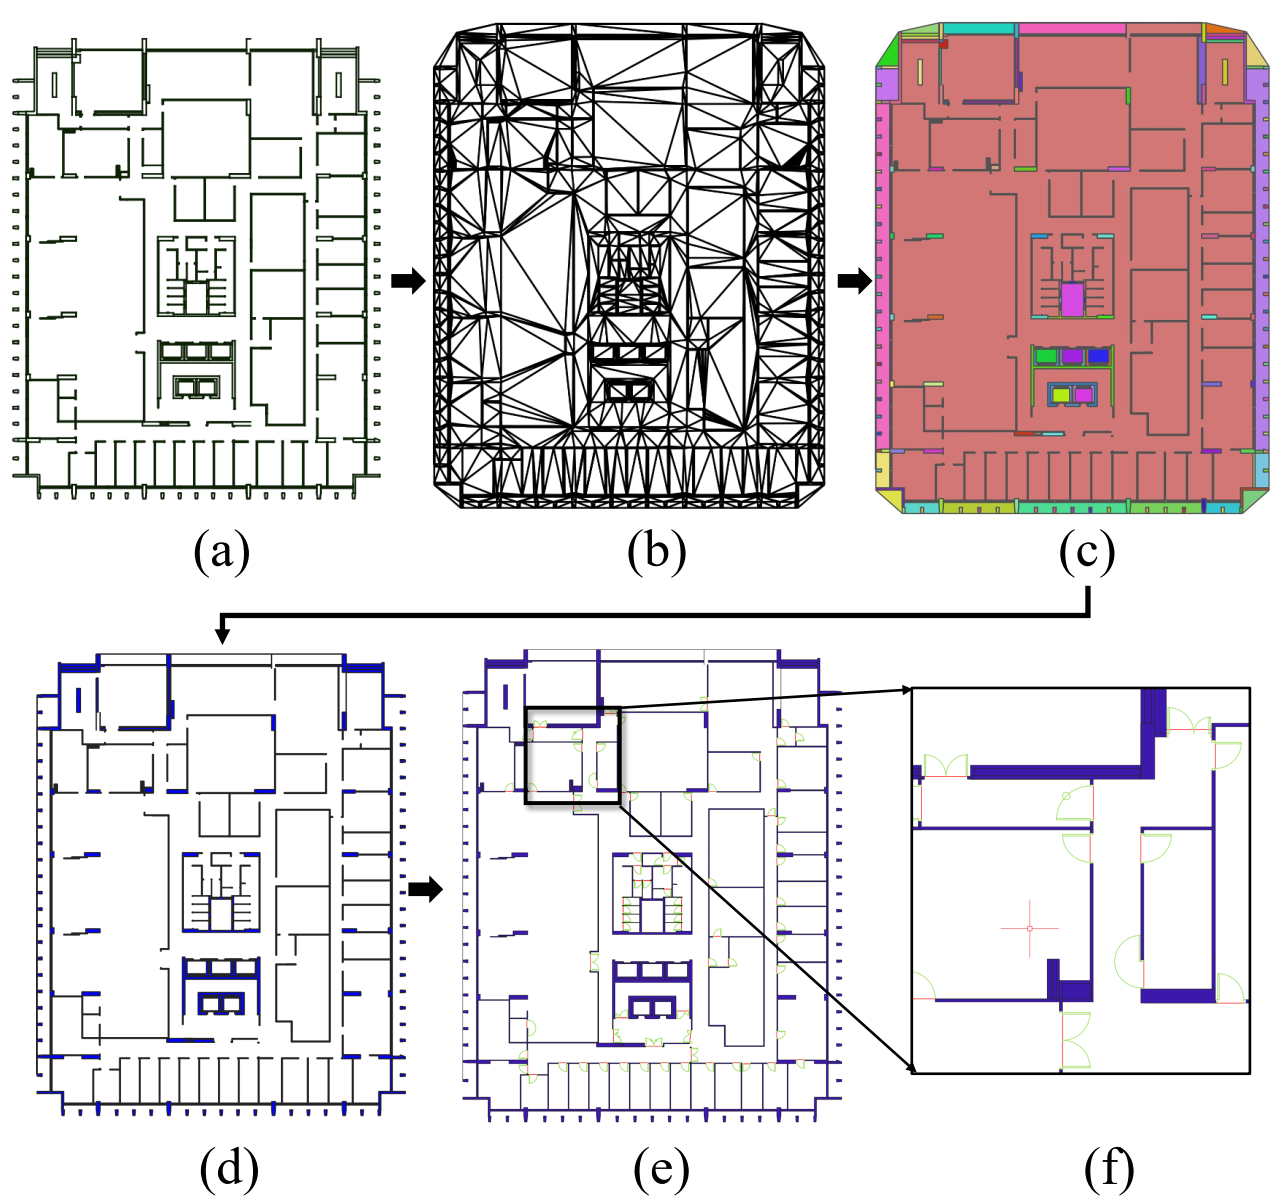
3.2.1. Parsing Cad Drawings (Plan2polygon)
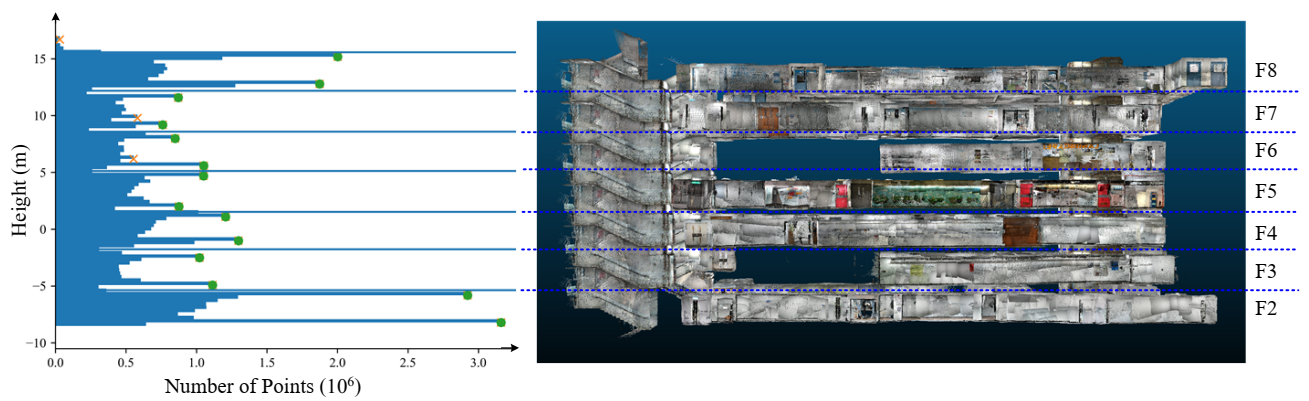
3.2.2. Segmentation of Point Clouds by Stories
3.2.3. Sampling 2D Points
3.3. The Proposed Regard Method
3.3.1. Symmetry as a Global Feature
3.3.2. DoFs in Regard
3.3.3. Step 1: Two-DoF Architectural Reflection Detection
3.3.4. Step 2: Four-DoF Transformation Optimization
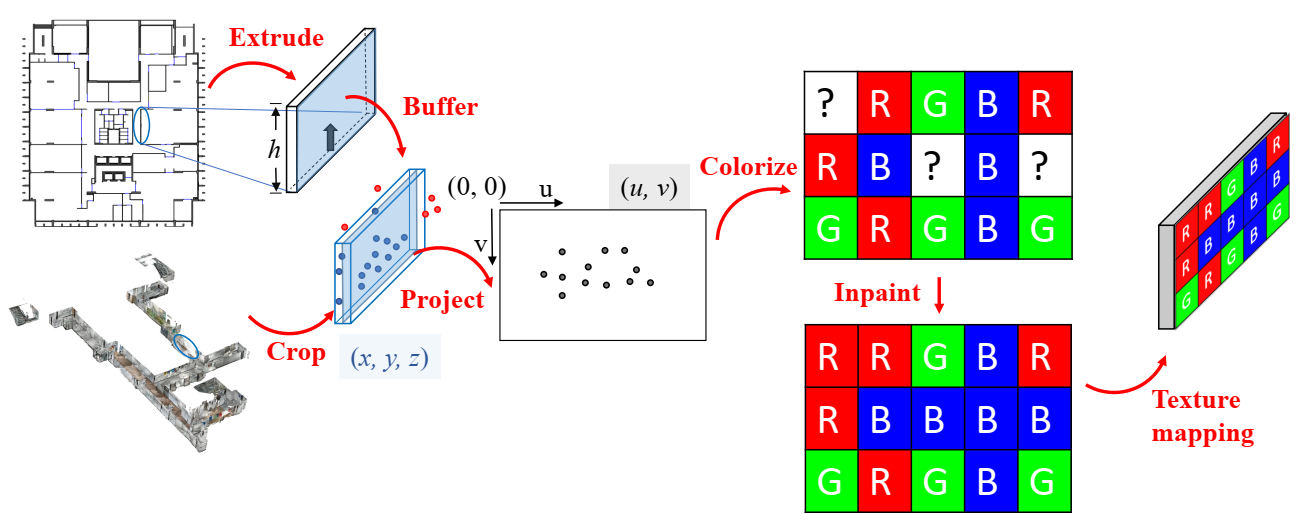
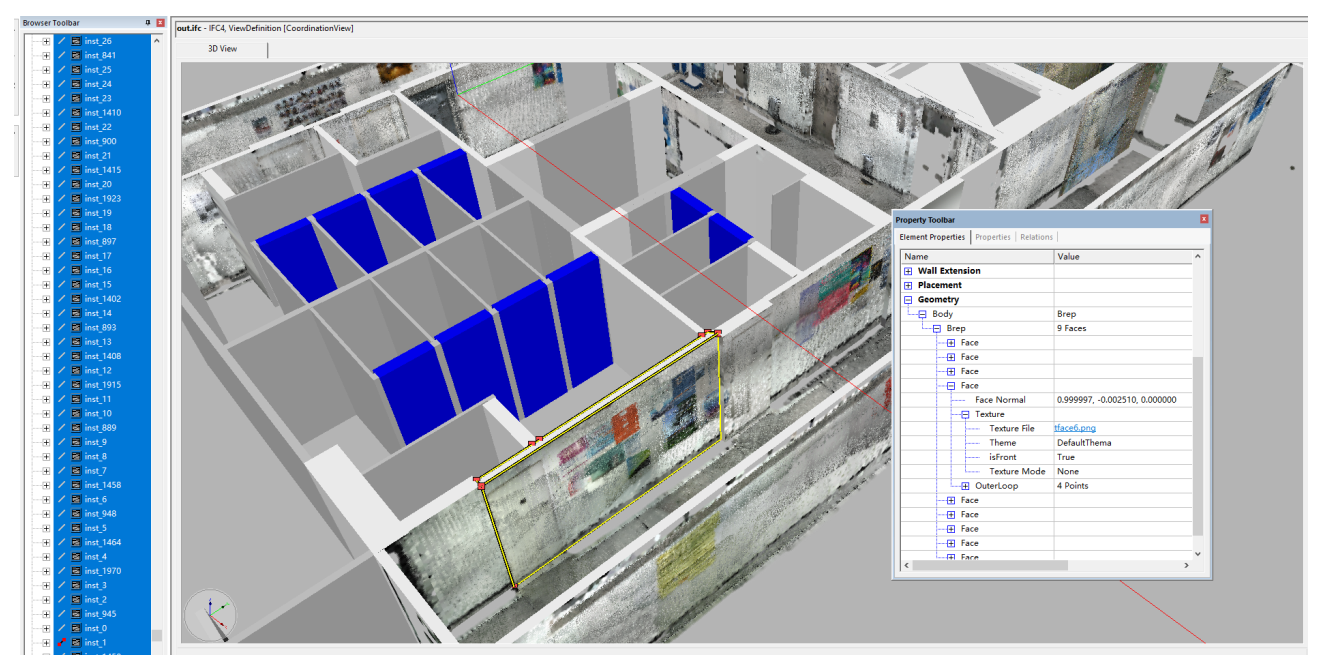
3.4. Texturing for Digital Twin Buildings
4. Experiments
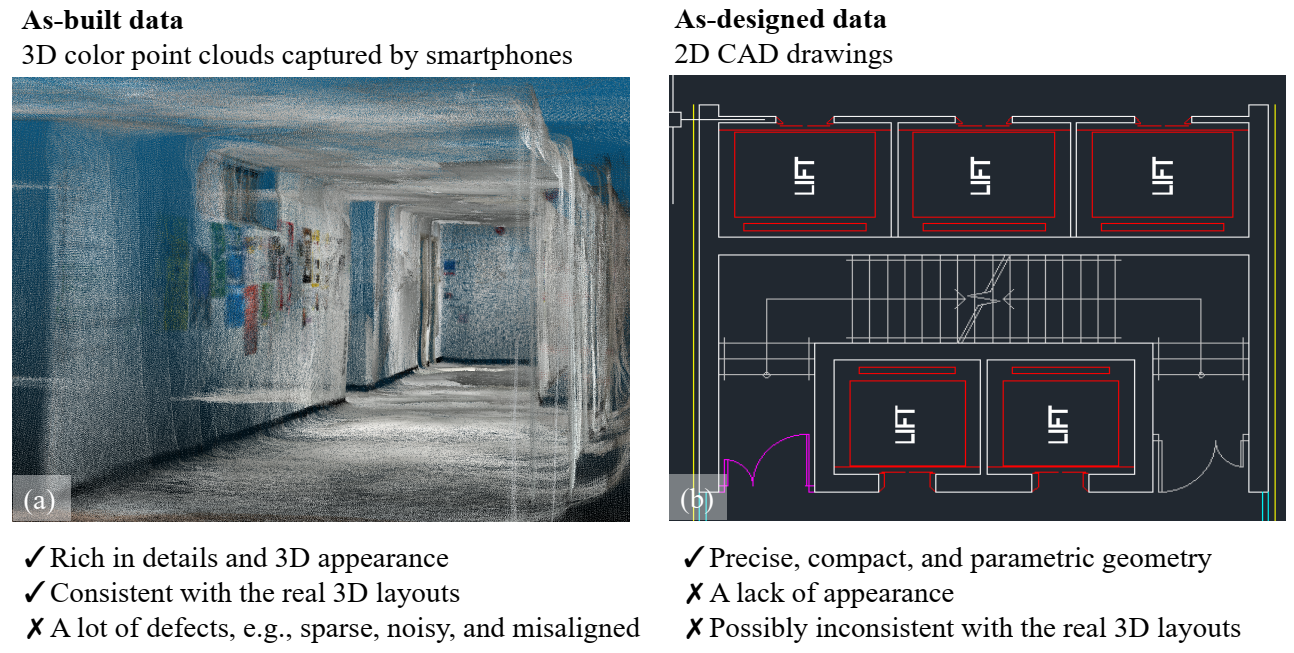
4.1. Test Data
4.2. Implementation Details
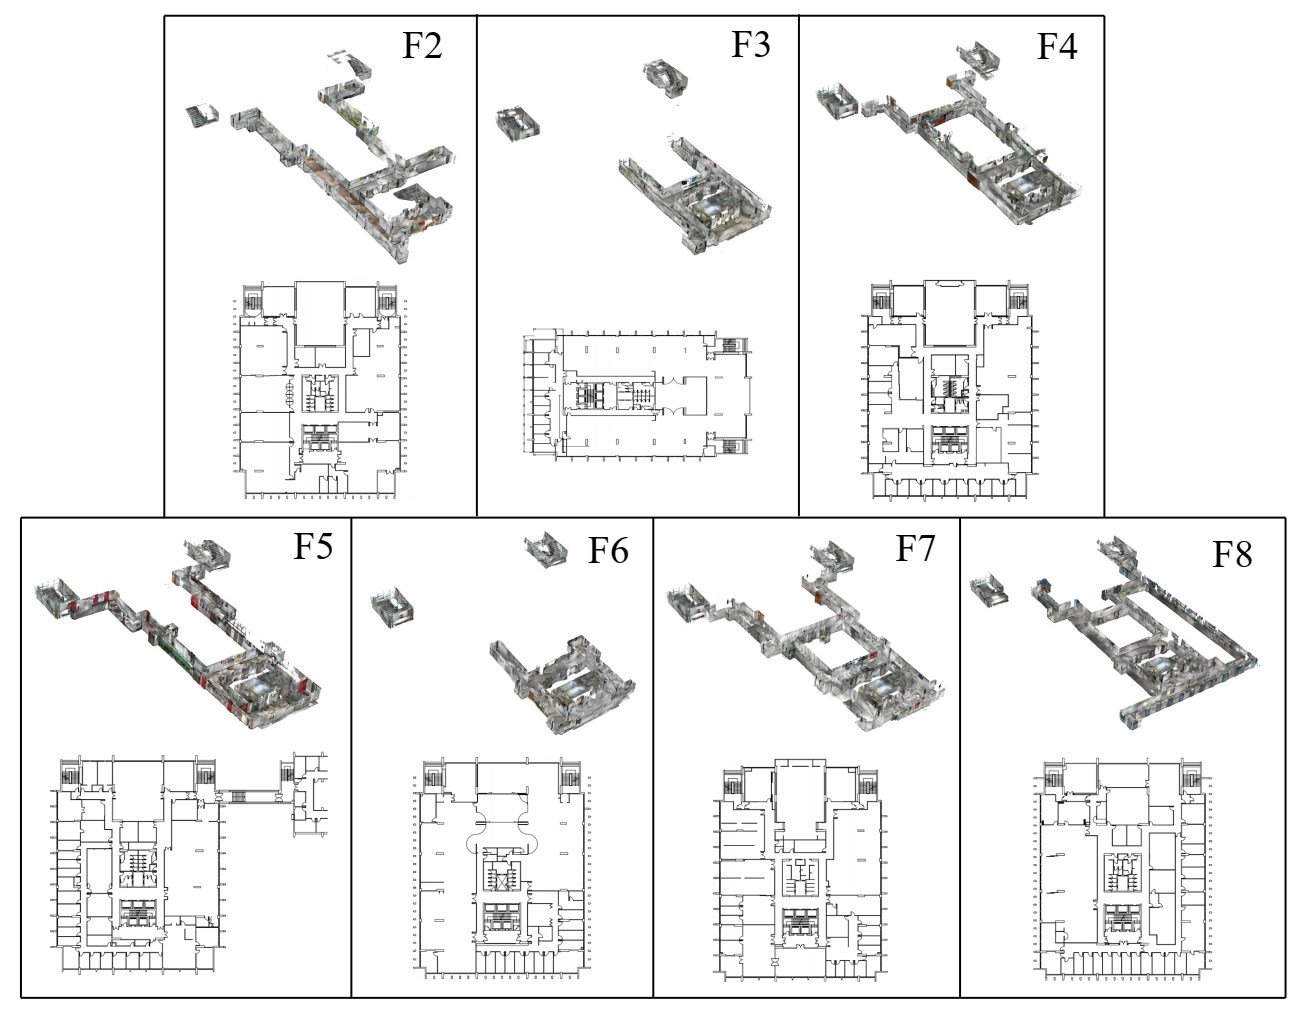
4.3. Generated Digital Twin Buildings
4.4. Registration Quantitative Analysis
4.4.1. Registration Benchmarking
4.4.2. Regard Component Analysis
- The inputs were close to the fittest transformation, e.g, the stories except for F3 and F5. The transformation between the sampled points of drawings and point clouds could be solved in a limited number of iterations. The results with 100 iterations were close to the converged solutions.
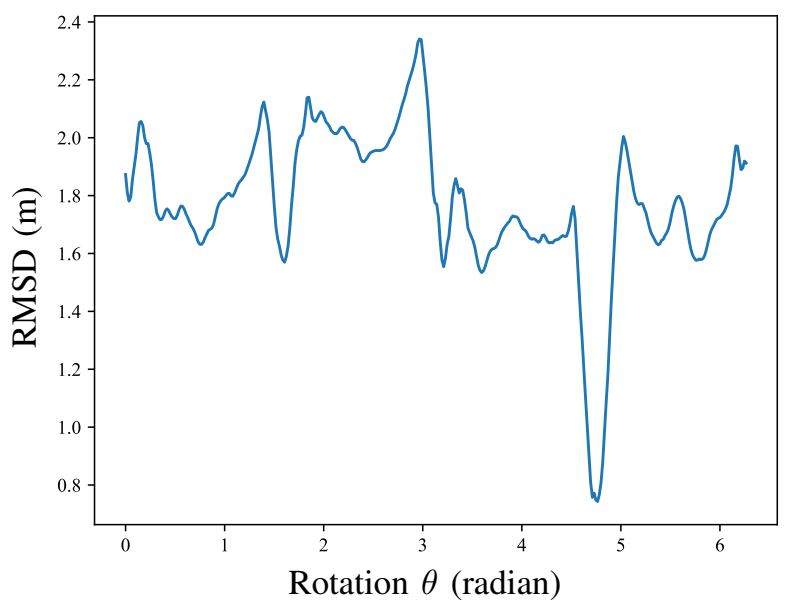
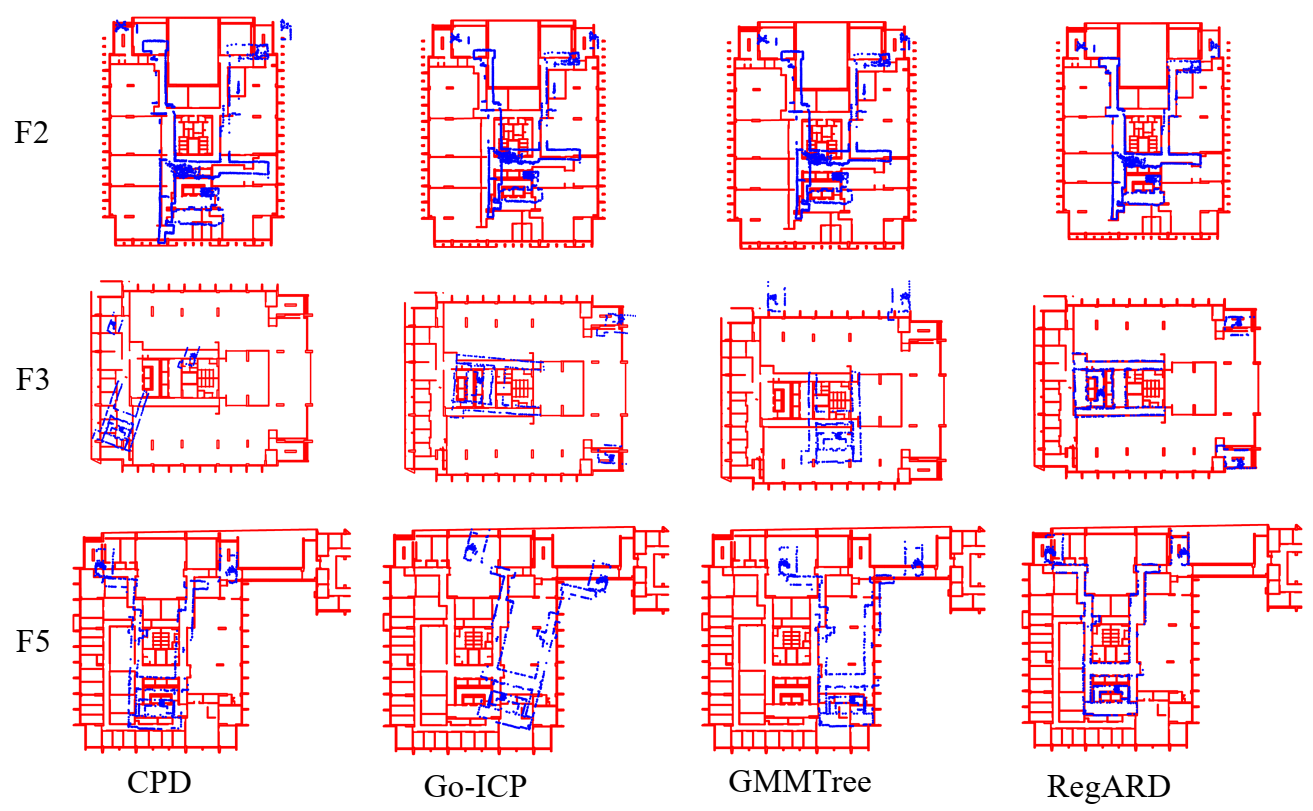
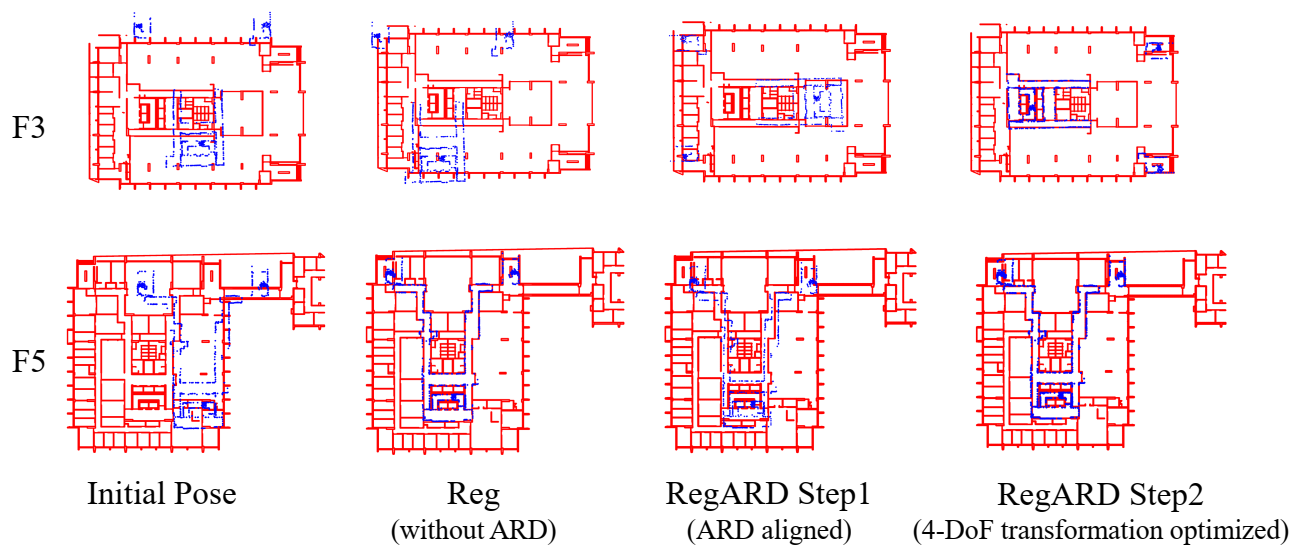
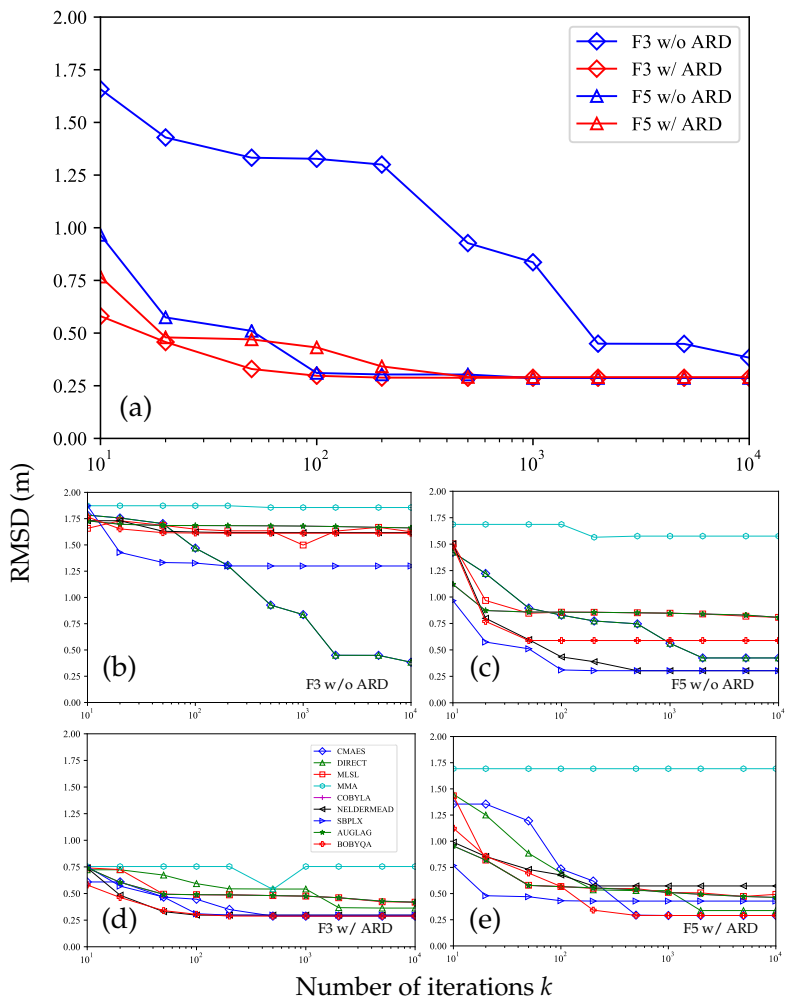
- There was a large translation between the initial poses of the two inputs, e.g., F5. The DFO solvers could optimize these translations to optima or sub-optima, with or without ARD. This could be verified by the F5’s RMSDs in Table 3, the visual results in Figure 10, and the RMSD curves in Figure 11.
- There was a large rotation between the initial poses of the two inputs, e.g., F3. This was the most challenging situation. As shown in Table 3, the registration without ARD was recorded an RMSD that was 4.5 times RegARD’s. The corresponding visual results of F3 and the RMSD convergence curves are presented in Figure 10 and Figure 11a, respectively. The curve comparison in Figure 11a demonstrated a considerably faster convergence with ARD. This result proved the argument in Section 3.3: rotation was a crucial DoF that could trap optimization algorithms in the problem equipping with strong self-similarities (e.g., building interiors). By decomposing the optimization of rotation and other DoFs, RegARD enabled the problem to be solved around 100 iterations.
5. Discussion
- Registration quality: RegARD is a rigid registration method aiming at applying a global transformation to align indoor point clouds and CAD drawings. However, there could be local misalignment as well as translation and rotation drifts which cannot be robustly registered with only one global rigid transformation. The right top of F3 and the left top of F5 shown in Figure 10 are examples. To resolve this issue, the rigid alignment with the non-rigid corrections or piece-wise rigid registration [71] can be applied. Moreover, as-designed data, such as floor plans, can serve as a priori information to make proper assumptions on the deformations and guide the piece-wise segmentation of point clouds. For example, an indoor point cloud can be segmented into rooms and represented as a graph. Then, rigid transformations can be estimated on the nodes and edges to counteract the local misalignment or drifts.
- Semantics richness: in Section 3.2.1, this paper applies a thickness filter to extraction of wall instances from the CAD drawings. The filter has a limited capability in extracting vertical structures with square cross sections, though. Moreover, the vertical structures could be further classified, e.g., as external walls, inner walls, windows, and sliding doors. One possible way is to replace the thickness filter in this paper with supervised-learning-based classifiers, such as Decision Tree and Support-Vector Machine. Besides, it is also possible to perform object detection and semantic/instance segmentation on point clouds to attach more detailed semantics to IFC elements.
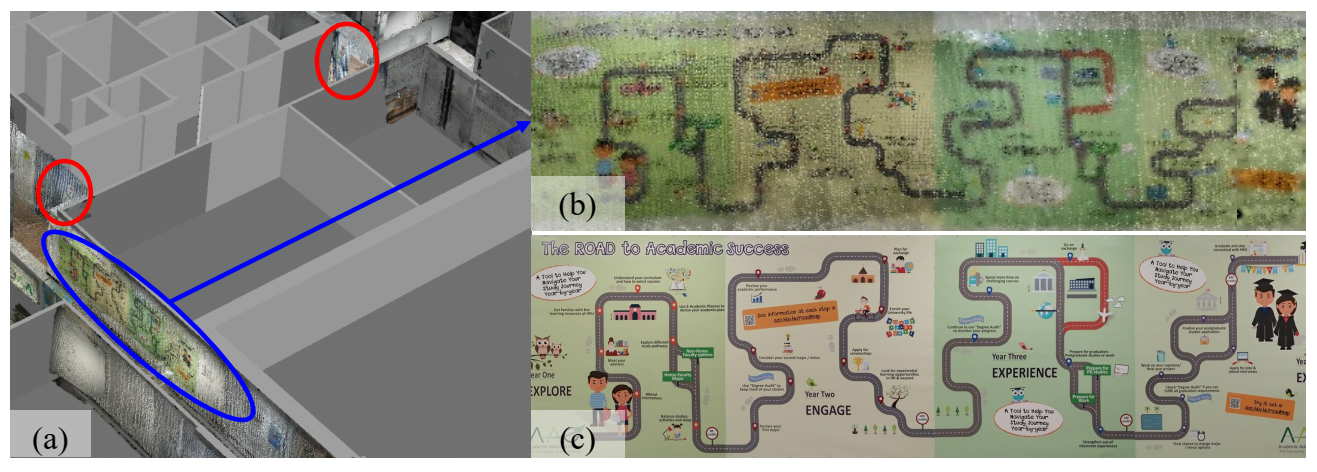
- Appearance quality: as shown in Figure 12, the resolution of the texture images is not high enough and defects such as blurring exist. This is a result of several reasons, such as the limitations of the scanning sensors, embedded Simultaneously Localization And Mapping (SLAM) algorithms, and unavoidable dynamic objects and texture lacking in the scanned environment. This issue can be improved by using the recent and even the next generations of consumer-level scanning devices with advanced sensors or embedded SLAM algorithms for point cloud collection.
- Processing time: the speed of the whole pipeline can be improved. For example, the asymptotic time complexity of RegARD is proportional to the number of source points, meaning the processing time can grow fast when the point number grows. This issue can be mitigated by applying weighted sampling [49] to reduce the processing scale of point clouds.
- Availability of reflection symmetry: when a building is asymmetric or with other types of symmetry, e.g., rotation or translation, rather than reflection, we can directly optimize the transformation without reflection detection. Examples without reflection detection are given in Table 3 and Figure 10. Moreover, because there is less self-similarity of asymmetric buildings, there are fewer local minima to trap the optimization.
- Inconsistency detection: there could be inconsistencies between the as-built and as-designed data. For example, the two red circles in Figure 12a show the on-going temporary construction work on the F2 of Knowles building. The temporary work covered one pathway between two soundproof curtains. These consistencies can cause a larger RMSD in registration or texturing noise. Inconsistency detection should be further exploited to improve the registration and final realistic models. At the same time, it is also desirable for maintenance and renovations.
6. Conclusions
Author Contributions
Funding
Data Availability Statement
Acknowledgments
Conflicts of Interest
References
- Xue, F.; Chiaradia, A.; Webster, C.J.; Liu, D.; Xu, J.; Lu, W. Personalized walkability assessment for pedestrian paths: An as-built BIM approach using ubiquitous augmented reality (AR) smartphone and deep transfer learning. In Proceedings of the 23rd International Symposium on the Advancement of Construction Management and Real Estate, Guiyang, China, 24–27 August 2018. [Google Scholar]
- Wen, C.; Pan, S.; Wang, C.; Li, J. An indoor backpack system for 2-D and 3-D mapping of building interiors. IEEE Geosci. Remote Sens. Lett. 2016, 13, 992–996. [Google Scholar] [CrossRef]
- Lim, K.Y.H.; Zheng, P.; Chen, C.H. A state-of-the-art survey of Digital Twin: Techniques, engineering product lifecycle management and business innovation perspectives. J. Intell. Manuf. 2019, 31, 1313–1337. [Google Scholar] [CrossRef]
- Khajavi, S.H.; Motlagh, N.H.; Jaribion, A.; Werner, L.C.; Holmström, J. Digital twin: Vision, benefits, boundaries, and creation for buildings. IEEE Access 2019, 7, 147406–147419. [Google Scholar] [CrossRef]
- Xue, F.; Lu, W.; Chen, Z.; Webster, C.J. From LiDAR point cloud towards digital twin city: Clustering city objects based on Gestalt principles. ISPRS J. Photogramm. Remote Sens. 2020, 167, 418–431. [Google Scholar] [CrossRef]
- Bianchini, C.; Nicastro, S. From BIM to H-BIM. In Proceedings of the 2018 3rd Digital Heritage International Congress (DigitalHERITAGE) Held Jointly with 2018 24th International Conference on Virtual Systems & Multimedia (VSMM 2018), San Francisco, CA, USA, 26–30 October 2018; pp. 1–4. [Google Scholar] [CrossRef]
- Attenni, M. Informative Models for Architectural Heritage. Heritage 2019, 2, 2067–2089. [Google Scholar] [CrossRef] [Green Version]
- NIC. Data for the Public Good. 2017. Available online: https://nic.org.uk/app/uploads/Data-for-the-Public-Good-NIC-Report.pdf (accessed on 10 May 2021).
- Xue, F.; Guo, H.; Lu, W. Digital twinning of construction objects: Lessons learned from pose estimation methods. In Proceedings of the 37th Information Technology for Construction Conference (CIB W78), São Paulo, Brazil, 2–4 June 2020. [Google Scholar] [CrossRef]
- Xue, F.; Lu, W.; Chen, K.; Zetkulic, A. From semantic segmentation to semantic registration: Derivative-Free Optimization–based approach for automatic generation of semantically rich as-built Building Information Models from 3D point clouds. J. Comput. Civ. Eng. 2019, 33, 04019024. [Google Scholar] [CrossRef] [Green Version]
- Lu, Q.; Chen, L.; Li, S.; Pitt, M. Semi-automatic geometric digital twinning for existing buildings based on images and CAD drawings. Autom. Constr. 2020, 115, 103183. [Google Scholar] [CrossRef]
- Boje, C.; Guerriero, A.; Kubicki, S.; Rezgui, Y. Towards a semantic Construction Digital Twin: Directions for future research. Autom. Constr. 2020, 114, 103179. [Google Scholar] [CrossRef]
- Xue, F.; Wu, L.; Weisheng, L. Semantic enrichment of building and city information models: A ten-year review. Adv. Eng. Inform. 2021, 47, 101245. [Google Scholar] [CrossRef]
- Xu, H.; Yu, L.; Fei, S. Hand-held 3-D reconstruction of large-scale scene with kinect sensors based on surfel and video sequences. IEEE Geosci. Remote Sens. Lett. 2018, 15, 1842–1846. [Google Scholar] [CrossRef]
- Bueno, M.; Bosché, F.; González-Jorge, H.; Martínez-Sánchez, J.; Arias, P. 4-Plane congruent sets for automatic registration of as-is 3D point clouds with 3D BIM models. Autom. Constr. 2018, 89, 120–134. [Google Scholar] [CrossRef]
- Endres, F.; Hess, J.; Sturm, J.; Cremers, D.; Burgard, W. 3-D mapping with an RGB-D camera. IEEE Trans. Robot. 2013, 30, 177–187. [Google Scholar] [CrossRef]
- Linowes, J.; Babilinski, K. Augmented Reality for Developers: Build Practical Augmented Reality Applications with Unity, ARCore, ARKit, and Vuforia; Packt Publishing Ltd.: Birmingham, UK, 2017. [Google Scholar]
- Xu, J.; Xue, F.; Chiaradia, A.; Lu, W.; Cao, J. Indoor-Outdoor Navigation without Beacons: Compensating Smartphone AR Positioning Errors with 3D Pedestrian Network. In Construction Research Congress 2020: Infrastructure Systems and Sustainability; American Society of Civil Engineers: Reston, VA, USA, 2020; pp. 444–452. [Google Scholar] [CrossRef]
- Gimenez, L.; Robert, S.; Suard, F.; Zreik, K. Automatic reconstruction of 3D building models from scanned 2D floor plans. Autom. Constr. 2016, 63, 48–56. [Google Scholar] [CrossRef]
- Han, J.; Yin, P.; He, Y.; Gu, F. Enhanced ICP for the registration of large-scale 3D environment models: An experimental study. Sensors 2016, 16, 228. [Google Scholar] [CrossRef]
- Lin, W.Y.; Liu, S.; Jiang, N.; Do, M.N.; Tan, P.; Lu, J. RepMatch: Robust feature matching and pose for reconstructing modern cities. In Proceedings of the European Conference on Computer Vision, Amsterdam, The Netherlands, 8–16 October 2016; Springer: Cham, Switzerland, 2016; pp. 562–579. [Google Scholar] [CrossRef]
- Hansen, N.; Müller, S.D.; Koumoutsakos, P. Reducing the time complexity of the derandomized evolution strategy with covariance matrix adaptation (CMA-ES). Evol. Comput. 2003, 11, 1–18. [Google Scholar] [CrossRef]
- Jones, D.R.; Perttunen, C.D.; Stuckman, B.E. Lipschitzian optimization without the Lipschitz constant. J. Optim. Theory Appl. 1993, 79, 157–181. [Google Scholar] [CrossRef]
- Nelder, J.; Mead, R. A simplex method for function minimization. Comput. J. 1965, 7, 308–313. [Google Scholar] [CrossRef]
- Johnson, A.E.; Hebert, M. Efficient multiple model recognition in cluttered 3-D scenes. In Proceedings of the 1998 IEEE Computer Society Conference on Computer Vision and Pattern Recognition (Cat. No. 98CB36231), Santa Barbara, CA, USA, 25 June 1998; pp. 671–677. [Google Scholar] [CrossRef] [Green Version]
- Chua, C.S.; Jarvis, R. Point signatures: A new representation for 3d object recognition. Int. J. Comput. Vis. 1997, 25, 63–85. [Google Scholar] [CrossRef]
- Rusu, R.B.; Blodow, N.; Beetz, M. Fast point feature histograms (FPFH) for 3D registration. In Proceedings of the 2009 IEEE International Conference on Robotics and Automation, Kobe, Japan, 12–17 May 2009; pp. 3212–3217. [Google Scholar] [CrossRef]
- Zeng, A.; Song, S.; Nießner, M.; Fisher, M.; Xiao, J.; Funkhouser, T. 3DMatch: Learning Local Geometric Descriptors from RGB-D Reconstructions. In Proceedings of the 2017 IEEE Conference on Computer Vision and Pattern Recognition (CVPR), Honolulu, HI, USA, 21–26 July 2017; pp. 199–208. [Google Scholar] [CrossRef] [Green Version]
- Choy, C.; Park, J.; Koltun, V. Fully Convolutional Geometric Features. In Proceedings of the 2019 IEEE/CVF International Conference on Computer Vision (ICCV), Seoul, Korea, 27 October–2 November 2019; pp. 8957–8965. [Google Scholar] [CrossRef]
- Yew, Z.J.; Lee, G.H. 3DFeat-Net: Weakly Supervised Local 3D Features for Point Cloud Registration. In Proceedings of the European Conference on Computer Vision, Munich, Germany, 8–14 September 2018; Springer: Cham, Switzerland, 2018; pp. 630–646. [Google Scholar] [CrossRef] [Green Version]
- Deng, H.; Birdal, T.; Ilic, S. PPFNet: Global Context Aware Local Features for Robust 3D Point Matching. In Proceedings of the 2018 IEEE/CVF Conference on Computer Vision and Pattern Recognition, Salt Lake City, UT, USA, 18–22 June 2018; pp. 195–205. [Google Scholar] [CrossRef] [Green Version]
- Besl, P.; McKayN, N. A method for registration of 3-D shapes. IEEE Trans. Pattern Anal. Mach. Intell. 1992, 14, 239–256. [Google Scholar] [CrossRef]
- Chen, Y.; Medioni, G. Object modelling by registration of multiple range images. Image Vis. Comput. 1992, 10, 145–155. [Google Scholar] [CrossRef]
- Rusinkiewicz, S.; Levoy, M. Efficient variants of the ICP algorithm. In Proceedings of the Third International Conference on 3-D Digital Imaging and Modeling, Quebec City, QC, Canada, 28 May–1 June 2001; pp. 145–152. [Google Scholar] [CrossRef] [Green Version]
- Myronenko, A.; Song, X. Point set registration: Coherent point drift. IEEE Trans. Pattern Anal. Mach. Intell. 2010, 32, 2262–2275. [Google Scholar] [CrossRef] [PubMed] [Green Version]
- Yang, J.; Li, H.; Campbell, D.; Jia, Y. Go-ICP: A globally optimal solution to 3D ICP point-set registration. IEEE Trans. Pattern Anal. Mach. Intell. 2015, 38, 2241–2254. [Google Scholar] [CrossRef] [PubMed] [Green Version]
- Eckart, B.; Kim, K.; Kautz, J. Hgmr: Hierarchical gaussian mixtures for adaptive 3d registration. In Proceedings of the European Conference on Computer Vision (ECCV), Munich, Germany, 8–14 September 2018; pp. 705–721. [Google Scholar]
- Yang, H.; Shi, J.; Carlone, L. TEASER: Fast and certifiable point cloud registration. IEEE Trans. Robot. 2020, 37, 314–333. [Google Scholar] [CrossRef]
- Wang, Y.; Solomon, J. Deep Closest Point: Learning Representations for Point Cloud Registration. In Proceedings of the 2019 IEEE/CVF International Conference on Computer Vision (ICCV), Seoul, Korea, 27 October–2 November 2019; pp. 3522–3531. [Google Scholar] [CrossRef] [Green Version]
- Choy, C.; Dong, W.; Koltun, V. Deep Global Registration. In Proceedings of the 2020 IEEE/CVF Conference on Computer Vision and Pattern Recognition (CVPR), Seattle, WA, USA, 14–19 June 2020; pp. 2511–2520. [Google Scholar] [CrossRef]
- Xu, Y.; Boerner, R.; Yao, W.; Hoegner, L.; Stilla, U. Pairwise coarse registration of point clouds in urban scenes using voxel-based 4-planes congruent sets. ISPRS J. Photogramm. Remote Sens. 2019, 151, 106–123. [Google Scholar] [CrossRef]
- Chen, S.; Nan, L.; Xia, R.; Zhao, J.; Wonka, P. PLADE: A Plane-Based Descriptor for Point Cloud Registration With Small Overlap. IEEE Trans. Geosci. Remote Sens. 2019, 58, 2530–2540. [Google Scholar] [CrossRef]
- Zolanvari, S.I.; Laefer, D.F.; Natanzi, A.S. Three-dimensional building façade segmentation and opening area detection from point clouds. ISPRS J. Photogramm. Remote Sens. 2018, 143, 134–149. [Google Scholar] [CrossRef]
- Polewski, P.; Yao, W. Scale invariant line-based co-registration of multimodal aerial data using L1 minimization of spatial and angular deviations. ISPRS J. Photogramm. Remote Sens. 2019, 152, 79–93. [Google Scholar] [CrossRef]
- Chen, K.; Lu, W.; Xue, F.; Tang, P.; Li, L.H. Automatic building information model reconstruction in high-density urban areas: Augmenting multi-source data with architectural knowledge. Autom. Constr. 2018, 93, 22–34. [Google Scholar] [CrossRef]
- Wang, H.; Zhang, W.; Chen, Y.; Chen, M.; Yan, K. Semantic decomposition and reconstruction of compound buildings with symmetric roofs from LiDAR data and aerial imagery. Remote Sens. 2015, 7, 13945–13974. [Google Scholar] [CrossRef] [Green Version]
- Ceylan, D.; Mitra, N.J.; Zheng, Y.; Pauly, M. Coupled structure-from-motion and 3D symmetry detection for urban facades. ACM Trans. Graph. (TOG) 2014, 33, 1–15. [Google Scholar] [CrossRef]
- Cheng, L.; Wu, Y.; Chen, S.; Zong, W.; Yuan, Y.; Sun, Y.; Zhuang, Q.; Li, M. A symmetry-based method for LiDAR point registration. IEEE J. Sel. Top. Appl. Earth Obs. Remote Sens. 2017, 11, 285–299. [Google Scholar] [CrossRef]
- Xue, F.; Lu, W.; Webster, C.J.; Chen, K. A derivative-free optimization-based approach for detecting architectural symmetries from 3D point clouds. ISPRS J. Photogramm. Remote Sens. 2019, 148, 32–40. [Google Scholar] [CrossRef]
- Xue, F.; Lu, W.; Chen, K.; Webster, C.J. BIM reconstruction from 3D point clouds: A semantic registration approach based on multimodal optimization and architectural design knowledge. Adv. Eng. Inform. 2019, 42, 100965. [Google Scholar] [CrossRef]
- Bassier, M.; Vergauwen, M. Unsupervised reconstruction of Building Information Modeling wall objects from point cloud data. Autom. Constr. 2020, 120, 103338. [Google Scholar] [CrossRef]
- Wang, C.; Hou, S.; Wen, C.; Gong, Z.; Li, Q.; Sun, X.; Li, J. Semantic line framework-based indoor building modeling using backpacked laser scanning point cloud. ISPRS J. Photogramm. Remote Sens. 2018, 143, 150–166. [Google Scholar] [CrossRef]
- Nikoohemat, S.; Diakité, A.A.; Zlatanova, S.; Vosselman, G. Indoor 3D reconstruction from point clouds for optimal routing in complex buildings to support disaster management. Autom. Constr. 2020, 113, 103109. [Google Scholar] [CrossRef]
- Ochmann, S.; Vock, R.; Klein, R. Automatic reconstruction of fully volumetric 3D building models from oriented point clouds. ISPRS J. Photogramm. Remote Sens. 2019, 151, 251–262. [Google Scholar] [CrossRef] [Green Version]
- Jung, J.; Stachniss, C.; Ju, S.; Heo, J. Automated 3D volumetric reconstruction of multiple-room building interiors for as-built BIM. Adv. Eng. Inform. 2018, 38, 811–825. [Google Scholar] [CrossRef]
- Murali, S.; Speciale, P.; Oswald, M.R.; Pollefeys, M. Indoor Scan2BIM: Building information models of house interiors. In Proceedings of the 2017 IEEE/RSJ International Conference on Intelligent Robots and Systems (IROS), Vancouver, BC, Canada, 24–28 September 2017; pp. 6126–6133. [Google Scholar] [CrossRef]
- Liu, C.; Wu, J.; Kohli, P.; Furukawa, Y. Raster-to-Vector: Revisiting Floorplan Transformation. In Proceedings of the 2017 IEEE International Conference on Computer Vision (ICCV), Venice, Italy, 22–29 October 2017; pp. 2214–2222. [Google Scholar] [CrossRef]
- Wu, Y.; Shang, J.; Chen, P.; Zlatanova, S.; Hu, X.; Zhou, Z. Indoor mapping and modeling by parsing floor plan images. Int. J. Geogr. Inf. Sci. 2020. [Google Scholar] [CrossRef]
- Wijmans, E.; Furukawa, Y. Exploiting 2D Floorplan for Building-Scale Panorama RGBD Alignment. In Proceedings of the 2017 IEEE Conference on Computer Vision and Pattern Recognition (CVPR), Honolulu, HI, USA, 21–26 July 2017; pp. 1427–1435. [Google Scholar] [CrossRef]
- Adams, R.; Bischof, L. Seeded region growing. IEEE Trans. Pattern Anal. Mach. Intell. 1994, 16, 641–647. [Google Scholar] [CrossRef] [Green Version]
- Turner, E.; Zakhor, A. Watertight as-built architectural floor plans generated from laser range data. In Proceedings of the 2012 Second International Conference on 3D Imaging, Modeling, Processing, Visualization & Transmission, Zurich, Switzerland, 13–15 October 2012; pp. 316–323. [Google Scholar] [CrossRef] [Green Version]
- Sun, C.; Sherrah, J. 3D symmetry detection using the extended Gaussian image. IEEE Trans. Pattern Anal. Mach. Intell. 1997, 19, 164–168. [Google Scholar] [CrossRef] [Green Version]
- Kazhdan, M. An approximate and efficient method for optimal rotation alignment of 3D models. IEEE Trans. Pattern Anal. Mach. Intell. 2007, 29, 1221–1229. [Google Scholar] [CrossRef]
- Rowan, T.H. Functional Stability Analysis of Numerical Algorithms. Ph.D. Thesis, The University of Texas at Austin, Austin, TX, USA, 1990. [Google Scholar]
- Telea, A. An image inpainting technique based on the fast marching method. J. Graph. Tools 2004, 9, 23–34. [Google Scholar] [CrossRef]
- Taberna, G.A.; Guarnieri, R.; Mantini, D. SPOT3D: Spatial positioning toolbox for head markers using 3D scans. Sci. Rep. 2019, 9, 12813. [Google Scholar] [CrossRef] [Green Version]
- Benazera, E. Libcmaes: A Multithreaded C++11 Library with Python Bindings for High Performance Blackbox Stochastic Optimization Using the CMA-ES Algorithm for Covariance Matrix Adaptation Evolution Strategy. 2020. Available online: https://github.com/beniz/libcmaes (accessed on 2 November 2020).
- Steven, J. NLopt: A Free/Open-Source Library for Nonlinear Optimization. 2020. Available online: https://nlopt.readthedocs.io/en/latest/ (accessed on 2 November 2020).
- Tanaka, K.; Schmitz, P.; Ciganovic, M.; Kumar, P. Probreg: Probablistic Point Cloud Registration Library. 2020. Available online: https://probreg.readthedocs.io/en/latest/ (accessed on 2 November 2020).
- Srinivasan, R. Go-icp_cython: A Cython Version of the Original Go-ICP. Available online: https://github.com/aalavandhaann/go-icp_cython (accessed on 2 November 2020).
- Tam, G.K.; Cheng, Z.Q.; Lai, Y.K.; Langbein, F.C.; Liu, Y.; Marshall, D.; Martin, R.R.; Sun, X.F.; Rosin, P.L. Registration of 3D point clouds and meshes: A survey from rigid to nonrigid. IEEE Trans. Vis. Comput. Graph. 2012, 19, 1199–1217. [Google Scholar] [CrossRef] [Green Version]


| Story | (km) | (m) | ||||
|---|---|---|---|---|---|---|
| F2 | 4.58 | 2046.46 | 295,305 | 14,395,380 | 3363 | 0.318 |
| F3 | 4.76 | 2085.48 | 322,491 | 6,767,762 | 908 | 0.220 |
| F4 | 5.46 | 2038.82 | 360,103 | 9,099,373 | 660 | 0.281 |
| F5 | 5.49 | 2266.97 | 326,971 | 7,462,367 | 1074 | 0.271 |
| F6 | 5.44 | 2038.71 | 379,294 | 6,433,582 | 721 | 0.235 |
| F7 | 6.42 | 2097.15 | 457,639 | 6,001,598 | 969 | 0.210 |
| F8 | 7.14 | 2038.61 | 519,177 | 11,307,407 | 1031 | 0.242 |
| Metric | Story | Init. | CPD | Go-ICP | GMMTree | RegARD | |
|---|---|---|---|---|---|---|---|
| F2 | 0.871 | 0.923 | 0.865 | 0.871 | 0.345 | 60.17 | |
| F3 | 2.168 | 0.732 | 0.592 | 2.168 | 0.295 | 50.12 | |
| Avg. | F4 | 0.663 | 0.735 | 0.650 | 0.664 | 0.290 | 55.34 |
| RMSD | F5 | 1.997 | 0.708 | 1.533 | 1.997 | 0.322 | 54.52 |
| (m) | F6 | 0.645 | 1.626 | 0.636 | 0.645 | 0.478 | 24.87 |
| F7 | 0.667 | 1.148 | 0.651 | 0.664 | 0.352 | 45.90 | |
| F8 | 1.063 | 2.170 | 0.974 | 1.063 | 0.407 | 58.21 | |
| Average | 49.88 | ||||||
| F2 | − | 279.78 | 14.25 | 8.08 | 5.17 | 36.02 | |
| F3 | − | 85.58 | 14.49 | 8.19 | 1.67 | 79.66 | |
| Avg. | F4 | − | 69.77 | 14.09 | 8.36 | 1.42 | 83.06 |
| Time | F5 | − | 99.50 | 14.48 | 8.24 | 2.02 | 75.53 |
| (s) | F6 | − | 77.50 | 14.03 | 8.48 | 1.44 | 83.03 |
| F7 | − | 123.98 | 14.04 | 8.60 | 1.89 | 78.02 | |
| F8 | − | 150.82 | 14.06 | 8.73 | 2.05 | 76.57 | |
| Average | 73.13 |
| Metric | Story | RegARD (with ARD) | Reg (without ARD) |
|---|---|---|---|
| F2 | 0.345 | 0.341 | |
| F3 | 0.295 | 1.327 | |
| Avg. | F4 | 0.290 | 0.291 |
| RMSD | F5 | 0.322 | 0.311 |
| (m) | F6 | 0.478 | 0.490 |
| F7 | 0.352 | 0.359 | |
| F8 | 0.407 | 0.403 | |
| Average | 0.356 | 0.626 | |
| F2 | 5.17 | 4.71 | |
| F3 | 1.67 | 1.39 | |
| Avg. | F4 | 1.42 | 1.05 |
| Time | F5 | 2.02 | 1.63 |
| (s) | F6 | 1.44 | 1.14 |
| F7 | 1.89 | 1.53 | |
| F8 | 2.05 | 1.59 | |
| Average | 2.23 | 1.86 |
Publisher’s Note: MDPI stays neutral with regard to jurisdictional claims in published maps and institutional affiliations. |
© 2021 by the authors. Licensee MDPI, Basel, Switzerland. This article is an open access article distributed under the terms and conditions of the Creative Commons Attribution (CC BY) license (https://creativecommons.org/licenses/by/4.0/).
Share and Cite
Wu, Y.; Shang, J.; Xue, F. RegARD: Symmetry-Based Coarse Registration of Smartphone’s Colorful Point Clouds with CAD Drawings for Low-Cost Digital Twin Buildings. Remote Sens. 2021, 13, 1882. https://0-doi-org.brum.beds.ac.uk/10.3390/rs13101882
Wu Y, Shang J, Xue F. RegARD: Symmetry-Based Coarse Registration of Smartphone’s Colorful Point Clouds with CAD Drawings for Low-Cost Digital Twin Buildings. Remote Sensing. 2021; 13(10):1882. https://0-doi-org.brum.beds.ac.uk/10.3390/rs13101882
Chicago/Turabian StyleWu, Yijie, Jianga Shang, and Fan Xue. 2021. "RegARD: Symmetry-Based Coarse Registration of Smartphone’s Colorful Point Clouds with CAD Drawings for Low-Cost Digital Twin Buildings" Remote Sensing 13, no. 10: 1882. https://0-doi-org.brum.beds.ac.uk/10.3390/rs13101882