
A Review of Passive and Active Ultra-Wideband Baluns for Use in Ground Penetrating Radar


Department of Electrical and Electronics Engineering, The University of Manchester, Oxford Road, Manchester M13 9PL, UK
*
Author to whom correspondence should be addressed.
Remote Sens. 2021, 13(10), 1899; https://0-doi-org.brum.beds.ac.uk/10.3390/rs13101899
Submission received: 20 April 2021
/
Revised: 6 May 2021
/
Accepted: 7 May 2021
/
Published: 13 May 2021
(This article belongs to the Special Issue Review of Application Areas of GPR)
Abstract
:Microwave ultra-wideband technology has been widely adopted in instrumentation and measurement systems, including ground-penetrating radar (GPR) sensors. Baluns are essential components in these systems to feed balanced antennas from unbalanced feed cables. Baluns are typically introduced to avoid issues with return signals, asymmetrical radiation patterns and radiation from cables. In GPR systems, these issues can cause poor sensitivity due to a reduction in radiated power, blind spots due to changes in the radiation pattern and additional clutter from common mode radiation. The different balun technologies currently available exhibit a wide variation in performance characteristics such as insertion loss, reflection coefficient and phase balance, as well as physical properties such as size and manufacturability. In this study, the performance of two magnetic transformer baluns, two tapered microstrip baluns and an active balun based on high-speed amplifiers were investigated, all up to frequencies of 6 GHz. A radio frequency current probe was used to measure the common mode currents on the feed cables that occur with poor performing baluns. It was found that commercially available magnetic transformer baluns have the best phase linearity, while also having the highest insertion losses. The active balun design has the best reflection coefficient at low frequencies, while, at high frequencies, its performance is similar to the other baluns tested. It was found that the active balun had the lowest common mode current on the feed cables.
1. Introduction
Microwave ultra-wideband (UWB) technology is commonly used in ground-penetrating radar (GPR) systems. GPR has been successfully used in a large variety of applications, such as archaeological surveys, buried pipe and cable detection, road surface inspection and planetary investigations [1]. It has also been deployed to aid in the detection of buried landmines, where its use can lead to a significant reduction in the rate of false alarms [2]. Other applications include the evaluation of pavements [3], measuring snow depth [4] and imaging ice sheets [5]. Microwave UWB measurements are also widely used in instruments and measurement devices, for varying applications. For example, UWB radio-frequency (RF) signals have been used to implement a low-cost indoor ranging system [6], to provide high-resolution imaging of dielectric profiles [7] and for tomographic imaging [8]. Other applications for UWB in the field of instrumentation and measurement technology include the use of time-domain reflectometry (TDR). One application of TDR is to measure the water content in soil [9]. One of the difficulties with the use of GPR systems, and UWB instruments in general, is the electrical feed for the antennas [1,10,11]. Many popular antenna designs are inherently symmetrical; they require symmetrical (“balanced”) current distributions along their arms [12]. However, when connected directly to a standard coax cable, one of the arms of the antenna is connected to the shield, while the other arm is connected to the central conductor. Therefore, the symmetric nature of the antenna is lost at this point [12]. This results in the formation of common mode currents flowing along the outside of the coax cable, which negatively affects the performance of the antennas and the overall system. These common mode currents can lead to radiation from the feed cables which can adversely affect the performance of the UWB system. Another effect is that the currents on the two arms of the antenna are no longer balanced, which can change how the antenna radiates, leading to changes in its radiation pattern and polarization [13,14]. Baluns are necessary to connect unbalanced transmission lines to balanced antennas. They can be seen as three-port devices, where one port has its signal referenced to ground, while the other two ports are referenced to each other, with a 180° phase difference between the signals on the latter two ports. For narrowband systems, several balun options exist which rely on structures which are exactly one-quarter of the wavelength at the operating frequency, such as the sleeve balun and the folded balun [13]. However, these narrow-band solutions are not appropriate for ultra wide-band devices. For the reasons described above, baluns are a critical component of instrumentation and measurement devices, and their design might be considered alongside that of the rest of the instrument or sensor [5,7,9,15]. The effect of baluns on measurements systems is seen in the radiation pattern of antennas [16], antenna feed reflections and losses [7,17] and for estimating the S-parameters [18]. It is often necessary to provide an impedance transformation between the feed cable (typically, 50 ) and the antenna, which often has a higher input impedance. Baluns can be used to facilitate this transformation [14,19], improving the match between the antenna and its feed, and reducing the reflection from the antenna. As a result, the impedance ratio or input/output impedance of the balun is often an important characteristic. Previous work in the instrument and measurement community has covered the design and characterization of individual hybrid balun designs [20,21]. While there are many reports in the literature regarding specific balun designs, these are often hard to compare due to differences in the experimental setups. This paper aims to fill a gap in the existing literature, by providing a direct comparison of three common, but very different, balun implementations. The baluns were subjected to identical experiments, allowing for direct comparisons of the results, including the measurements of the common mode current on the RF cables. The issues discussed in this paper are typically applicable to baluns on both the transmitter and the receiver antennas, due to the reciprocal nature of the antenna systems.
2. Summary of Balun Designs for GPR Antennas
An ideal transformer, with one terminal grounded, can be seen as a model for an ideal balun. The traditional transformer, where two wires are wrapped around a magnetic core, is one of the simplest balun types to be used in practice, and they can be used as a broadband balun. However, at higher frequencies, the coupling inside the magnetic core starts to decrease, while the capacitance between the windings increases. This causes direct coupling that bypasses the magnetic core, which limits the operating bandwidth of the balun. The upper bandwidth is also limited by the high attenuation losses inside the magnetic core at microwave frequencies. One advantage of the transformer balun is that the turns ratio can be used to create a particular impedance ratio. A variation on this type of balun is the transmission line balun, where the capacitance between the windings of the coils forms part of the characteristic impedance of the transmission line, avoiding resonances which might limit the balun’s operating bandwidth. The type of transmission line commonly used for this is the twisted pair [22]. This type of balun can be connected in many different ways. For example, the common mode voltage baluns described by Guanella [23], which can have a 1:1 or 4:1 impedance ratio, or the common mode voltage balun described by Ruthroff [22] with a 4:1 impedance ratio can be used. Transmission line transformer baluns are commercially available in small packages with very high operating bandwidths. An alternative form of balun can be constructed from a coax cable, as described by Duncan and Minerva [24]. This type of balun is formed by cutting open the outer conductor of a coax cable and gradually increasing the size of the slot until the coax cable has been converted into two parallel conductors. The length of these baluns is determined by the lowest operating frequency [24] because the transition has to be performed gradually [13]. As a result, the Duncan–Minerva balun can be bulky for lower frequencies. The output impedance of these baluns can be controlled by changing the geometry of the balanced end. Closely related to the Duncan–Minerva balun is the tapered microstrip balun. This balun is effectively a planar version of the tapered coax cable, which allows it to be produced using traditional printed circuit board (PCB) manufacturing techniques. One side of the balun is a conventional microstrip line, while the other side of the balun is a balanced line with two conductors of equal width on either side of the PCB. The width of the ground plane of the microstrip is gradually reduced until it matches that of the conductor on the other side of the PCB. The impedance of the balanced transmission line can be controlled by varying the width of the conductors on both sides of the PCB. The profile of the widths of the conductors along the length of the balun can be derived analytically [25], based on the work in [26], and a more recent analysis is presented in [12], which takes into account the quasi-TEM nature of the electromagnetic wave. The length of the tapered microstrip depends on the lowest operating frequency [12,19], as with the Duncan–Minerva balun. Several types of baluns can be made using printed circuit techniques, e.g., the tapered microstrip balun. One of these is the Marchand balun, which was first introduced in 1944 [27]. The Marchand balun uses a number of coupled transmission line sections, with open or short circuits to provide the balance transformation across wide bandwidths. The Marchand design has proven to be popular and many different variations have been proposed, such as the fourth-order Marchand balun with a 10:1 bandwidth [28]. To reduce the reflection coefficient of the balun, the order of the equivalent circuit can be increased. The order of the Marchand balun also corresponds to the number of nulls in its pass band [29]. Typically, Marchand baluns are implemented as second-, third- or fourth-order [28,29], but higher-order realizations also exist [30]. The exact analysis and synthesis of Marchand baluns has been well-described in the literature [31]. Lu et al. [32] introduced a more general approach to the design process, allowing for greater control of the coupling coefficients. The previously described printed circuit baluns rely on quarter-wave length sections, and as a result a trade-off exists between the length of the structure and the ability of the balun to operate at low frequencies [33]. The substrate of the PCB has a significant impact on the characteristics of these types of baluns. On substrates with a low permittivity, the structures have to be larger for a given cut-off frequency, but the losses will also be lower. On high permittivity substrates, the size of the structures can be reduced, but the losses will be higher [33]. A different type of printed circuit balun is the double-Y balun (DBY) proposed by Trifunovic and Jokanovic [29,34] and further investigated by Venkatesan and Scott for their use in feeding antennas [14] and applications in GPR [35]. The DBY balun consists of a central junction, three balanced ports and three unbalanced ports. The ports are arranged in an alternating fashion around the central junction [29]. The balun requires that opposing pairs of ports have opposite reflection coefficients, so, if one port in a pair is open circuit, the other should be short circuit. This also means that the electrical length of the ports should be equal [29]. DBY baluns can be constructed using a range of transmission-line structures for the input and output traces. However, the best performance is achieved when the double-Y balun transitions from a coplanar waveguide (CPW) to a balanced coplanar stripline (CPS) [29]. Impedance transformation can be achieved by choosing different impedance values for the CPW and CPS sections. It has been reported that the bandwidth of the double-Y balun depends on the length of the stubs in the double-Y section [35]. In particular, when the input and output impedances differ, there exists a resonance when the length of these stubs equals [14,35], which sets the upper frequency limit. Despite this, Venkatesan et al. [35] described a double-Y balun with a bandwidth of close to 6 GHz. An additional resonance can be caused by currents on the ground conductors of the input line. The effect of this resonance can be reduced by the introduction of an additional CPW bridge placed at the correct position with respect to the double-Y section [35]. Another type of transition between coplanar waveguides and coplanar striplines can also be used as a printed circuit balun. This design is based on an UWB transition design by Kim et al. [36] for monolithic microwave integrated circuit (MMIC) applications. This design relies on a symmetrical connection between the two grounds of the CPW and one arm of the CPS. This symmetry ensures that the currents on both ground conductors are combined with equal phase at the transition [36]. Butrym and Pivnenko [37] modified the MMIC design for PCB fabrication and feeding antennas by scaling it up in size. Their proposed design has an operating bandwidth of 300 MHz–6 GHz and can be fed with a subminiature A (SMA) connector. Radial stubs can also be used in the transition between coplanar waveguides and coplanar striplines or to create three-port coplanar waveguide to coplanar waveguide baluns (CPW-CPW balun) [38]. The transitions rely on the radial stub acting as a broadband open circuit to transfer power from the coplanar waveguide into the slotline. Such a transition can be wideband (two octaves or better) with low insertion loss of less than 1 dB [39]. The CPW-CPW balun consists of a T-junction which uses two radial open stubs, arranged such that they cause a 180° phase shift between the two output ports [40]. Radial open stubs have also been integrated into tapered slot antennas to form an integrated combination of balun and antenna [10]. Ring hybrids, also known as rat-race couplers, are normally used as power splitters and combiners. However, they can also be configured such that the phase difference at the output ports of a power splitter is 180°. Correspondingly, they can also be configured such that they can accept a phase difference of 180° at the inputs of a power combiners. Traditional ring hybrids have a limited bandwidth of around 20%, however various adaptations can be made to the design to extend the bandwidth [38,40]. Ho et al. [40] demonstrated a 180° hybrid coupler design with an octave bandwidth from 2 to 4 GHz. Similar to the tapered microstrip and Marchand baluns, this balun design increases in size as the lower cutoff frequency is reduced, because it requires sections of one-quarter and/or three-quarters of the wavelength, depending on the design. Traditional rat-race hybrid rings require a circumference of , although alternative designs exist which reduce this circumference to [39]. Recent advances in the production of RF integrated circuits has led to the availability of ultra-wideband differential amplifiers, which can be used to perform single-ended to differential conversion. These devices offer significant bandwidths, such as 6.5 GHz for the Analog Devices ADL5569 [41] and 7 GHz for the Texas Instruments LMH3401 [42]. These devices are particularly useful when used with stepped-frequency continuous wave (SFCW) radar systems, since their output power is relatively constant, unlike impulse radars. SFCW radar systems can also adjust the output power at each frequency, allowing them to match the frequency-dependent maximum input power level for the amplifiers across their operating band. These wideband amplifiers offer the potential to offer a good wideband match to the single-ended feed cables, and they amplify the signal instead of attenuating it. The amplification also allows them to offset insertion losses in long and/or high-loss feed cables. The active nature of these active baluns increases the power consumption of the GPR system, which could be an issue in battery-powered devices [41,42]. The need to supply power to the antennas can also increase the overall system complexity. Finally, the noise figure of these differential wideband amplifiers may be an issue in very low noise UWB systems [41,42].
3. Experimental Methodology
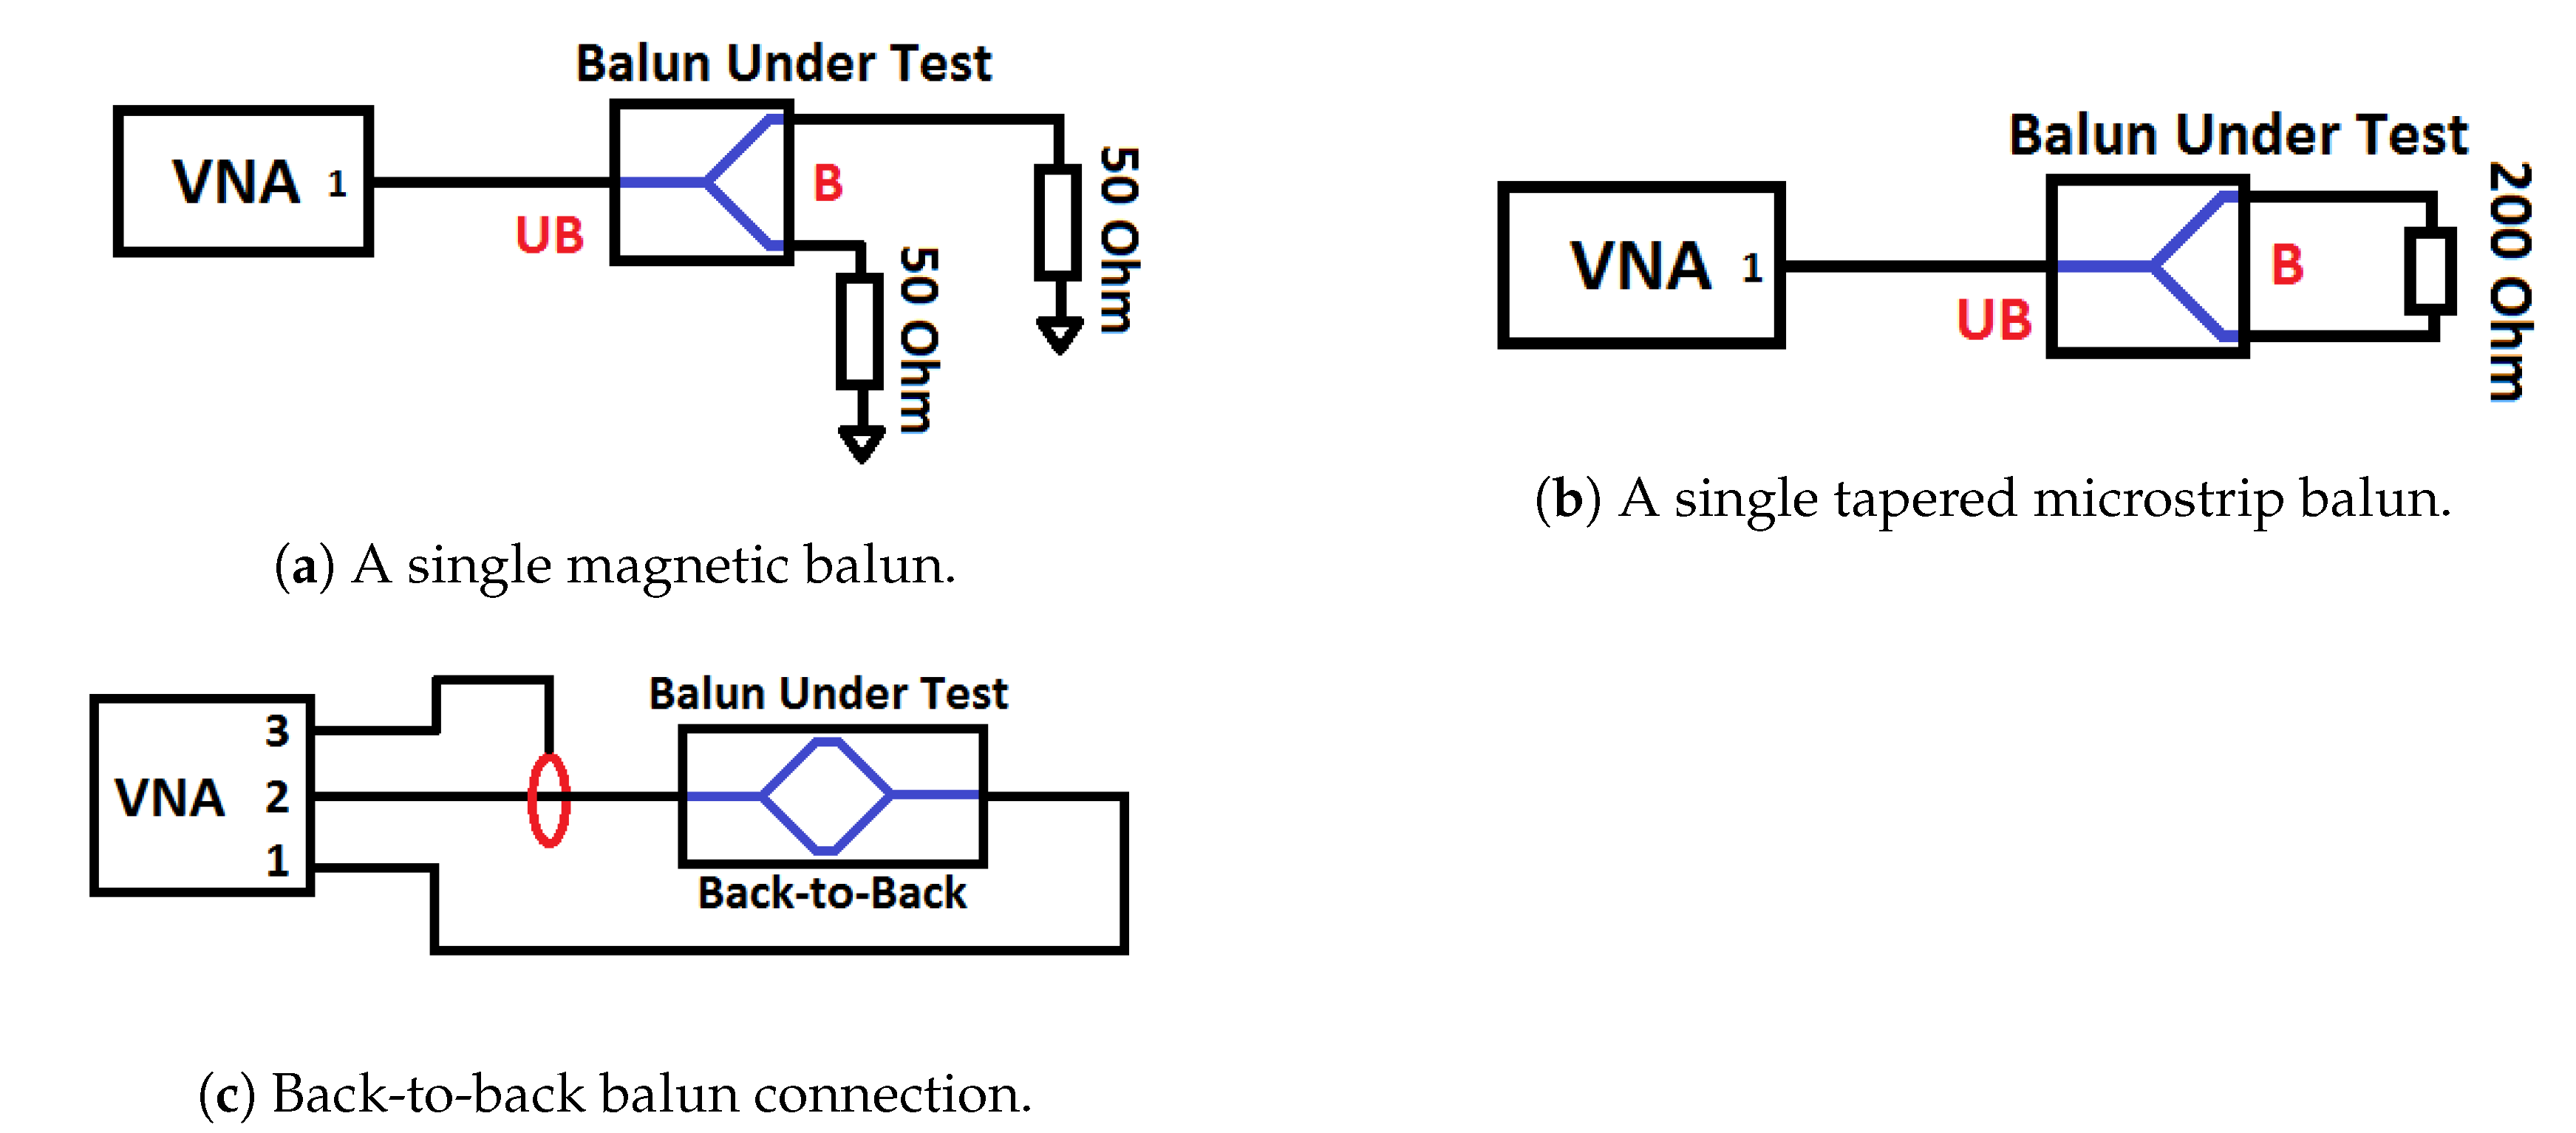
In this study, the performance of five different baluns was evaluated. These baluns can be placed into three categories: tapered microstrip baluns, magnetic baluns and active baluns. Two tapered microstrip baluns were designed, manufactured and tested, based on the design by Vinayagamoorthy [19]. Both were manufactured on Rogers RT5880 material, the first measuring 16 cm in length and the second 24 cm. Two more magnetic baluns were evaluated, the Minicircuits TCM4-452X and the Minicircuits TCM1-63AX+. For both magnetic baluns, the circuit layout and construction was as directed in the manufacturer’s datasheet. The active balun was designed around the LMH3401 wideband amplifier from Texas Instruments. Here too, the circuit and layout were implemented using the recommendations from the datasheet [42]. Three experiments were performed on each of the baluns: (i) evaluating the reflection coefficient of a single balun; (ii) measuring the reflection coefficient, insertion loss and phase distortion of back-to-back baluns; and (iii) measuring the common mode current on the feed cable. The diagrams in Figure 1a–c show the experimental setup for each of the experiments, respectively. Figure 1a shows how a single magnetic balun is connected to the Vector Network Analyzer (VNA), with the balanced (B) end terminated to ground. Figure 1b shows the same connections for the case of the single tapered microstrip balun. This configuration is used to measure the reflection coefficient of a single balun.
Figure 1c shows the configuration used to measure the performance of the back-to-back baluns. A third VNA port is connected to the RF current probe to measure the common mode current on both sides of the baluns at the same time, by recording (the power received at port 3 when exciting port 1) and . In the case of the active balun, the balun under test is flipped around before taking the measurement, as the amplifiers are non-reciprocal. The measurements were taken using a Keysight Technologies M9018A VNA, whose configuration is summarized in Table 1. The current probe used to measure the common mode current is an ETS-Lindgren 94111-1 Current Probe. Since the current probe is specified to work up to 1 GHz, the results taken with the probe are shown only up to that frequency. The manufacturer specifies the typical probe transfer impedance as being between 1 and 10 across the whole operating band. The RF cable used in this experiment was an AtlantecRF AFX-CA-141 series cable with a shielding value of 90 dB minimum.
4. Results and Discussion
4.1. Active Balun Input Power Limitations
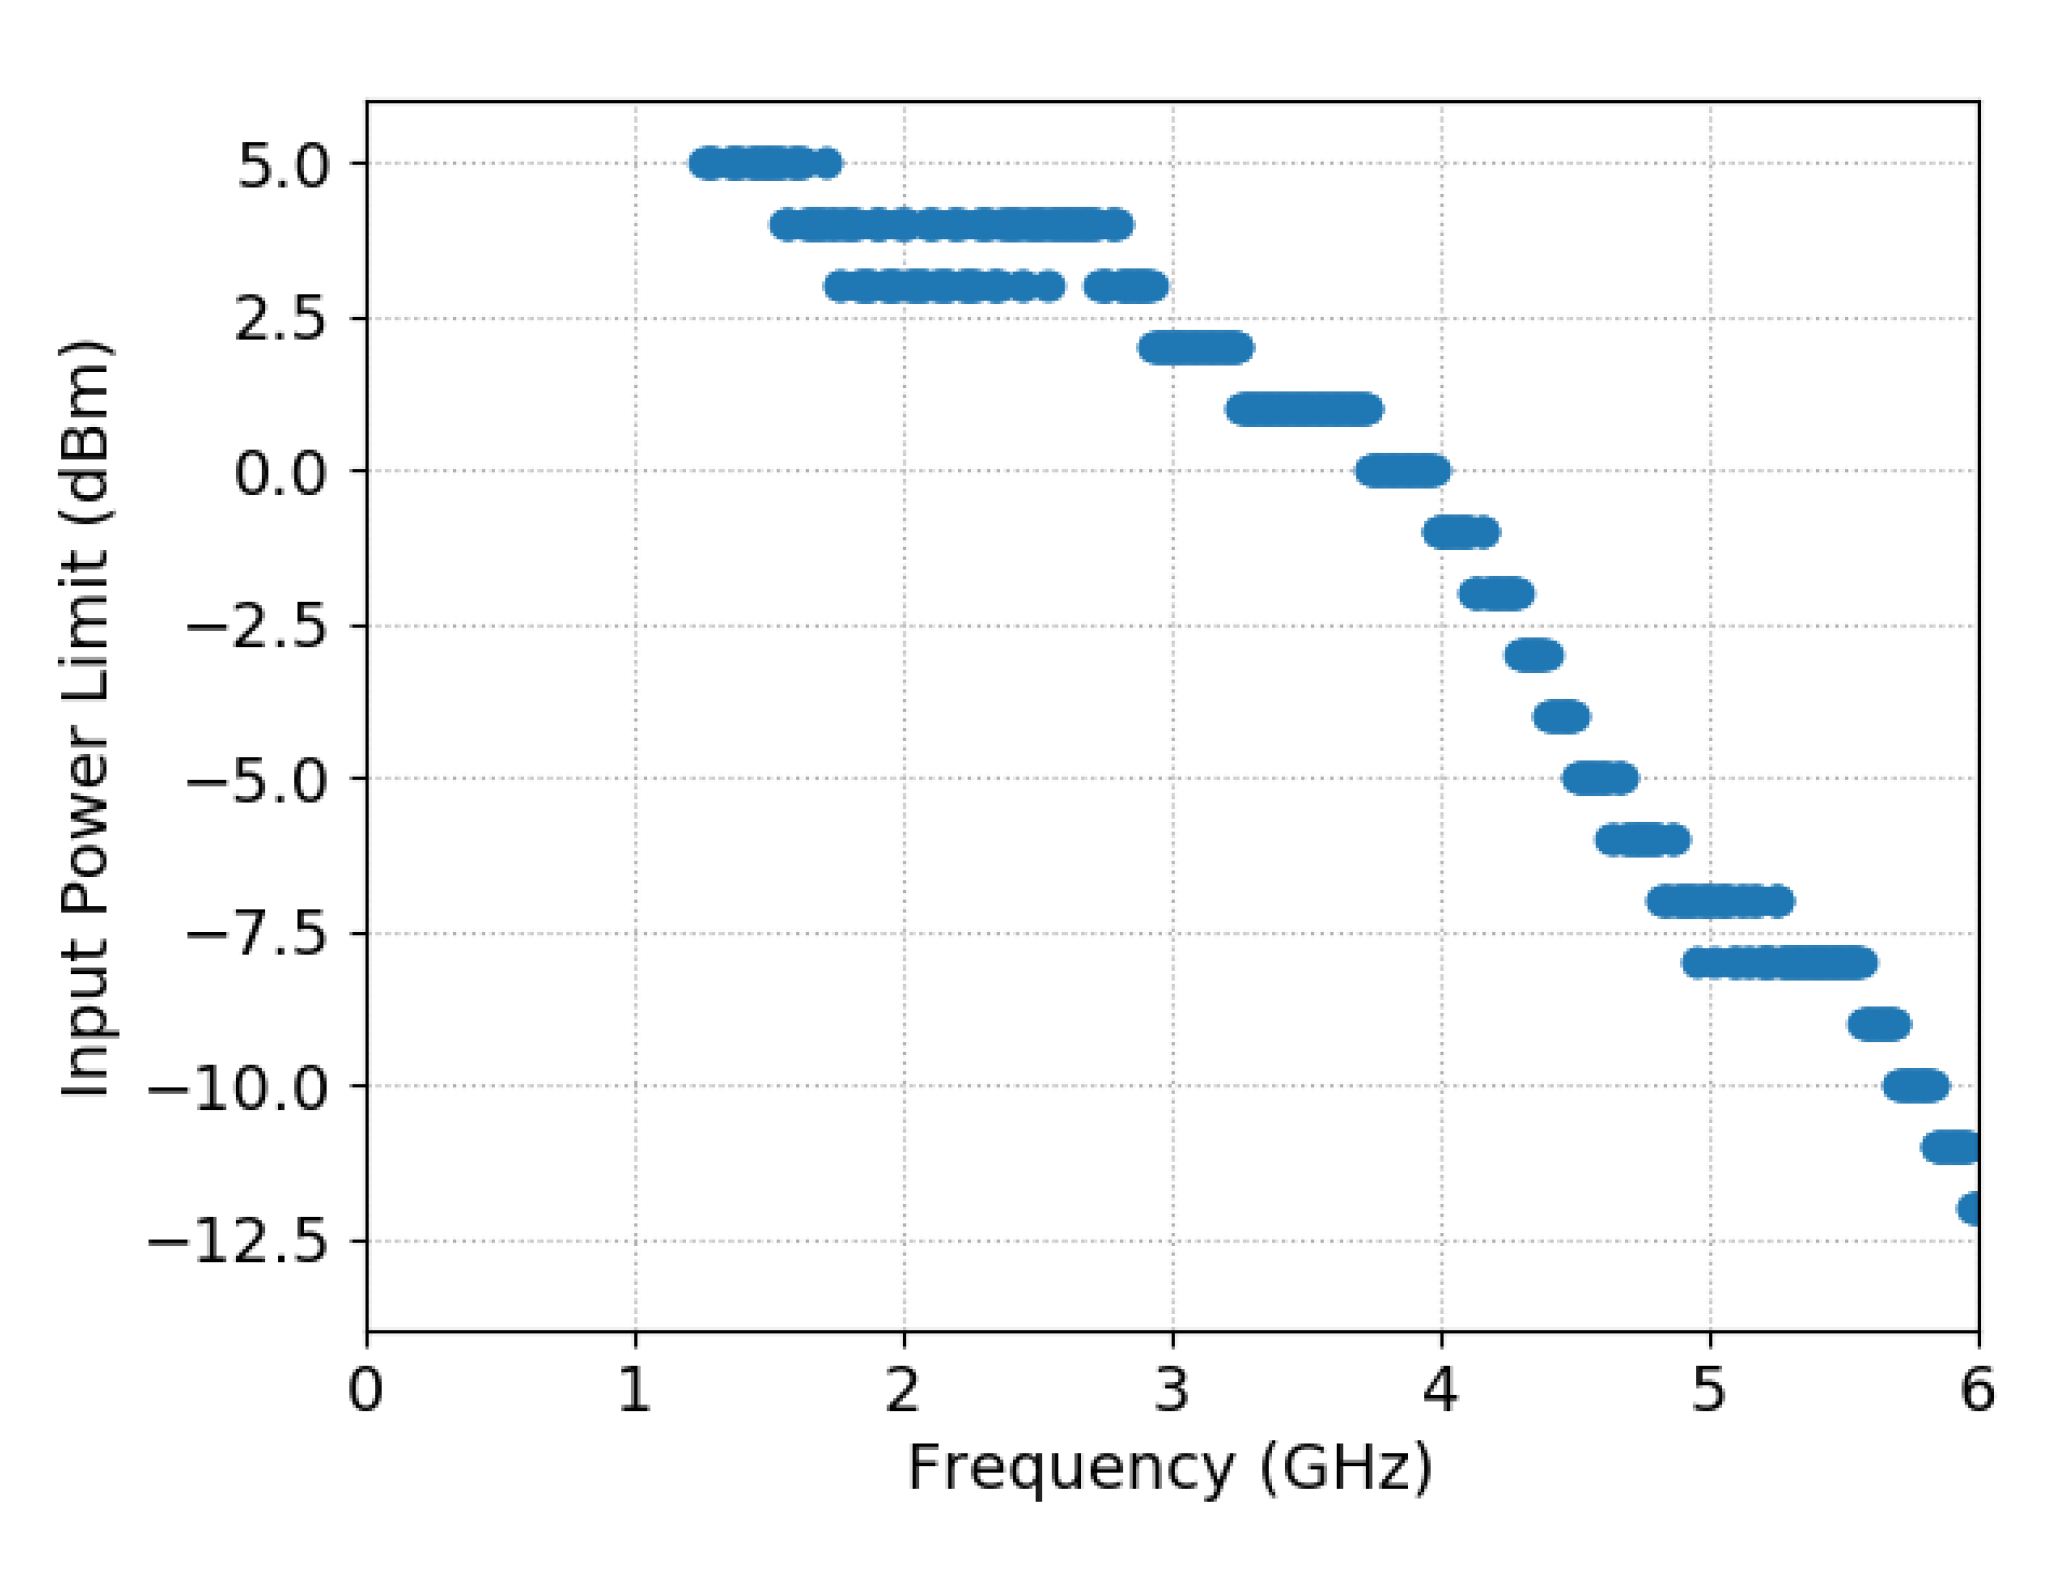
An important consideration when using amplifiers as baluns is that they have limitations regarding the maximum input and output power levels. Exceeding the power limitations could lead to non-linear behavior from the amplifiers. This may cause undesirable artefacts in the performance characteristics such as the reflection coefficient, transmission coefficient and phase response. In this experiment, the power limitation of the LMH 3401 amplifier in a back-to-back configuration was evaluated, as in Figure 1c. The input power to the amplifiers was varied between +5 and −15 dBm in steps of 1 dBm, and the reflection and transmission coefficients were recorded at each input power level. Figure 2 shows the input power limit which causes a 1 dB compression of the output power level as a function of frequency. Since the measurements were taken in steps of 1 dBm, some quantization can be observed in this figure. It can be seen that the input power limit changes with the input frequency, which suggests that the limiting factor at above 1.2 GHz is primarily the slew rate of the amplifier output. Other limits such as the input and output headroom and the noise figure of the amplifier should also be considered. The key operating characteristics are summarized in Table 2 based on the information from the datasheet [42].
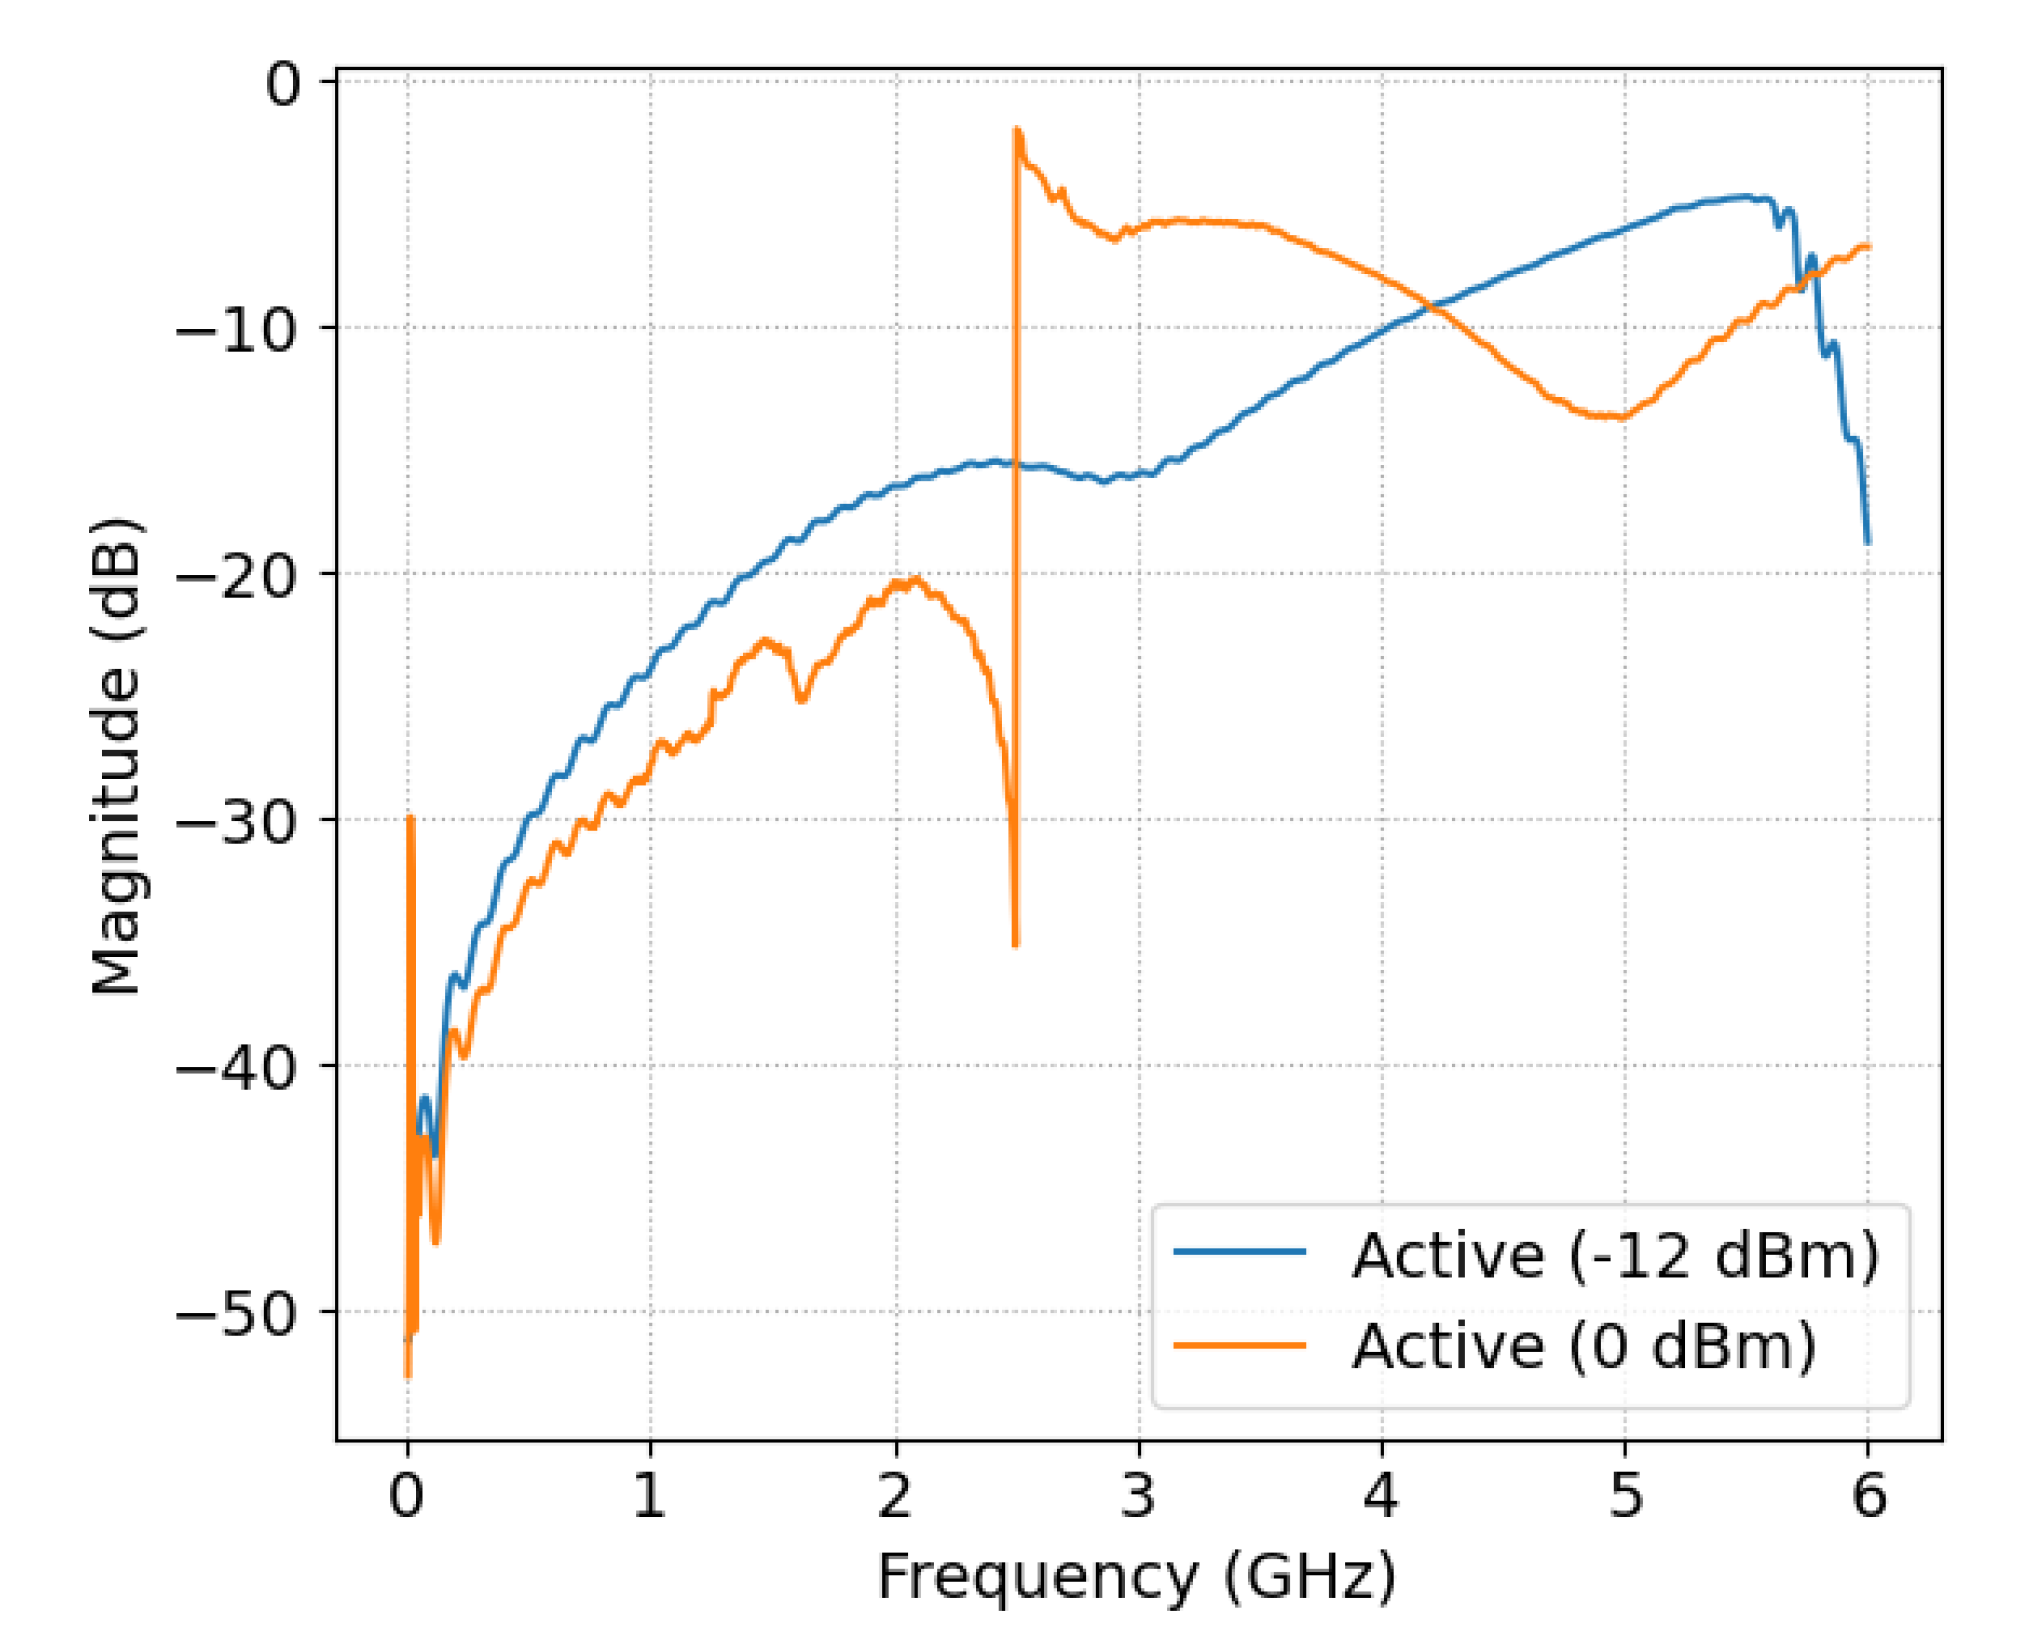
When the input power limit of the amplifier in the active balun is exceeded, non-linearities can be observed in the reflection coefficient, the transmission coefficient and the phase through the baluns. Figure 3 shows an example of such a discontinuity in the reflection coefficient at 0 dBm input power. Based on these results, the input power to the active balun was reduced to −12 dBm in the subsequent experiments. The reflection coefficient for this configuration is also shown in Figure 3. From this experiment, alone it is not clear whether the power limitations are due to the limits of the transmit or receive amplifiers. A follow-up experiment was performed with the amplifiers connected to bowtie antennas placed face-to-face, and the results suggest that both amplifiers contribute to the discontinuities found here. The discontinuities are still present, but at higher frequencies for equal input power levels. In practice, if the baluns are connected to bowtie antennas, there would be significant losses between transmitter and receiver and further experimentation can be performed to fully evaluate the amplifiers’ non-linearities in those conditions.
4.2. Single Balun Measurements
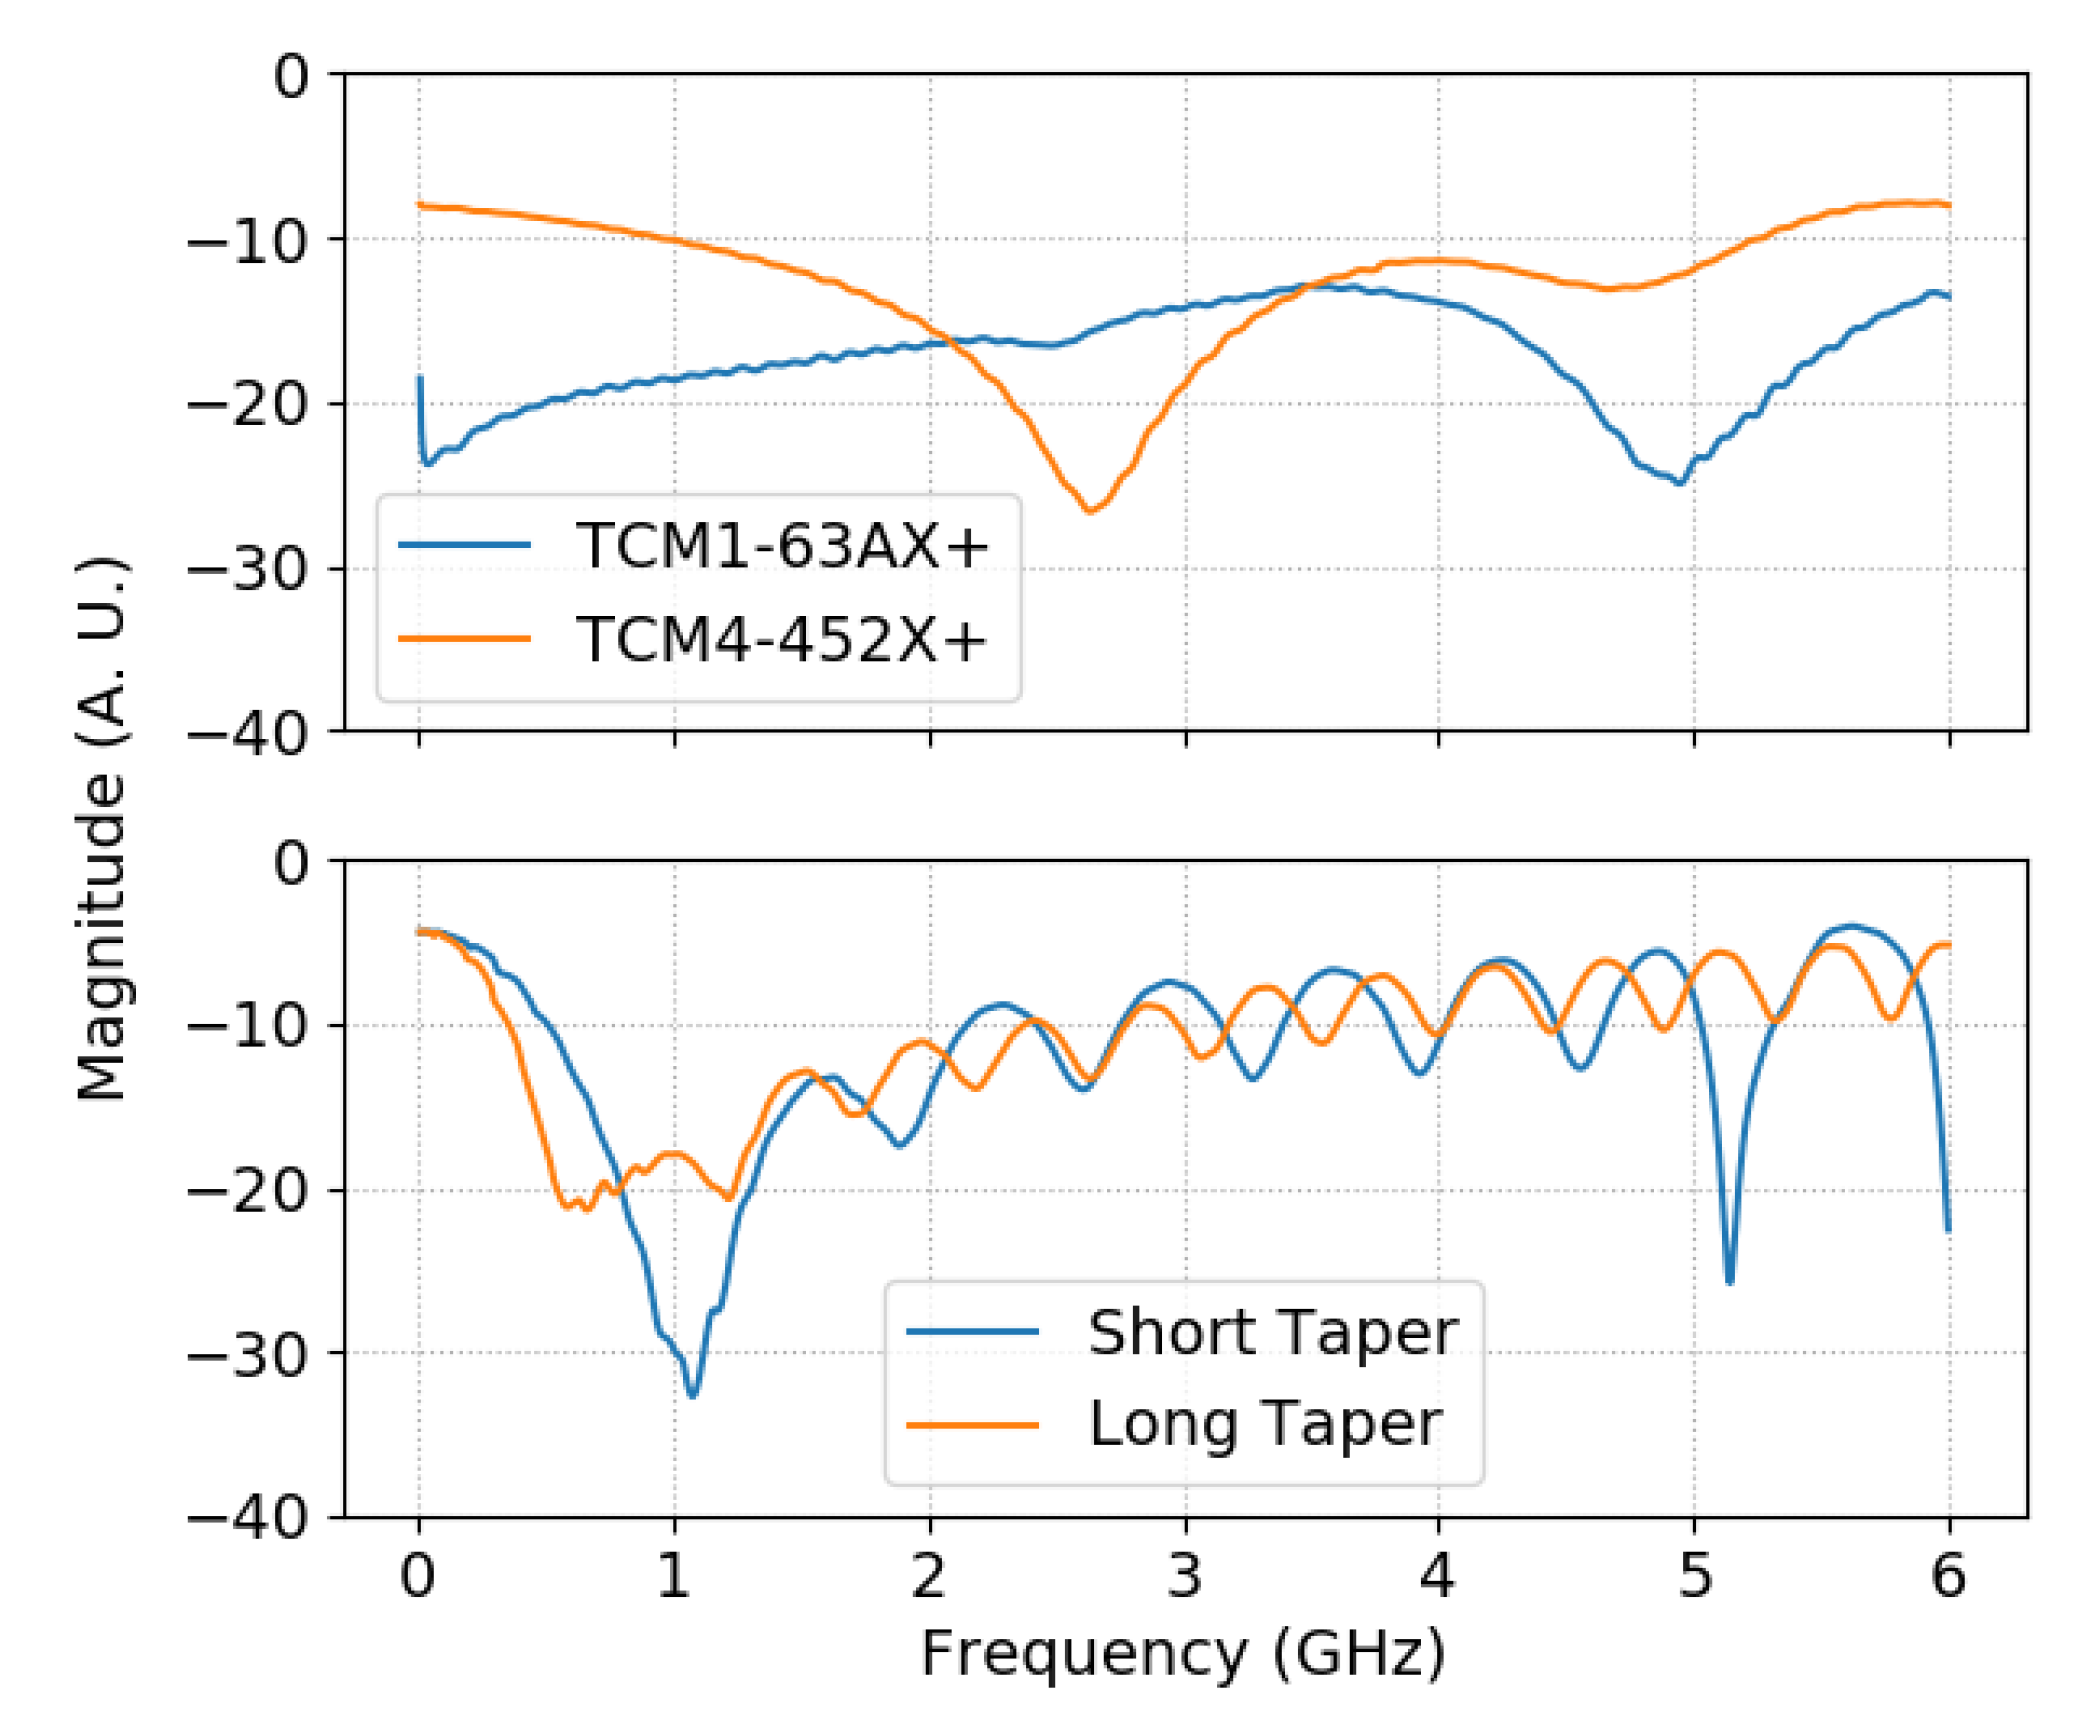
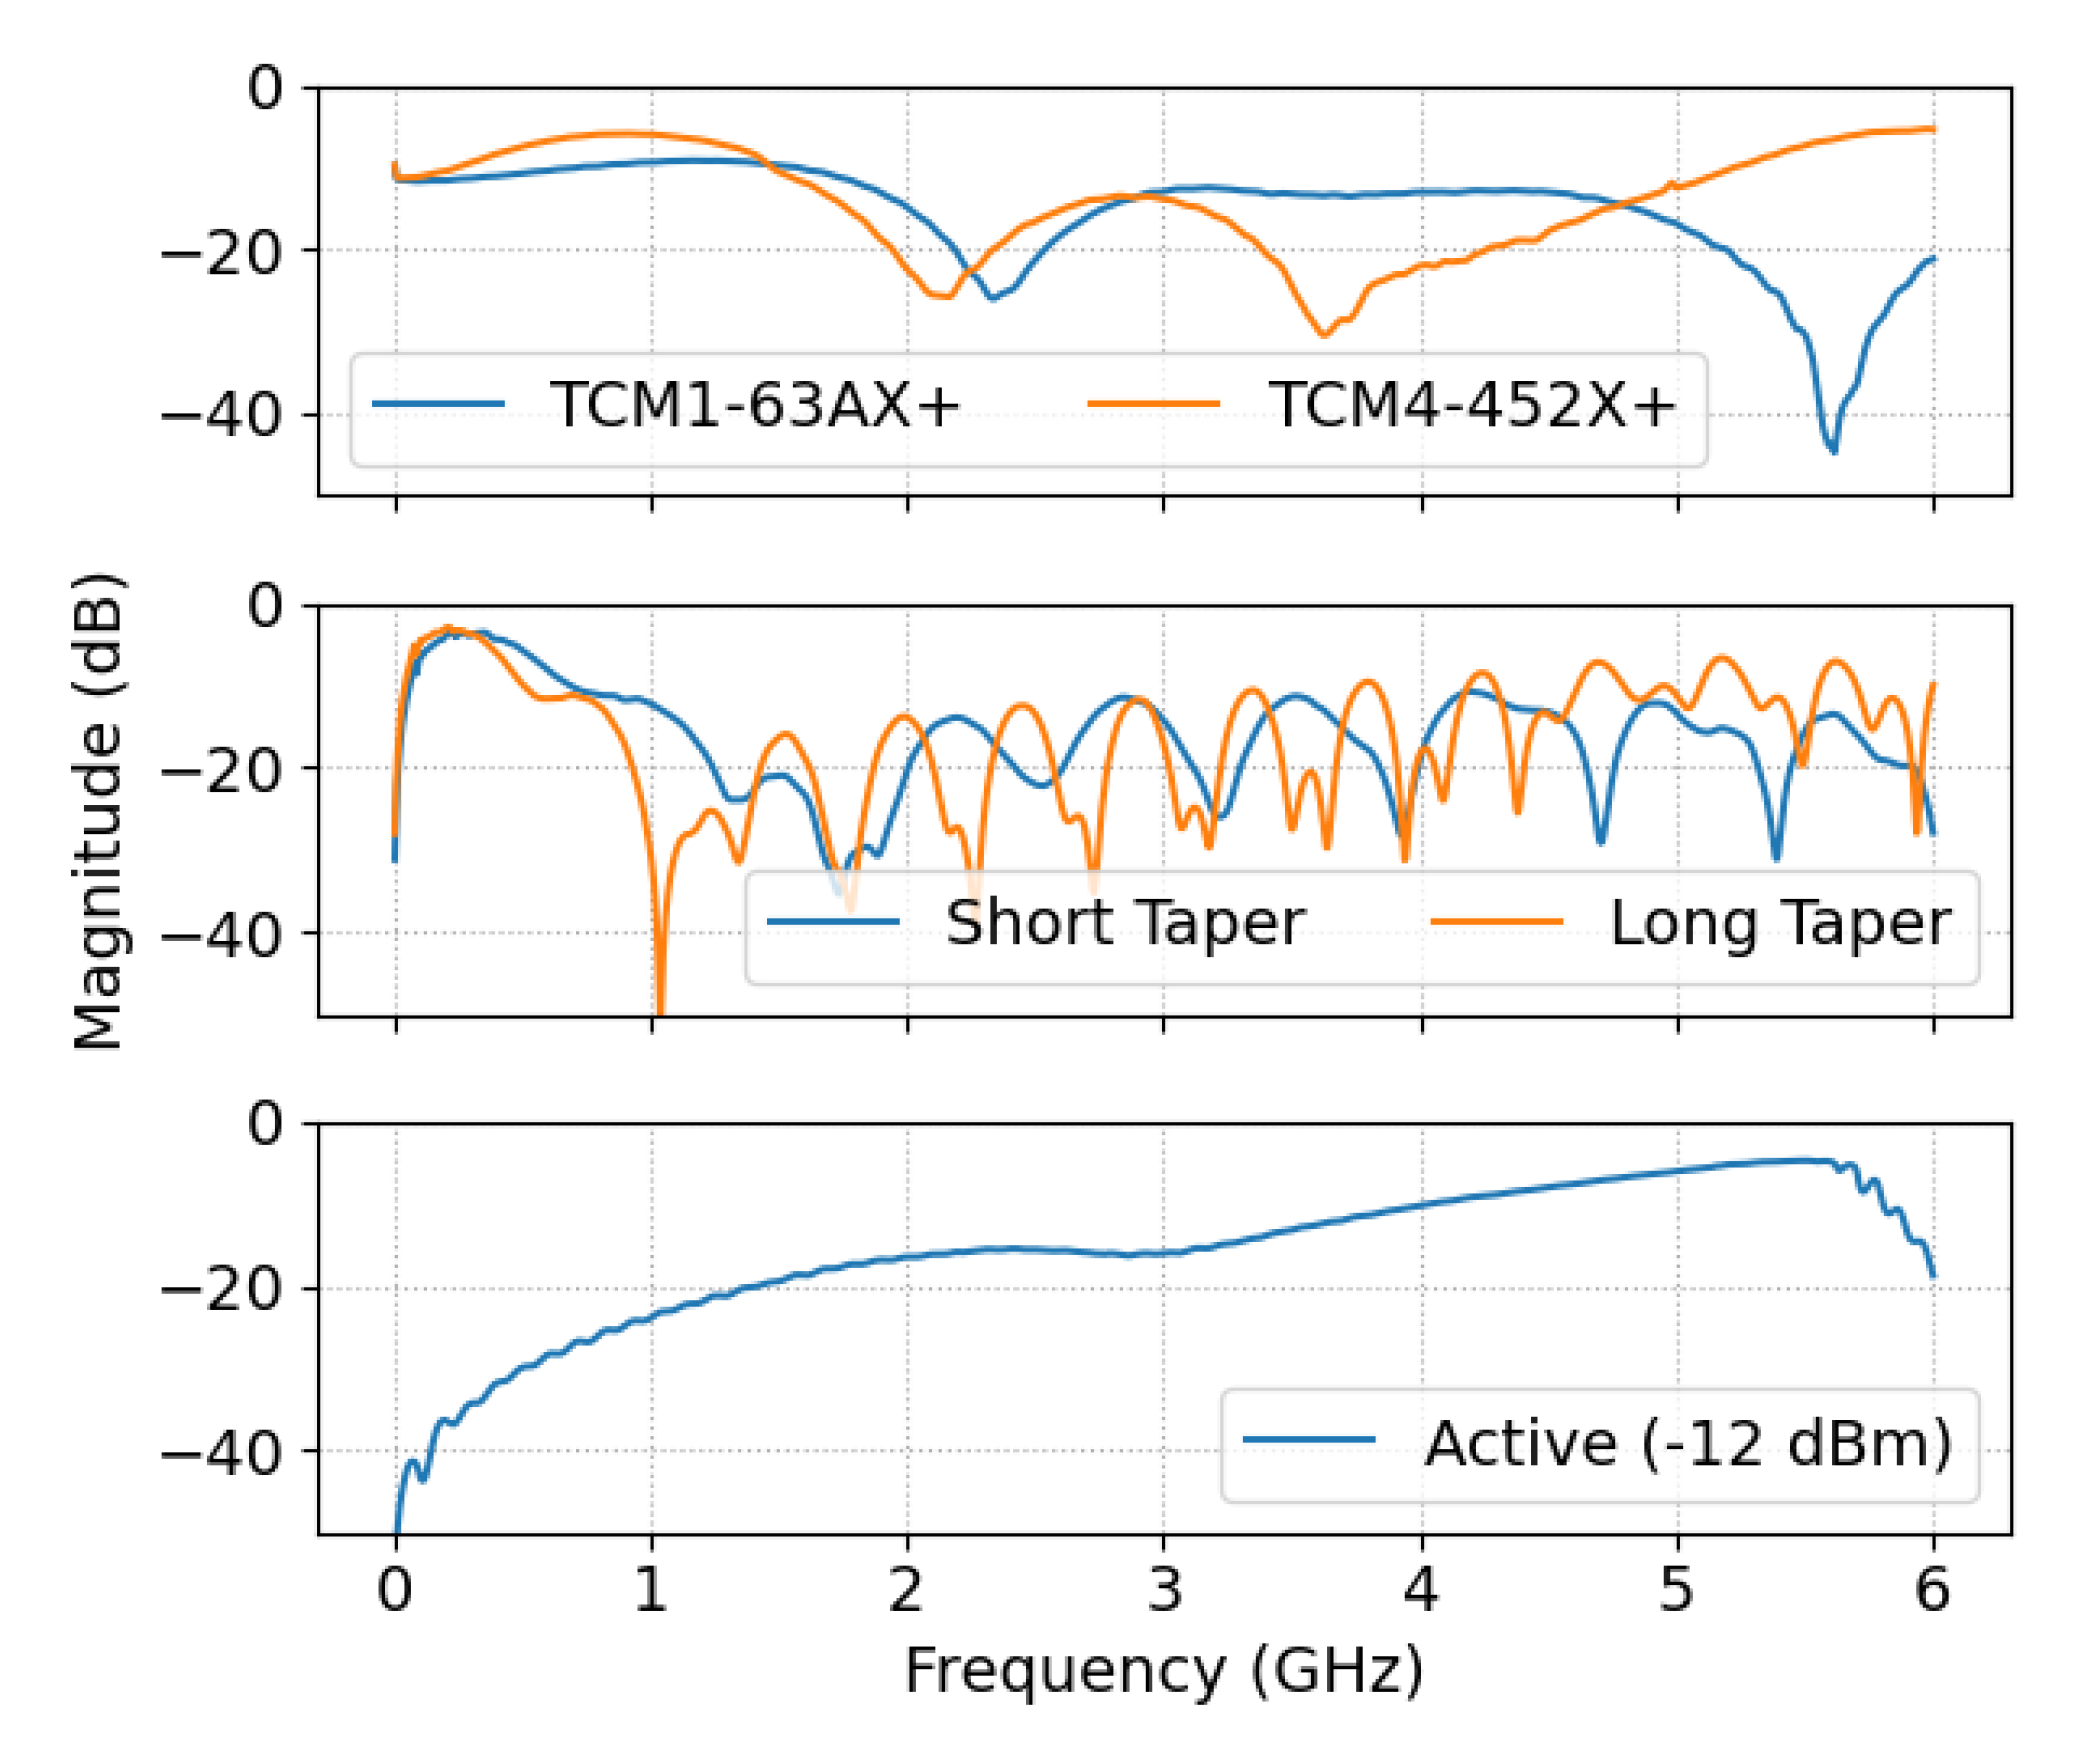
The reflection coefficient of the single baluns was evaluated by placing a load on the balanced end of the baluns, as shown in Figure 1a,b. This experiment was performed for all baluns except for the active device, as it was impractical to place a load resistor on the narrow differential input/output tracks. The reflection coefficients for the other baluns are shown in Figure 4. It can be seen that the TCM1-63AX+ magnetic balun had the best reflection coefficient. Furthermore, the long tapered microstrip balun had better performance, especially at approximately 0.2 GHz, which matches with the theory. The transition from the unbalanced end to the balanced end has to be performed gradually, and the lowest operating frequency is determined by its length, which explains why the longer balun performs better. The tapered microstrip baluns also showed a resonance behavior which corresponds to their length.
4.3. Back-to-Back Measurements
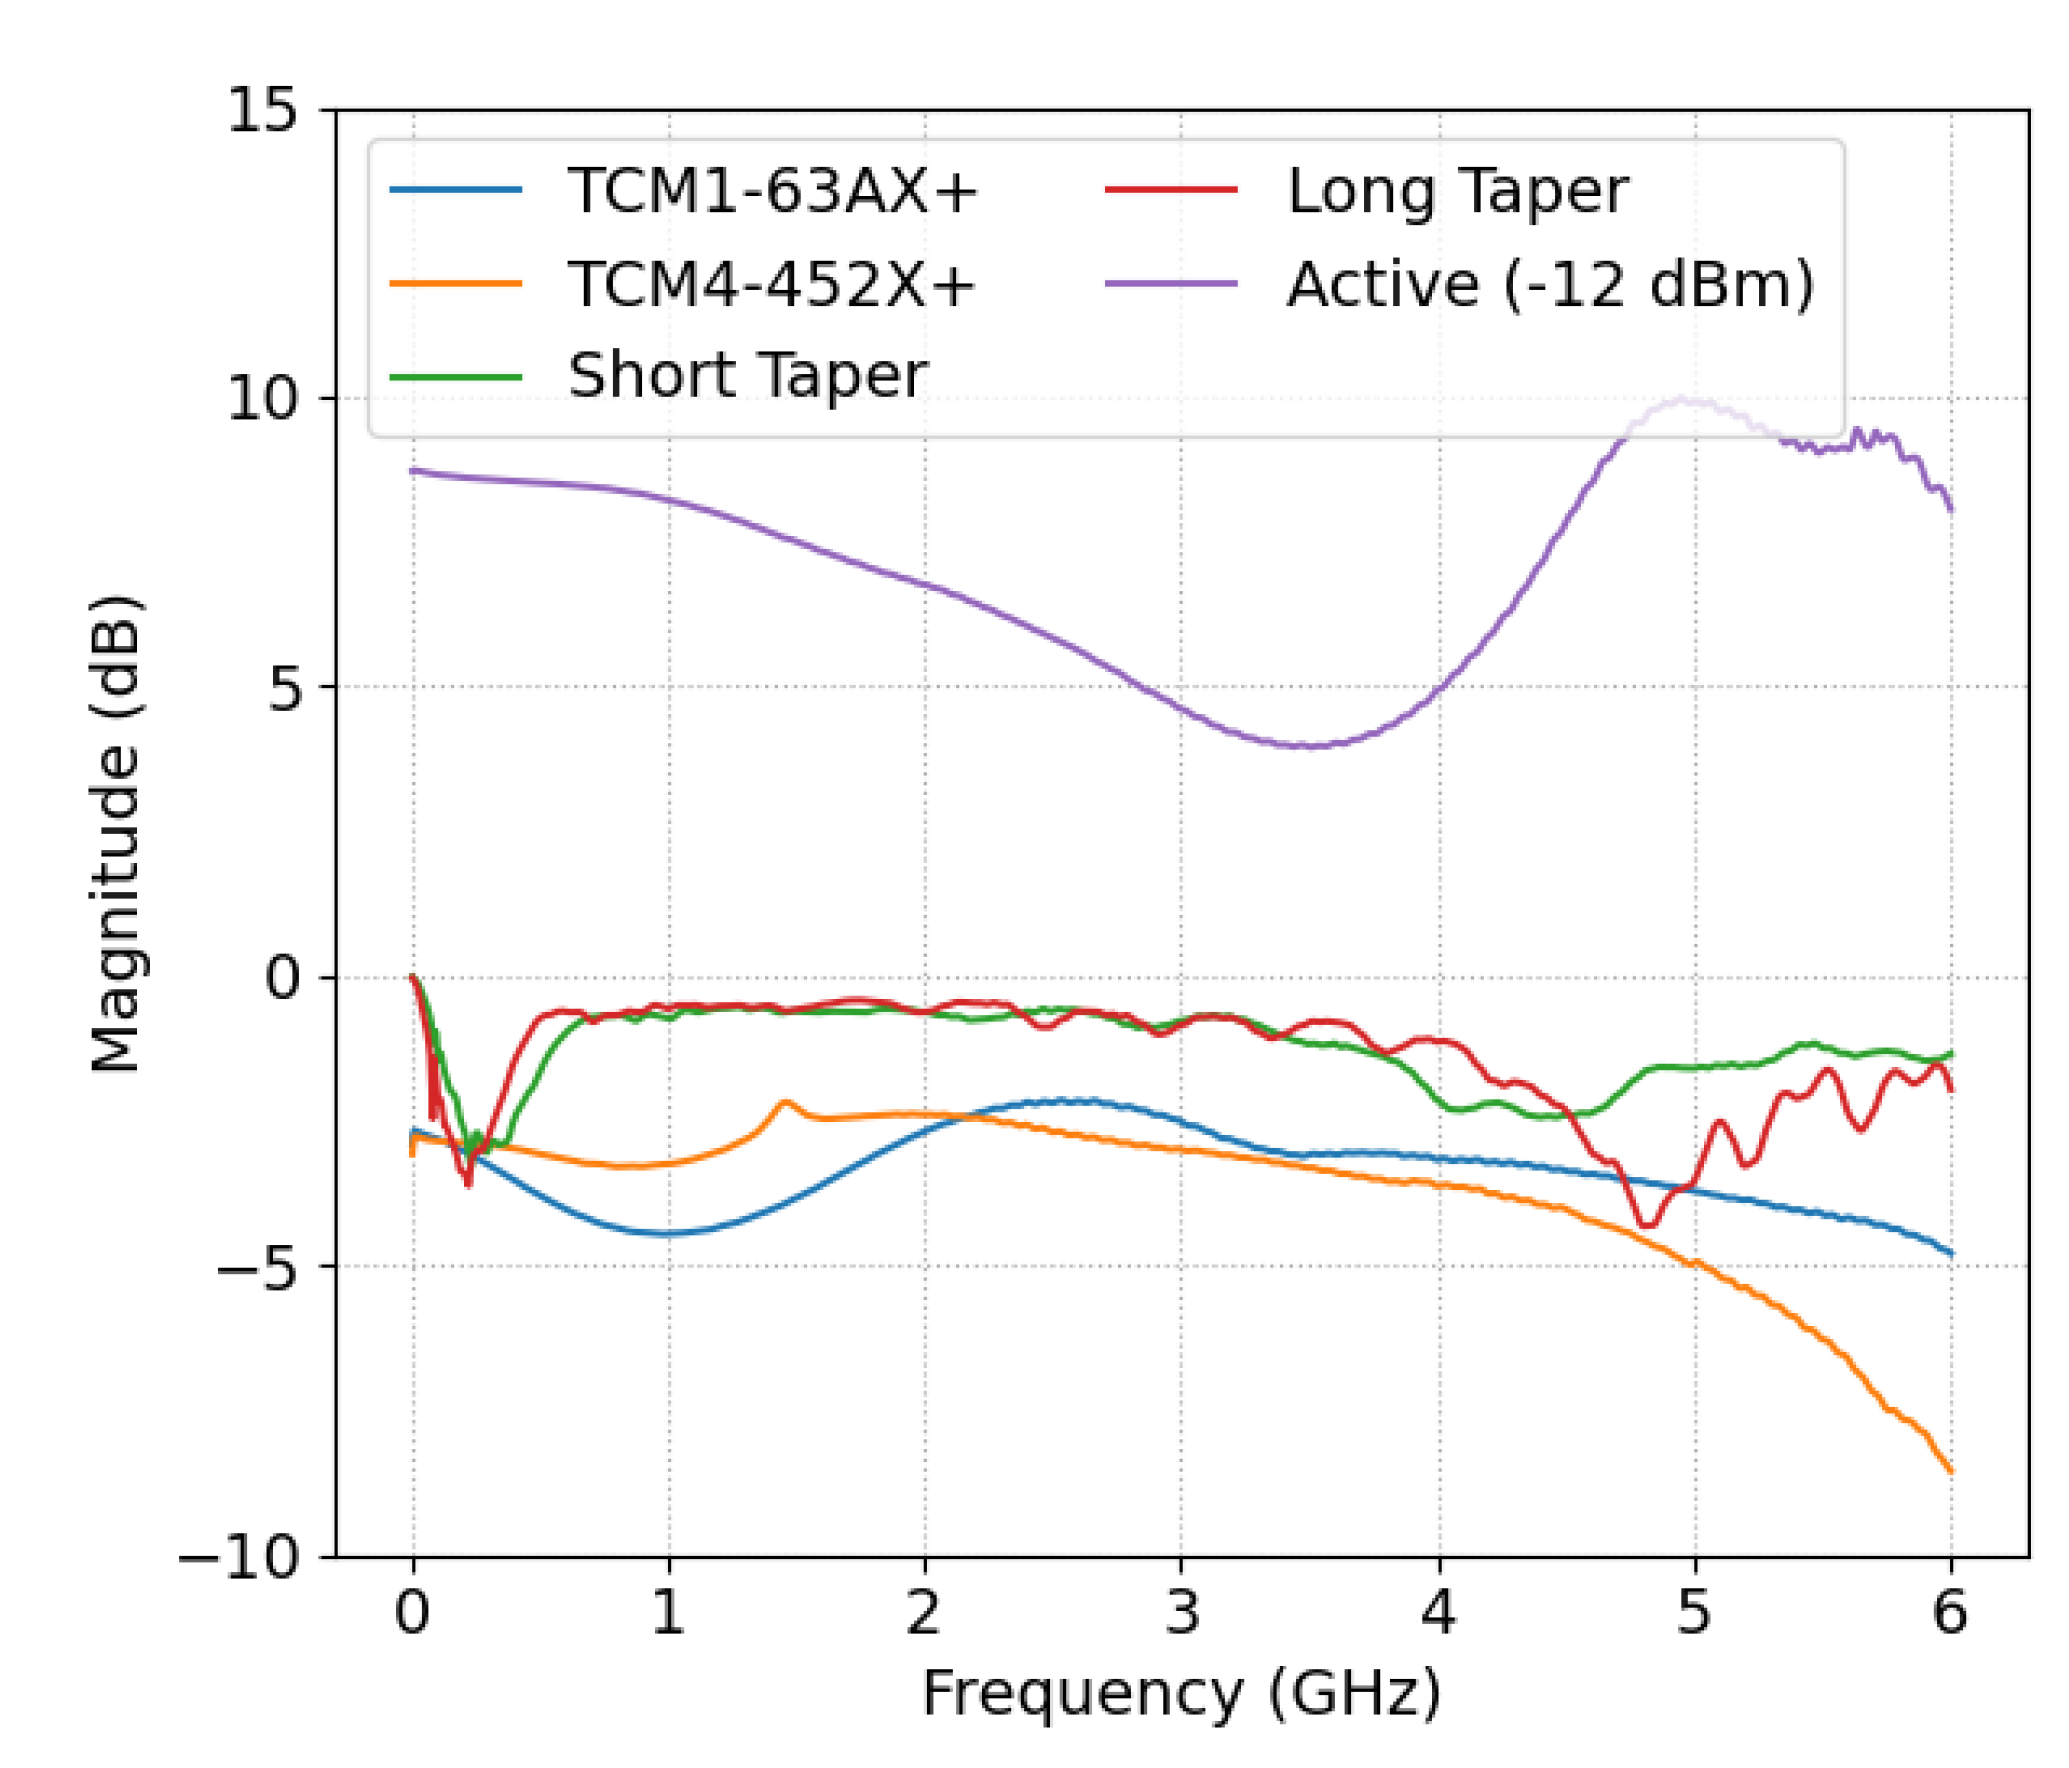
The reflection coefficient of the baluns, when connected back-to-back, is shown in Figure 5. In these tests, the active balun had the best performance at low frequencies, while the microstrip lines performed the worst overall. As the frequency increased, the reflection coefficient of the active baluns increased, while that of the microstrip baluns improved. Between 1 and 1.5 GHz, the TCM4-452X magnetic balun had the worst performance, while the TCM1-63AX+ has a flat reflection coefficient at approximately −10 dB, apart from a resonance at 2.4 GHz. The back-to-back insertion loss is shown in Figure 6. The active balun had a positive insertion loss, since the amplifiers apply a gain to the signal. The magnetic baluns had the highest insertion loss, with the TCM4-452X showing more loss below 2 GHz, and the TCM1-63AX+ having the worse loss above 2 GHz. The microstrip baluns had a relatively flat insertion losses across the frequency band, with the exception of a resonance at low frequencies, which corresponds to the total length of the back-to-back balun structures.
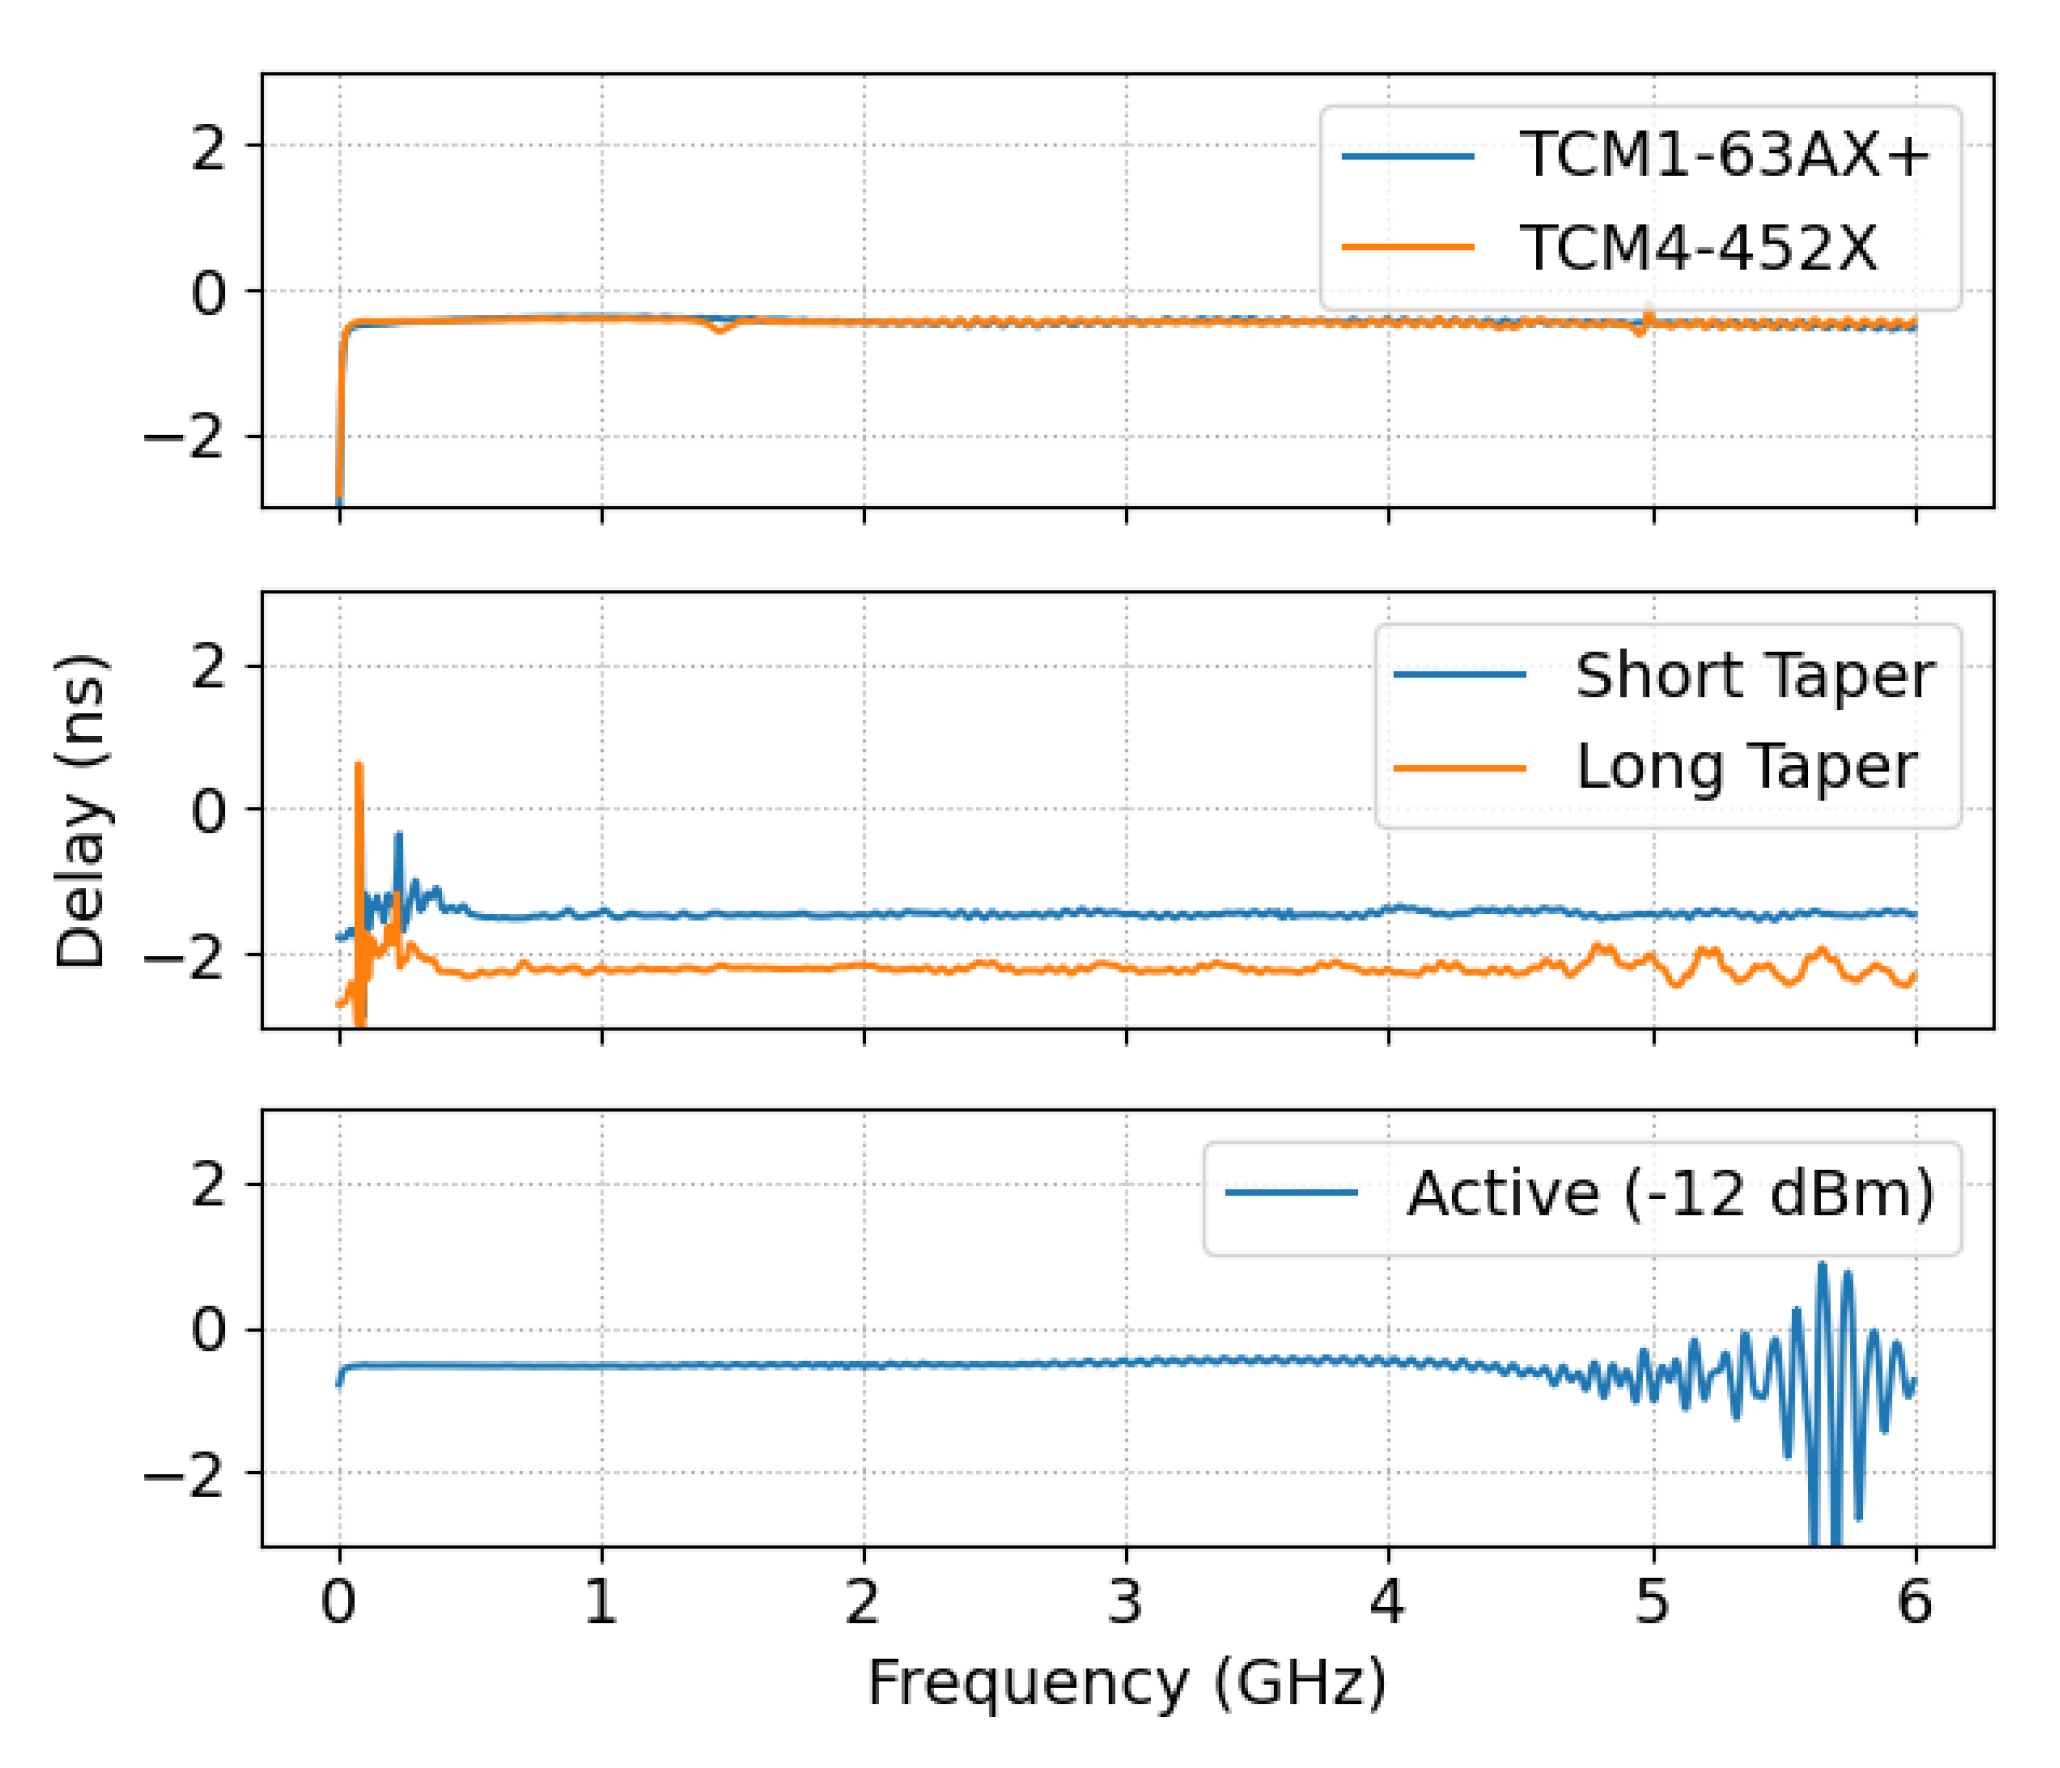
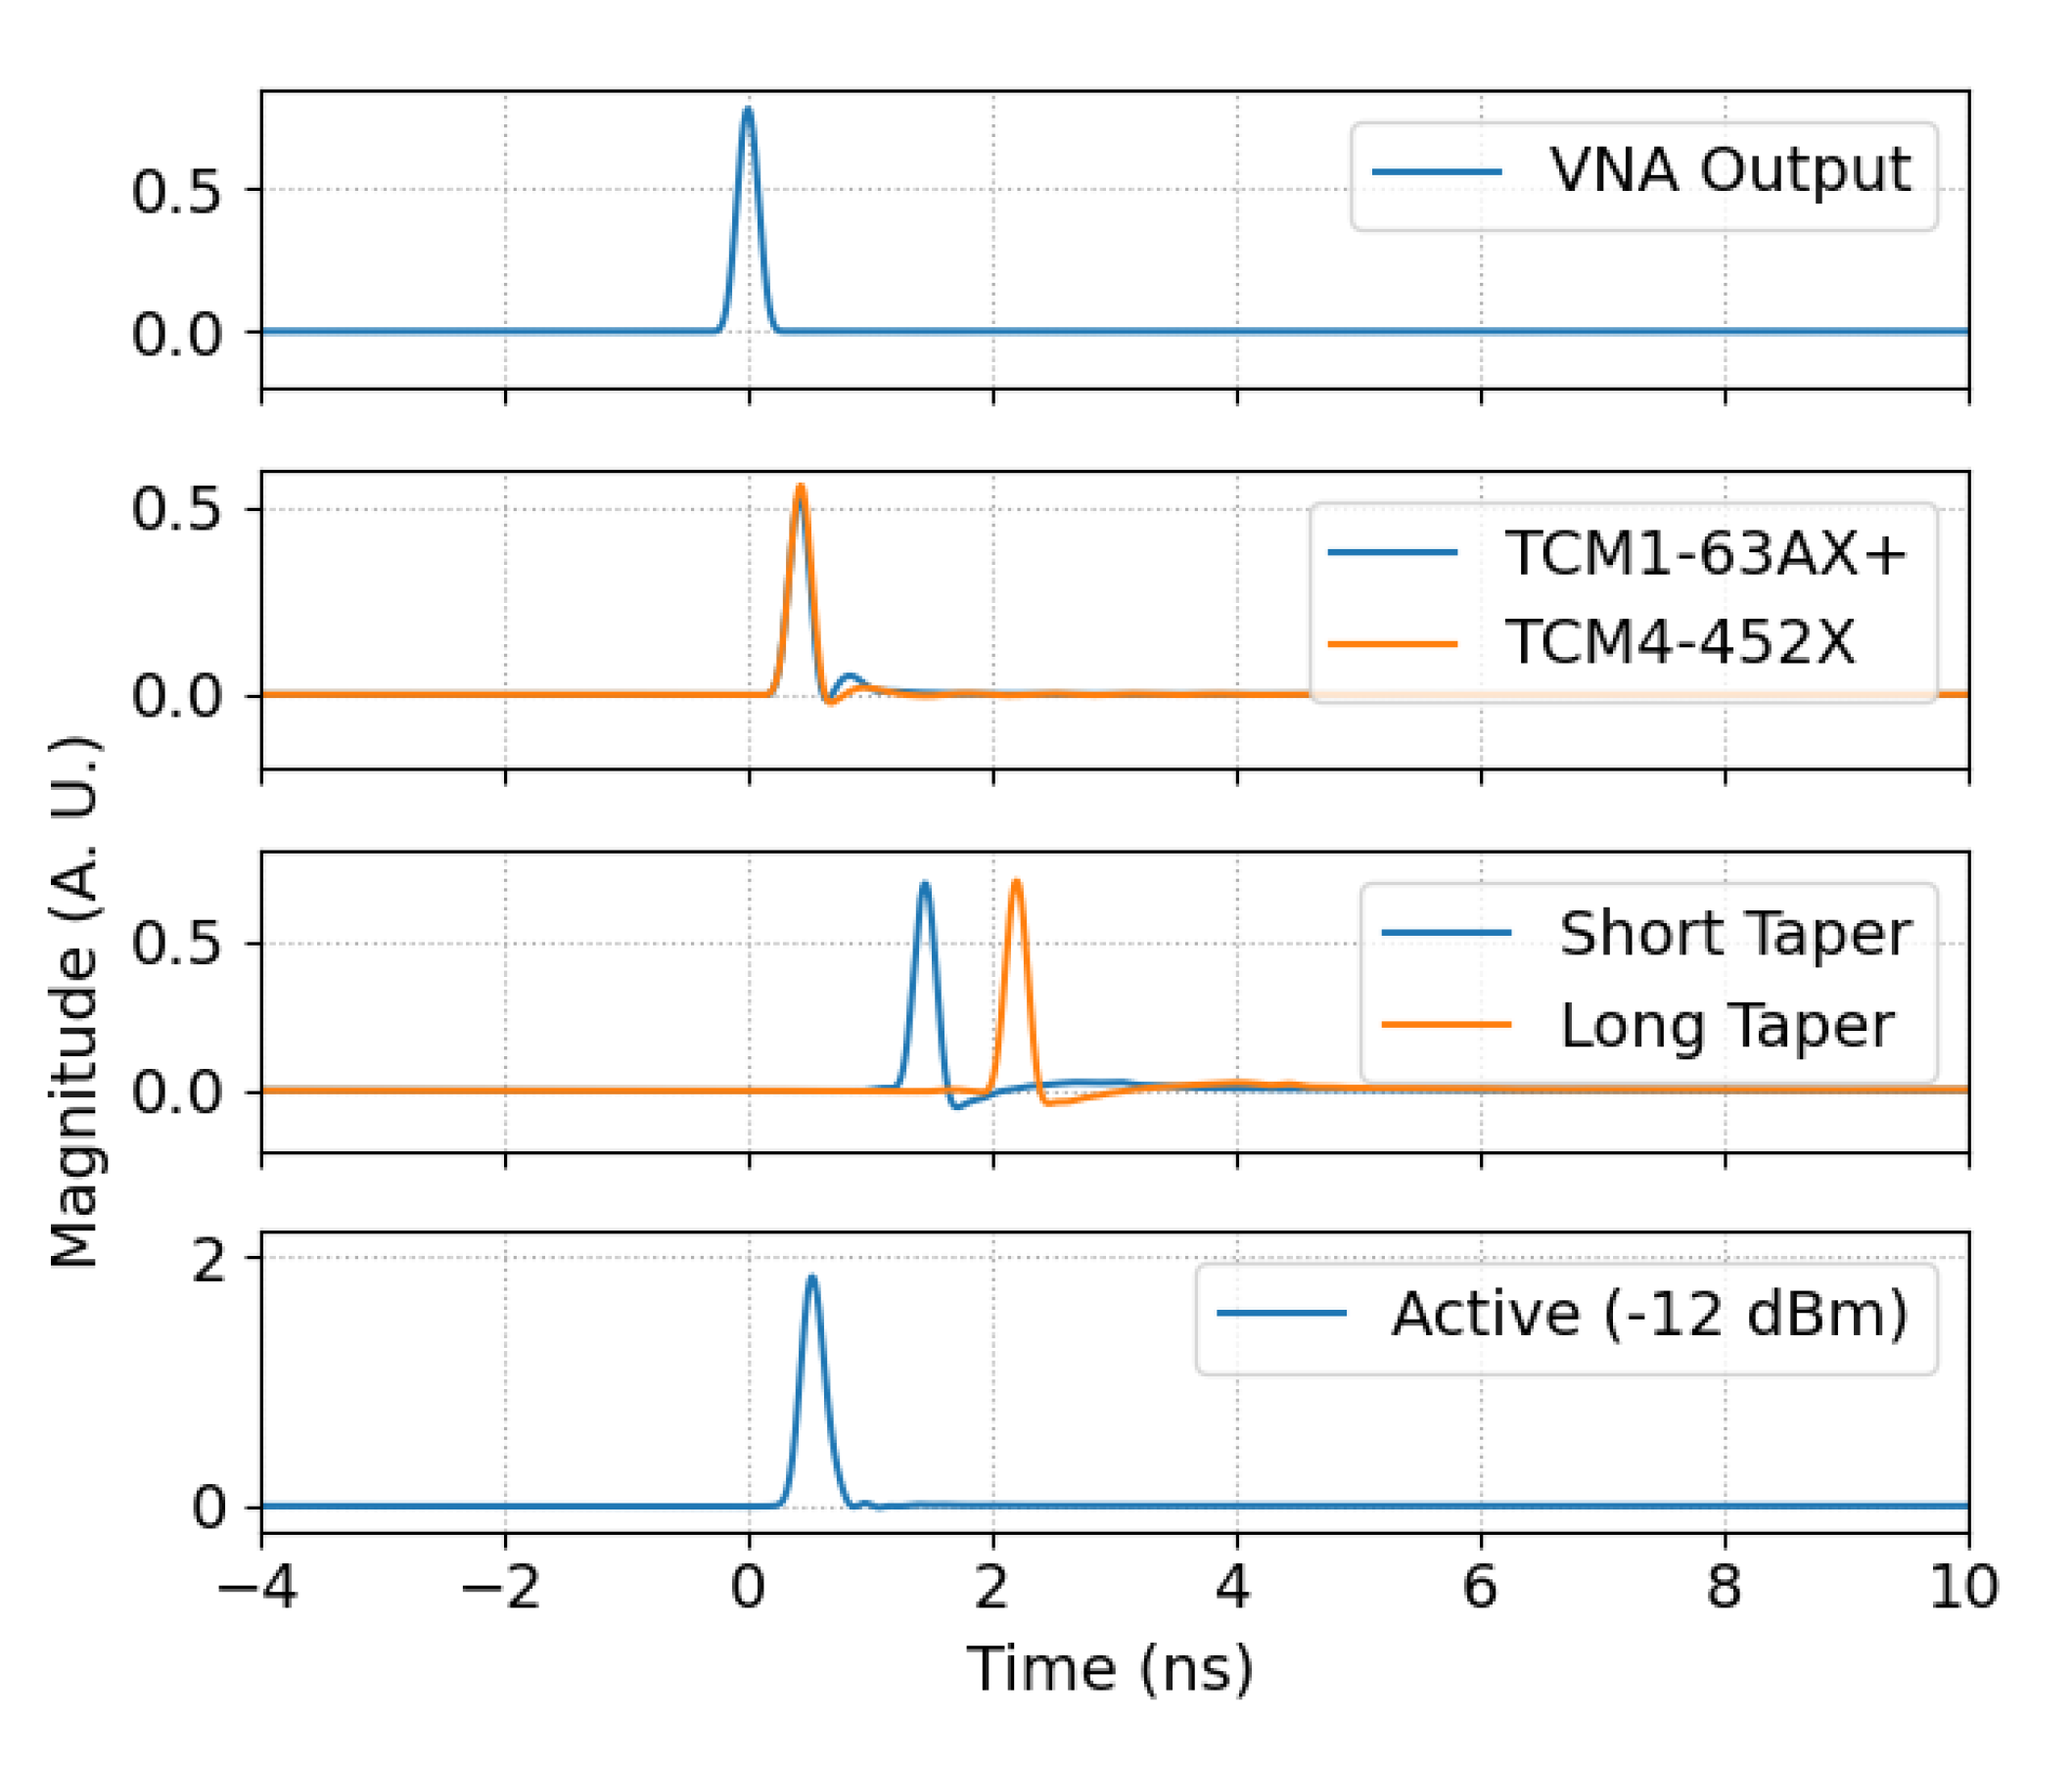
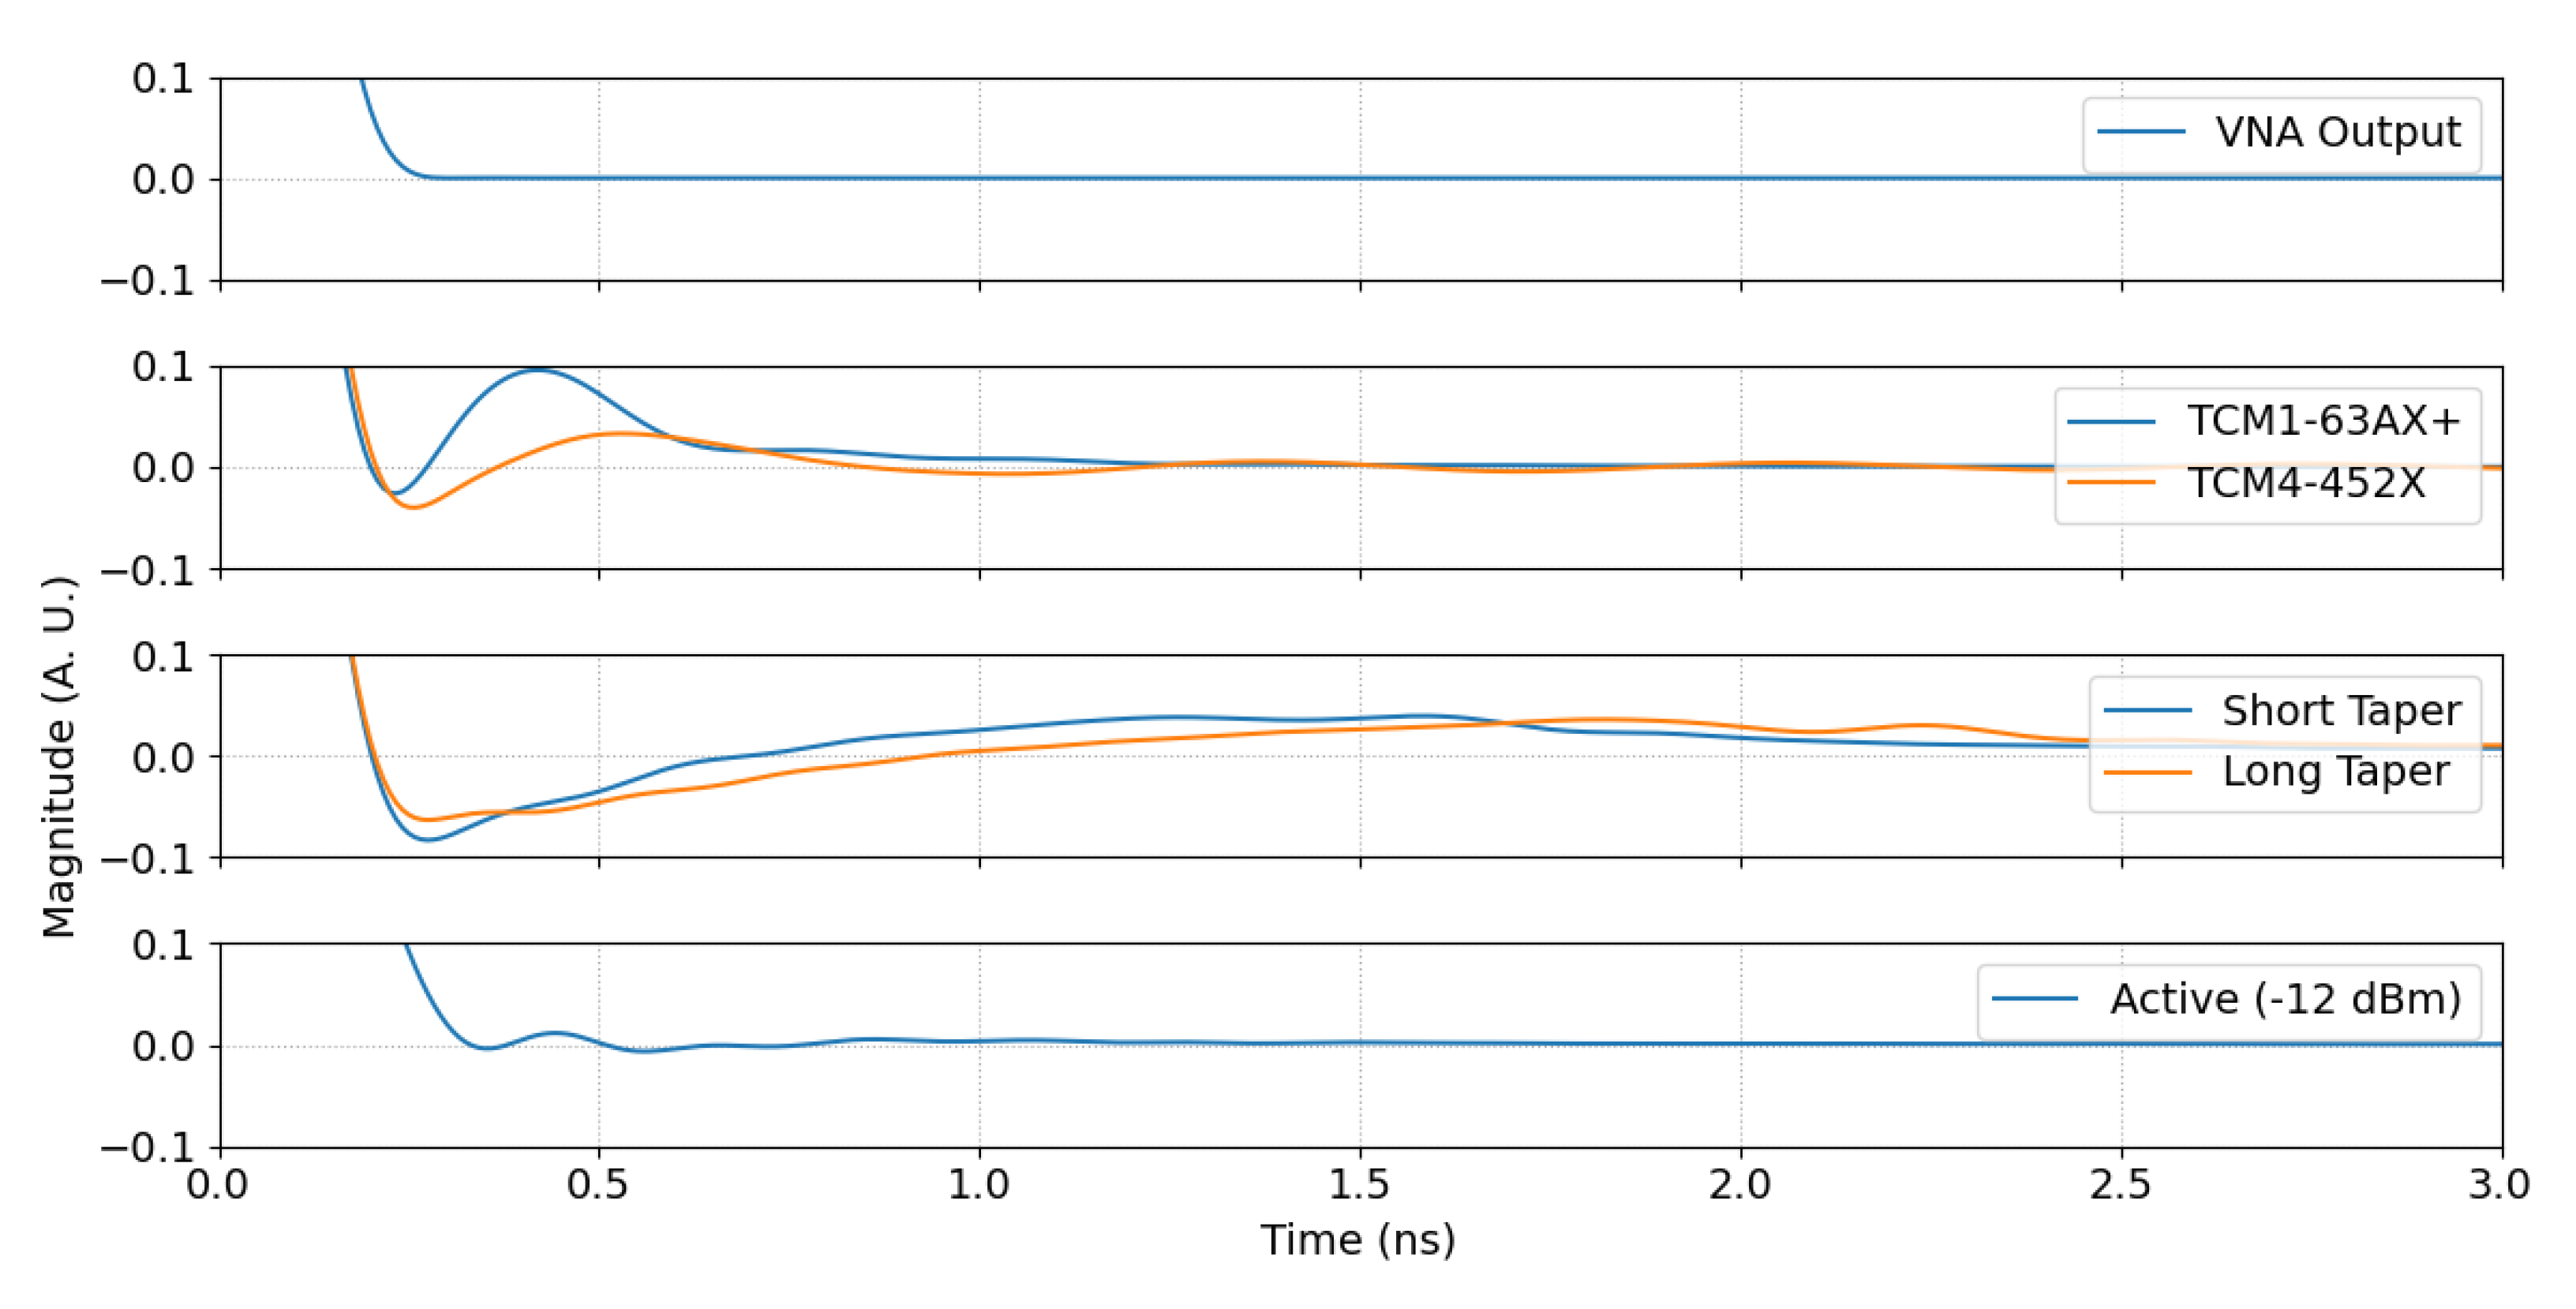
The unwrapped phase should be linear to minimize the pulse distortion through the baluns, therefore the gradient of the phase (shown in Figure 7) should be constant. From the gradient of the phase it can be seen that the magnetic baluns had the best phase performance, with the TCM1-63AX+ performing slightly better at low frequencies and the TCM4-452X showing a flatter phase response at high frequencies. The active balun had very good performance at low frequencies and the worst performance at high frequencies. The break frequency of the active balun, where the phase response turns non-linear, was dependent upon the input power level, suggesting that this phenomenon is caused by the slew rate limit of the amplifiers. In specific applications, such as when SFCW modulation is employed, it may be possible to shape the power spectrum to respect these slew rate limits. The tapered microstrip baluns had the worst phase performance overall, especially at low frequencies. The complex transmission coefficient through the back-to-back baluns can be transformed into the time-domain by applying a Fourier Transform. The data was inverted using an Inverse Fast Fourier Transform after applying a Kaiser window (). The resulting pulses are shown in Figure 8. The magnetic and active baluns both showed very little pulse distortion. This was expected based on the phase performance shown previously. The pulse magnitude of the signal through the active balun was significantly bigger than those through the other baluns, due to the gain in the amplifiers. During the testing, it was observed that exceeding the slew rate limit in the amplifiers leads to extra ringing. However, the ringdown performance of the active baluns is better than that of the other options, including the magnetic baluns. This can be seen in Figure 9, which zooms in on the ringdown performance of the back-to-back baluns. For this figure, the peaks of the signal were aligned and normalized, so that the ringdown profiles can be compared directly.
4.4. Current Probe Measurements
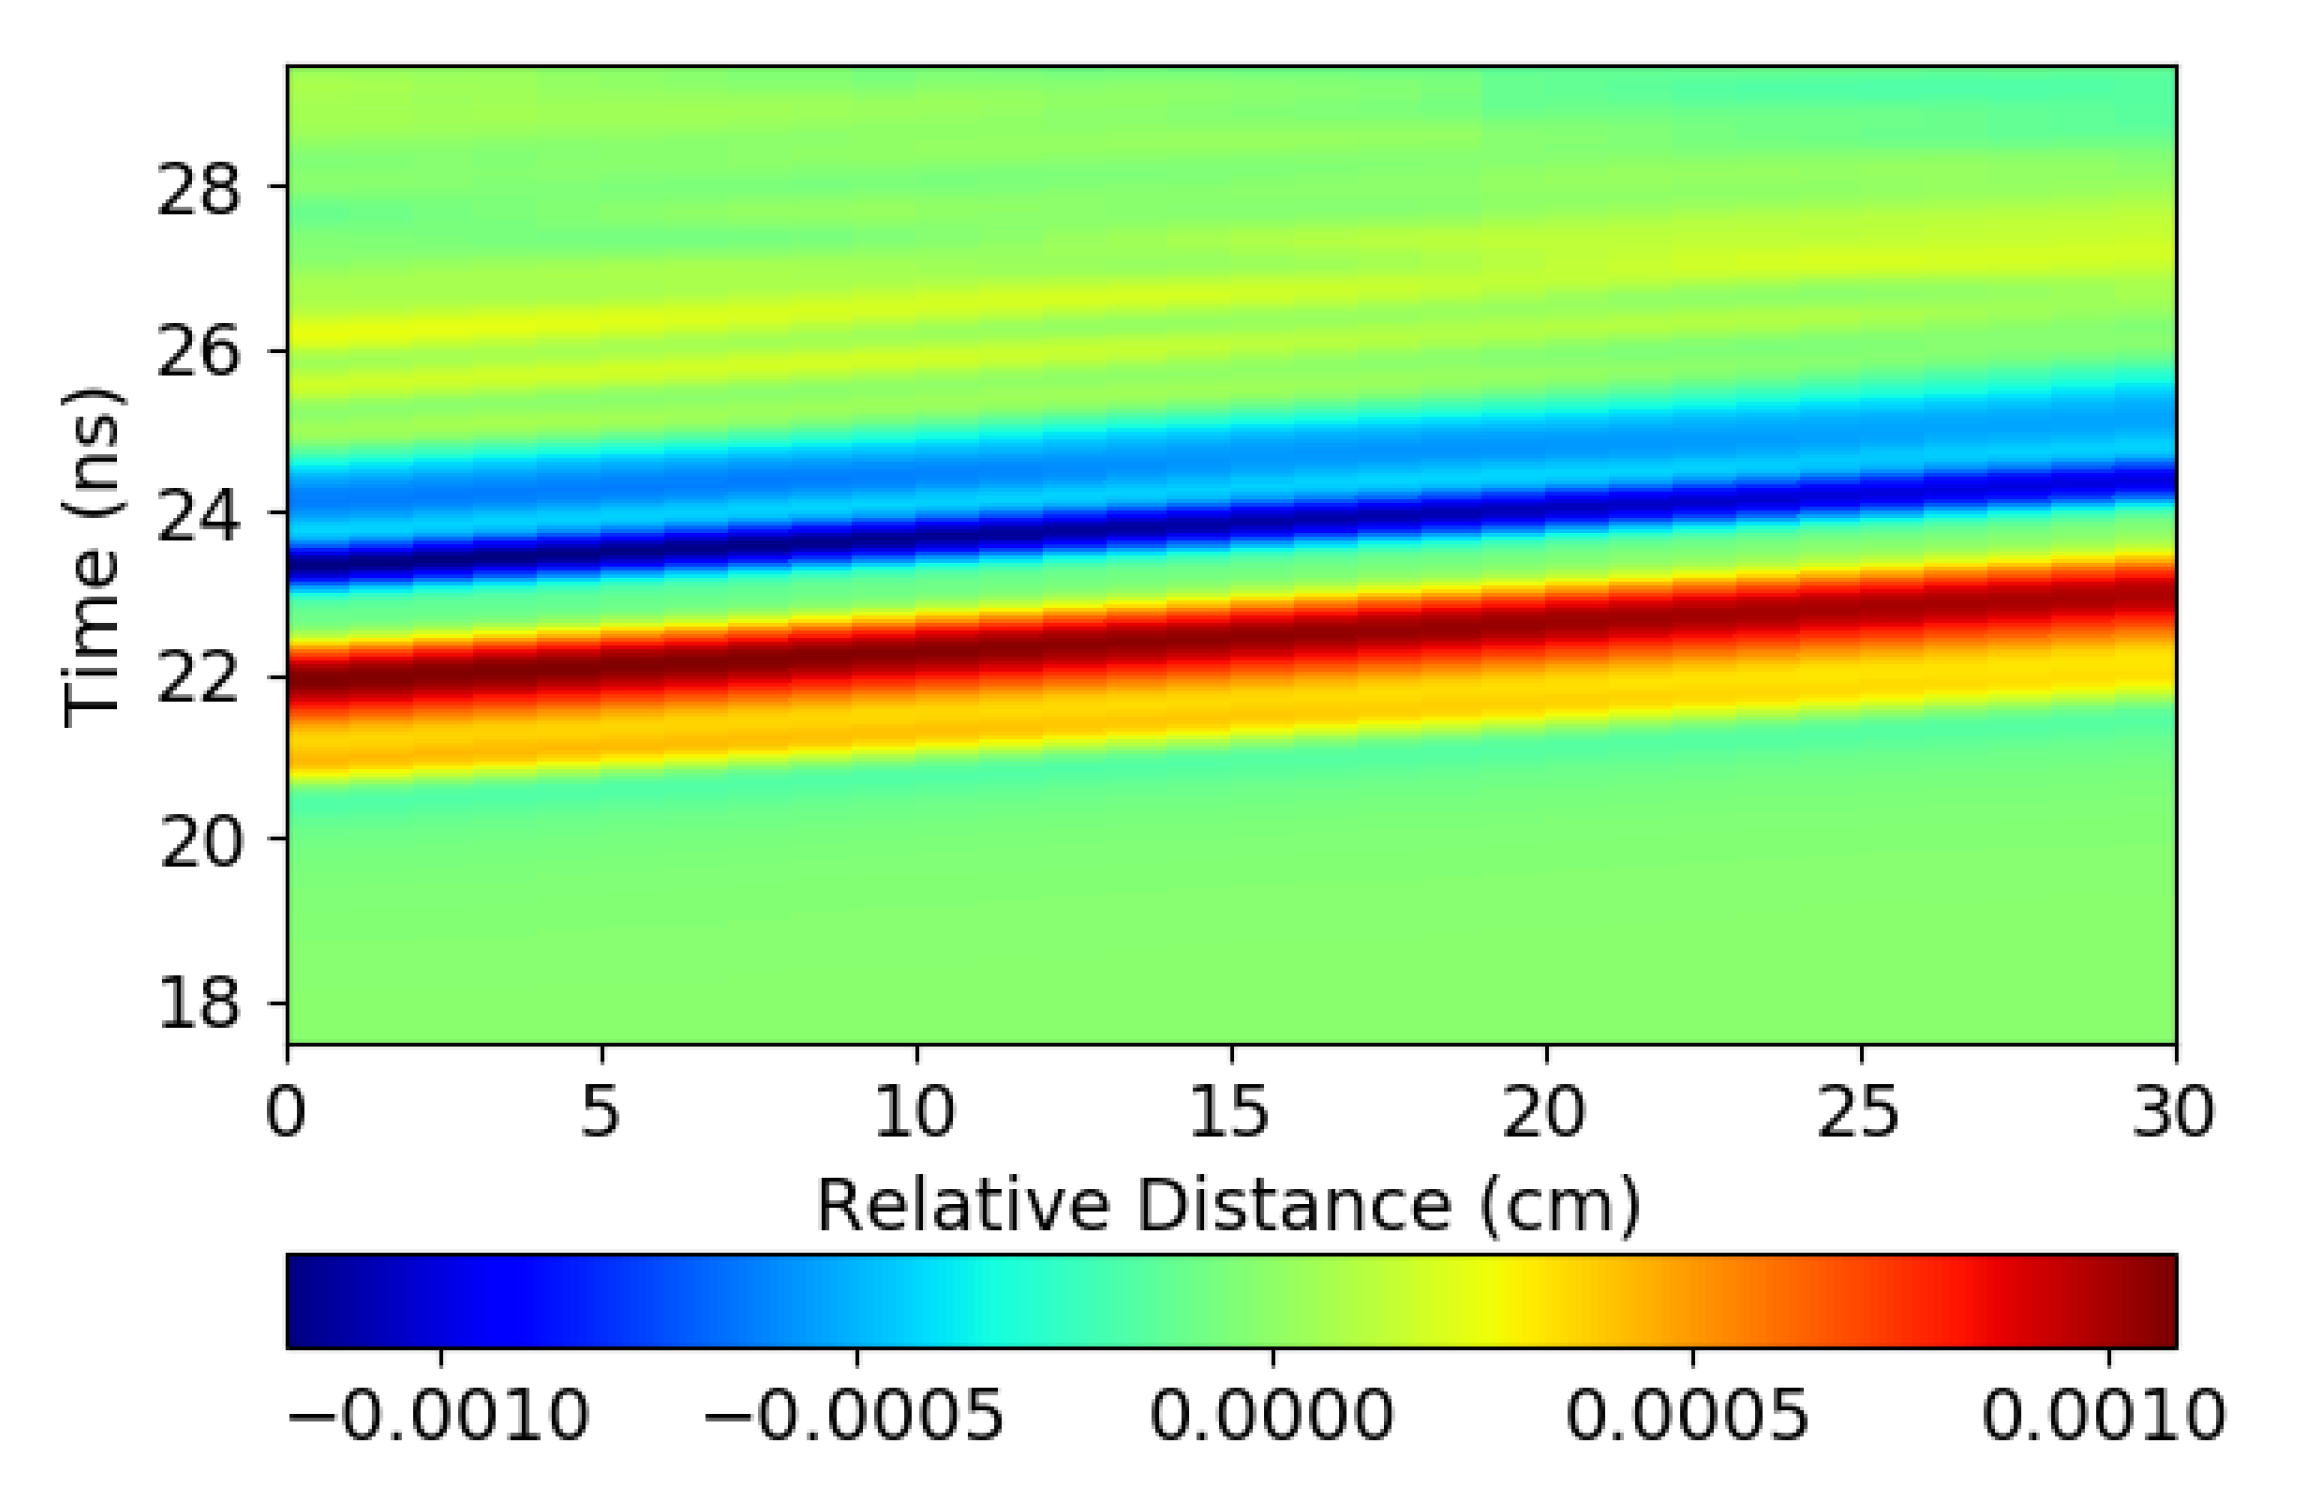
An RF current probe was placed around the feed cable to estimate the magnitude of the common mode current at different frequencies. First, the experimental setup was validated using a set of reference measurements. For these measurements only, the IF bandwidth was set to 1 Hz, to ensure the noise floor of the device is well below the environmental background noise. With these settings, the noise floor is better than at least −140 dB across the operating band. The noise floor from the environment was measured by connecting the RF current probe to the VNA and leaving the probe empty. In this configuration, the environmental noise floor was typically below −120 dB. It is expected that the common mode currents measured will be very small when terminating the cable with a short, open or load from a calibration kit, as no common mode current should form in these cases. The limiting factor in this case is likely to be the shielding from the RF cable (90 dB minimum according to the datasheet). The signal from the RF current probe in this case is typically below −105 dB, which represents the maximum sensitivity of the test apparatus. All subsequent measurements are above this level. The RF current probe can be used to visualize the common mode current pulse as it travels from the balun back to the VNA. To do this, measurements of the common mode current were taken along the feed cable at 1 cm intervals, and the data were transformed into the time-domain using an inverse FFT after applying a Kaiser filter, as previously. Figure 10 shows the time-domain signal as function of the distance relative to an arbitrary starting point, with the RF probe moving away from the balun towards the VNA. It can be seen that the arrival time of the common mode pulse increases with distance, as expected. The peak magnitude of the pulse also reduces with distance. This is likely to be due to the losses from the common mode radiation as the current passes along the feed cable.
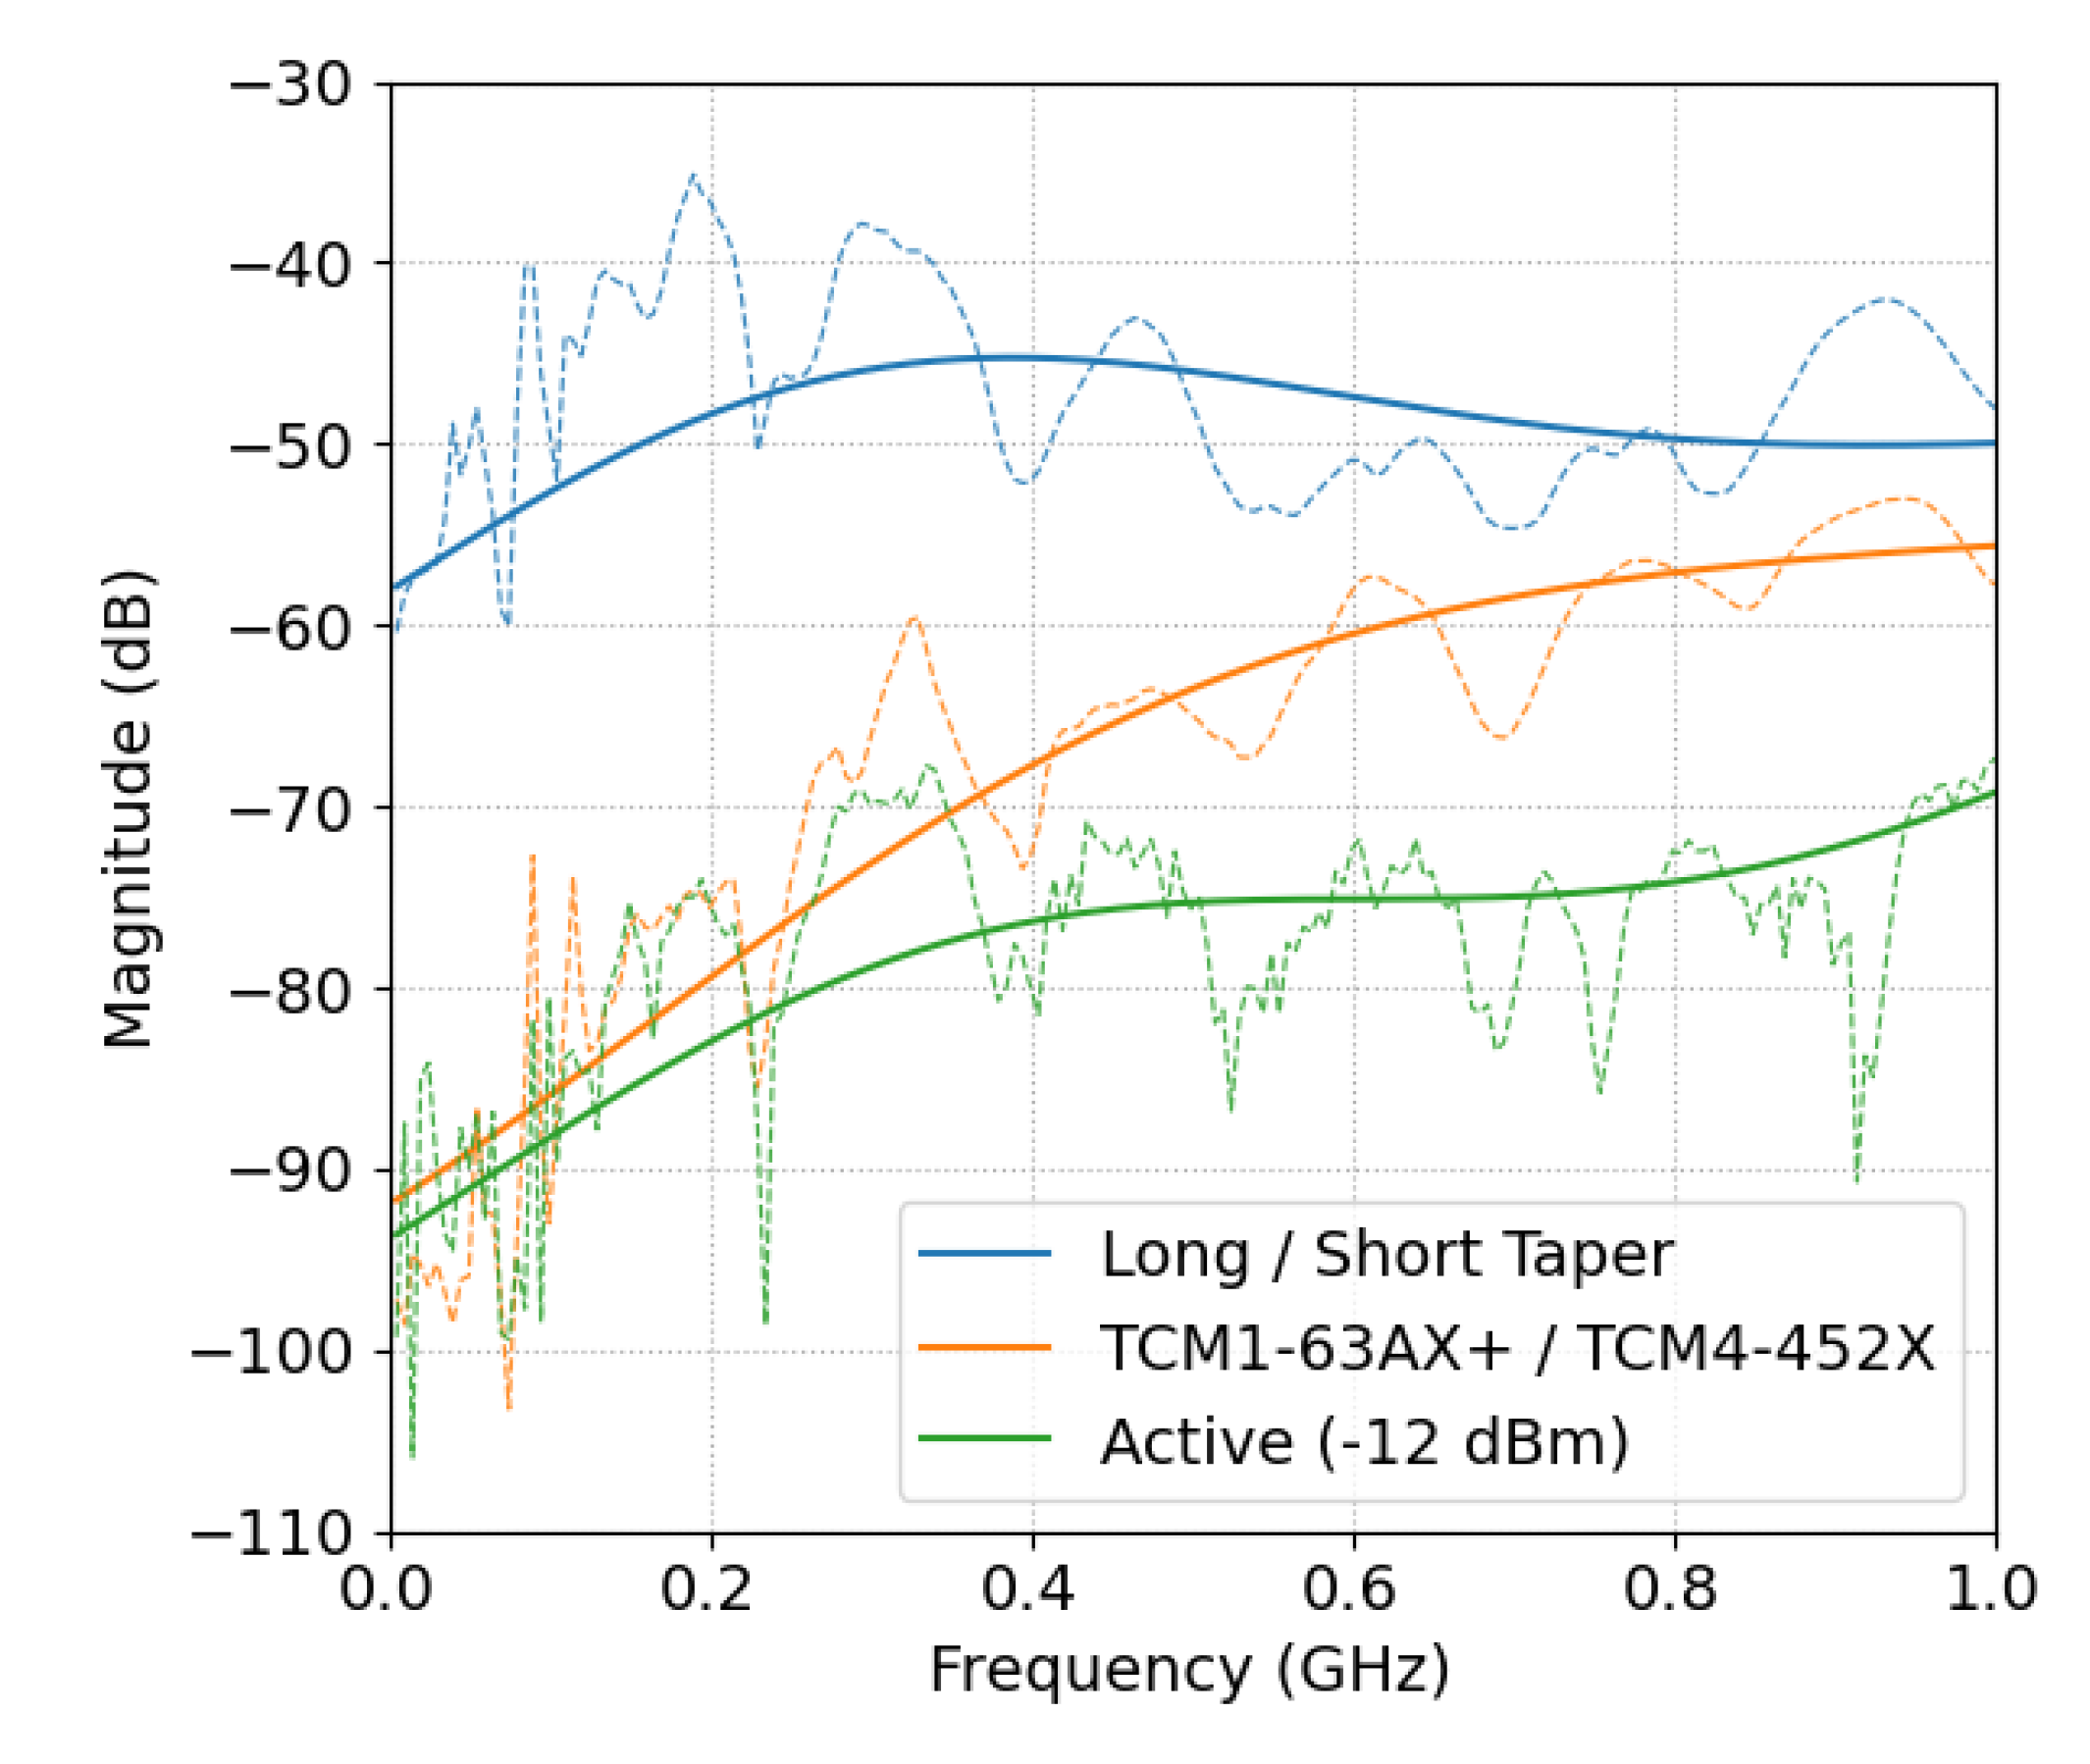
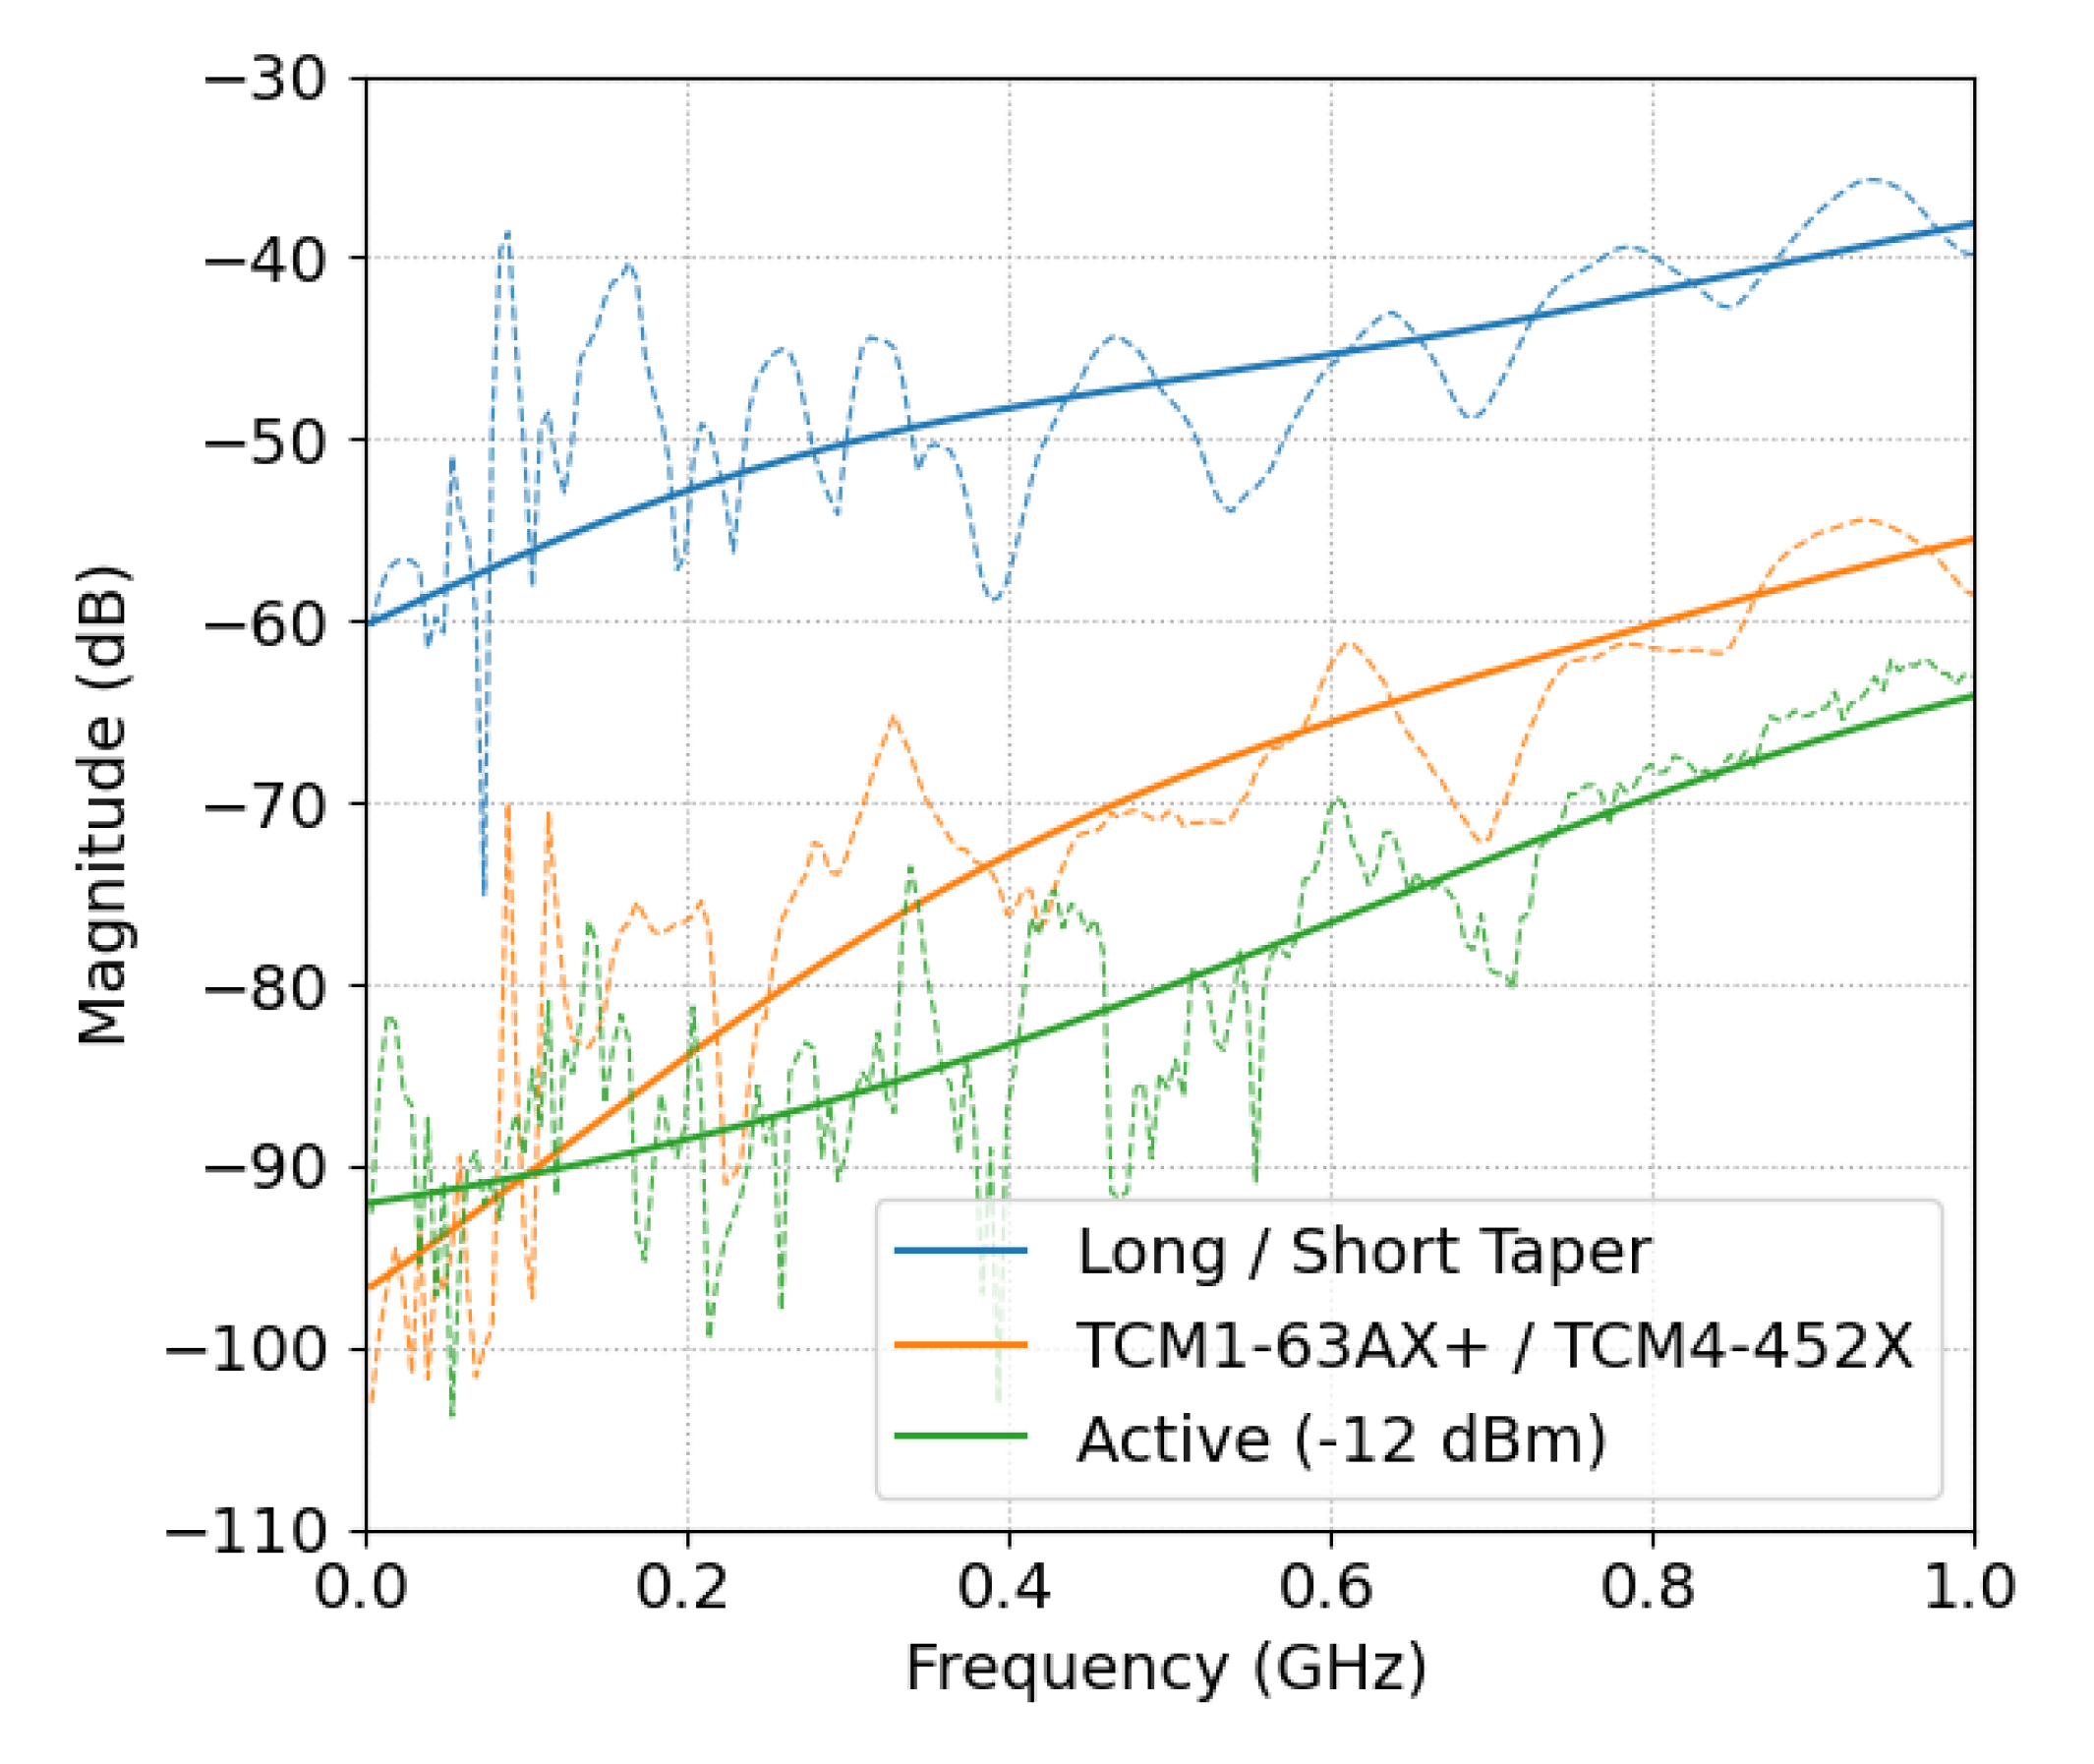
Figure 11 shows the measured common mode currents, using the configuration shown in Figure 1c, for each of the baluns under consideration. The measurements from the two tapered microstrip baluns were averaged together to improve the clarity of the figure. The same was done with the TCM1-63AX+ and TCM4-452X baluns. These measurements are indicated with the dashed lines, while the solid lines show the averaged trend of the measurements. The common mode current was worst with the tapered microstrip baluns, and the magnetic baluns were the second best option. The active balun was found to have the lowest levels of common mode current, particularly above 400 MHz. However, when the active balun was driven at an input power that is too high, the common mode current increased to be above that of the magnetic baluns. Figure 12 shows the magnitude of the common mode current measured just after the back-to-back baluns, in the frequency domain. On the receiver side of the baluns, the overall trend is the same; the tapered microstrip baluns had the highest levels of common mode current, followed by the magnetic baluns and the active balun had the lowest level. However, at this position, the difference between the tapered baluns and the magnetic baluns did not get smaller with increasing frequency. There also was a larger gap in performance between the two magnetic baluns, with the TCM1-63AX+ showing better performance. The difference between this magnetic balun and the active balun was smaller in this position as well.
5. Conclusions
In this study, the performance of five different baluns was evaluated. The properties investigated were the reflection coefficient, transmission coefficient, phase distortion, time-domain transmission and the common mode current on the cables. The input power limitation of a pair of back-to-back active baluns, based on high-speed amplifiers, was also evaluated. The reflection coefficient of the active balun was the best at low frequencies, while, at high frequencies, the TCM1-63AX+ magnetic balun has the lowest reflection coefficient. When looking at the reflection coefficient, the long tapered balun outperformed the short taper, especially at low frequencies. This was as expected because the performance of these tapered microstrip baluns depends on the length of the structure compared to the wavelength. The active balun applied a gain to the input signal, which would give them the best insertion loss. However, the input power to the active balun has to be chosen to avoid exceeding the limit on the output slew rate, so that the final output power from these baluns is restricted. Among the passive baluns, the short tapered microstrip had the lowest insertion loss, and the losses through the magnetic baluns were much higher than through the tapered baluns. The phase linearity was best through magnetic baluns, as the gradient of the phase is almost constant across the operating band, with the TCM1-63AX+ slightly outperforming the TCM4-452X. The active balun had good phase linearity when the output slew rate was not exceeded, and the tapered baluns had the worst phase linearity across the operating band. They were particularly bad at low frequencies, below approximately 0.5 GHz. The common mode currents were evaluated before and after the baluns, when the baluns were connected back-to-back. From both these tests, it was clear that the tapered microstrips cause the highest magnitude of common mode current on the feed cables. The magnetic baluns led to a lower common mode current, between 10 and 20 dB less across the frequencies evaluated. The active balun reduced the common mode current even further, by another 5–10 dB. The frequency at which the amplifiers in the active balun displayed non-linear behavior could be clearly identified, and it was dependent on the input power level. Based on the measurements of the active balun in the back-to-back configuration, it was not possible to identify which amplifier was causing the discontinuities seen in the measurements. In further testing, using bowtie antennas, it was found that the transmit amplifier displayed significant non-linearities on its own, but that the receive amplifier also added to this. Future work remains to be done on evaluating the common mode current across the entire bandwidth of up to 6 GHz, since the RF current probe used here limited the common mode current measurements to 1 GHz. Further tests can also be done to measure the current with antennas attached to the baluns, instead of the baluns being connected back-to-back. When the active baluns are connected to antennas, there would be a lower risk of saturation and the non-linearities in the amplifiers could be further explored in this configuration. The commercially available magnetic transformer baluns provide a good balance among size, reflection coefficient and common mode current magnitude. Their insertion loss, however, is high compared to other options. If lower insertion losses and the lowest common mode current are required, the active balun provide a good solution, as long as their input power limitations are respected. Active baluns can work particularly well with stepped-frequency continuous wave radars where the power level at each frequency can be appropriately controlled to respect the input power limits of the amplifiers at each frequency.
Supplementary Materials
The supplementary materials are available online at https://0-www-mdpi-com.brum.beds.ac.uk/article/10.3390/rs13101899/s1.
Author Contributions
Conceptualization, W.v.V., D.J.D. and A.J.P.; methodology, W.v.V., F.J.W.P., D.J.D. and A.J.P.; software, W.v.V.; validation, W.v.V. and X.G.; formal analysis, W.v.V., F.P and D.J.D.; investigation, W.v.V. and F.J.W.P.; resources, W.v.V., X.G. and A.J.P.; data curation, W.v.V.; writing—original draft preparation, W.v.V. and F.J.W.P.; writing—review and editing, W.v.V., F.J.W.P., X.G., D.J.D. and A.J.P.; visualization, W.v.V.; supervision, F.J.W.P., D.J.D. and A.J.P.; project administration, D.J.D. and A.J.P.; and funding acquisition, A.J.P. All authors have read and agreed to the published version of the manuscript.
Funding
This work was conducted as part of the programme “SEMIS III” (Scanning electromagnetic mine inspection system) with funding from the charity ‘Sir Bobby Charlton Foundation’. Additional support was provided by EPSRC—Grant number: EP/N509565/1.
Data Availability Statement
The data for all figures presented in this paper can be found in the Supplementary Materials.
Conflicts of Interest
The authors declare no conflict of interest.
References
- Daniels, D.J. Ground Penetrating Radar, 2nd ed.; The Institution of Electrical Engineers: Stevenage, UK, 2004. [Google Scholar]
- Daniels, D.J. A review of GPR for landmine detection. Sens. Imaging Int. J. 2006, 7, 90–123. [Google Scholar] [CrossRef]
- Lee, J.S.; Nguyen, C.; Scullion, T. A novel, compact, low-cost, impulse ground-penetrating radar for nondestructive evaluation of pavements. IEEE Trans. Instrum. Meas. 2004, 53, 1502–1509. [Google Scholar] [CrossRef]
- Jenssen, R.O.R.; Eckerstorfer, M.; Jacobsen, S. Drone-Mounted Ultrawideband Radar for Retrieval of Snowpack Properties. IEEE Trans. Instrum. Meas. 2019, 69, 1–10. [Google Scholar] [CrossRef] [Green Version]
- Byers, K.J.; Harish, A.R.; Seguin, S.A.; Leuschen, C.J.; Rodriguez-Morales, F.; Paden, J.; Arnold, E.J.; Hale, R.D. A modified wideband dipole antenna for an airborne VHF ice-penetrating radar. IEEE Trans. Instrum. Meas. 2012, 61, 1435–1444. [Google Scholar] [CrossRef]
- De Angelis, A.; Dionigi, M.; Moschitta, A.; Carbone, P. A low-cost ultra-wideband indoor ranging system. IEEE Trans. Instrum. Meas. 2009, 58, 3935–3942. [Google Scholar] [CrossRef]
- Abdullah, M.Z.; Binajjaj, S.A.; Zanoon, T.F.; Peyton, A.J. High-resolution imaging of dielectric profiles by using a time-domain ultra wideband radar sensor. Meas. J. Int. Meas. Confed. 2011, 44, 859–870. [Google Scholar] [CrossRef]
- Jofre, L.; Toda, A.P.; Montana, J.M.J.; Carrascosa, P.C.; Romeu, J.; Blanch, S.; Cardama, A. UWB short-range bifocusing tomographic imaging. IEEE Trans. Instrum. Meas. 2008, 57, 2414–2420. [Google Scholar] [CrossRef]
- Woodhead, I.; Buchan, G.; Platt, I.; Christie, J. Improved electric field modelling for TDR. Meas. Sci. Technol. 2007, 18, 1110–1117. [Google Scholar] [CrossRef]
- Hokmabadi, A.; Keshtkar, A.; Bayat, A.; Keshtkar, A. A CPW-fed tapered slot antenna with improved time and frequency domain characteristics. Int. J. Microw. Wirel. Technol. 2017, 9, 1185–1190. [Google Scholar] [CrossRef]
- Marsh, L.A.; van Verre, W.; L. Davidson, J.; Gao, X.; Podd, F.J.W.; J. Daniels, D.; J. Peyton, A. Combining Electromagnetic Spectroscopy and Ground-Penetrating Radar for the Detection of Anti-Personnel Landmines. Sensors 2019, 19, 3390. [Google Scholar] [CrossRef] [Green Version]
- Sefa, R.; Maraj, A. Analysis and design of microstrip to balanced stripline transitions. In Proceedings of the 10th WSEAS international conference on Telecommunications and informatics and microelectronics, nanoelectronics, optoelectronics, and WSEAS international conference on Signal processing, Canary Islands, Spain, 27–29 May 2011; pp. 137–142. [Google Scholar]
- Stutzman, W.L.; Thiele, G.A. Antenna Theory and Design, 2nd ed.; John Wiley & Sons: Hoboken, NJ, USA, 1998. [Google Scholar]
- Venkatesan, J.; Scott, W., Jr. Investigation of the double-Y balun for feeding pulsed antennas. In Proceedings of the Detection and Remediation Technologies for Mines and Minelike Targets IX, Orlando, FL, USA, 12–16 April 2004; Volume 5089. [Google Scholar] [CrossRef]
- Chiappe, M.; Gragnani, G. Vivaldi antennas as detectors for microwave imaging: Some theoretical results and design considerations. IEEE Trans. Instrum. Meas. 2005, 55, 22–27. [Google Scholar]
- Icheln, C.; Krogerus, J.; Vainikainen, P. Use of Balun Chokes in Small-Antenna Radiation Measurements. IEEE Trans. Instrum. Meas. 2004, 53, 498–506. [Google Scholar] [CrossRef]
- Kawana, T.; Osakabe, M.; Koike, K. Evaluation of Dipole Antenna Balun Loss in the UHF Band. IEEE Trans. Instrum. Meas. 1991, 40, 480–482. [Google Scholar] [CrossRef]
- Morioka, T.; Komiyama, K. Measurements of antenna characteristics above different conducting planes. IEEE Trans. Instrum. Meas. 2002, 50, 393–396. [Google Scholar] [CrossRef]
- Vinayagamoorthy, K.; Coetzee, J.; Jayalath, D. Microstrip to parallel strip balun as spiral antenna feed. In Proceedings of the 2012 IEEE 75th Vehicular Technology Conference (VTC Spring), Yokohama, Japan, 6–9 May 2012; pp. 1–5. [Google Scholar] [CrossRef] [Green Version]
- Vandersteen, G.; Barel, A.; Rolain, Y. Broadband high-frequency hybrid. IEEE Trans. Instrum. Meas. 2002, 51, 1204–1209. [Google Scholar] [CrossRef]
- Lu, S.; Elshabini-Riad, A.; Riad, S.M. Design, Fabrication, and Characterization of a Wideband Hybrid Balun. IEEE Trans. Instrum. Meas. 1991, 40, 486–489. [Google Scholar]
- Ruthroff, C.L. Some Broad-Band Transformers. Proc. IRE 1959, 47, 1337–1342. [Google Scholar] [CrossRef]
- Guanella, G. New Method of Impedance Matching in Radio-Frequency Circuits. Brown Boveri Rev. 1944, 31, 327–329. [Google Scholar]
- Duncan, J.; Minerva, V. 100:1 Bandwidth Balun Transformer. Proc. IRE 1960, 48, 156–164. [Google Scholar] [CrossRef]
- Kobayashi, M.; Sawada, N. Analysis and Synthesis of Tapered Microstrip Transmission Lines. IEEE Trans. Microw. Theory Tech. 1992, 40, 1642–1646. [Google Scholar] [CrossRef]
- Pramanick, P.; Bhartia, P. A Generalized Theory of Tapered Transmission Line Matching Transformers and Asymmetric Couplers Supporting Non-TEM Modes. IEEE Trans. Microw. Theory Tech. 1989, 37, 1184–1191. [Google Scholar] [CrossRef]
- Marchand, N. Transmission line conversion transformers. Electronics 1944, 17, 142–145. [Google Scholar]
- Cloete, J.H. Exact Design of The Marchand Balun. In Proceedings of the 9th European Microwave Conference, Brighton, UK, 17–20 September 1979. [Google Scholar]
- Trifunovic, V.; Jokanovic, B. Review of Printed Marchand and Double Y Baluns: Characteristics and Application. IEEE Trans. Microw. Theory Tech. 1994, 42. [Google Scholar] [CrossRef]
- Ahn, H.R.; Nam, S. New Design Formulas for Impedance-Transforming 3-dB Marchand Baluns. IEEE Trans. Microw. Theory Tech. 2011, 59, 2816–2823. [Google Scholar] [CrossRef]
- Ang, K.S.; Robertson, I.D. Analysis and Design of Impedance-Transforming Planar Marchand Baluns. IEEE Trans. Microw. Theory Tech. 2001, 49, 402–406. [Google Scholar]
- Lu, J.C.; Lin, C.C.; Chang, C.Y. Exact Synthesis and Implementation of New High-Order Wideband Marchand Baluns. IEEE Trans. Microw. Theory Tech. 2011, 59, 80–86. [Google Scholar] [CrossRef]
- Jorgesen, D.; Marki, C. Balun Basics Primer; Technical report; Marki Microwave: Morgan Hill, CA, USA, 2014. [Google Scholar]
- Trifunovic, V.; Jokanovic, B. Four decade bandwidth uniplanar balun. Electron. Lett. 1992, 28, 534–535. [Google Scholar] [CrossRef]
- Venkatesan, J.B.; Scott, W.R., Jr. Design of the double-y balun for use in GPR applications. In Proceedings of the Detection and Remediation Technologies for Mines and Minelike Targets IX, Orlando, FL, USA, 12–16 April 2004; Volume 5415. [Google Scholar] [CrossRef]
- Kim, S.; Jeong, S.; Lee, Y.T.; Kim, D.H.; Lim, J.S.; Seo, K.S.; Nam, S. Ultra-wideband (from DC to 110 GHz) CPW to CPS transition. Electron. Lett. 2002, 38, 622. [Google Scholar] [CrossRef]
- Butrym, A.; Pivnenko, S. A Tapered Coplanar Strip Antenna with Improved Matching. In Ultra-Wideband, Short-Pulse Electromagnetics 7; Sabath, F., Mokole, E.L., Schenk, U., Nitsch, D., Eds.; Springer: New York, NY, USA, 2007; pp. 342–353. [Google Scholar]
- Ahn, H.R. Asymmetric Passive Components in Microwave Integrated Circuits; John Wiley & Sons: Hoboken, NJ, USA, 2005; pp. 1–291. [Google Scholar] [CrossRef]
- Ho, C.H.; Fan, L.; Chang, K. Broad-Band Uniplanar Hybrid-Ring and Branch-Line Couplers. IEEE Trans. Microw. Theory Tech. 1993, 41, 2116–2125. [Google Scholar]
- Ho, C.H.; Fan, L.; Chang, K. New uniplanar coplanar waveguide hybrid-ring couplers and magic-T’s. IEEE Trans. Microw. Theory Tech. 1994, 42, 2440–2448. [Google Scholar]
- Analog Devices. ADL5569 Datasheet and Product Info|Analog Devices. Available online: https://www.analog.com/media/en/technical-documentation/data-sheets/ADL5569.pdf (accessed on 16 December 2019).
- Texas Instruments. LMH3401 7-GHz, Ultra-Wideband, Fully Differential Amplifier|TI.com. Available online: https://www.ti.com/lit/ds/symlink/lmh3401.pdf (accessed on 16 December 2019).
Figure 1.
Three measurement setups used in this paper. UB refers to the unbalanced port and B refers to the balanced ports.
Figure 1.
Three measurement setups used in this paper. UB refers to the unbalanced port and B refers to the balanced ports.

Figure 2.
Input power limits as a function of frequency, based on 1 dB compression of the output.

Figure 3.
Reflection coefficient of the back-to-back active baluns when driven at 0 dBm.

Figure 4.
Reflection coefficient of single baluns. The long and short tapers refer to the tapered microstrip baluns.
Figure 4.
Reflection coefficient of single baluns. The long and short tapers refer to the tapered microstrip baluns.

Figure 5.
Return loss of back-to-back baluns. The long and short tapers refer to the tapered microstrip baluns.
Figure 5.
Return loss of back-to-back baluns. The long and short tapers refer to the tapered microstrip baluns.

Figure 6.
Insertion loss of back-to-back baluns. The long and short tapers refer to the tapered microstrip baluns.
Figure 6.
Insertion loss of back-to-back baluns. The long and short tapers refer to the tapered microstrip baluns.

Figure 7.
Gradient of the phase through back-to-back baluns. The long and short tapers refer to the tapered microstrip baluns.
Figure 7.
Gradient of the phase through back-to-back baluns. The long and short tapers refer to the tapered microstrip baluns.

Figure 8.
Time-domain transmission through the baluns. The long and short tapers refer to the tapered microstrip baluns.
Figure 8.
Time-domain transmission through the baluns. The long and short tapers refer to the tapered microstrip baluns.

Figure 9.
Time-domain ringdown of the signal through the back-to-back baluns. The long and short tapers refer to the tapered microstrip baluns.
Figure 9.
Time-domain ringdown of the signal through the back-to-back baluns. The long and short tapers refer to the tapered microstrip baluns.

Figure 10.
Measured current in time-domain as a function of position. Measurements taken with the back-to-back microstrip baluns.
Figure 10.
Measured current in time-domain as a function of position. Measurements taken with the back-to-back microstrip baluns.

Figure 11.
Magnitude of the current against frequency as measured by the RF current probe, at the input to the baluns. The long and short tapers refer to the tapered microstrip baluns.
Figure 11.
Magnitude of the current against frequency as measured by the RF current probe, at the input to the baluns. The long and short tapers refer to the tapered microstrip baluns.

Figure 12.
Magnitude of the current against frequency as measured by the RF current probe, at the output from the baluns. The long and short tapers refer to the tapered microstrip baluns.
Figure 12.
Magnitude of the current against frequency as measured by the RF current probe, at the output from the baluns. The long and short tapers refer to the tapered microstrip baluns.


Table 1.
A summary of the key VNA parameters
| Start Frequency | 5 MHz |
|---|---|
| Stop Frequency | 6 GHz |
| Step Frequency | 5 MHz |
| Steps | 1200 |
| IF Bandwidth | 100 Hz |
| Output Power | 0 dBm |
Table 2.
Key operating characteristics of the LMH3401
| Output Headroom | 1.4 V/13 dBm (Output) |
|---|---|
| Input Headroom | 1.0 V/5 dBm (Input) |
| Slew rate | 18,000 V/s |
| Noise Figure | 9 dB |
Publisher’s Note: MDPI stays neutral with regard to jurisdictional claims in published maps and institutional affiliations. |
© 2021 by the authors. Licensee MDPI, Basel, Switzerland. This article is an open access article distributed under the terms and conditions of the Creative Commons Attribution (CC BY) license (https://creativecommons.org/licenses/by/4.0/).
Share and Cite
MDPI and ACS Style
van Verre, W.; Podd, F.J.W.; Gao, X.; Daniels, D.J.; Peyton, A.J. A Review of Passive and Active Ultra-Wideband Baluns for Use in Ground Penetrating Radar. Remote Sens. 2021, 13, 1899. https://0-doi-org.brum.beds.ac.uk/10.3390/rs13101899
AMA Style
van Verre W, Podd FJW, Gao X, Daniels DJ, Peyton AJ. A Review of Passive and Active Ultra-Wideband Baluns for Use in Ground Penetrating Radar. Remote Sensing. 2021; 13(10):1899. https://0-doi-org.brum.beds.ac.uk/10.3390/rs13101899
Chicago/Turabian Stylevan Verre, Wouter, Frank J. W. Podd, Xianyang Gao, David J. Daniels, and Anthony J. Peyton. 2021. "A Review of Passive and Active Ultra-Wideband Baluns for Use in Ground Penetrating Radar" Remote Sensing 13, no. 10: 1899. https://0-doi-org.brum.beds.ac.uk/10.3390/rs13101899
Note that from the first issue of 2016, this journal uses article numbers instead of page numbers. See further details here.