Article

46-Year (1973–2019) Permafrost Landscape Changes in the Hola Basin, Northeast China Using Machine Learning and Object-Oriented Classification

1
State Key Laboratory of Frozen Soils Engineering, Northwest Institute of Eco-Environment and Resources, Chinese Academy of Sciences, Lanzhou 730000, China
2
Applied Geomorphology and Interdisciplinary Research Centre, Department of Geography, West University of Timișoara, 300223 Timiș, Romania
3
Institute of Cold-Regions Science and Engineering, School of Civil Engineering, and Northeast-China Observatory and Research-Station of Permafrost Geological-Environment—Ministry of Education, Northeast Forestry University, Harbin 150040, China
4
College of Resources and Environment, University of Chinese Academy of Sciences, Beijing 100049, China
5
School of Civil Engineering, Harbin Institute of Technology, Harbin 150090, China
*
Author to whom correspondence should be addressed.
Author of equivalent contribution: Mihaela Șerban.
Remote Sens. 2021, 13(10), 1910; https://0-doi-org.brum.beds.ac.uk/10.3390/rs13101910
Submission received: 24 April 2021 / Revised: 11 May 2021 / Accepted: 11 May 2021 / Published: 13 May 2021

Abstract

:
Land use and cover changes (LUCC) in permafrost regions have significant consequences on ecology, engineered systems, and the environment. Obtaining more details about LUCC is crucial for sustainable development, land conservation, and environment management. The Hola Basin (957 km2) in the northernmost part of Northeast China, a boreal forest landscape underlain by discontinuous, sporadic, and isolated permafrost, was selected for the case study. The LUCC was analyzed using the Landsat archive of satellite images from 1973 to 2019. A thematic change detection analysis was performed by combining the object-based image analysis (OBIA) and the Support Vector Machine (SVM) algorithm. Four types of LUCC (forest, grass, water, and anthropic) were extracted with an overall accuracy of 80% for 1973 and >90% for 1986, 2000, and 2019. Forest, the dominant class (750 km2 in 1973), declined by 88 km2 (11.8%) from 1973 to 1986 but had a recovery of 78 km2 (12.5%) from 2000 to 2019. Grass, the second-largest class (187 km2 in 1973), increased by 86 km2 (46.5%) between 1973 and 1986 and decreased by 90 km2 (40%) between 2000 and 2019. The anthropic class continuously increased from 10 km2 (1973) to 37 km2 (2019). Major features in LUCC are attributed to rapid population growth, resource exploitation, agriculture intensification, economic development, and frequent forest fires. Under a pronounced climate warming, these drivers have been accelerating the degradation of permafrost, subsequently triggering natural hazards and deteriorating the ecological environment. This study represents a benchmark for sustainable LUCC management in the Hola Basin, Northeast China.

Graphical Abstract

1. Introduction

Under a warming climate, northern ecosystems are experiencing continuous and severe land use and cover changes (LUCC), affecting the environment, biodiversity, food security, and human health [1]. Population growth, over-exploitation of natural resources, climate change, agricultural intensification, accelerating urbanization, and industrialization processes have all greatly contributed to the rapid LUCC [2,3]. Moreover, it is projected that about 64% of the developing world and 86% of the developed world will be urbanized by 2050 [4]. Forest fires, wind, droughts, and pest outbreaks also significantly contribute to LUCC. It is recognized that the cropland expansion in China facilitated the increasing pest outbreaks. Zhao et al. [5] showed that the area of cereal aphid outbreak in wheat increased by 51% from 1951 to 2010. Forest fires are expected to further increase in the boreal forest while their dynamics are a key issue for fire management and forest ecological environment protection [6]. From 2000 to 2014, 53.1% of the total forest fires in China occurred in Northeast China [7]. Furthermore, forest fires are transforming the boreal forest from carbon sinks to sources [8]. Therefore, it deems necessary and urgent to better understand the rapid LUCC at all spatiotemporal scales associated with human-induced activities and the responses of vegetation to climate warming.
Remote sensing (RS) has been widely recognized as a powerful and effective tool in detecting the spatiotemporal dynamics of LUCC in less time, at a lower cost, and with better accuracy and coverage [4,9,10,11]. Studies on LUCC detection are becoming priority tasks with the availability of multiple sensors operating at various imaging scales, resolutions, and scopes. Landsat series of satellites provide the longest and continuous record of Earth observations (since 1972) prevailing in monitoring the anthropogenic activities and regional vegetation dynamics [1,12,13,14]. Various techniques for detecting LUCC have been developed, such as image differencing and rationing, regression analysis, vegetation index differencing, change vector analysis, principal component analysis, and tasseled cap transformation [15]. The simplest change index for vegetation assessment is considered the original surface reflectance of satellite bands. For example, the Landsat red and short-wave infrared (SWIR) bands have been proven more adequate in distinguishing forest disturbances than the other Landsat bands [16]. The tasseled cap transformation indices are also extensively used because they can simplify the six Landsat optical bands into three orthogonal indices: brightness, greenness, and wetness [17]. However, the object-based image analysis (OBIA) and machine-learning algorithms have started to gain their advantages over the pixel-based approaches in land cover mapping for change detection analysis [15,18,19,20]. Besides the spectral information, the OBIA also takes into account the spatial heterogeneity of pixels grouped into clusters to form objects. The Support Vector Machine (SVM) is among the most accurate and widely used machine-learning algorithms for land cover classification [21,22,23]. The SVM is adequate for high-dimensional datasets, avoids model over-fitting, considers auto-correlation between similar inputs, and permits a probabilistic interpretation of the outputs by a continuous decision function [24]. In addition, the SVM generally needs only small training data sets and handles multidimensional data sets, thus making it appealing for RS classification tasks [25].
China experienced accelerated urbanization from 17.9% in 1978 to 40.5% in 2003 at a rate twice as rapid as the contemporary global average [3]. Moreover, the permafrost extent in Northeast China ranks the second largest in China [26], only after the Qinghai-Tibet Plateau (QTP). Due to its ecosystem-protection nature and marginal location at the southeastern edge of discontinuous permafrost zones in the Eastern Asia continent, the Xing’an permafrost in Northeast China is more sensitive to the LUCC. Thus, permafrost degradation accelerates frost hazards (e.g., thaw slumps and active-layer detachment failure induced landslides, mudflows, and thaw subsidence), threatening the ecosystems, engineered infrastructures, and human communities. With the growing demand for scientific and prudent management of regional forest and water resources, it is essential to obtain the accurate status and dynamic changes of LUCC. Mapping and monitoring of LUCC in Northeast China are vital for regional sustainable development, land planning, and environmental management. Furthermore, the combined effects of climate change and human activities on landscape changes in a specific region are insufficiently assessed [27]. This study aims at detecting the landscape changes over the last 46 years (1973–2019) in the Hola Basin, Northeast China, as jointly induced by climate change and human activities. The objectives are to: (i) Produce LUCC inventories from the Landsat imagery for the period of 1973–2019; (ii) Evaluate land cover characteristics and spatial distribution; and (iii) Quantify the impact of climate change and human activities for the LUCC.

2. Materials and Methods
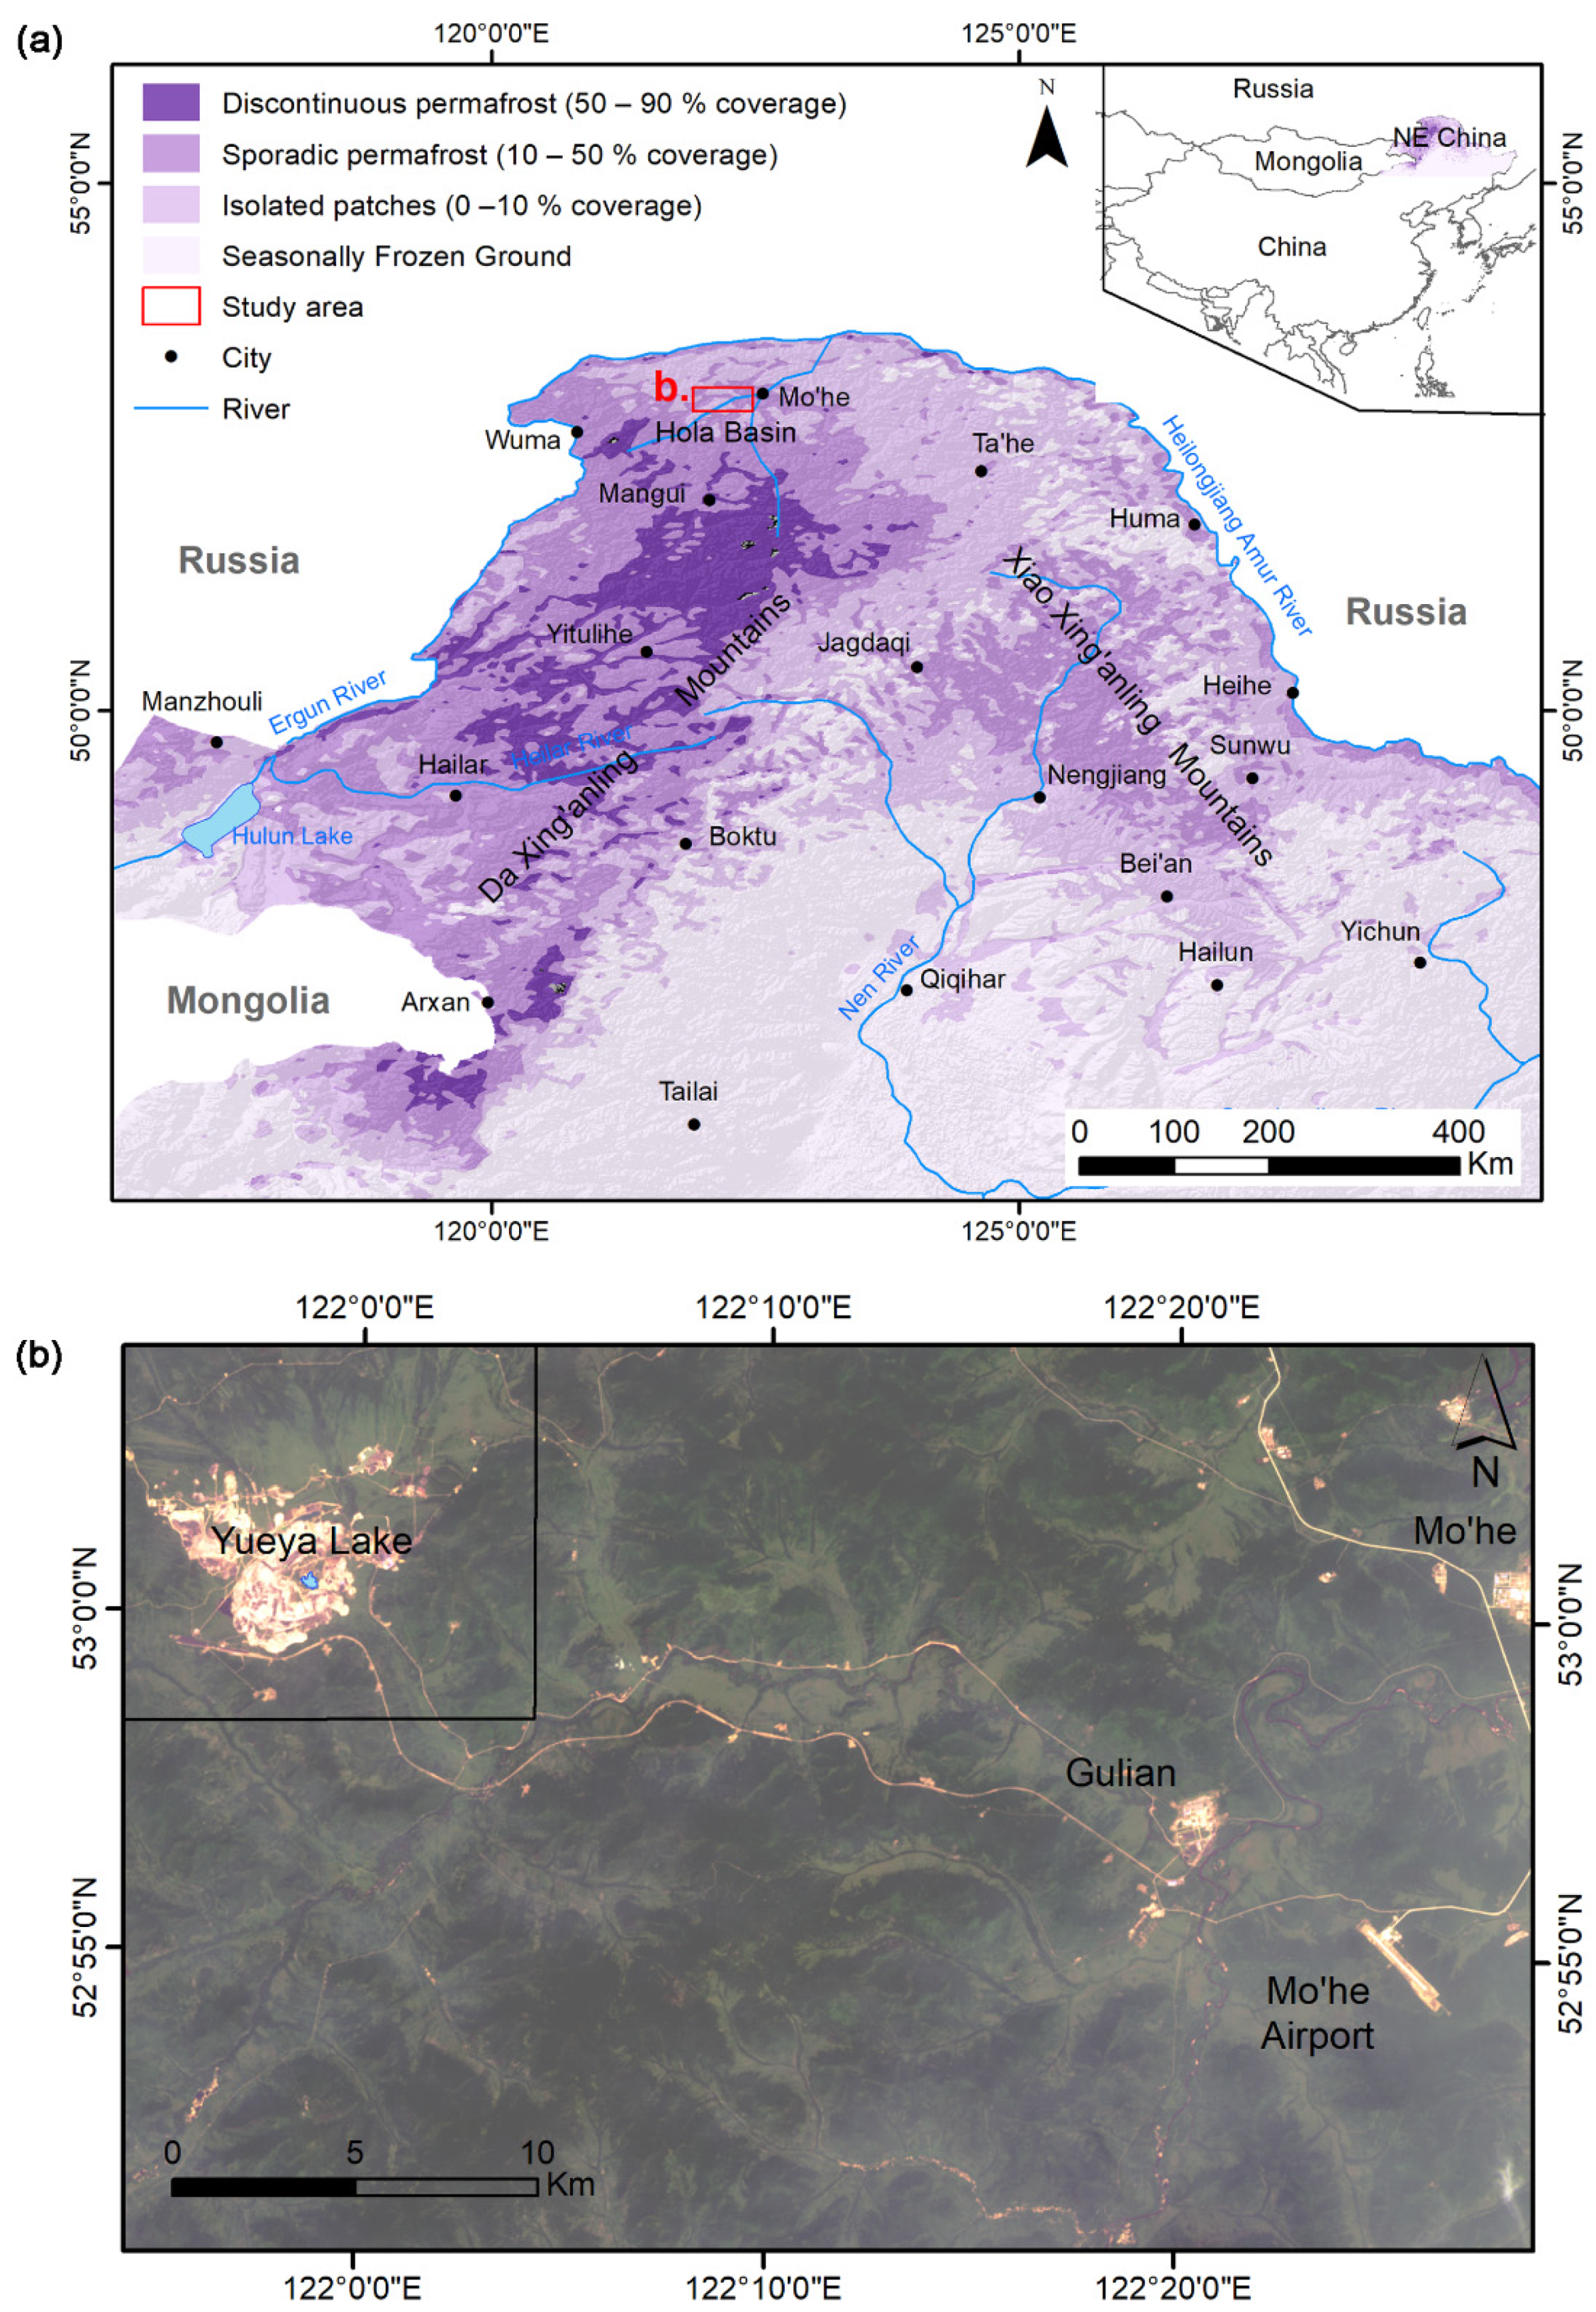
2.1. Study Area

Northeast China, with the largest area of natural forests in China, represents the main national source for wood products and an important ecoregion [28]. At elevations of 500 to 620 m a. s. l., the Hola River Basin is situated in a mosaicked transition zone of the discontinuous, sporadic, and isolated permafrost in the northernmost part of Northeast China (Figure 1). The ground temperature measurements in boreholes revealed an average thickness of permafrost in the basin between 60 and 80 m and an active-layer thickness of 1.5–2.0 m [29]. Mean annual ground temperature at the depth of zero annual amplitude (10 to 20 m in depth) ranges from −3.0 °C to −0.5 °C for zones underlain by permafrost [29]. The Hola Basin is characterized by a continental monsoonal climate with long, dry, and cold winters and short, moist, and warm summers. The multi-year average (1961–2015) of mean annual air temperature (MAAT) was −4.0 °C; that of annual precipitation, 437.5 mm, and that of annual evaporation, 1000 mm [29,30].
The surficial lithology in the Hola Basin consists of Quaternary deposits, mainly peat, clay, loam, gravel, and sand. The vegetation is characterized by mixed forests of the needle- and broad-leaved trees, shrubs, under-bushes, and Sphagnum lichens [29]. In the Hola Basin, around the Yueya (Crescent) Lake, the Gulian’he strip coal mine started to operate in 1978, producing a direct impact on the underlying permafrost. From the Hola Basin, an area of 957 km2 was selected to quantify the LUCC with a focus on the mining expansion around the Yueya Lake (115 km2).

2.2. Remotely Sensed Data and Pre-Processing

Landsat archive was employed for this study because it is the most comprehensive database of satellite images at moderate temporal and spatial resolution (30-m). The first image acquired is a Landsat 1–5 MSS from 1973, followed by Landsat 4–5 TM (1986), Landsat 7 ETM+ (2000), and Landsat 8 OLI (2019) (Table 1). The criteria for image acquisition were to have low cloud contamination and to cover the summer or early fall period with the climax vegetation and peak phenological features. All the images represent a Level-1 precision and terrain corrected product (L1TP) on which geometric corrections are applied and precisely registered with sub-pixel misregistration, without affecting the analysis [17]. The image from 1973 has a coarser spatial resolution (60-m), the lowest quality (5 from maximum 9), and the highest RMSE of 27.7 for the geometric model (Table 1). Moreover, the image from 1973 was acquired in November, making it difficult to distinguish between forest and grass in some areas. However, the water and anthropic areas are obvious to distinguish from vegetation.
The raw calibrated pixel values were rescaled to surface reflectance using the atmospheric correction module Fast Line-of-sight Atmospheric Analysis of Spectral Hypercubes (FLAASH) in ENVI 5.3. The Landsat 1–5 MSS image from 1973 has been resampled to the 30-m spatial resolution to match with the other images. Clouds and their shadows have been masked using the function of mask (Fmask) algorithm [32]. The image from 1986 was covered with clouds on an area of 48 km2 in the south-east corner and for that area the classes from 1973 were considered (Figure 2). The small clouds identified in the image from 2000 were successfully removed during pre-processing and classification steps.

2.3. Image Classification and Change Detection Analysis

Image segmentation is the first step of OBIA that consists of dividing the image into relatively homogeneous objects. Then, the objects are used for image classification and change detection analysis based on their spectral, spatial, and contextual attributes [20]. Image classification was performed using the OBIA implemented in the semiautomatic feature extraction tool in ENVI 5.3. The popular multiresolution segmentation approach was employed using the Edge algorithm with a scale level of 10 for the segmentation step. The Full Lambda Schedule algorithm with a merging level 80 was used to aggregate the small segments within the larger ones based on their common spectral properties, texture, and geometry. Of the several tested settings, the proposed one attains the best visually agreeable results.
Due to the low quality of the Landsat image from 1973, only four LUCC classes were selected: forest, grass (including shrubs and cultivated land), water, and anthropic (including construction land, bare ground, disturbed ground, and erosions). The classification of the resulted objects into the four classes was conducted using the SVM algorithm. The SVM is a machine-learning method based on statistical learning theory that transforms original input space into a higher-dimensional feature space to find an optimal separating hyperplane [33]. Please refer to Appendix A for more details on the method SVM. We applied a radial basis function (RBF) kernel, one of the widely used and recognized kernels, to provide high results in remote-sensing applications. Different values were tested for kernel width ( γ ) and the penalty parameter ranging from 10−5 to 101 and 10−1 to 105, respectively. Cross validation and trial and error methods were used to optimize these user-defined parameters [34].
The input layers for classification were the spectral bands and the normalized difference indices derived from the spectral bands available for every scene (Table S1). Additionally, a digital elevation model (DEM) at 12.5-m spatial resolution, generated from the Phased Array type L-band Synthetic Aperture Radar (PALSAR) microwave sensor onboard the Advanced Land Observing Satellite (ALOS), was used. Therefore, for the Landsat 1–5 MSS (1973) the input layers were the DEM, the spectral bands green, red, near-infrared, and the normalized indices: Normalized Difference Vegetation Index—NDVI [35], Normalized Difference Water Index—NDWI [36], and Optimized Soil Adjusted Vegetation Index—OSAVI [37]. For the Landsat 5 TM (1986), 7 ETM+ (2000), and OLI (2019) the following input layers were used: DEM, spectral bands: blue, green, red, near-infrared, short-wave infrared 1, short-wave infrared 2, and the normalized indices: NDVI, NDWI, OSAVI, Normalized Difference Moisture Index—NDMI [38], Normalized Difference Built-up Index—NDBI [39], Normalized Burn Ratio—NBR [40], Modified Normalized Difference Water Index—MNDWI [41], and Enhanced Vegetation Index—EVI [42]. From these inputs, several attributes were extracted, including spectral properties (mean, minimum, maximum, and standard deviation), texture (range, mean, and variance), and shape (area, length, convexity, and major and minor lengths). This richer information allows exploiting the spatial context in grouping the segments with similar properties [15]. After the image classification was performed for each period, the transition dynamics of the LUCC were conducted using the Thematic Change module in ENVI 5.3.
The segments (n = 400) for calibrating and validating the algorithm were visually selected from the band combination red-green-blue of every image. These segments were divided into the training data set (70%) used to classify the LUCC types and the validation data set (30%) used to assess the accuracy of classified maps. Validation was performed using kappa coefficient (K) and the confusion matrix with its accuracy indices: overall accuracy (OA), user’s accuracy (UA), and producer’s accuracy (PA).

3. Results

3.1. Accuracy Assessment of Land Cover Classification

The classified images from 1986, 2000, and 2019 revealed a high OA (>90%) with a perfect agreement (K > 0.8) (Table 2). Unsurprisingly, the classification from 1973 recorded an OA of 80% with a substantial agreement (K = 0.73). This happens because the Landsat 1–5 MSS image has the lowest quality with an RMSE of 27.7 and a coarser native spatial resolution of 60-m. The classification from 1973 also presented the lowest values for the UA and PA for all the classes. The lowest UA was recorded by anthropic and grass with 72.7% and 77.4%, respectively, while the lowest PA was for water (60%) and anthropic (64%). The classification maps from 1973 revealed that the algorithm had difficulties in mapping the small rivers (Figure 2). Thus, only the lakes visible in the 1973 image have been considered for the change detection analysis. However, the PA for forest and grass was high even for the image from 1973 with 100% and 96%, respectively. Forest also presented the highest PA (95.5 to 100%) for the classifications from 1986, 2000, and 2019, followed by anthropic (89.6 to 100%), grass (85.6 to 100%), and water class (90.2 to 93.7%). For the same years, the UA was slightly higher for anthropic (96.3 to 100%) and water (91 to 100%), than for forest (85.5 to 94.7%) and grass (84 to 96%).

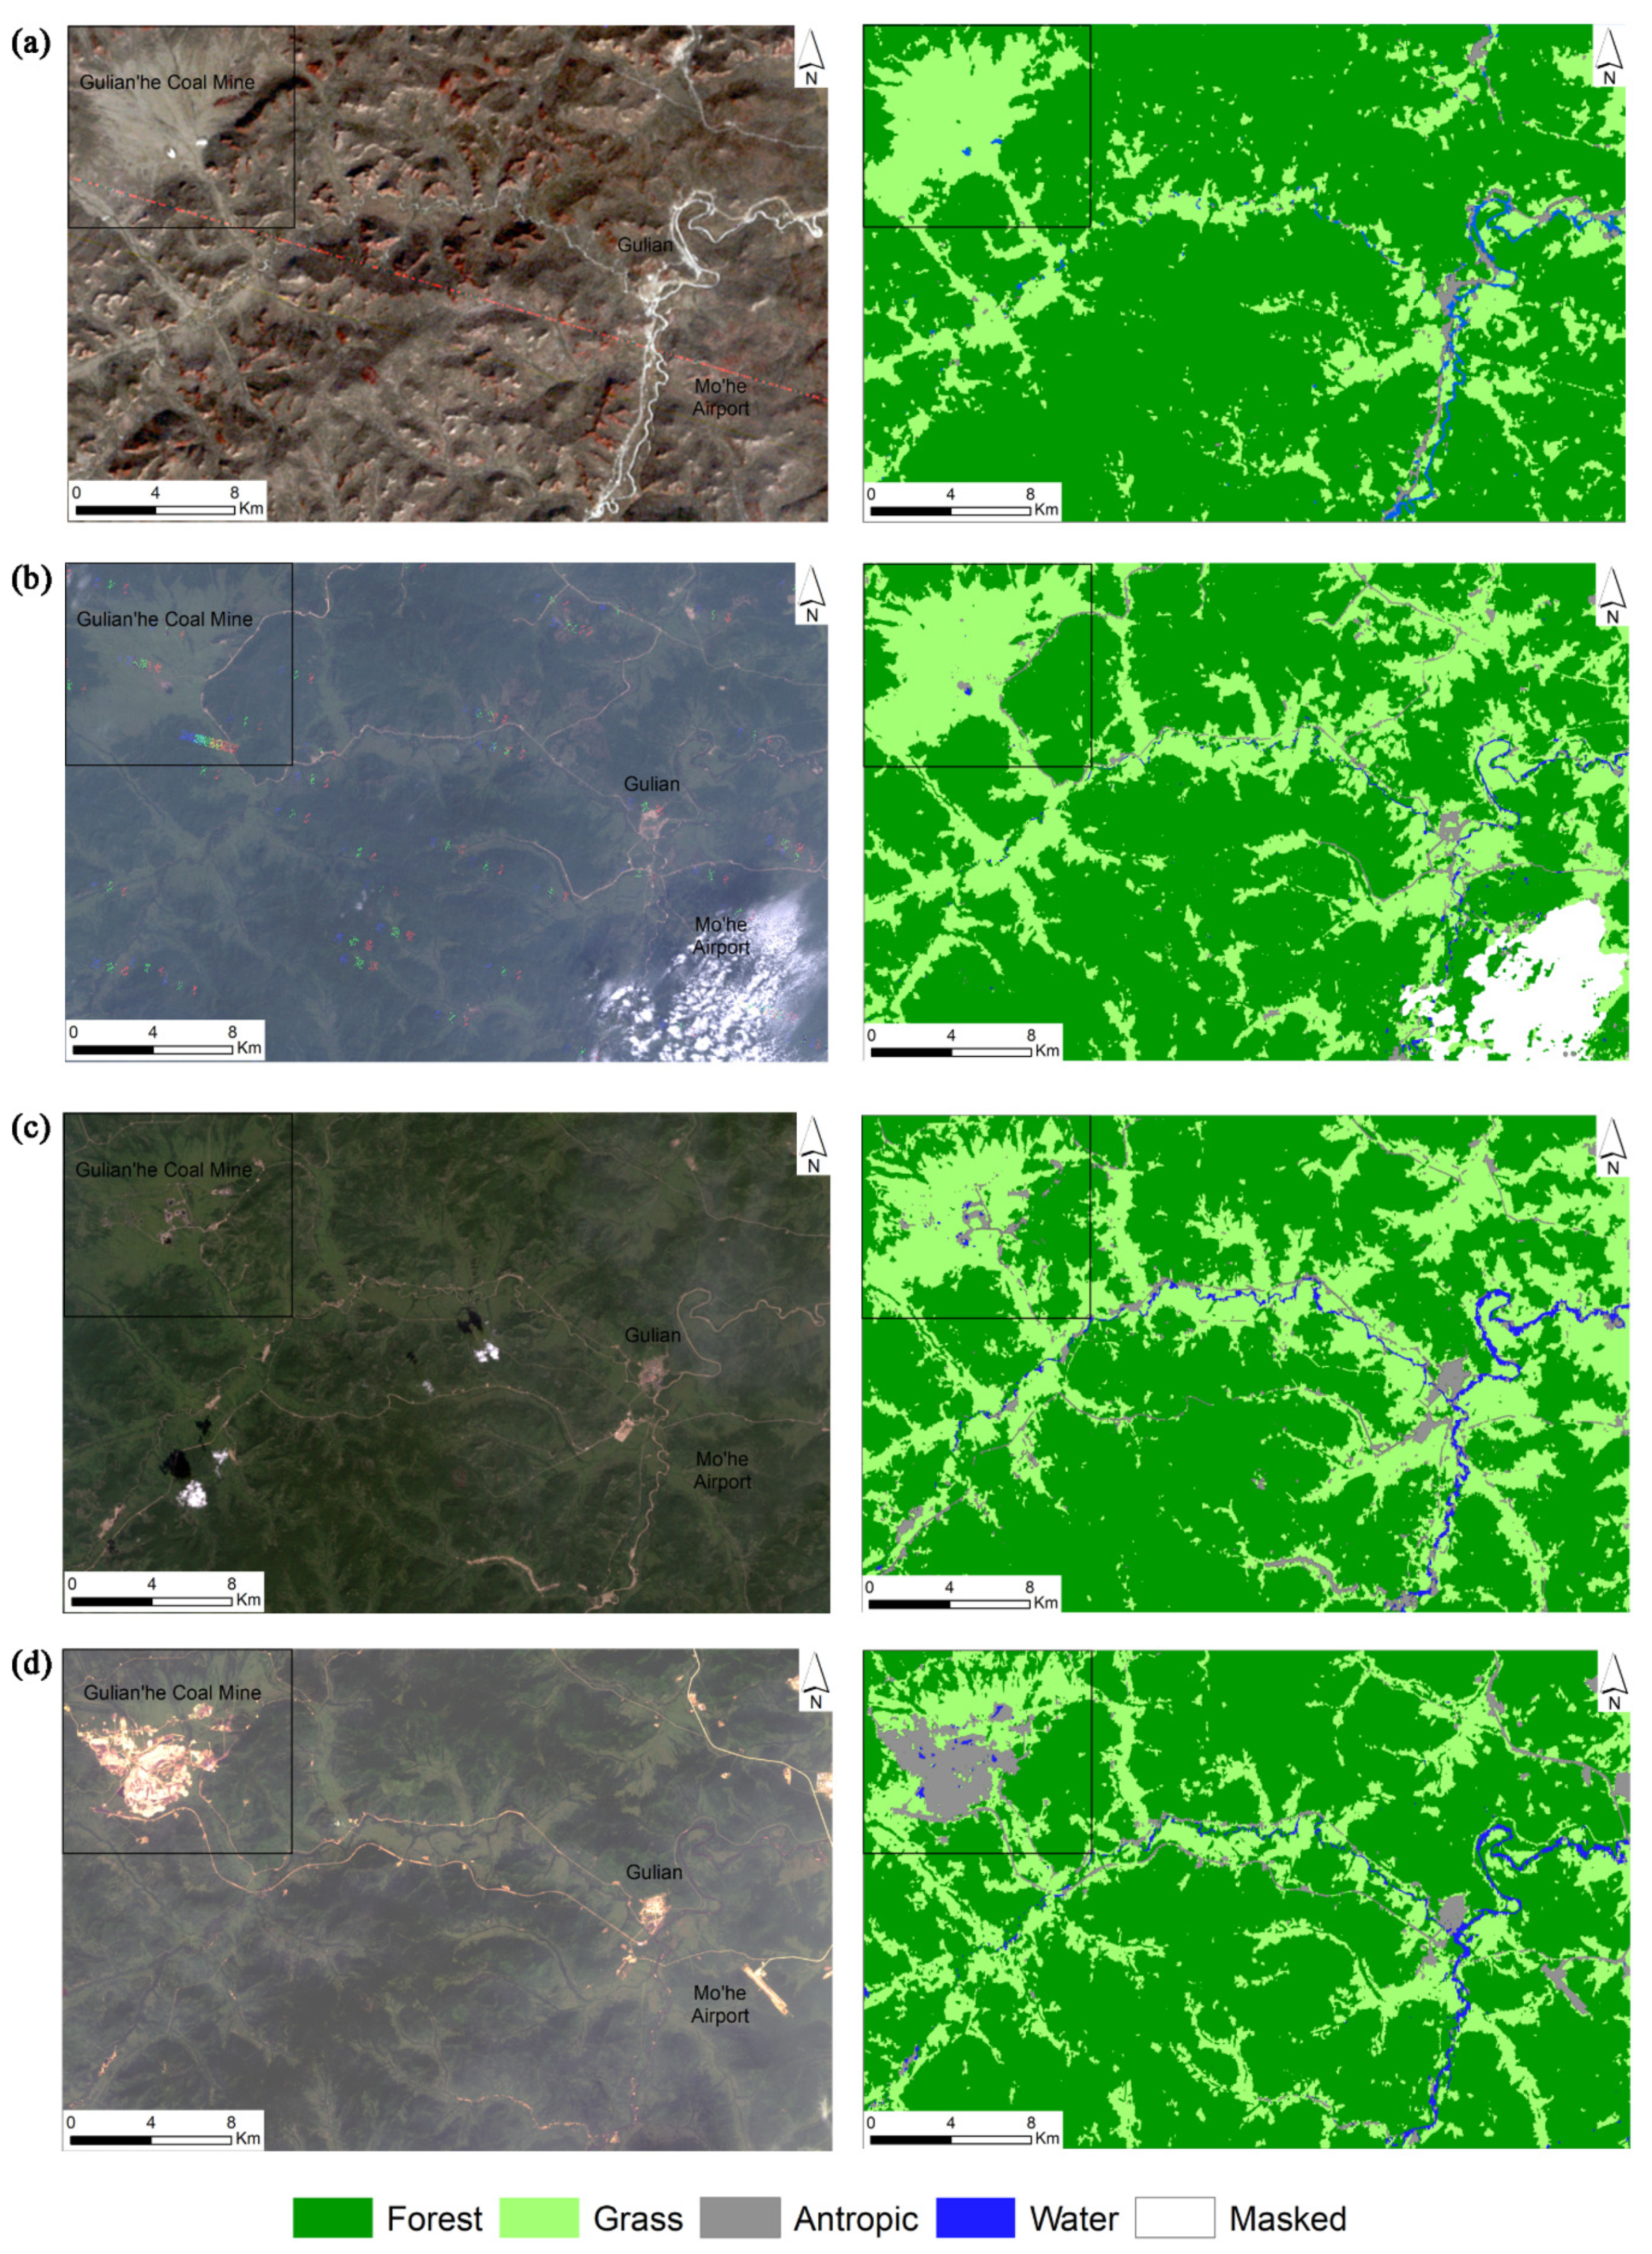
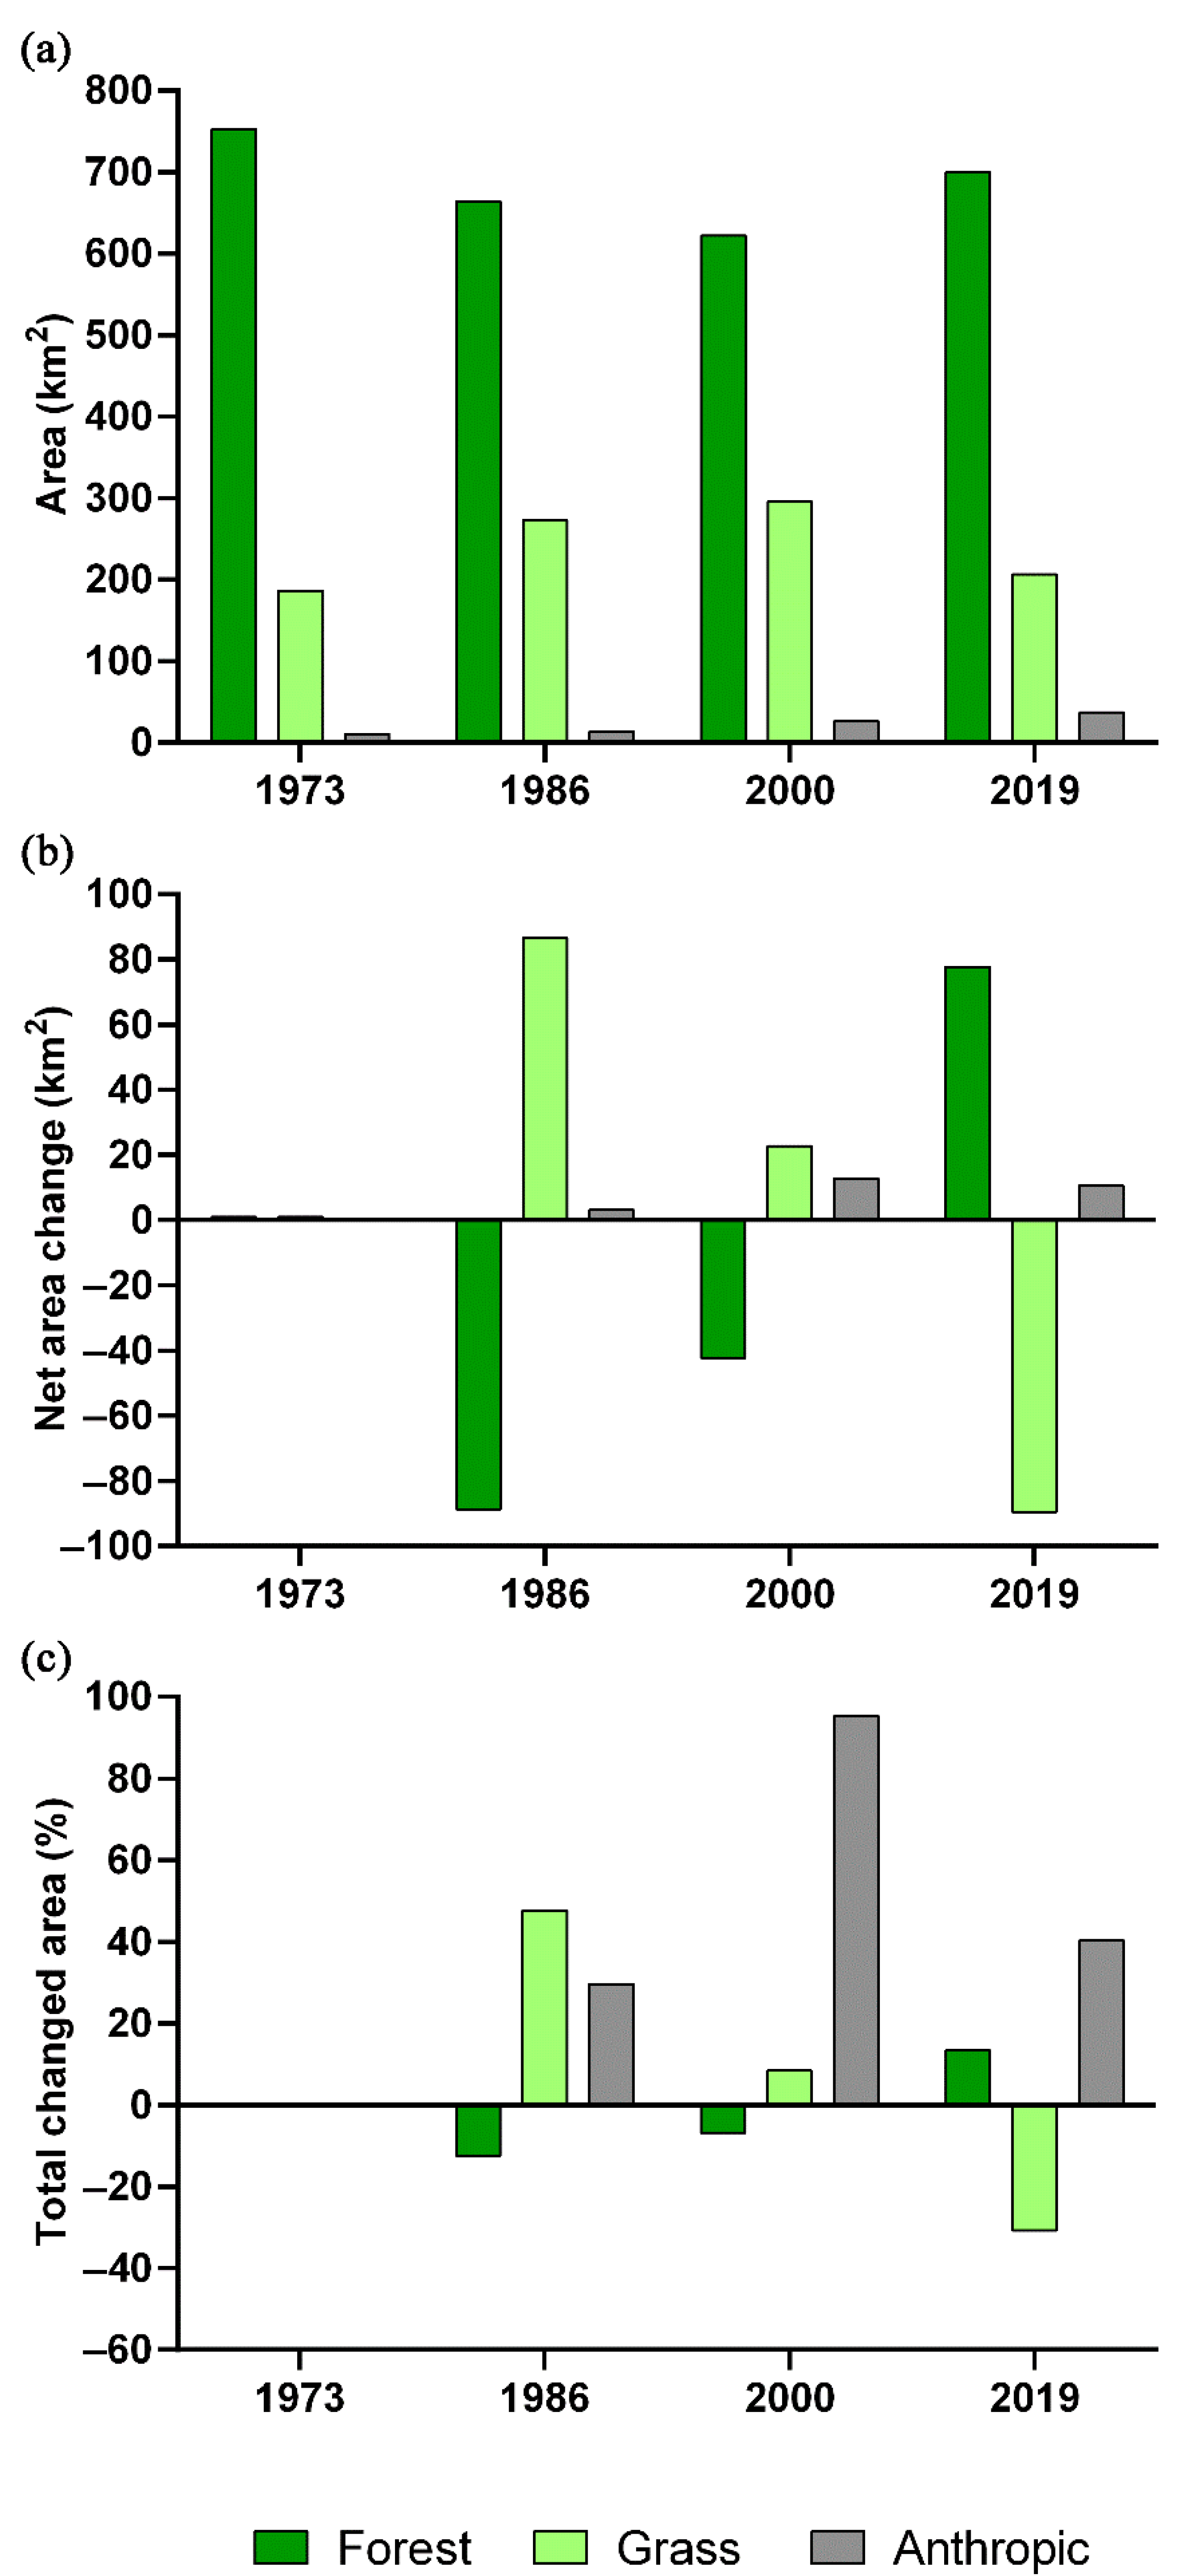
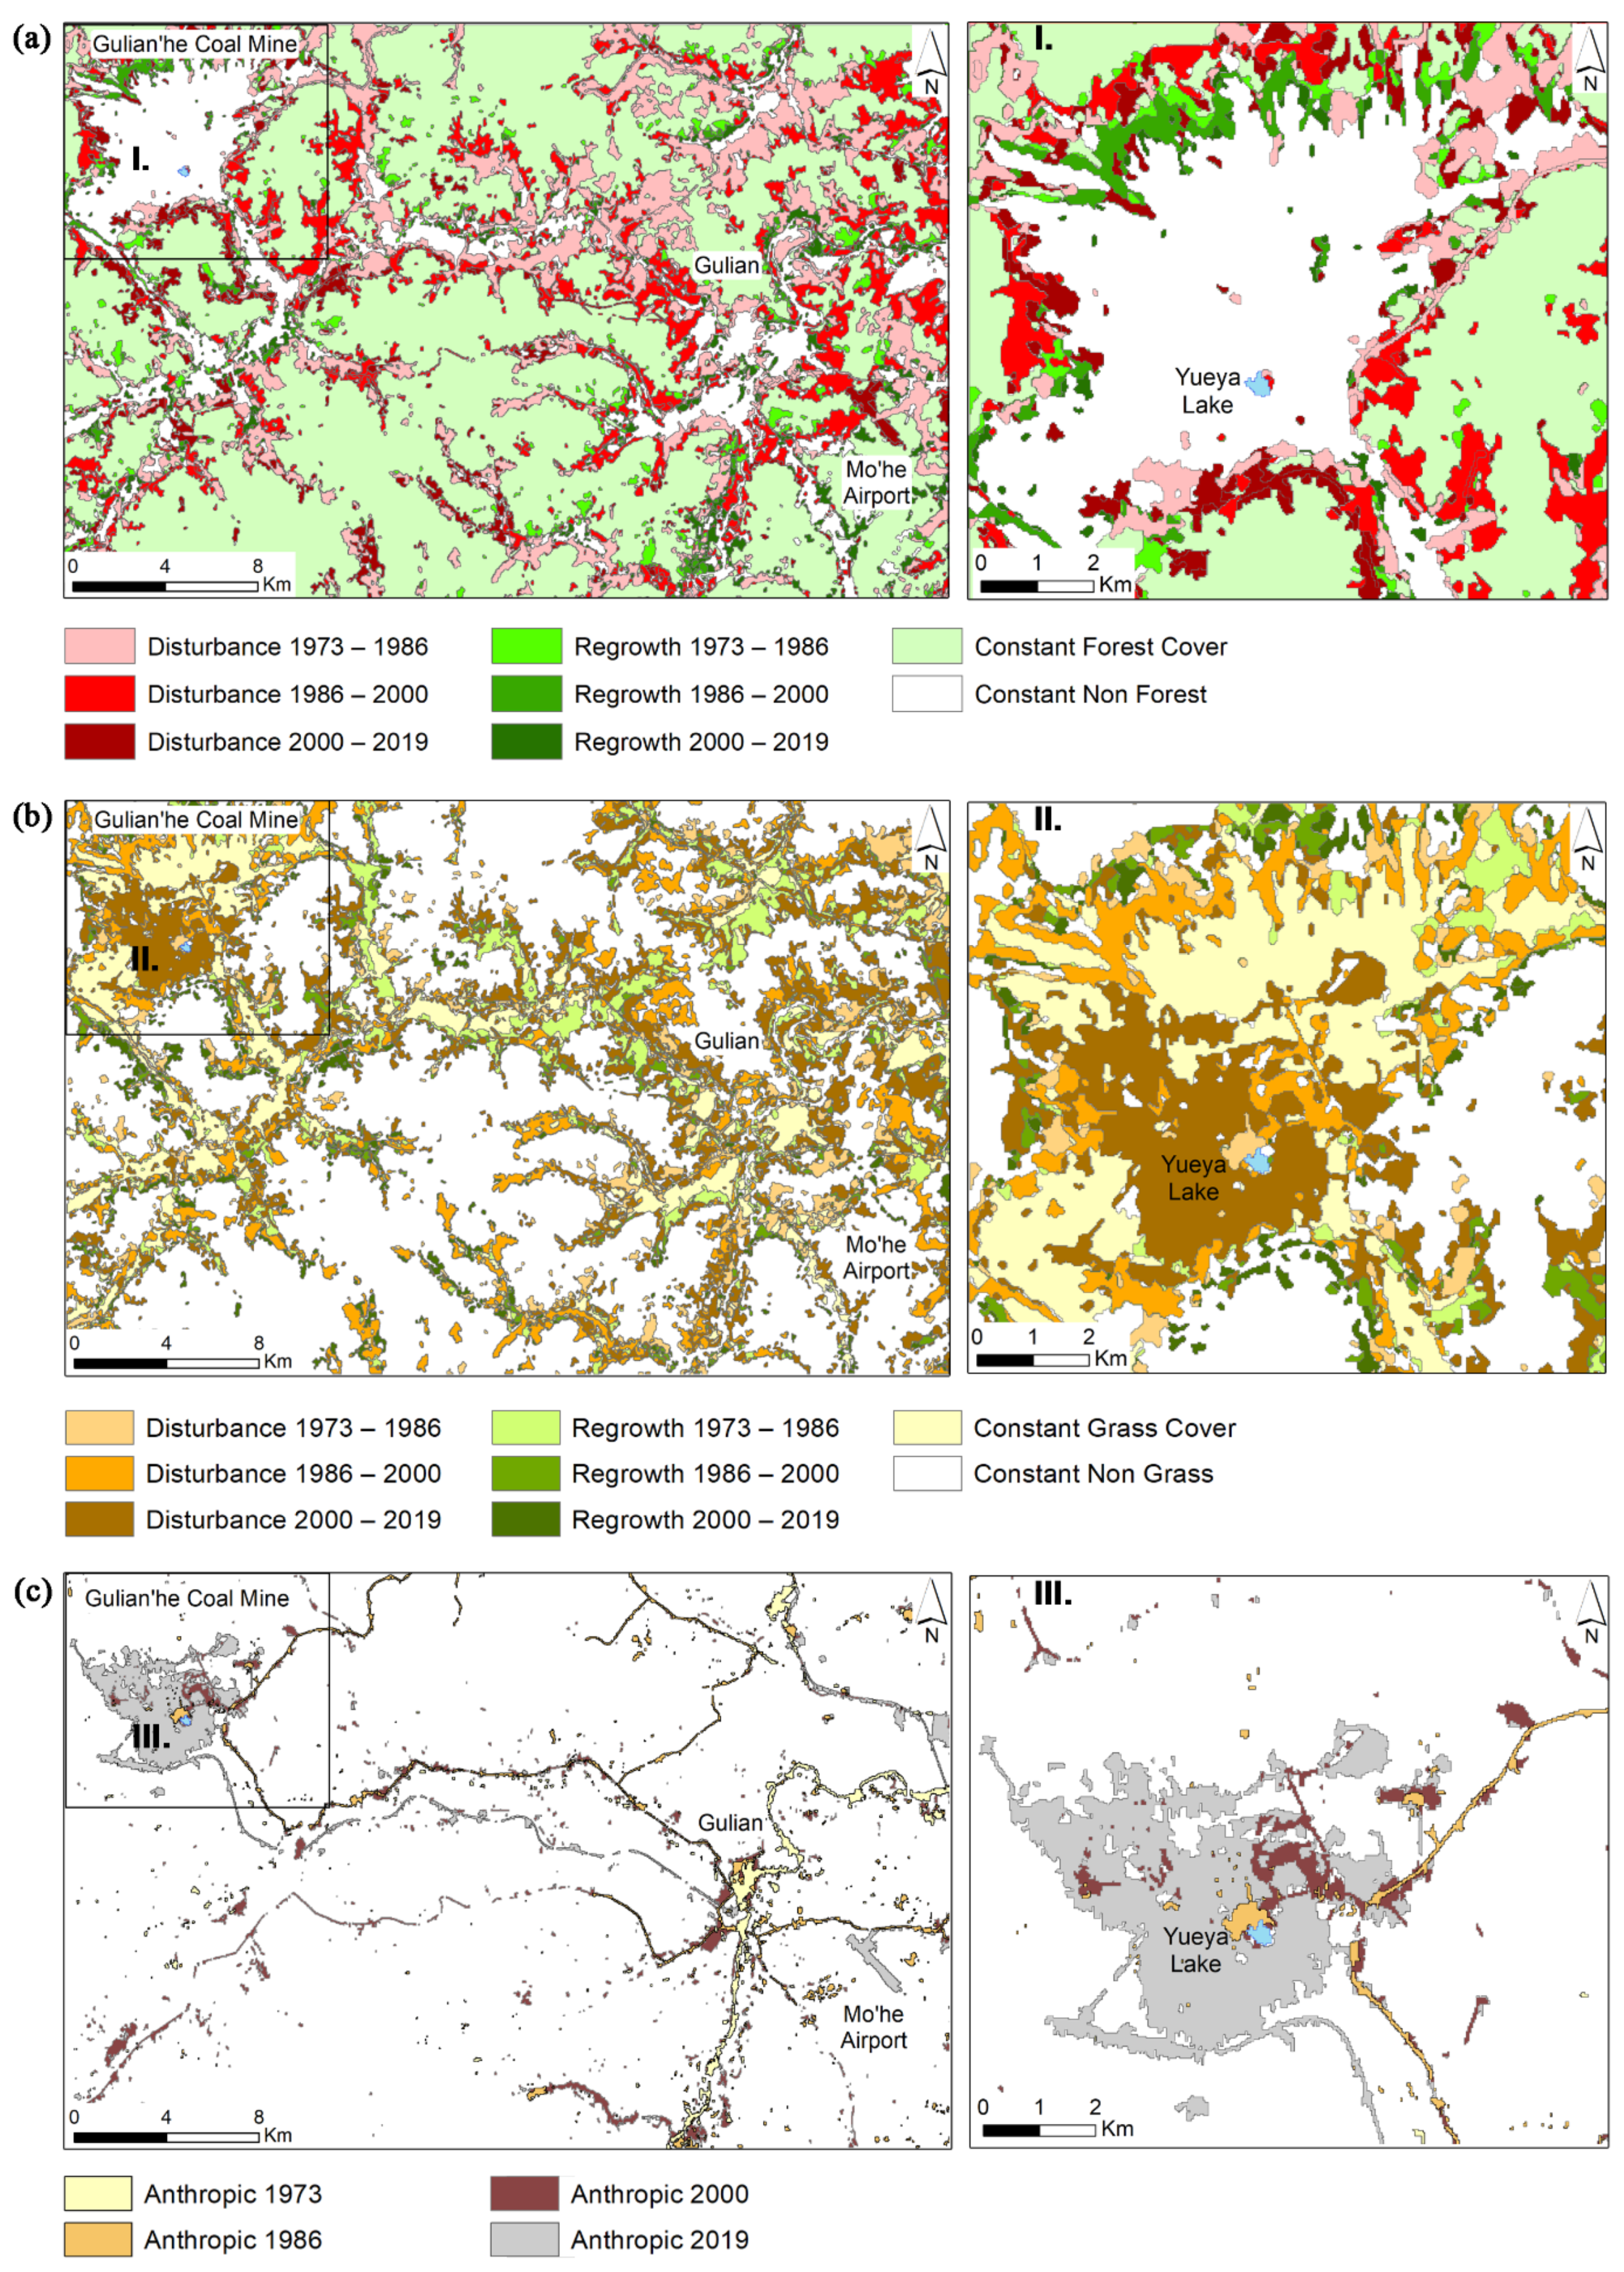
3.2. LUCC in the Hola Basin

Time-series of Landsat satellite images provide the spectral information necessary to identify the LUCC. Furthermore, we present changes in the three classes of forest, grass, and anthropic; classes that have the highest accuracy and the most obvious changes. From the water class only the lakes around the Yueya Lake were analyzed (Section 3.3). Landsat images are too coarse to reliably detect the evolution of the meandered small rivers, especially in the forested areas (Figure 2) as revealed by the low PA. Through the observed period (1973 to 2019), the forest was the dominant class in this region covering an area between 620 and 750 km2, which represents 65 to 78.6% of the investigated area (Figure 3a). It is followed by the grass class with an area ranging between 187 and 295 km2 (19.5 to 31%). The anthropic class was ranging between 10 and 37 km2 (0.4 to 1%). The amount of these classes varied substantially in our study area during the last 46 years. Forest class revealed a net cover decrease of 88 km2, a decrease of 11.8% from 1973 to 1986 (Figure 3b,c). From 1986 to 2000, the forest class continued to decrease by 42 km2 (6.4%), while from 2000 to 2019 increased by 78 km2 (12.5%). On the contrary, the grass class showed an increasing trend of 86 km2 (46.5%) from 1973 to 1986 and 23 km2 (8.3%) from 1986 to 2000. From 2000 to 2019, the grass class presented a sharp decrease of 90 km2, representing a 30% loss from the total grass cover in 2000. Therefore, for the entire study period (1973 to 2019), the forest class declined by 53 km2 (7%), while the grass class grew by 20 km2 (10.6%). The anthropic class presented a continuous increase from a total surface area of 10.6 km2 (1973) to 13.7 km2 (1986), 26.5 km2 (2000), and 37 km2 (2019). Accordingly, it represents an increase of 29% (3 km2) in the first period (1973–1986), 93% (13 km2) in the second period (1986–2000), and 40% (10.6 km2) in the last period (2000–2019). Thus, the surface area of the anthropic class increased 2.5 times over the last 46 years. The change maps (Figure 4) show the spatiotemporal patterns of LUCC, revealing both very stable areas, in contrast to areas with substantial changes. The stable areas prevail on the mountain slopes, while the LUCC appear mainly along the roads and in the proximity of the coal mine and settlements.
LUCC in the Hola Basin for the period 2000–2019 have been quantified based on the permafrost zonation model of Obu et al. [31] developed for 2000–2016 at 1 km2 scale. According to this zonation map, in the Hola Basin, the isolated permafrost prevails (70.6%), and it is followed by sporadic permafrost (29.2%) (Figure 5a). Only a small patch of discontinuous permafrost (0.2%) is located around the Yueya Lake with little LUCC compared to other permafrost types. The area of isolated permafrost is more widespread than that of sporadic permafrost, while the LUCC are in a relatively similar proportion (Figure 5b,c). The LUCC for the forest and grass classes in the isolated permafrost zones are ranging from −76 to 74%, and in the sporadic permafrost, from −64 to 52%. However, the anthropic extent is significantly larger in the sporadic permafrost zone (65%) than that in the isolated permafrost zone (31%), and it is also notable in the discontinuous permafrost (4%).

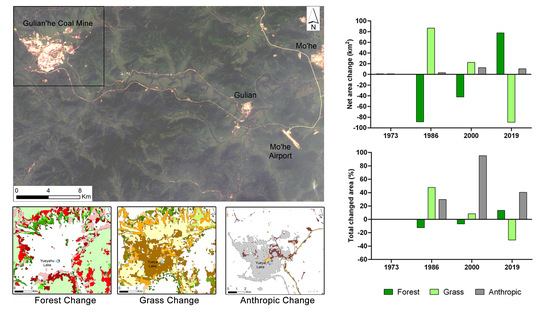
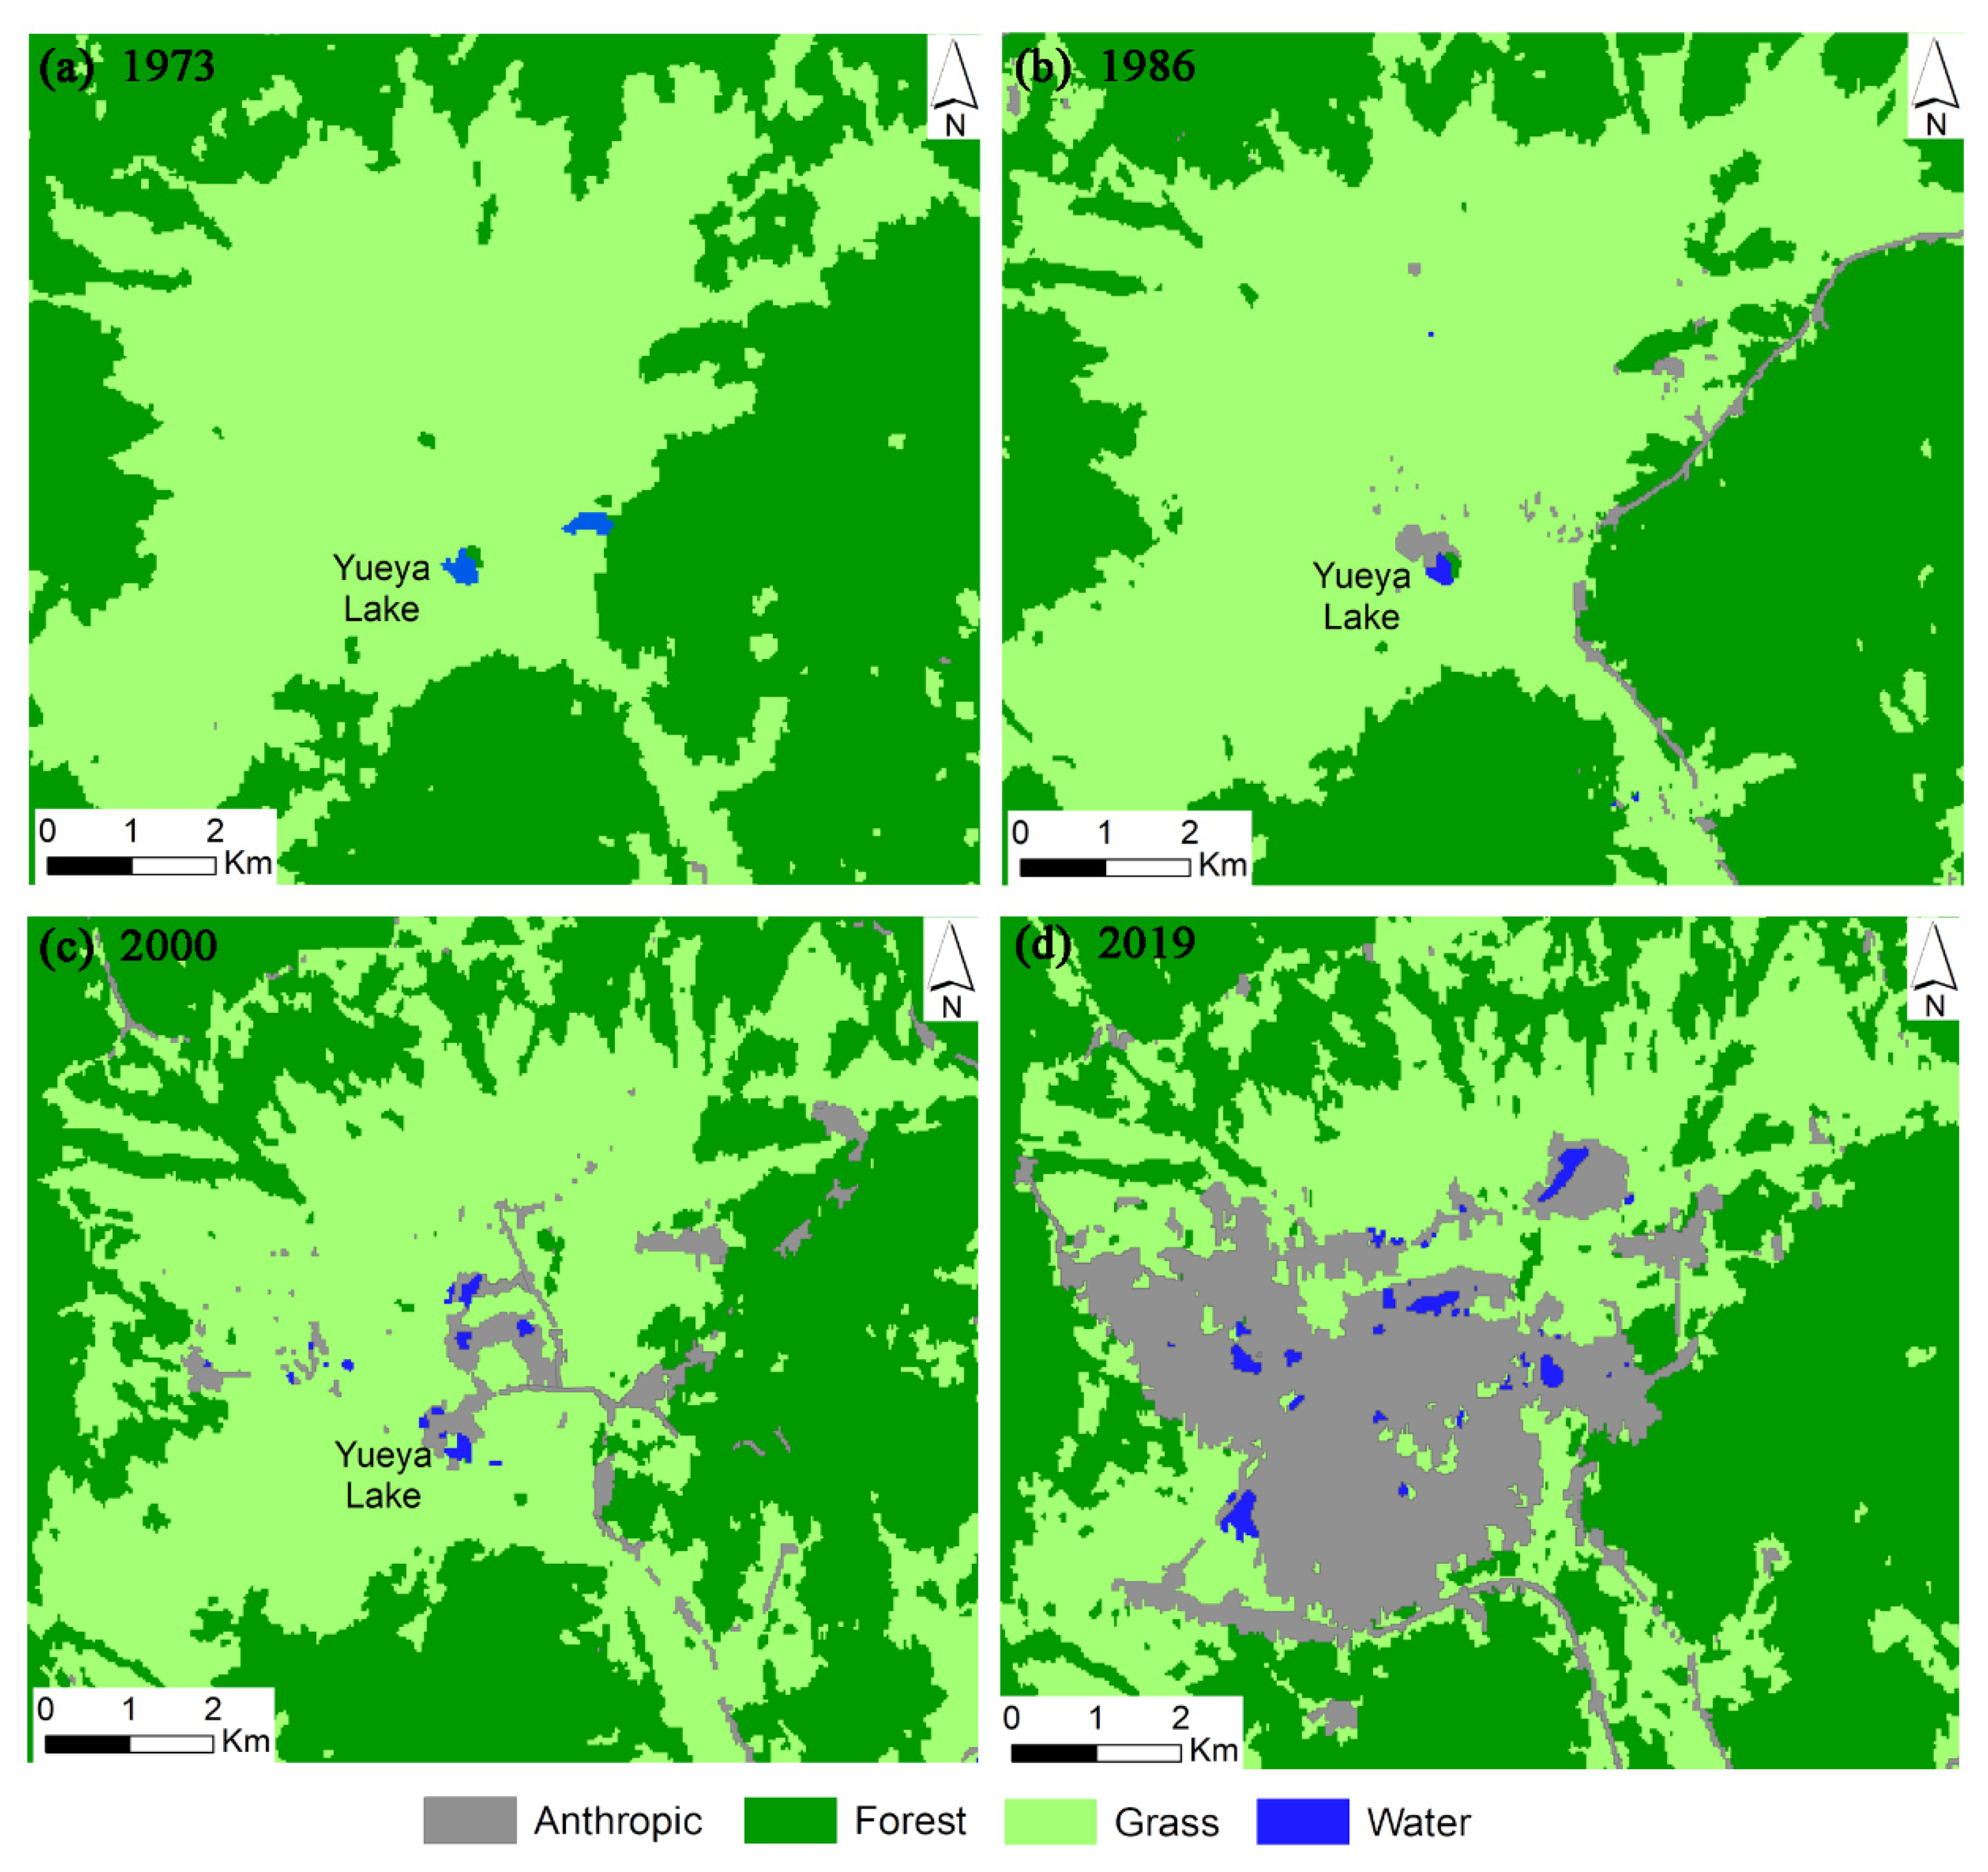
3.3. LUCC around the Yueya Lake

In 1973, in addition to the Yueya Lake, there was another unnamed lake, and the surrounding area was undisturbed (Figure 6a). The road construction and mining activities started to show up mainly from 1986 (Figure 6b), gradually expanded until 2000 (Figure 6c), and after 2000 a boom in coal mining was recorded (Figure 6d). In 1986, in the vicinity of the lake, there was only one quarry, with a surface area of 0.23 km2. In 2000, 12 quarries scattered around the lake, covering an areal extent of 2.32 km2 (Figure 7a,b). Until 2019, these quarries significantly expanded and aggregated each other, counting for eight quarries with a surface area of 19.61 km2. The other nameless lake, close to the Yueya Lake, with a surface area of 0.113 km2, disappeared from 1973 to 1986 (Figure 6a,b), while the Yueya Lake shrank from 0.110 to 0.075 km2. The Yueya Lake continued to shrink to 0.067 km2 in the period of 1987–2000 and drained completely by 2019. However, from 1986 to 2000, 13 new lakes appeared around the Yueya Lake, especially in the quarry areas (Figure 6c and Figure 7a). The surface area of these lakes was around 0.28 km2. By 2019, the number of lakes increased to 32, covering an area of 0.82 km2 (Figure 7a,b). The large extension of quarries in this area caused substantial disturbances to the forest class and more severely to the grass class particularly after 2000 (Figure 6c,d).

4. Discussion

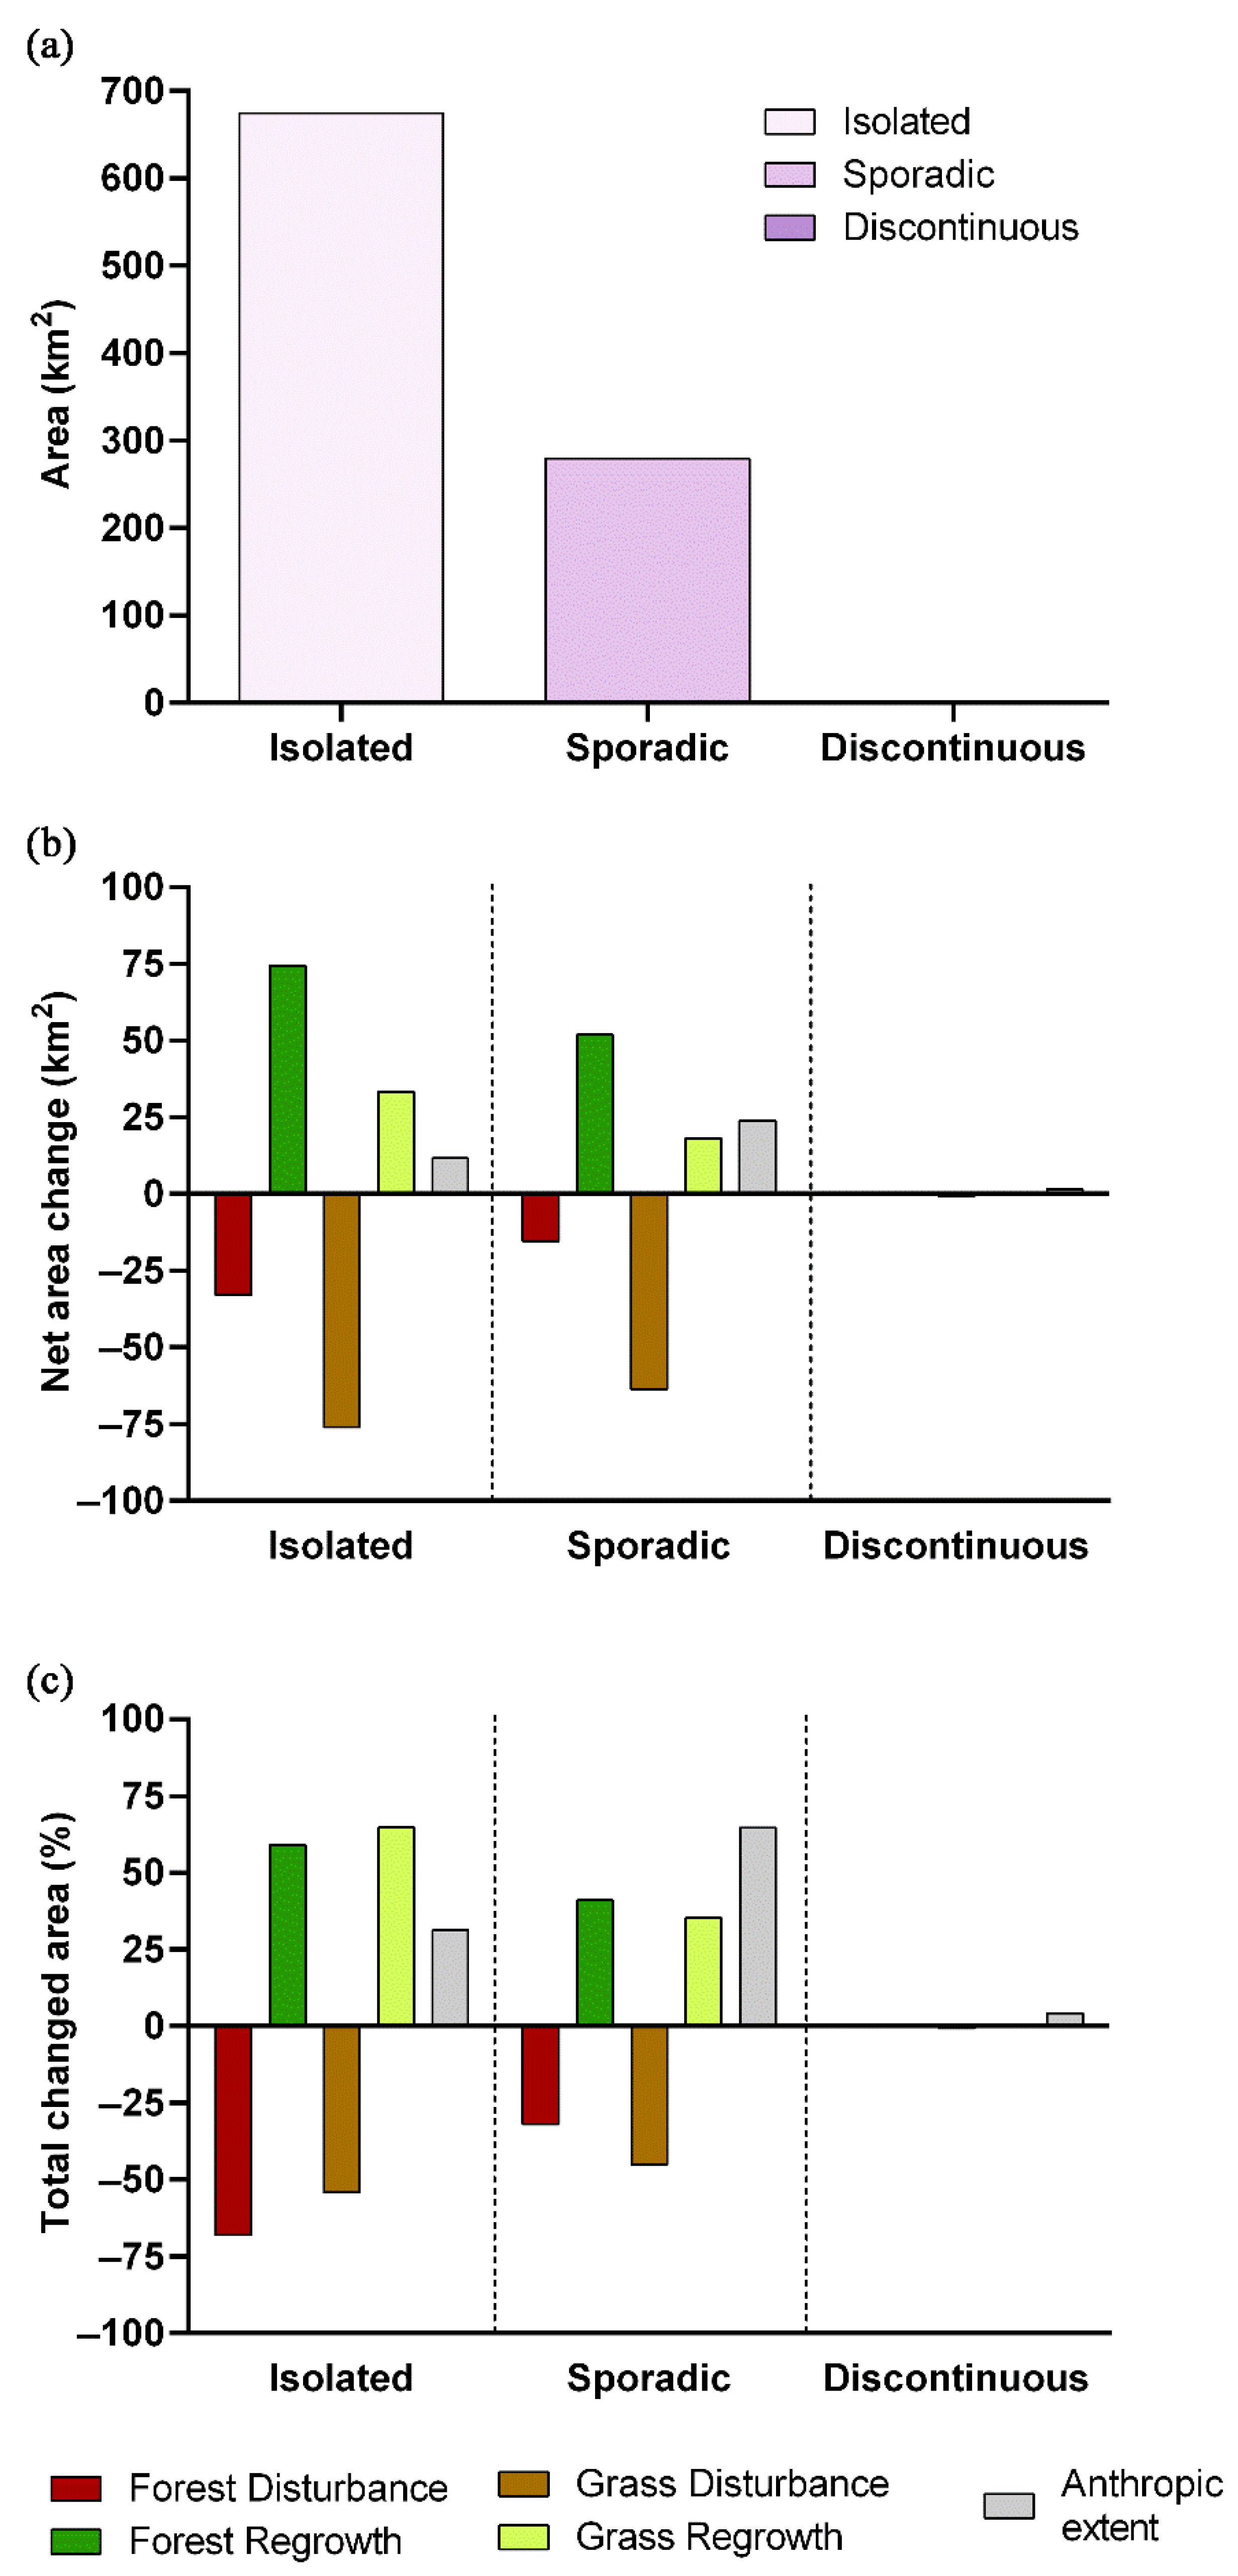
4.1. Change Dynamics in the Hola Basin

The disturbance and regrowth of the forest class are mainly concentrated along the roads and around the major settlements (residential areas) (Figure 4a). This suggests that the main cause for forest disturbance is deforestation for lumbering, resource exploitation, agriculture cultivation, and other activities of economic development. There are also a few spots of forest disturbance on the mountain slopes, far from any roads. These disturbances could be attributed to pest/bug outbreaks, drought, fires, landslides, and windfall that prevail in this area [43]. Forest fires have been documented in Northeast China since the 1960s with a frequency ranging from 9.6 to 42 forest fires per year [6,44,45]. Severe burns also occurred in the Hola Basin in 1987 and 2002, causing large disturbances to the forest class, in turn, significantly impacting the permafrost environment. Even 30 years after the fires, the vegetation types have not fully recovered and reached the climax community [46]. Increasing wildfires extent, frequency, and severity are also observed in many boreal and Arctic regions, causing irreversible degradations to permafrost landscapes. Effects of wildfires coupled with climate change include a warmer and deeper active layer, expansion of taliks (unfrozen ground in permafrost regions), and rapid losses of soil carbon stock [6,47]. For example, in western Canadian permafrost peatlands, the impact of wildfires tripled the rate of thermokarst bog expansion [48].
Larger areas of forest disturbances in the Hola Basin are observed for the first two analyzed periods (1973–1986 and 1986–2000) compared to the third period (2000 to 2019). Rapid population growth and land shortage have forced the clearance of natural vegetation for the expansion of croplands, industry, and urbanization. In the northern part of the Hola Basin, forest area decreased significantly from 1986 to 2000 due to the 6 May 1987 fire. This has led to environmental degradation, soil and water pollution risks, high carbon emissions, local climate change, and the loss of wildlife habitat and biodiversity [2,3]. The disturbances in the third period are concentrated in the mining area, at the airport location, and along the roads in the south and south-west. However, in this period, the areas of forest regrowth are larger than those of forest disturbance. This could be explained by the forest regrowth on previously disturbed forest areas or abandoned farmlands. Starting with the 1980s, a considerable cropland decline has been observed all over China while urban and forest areas expanded [3]. Between 1978 and 2017, over 118,205 km2 of croplands in China were converted into urban areas [14]. Zhang and Liang [49] concluded the forest development and climate controls as the main drivers for the increase in forest biomass in Northeast China from 2001 to 2010. Forest recovery from fires, afforestation, and reforestation also represent important factors for the increasing trend [49]. With the initiation of the Natural Forest Conservation Program in 1998, a substantial reduction was observed in wood production and fire-burned areas. Moreover, 85.9% of the decrease in areas affected by forest fire was concentrated in Northeast and North China [7]. A gradual restoration of vegetation after the 1987 fire was observed in the Hola Basin but currently, it mainly grows broad-leaved forest.
As with those in the forest class, spatiotemporal changes in the grass class (Figure 3b) are concentrated mainly along roads, around settlements, and exploitation sites. Extensive areas of grass disturbances occurred after 2000 when Northeast China experienced the lowest grassland growth in China [50]. On the other hand, the largest areas of grass recovery were recorded from 1973 to 1986, mainly synchronous with forest decline. He et al. [51] also observed an increase in the forest area and a decrease of grasslands over China from 1982 to 2013.
The high rates of disturbances and regrowth for forest and grass in some areas from the Hola Basin may be overestimated. The UA for these classes is relatively low, ranging between 77 and 85% in the classification maps from 1973 and 2000 (Table 2). However, the UA is above 93% for the classification maps from 1986 and 2019.
The areal extent of the anthropic class started to increase more rapidly in the Hola Basin from 1986, especially after 2000 (Figure 3c). Until 2000, the infrastructure developed mainly by the construction of roads and city/town expansion, while areas disturbed by coal mining were relatively small. However, the areas affected by mining grew significantly after 2000, marking the main reason for the expansion of the anthropic class. Additionally, the airport construction, extension of Mo’he city, and the construction of the new road between the coal mine and Gulian town all contributed to the rapid expansion of the anthropic class after 2000. All these anthropic expansions are fragmenting the landscape and ecosystem and disturbing the wildlife by blocking their migration routes [52]. Likewise, human activities are contributing to 50.46% of vegetation changes in Northwest China, while the climate factors (e.g., precipitation and temperature), only 16.39% and 4.33%, respectively [27]. At the same time, on the northeastern QTP, climate warming is the main driver for permafrost degradation and the shrinking of thermokarst lakes and ponds [53].
In Northeast China, climate warming is significantly impacting the LUCC. At a national scale, Northeast China underwent the largest increase in temperature and a significant decrease in summer-autumn precipitation [54]. Persistent warming was recorded in Northeast China from 1970 to 2000, particularly after 1991. During 1991–2000, the decadal average air temperature was 0.9–2.2 °C higher than those from the 1960s, being the largest temperature increase in China [44]. At the Mo’he meteorological station, air temperature increased by 0.31 °C/decade from 1960 to 2015 [55]. This increase is higher even compared to the concurrent global averages of climate warming. The air temperature in Northeast China has increased at an average rate of 0.35 °C/decade from 1961 to 2012 while the global temperature increased at 0.12 °C/decade from 1951 to 2012 [56]. This significant temperature increase corresponds well with the frequent forest fires and the severe burns from the 1980s and 2000s in the Hola Basin. Ground temperatures also increased, for example, with 0.7 °C at 20 m depth (1973 to 1978) and 0.2 °C at 13 m depth (1984 to 1997) [44]. Therefore, the permafrost environment in Northeast China is one of the areas with the most rapid response to climate change. The southern limit of permafrost has been notably moved northwards by about 50–120 km, reducing its areal extent from 3.9 × 10⁵ km2 in the 1970s to 2.6 × 10⁵ km2 in the late 2000s [55]. Climate warming and deforestation have accelerated permafrost degradation by deepening the active layer, rising ground temperatures, expanding taliks, and developing thermokarst landforms. The rapid urbanization, disturbances from road construction, urban heat-islands, and forest fires contributed to permafrost degradation [44]. LUCC are significantly present in the sporadic permafrost zone, suggesting that permafrost degradation is contributing to the LUCC in the Hola Basin as well. In other areas such as the Pechora catchment (Russia), permafrost degradation is larger in discontinuous and sporadic zones as suggested by a much denser thermokarst lake network [57]. Additionally, in the Hola Basin, the thermokarst lakes are present only in the discontinuous permafrost zone. Permafrost degradation has induced natural hazards, such as thaw settlement, thaw slump, and landslides that are threatening the foundation soils of buildings and infrastructure. Furthermore, it was observed a more rapid permafrost degradation under the engineering infrastructure, such as the Mo’he airport [55] and the China–Russia Crude Oil Pipeline [58,59,60]. The deepening of the active layer is also affecting the ecosystems by reducing the plant cover, below-ground biomass, and species richness [61]. The increased thickness of the active layer is facilitating rapid drainage and loss of soil water in the active layer that leaves less available water for plant growth, increasing the potential for droughts [56]. To maintain the diverse ecosystems from Northeast China, several natural reserves have been established to protect boreal coniferous forests, wetlands, rare waterfowls, and cold-water fish [52].

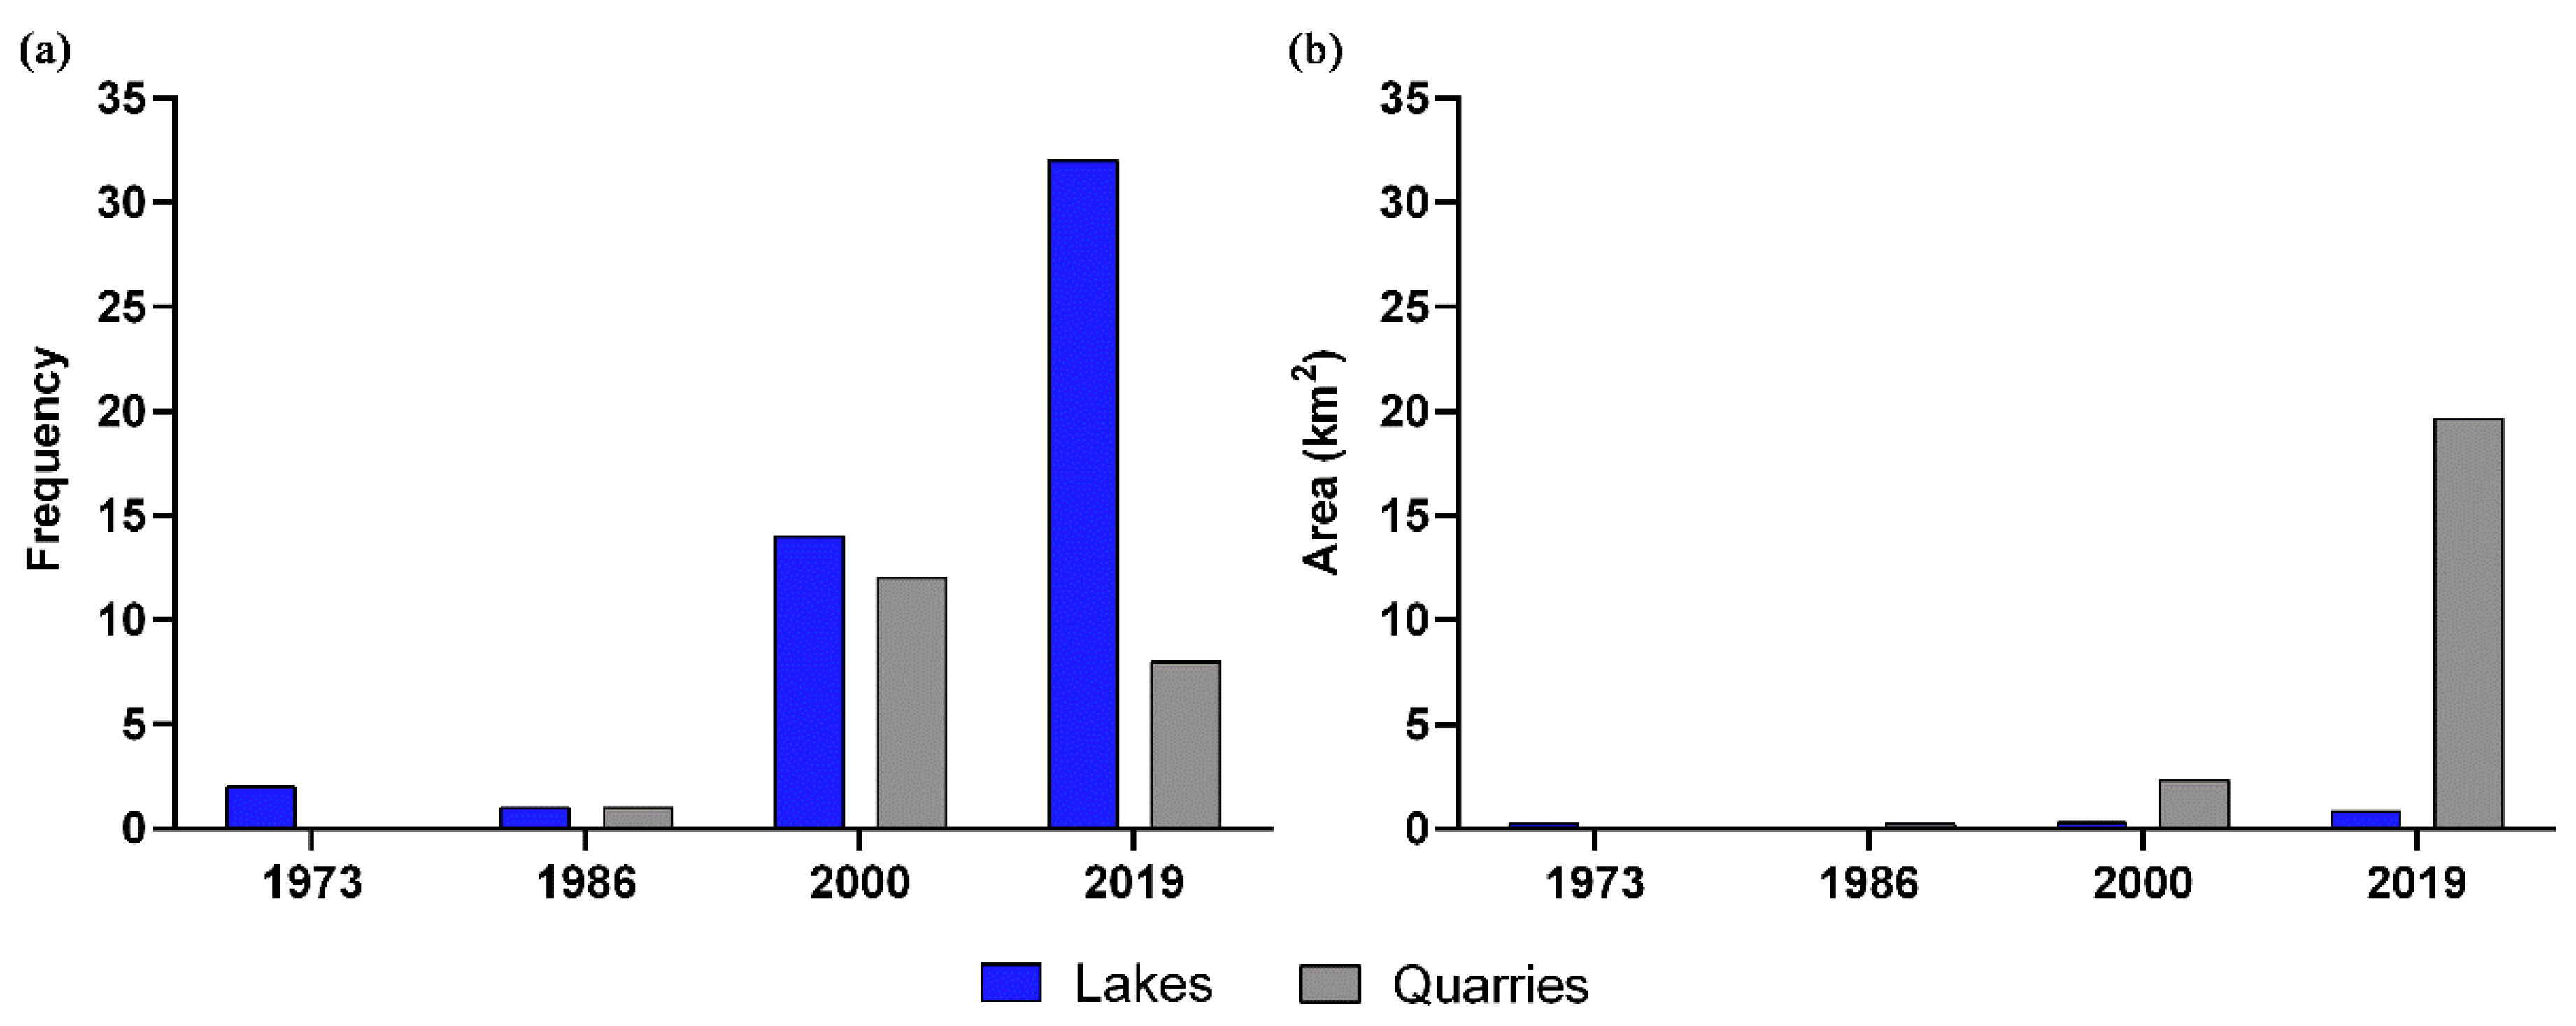
4.2. Change Dynamics around the Yueya Lake

The change detection analysis has revealed that mining activities are the main factor of landscape changes around the Yueya Lake and possibly the cause for the lake drainage. It was noticed that the spatiotemporal distributive patterns of mining pits and quarries were strongly correlated with the appearance or disappearance of the lakes. Due to quarries extension and underground mining galleries, extensive and intensive disturbances to permafrost, such as open the forested lands, land stripping and clearance, and pit and tunnel excavations, eventually led to thaw subsidence on the ground surface and thermokarst lakes drainage. Through drilling prospects in the 1980s and mid-2000s, several taliks were identified around the Yueya Lake, as well as an open talik under the lake. The expanding mining activities and declining forest coverage extended the thaw depths of taliks that increased surface water supplies to the sub-permafrost water [62]. The hydrothermal stability of the thermokarst lake and the surrounding permafrost has been further complicated by the nearby coal deposits and pumping of the lake water for a local power plant (Kengkou Powerplant) [62]. These disturbances led to the sudden drainage of the lake before 2013, but when the power plant was closed, the lake level was able to recover. The local government has made great efforts to restore the environment for recreational purposes, with the Yueya Lake as one of the tourist scenic spots [62]. However, in the winter of 2012/2013, the Yueya Lake rapidly drained. During the field observation from September 2019, large subsidence with remnant timber from underground galleries and 30 to 40 cm wide cracks were found on the bottom of the drained Yueya Lake (Figure S1a). Near the Yueya Lake depression, there was still a small residual thermokarst lake but with a surface area below the capabilities of the mapping method. This lake also shows a shrinking trend with the active collapse of the lakeshore and retrogressive erosion of the thaw slump (Figure S1b). Thus, patches or islands of permafrost are still present around the Yueya Lake depression, especially in the forested areas. Evidence is the presence of the “drunken” forest on the west side of the lake depression that indicates the melting of ground ice. Trees growing on clayey soils with a shallower permafrost table and under the disturbances of thermokarst are conducive to form “drunken” forest [63]. The geophysical surveys using the electrical resistivity tomography (ERT) from September 2019 revealed small patches of permafrost in this area [64]. Drunken forests, clusters of sinkholes, frozen debris flows, and landslides, probably as a result of permafrost degradation, have been frequently observed in other permafrost environments from Northeast China.
Extensive manifestations of LUCC were also observed in the Arctic region based on satellite images and aerial photographs caused by rapid climate change and intensive industrial activities. In the Bovanenkovo gas field, Yamal Peninsula, the affected areas substantially increased from 70 km2 in 1984 to 836 km2 in 2011 in association with the oil exploration and development activities [65]. The industrial transformation continued at this site where the length of gas pipelines increased by 7.4 times between 2004 and 2016 [66]. Similarly, in northern Alaska the oil field development had affected 34% of the mapped area from 1949 to 2011 [67]. Satellite observations also indicated a pronounced shrub expansion in the circumpolar Arctic tundra driven by climate warming and permafrost degradation [68]. In Northeast China, as with many boreal and Arctic regions, the combination of climate warming and anthropogenic activities has significantly changed the landscape. Consistent LUCC over short periods, without adequate mitigative measures, are causing considerable disequilibrium in the landscape. Permafrost is thawing rapidly and dramatically, leading to changes in the landscape, increasing the risks of natural hazards, and threatening the water resources and ecosystems. These changes could result in hydrological, ecological, societal, and environmental consequences of extensive concern.

5. Conclusions

Analysis of permafrost landscape changes for 46 years around the Yueya Lake and the Hola Basin based on Landsat satellite images revealed the following conclusions:
The object-oriented classification based on the Support Vector Machine algorithm revealed high overall accuracy (OA > 90%) and a perfect agreement of the kappa coefficient (K > 0.8) for the 1986, 2000, and 2019 images. Due to the lower quality of the image from 1973, the OA was 80% and K = 0.73. In the change detection analysis, this may add some overestimations, which are acceptable due to the large changes observed in this area.
Forest, the largest class (620–750 km2), declined by 88 km2 (11.8%) from 1973 to 1986 and by 42 km2 (6.4%) from 1986 to 2000. From 2000 to 2019, the forest class was recovered by 78 km2 (12.5%). Grass, the second-largest class (187–295 km2), showed an opposite trend. In the first (1973–1986) and second (1986–2000) periods, increased by 86 km2 (46.5%) and 23 km2 (8.3%), while in the third period (2000–2019), it decreased by 90 km2 (30%). The anthropic class revealed a sharp and continuous expansion from 10 km2 in 1973 to 37 km2 in 2019. These changes are spatially concentrated among the isolated and sporadic permafrost zones, along the roads, and around the residential settlements. The frequent forest fires reported in this area could also explain the forest decline in the isolated areas far from roads and settlements. The post-2000 trends for forest expansion and grassland degradation correspond well with the implementation of the Natural Forest Conservation Program in 1998 for reducing wood production and preserving and expanding forest ecosystems.
From 1973 to 1986 the forest disturbance and grass regrowth are caused by deforestation for settlement development and cropland expansion. Starting with 1986 are observed changes caused by mining activities with an increasing number of quarries and lakes. A significant quarries expansion was noted during 2000–2019 when the area affected by quarries reached 19.61 km2. During this period, also the Yueya Lake drained completely. Thus, the mining activities are the main factor for permafrost degradation around the Yueya depression, where only small sporadic islands and patches of permafrost are still present. Permafrost is thawing fast, leading to changes in the landscape, increasing the risks of natural hazards, and threatening the water resources and ecosystems.
This study reveals the rapidly developing permafrost landscape and land use and cover changes in the Hola Basin and provides baseline information for sustainable development in this area. Further research should focus on better understanding the mechanisms of landscape changes, predicting the change trends, and establishing adaptive strategies. In particular, the mechanisms related to the hydrothermal and mechanical dynamics of the active layer, sub-permafrost and subaerial supra-permafrost taliks, and groundwater flow systems.

Supplementary Materials

The following are available online at https://0-www-mdpi-com.brum.beds.ac.uk/article/10.3390/rs13101910/s1. Figure S1: On-site survey photos taken during field observation from September 2019 at the Yueya Lake from the Hola Basin, Northeast China. (a) The large subsidence with remnant timber from underground galleries and with 30 to 40 cm wide cracks on the bottom of the drained Yueya Lake. (b) The small thermokarst lake near the drained Yueya Lake with a shrinking trend and active collapse of the lakeshore and retrogressive erosion of the thaw slump; Table S1: Variables used for LUCC classification. “x” marks the corresponding years when the variables were used.

Author Contributions

Conceptualization, R.-D.Ș., R.H. and H.J.; methodology, R.-D.Ș.; software, R.-D.Ș. and M.Ș.; validation, Y.L., X.L., X.W. and G.L.; formal analysis, M.Ș.; investigation, M.Ș.; resources, H.J.; data curation, M.Ș.; writing—original draft preparation, R.-D.Ș. and M.Ș.; writing—review and editing, all authors; visualization, M.Ș.; supervision, H.J.; funding acquisition, R.H. and H.J. All authors have read and agreed to the published version of the manuscript.

Funding

This research was funded by the National Nature Science Foundation of China (Grant Nos. 41871052 and U20A2082) and the State Key Laboratory of Frozen Soils Engineering Open Fund Project (SKLFSE201811).

Acknowledgments

Landsat data is the courtesy of the United States Geological Survey (https://earthexplorer.usgs.gov/, accessed on 12 March 2020) and ALOS DEM, of Alaska Satellite Facility (www.asf.alaska.edu/, accessed on 27 March 2020). We would like to acknowledge Qingbai Wu, Director of the State Key Laboratory of Frozen Soils Engineering, for his staunch support of our fieldwork over the years. We thank the anonymous reviewers for their insightful and constructive comments and suggestions.

Conflicts of Interest

The authors declare no conflict of interest.

Appendix A

The SVM principle is that the training samples, where the x are the input features, and y, the binary labels (presence and absence of a class), are linearly separable by a hyperplane [69]:
( w · x ) + b = 0
where w is the hyperplane normal, x is the input feature, ( · ) corresponds to the scalar product, and b represents the scalar base.
The SVM seeks to maximize the distance between the training vectors and the hyperplane and is illustrated as 2 w after the normalization [69]. Therefore, the maximum margin is obtained by:
min w , b 1 2 w 2
Rarely, the training vectors are linearly separable, thus a slack variable ξ i and a penalty term are inserted:
y i ( ( w · x i ) + b ) 1 ξ i , i = 1 , 2 , , n , ξ i 0
Therefore, the maximum margin equation is changed to:
min w , b 1 2 w 2 + i = 1 n ξ i
The non-linear classification is conducted using the same concept, but only by employing a kernel function that converts the input data into a high-dimensional feature space [33,69].

References

  1. Viana, C.M.; Oliveira, S.; Oliveira, S.C.; Rocha, J. Land use/land cover change detection and urban sprawl analysis. In Spatial Modeling in GIS and R for Earth and Environmental Sciences; Pourghasemi, H.R., Gokceoglu, C., Eds.; Elsevier: Amsterdam, The Netherlands, 2019; pp. 621–651. [Google Scholar]
  2. Gong, P.; Liu, H.; Zhang, M.; Li, C.; Wang, J.; Huang, H.; Clinton, N.; Ji, L.; Li, W.; Bai, Y.; et al. Stable classification with limited sample: Transferring a 30-m resolution sample set collected in 2015 to mapping 10-m resolution global land cover in 2017. Sci. Bull. 2019, 64, 370–373. [Google Scholar] [CrossRef] [Green Version]
  3. Miao, L.; Zhu, F.; Sun, Z.; Moore, J.; Cui, X. China’s land-use changes during the past 300 years: A historical perspective. Int. J. Environ. Res. Public Health 2016, 13, 847. [Google Scholar] [CrossRef] [PubMed] [Green Version]
  4. Zhou, X.; Chen, H. Impact of urbanization-related land use land cover changes and urban morphology changes on the urban heat island phenomenon. Sci. Total Environ. 2018, 635, 1467–1476. [Google Scholar] [CrossRef]
  5. Zhao, Z.H.; Ouyang, F.; Ge, F. Cropland expansion facilitated the outbreak of cereal aphids during 1951–2010 in China. Sci. Bull. 2015, 60, 1036–1037. [Google Scholar] [CrossRef] [Green Version]
  6. Li, X.Y.; Jin, H.J.; Wang, H.W.; Marchenko, S.S.; Shan, W.; Luo, D.-L.; He, R.X.; Spektor, V.; Huang, Y.D.; Li, X.Y.; et al. Influences of forest fires on the permafrost environment: A review. Adv. Clim. Chang. Res. 2021, 12, 48–65. [Google Scholar] [CrossRef]
  7. Liu, W.; Guo, Z.; Lu, F.; Wang, X.; Zhang, M.; Liu, B.; Wei, Y.; Cui, L.; Luo, Y.; Zhang, L.; et al. The influence of disturbance and conservation management on the greenhouse gas budgets of China’s forests. J. Clean. Prod. 2020, 261, 121000. [Google Scholar] [CrossRef]
  8. Mcguire, A.D.; Anderson, L.G.; Christensen, T.R.; Dallimore, S.; Guo, L.; Hayes, D.J.; Heimann, M.; Lorenson, T.D.; Macdonald, R.W.; Roulet, N. Sensitivity of the carbon cycle in the Arctic to climate change. Ecol. Monogr. 2014, 79, 523–555. [Google Scholar] [CrossRef] [Green Version]
  9. Coulter, L.L.; Stow, D.A.; Tsai, Y.H.; Ibanez, N.; Shih, H.C.; Kerr, A.; Benza, M.; Weeks, J.R.; Mensah, F. Classification and assessment of land cover and land use change in southern Ghana using dense stacks of Landsat 7 ETM+ imagery. Remote Sens. Environ. 2016, 184, 396–409. [Google Scholar] [CrossRef]
  10. Mishra, P.K.; Rai, A.; Rai, S.C. Land use and land cover change detection using geospatial techniques in the Sikkim Himalaya, India. Egypt. J. Remote Sens. Sp. Sci. 2020, 23, 133–143. [Google Scholar] [CrossRef]
  11. Kuang, W.; Du, G.; Lu, D.; Dou, Y.; Li, X.; Zhang, S.; Chi, W.; Dong, J.; Chen, G.; Yin, Z.; et al. Global observation of urban expansion and land-cover dynamics using satellite big-data. Sci. Bull. 2020, 66, 297–300. [Google Scholar] [CrossRef]
  12. Zhang, C.; Smith, M.; Lv, J.; Fang, C. Applying time series Landsat data for vegetation change analysis in the Florida Everglades Water Conservation Area 2A during 1996–2016. Int. J. Appl. Earth Obs. Geoinf. 2017, 57, 214–223. [Google Scholar] [CrossRef]
  13. Pei, J.; Wang, L.; Wang, X.; Niu, Z.; Kelly, M.; Song, X.-P.; Huang, N.; Geng, J.; Tian, H.; Yu, Y.; et al. Time series of Landsat imagery shows vegetation recovery in two fragile karst watersheds in southwest China from 1988 to 2016. Remote Sens. 2019, 11, 2044. [Google Scholar] [CrossRef] [Green Version]
  14. Gong, P.; Li, X.; Zhang, W. 40-Year (1978–2017) human settlement changes in China reflected by impervious surfaces from satellite remote sensing. Sci. Bull. 2019, 64, 756–763. [Google Scholar] [CrossRef] [Green Version]
  15. Hussain, M.; Chen, D.; Cheng, A.; Wei, H.; Stanley, D. Change detection from remotely sensed images: From pixel-based to object-based approaches. ISPRS J. Photogramm. Remote Sens. 2013, 80, 91–106. [Google Scholar] [CrossRef]
  16. Healey, S.P.; Yang, Z.; Cohen, W.B.; Pierce, D.J. Application of two regression-based methods to estimate the effects of partial harvest on forest structure using Landsat data. Remote Sens. Environ. 2006, 101, 115–126. [Google Scholar] [CrossRef]
  17. Zhu, Z.; Woodcock, C.E.; Olofsson, P. Continuous monitoring of forest disturbance using all available Landsat imagery. Remote Sens. Environ. 2012, 122, 75–91. [Google Scholar] [CrossRef]
  18. Hossain, M.D.; Chen, D. Segmentation for Object-Based Image Analysis (OBIA): A review of algorithms and challenges from remote sensing perspective. ISPRS J. Photogramm. Remote Sens. 2019, 150, 115–134. [Google Scholar] [CrossRef]
  19. Myint, S.W.; Gober, P.; Brazel, A.; Grossman-Clarke, S.; Weng, Q. Per-pixel vs. object-based classification of urban land cover extraction using high spatial resolution imagery. Remote Sens. Environ. 2011, 115, 1145–1161. [Google Scholar] [CrossRef]
  20. Johnson, B.A.; Ma, L. Image segmentation and object-based image analysis for environmental monitoring: Recent areas of interest, researchers’ views on the future priorities. Remote Sens. 2020, 12, 1772. [Google Scholar] [CrossRef]
  21. Shao, Y.; Lunetta, R.S. Comparison of support vector machine, neural network, and CART algorithms for the land-cover classification using limited training data points. ISPRS J. Photogramm. Remote Sens. 2012, 70, 78–87. [Google Scholar] [CrossRef]
  22. Song, X.; Duan, Z.; Jiang, X. Comparison of artificial neural networks and support vector machine classifiers for land cover classification in Northern China using a SPOT-5 HRG image. Int. J. Remote Sens. 2012, 33, 3301–3320. [Google Scholar] [CrossRef]
  23. Thanh Noi, P.; Kappas, M. Comparison of Random Forest, k-Nearest Neighbor, and Support Vector Machine classifiers for land cover classification using Sentinel-2 imagery. Sensors 2017, 18, 18. [Google Scholar] [CrossRef] [Green Version]
  24. Deluigi, N.; Lambiel, C. PERMAL: A machine learning approach for alpine permafrost distribution modeling. In Mattertal—Ein Tal in Bewegung. Jahrestagung der Schweizerischen Geomorphologischen Gesellschaft; Graf, C., Ed.; Eidg. Forschungsanstalt WSL: St. Niklaus, Switzerland, 2012; Volume 4, pp. 47–62. [Google Scholar]
  25. Räsänen, A.; Elsakov, V.; Virtanen, T. Usability of one-class classification in mapping and detecting changes in bare peat surfaces in the tundra. Int. J. Remote Sens. 2019, 40, 4083–4103. [Google Scholar] [CrossRef] [Green Version]
  26. Wei, Z.; Jin, H.J.; Zhang, J.M.; Yu, S.P.; Han, X.J.; Ji, Y.J.; He, R.X.; Chang, X.L. Prediction of permafrost changes in Northeastern China under a changing climate. Sci. China Earth Sci. 2011, 54, 924–935. [Google Scholar] [CrossRef]
  27. Wang, J.; Xie, Y.; Wang, X.; Guo, K. Driving factors of recent vegetation changes in Hexi Region, Northwest China based on a new classification framework. Remote Sens. 2020, 12, 1758. [Google Scholar] [CrossRef]
  28. Zhang, Y.; Liang, S.; Sun, G. Forest biomass mapping of northeastern China using GLAS and MODIS data. IEEE J. Sel. Top. Appl. Earth Obs. Remote Sens. 2014, 7, 140–152. [Google Scholar] [CrossRef]
  29. Gao, S.H.; He, R.X.; Jin, H.J.; Huang, Y.D.; Zhang, J.M.; Luo, D.L. Thermal recovery process of a backfilled open-pit in permafrost area at the Gulian strip coal mine in Northeast China. J. Mt. Sci. 2017, 14, 2212–2229. [Google Scholar] [CrossRef]
  30. Li, X.Y.; Jin, H.J.; Sun, L.; Wang, H.; Huang, Y.; He, R.; Chang, X.; Yu, S.; Zang, S. Map of permafrost distribution based on TTOP modelling for 1961–2019 in Northeast China. Permafr. Periglac. Process. 2021. in review. [Google Scholar]
  31. Obu, J.; Westermann, S.; Bartsch, A.; Berdnikov, N.; Christiansen, H.H.; Dashtseren, A.; Delaloye, R.; Elberling, B.; Etzelmüller, B.; Kholodov, A.; et al. Northern Hemisphere permafrost map based on TTOP modelling for 2000–2016 at 1 km2 scale. Earth-Sci. Rev. 2019, 193, 299–316. [Google Scholar] [CrossRef]
  32. Zhu, Z.; Woodcock, C.E. Object-based cloud and cloud shadow detection in Landsat imagery. Remote Sens. Environ. 2012, 118, 83–94. [Google Scholar] [CrossRef]
  33. Vapnik, V. Statistical Learning Theory; Wiley: New York, NY, USA, 1998. [Google Scholar]
  34. Pal, M.; Foody, G.M. Evaluation of SVM, RVM and SMLR for accurate image classification with limited ground data. IEEE J. Sel. Top. Appl. Earth Obs. Remote Sens. 2012, 5, 1344–1355. [Google Scholar] [CrossRef]
  35. Rouse, J.W.; Haas, R.H.; Schell, J.A.; Deeering, D. Monitoring vegetation systems in the Great Plains with ERTS (Earth Resources Technology Satellite). In Proceedings of the Third Earth Resources Technology Satellite-1 Symposium, Washington, DC, USA, 10–14 December 1973; pp. 309–317. [Google Scholar]
  36. McFeeters, S.K. The use of the Normalized Difference Water Index (NDWI) in the delineation of open water features. Int. J. Remote Sens. 1996, 17, 1425–1432. [Google Scholar] [CrossRef]
  37. Rondeaux, G.; Steven, M.; Baret, F. Optimization of soil-adjusted vegetation indices. Remote Sens. Environ. 1996, 55, 95–107. [Google Scholar] [CrossRef]
  38. Wilson, E.H.; Sader, S.A. Detection of forest harvest type using multiple dates of Landsat TM imagery. Remote Sens. Environ. 2002, 80, 385–396. [Google Scholar] [CrossRef]
  39. Zha, Y.; Gao, J.; Ni, S. Use of normalized difference built-up index in automatically mapping urban areas from TM imagery. Int. J. Remote Sens. 2003, 24, 583–594. [Google Scholar] [CrossRef]
  40. García, M.J.L.; Caselles, V. Mapping burns and natural reforestation using thematic mapper data. Geocarto Int. 1991, 6, 31–37. [Google Scholar] [CrossRef]
  41. Xu, H. Modification of normalised difference water index (NDWI) to enhance open water features in remotely sensed imagery. Int. J. Remote Sens. 2006, 27, 3025–3033. [Google Scholar] [CrossRef]
  42. Huete, A.; Didan, K.; Miura, T.; Rodriguez, E.; Gao, X.; Ferreira, L. Overview of the radiometric and biophysical performance of the MODIS vegetation indices. Remote Sens. Environ. 2002, 83, 195–213. [Google Scholar] [CrossRef]
  43. Zhang, C.; Ju, W.; Chen, J.M.; Wang, X.; Yang, L.; Zheng, G. Disturbance-induced reduction of biomass carbon sinks of China’s forests in recent years. Environ. Res. Lett. 2015, 10, 114021. [Google Scholar] [CrossRef]
  44. Jin, H.J.; Yu, Q.H.; Lü, L.Z.; Guo, D.G.; He, R.X.; Yu, S.P.; Sun, G.G.; Li, Y.G. Degradation of permafrost in the Xing’anling Mountains, northeastern China. Permafr. Periglac. Process. 2007, 18, 245–258. [Google Scholar] [CrossRef]
  45. Shu, Z.; Di, X.; Huang, H. Effects to forest fire occurrence of climate change in Ta He Forestry Bureau in Great Xing’an Mountain. Adv. Mater. Res. 2011, 183–185, 135–139. [Google Scholar] [CrossRef]
  46. Li, X.Y.; Jin, H.J.; He, R.X.; Huang, Y.D.; Wang, H.G.; Luo, D.L.; Jin, X.Y.; Lü, L.Z.; Wang, L.H.; Li, W.; et al. Effects of forest fires on the permafrost environment in the northern Da Xing’anling (Hinggan) mountains, Northeast China. Permafr. Periglac. Process. 2019, 30, 163–177. [Google Scholar] [CrossRef]
  47. Holloway, J.E.; Lewkowicz, A.G.; Douglas, T.A.; Li, X.; Turetsky, M.R.; Baltzer, J.L.; Jin, H. Impact of wildfire on permafrost landscapes: A review of recent advances and future prospects. Permafr. Periglac. Process. 2020, 31, 371–382. [Google Scholar] [CrossRef]
  48. Gibson, C.M.; Chasmer, L.E.; Thompson, D.K.; Quinton, W.L.; Flannigan, M.D.; Olefeldt, D. Wildfire as a major driver of recent permafrost thaw in boreal peatlands. Nat. Commun. 2018, 9, 3041. [Google Scholar] [CrossRef] [Green Version]
  49. Zhang, Y.; Liang, S. Changes in forest biomass and linkage to climate and forest disturbances over Northeastern China. Glob. Chang. Biol. 2014, 20, 2596–2606. [Google Scholar] [CrossRef] [PubMed]
  50. Xu, B.; Yang, X.C.; Tao, W.G.; Miao, J.M.; Yang, Z.; Liu, H.Q.; Jin, Y.X.; Zhu, X.H.; Qin, Z.H.; Lv, H.Y.; et al. MODIS-based remote-sensing monitoring of the spatiotemporal patterns of China’s grassland vegetation growth. Int. J. Remote Sens. 2013, 34, 3867–3878. [Google Scholar] [CrossRef]
  51. He, Y.; Lee, E.; Warner, T.A. A time series of annual land use and land cover maps of China from 1982 to 2013 generated using AVHRR GIMMS NDVI3g data. Remote Sens. Environ. 2017, 199, 201–217. [Google Scholar] [CrossRef]
  52. Yang, S.Z.; Jin, H.J.; Yu, S.P.; Chen, Y.C.; Hao, J.Q.; Zhai, Z.Y. Environmental hazards and contingency plans along the proposed China-Russia oil pipeline route, Northeastern China. Cold Reg. Sci. Technol. 2010, 64, 271–278. [Google Scholar] [CrossRef]
  53. Șerban, R.-D.; Jin, H.J.; Șerban, M.; Luo, D.L. Shrinking thermokarst lakes and ponds on the northeastern Qinghai-Tibet Plateau, over the last three decades. Permafr. Periglac. Process. 2021, accepted. [Google Scholar]
  54. Zhang, Y.; Liang, S.; Xiao, Z. Observed vegetation greening and its relationships with cropland changes and climate in China. Land 2020, 9, 274. [Google Scholar] [CrossRef]
  55. Mao, Y.; Li, G.; Ma, W.; Mu, Y.; Wang, F.; Miao, J.; Wu, D. Field observation of permafrost degradation under Mo’he airport, Northeastern China from 2007 to 2016. Cold Reg. Sci. Technol. 2019, 161, 43–50. [Google Scholar] [CrossRef]
  56. Zhang, X.; Liu, X.; Wang, W.; Zhang, T.; Zeng, X.; Xu, G.; Wu, G.; Kang, H. Spatiotemporal variability of drought in the northern part of northeast China. Hydrol. Process. 2018, 32, 1449–1460. [Google Scholar] [CrossRef]
  57. Cheţan, M.-A.; Dornik, A.; Ardelean, F.; Georgievski, G.; Hagemann, S.; Romanovsky, V.E.; Onaca, A.; Drozdov, D.S. 35 years of vegetation and lake dynamics in the Pechora Catchment, Russian European Arctic. Remote Sens. 2020, 12, 1863. [Google Scholar] [CrossRef]
  58. Li, G.Y.; Wang, F.; Ma, W.; Fortier, R.; Mu, Y.; Zhou, Z.; Mao, Y.; Cai, Y. Field observations of cooling performance of thermosyphons on permafrost under the China-Russia Crude Oil Pipeline. Appl. Therm. Eng. 2018, 141, 688–696. [Google Scholar] [CrossRef]
  59. Wang, F.; Li, G.Y.; Ma, W.; Wu, Q.; Șerban, M.; Vera, S.; Alexandr, F.; Jiang, N.; Wang, B. Pipeline–permafrost interaction monitoring system along the China–Russia crude oil pipeline. Eng. Geol. 2019, 254, 113–125. [Google Scholar] [CrossRef]
  60. Șerban, M.; Li, G.; Șerban, R.-D.; Wang, F.; Fedorov, A.; Vera, S.; Cao, Y.; Chen, P.; Wang, W. Characteristics of the active-layer under the China-Russia crude oil pipeline. J. Mt. Sci. 2021, 18, 323–337. [Google Scholar] [CrossRef]
  61. Jin, X.Y.; Jin, H.J.; Wu, X.D.; Luo, D.L.; Yu, S.; Li, X.; He, R.; Wang, Q.F.; Knops, J.M.H. Permafrost degradation leads to biomass and species richness decreases on the Northeastern Qinghai-Tibet Plateau. Plants 2020, 9, 1453. [Google Scholar] [CrossRef] [PubMed]
  62. Cheng, G.D.; Jin, H.J. Permafrost and groundwater on the Qinghai-Tibet Plateau and in northeast China. Hydrogeol. J. 2013, 21, 5–23. [Google Scholar] [CrossRef]
  63. Jin, X.Y.; Jin, H.J.; Iwahana, G.; Marchenko, S.S.; Luo, D.L.; Li, X.Y.; Liang, S. Impacts of climate-induced permafrost degradation on vegetation: A review. Adv. Clim. Chang. Res. 2021, 12, 29–47. [Google Scholar] [CrossRef]
  64. He, R.X.; Jin, H.J.; Yang, S.Q.; Huang, Y.D.; Zhang, Z.; Li, X.Y.; Li, Y. Monitoring of hydrothermal dynamics of rapidly degrading permafrost under and around the Yueya (Crescent) Lake near Mo’he, northern Heilongjiang Province, Northeast China. Eng. Geol. 2021, submitted. [Google Scholar]
  65. Kumpula, T.; Forbes, B.C.; Stammler, F.; Meschtyb, N. Dynamics of a coupled system: Multi-resolution remote sensing in assessing social-ecological responses during 25 years of gas field development in Arctic Russia. Remote Sens. 2012, 4, 1046–1068. [Google Scholar] [CrossRef] [Green Version]
  66. Ardelean, F.; Onaca, A.; Chețan, M.-A.; Dornik, A.; Georgievski, G.; Hagemann, S.; Timofte, F.; Berzescu, O. Assessment of spatio-temporal landscape changes from VHR images in three different permafrost areas in the Western Russian Arctic. Remote Sens. 2020, 12, 3999. [Google Scholar] [CrossRef]
  67. Raynolds, M.K.; Walker, D.A.; Ambrosius, K.J.; Brown, J.; Everett, K.R.; Kanevskiy, M.; Kofinas, G.P.; Romanovsky, V.E.; Shur, Y.; Webber, P.J. Cumulative geoecological effects of 62 years of infrastructure and climate change in ice-rich permafrost landscapes, Prudhoe Bay Oilfield, Alaska. Glob. Chang. Biol. 2014, 20, 1211–1224. [Google Scholar] [CrossRef] [PubMed]
  68. Myers-Smith, I.H.; Forbes, B.C.; Wilmking, M.; Hallinger, M.; Lantz, T.; Blok, D.; Tape, K.D.; Macias-Fauria, M.; Sass-Klaassen, U.; Lévesque, E.; et al. Shrub expansion in tundra ecosystems: Dynamics, impacts and research priorities. Environ. Res. Lett. 2011, 6, 045509. [Google Scholar] [CrossRef] [Green Version]
  69. Deluigi, N.; Lambiel, C.; Kanevski, M. Data-driven mapping of the potential mountain permafrost distribution. Sci. Total Environ. 2017, 590–591, 370–380. [Google Scholar] [CrossRef] [PubMed] [Green Version]
Figure 1. (a) Study area location in Northeast China. Permafrost distribution after Obu et al. [31]. (b) Landsat 8 OLI image (band combination red-green-blue) from 1 August 2019 for the Hola Basin.
Remotesensing 13 01910 g001
Figure 2. Examples of Landsat composites (left side, band combination: near-infrared-red-green for 1973 and red-green-blue for other years) and the land cover classes (right side) for the Hola Basin, Northeast China, in (a) 1973, (b) 1986, (c) 2000, and (d) 2019. The black box marks the location of the Yueya Lake and the Gulian’he coal mine.
Remotesensing 13 01910 g002
Figure 3. (a) The overall area (km2) of classes forest, grass, and anthropic in the Hola Basin, Northeast China, in 1973, 1986, 2000, and 2019; (b) the net change of classes area in km2, and (c) the net change of classes area in %.
Remotesensing 13 01910 g003
Figure 4. Change maps for the period 1973–2019 in the Hola Basin, Northeast China, for (a) forest cover, (b) grass cover, and (c) anthropic development. I to III are insets of a zoomed view of the Yueya Lake and the Gulian’he coal mine.
Remotesensing 13 01910 g004
Figure 5. (a) The overall area (km2) of isolated, sporadic, and discontinuous permafrost in the Hola Basin, Northeast China, after Obu et al. [31]; (b) the net change of classes area in km2 for the period 2000–2019, and (c) the net change of classes area in %.
Remotesensing 13 01910 g005
Figure 6. LUCC around the Yueya Lake and the Gulian’he coal mine for the years: (a) 1973, (b) 1986, (c) 2000, and (d) 2019.
Remotesensing 13 01910 g006
Figure 7. Comparison of the lakes and quarries around the Yueya Lake and the Gulian’he coal mine for 1973, 1986, 2000, and 2019: (a) frequency and (b) surface area.
Remotesensing 13 01910 g007
Table 1. Technical details of the satellite images for the Hola Basin, Northeast China.
Acquisition DateSatellite Mission and SensorProcessing LevelPixel Size (m)Cloud CoverQualityRMSE
21 November 1973Landsat 1–5 MSSL1TP_T26022527.7
6 August 1986Landsat 4–5 TML1TP_T130375.7
20 August 2000Landsat 7 ETM+L1TP_T130493.4
1 August 2019Landsat 8 OLI_TIRSL1TP_T1301497.3
Table 2. Accuracy indices for classified images for the Hola Basin, Northeast China. Presented are overall accuracy (OA), kappa coefficient (K), user’s and producer’s accuracy for the classes anthropic, forest, grass, and water. All values are represented in percentage, except for kappa values, which range between 0 and 1.
YearOAKUser’s Accuracy (UA)Producer’s Accuracy (PA)
AnthropicForestGrassWaterAnthropicForestGrassWater
197380.000.7372.7383.3377.4288.2464.00100.0096.0060.00
198696.910.96100.0092.8696.00100.00100.00100.0096.0090.48
200090.090.8696.2685.4884.0791.0989.5595.5085.5990.20
201997.100.96100.0094.7494.44100.0094.44100.00100.0093.75
Publisher’s Note: MDPI stays neutral with regard to jurisdictional claims in published maps and institutional affiliations.

