
An Improved R-Index Model for Terrain Visibility Analysis for Landslide Monitoring with InSAR
by
 ,
,
Tianhe Ren
1 ,
,
Wenping Gong
1,*, 
Victor Mwango Bowa
1,
Huiming Tang
1,
Jun Chen
2,3 and
Fumeng Zhao
1 1
Faculty of Engineering, China University of Geosciences, Wuhan 430074, China
2
School of Automation, China University of Geosciences, Wuhan 430074, China
3
Hubei Key Laboratory of Advanced Control and Intelligent Automation for Complex Systems, Wuhan 430074, China
*
Author to whom correspondence should be addressed.
Remote Sens. 2021, 13(10), 1938; https://0-doi-org.brum.beds.ac.uk/10.3390/rs13101938
Submission received: 23 March 2021
/
Revised: 26 April 2021
/
Accepted: 12 May 2021
/
Published: 16 May 2021
(This article belongs to the Section Remote Sensing in Geology, Geomorphology and Hydrology)
Abstract
:The interferometric synthetic aperture radar (InSAR) technique is widely adopted for detecting and monitoring landslides, but its effectiveness is often degraded in mountainous terrains, due to geometric distortions in the synthetic aperture radar (SAR) image input. To evaluate the terrain effect on the applicability of InSAR in landslide monitoring, a variety of visibility evaluation models have been developed, among which the R-index models are quite popular. In consideration of the poor performance of the existing R-index models in the passive layover region, this study presents an improved R-index model, in which a coefficient for improving the visibility evaluation in the far passive layover regions is incorporated. To demonstrate the applicability of the improved R-index model, the terrain visibility of SAR images in Fengjie, a county in the Three Gorges Reservoirs region, China, is studied. The effectiveness of the improved R-index model is demonstrated through comparing the visibility evaluation results with those obtained from the existing R-index models and P-NG method. Further, the effects of the line-of-sight (LOS) parameters of SAR images and the resolution of the digital elevation model (DEM) on the terrain visibility are discussed.
1. Introduction
Landslides are one of the most destructive and recurrent geohazards around the world, causing huge economic losses and casualties every year [1]. The catastrophic Mud Creek landslide, occurred on May 20, 2017 along the rugged coast of Big Sur, California, USA, destroyed over 400 m of scenic California State Highway 1 [2]. The Baige landslide, which took place on October 10, 2018 at the border between Sichuan Province and the Tibet Autonomous Region in China, blocked the Jinsha River, with a direct economic loss of 6.8 billion RMB [3]. The Jichang landslide, occurred on July 23, 2019 in Shuicheng County (Guizhou Province, China), buried 27 buildings, with 42 fatalities and nine people missing [4]. Hence, the effective detection and monitoring of landslides plays a vital role in the risk reduction in the mountainous region.
Landslide activity, in most cases, can be assessed by detecting and monitoring the deformations on the ground surface. The traditional means to measure landslide deformations include geomorphologic evidences and in-situ observation tools [5,6,7,8]. Field investigations and in-situ observations with total stations, inclinometers, extensometers, and global positioning systems (GPS) have high accuracy but can only acquire data from discrete ground points. Thus, these traditional means are not very suitable for landslide monitoring in large areas. Optical remote sensing allows rapid large-area monitoring of landslide deformations through interpretation of ground surface features [9]. However, the quality of the input optical images can be highly dependent upon the external conditions (e.g., light, weather, and atmosphere); and, this technique can hardly detect the subtle deformation of slow-moving landslides. The interferometric synthetic aperture radar (InSAR) technique can address the aforementioned limitations, and could be adopted for the landslide monitoring in a large area while detecting subtle ground deformations with high precision [10].
Over the past two decades, the InSAR technique, particularly the time series InSAR, has been successfully applied to a range of landslide monitoring and behavior analysis studies [11,12]. The previous analyses illustrate that the InSAR technology not only can help define the boundaries of landslides, but also has the capability of monitoring the cumulative deformations of landslides over a long time period [13,14,15,16]. On the basis of the time series of the displacement monitored with InSAR, the correlations between the landslide displacement and the triggering factors (e.g., rainfall intensity, reservoir water level, and earthquake magnitude) have been further studied [17,18,19].
Note that although the technique of InSAR has been extensively adopted for detecting and monitoring landslides, its effectiveness can be degraded in mountainous terrains, due to geometric distortions in the synthetic aperture radar (SAR) image input [20]. According to the engineering practices in the Three Gorges Reservoirs region in China, where frequent landslides have been reported over the past two decades [1], lots of the reported landslides are located in the geometric distortion areas of SAR images and the direction application of the InSAR technology to the monitoring of these landslides would be problematic. To avoid this problem, SAR images with good visibility are usually selected, according to the location of the monitoring area, in the landslide monitoring. To this end, a variety of terrain visibility evaluation models, which can help identify the geometric distortions in the SAR image, have been advanced [21,22,23,24,25,26,27,28].
Among the various visibility evaluation models, the R-index model proposed by Notti et al. is relatively popular [22]. The R-index, which is calculated based on the cosine of the angle between the local terrain surface and the radar beam, has been successfully adopted to evaluate the impact of the local terrain on the visibility of SAR images at a series sites [24,26,29,30]. It must be noted that the cosine value of this local angle could only represent the geometric relationship between the local terrain and the SAR satellite; whereas, the influence from the adjacent terrain, such as layover and shadow, cannot be included, as detailed in Cigna et al. [26]. Thus, the R-index model could not be sufficient to identify all geometric distortions [24,26,31]. In such a situation, a modified R-index model was later developed in Cigna et al. [26] and Notti et al. [27], in which the layover and shadow coefficients are incorporated. However, the far passive layover phenomenon in the layover regions of SAR images may not be identified with the modified R-index model [26,31]. To address this limitation of the modified R-index model, a coefficient, which is based on the formation mechanism of the far passive layover phenomenon, is established in this study for recognizing the far passive layover regions of SAR images, and then an improved R-index model is developed through incorporating this coefficient into the existing R-index models (in terms of the original and modified R-index models).
The rest of this paper is organized as follows. First, the formulation of the improved R-index model is presented. Second, the terrain visibility of SAR images in Fengjie, a county in the Three Gorges Reservoirs region, China where 1550 landslides have been identified, is studied, and comparative analyses are conducted to depict the effectiveness of the improved R-index model. Third, the effects of the line-of-sight (LOS) parameters (i.e., incidence angle and azimuth) of SAR images and the resolution of the digital elevation model (DEM) on the terrain visibility are discussed. Finally, the concluding remarks are provided.
2. Formulation of the Improved R-Index Model
In this section, the geometric distortions in the SAR images and the formulation of the existing R-index models are briefly introduced; then, the formulation of the improved R-index model, along with that of the new coefficient for identifying the far passive layover regions of SAR images, is presented.
2.1. The Geometric Distortions in SAR Images
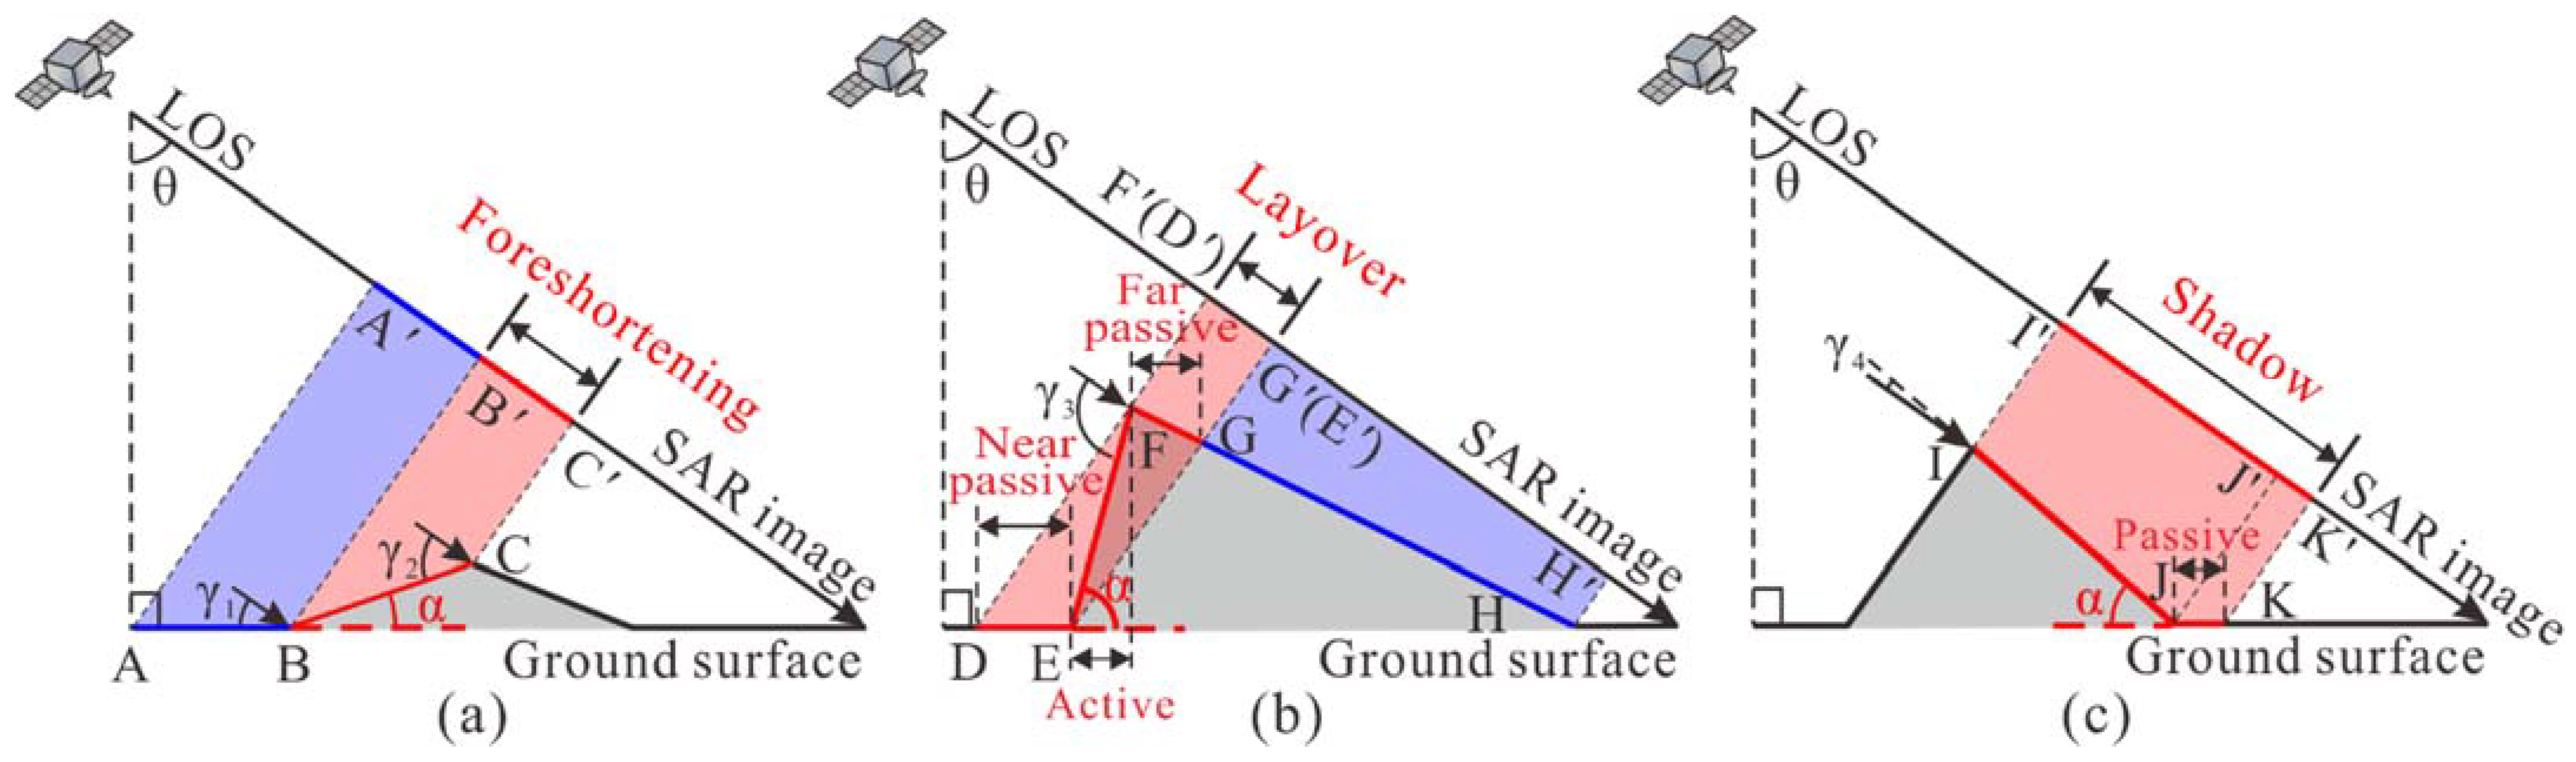
Side-view imaging is often adopted to generate SAR images and the visibility of the topographic surface to the SAR satellite sensor relies upon the acquisition direction of the adopted satellite radar with respect to the imaged terrain [20,31,32]. According to the geometric relationship between the orientation parameters of the satellite LOS (in terms of incidence angle and azimuth) and the characteristics of the local terrain (in terms of slope and aspect), three types of geometric distortions can be induced in the SAR images, as shown in Figure 1.
In the coverage area of the satellite SAR, the signals reflected from the flat terrain are received by the radar and the topographic lengths are mapped in the SAR images according to the cosine value of the angle (γ1) between the LOS of the satellite radar (A’B’) and the terrain (AB) (see Figure 1a). For a slope dipping towards the satellite radar, when the slope angle of the terrain (α) is smaller than the incidence angle of the satellite LOS (θ) (i.e., 0 < α < θ), the cosine of the angle (γ1) between the LOS of the radar (B’C’) and the terrain (BC) decreases with the terrain slope (α). Compared to the flat area (AB), the mapped length (B’C’) of the slope area (BC) in the SAR image is compressed (see Figure 1a), this phenomenon is called foreshortening. Whereas, when the terrain slope (α) is greater than the incidence angle of the satellite LOS (θ) (i.e., α > θ), the signals reflected from the top of the slope (e.g., point F) are received earlier (by the radar) than those reflected from the bottom of the slope (e.g., point E), as shown in Figure 1b. Thus, the top of the slope is mapped earlier in the SAR image than the bottom of the slope, this phenomenon is active layover. Due to the influence of the active layover (EF), the adjacent areas (DE and FG), which cannot be normally imaged in the SAR image [28,32], are known as the passive layover regions. According to the distance measured from the region to the satellite, the near-satellite area (DE) is defined as the near passive layover region and the far-satellite area (FG) is defined as the far passive layover region (see Figure 1b). For a slope dipping away from the satellite, when the slope angle of the terrain (α) is greater than the complementary angle of the incidence angle of the satellite LOS (90° − θ) (i.e., 90° − θ < α), this slope cannot be reached by the radar beam, and as a result the region (IJ) cannot be mapped in the SAR image (see Figure 1c), this phenomenon is active shadow. The area (JK) that is located at the end of this steep slope (IJ), which cannot be normally imaged in the SAR image, is known as the passive shadow region (see Figure 1c).
The latter two kinds of geometric distortion regions (i.e., layover and shadow regions) in the SAR images are the areas with poor visibility; and, the ground points in the layover and shadow regions cannot be detected and monitored by the time series InSAR technique such as the persistent scatterer interferometry (PSI) technique and the small-baseline subset (SBAS) technique [27,33]. On the other hand, a few image pixels with bright reflectivity, in the foreshortening regions in the SAR image, can be detected and monitored by the time series InSAR technique [20]. As such, the visibility of the foreshortening regions is medium and the monitored ground deformation might be inaccurate.
2.2. The R-Index Model and Its Potential Limitation
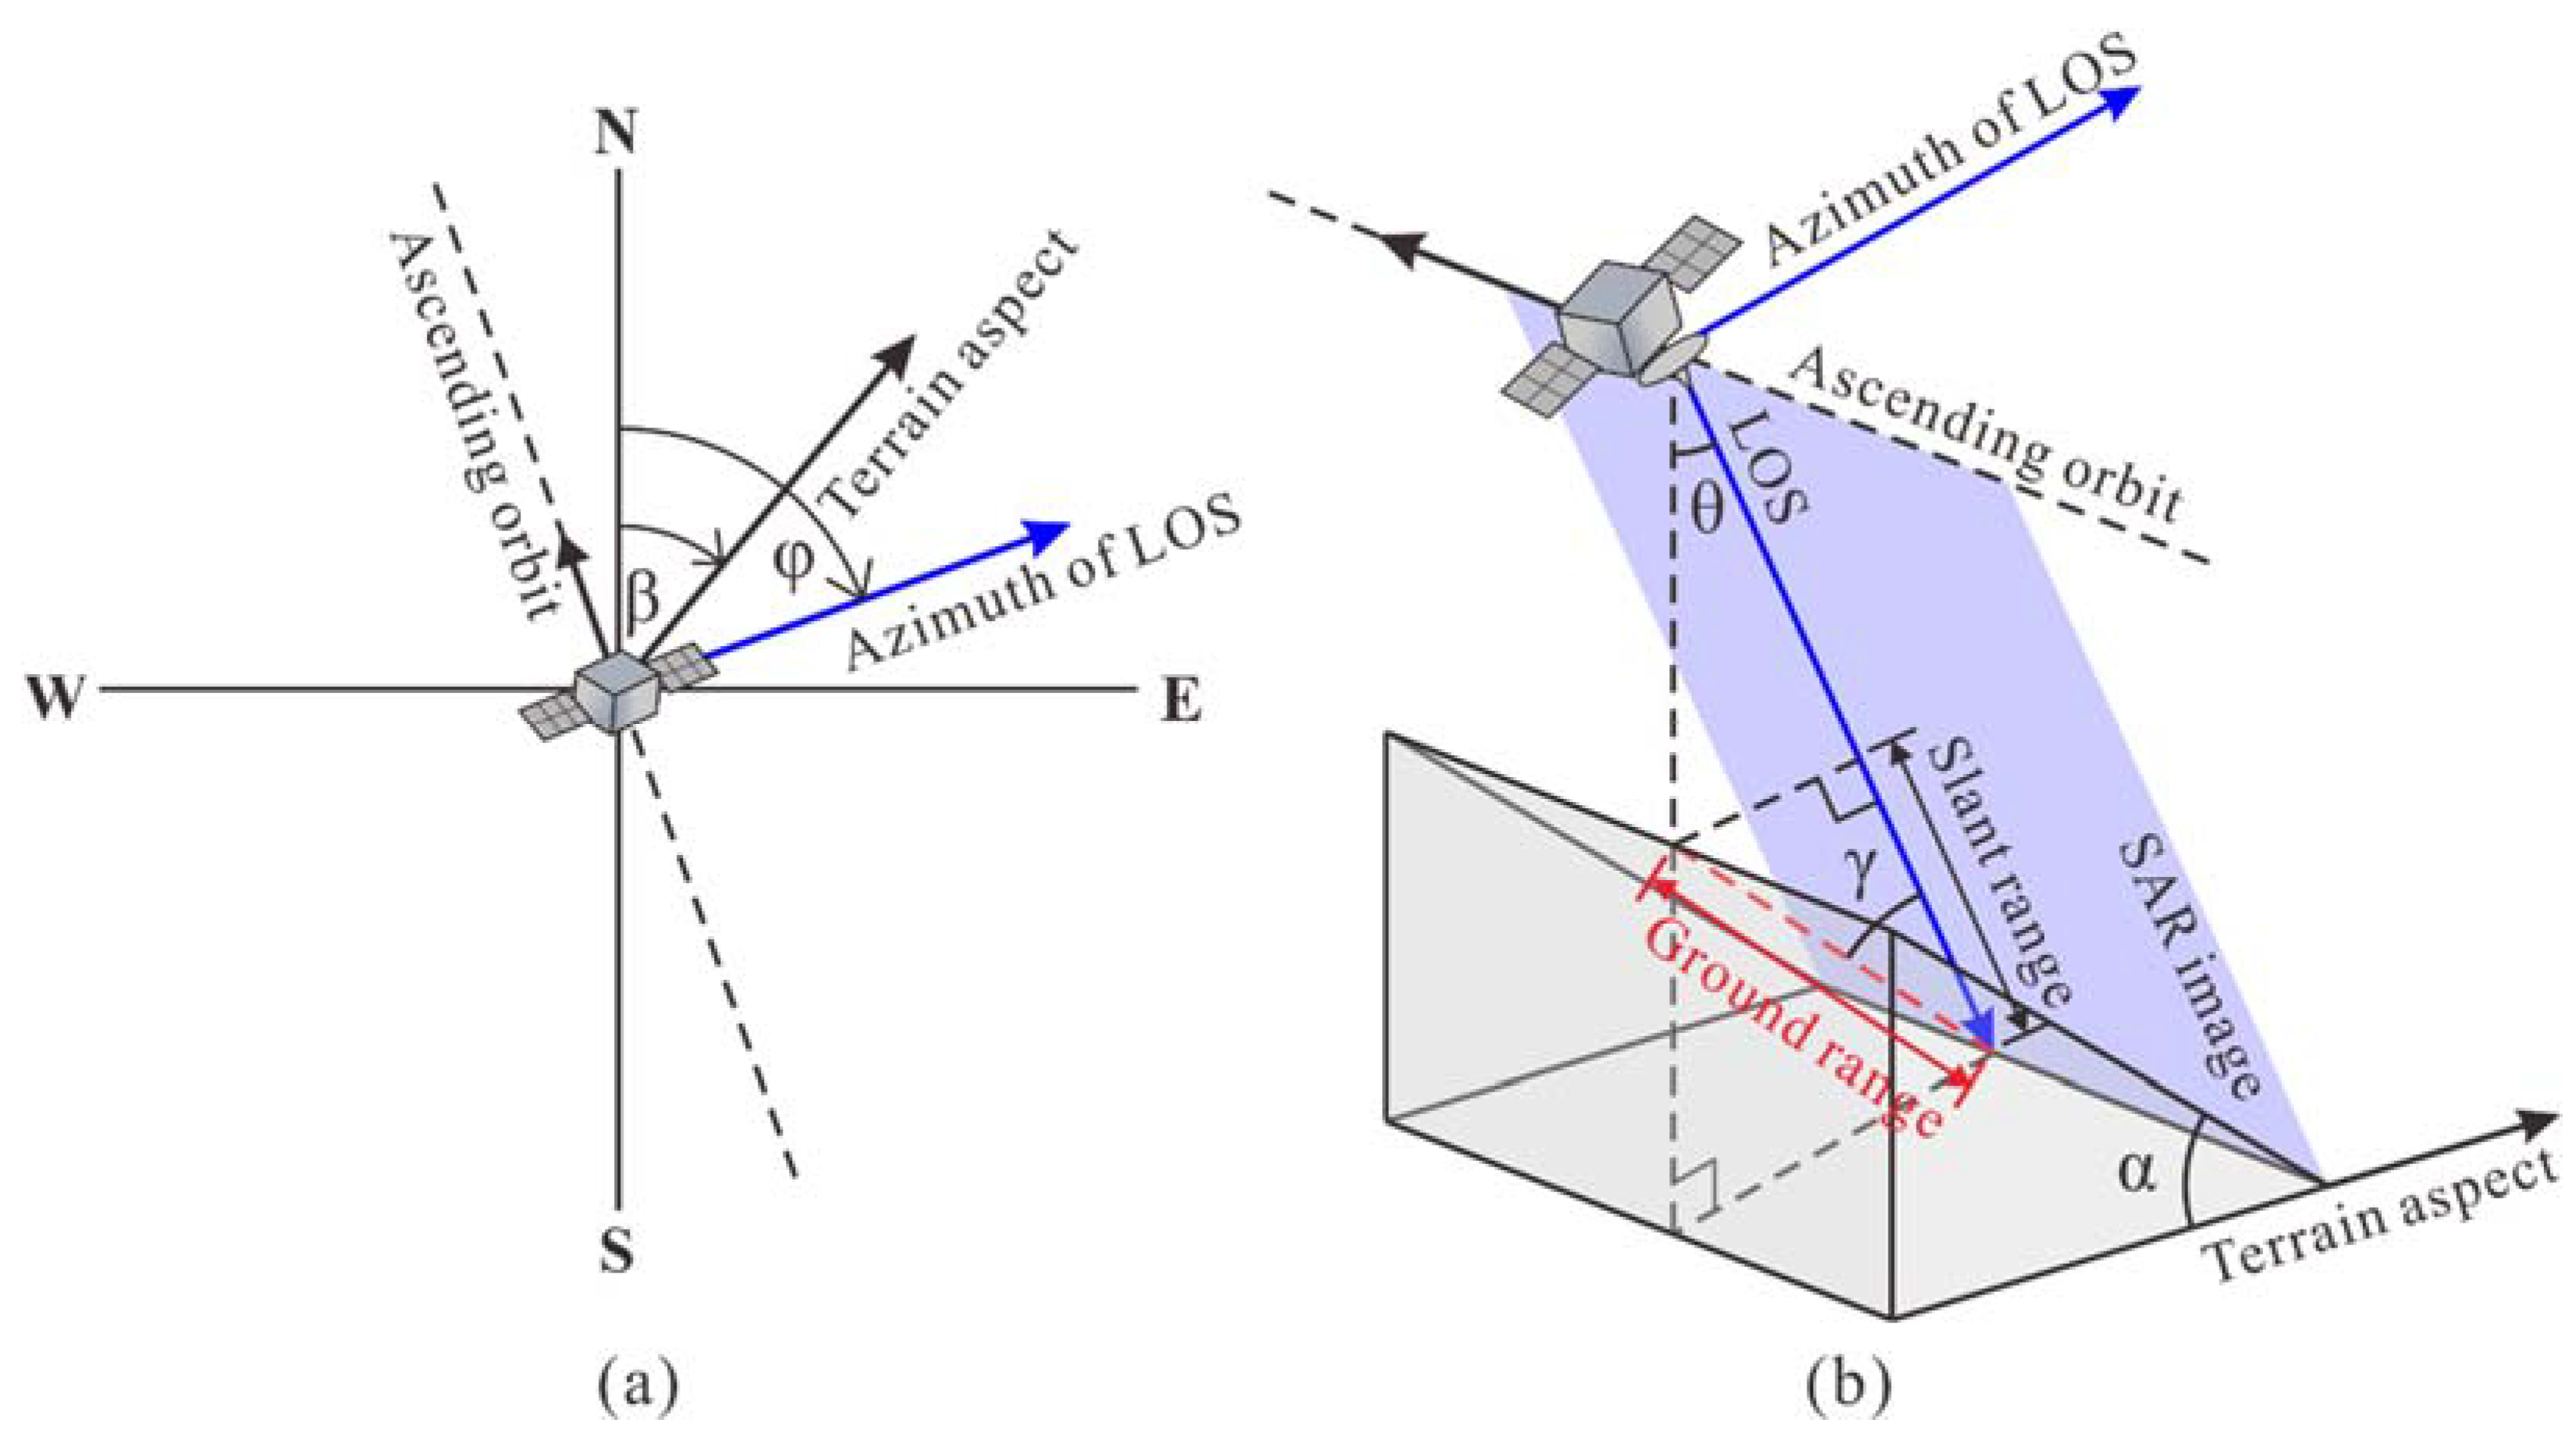
The R-index model, which can capture the ratio of the slant range (i.e., the pixel size in the SAR image) and the ground range (i.e., the distance at the ground surface), was initially proposed by Notti et al. [22,23]; and then, the R-index model has been widely adopted to evaluate the visibility of the SAR image. In reference to Notti et al. [22,23], the R-index can be calculated based on the cosine of the angle between the local terrain surface and the radar beam. As illustrated in Figure 2, an imaging scenario with the satellite in ascending mode and the slope dipping towards the radar is taken as an example to depict the formulation of the R-index [22].
where γ is the angle between the local terrain surface and the radar beam; α is the slope of the terrain; β is the aspect of the terrain; θ is the incidence angle of the satellite LOS; and, φ is the azimuth angle of the satellite LOS.
It is noted that in the areas with good visibility, the angle (γ1) between the local terrain surface and the radar beam is acute and is not greater than the complementary angle of the incidence angle of the satellite LOS, thus the value of the R-index is not smaller than sin(θ). The relationship between the incidence angle of the satellite LOS and the slope of the terrain in the geometric distortion regions is analyzed in Dai et al. [34], and the possible values of the R-index (in the geometric distortion regions) are summarized as follows: (1) in the foreshortening regions (e.g., BC in Figure 1a), the angle (γ2) between the terrain surface and the radar beam is acute and it is greater than the complementary angle of the incidence angle of the satellite LOS, thus the R-index is between 0 and sin(θ), expressed as 0 < R-index < sin(θ); (2) in the active layover regions (e.g., EF in Figure 1b), the angle (γ3) between the terrain surface and the radar beam is obtuse, and the R-index is a negative value; and 3) in the active shadow regions (e.g., IJ in Figure 1c), the angle (γ4) between the terrain surface and the radar beam is acute, and the R-index is a positive value.
As can be seen, one possible limitation of the R-index model is that the value of the R-index in the areas with good visibility and that in the active shadow regions are both positive [26]. Thus, the areas with good visibility and the active shadow regions might not be distinguished by this R-index. The other limitation of the R-index model is that the passive layover regions (e.g., DE and FG in Figure 1b) and passive shadow regions (e.g., JK in Figure 1c) in the SAR images are formed due to the influence of the adjacent terrains, which may not be recognized through the cosine of the angle between the local terrain surface and the radar beam (or the R-index) [26,31]. In short, the original R-index model may not identify the passive layover regions and shadow regions in the SAR images [24,26]. To overcome this limitation, a modified R-index model was developed in Cigna et al. [26] and Notti et al. [27], in which a layover coefficient and a shadow coefficient are incorporated; and, the modified R-index, denoted as R-index(m), is formulated as follows:
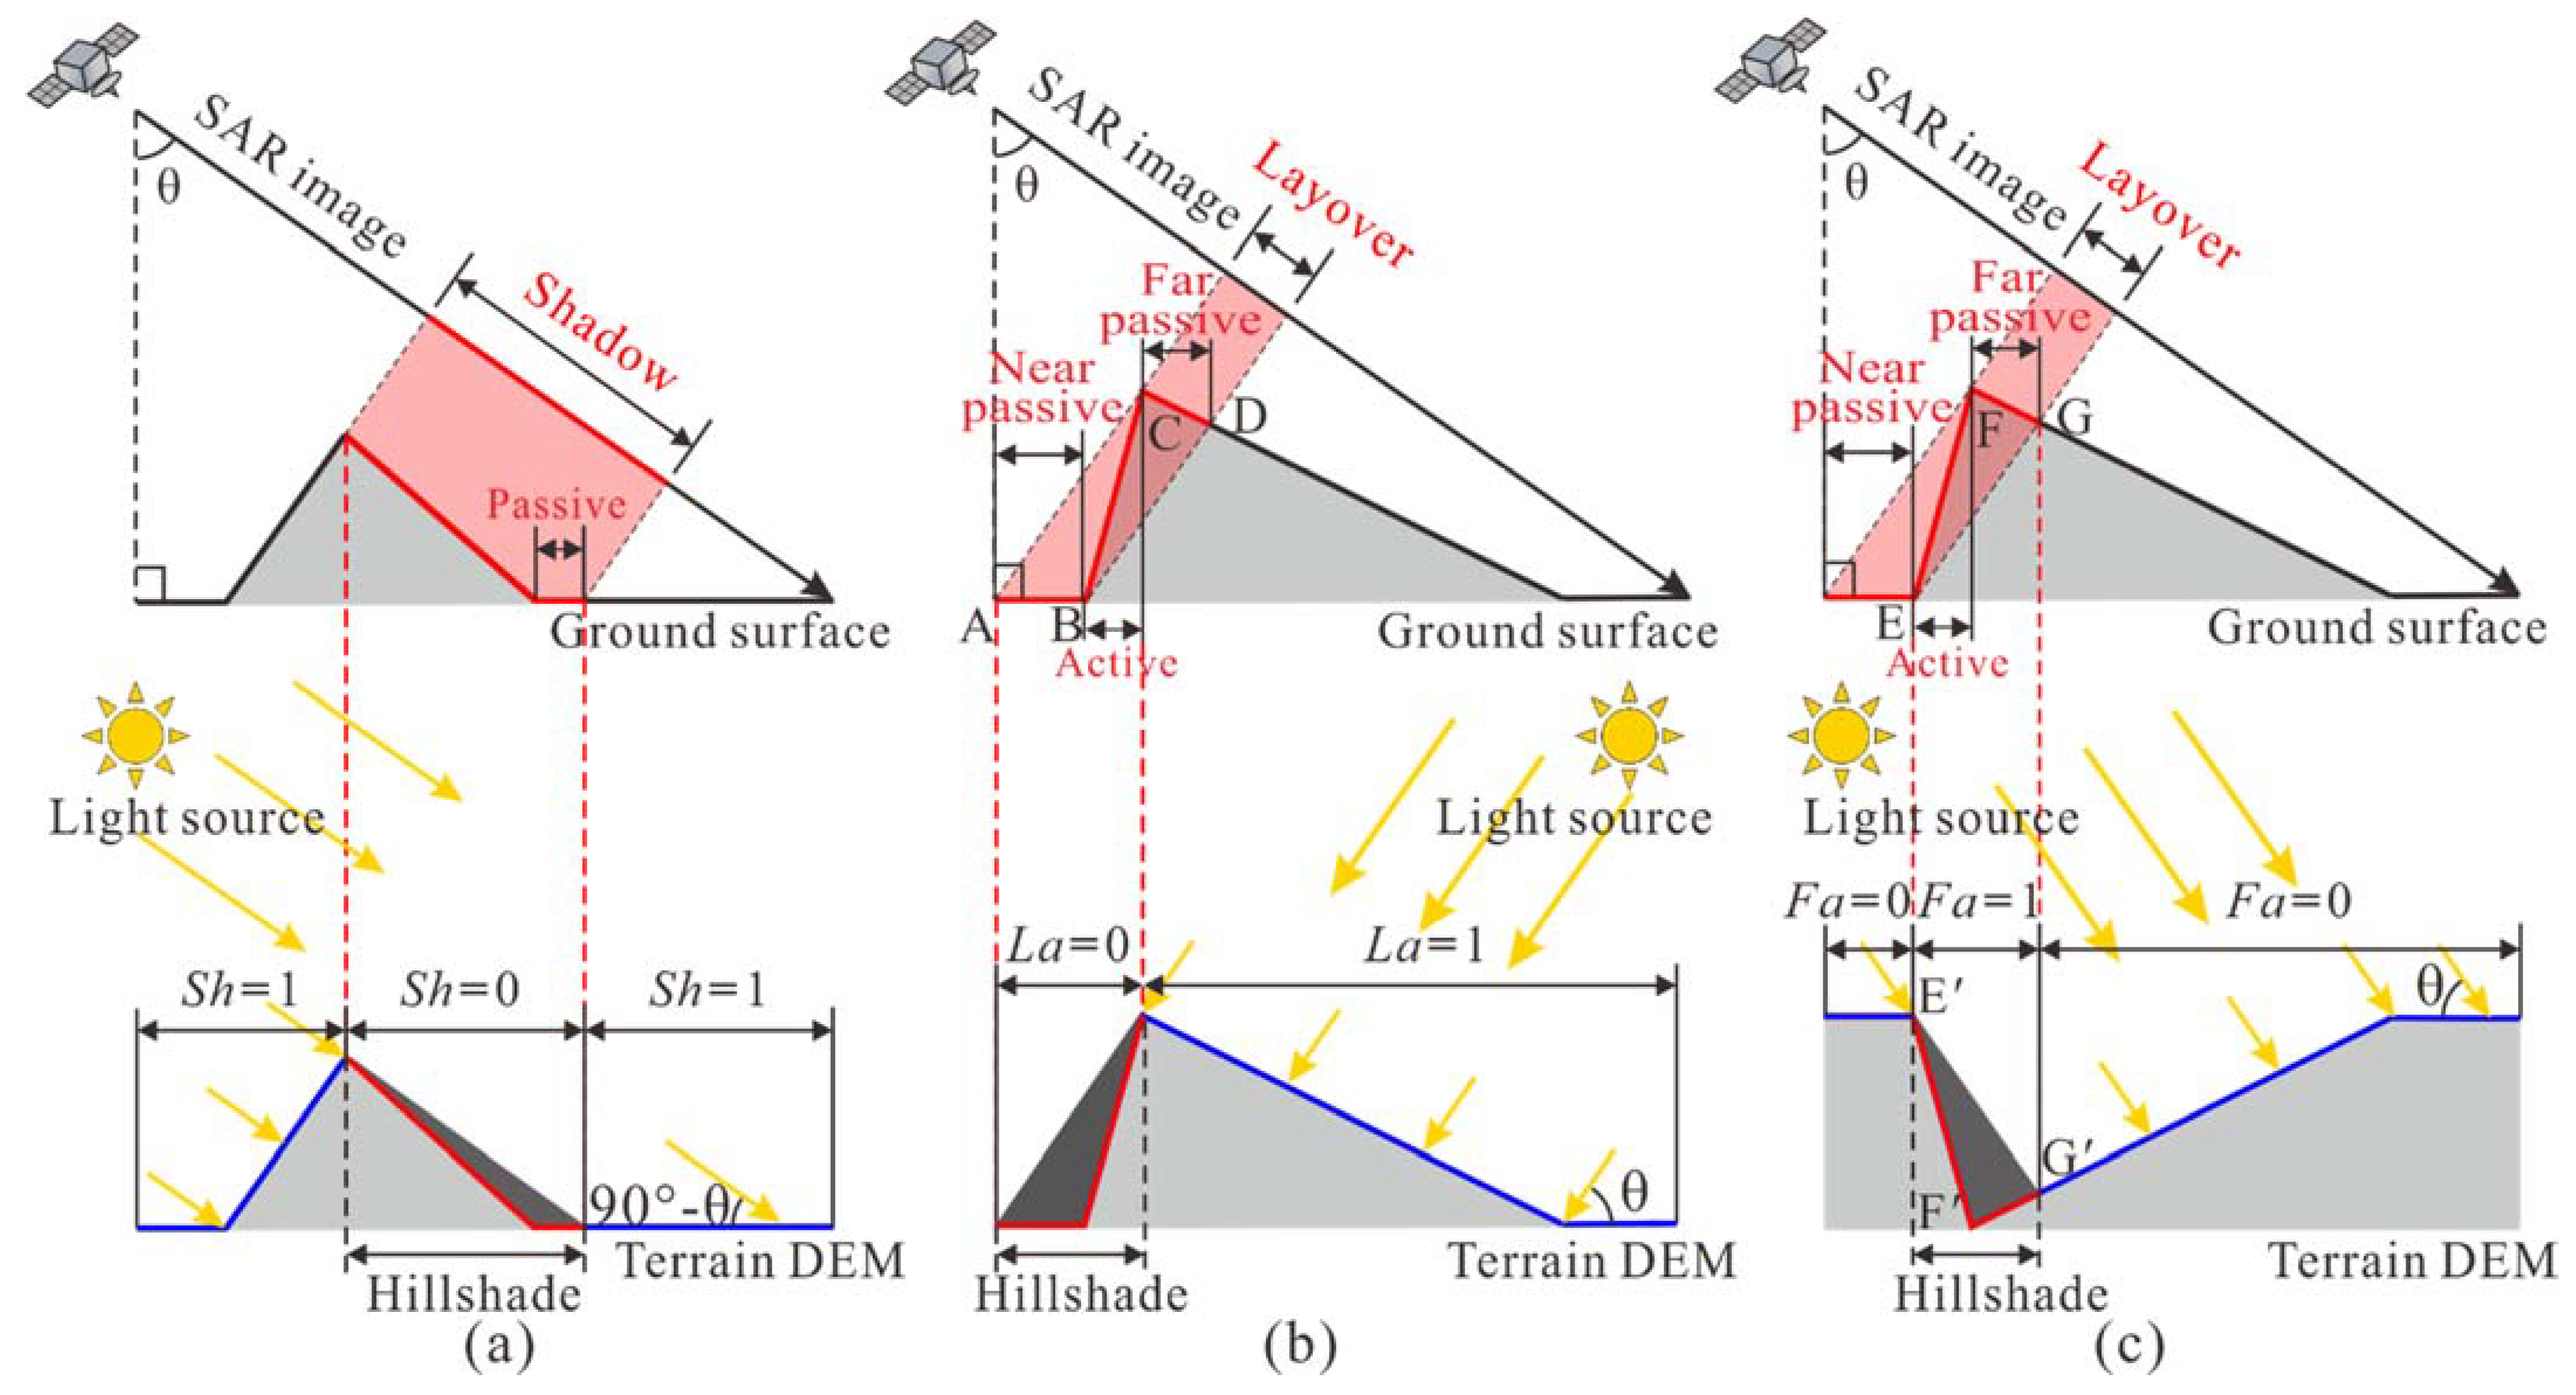
where Sh is the shadow coefficient and La is the layover coefficient, which can be calculated using the hillshade model in ArcGIS [35]. The altitude and azimuth angles (of the light source adopted in the hillshade model) are demanded for the calculation of the shadow coefficient (Sh) and layover coefficient (La), as illustrated in Figure 3a,b. More information about the shadow coefficient (Sh) and layover coefficient (La) can be found in Notti et al. [27]. The value of R-index(m) is smaller than 1.0, and the visibility of an area can be evaluated with the following criteria: 1) if R-index(m) is greater than or equal to sin(θ) (i.e., R-index(m) ≥ sin(θ)), the related area is an area with good visibility; 2) if R-index(m) is between 0 and sin(θ) (i.e., 0 < R-index(m) < sin(θ), the related area is a foreshortening region and the visibility is medium; and 3) if R-index(m) is not positive (i.e., R-index(m) ≤ 0), the related area is a layover or shadow region and the visibility is poor.
In reference to Figure 1b, the passive layover region consists of two parts, in terms of the near passive layover region (DE) and the far passive layover region (FG). However, the R-index(m) could only identify the active layover region (BC) and near passive layover region (AB) in the SAR images, according to the geometric basis of the layover coefficient shown in Figure 3b; and, the far passive layover region (CD) in the SAR images cannot be recognized. Thus, the modified R-index model is not perfect and there is still room for improvement.
2.3. The Improved R-Index Model
To recognize the far passive layover regions of SAR images, a far passive layover coefficient, which is based on the formation mechanism of the far passive layover region (see Figure 1b), is proposed in this study. This far passive layover coefficient is then incorporated into the calculation of the R-index to improve the modified R-index model [26,27], and the improved R-index, denoted as R-index(im), is formulated as follows:
where Fa is the far passive layover coefficient, the value of which is 0 in the passive layover region and while in the other region is 1.0. This far passive layover coefficient can be calculated using the hillshade model in ArcGIS [35], the reversed DEM (of the terrain) and the altitude and azimuth angles (of the light source employed in the hillshade model) are input parameters for the estimate of this far passive layover coefficient. In reference to Figure 3c, the geometric feature of the light source is first determined through making the location (in terms of latitude and longitude) of the hillshade region in the hillshade model (e.g., E’F’ and F’G’ in Figure 3c) to coincide with that of the layover region (i.e., the active layover region and the far passive layover region) (e.g., EF and FG in Figure 3c); and, the altitude and azimuth angles of the light source in the hillshade model can be obtained: the altitude angle is equal to the incidence angle of the satellite LOS (θ) and the azimuth angle is equal to the opposite orientation of the satellite LOS (φ + π). The outcome of the hillshade analysis is the gray gradient, based on which the far passive layover coefficient (Fa) could be determined: the far passive layover coefficient (Fa) in the area with gray gradient above 0 is set to 1.0 while that in the other area is set to 0.
Note that the calculated value of the improved R-index (R-index(im)) is between 0 and 1.0, based on which the visibility of an area can be evaluated: 1) if R-index(im) is greater than or equal to sin(θ) (i.e., R-index(im) ≥ sin(θ)), the related area is an area with good visibility; 2) if R-index(im) is between 0 and sin(θ) (i.e.,0 < R-index(im) < sin(θ)), the corresponding area is a foreshortening region and the visibility is medium; and 3) if R-index(im) is equal to 0 (i.e., R-index(im) = 0), the related area is a layover or shadow region and the visibility is poor.
3. Application of the Improved R-Index Model: Terrain Visibility Analysis in Fengjie
To illustrate the applicability of the improved R-index model, the terrain visibility of SAR images in Fengjie, a county in the Three Gorges Reservoirs region of China, is studied in this section, and the effectiveness of the improved R-index model is demonstrated through comparing the visibility analysis results with those obtained from the existing R-index models and P-NG method [28].
3.1. The Geological Setting of the Study Area and the Parameters of the Satellite LOS
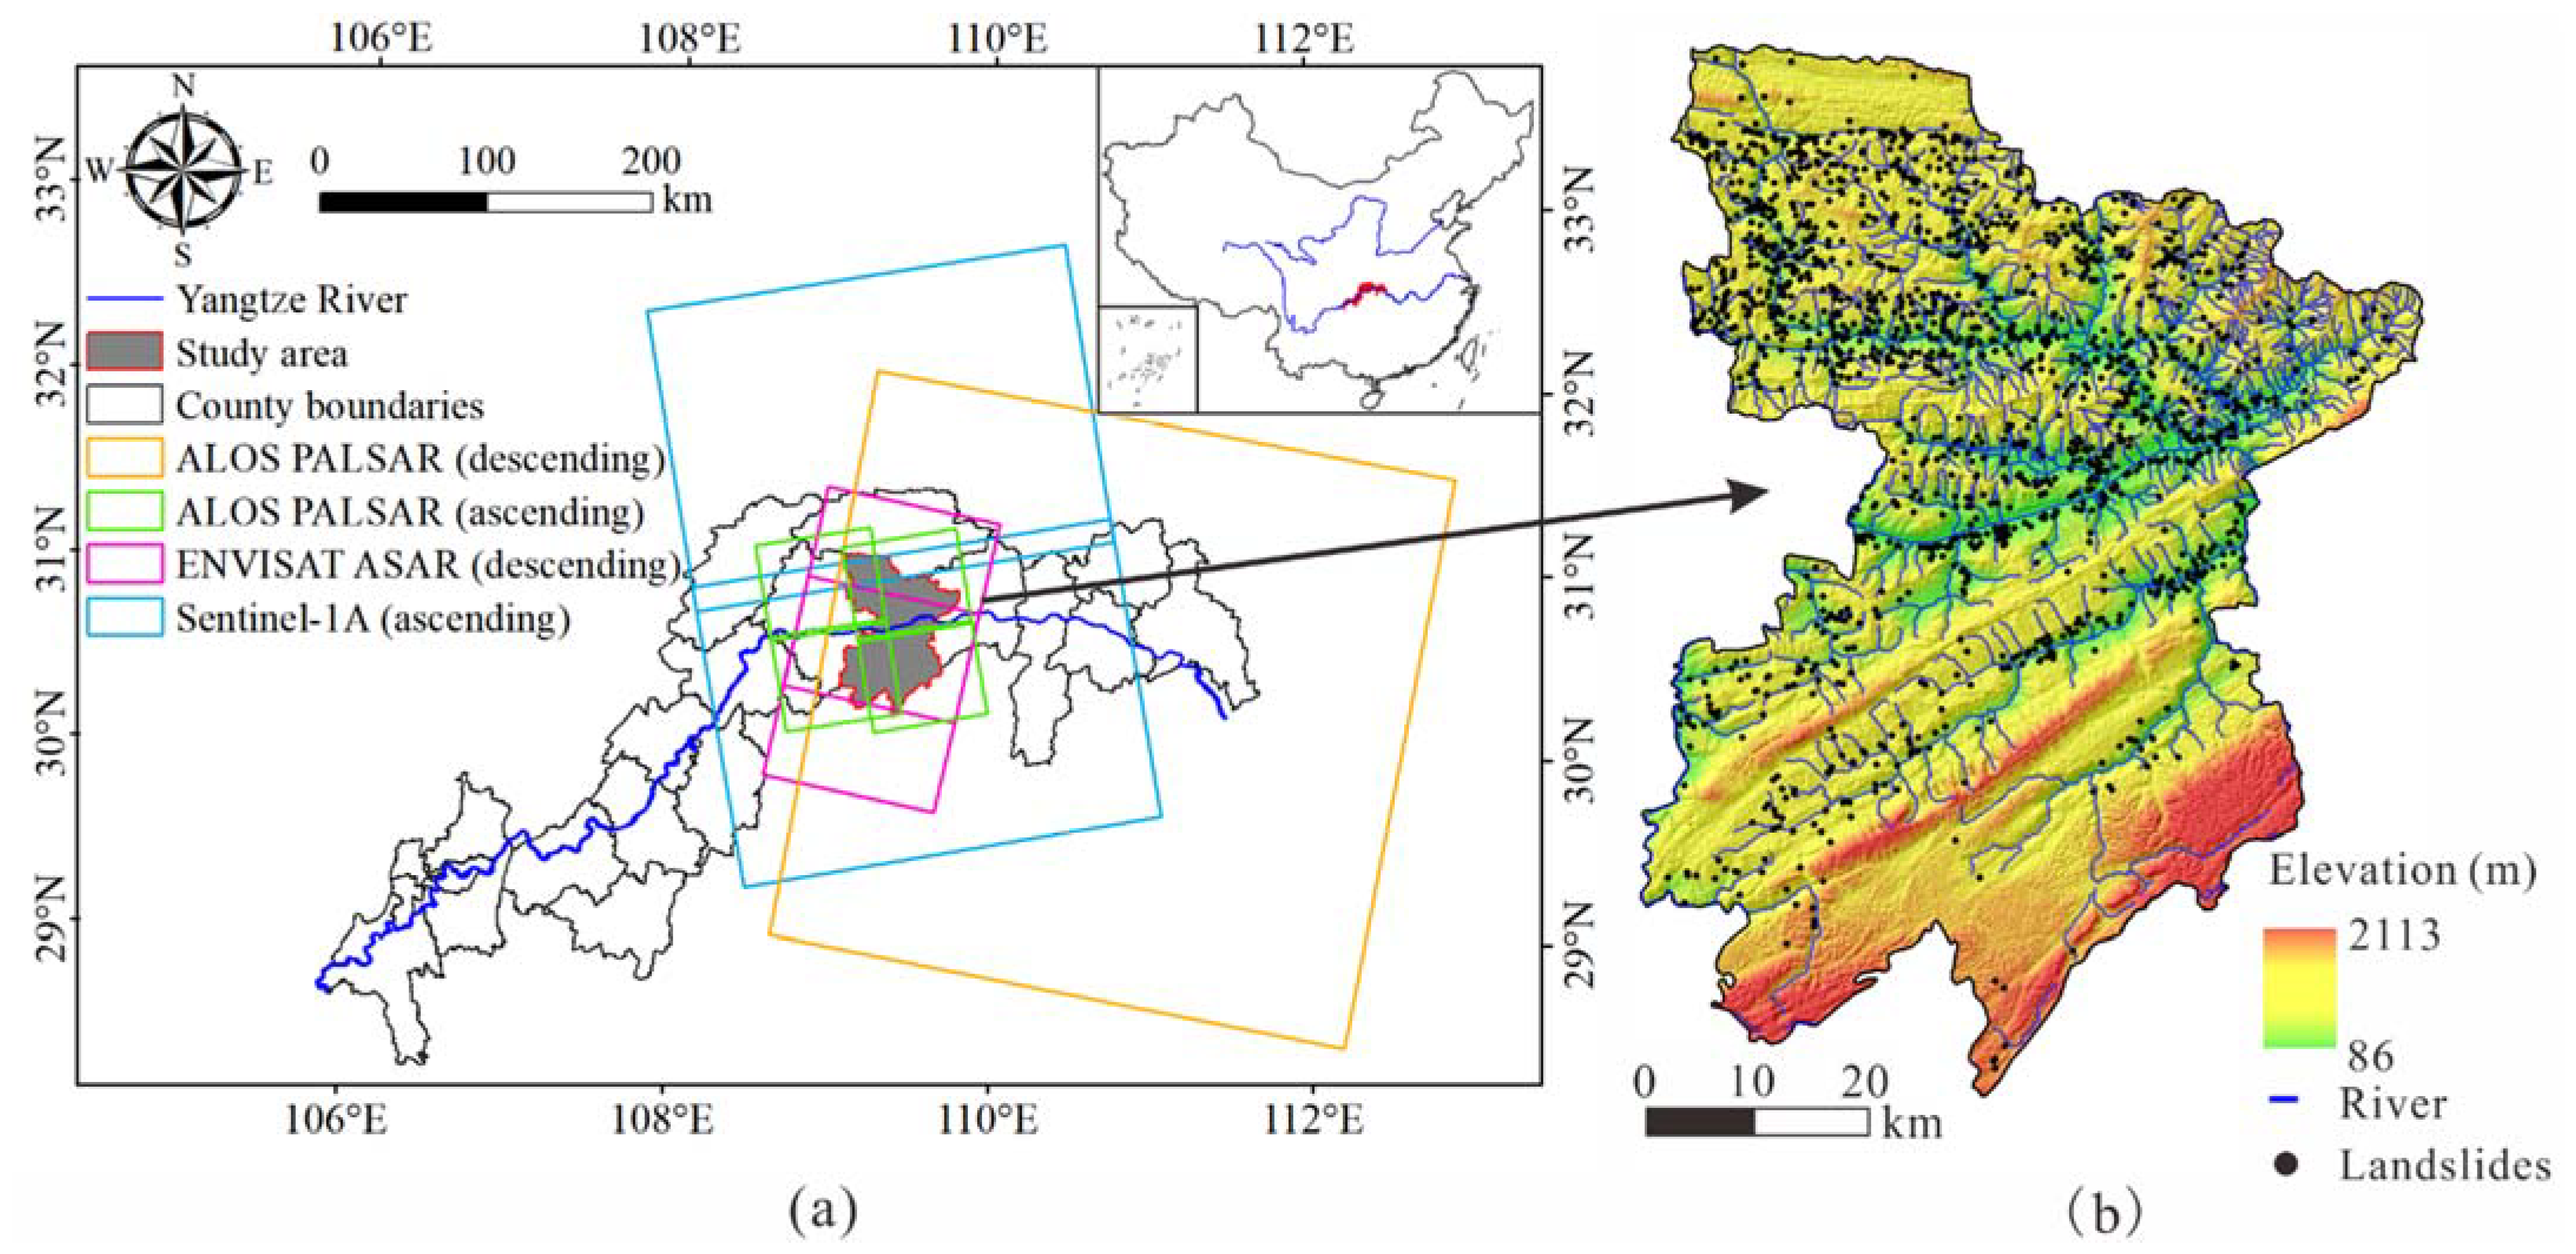
In reference to Figure 4a, the study area, Fengjie, is situated in the hinterland of the Three Gorges Reservoir region of China (109°1’17’’E ~ 109°45’58’’E, 30°29’19’’ ~ 31°22’33’’N), covering an area of about 4100 km2. The topography of the study area is mainly characterized by rugged mountains and deeply incised valleys with elevations ranging from 86 m to more than 2100 m. The mountainous areas account for around 88% of the total area of this county. The lithology in the study area consists of that of the Quaternary, Jurassic, Triassic, Permian, Carboniferous, Devonian, and Silurian, and the outcrops mainly consist of the Middle Triassic Badong Formation, with a broken and loose structure [36,37]. The climate of the study area is the central Asian tropical humid monsoon climate, with abundant rainfall and annual average precipitation of 1132 mm. There are numerous rivers in the study area that drain into the Yangtze River; and, the Yangtze River runs through the central part of the study area, with an average annual discharge of about 13,700 m3/s [37]. The study area is prone to landslides. For example, plenty of landslides were distributed along the Yangtze River and its tributaries. A total of 1550 landslides were identified in the study area (from 2001 to 2019), according to the information from the Chongqing Municipal Geological Environment Agency, a governmental institution responsible for monitoring and investigating geological hazards. The locations of the 1550 historical landslides are mapped in Figure 4b.
There exist various SAR satellites could be utilized for the ground surface deformation monitoring in the study area (i.e., Fengjie). For illustration purposes, four sets of SAR images, acquired by three SAR satellites, are analyzed in this paper, the orbit information of which is: descending scenes (track 118 frames 2979 and 2989) of ENVISAT ASAR, descending scenes (track 112 frame 3000) of ALOS PALSAR, ascending scenes (track 464 frames 600 and 610; track 465 frames 600 and 610) of ALOS PALSAR, and ascending scenes (track 84 frames 97 and 98) of Sentinel-1A. The SAR images acquired by ENVISAT ASAR and Sentinel-1A can be downloaded from the European Space Agency (https://earth.esa.int, accessed on 26 April 2021), while those acquired by ALOS-PALSAR can be downloaded from the Japan Aerospace Exploration Agency (https://global.jaxa.jp, accessed on 26 April 2021). The coverage areas of these four analyzed sets of SAR images are shown in Figure 4a, and the orientation parameters of the satellite LOSs are tabulated in Table 1.
3.2. Terrain Visibility Analysis in Fengjie with the Improved R-Index Model
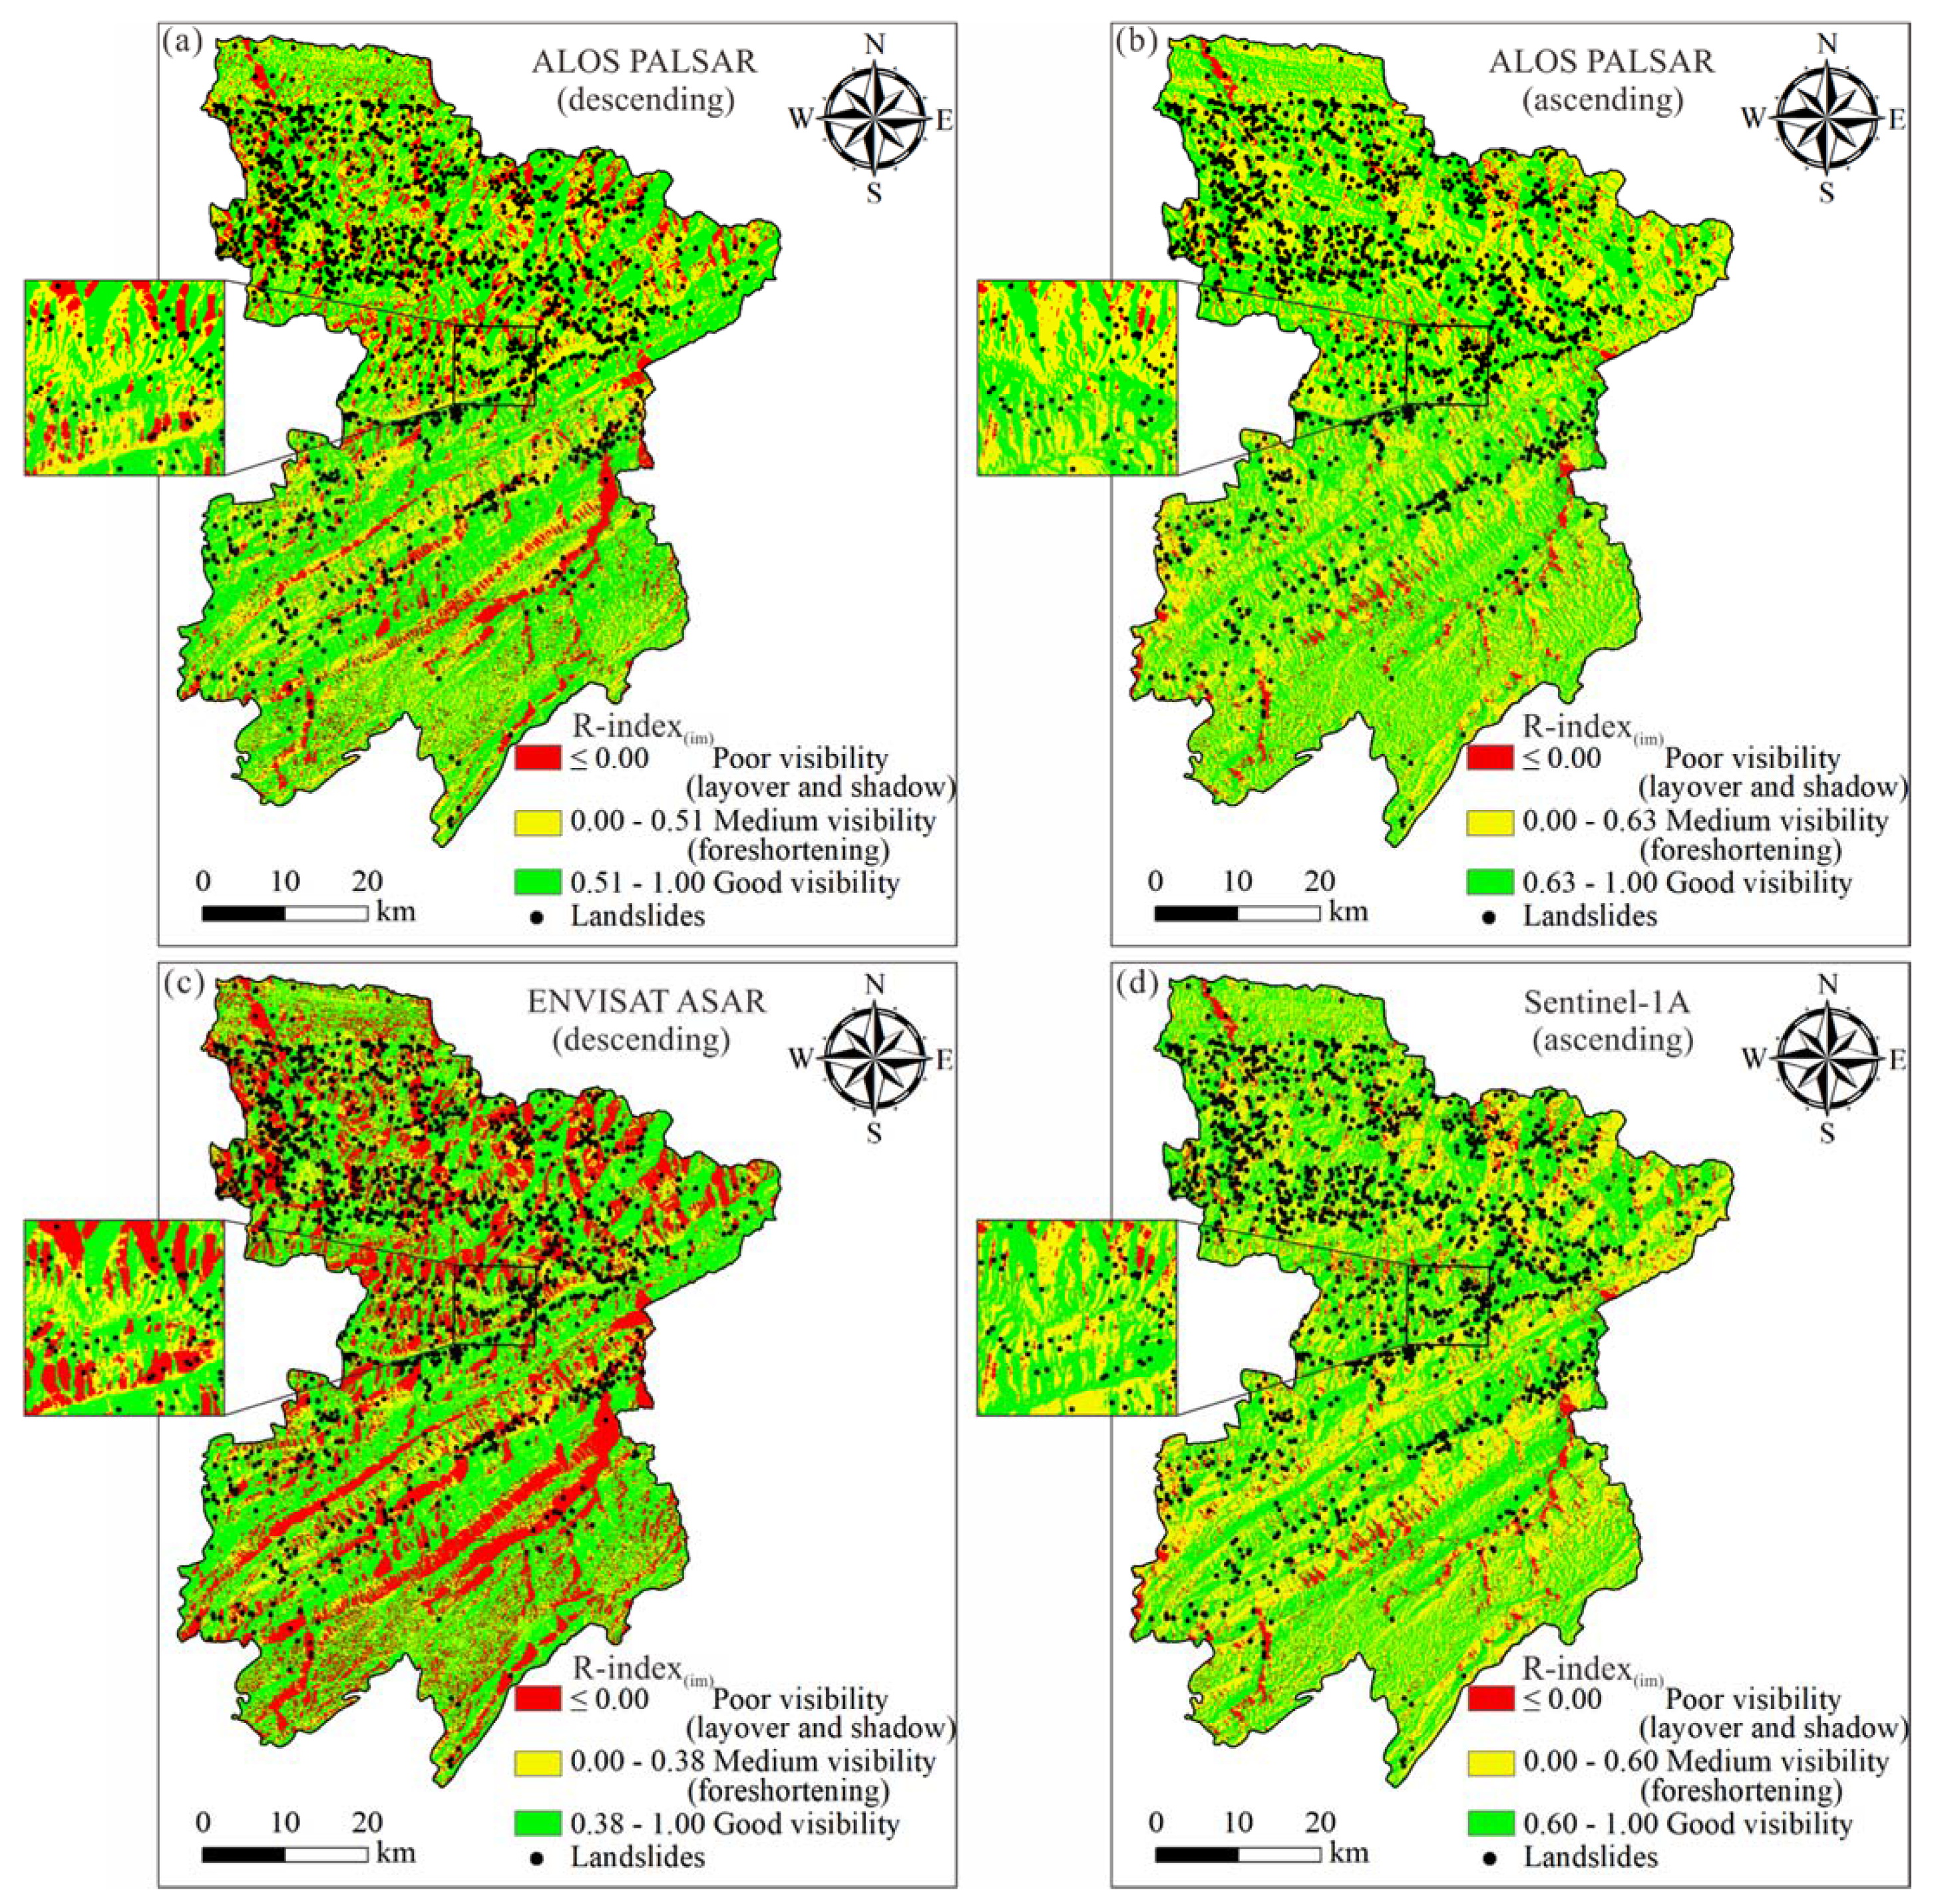
The procedures for implementing the improved R-index model are summarized in the following steps. First, the original R-indexes (see Equation (1)), of the four sets of SAR images, are calculated with the incidence angles (θ) and azimuth angles (φ) of the satellite LOSs and the terrain parameters (i.e., slope α and aspect β), the results are shown in Figure 5. The slope (α) and aspect (β) of the terrain, in this study, are calculated from the Shuttle Radar Topography Mission (SRTM) DEM of Fengjie, the resolution of which is 30 m/pixel. Second, the shadow coefficients (Sh) and layover coefficients (La) are estimated with the procedures developed in Notti et al. [27], then the modified R-indexes (R-index(m); see Equation (2)) are computed, the results are depicted in Figure 6. Third, the far layover coefficients (Fa) are calculated with the procedures mentioned in Section 2.3, then the improved R-indexes (R-index(im); see Equation (3)) are obtained, the results are shown in Figure 7.
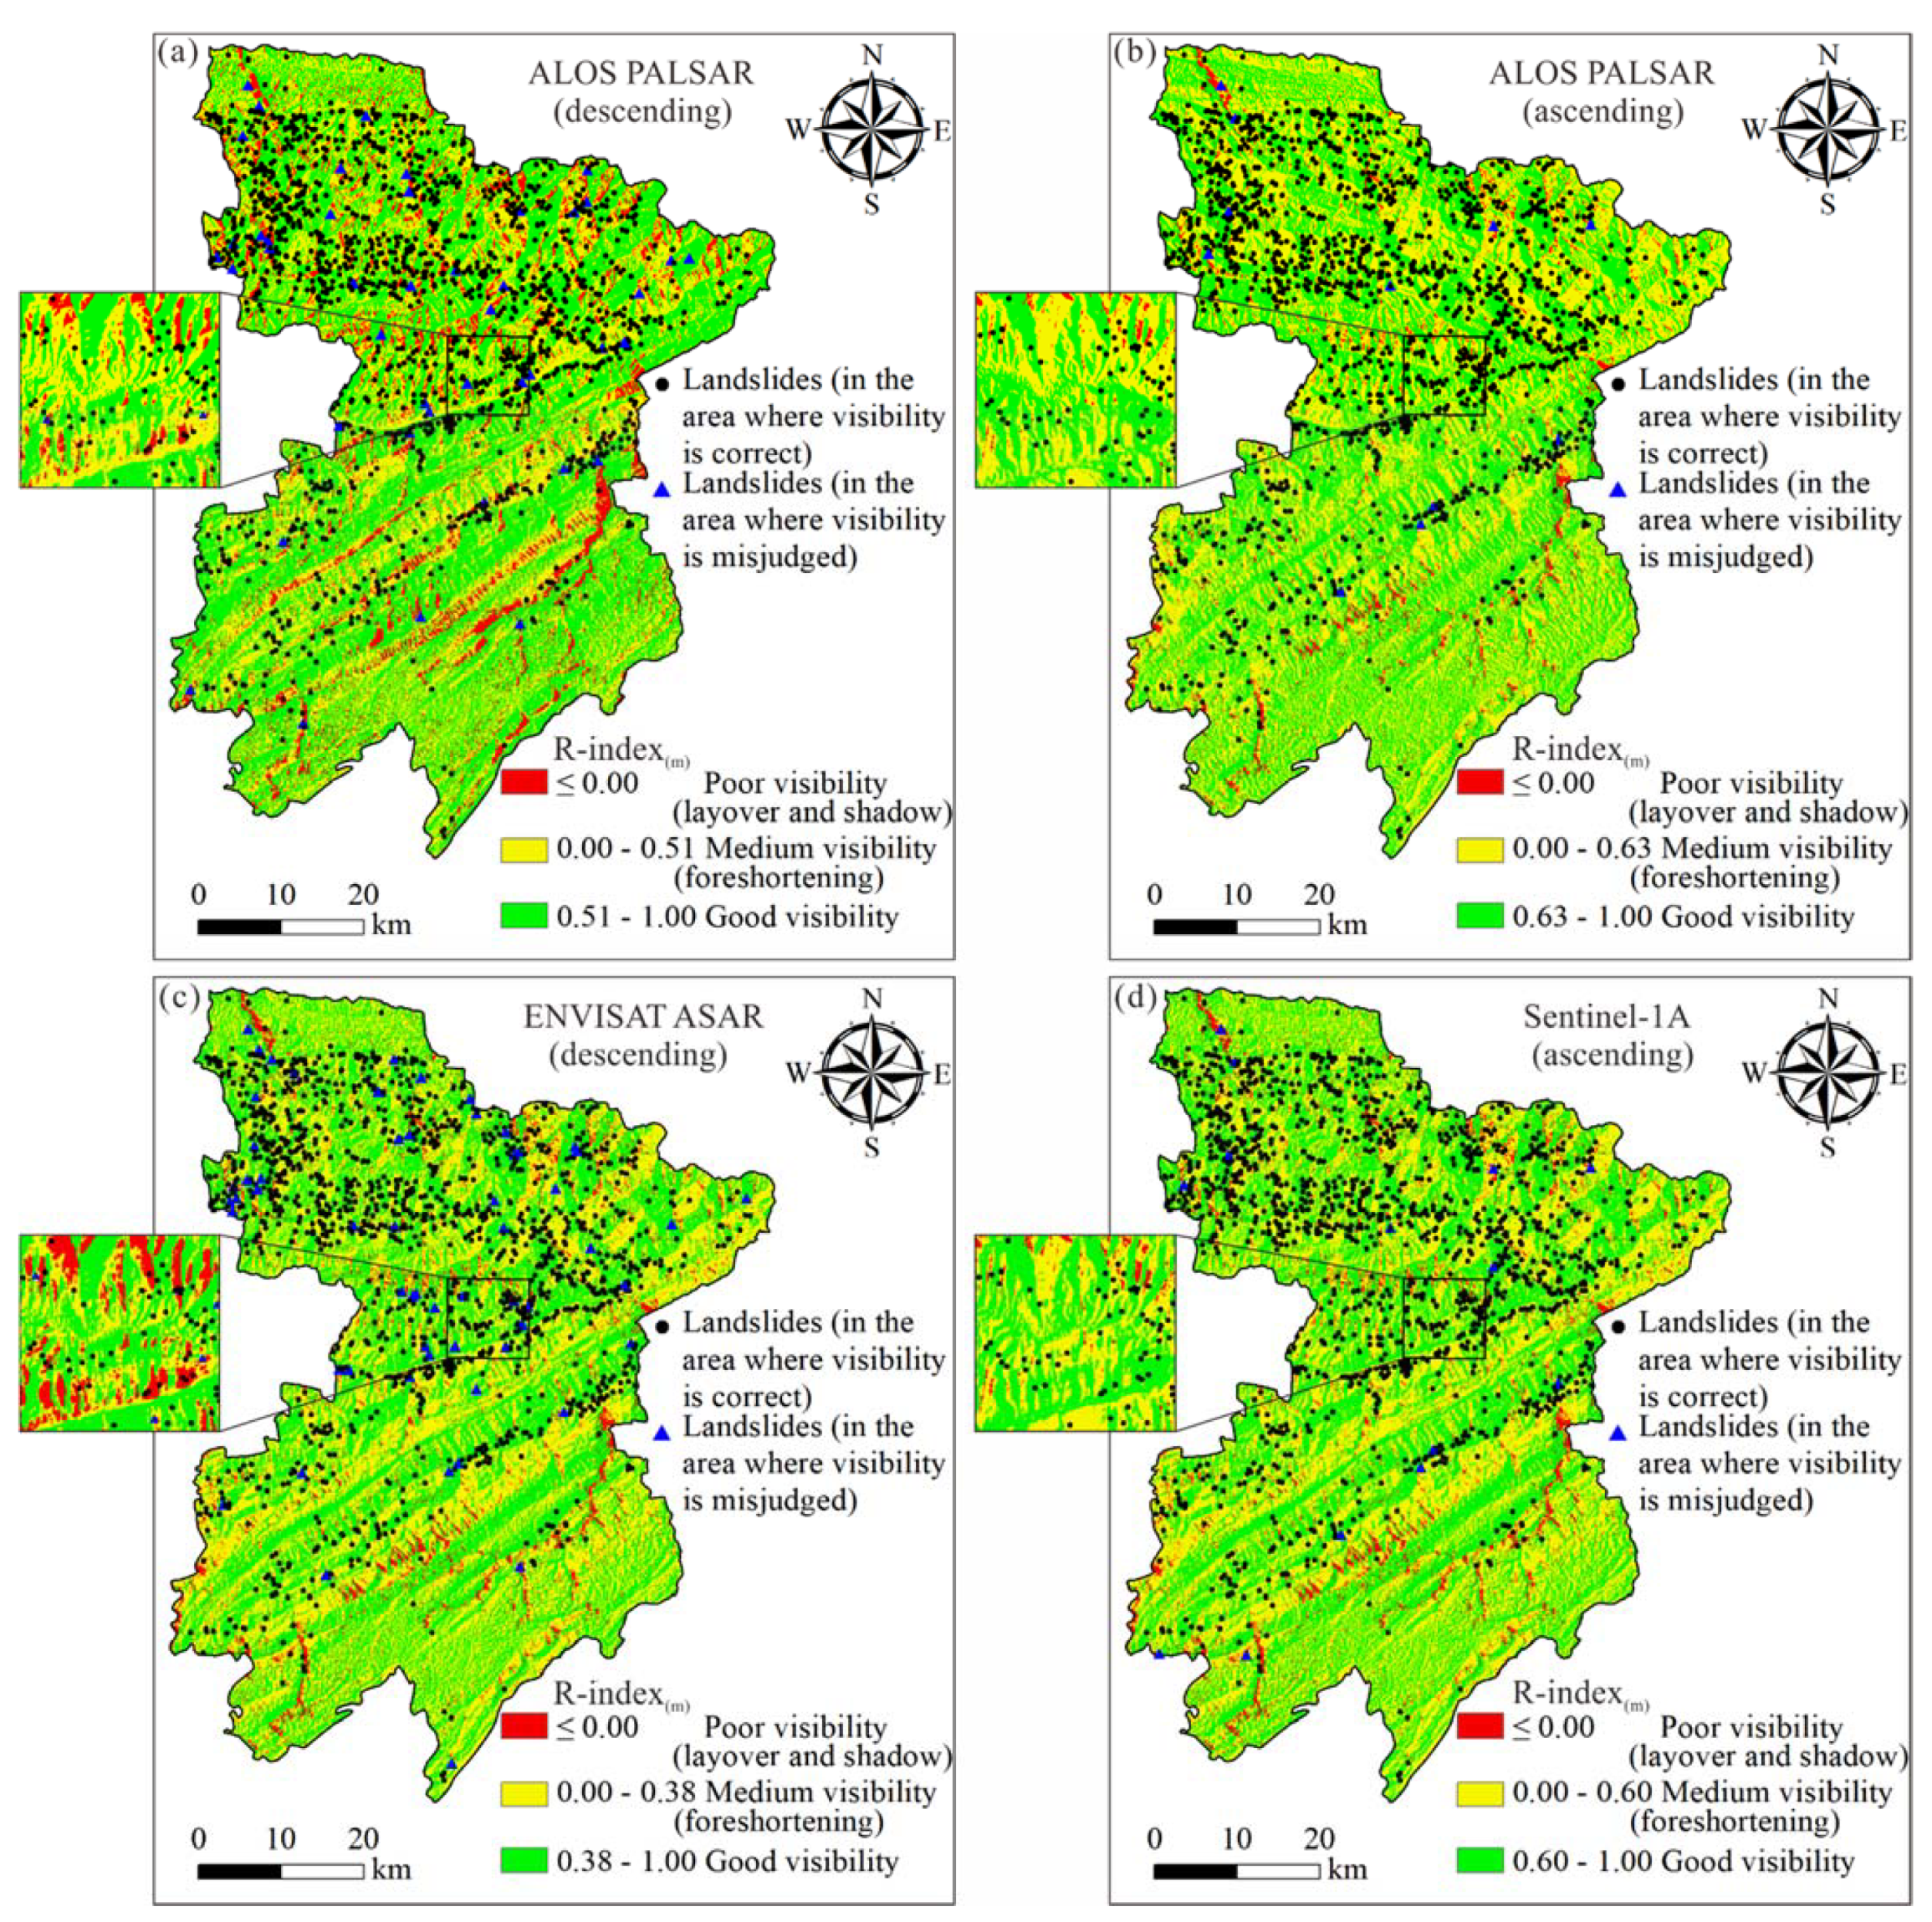
In reference to the mathematical formulation of the improved R-index model, the sine value of the incidence angle of the satellite LOS, in terms of sin(θ), plays an important role in evaluating the terrain visibility, and which is taken here as the threshold value for locating the area with good visibility. The related threshold values of the selected four sets of SAR images, acquired by the descending ENVISAT ASAR, descending ALOS PALSAR, ascending ALOS PALSAR, and ascending Sentinel-1A, are 0.38, 0.51, 0.63, and 0.60, respectively. Based on the comparisons between the improved R-indexes (R-index(im)) and the threshold values, the terrain visibility of the study area can be evaluated, and the evaluation results are illustrated in Figure 7. It can be seen from Figure 7 that the evaluated terrain visibility varies with the input SAR image, which is consistent with the previous knowledge that the terrain visibility can be closely related to the parameters of the satellite LOS [20,38]. The statistical information of the areas with different levels of visibility, obtained with the selected four sets of SAR images, is listed in Table 2. A detailed discussion on the effect of the orientation of the satellite LOS on the terrain visibility will be presented later.
Among the four sets of SAR images studied, the areas with good visibility obtained by the descending ALOS PALSAR are the largest (i.e., accounting for 51.91 % of the total area); and, 844 landslides, accounting for 54.45% of the historical landslides identified, are located in the areas with good visibility. As can be seen in Figure 7a, the areas with good visibility are mainly distributed on the flat ground and the W-facing slopes with the slope less than 59.61°; the foreshortening regions, the visibility of which is medium, are mainly distributed on the E-facing slopes with the slope less than 30.39°; and, the layover regions, the visibility of which is poor, are mainly distributed on the E-facing slopes with the slope greater than 30.39°. Since the incidence angle of the descending ALOS PALSAR is very small (i.e., 30.39°), the shadow regions in the study area are small (i.e., only accounting for 0.015% of the total area), which are mainly distributed on the W-facing slopes with the slope greater than 59.61°. It should be noted that 172 landslides are located in the areas with poor visibility (i.e., layover and shadow regions), the behavior of these 172 landslides may not well monitored if only the SAR images acquired by the descending ALOS PALSAR are included using the technique of InSAR.
3.3. Comparisons between the Improved R-Index Model and the Existing R-Index Models
To illustrate the advantages of the improved R-index model over the existing R-index models (i.e., the original and modified R-index models) in evaluating the terrain visibility of SAR images, the visibility evaluation results obtained from the improved R-index model are compared here to those obtained from the existing R-index models.
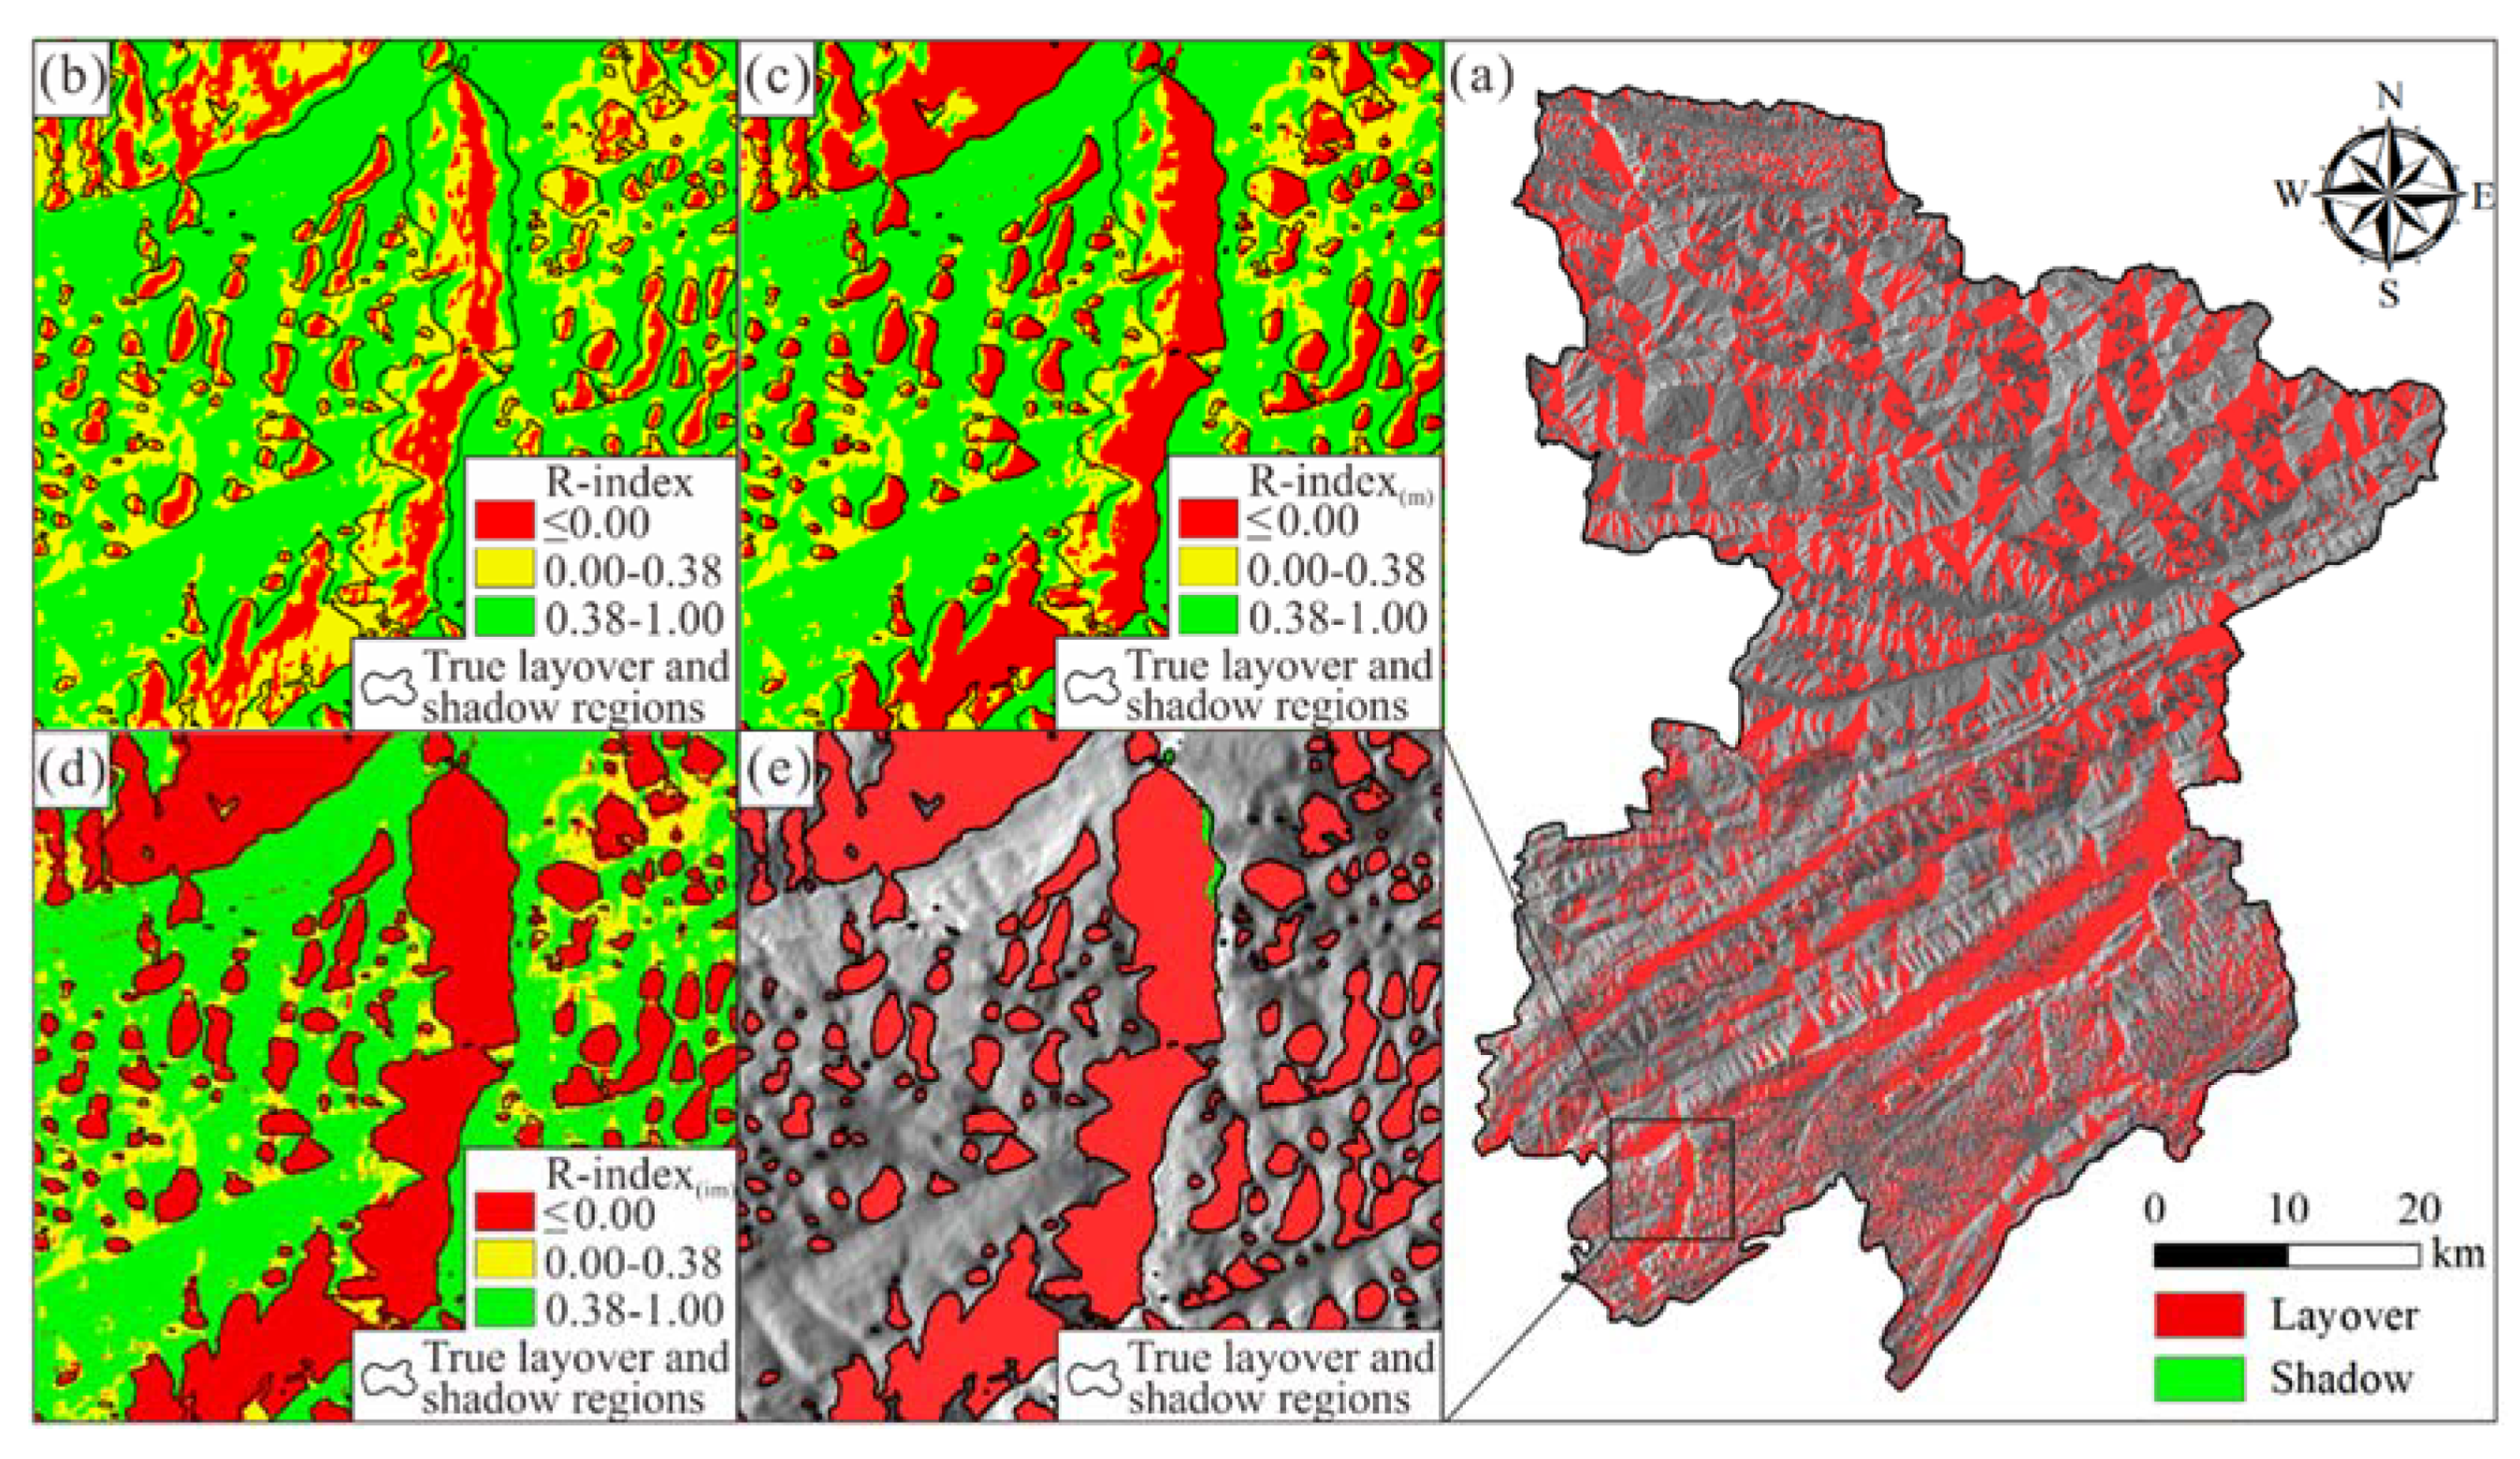
According to the geometric basis of the improved R-index model and the existing R-index models, the main difference between these three models is in the ability to identify the layover and shadow regions in the SAR images. As such, the true layover and shadow regions are recognized in the SAR intensity image, which are taken as the reference for comparisons among these three R-index models. For ease of comparisons, the SAR images acquired by the descending ENVISAT ASAR, which are most influenced by the layover and shadow regions (i.e., yielding the largest area of layover and shadow regions; see Table 2), are studied. Figure 8 shows the true layover and shadow regions recognized in the SAR intensity image of the descending scene acquired by ENVISAT ASAR on September 24, 2003, which is multi-looked with a 1:5 amplification factor (in range and azimuth) and geocoded to the SRTM DEM (with resolution of 30 m/pixel). It is noted that the true layover and shadow regions in Figure 8 are recognized using the Geocoding and Radiometric Calibration module in ENVI SARscape [32]. The total area of the true layover and shadow regions recognized is 1329.82 km2. Listed in Table 3 is the statistical information of the areas with different levels of visibility (of the selected four sets of SAR images), obtained from the existing R-index models. According to the data in Table 2 and Table 3, the total area of the layover and shadow regions (of SAR images acquired by the descending ENVISAT ASAR) detected by the original R-index model is only 478.39 km2, whereas, those detected by the modified R-index model and improved R-index model are 896.99 km2 and 1252.08 km2, respectively. The comparisons in Figure 8c–e confirm that the layover and shadow regions could be more effectively detected by the improved R-index model, compared to the existing R-index models. From there, the improved R-index model is shown more effective in detecting the layover and shadow regions. In addition, it is noted that the area of the layover and shadow regions obtained from the improved R-index model are not consistent with the true layover and shadow regions. Due to the oversimplification of the acquisition direction of SAR images, variations of the incidence angles (θ) and azimuth angles (φ) of the satellite LOS could not be accounted in the R-index models. This simplification generally results in inaccurate terrain visibility evaluation at the margins of SAR image frames [26]. Note that although this limitation of the R-index models warrants further investigation, the terrain visibility evaluation results (in a large area) would not be degraded much by this simplification when the improved R-index model is adopted.
A further comparison between Table 2 and Table 3 illustrates that the difference in the visibility evaluation results, among these three R-index models, is the most significant in the foreshortening and layover regions, whereas, the difference is the least obvious in the shadow region. The existing R-index models, especially the original R-index model, underestimate the area of the layover regions of SAR images, while overestimate the area of the foreshortening regions and the area with good visibility (see Figure 8). Further, the SAR images acquired by the descending ENVISAT ASAR (among the four sets of SAR images investigated) can yield the biggest difference in the evaluation results between the improved R-index model and the existing R-index models. As an outcome, some landslides in the layover regions of the SAR images, the visibility of which is poor, might be misjudged to be located in the area with good visibility using the existing R-index models, as illustrated in Figure 5 and Figure 6. It can be expected that the error in the visibility evaluation could degrade the applicability of the technique of InSAR to landslide monitoring. With the aid of the improved R-index model, the error in the terrain visibility evaluation could be effectively reduced, and thus a more informed selection of SAR images may be achieved in the landslide monitoring.
3.4. Comparison between the Improved R-Index Model and the P-NG Method
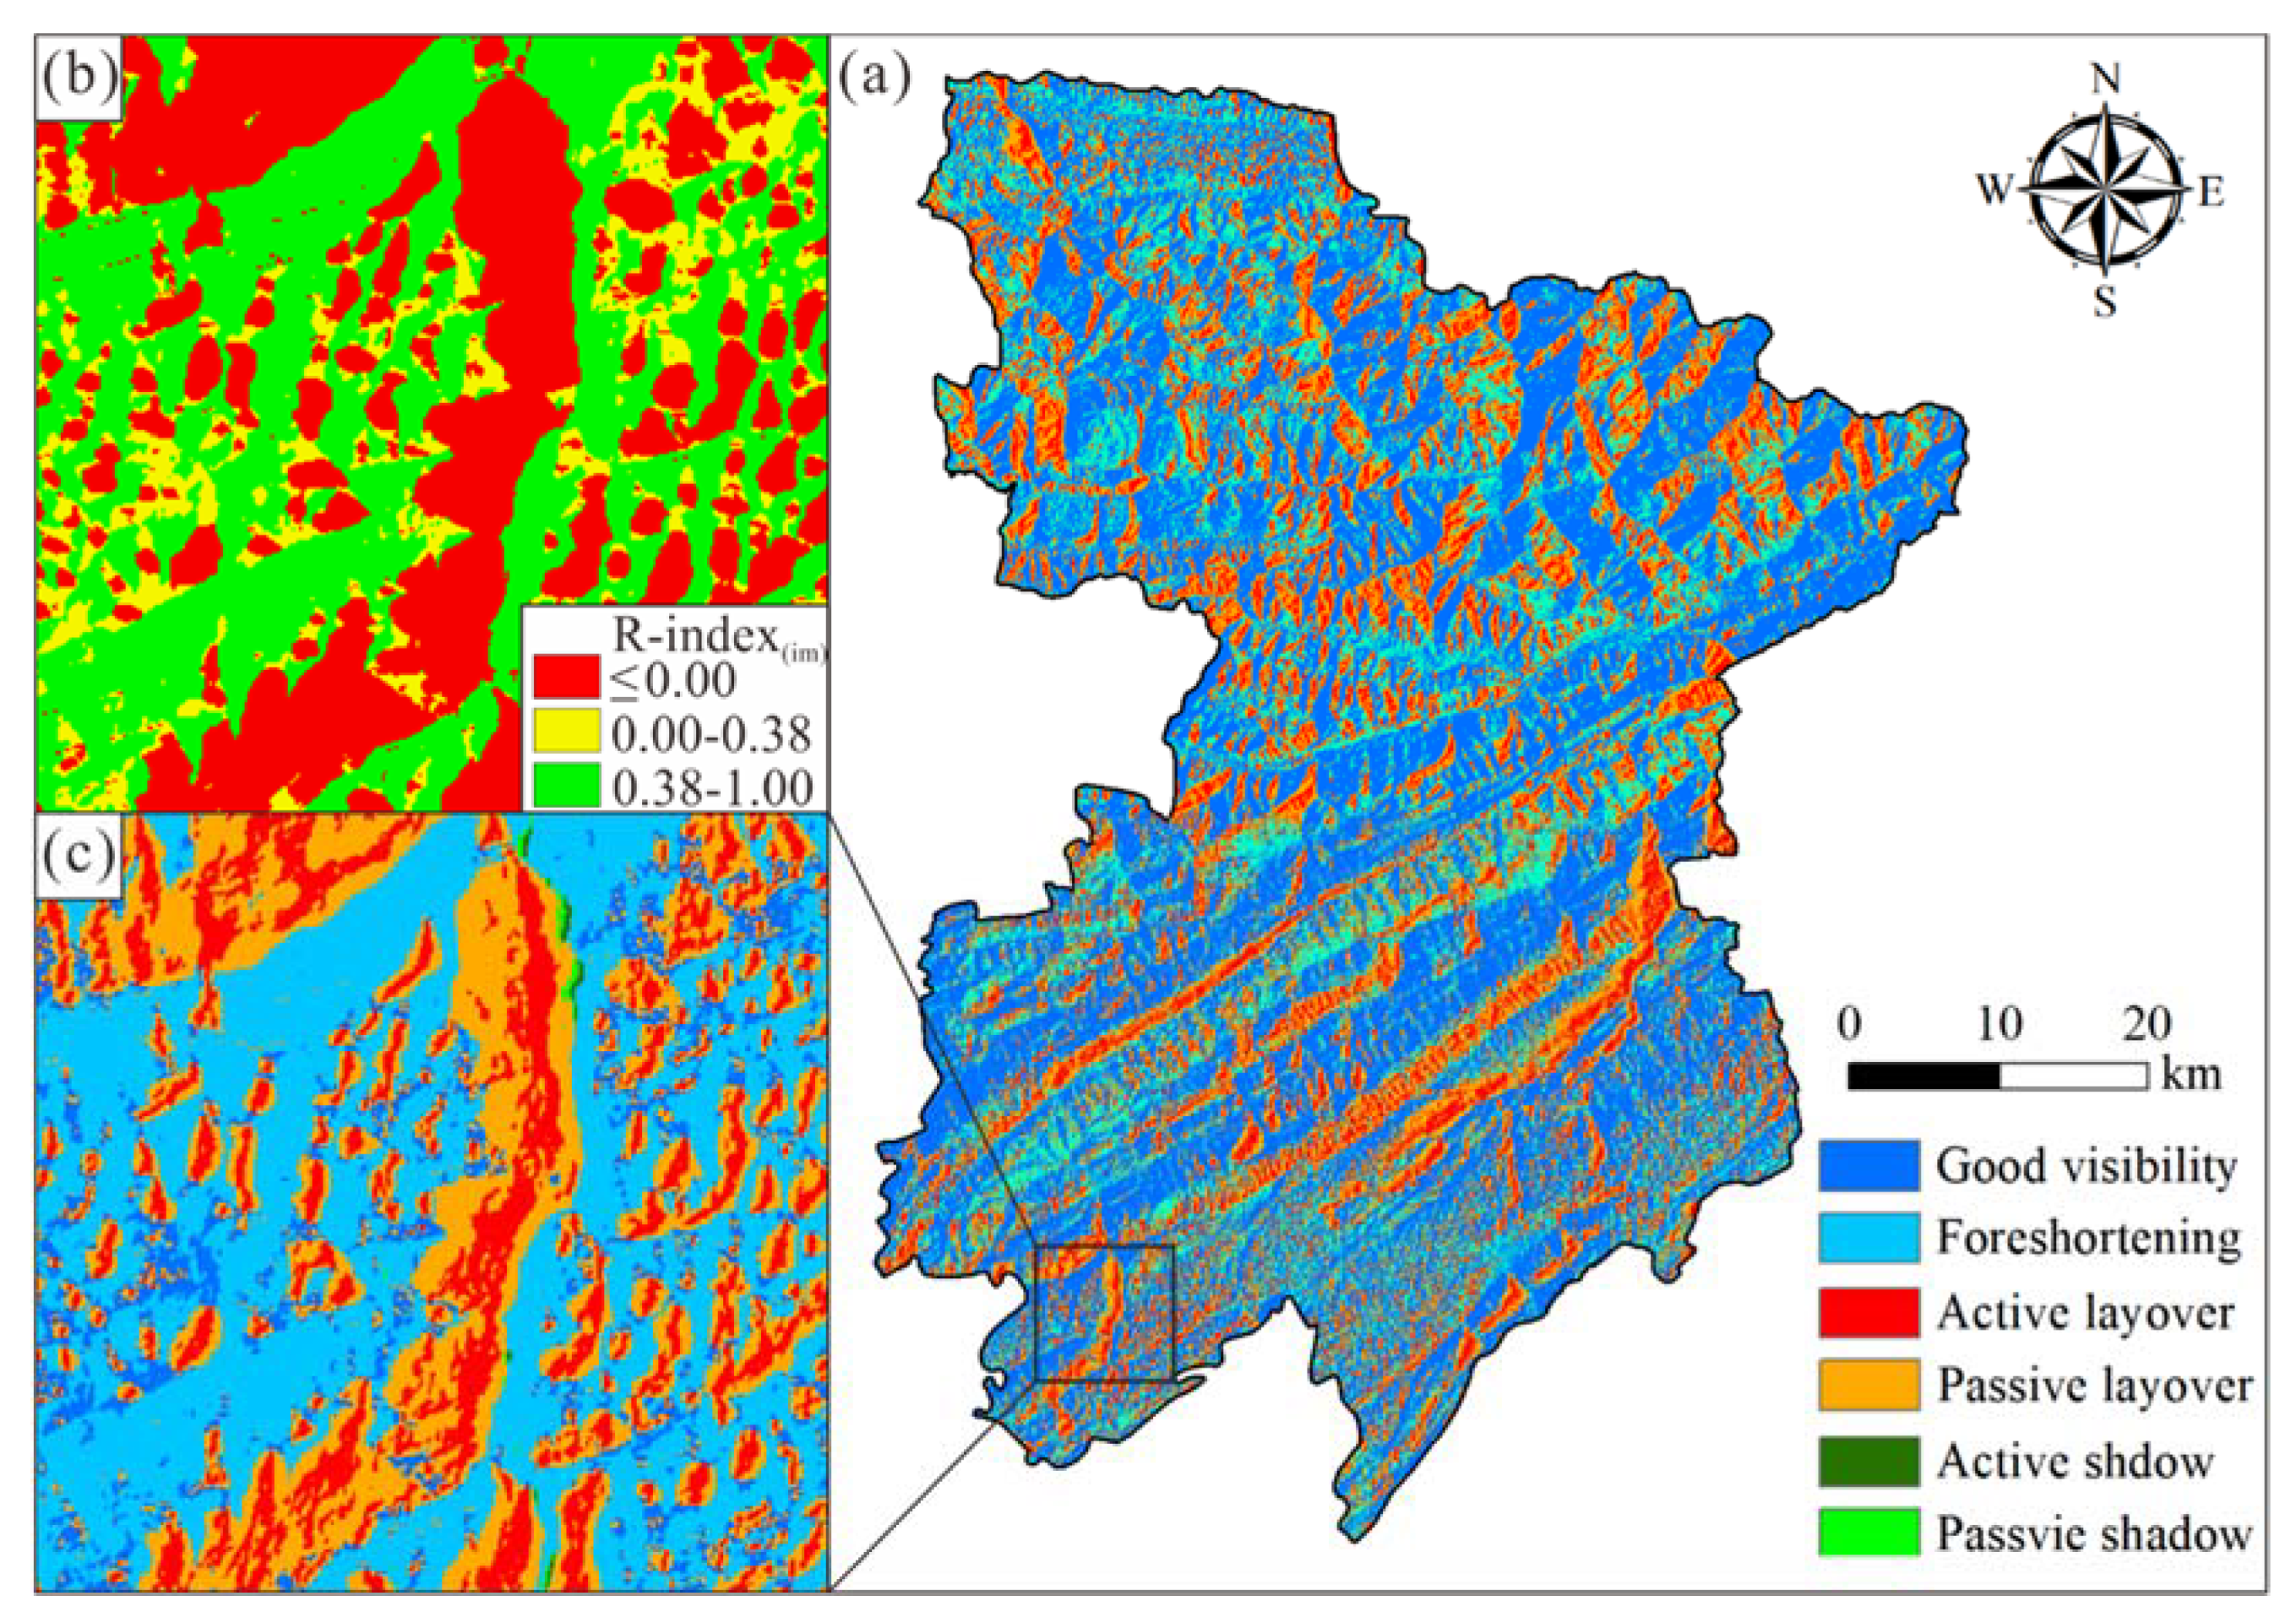
In the context of the P-NG method proposed in Chen et al. [28], the active geometric distortions (i.e., foreshortening, active layover, and active shadow) in the SAR image are first identified; then, a neighbor gradient between passive and active distortion is computed, based on which the passive geometric distortions (i.e., passive layover and passive shadow) could be located. According to this definition, the full name of P-NG may be referred to the passive geometric distortions-neighbor gradient. More information about the P-NG method can be found in Chen et al. [28]. To further demonstrate the effectiveness and advantages of the improved R-index model, the improved R-index model is compared herein to the P-NG method. Figure 9a depicts the geometric distortions in the SAR images acquired by the descending ENVISAT ASAR recognized by the P-NG method. As can be seen in Figure 9b,c, the range of the areas with different levels of visibility obtained by the improved R-index model is in good agreement with that of the geometric distortion regions obtained by the P-NG method. From there, the effectiveness of the improved R-index model can be illustrated. Note that in the context of the P-NG method, each and every cell (or position) of the study area should be evaluated whether it belongs to the areas with geometric distortions, while the improved R-index model can be implemented based on a raster operation in ArcGIS. Thus, the increase of the study area might lead to a significant increase in the calculation time using the P-NG method, and the improved R-index model would yield higher computational efficiency. Further, the improved R-index model can provide a quantitative assessment of the effect of the geometric distortion in the SAR images, which may be adopted for evaluating the presence of PS points in the prior processing of PSI techniques [27].
4. Discussions on the Influencing Parameters of the Terrain Visibility
According to the formation mechanism of geometric distortions of SAR images shown in Figure 1, the terrain visibility of SAR images can be related to the orientation parameters of the satellite LOS and the characteristics of the local terrain. Thus, the effects of the orientation (i.e., incidence angle and azimuth) of the satellite LOS and the resolution of the DEM (of the local terrain) on the terrain visibility are discussed in this section. Note that although the effects of the influencing parameters on the terrain visibility have been addressed previously [23,26,27,31,39], the results presented in this section could be taken as a meaningful supplement to the existing studies.
4.1. Influences of the Orientation of the Satellite LOS on the Terrain Visibility
A further investigation of the data shown in Table 2 indicates that in the SAR images collected by descending satellites, the layover areas acquired by ALOS PALSAR are smaller than those acquired by ENVISAT ASAR, and the shadow areas acquired by ALOS PALSAR are larger than those acquired by ENVISAT ASAR; whereas, in the SAR images collected by ascending satellites, the layover areas acquired by ALOS PALSAR are smaller than those acquired by Sentinel-1A, and the shadow areas acquired by ALOS PALSAR are larger than those acquired by Sentinel-1A. Therefore, the shadow areas (in the SAR images) tend to increase with the incidence angle of the satellite LOS, while the layover areas (in the SAR images) tend to decrease with the incidence angle of the satellite LOS. This observation is consistent with that derived in the previous studies [26], which can aid in selecting suitable SAR images for the landslide monitoring. For example, when the study area is located in the layover area of SAR images, the SAR images with a greater incidence angle should be preferred. In addition, in the SAR images collected by descending satellites, the layover regions (i.e., the visibility of which is poor) and the foreshortening regions (i.e., the visibility of which is medium) are mainly distributed on the E-facing slopes, as shown in Figure 10b,c; whereas, the areas with good visibility and the shadow regions (i.e., the visibility of which is poor) are mainly distributed on the W-facing slopes, as shown in Figure 10a,d. The opposite phenomenon could be observed in the SAR images collected by ascending satellites (see Figure 10). Thus, the SAR images collected by the descending ALOS PALSAR is more suitable for monitoring W-facing landslides in Fengjie, while those collected by the ascending ALOS PALSAR is more suitable for monitoring E-facing landslides in Fengjie.
According to the inference drawn in Section 3.2, a single set of SAR images cannot be sufficient for the landslide monitoring of the study area. For example, if only the SAR images acquired by the descending ALOS PALSAR are utilized, only 51.91% of the total area (i.e., 2127.06 km2) in Fengjie is categorized into the area with good visibility, and 844 landslides (i.e., only 54.45% of the historical landslides identified) are located in the regions with good visibility. Rather, if the SAR images acquired by the descending ALOS PALSAR and those by the ascending ALOS PALSAR are integrated, 89.01% of the total area (i.e., 3648.37 km2) in Fengjie would be categorized into the area with good visibility, and 1360 landslides (i.e., 87.74% of the historical landslides) would be located in the regions with good visibility. In other words, to overcome the problem of poor visibility caused by the application of a single set of SAR images, a combined use of the ascending and descending SAR images can provide a promising solution [39].
4.2. Influence of the Resolution of the Terrain DEM on the Terrain Visibility
It is known that the characteristics of the local terrain (i.e., slope and aspect) could be more accurately captured by the DEM with higher resolution. To analyze the influence of the resolution of the DEM (of the local terrain) on the terrain visibility, the SAR images acquired by the descending ENVISAT ASAR and four levels of resolution of the DEM (of Fengjie), as shown in Table 4, are studied in this parametric analysis. Figure 11 shows the terrain visibility evaluation results of the selected SAR images with the four levels of resolution of the DEM, and plotted in Figure 12a are the influences of the resolution of the DEM on the percentages of the areas with different levels of visibility.
As can be seen in Figure 11, the resulting boundaries between the areas (with different levels of visibility) could be more evident when a higher resolution DEM is used in the terrain visibility evaluation, implying that the regions along these boundaries may be more accurately assessed with a higher resolution DEM. Figure 12a illustrates that with the improvement of the resolution of the terrain DEM (i.e., from 250 m/pixel to 12.5 m/pixel), the percentage of the foreshortening regions (i.e., the visibility of which is medium) and that of the shadow regions (i.e., the visibility of which is poor) increase, whereas, the percentage of the area with good visibility and that of the layover regions (i.e., the visibility of which is poor) decrease. The difference in the terrain visibility evaluation results is most significant between the DEM with resolution of 30 m/pixel and that with resolution of 90 m/pixel. Note that a similar observation is derived in the previous studies of the terrain visibility of SAR images acquired by the ascending ERS-1/2 and ENVISAT [26], as shown in Figure 12b. That is to say, a higher resolution DEM should be preferred in the terrain visibility analysis, a higher resolution DEM is however more costly (see Table 4).
In consideration of the tradeoff between the cost of the terrain DEM and the accuracy of the visibility evaluation, the DEM with resolution of 30 m/pixel, which yields the best compromise solution between the aforementioned conflicting objectives, is recommended for the terrain visibility evaluation in Fengjie. For example, the visibility evaluation results obtained by the DEM with resolution of 12.5 m/pixel are close to those obtained by the DEM with resolution of 30 m/pixel, and there exist obvious differences between the evaluation results obtained by the DEM with resolution of 30 m/pixel and those obtained by the DEM with resolution of 90 m/pixel; however, the DEM with resolution of 12.5 m/pixel is more costly than that with resolution of 30 m/pixel (i.e., one is 1530 RMB while the other is free). In other words, the DEM with resolution of 30 m/pixel can yield a notable improvement of the terrain visibility evaluation without sacrifice of the cost, thus, the DEM with resolution of 30 m/pixel yields the best compromise solution between the terrain visibility evaluation accuracy and the cost efficiency.
5. Conclusions
The paper presented an improved R-index model for evaluating the terrain visibility of SAR images, in which a far layover coefficient that can help recognize the far passive layover regions in SAR images was incorporated into the calculation of the R-index. An illustrative application of the improved R-index to the terrain visibility analysis in Fengjie was conducted; and, comparative analyses were conducted to depict the advantages of the improved R-index model over the existing R-index models (and the P-NG method). Further, the effects of the orientation parameters of the satellite LOS and the resolution of the DEM (of the local terrain) on the terrain visibility were discussed. Based upon the results presented, the following conclusions are reached:
- (1)
- Compared to the existing R-index models, the improved R-index model is shown more effective in detecting the layover regions (i.e., the visibility of which is poor) in SAR images. With the aid of the improved R-index model, the error in the terrain visibility evaluation can be effectively reduced, allowing for a more informed selection of SAR images in the landslide monitoring in mountainous regions. Meanwhile, the improved R-index model might be more computational efficient than the P-NG method in the terrain visibility evaluation of large areas.
- (2)
- SAR images collected by the descending ALOS PALSAR could be more suitable for monitoring W-facing landslides in Fengjie, while those collected by the ascending ALOS PALSAR could be more suitable for monitoring E-facing landslides in Fengjie. A combined use of the ascending and descending SAR images provides a promising solution to overcome the problem of poor visibility caused by the application of a single set of SAR images.
- (3)
- With the improvement of the resolution of the DEM of the local terrain, the terrain visibility can be more accurately evaluated, thus a higher resolution DEM should be preferred in the terrain visibility evaluation of SAR images. In consideration of the tradeoff between the cost of the terrain DEM and the accuracy of the visibility evaluation, the DEM with resolution of 30 m/pixel, which could yield the best compromise solution in this tradeoff relationship, is recommended for the terrain visibility evaluation in Fengjie.
It must be noted that the improved R-index is formulated based on an assumption that the orientation parameters of the satellite LOS are taken as constant values, thus, there may exist errors in the terrain visibility evaluation results of SAR images. To overcome this limitation, it might be necessary to obtain the orientation of the satellite LOS at each position in the SAR images and then update the light source in the hillshade model, such a modification of the improved R-index may warrant further investigation.
Author Contributions
Conceptualization, W.G.; methodology, T.R.; software, J.C.; formal analysis, F.Z.; writing—original draft preparation, T.R.; writing—review and editing, W.G., V.M.B. and H.T.; project administration, H.T. and W.G.; funding acquisition, W.G. All authors have read and agreed to the published version of the manuscript.
Funding
This research was funded by the Major Program of National Natural Science Foundation of China (Grant No. 42090055), the National Natural Science Foundation of China (Grants No. 41977242 and No. 41702294), and the Fundamental Research Funds for the Central Universities, China University of Geosciences (Wuhan) (Grant No. CUGGC09) is acknowledged.
Acknowledgments
The SAR images acquired by the ENVISAT ASAR and Sentinel-1A were provided by the European Space Agency (ESA). The SAR images acquired by ALOS-PALSAR were provided by the Japan Aerospace Exploration Agency (JAXA).
Conflicts of Interest
The authors declare no conflict of interest.
References
- Gong, W.; Juang, C.H.; Wasowski, J. Geohazards and human settlements: Lessons learned from multiple relocation events in Badong, China–Engineering geologist’s perspective. Eng. Geol. 2021, 285, 106051. [Google Scholar] [CrossRef]
- Warrick, J.A.; Ritchie, A.C.; Schmidt, K.M.; Reid, M.E.; Logan, J. Characterizing the catastrophic 2017 Mud Creek landslide, California, using repeat structure-from-motion (SfM) photogrammetry. Landslides 2019, 16, 1201–1219. [Google Scholar] [CrossRef]
- Zhang, Z.; He, S.; Liu, W.; Liang, H.; Yan, S.; Deng, Y.; Bai, X.Q.; Chen, Z. Source characteristics and dynamics of the October 2018 Baige landslide revealed by broadband seismograms. Landslides 2019, 16, 777–785. [Google Scholar] [CrossRef]
- Fan, X.; Tang, J.; Tian, S.; Jiang, Y. Rainfall-induced rapid and long-runout catastrophic landslide on July 23, 2019 in Shuicheng, Guizhou, China. Landslides 2020, 17, 2161–2171. [Google Scholar] [CrossRef]
- Mansour, M.F.; Morgenstern, N.R.; Martin, C.D. Expected damage from displacement of slow-moving slides. Landslides 2011, 8, 117–131. [Google Scholar] [CrossRef]
- Massey, C.I.; Petley, D.N.; McSaveney, M.J. Patterns of movement in reactivated landslides. Eng. Geol. 2013, 159, 1–19. [Google Scholar] [CrossRef]
- Jiang, S.; Wen, B.P.; Zhao, C.; Li, R.D.; Li, Z.H. Kinematics of a giant slow-moving landslide in Northwest China: Constraints from high resolution remote sensing imagery and GPS monitoring. J. Asian Earth Sci. 2016, 123, 34–46. [Google Scholar] [CrossRef]
- Xin, P.; Liang, C.; Wu, S.; Liu, Z.; Shi, J.; Wang, T. Kinematic characteristics and dynamic mechanisms of large-scale landslides in a loess plateau: A case study for the north bank of the Baoji stream segment of the Wei River, China. Bull. Eng. Geol. Environ. 2016, 75, 659–671. [Google Scholar] [CrossRef]
- Martha, T.R.; Kerle, N.; Van Westen, C.J.; Jetten, V.; Kumar, K.V. Object-oriented analysis of multi-temporal panchromatic images for creation of historical landslide inventories. ISPRS J. Photogramm. Remote Sens. 2012, 67, 105–119. [Google Scholar] [CrossRef]
- Liao, M.; Tang, J.; Wang, T.; Balz, T.; Zhang, L. Landslide monitoring with high-resolution SAR data in the Three Gorges region. Sci. China Earth Sci. 2012, 55, 590–601. [Google Scholar] [CrossRef]
- Farina, P.; Colombo, D.; Fumagalli, A.; Marks, F.; Moretti, S. Permanent Scatterers for landslide investigations: Outcomes from the ESA-SLAM project. Eng. Geol. 2006, 88, 200–217. [Google Scholar] [CrossRef]
- Cascini, L.; Fornaro, G.; Peduto, D. Advanced low-and full-resolution DInSAR map generation for slow-moving landslide analysis at different scales. Eng. Geol. 2010, 112, 29–42. [Google Scholar] [CrossRef]
- Hilley, G.E.; Bürgmann, R.; Ferretti, A.; Novali, F.; Rocca, F. Dynamics of slow-moving landslides from permanent scatterer analysis. Science 2004, 304, 1952–1955. [Google Scholar] [CrossRef] [Green Version]
- Meisina, C.; Zucca, F.; Fossati, D.; Ceriani, M.; Allievi, J. Ground deformation monitoring by using the permanent scatterers technique: The example of the Oltrepo Pavese (Lombardia, Italy). Eng. Geol. 2006, 88, 240–259. [Google Scholar] [CrossRef]
- García-Davalillo, J.C.; Herrera, G.; Notti, D.; Strozzi, T.; Álvarez-Fernández, I. DInSAR analysis of ALOS PALSAR images for the assessment of very slow landslides: The Tena Valley case study. Landslides 2014, 11, 225–246. [Google Scholar] [CrossRef]
- Zhao, C.; Zhang, Q.; He, Y.; Peng, J.; Yang, C.; Kang, Y. Small-scale loess landslide monitoring with small baseline subsets interferometric synthetic aperture radar technique—case study of Xingyuan landslide, Shaanxi, China. J. Appl. Remote Sens. 2016, 10, 026030. [Google Scholar] [CrossRef] [Green Version]
- Chen, Q.; Cheng, H.; Yang, Y.; Liu, G.; Liu, L. Quantification of mass wasting volume associated with the giant landslide Daguangbao induced by the 2008 Wenchuan earthquake from persistent scatterer InSAR. Remote Sens. Environ. 2014, 152, 125–135. [Google Scholar] [CrossRef]
- Bayer, B.; Simoni, A.; Mulas, M.; Corsini, A.; Schmidt, D. Deformation responses of slow moving landslides to seasonal rainfall in the Northern Apennines, measured by InSAR. Geomorphology 2018, 308, 293–306. [Google Scholar] [CrossRef]
- Zhao, C.; Kang, Y.; Zhang, Q.; Lu, Z.; Li, B. Landslide identification and monitoring along the Jinsha River catchment (Wudongde reservoir area), China, using the InSAR method. Remote Sens. 2018, 10, 993. [Google Scholar] [CrossRef] [Green Version]
- Colesanti, C.; Wasowski, J. Investigating landslides with space-borne Synthetic Aperture Radar (SAR) interferometry. Eng. Geol. 2006, 88, 173–199. [Google Scholar] [CrossRef]
- Rees, W.G. Simple masks for shadowing and highlighting in SAR images. Int. J. Remote Sens. 2000, 21, 2145–2152. [Google Scholar] [CrossRef]
- Notti, D.; Davalillo, J.C.; Herrera, G.; Mora, O. Assessment of the performance of X-band satellite radar data for landslide mapping and monitoring: Upper Tena Valley case study. Nat. Hazards Earth Syst. Sci. 2010, 10, 1865–1875. [Google Scholar] [CrossRef]
- Notti, D.; Meisina, C.; Zucca, F.; Colombo, A. Models to predict Persistent Scatterers data distribution and their capacity to register movement along the slope. In Proceedings of the Fringe 2011 Workshop, Frascati, Italy, 19–23 September 2011; pp. 19–23. [Google Scholar]
- Cigna, F.; Bateson, L.; Jordan, C.; Dashwood, C. Feasibility of InSAR technologies for nationwide monitoring of geohazards in Great Britain. In Proceedings of the Remote Sensing and Photogrammetry Society Conference 2012, London, UK, 12–14 September 2012. [Google Scholar]
- Plank, S.; Singer, J.; Minet, C.; Thuro, K. Pre-survey suitability evaluation of the differential synthetic aperture radar interferometry method for landslide monitoring. Int. J. Remote Sens. 2012, 33, 6623–6637. [Google Scholar] [CrossRef]
- Cigna, F.; Bateson, L.B.; Jordan, C.J.; Dashwood, C. Simulating SAR geometric distortions and predicting Persistent Scatterer densities for ERS-1/2 and ENVISAT C-band SAR and InSAR applications: Nationwide feasibility assessment to monitor the landmass of Great Britain with SAR imagery. Remote Sens. Environ. 2014, 152, 441–466. [Google Scholar] [CrossRef] [Green Version]
- Notti, D.; Herrera, G.; Bianchini, S.; Meisina, C.; García-Davalillo, J.C.; Zucca, F. A methodology for improving landslide PSI data analysis. Int. J. Remote Sens. 2014, 35, 2186–2214. [Google Scholar] [CrossRef]
- Chen, X.; Sun, Q.; Hu, J. Generation of complete SAR geometric distortion maps based on DEM and neighbor gradient algorithm. Appl. Sci. 2018, 8, 2206. [Google Scholar] [CrossRef] [Green Version]
- Zhang, Y.; Meng, X.; Chen, G.; Qiao, L.; Zeng, R.; Chang, J. Detection of geohazards in the Bailong River Basin using synthetic aperture radar interferometry. Landslides 2016, 13, 1273–1284. [Google Scholar] [CrossRef]
- Vecchiotti, F.; Peduto, D.; Strozzi, T. Multi-sensor a priori PSI visibility map for nationwide landslide detection in Austria. In Workshop on World Landslide Forum; Springer: Cham, Switzerland, 2017; pp. 45–52. [Google Scholar]
- Novellino, A.; Cigna, F.; Brahmi, M.; Sowter, A.; Bateson, L.; Marsh, S. Assessing the feasibility of a national InSAR ground deformation map of Great Britain with Sentinel-1. Geosciences 2017, 7, 19. [Google Scholar] [CrossRef] [Green Version]
- Kropatsch, W.G.; Strobl, D. The generation of SAR layover and shadow maps from digital elevation models. IEEE Trans. Geosci. Remote Sens. 1990, 28, 98–107. [Google Scholar] [CrossRef]
- Zhang, Y. Detecting Ground Deformation and Investigating Landslides Using InSAR Technique-Taking Middle Reach of Bailong River Basin as an Example. Ph.D. Thesis, Lanzhou University, Lanzhou, China, 2018. [Google Scholar]
- Dai, K.; Li, Z.; Tomás, R.; Liu, G.; Yu, B.; Wang, X.; Cheng, H.; Chen, J.; Stockamp, J. Monitoring activity at the Daguangbao mega-landslide (China) using Sentinel-1 TOPS time series interferometry. Remote Sens. Environ. 2016, 186, 501–513. [Google Scholar] [CrossRef] [Green Version]
- Burrough, P.A.; McDonnell, R.A. Principles of Geographical Information Systems; Oxford University Press: HongKong, China, 1998. [Google Scholar]
- Wang, K.; Xu, H.; Zhang, S.; Wei, F.; Xie, W. Identification and Extraction of Geomorphological Features of Landslides Using Slope Units for Landslide Analysis. ISPRS Int. J. Geo-Inf. 2020, 9, 274. [Google Scholar] [CrossRef] [Green Version]
- Sun, D.; Wen, H.; Wang, D.; Xu, J. A random forest model of landslide susceptibility mapping based on hyperparameter optimization using Bayes algorithm. Geomorphology 2020, 362, 107201. [Google Scholar] [CrossRef]
- Guo, R.; Sumin, L.I.; Chen, Y.N.; Li, X.; Yuan, L. Identification and monitoring landslides in longitudinal range-gorge region with InSAR fusion integrated visibility analysis. Landslides 2020, 18, 551–568. [Google Scholar] [CrossRef]
- Pastor, J.L.; Tomás, R.; Lettieri, L.; Riquelme, A.; Cano, M.; Infante, D.; Ramondini, M.; Di Martire, D. Multi-Source data integration to investigate a deep-seated landslide affecting a bridge. Remote Sens. 2019, 11, 1878. [Google Scholar] [CrossRef] [Green Version]
Figure 1.
Geometric distortions in SAR images: (a) Foreshortening; (b) Layover; (c) Shadow.

Figure 2.
The geometrical bases of the R-index model: (a) The azimuth angle of satellite LOS and terrain aspect; (b) The geometric relationship between satellite position and local terrain.
Figure 2.
The geometrical bases of the R-index model: (a) The azimuth angle of satellite LOS and terrain aspect; (b) The geometric relationship between satellite position and local terrain.

Figure 3.
The geometrical bases of the hillshade model: (a) The shadow coefficient (Sh); (b) The layover coefficient (La); (c) The far passive layover coefficient (Fa).
Figure 3.
The geometrical bases of the hillshade model: (a) The shadow coefficient (Sh); (b) The layover coefficient (La); (c) The far passive layover coefficient (Fa).

Figure 4.
The information of the study area and SAR images: (a) Location of the study area and coverage areas of SAR images; (b) Historical landslides identified in Fengjie.
Figure 4.
The information of the study area and SAR images: (a) Location of the study area and coverage areas of SAR images; (b) Historical landslides identified in Fengjie.

Figure 5.
The terrain visibility evaluation results of the selected SAR images obtained from the original R-index model: (a) SAR images acquired by the descending ALOS PALSAR; (b) SAR images acquired by the ascending ALOS PALSAR; (c) SAR images acquired by the descending ENVISAT ASAR; (d) SAR images acquired by the ascending Sentinel-1A.

Figure 6.
The terrain visibility evaluation results of the selected SAR images obtained from the modified R-index model: (a) SAR images acquired by the descending ALOS PALSAR; (b) SAR images acquired by the ascending ALOS PALSAR; (c) SAR images acquired by the descending ENVISAT ASAR; (d) SAR images acquired by the ascending Sentinel-1A.

Figure 7.
The terrain visibility evaluation results of the selected SAR images obtained from the improved R-index model: (a) SAR images acquired by the descending ALOS PALSAR; (b) SAR images acquired by the ascending ALOS PALSAR; (c) SAR images acquired by the descending ENVISAT ASAR; (d) SAR images acquired by the ascending Sentinel-1A.

Figure 8.
The comparisons among the SAR intensity image and the terrain visibility evaluation results obtained from the three models: (a) Geocoded and multi-looked SAR intensity image (1:5 look factors) of the descending scenes of ENVISAT ASAR; (b) The terrain visibility evaluation result in an area of the SAR intensity image obtained from the original R-index model; (c) The terrain visibility evaluation result in the related area obtained from the modified R-index model; (d) The terrain visibility evaluation result in the related area obtained from the improved R-index model; (e) The true layover and shadow regions in the related area.

Figure 9.
The comparison between the improved R-index model and the P-NG method: (a) The geometric distortions in the SAR images obtained by the P-NG method; (b); The terrain visibility evaluation results in an area of the SAR images obtained by the improved R-index model; (c) The geometric distortions in the related area obtained by the P-NG method.

Figure 10.
The terrain aspect distribution of the areas with different levels of visibility in the selected SAR images of Fengjie: (a) Good visibility; (b) Medium visibility (foreshortening); (c) Poor visibility (layover); (d) Poor visibility (shadow).
Figure 10.
The terrain aspect distribution of the areas with different levels of visibility in the selected SAR images of Fengjie: (a) Good visibility; (b) Medium visibility (foreshortening); (c) Poor visibility (layover); (d) Poor visibility (shadow).

Figure 11.
The terrain visibility evaluation results of SAR images acquired by the descending ENVISAT ASAR with the four levels of resolution of the DEM: (a) 12.5 m/pixel ALOS DEM; (b) 30 m/pixel SRTM DEM; (c) 90 m/pixel SRTM DEM; (d) 250 m/pixel SRTM DEM.
Figure 11.
The terrain visibility evaluation results of SAR images acquired by the descending ENVISAT ASAR with the four levels of resolution of the DEM: (a) 12.5 m/pixel ALOS DEM; (b) 30 m/pixel SRTM DEM; (c) 90 m/pixel SRTM DEM; (d) 250 m/pixel SRTM DEM.

Figure 12.
The terrain visibility evaluation results versus the DEM resolutions: (a) The influence of the resolution of the DEM on the percentages of the areas with different levels of visibility; (b) The influence of the resolution of the DEM on the percentages of the areas with different levels of visibility in the ascending mode of ERS-1/2 and ENVISAT for the area of Lake and River Etive, Scotland (modified from [26]).


Table 1.
Orientation parameters of the satellite LOSs.
| SAR Satellite | Flight Direction | Radar Azimuth | Radar Incidence |
|---|---|---|---|
| ENVISAT ASAR | Descending | 285.00° | 22.25° |
| ALOS PALSAR | Ascending | 74.00° | 38.70° |
| ALOS PALSAR | Descending | 285.00° | 30.39° |
| Sentinel-1A | Ascending | 77.31° | 36.69° |
Table 2.
Statistical information of the visibility evaluation results of the selected SAR images obtained from the improved R-index model.
Table 2.
Statistical information of the visibility evaluation results of the selected SAR images obtained from the improved R-index model.
| Level of Visibility | Sentinel-1A (Ascending) | ENVISAT ASAR (Descending) | ALOS PALSAR (Ascending) | ALOS PALSAR (Descending) | ||||||||
|---|---|---|---|---|---|---|---|---|---|---|---|---|
| R-Index(im) | Area (km2) | Landslide Number | R-Index(im) | Area (km2) | Landslide Number | R-Index(im) | Area (km2) | Landslide Number | R-index(im) | Area (km2) | Landslide Number | |
| Good visibility | 0.60–1.00 | 1922.52 | 695 | 0.38–1.00 | 1992.89 | 801 | 0.63–1.00 | 1965.56 | 700 | 0.51–1.00 | 2127.06 | 844 |
| Medium visibility (foreshortening) | 0.00–0.60 | 1897.64 | 808 | 0.00–0.38 | 854.03 | 365 | 0.00–0.63 | 1915.06 | 813 | 0.00–0.51 | 1378.81 | 534 |
| Poor visibility (layover) | 0.00 | 261.96 | 44 | 0.00 | 1251.05 | 384 | 0.00 | 196.01 | 31 | 0.00 | 587.11 | 170 |
| Poor visibility (shadow) | 0.00 | 16.87 | 3 | 0.00 | 1.03 | 0 | 0.00 | 22.38 | 6 | 0.00 | 6.01 | 2 |
Table 3.
Statistical information of the visibility evaluation results of the selected SAR images obtained from the existing R-index models.
Table 3.
Statistical information of the visibility evaluation results of the selected SAR images obtained from the existing R-index models.
| Level of Visibility | Sentinel-1A (Ascending) | ENVISAT ASAR (Descending) | ALOS PALSAR (Ascending) | ALOS PALSAR (Descending) | |||||||||
|---|---|---|---|---|---|---|---|---|---|---|---|---|---|
| R-Index | Area (km2) | Landslide Number | R-Index | Area (km2) | Landslide Number | R-Index | Area (km2) | Landslide Number | R-Index | Area (km2) | Landslide Number | ||
| The original R-index model | Good visibility | 0.60–1.00 | 1950.22 | 702 | 0.38–1.00 | 2166.59 | 849 | 0.63–1.00 | 1993.50 | 704 | 0.51–1.00 | 2168.53 | 852 |
| Medium visibility (foreshortening) | 0.00–0.60 | 2075.08 | 837 | 0.00–0.38 | 1454.02 | 562 | 0.00–0.63 | 2051.90 | 840 | 0.00–0.51 | 1733.87 | 651 | |
| Poor visibility (layover) | ≤0.00 | 73.70 | 11 | ≤0.00 | 478.39 | 139 | ≤0.00 | 53.59 | 6 | ≤0.00 | 196.60 | 47 | |
| Poor visibility (shadow) | - | - | - | - | - | - | - | - | - | - | - | - | |
| The modified R-index model | Good visibility | 0.60–1.00 | 1927.33 | 695 | 0.38–1.00 | 2078.22 | 809 | 0.63–1.00 | 1968.16 | 700 | 0.51–1.00 | 2144.19 | 844 |
| Medium visibility (foreshortening) | 0.00–0.60 | 1972.43 | 823 | 0.00–0.38 | 1123.80 | 419 | 0.00–0.63 | 1981.48 | 825 | 0.00–0.51 | 1543.45 | 583 | |
| Poor visibility (layover) | ≤0.00 | 182.37 | 29 | ≤0.00 | 895.96 | 322 | ≤0.00 | 126.98 | 19 | ≤0.00 | 405.35 | 121 | |
| Poor visibility (shadow) | 0.00 | 16.87 | 3 | 0.00 | 1.03 | 0 | 0.00 | 22.38 | 6 | 0.00 | 6.01 | 2 | |
Table 4.
Sources and resolutions of the DEMs of Fengjie.
| Data Type | Source of Data | Resolution (m/pixel) | Cost | Area/Range |
|---|---|---|---|---|
| ALOS PALSAR DEM | http://www.tuxingis.com, accessed on 26 April 2021 | 12.5 | 1530 RMB | 82370 km2 |
| SRTM DEM Version 2 | https://data.nasa.gov, accessed on 26 April 2021 | 30 | Free | 21176 km2 |
| SRTM DEM Version 4 | https://srtm.csi.cgiar.org, accessed on 26 April 2021 | 90 | Free | 57315 km2 |
| Resampled SRTM DEM | https://srtm.csi.cgiar.org, accessed on 26 April 2021 | 250 | Free | Global Earth |
Publisher’s Note: MDPI stays neutral with regard to jurisdictional claims in published maps and institutional affiliations. |
© 2021 by the authors. Licensee MDPI, Basel, Switzerland. This article is an open access article distributed under the terms and conditions of the Creative Commons Attribution (CC BY) license (https://creativecommons.org/licenses/by/4.0/).
Share and Cite
MDPI and ACS Style
Ren, T.; Gong, W.; Bowa, V.M.; Tang, H.; Chen, J.; Zhao, F. An Improved R-Index Model for Terrain Visibility Analysis for Landslide Monitoring with InSAR. Remote Sens. 2021, 13, 1938. https://0-doi-org.brum.beds.ac.uk/10.3390/rs13101938
AMA Style
Ren T, Gong W, Bowa VM, Tang H, Chen J, Zhao F. An Improved R-Index Model for Terrain Visibility Analysis for Landslide Monitoring with InSAR. Remote Sensing. 2021; 13(10):1938. https://0-doi-org.brum.beds.ac.uk/10.3390/rs13101938
Chicago/Turabian StyleRen, Tianhe, Wenping Gong, Victor Mwango Bowa, Huiming Tang, Jun Chen, and Fumeng Zhao. 2021. "An Improved R-Index Model for Terrain Visibility Analysis for Landslide Monitoring with InSAR" Remote Sensing 13, no. 10: 1938. https://0-doi-org.brum.beds.ac.uk/10.3390/rs13101938
Note that from the first issue of 2016, this journal uses article numbers instead of page numbers. See further details here.