1. Introduction
Unlike optical satellites, synthetic aperture radar (SAR) satellites work in all weather conditions thanks to active data collection. They are widely used in marine monitoring and are the main remote sensing means for large-scale maritime ship target detection. Marine ship target detection can monitor maritime traffic, maintain maritime rights and interests, and improve the early warning capabilities of coastal defenses [
1,
2,
3]. Therefore, high precision positioning of ship targets is required. The traditional image information acquisition process involves four main steps: data acquisition, data download, ground centralized processing, and information extraction. This process can be slow, and the longer the time from when the satellite generates the data to when information is extracted on the ground, the less useful that data will be. It is necessary to migrate the processing and information extraction algorithms from the ground to the on-board computing platform in order to make full use of the limited transmission bandwidth and satellite transmission time to shorten the time delay in information acquisition. This migration would also reduce the load on the satellite-ground data transmission system [
4,
5,
6].
Many satellites have the capability of on-board processing of remote sensing data. The Earth Observation-1 launched by NASA’s New Millennium Program in November of 2000 has on-board processing capabilities that include emergency monitoring, feature monitoring, change monitoring, and anomaly monitoring. In October 2001, DigitalGlobe launched the QuickBird satellite, which was the highest resolution commercial satellite to date and it can produce multiple types of images and perform remote sensing image preprocessing and real-time multispectral classification on-board. The NEMO satellite, launched by the US, is equipped with COIS coast imaging spectrometer and adaptive spectrum identification system ORASIS and it can generate and directly download coastal description information [
7]. On-board processing is usually implemented by Digital Signal Processor and Field-Programmable Gate Array; however, due to their poor scalability, implementing new algorithms is difficult, which restricts them from meeting the diverse needs of intelligent on-board processing. However, with rapid advancements in computing hardware, such as the advent of embedded Graphic Processing Units (GPUs) with low power consumption, strong performance, and high integration, new solutions for on-board real-time processing have been made available [
8], such as NVIDIA Jetson TX1 and TX2.
In the past few years, researchers have proposed many traditional ship detection methods utilizing SAR imagery [
9,
10,
11,
12]. Gao et al. [
9] proposed an adaptive and fast CFAR algorithm that was based on automatic censoring (AC), and the combination of AC with the algorithm resulted in good performance. Huang et al. [
10] used a new ship detection approach based on multi-scale heterogeneities under the a contrario decision framework, this method proved to be suitable for ships of different sizes. Ji et al. [
11] used the K-distribution CFAR method to calculate a global threshold with a given false-alarm rate, then mathematical morphological filters are applied to the results; this approach greatly improved the processing speed. Ai et al. [
12] proposed an algorithm for ship target gray distributions based on correlations, and then the joint gray distribution models of pixels and adjacent pixels in clutter are established using the two-dimensional joint lognormal distribution. However, these methods are dependent on the pre-classification and pre-definition of features by humans, and they may be less robust in complex backgrounds. Furthermore, no on-board traditional method for real-time SAR processing has been verified.
With the development of computer vision, deep learning has gradually been applied to ship detection from SAR imagery. Target detectors that are based on deep learning can be divided into two categories. The first type of target detectors are based on region recommendations, such as Region-based Convolutional Networks (R-CNN) [
13], Spatial Pyramid Pooling Network (SPP-NET) [
14], Fast R-CNN [
15], and Faster R-CNN [
16]. This type of detector first uses regional recommendations to generate candidate targets, and then uses the convolution neural network for processing. Its accuracy is high, but it does not meet the requirements for real-time processing. The second type of target detectors are regression-based, such as You Only Look Once (YOLO) [
17,
18,
19], Single Shot Multibox Detector (SSD) [
20], etc. These methods treat the detection problem as a regression and directly predict target positions and categories. This type of detector has a fast processing speed, but low accuracy. Cui et al. [
2] applied R-CNN to large scene SAR target recognition, which can detect objects while recognizing their classes thanks to its regression method and the sharing network structure. Wang et al. [
21] used RetinaNet with feature pyramid networks (FPN) and focal loss to detect ships, and achieved high accuracy multi-scale ship detection. Kang et al. [
22] used the Faster R-CNN method to conduct the initial ship detection and then applied CFAR to obtain the final results.
The challenge of on-board ship detection of lightweight SAR satellite is to achieve the accurate and efficient detection of targets under the constraints of the limited memory and computing power of the satellite processing platform. Most of the ship detection methods use high-power GPUs on the ground to detect ships, and these network models are always large in size and complex computations. However, the special hardware used for lightweight satellites is different from the mature technology available in ground data centers. Therefore, these highly complex network models cannot be used to complete real-time detection missions with the limited on-board memory and computing power.
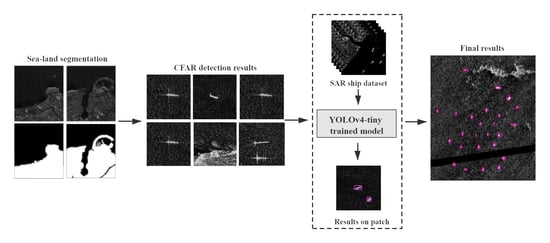
To solve the above problem, we propose an on-board ship detection scheme that combines the traditional CFAR algorithm and lightweight deep learning to achieve efficient on-board ship detection. Firstly, this method is based on geographic prior experience and regional growth methods to realize sea-land segmentation. Sea-land segmentation can reduce the interference of the land and improve detection efficiency. Secondly, the K-distribution is used to model sea clutter in images, and the CFAR algorithm is used for fast rough detection. Subsequently, the initial detection results are used as input for the YOLOv4-tiny network to refine the detection results. Finally, through a reasonable hardware acceleration strategy, the entire algorithm was ported into a Jetson TX1 GPU and achieved an acceptable algorithm speed. This method only uses the preliminary extraction results as the input for the YOLOv4-tiny network, which greatly reduces the computation power required. The main difference between our method and the vast majority of the SAR automatic target recognition approaches is that we consider an end-to-end workflow, in which manually extracting samples for target classification is not required. In addition, our algorithm can directly generate the category probability and position coordinate value of the object, and obtain the final detection result after a single detection, so it has a faster detection speed. When combined with the hardware acceleration strategy, our method achieved high accuracy and efficiency on the ground verification platform. The main contributions of this paper are as follows:
- 1.
In order to eliminate the influence of land, we first remove the land from the image, which greatly reduces the computation load of the algorithm. Subsequently, we use the CFAR algorithm that is based on K-distribution to extract ship targets.
- 2.
We input the CFAR detection results into the YOLOv4-tiny network for further ship detection using its efficient global context information extraction capability.
- 3.
We combine each part of the algorithm organically in the Jetson TX1 platform. Through a reasonable hardware acceleration strategy, we reduce the running time of our algorithm. Additionally, our method was validated on the HISEA-1 satellite.
The organization of this paper is as follows.
Section 2 relates to the details of our proposed ship detection algorithm, including the CFAR algorithm and YOLOv4-tiny.
Section 3 introduces the satellite computing platform and the construction of the ground verification system.
Section 4 reports on the experiments.
Section 5 and
Section 6 present our discussion and conclusion.
2. Methods of On-Board Ship Detection
Because of the limitations of the GPU’s memory, the original large-scale SAR remote sensing images should be broken into image patches before target detection. Because of the large-size of the original image, the number of image patches will be relatively large, which will not only take up the limited storage, but it will also result in the model processing many empty image blocks. This is why this paper proposed an on-board ship detection scheme based on the CFAR algorithm and deep learning. Using the CFAR method before deep learning, target recognition can significantly reduce the number of image patches submitted to deep learning detection. Because of the high complexity of the deep learning algorithm, the processing time will increase with an increased number of target patches. Therefore, the first extracting targets using CFAR will greatly reduce the computations that are required by deep learning. Our experimental results showed that using the CFAR method before deep learning reduced the computational time by more than half when compared to using only the deep learning method. First, the image is categorized as either sea or land, and if it is includes the coast, it will be divided by sea and land. This is done to prevent land features from affecting the detection of ships. Subsequently, the CFAR algorithm is used for an initial quick and rough ship detection, and any detected targets are stored as 256 × 256 pixels image patches. The resulting image patches are input into the trained and lightweight deep learning model for further detection to obtain a more accurate final ship detection. Finally, the targets are mapped on the original image to obtain its pixel coordinates, the latitude and longitude coordinates of the four corners of the original image are used to determine the targets actual location using the bilinear interpolation method, and then this effective information is transmitted through the satellite-earth data transmission system.
Figure 1 shows the process of on-board ship detection.
2.1. Sea-Land Segmentation
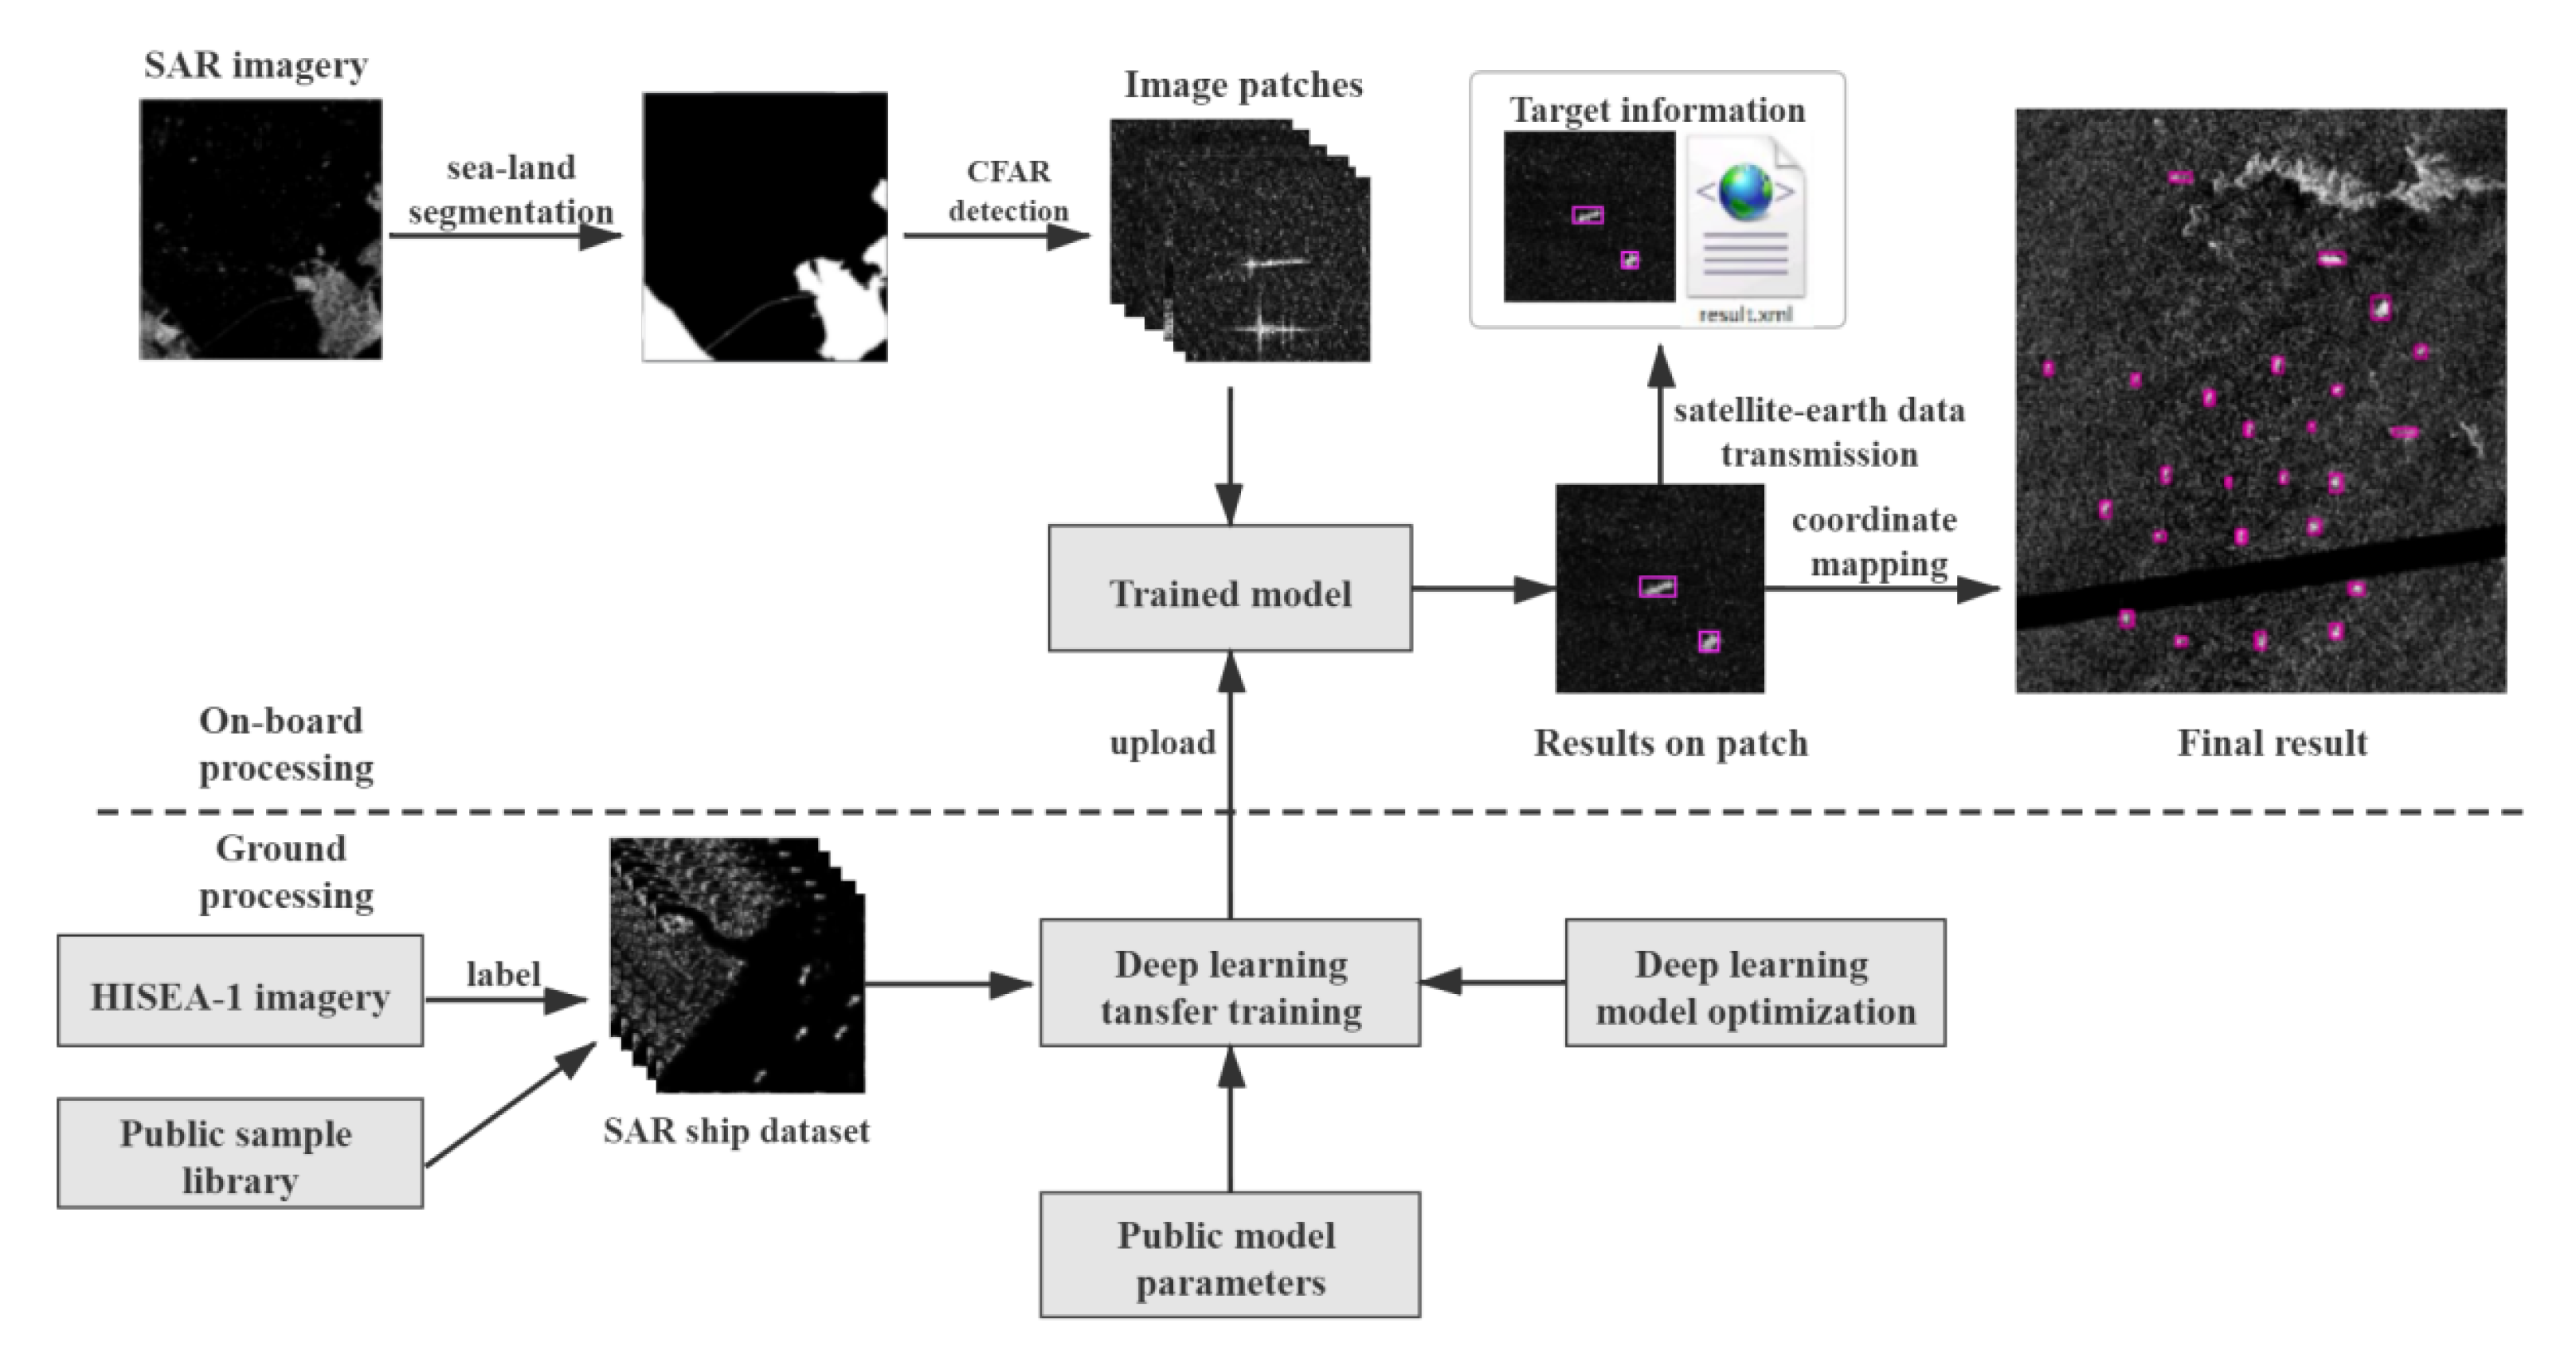
During ship detection, land area is not of interest, but the SAR images that are used commonly include both land and sea. The purpose of sea-land segmentation is to mask or remove the land area from the SAR images, so that the detection algorithm only processes the sea area and ignores the land [
23]. This is particularly important, because many land objects appear in SAR images as strong scatterers that are similar to ships at sea. These land objects will produce false alarms and waste processing power that should be focused on the detection of ships. Therefore, effective sea-land segmentation can limit the detection range to sea areas, thereby improving the detection efficiency and accuracy.
This paper first adopted a method in which geographic prior information (coastline vector data) is superimposed on SAR images using a vector layer, and the polygon vector elements in the vector layer are then used to determine whether the image is of the sea, land, or sea-land junction. The region growing method is then used for sea-land segmentation.
2.1.1. Judgment on Land and Sea
In this part, using the latitudes and longitudes of the four corners of the image, the global coastline vector data are superimposed to determine the position of the image. Because every polygon on the vector layer corresponds to a piece of land, the problem of judging whether corner points of the SAR image are sea or land is converted to a problem of whether the points on the vector layer are in the polygons designated as land. The problem of determining whether a point is in a polygon in the vector layer is carried out according to the graphics algorithm [
24]; where, the time complexity of the algorithm is O(n) and n is the number of polygonal line segments. Because of the large size of the acquired images and the requirements for efficiency, only the four corner points of the image are used to obtain the approximate position of the image.
2.1.2. Sea-Land Segmentation Based on Region Growth
Region growth is an image segmentation method that is based on image gray-scale similarity, neighborhood information, etc., with the basic goal of grouping pixels with similar properties to form regions [
25]. Segmentation that is based on region growth has two key elements: one is to select the seed point of the image to be segmented and the other is to establish the range of pixel intensity contained in the region. Once there is a seed and a range, the area will grow from the seed point. When there are no more pixels that meet the conditions, the algorithm stops. T is the given threshold, so the seed growth criterion is expressed by Equation (
1), as:
where,
y(
i,
j) is the gray value of the pixel to be determined; and,
is the average intensity of the growth area R of the seed pixel.
The selection of seed points is based on the results of the land and sea judgment. If a corner point is judged to be land, then that pixel point is used as the seed for regional growth. Compared with the ocean area, the land area in the SAR image exhibits strong scattering and it has a higher gray value. The gray value is used as the threshold value and the sea and land area can then be separated through regional growth.
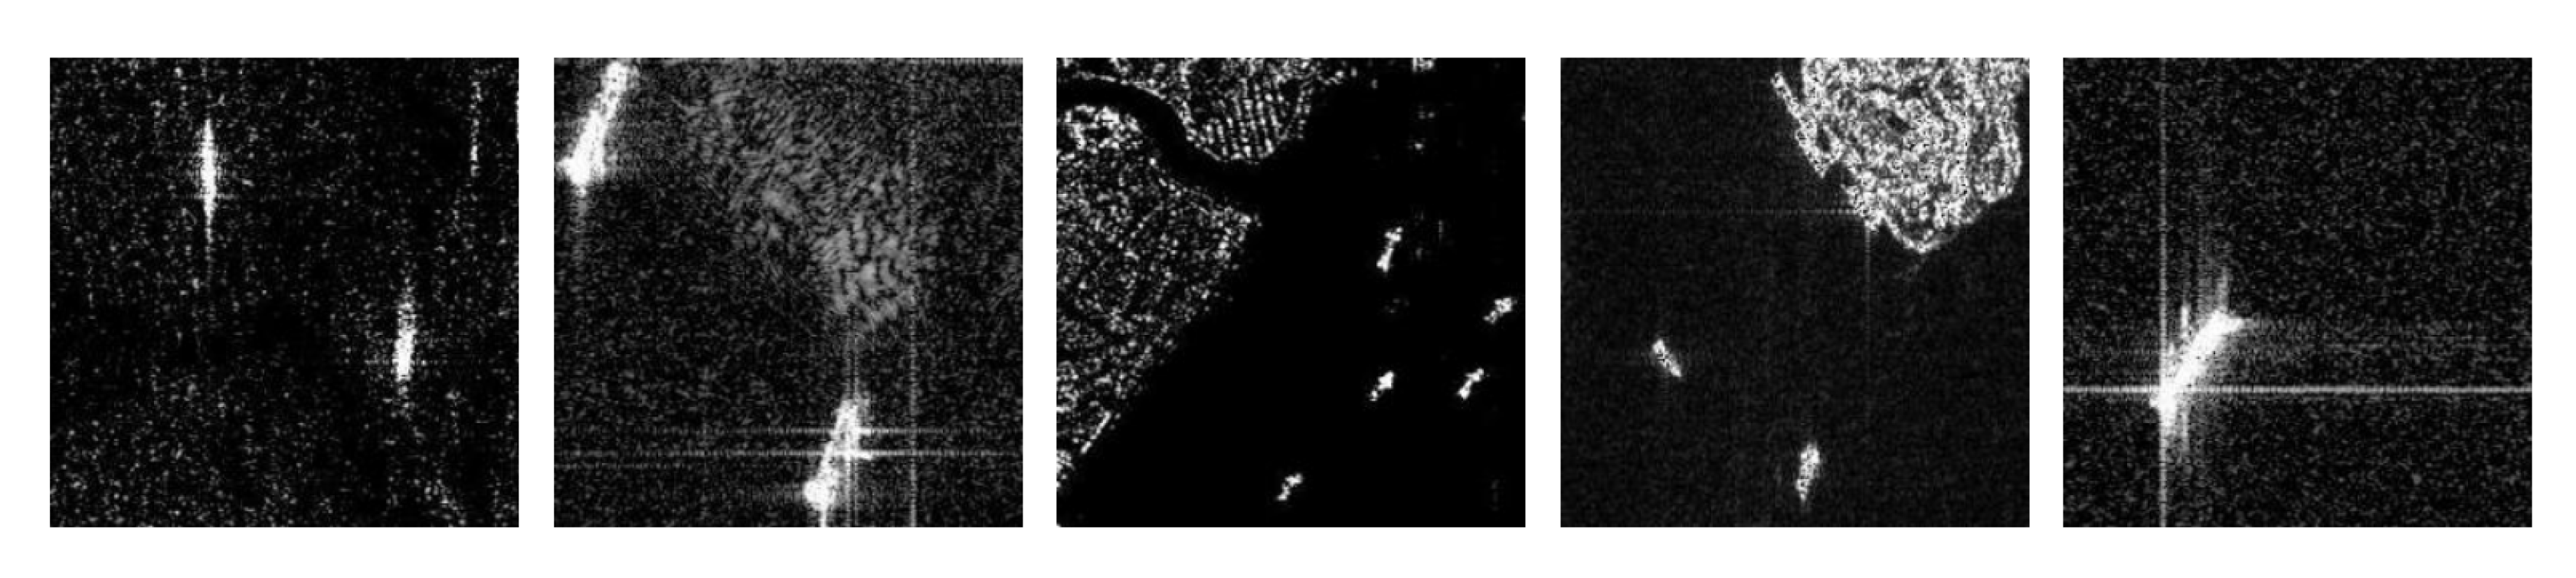
Figure 2 shows exxamples of sea–land segmentation.
2.2. CFAR Detector Based on K-Distribution
When considering the large scale of the original image, recognition speed using only the deep learning model will be relatively slow. Therefore, this paper proposed using CFAR to perform the initial ship detection, the results of which are then used as the input for the YOLO method to obtain the final, more accurate, detection results. The initial ship detection results are stored as sub-images that are suitable for neural network recognition, and then input into the YOLO model to obtain accurate detection results.
The false alarm rate is the probability that the detector will misjudge noise or other interference signals as valid target signals in a given unit of time. By setting a constant false alarm rate, stable target detection results can be obtained during signal detection. It is necessary to carry out statistical analyses of the characteristics of sea clutter to accurately model background sea clutter in order to obtain a constant false alarm effect under different sea and environmental conditions. For this reason, different clutter distribution models have been proposed, including the Rayleigh, Lognor-mal, Weibull,
-steady distribution,
distribution [
26], and K-distribution [
27] models, among which the K-distribution is the most commonly used statistical model. It not only accurately matches the clutter amplitude distribution over a wide range, but also accurately simulates the correlations between clutter echo pulses. As such, it has become a classic model for describing sea clutter.
2.2.1. Parameter Estimation on K-Distribution Model
The probability statistical model of the K-distribution [
28] is as follows:
where,
(·) is the Gamma function; K
(·) is the second type modified Bessel function of order
v-1; a is the scale parameter; and,
v is the shape parameter. For most sea clutter, the shape parameter values range is 0.1 <
v <
∞. When
v→
∞, the distribution of the clutter is close to the Rayleigh distribution.
Subsequently, we chose the statistical estimation method to estimate the parameters. From the K-distribution model expression, the r-moment of the K-distribution can be obtained, as shown in Equation (
3):
According to the properties of the Gamma function presented in Equation (
4), we can obtain Equation (
5).
It can be seen from Equation (
5) that the moment estimation method only requires that multiple
groups be calculated. For sea clutter samples
, the k-order sample moment of the K-distribution is expressed by Equation (
6):
Random sample moments are used instead of overall moments and an inverse transformation is performed to obtain the scale parameter a and shape parameter v.
2.2.2. CFAR Ship Detection Based on the K-Distribution
The CFAR algorithm determines the threshold based on the statistically determined characteristics of the image pixels. The basic principle is that, for each pixel , a certain reference window around it is defined and threshold is determined based on the characteristics of the pixels in the window. Target detection can be achieved by comparing the value of the pixel with the value of the threshold. The sea background statistical model uses the K-distribution, and the specific process is as follows:
- (1)
The scale parameter a and shape parameter v of the K-distribution are calculated using Equations (3)–(5).
- (2)
The parameter estimations are used in Equation (
1) to obtain the probability density function that is used to solve Equation (
7) for
, as follows:
where,
is the false alarm rate.
- (3)
According to the detection threshold
obtained by Equation (
7), we can determine whether the pixel
to be detected in the target window is a target pixel based on Equation (
8):
if the equation is satisfied, then it is categorized as a target; otherwise, it is categorized as background.
2.3. Ship Detection Based on the YOLOv4-Tiny Network
Traditional deep learning models have the disadvantages of involving many parameters and being very large. Applications in various fields have shown that YOLO is better at generalization than R-CNN. We constructed a YOLOv4-tiny-based [
29] training convolutional neural network to obtain the final ship detection results in order to achieve real-time and efficient detection of ship targets, while, at the same time, considering model size and subsequent model injection through the satellite-earth data transmission system. The model was only 22.4 MB, which would satisfy the mission requirements for on-board real-time detection.
2.3.1. Architecture of the YOLOv4-Tiny Network
YOLO is an algorithm that integrates target area and target category predictions into a single neural network. First, the images are divided into grids with sizes S × S, where each grid cell is responsible for the detection of the object that is centered in that cell. The predicted confidence scores indicate the accuracy of the prediction results for each grid cell. If there is no object in the cell, the confidence score is zero. Otherwise, the confidence score is equal to the intersection over union (IoU) between the ground truth and prediction box [
18]. We used a confidence score threshold to determine whether the predicted bounding boxes should be retained.
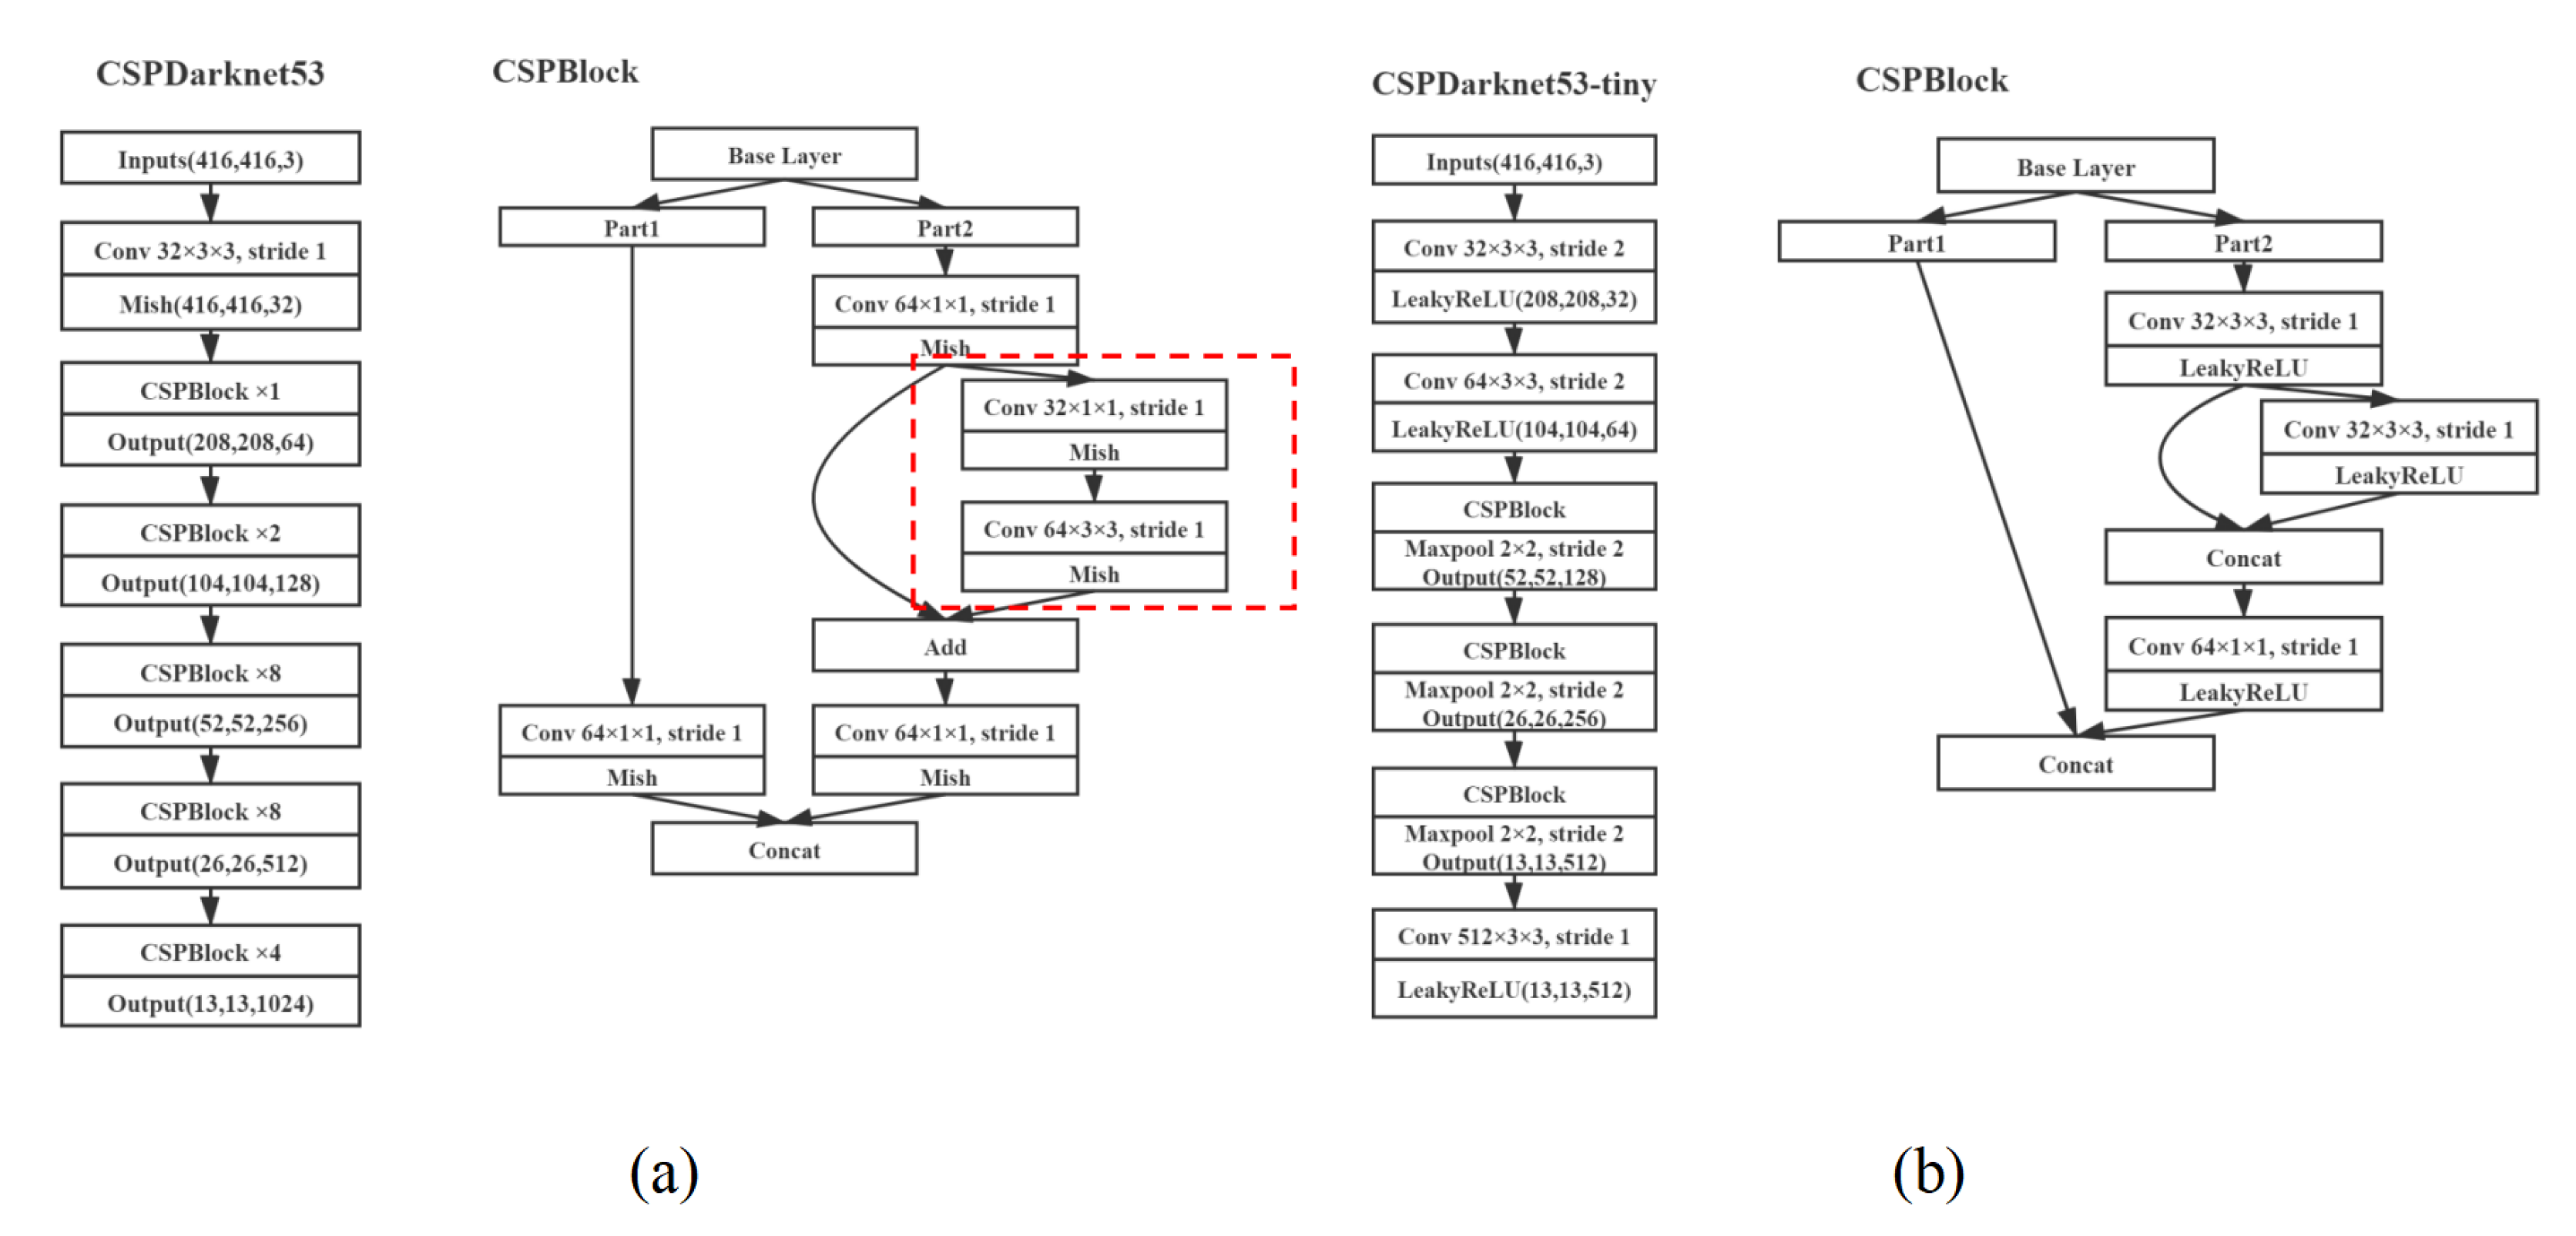
The CSPDarknet53-tiny network is a simplified version of CSPDarknet53, and it uses the CSPBlock module instead of the ResBlock module. The CSPBlock module can enhance the learning ability of convolution network comparing with ResBlock module. At the same time, it improves the inference speed and accuracy of the YOLOv4-tiny method.
The building blocks of CSPDarknet53 can be divided into two groups: the convolutional building block and the five CSPBlock modules. The convolutional building block contains a convolutional (Conv) layer with a kernel size of 3, a stride of 1, and a Mish layer. The CSPBlocks divide the feature map of the base layer into two parts, and then merges them through a cross-phase hierarchy, as shown in
Figure 3a. In this way, the gradient flow can propagate through different network paths after being separated [
30]. The five CSPBlock modules are repeatedly stacked by the two Conv layers in the red box in
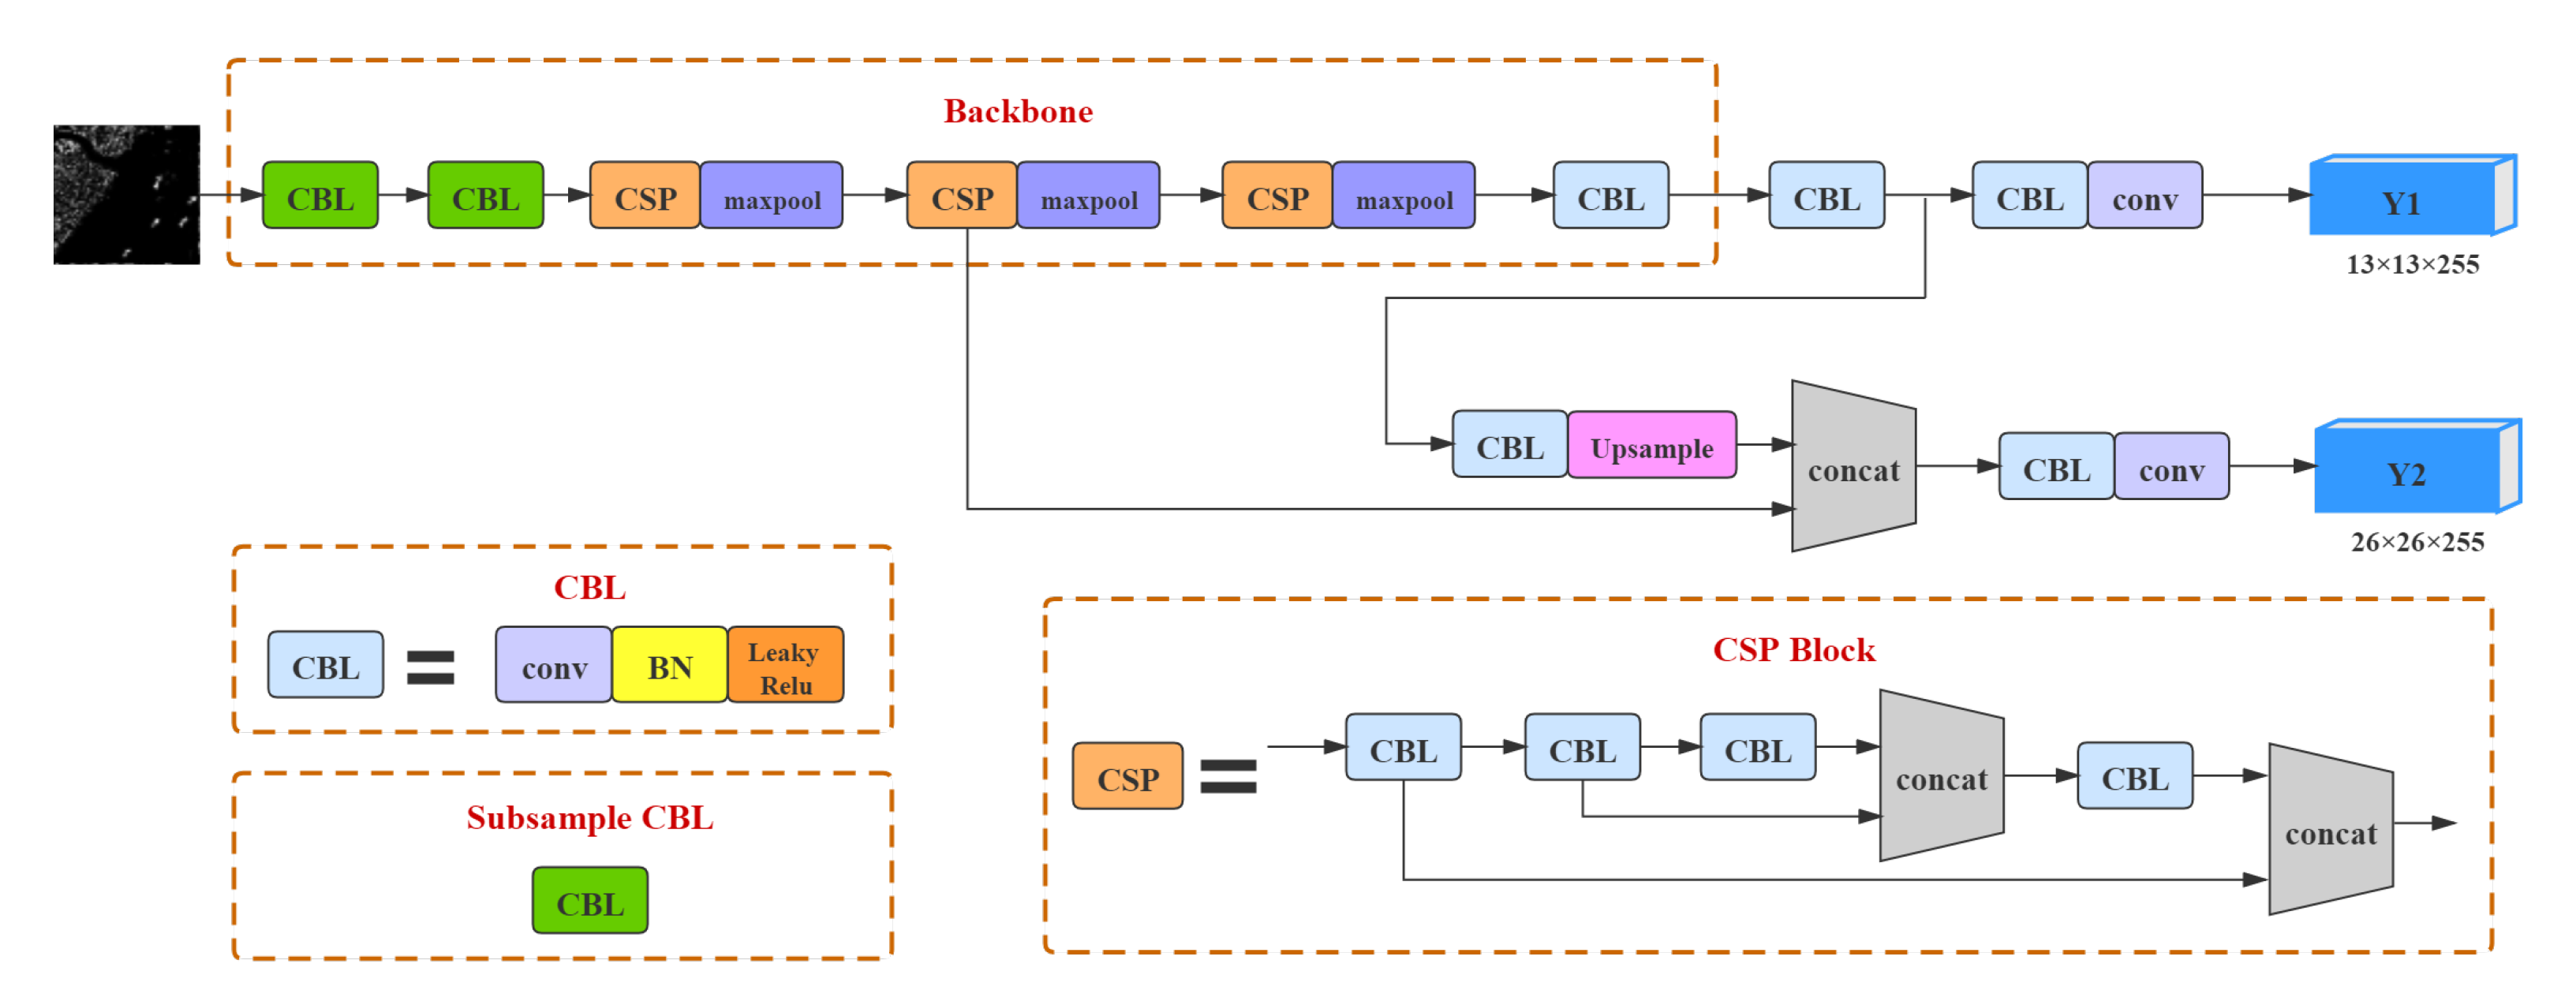
Figure 3. The numbers of stacked Conv layers are 1, 2, 8, 8, and 4, respectively. The first Conv layer has a kernel size of 3 and a stride of 2, and the second Conv layer has a kernel size of 3, and a stride of 1. YOLOv4-tiny is designed based on YOLOv4, but it prioritizes faster object detection speeds. YOLOv4-tiny uses the CSPDarknet53-tiny network as its backbone network, it’s network structure is shown in
Figure 4.
CSPDarknet53-tiny consists of three Conv layers and three CSPBlock modules. Specifically, there is a Conv layer and LeakyReLU layer in the first two Conv layers, and each Conv layer has a kernel size of 3 and a stride of 2. The last Conv layer has kernel size of 3 and a stride of 1. CSPDarknet53-tiny uses the LeakyReLU function as the activation function in place of the Mish activation function, which simplifies the calculation process.
The YOLOv4-tiny uses two different scales feature maps that are 13 × 13 and 26 × 26 to predict the detection results. At the same time, each feature map uses three anchor boxes of different sizes to predict three bounding boxes, and k-means clustering is used in advance to pre-define the number of anchor boxes, and there is a total of six pre-defined boxes for the three scales.
2.3.2. Loss Function
The loss function of YOLOv4-tiny contains three parts and can be expressed as follows:
where,
lbox,
lobj, and
lcls are confidence bounding box regression loss, classification loss, and confidence loss functions, respectively.
YOLOv4-tiny uses complete intersection over union (CIoU) loss instead of Mean Square Error (MSE) loss, which takes the three geometric factors of the two detection boxes into account, namely their overlapping area, the distance between their center points, and their aspect ratios. Accordingly, the bounding box regression loss function is:
where,
IoU is the intersection over union between the truth bounding box and predicted bounding box;
b is the coordinate of the center point of the predicted bounding box;
is the center point coordinates of the real bounding box;
is the calculation of Euclidean distance;
c is the diagonal distance of the box that can contain the predicted and truth bounding boxes;
and
are the width and height of the truth bounding box; and,
w and
h are the width and height of the predicted bounding box.
The confidence loss function is:
where,
is the grid size;
B is the number of bounding boxes in a grid;
is a function of the object, if the
jth bounding box of the
ith grid is responsible for detecting the current object,
, otherwise
;
and
are the confidence scores of the predicted and truth boxes, respectively.
The classification loss function is:
where,
and
are the predicted probability and true probability that the object belongs to
c classification in the
jth bounding box of the
ith grid.
The detection results will produce a large number of overlapping detection bounding boxes. Based on traditional Non-Maximum Suppression (NMS), distance intersection over union non-maximum suppression (DIoU-NMS) is used to resolve problems when the bounding boxes do not overlap, using the distances between the center points of the bounding boxes to do so. We chose 0.4 as the threshold for DIoU-NMS in this article.
3. Satellite Ground Verification System and Algorithm Hardware Acceleration Strategy
3.1. Algorithm Hardware Adaptation and Acceleration Strategy
We used the Jeston TX1 as the on-board development board in order to realize on-board ship detection. The embedded vision computer system Jetson TX1, which was developed by NVIDIA integrates an ARM Cortex-A57 Central Processing Unit (CPU) and a 256-core NVIDIA Maxwell architecture GPU, can realize trillions of floating-point operations per second on Linux systems and is very suitable for artificial intelligence calculations. At the same time, its small size, low power consumption, and high integration make it suitable for real-time on-board satellite processing.
In order to give full play to the computing power of the Jeston TX1 hardware, we fully analyzed the algorithm principles and assigned each module to the appropriate hardware to maximize the calculation efficiency. Specifically, due to the large number of logic operations required by the sea-land segmentation and CFAR algorithms, which belong to the serial logic flow algorithm, they are designated to the CPU, which has superior serial computing power. For the YOLOv4-tiny network, a large number of matrix convolution operations are involved with floating point type data. For these operations, the GPU can provide better throughput, albeit with the cost of a delay. Taking full advantage of the multi-core, the GPU is much better than the CPU in parallel computing and floating-point computing efficiency. Therefore, we assigned the YOLOv4-tiny network to the GPU.
In addition, in order to prevent the time taken to transfer data between the CPU and GPU from affecting the overall performance of the program, we made the calculation workload of the GPU far greater than the workload of copying and transferring data so that it does not copy and transfer frequently. This can reduce the proportion of time that is spent copying and transmitting data relative to the total time consumed, which will reduce its effect on overall performance. At the same time, when multiple threads are ongoing on the CPU, one thread can be in the process of copying while the other thread is performing calculations. In this way, calculations and copying can be performed simultaneously to reduce the calculation time. Finally, using the stream mechanism of the CUDA GPU, in asynchronous mode, when one stream is copying the other is calculating.
3.2. Composition of Ground Verification System
We constructed a ground verification system for testing before porting it into the satellite to verify the feasibility of our scheme. All of our experiments were carried out in this simulated environment.
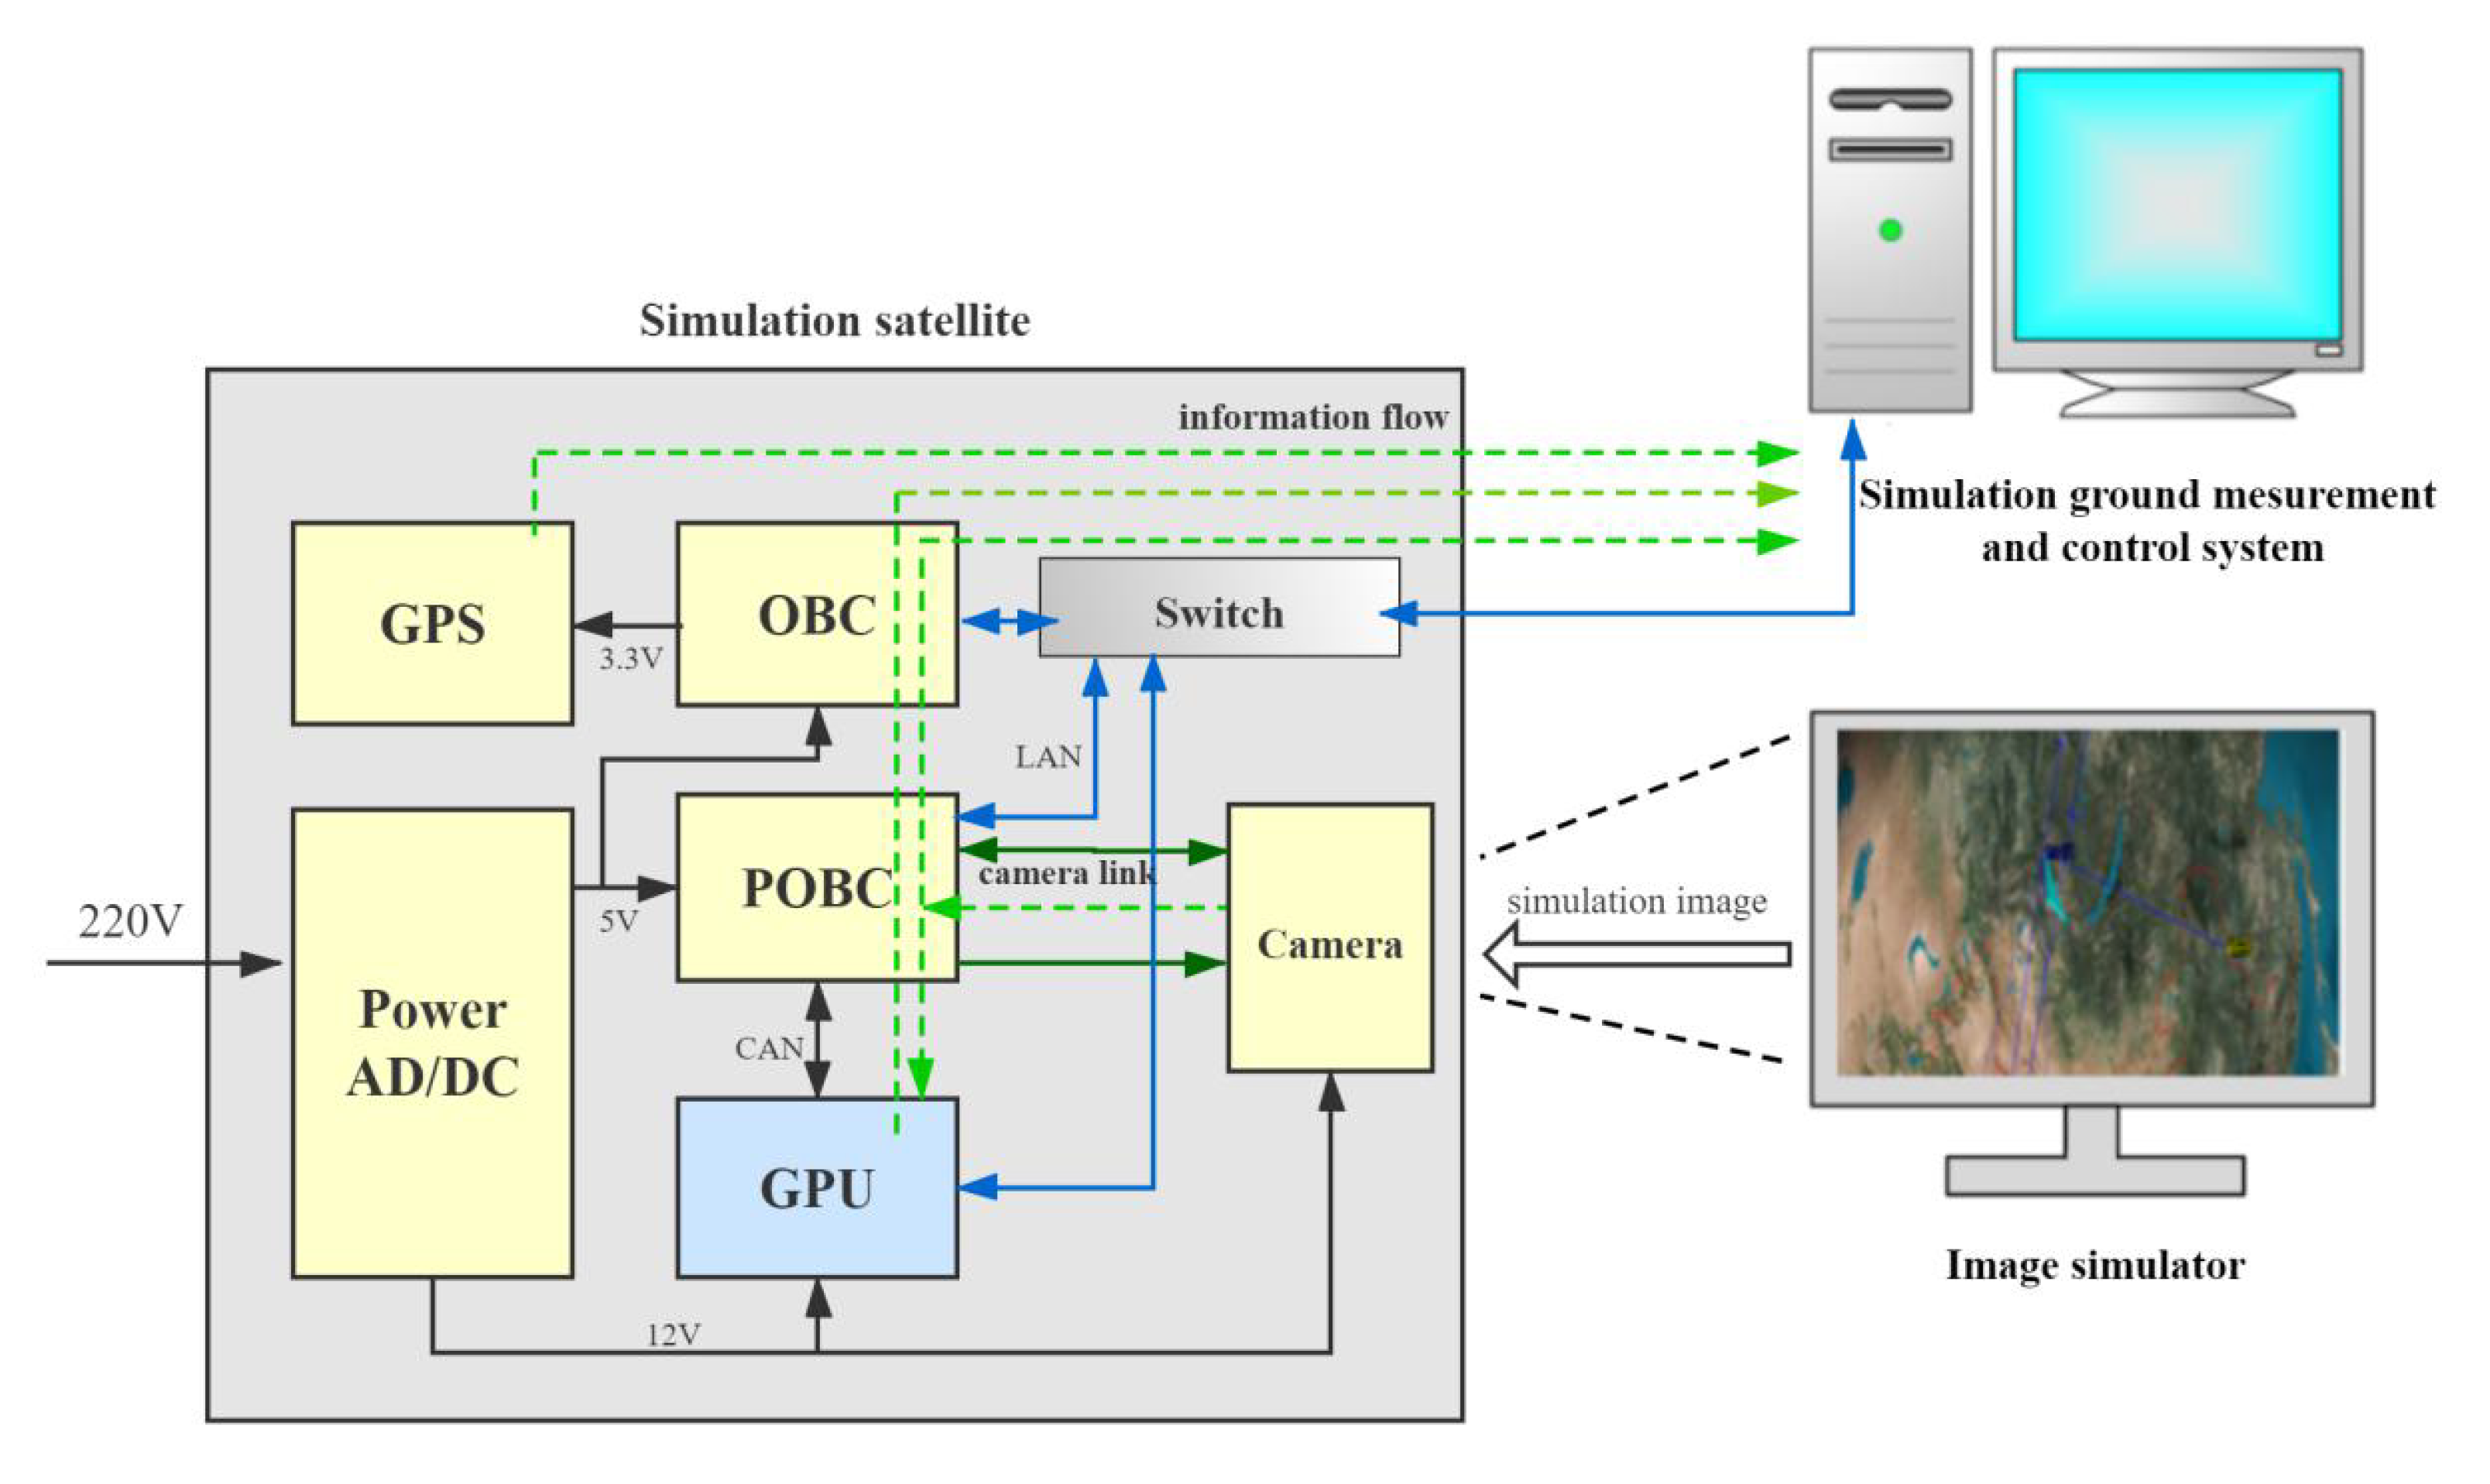
Figure 5 shows the system schematic.
The main components of the system were the OBC (on-board computer), POBC (on-board data processing computer), GPS (global positioning system) module, switch module, camera, image simulator, and simulated ground measurement and control system. As the control center of the system, the OBC runs the satellite service software and controls the entire satellite. It sends the status and telemetry information from the satellite to the simulated ground measurement and control system, and it communicates with the GPS module through the serial port. The POBC receives the camera’s image data through the camera link, processes it as required, and then transmits it via ethernet. The simulated ground measurement and control system displays the satellite telemetry signal and status parameters. The GPS module provides latitude and longitude information.
With this system, the information flows from the camera, which collects images of the image simulator, to the POBC through the camera link for processing and storage, before finally travelling to the simulated ground measurement and control system where the data are displayed.
3.3. The HISEA-1 Satellite and Its On-Board Image Processing Load
At 12:37 noon Beijing time on December 22, 2020, the HISEA-1 satellite that was developed by Spacety was successfully launched on the CZ-8 rocket. The HISEA-1 satellite represented the first SAR remote sensing satellite constructed for scientific observation of oceans and coastal zones by a domestic university. It is also the first star of the planned HISEA series of small satellite constellations. The constellation will include multiple small and light SAR satellites and multi-spectral satellites that can be utilized by various field observation systems.
Table 1 lists the requirements for the HISEA-1 mission. On 25 December 2020, the first batch of images from the HISEA-1 satellite were successfully obtained. To reduce the pressure of data transmission, the satellite platform is equipped with an intelligent information processing module for technical exploration of on-board intelligent image processing. This module is designed to extract effective information from remote sensing images and, thereby, reduce the data load sent to the measurement and control station and improve the efficiency of data acquisition.
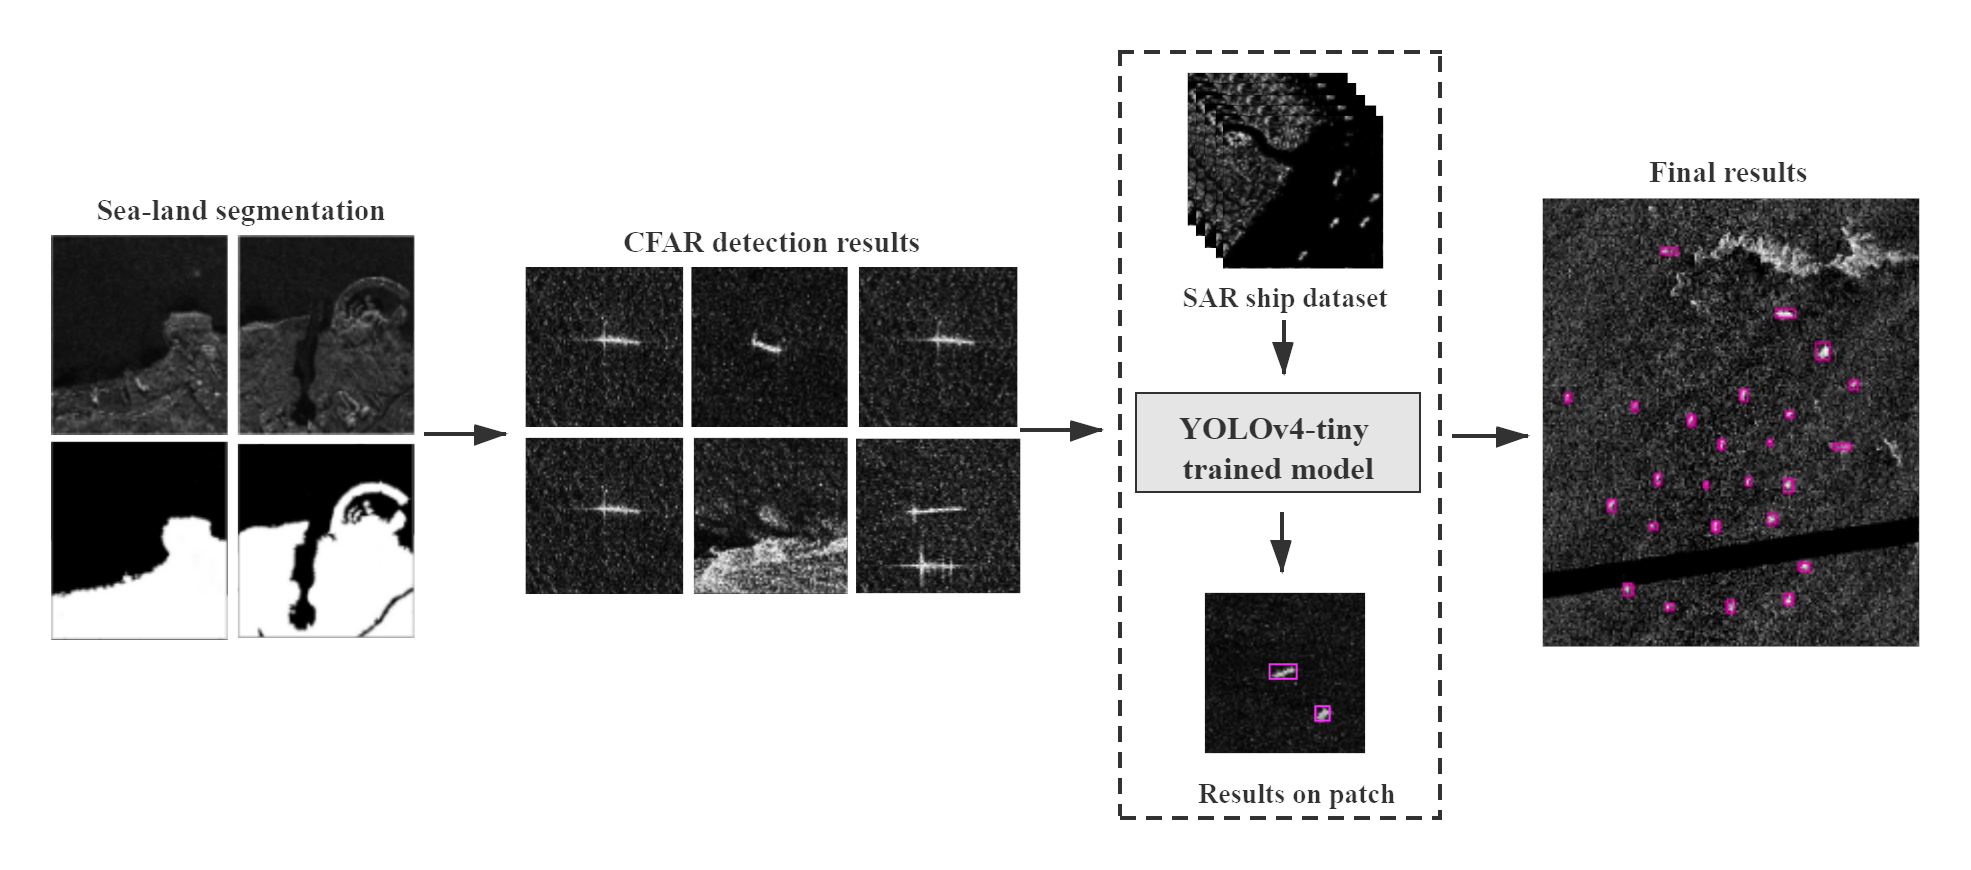
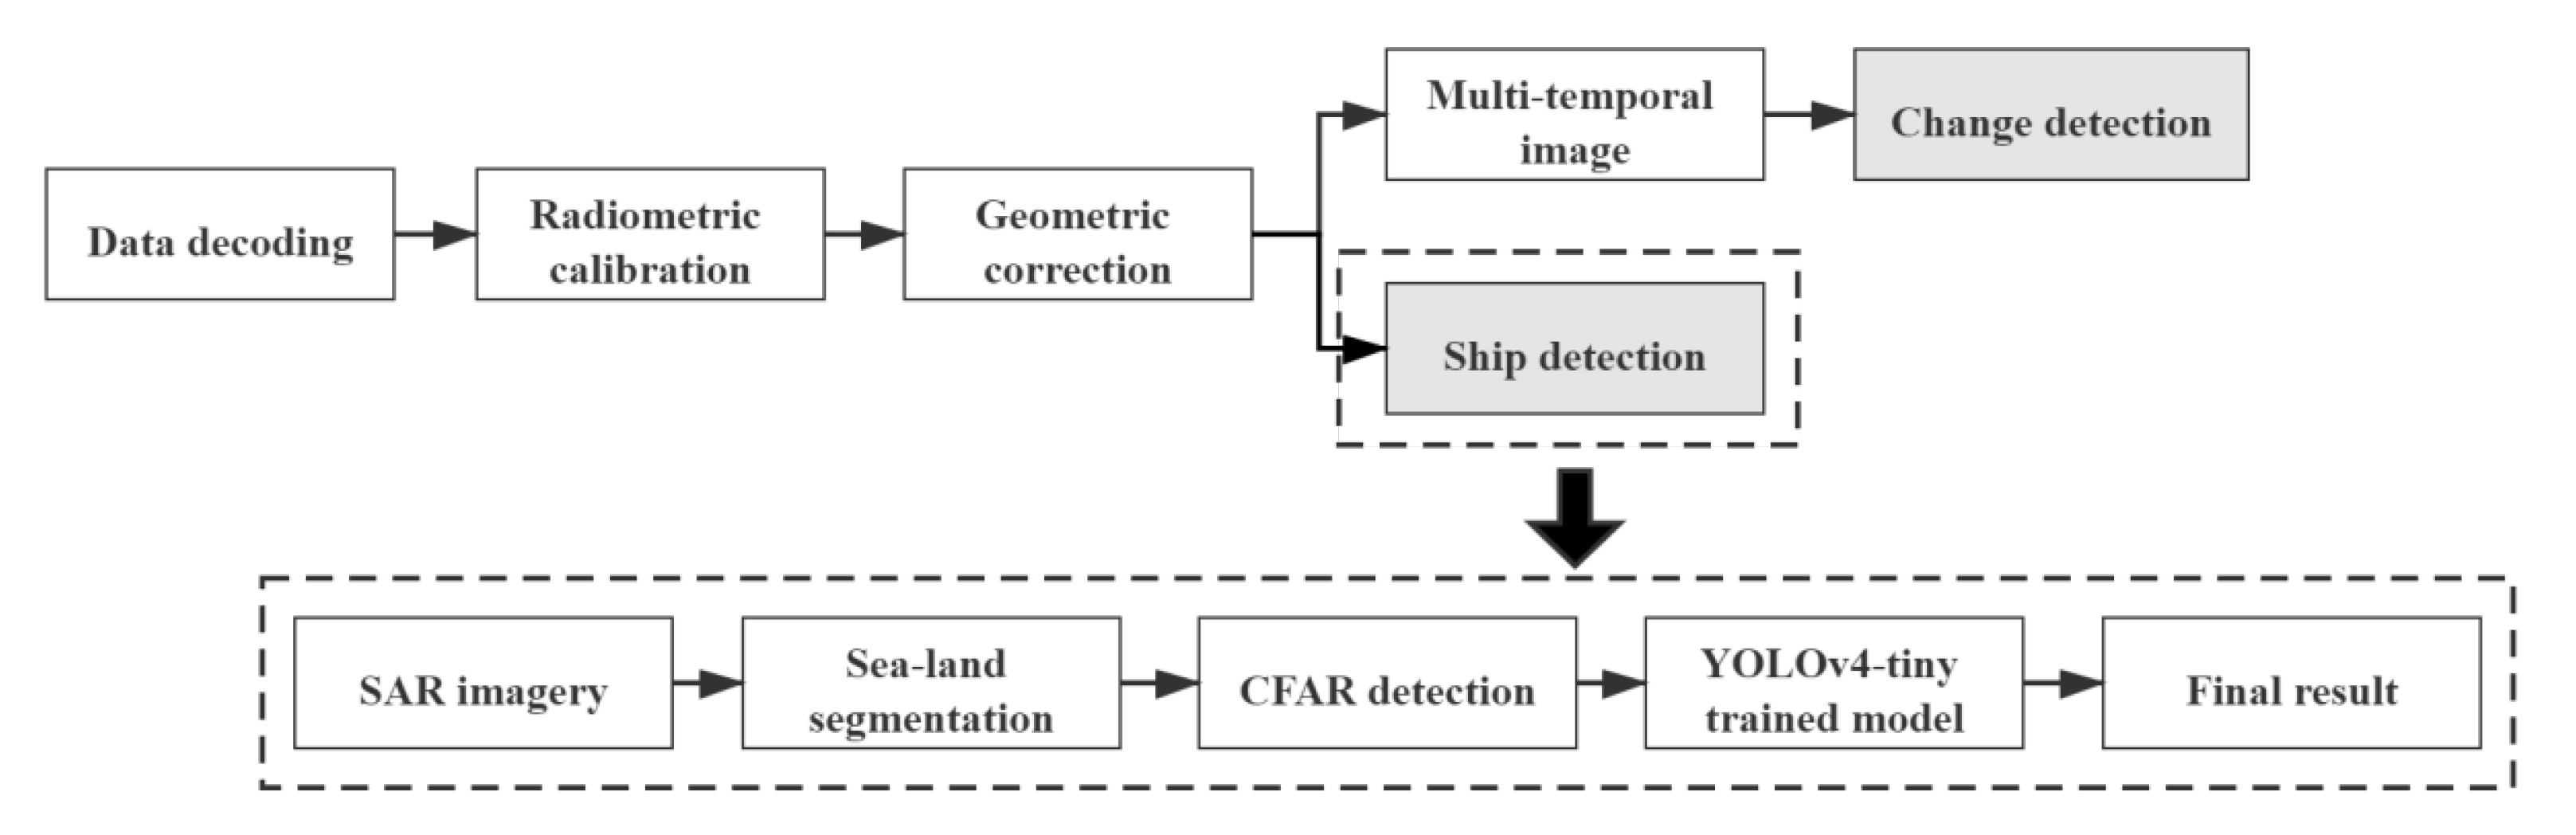
The on-board image processing load of the HISEA-1 satellite includes two parts, one is the SAR image preprocessing module and the other is an intelligent application module. Pre-processing includes data decoding, radiometric calibration, and geometric correction. The intelligent application module is responsible for real-time ship detection and detection of ground changes.
Figure 6 shows the processing flow. Using the pre-processed images, the on-board ship detection process will extract the target image patches and position information, producing the effective information that will be transmitted to the ground receiver through the downlink. At the same time, the ground control system can monitor satellite transmission data in real time and communicate ground instructions to the satellite and, by continually updating the algorithm model parameters in the satellite’s intelligent processing unit through the satellite upload channel, it can be tasked to complete more on-board processing tasks.
5. Discussion
The above experiments verified the validity of our scheme. We can deploy our network scheme to the Jetson TX1 on the lightweight SAR satellite for on-board ship detection. The combination of the classic CFAR algorithm and YOLOv4-tiny lightweight deep learning network greatly improved the speed of ship detection. After extracting the ship targets, the coordinates of the upper left and lower right corners of the images are collected and latitude and longitude coordinates of the ship are obtained through coordinate conversion. Only the target image patches and geographic coordinates will be transmitted to the ground receivers. This on-board ship detection method greatly reduces the amount of data that must be transferred to the ground receiver, which helps to reduce the pressure on the ground receiver. However, if required for special missions, users on the ground can control the satellite and obtain images of a region of interest, and the useful information will be transmitted to the ground after on-board processing. With these data, ground users will be able to make better and faster decisions in emergency situations.
In addition, as shown above, our method achieved a rapid and accurate ship detection in SAR images. In order to obtain better ship detection results, subsequent work will need to label the ship chips of original images that were downloaded from the satellite at an early stage and train the model. Finally, the model can be updated or a new model can be uploaded to the satellite to achieve more accurate detection results. Furthermore, in addition to the role of the deep learning model in determining detection accuracy, the CFAR algorithm also impacts the detection accuracy. Therefore, our future work will continue to improve the CFAR algorithm.


 ,
, 


