
Submarine and Subaerial Morphological Changes Associated with the 2014 Eruption at Stromboli Island


 , , , and
Abstract
:
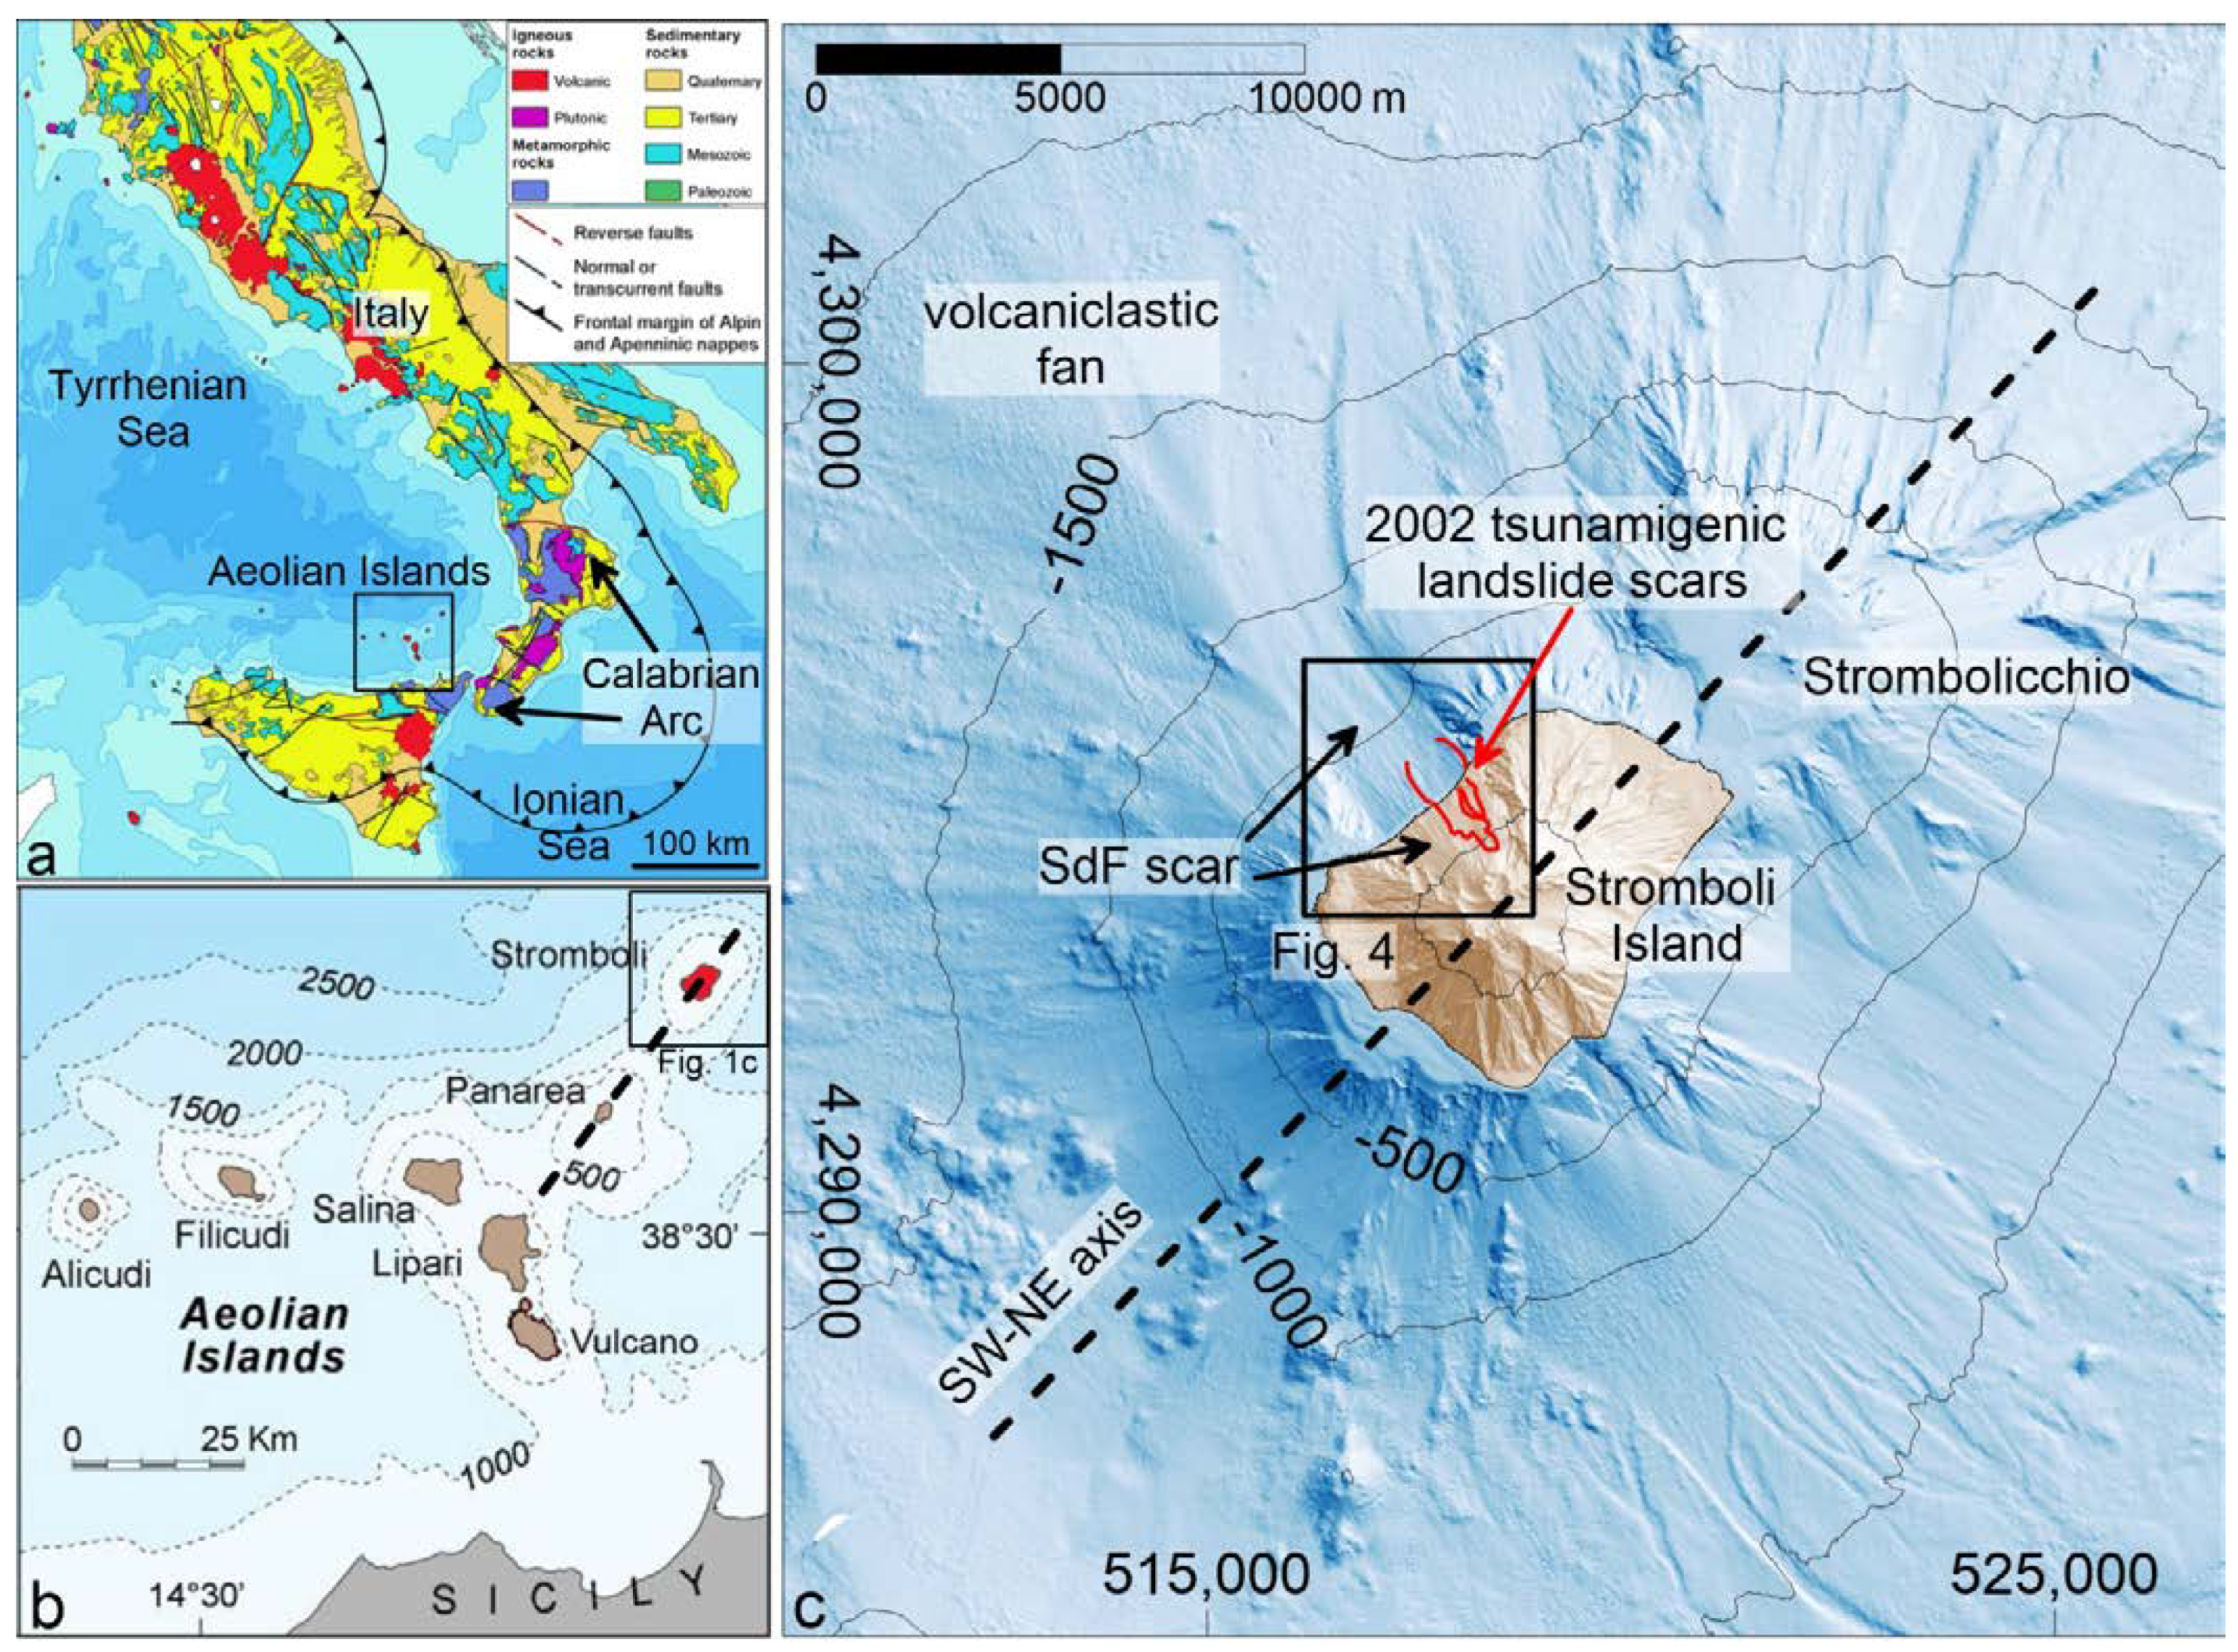
1. Introduction
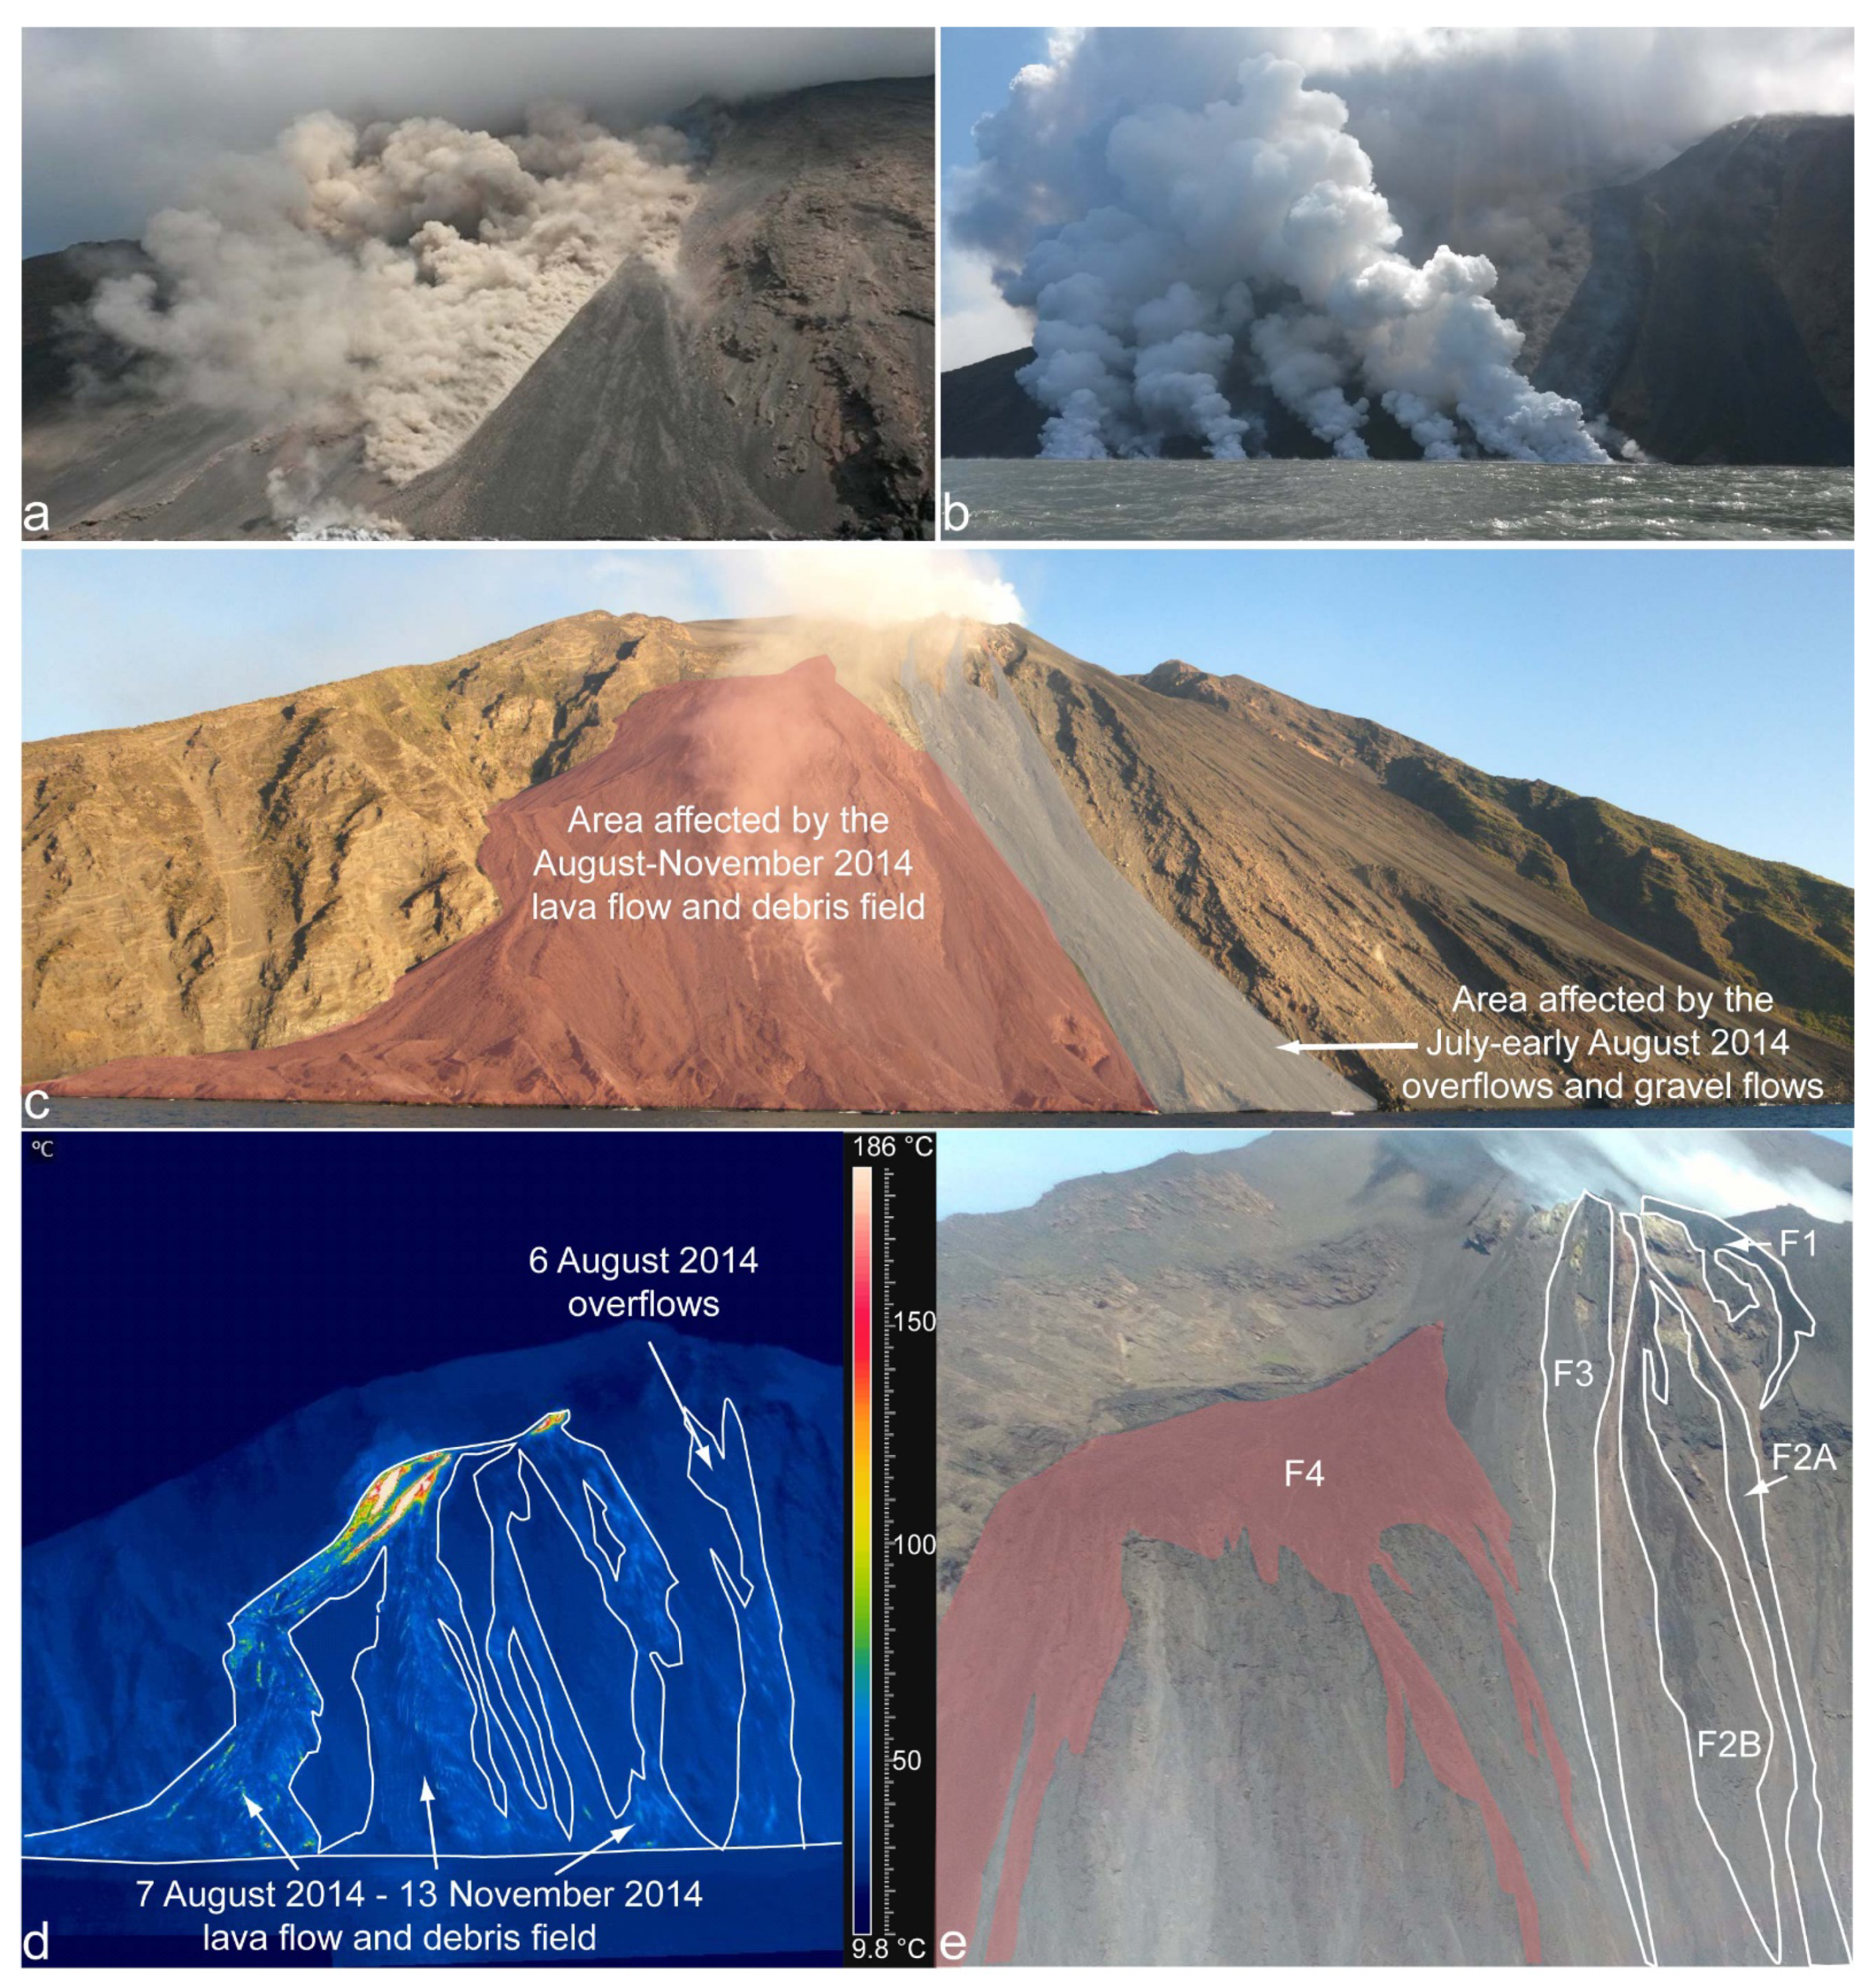
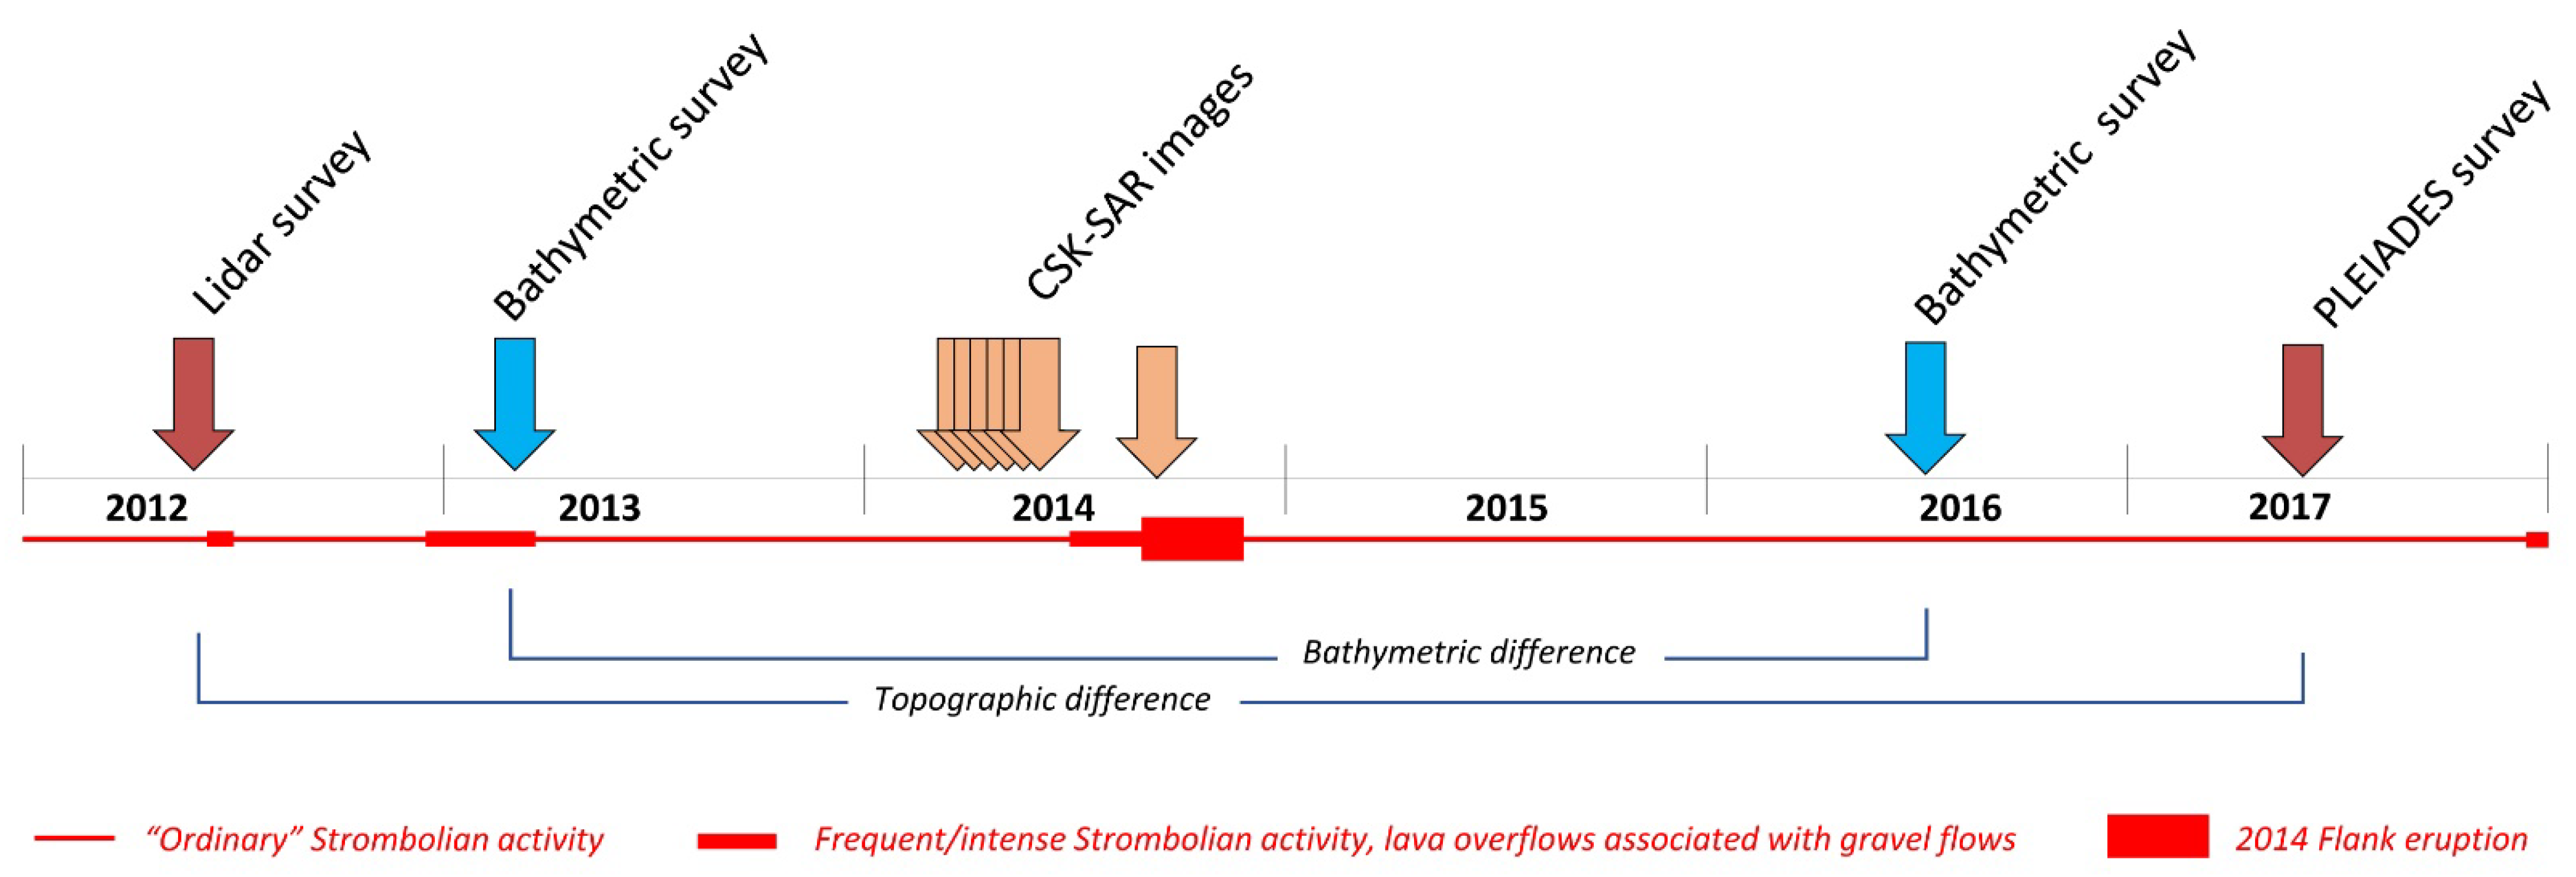
2. The 2014 Eruption: Chronology and Subaerial Morphological Analysis
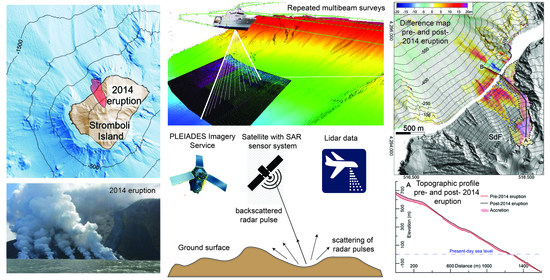
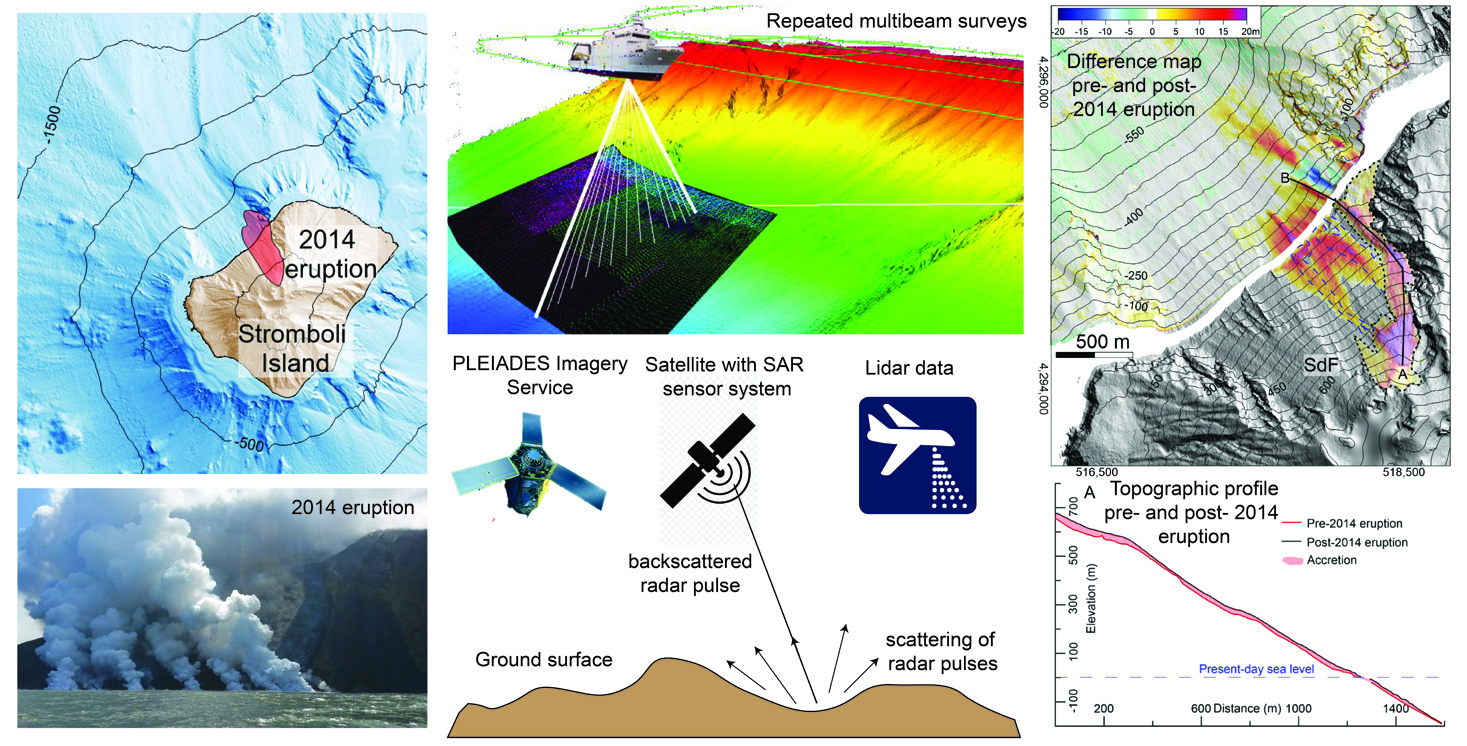
3. Data and Methods
3.1. Lidar, Photogrammetric and Bathymetric Surveys
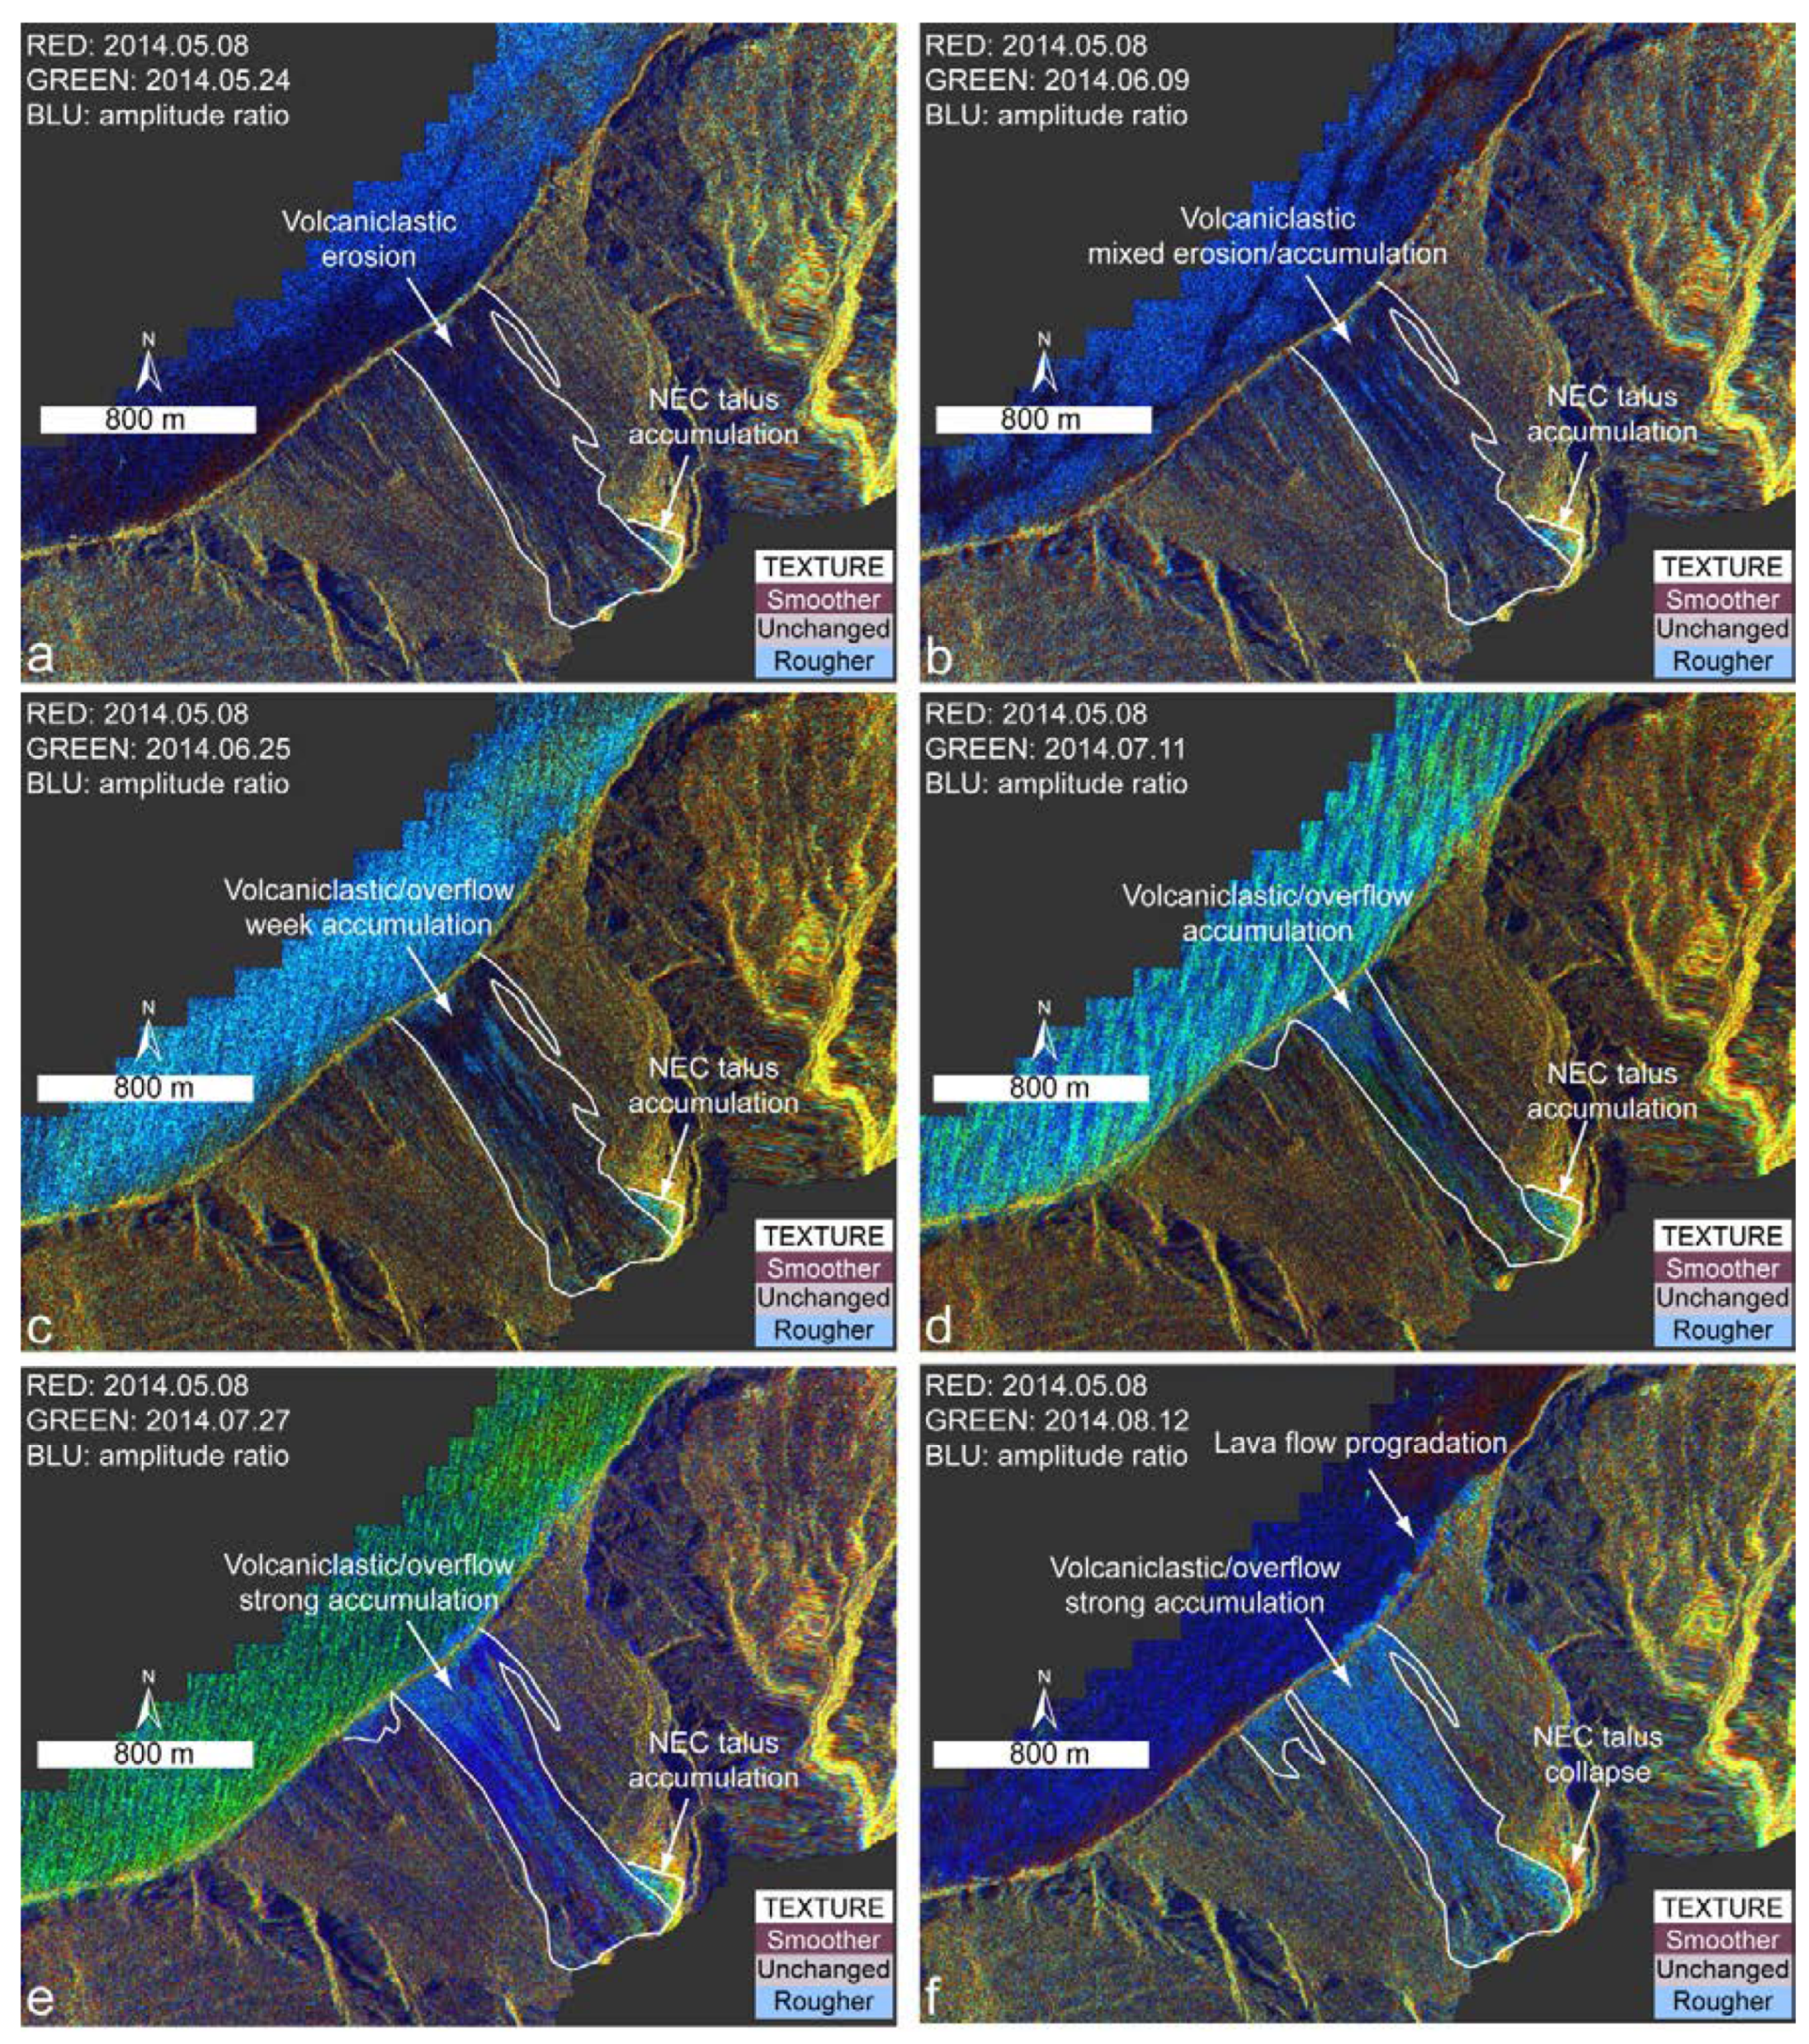
3.2. Change Detection with SAR Amplitude Images
- RED: 8 May 2014 image, considered as a reference for all the others;
- GREEN: image that is analyzed;
- BLUE: ratio of the amplitudes between the analyzed image and that of 8 May 2014.
4. Results
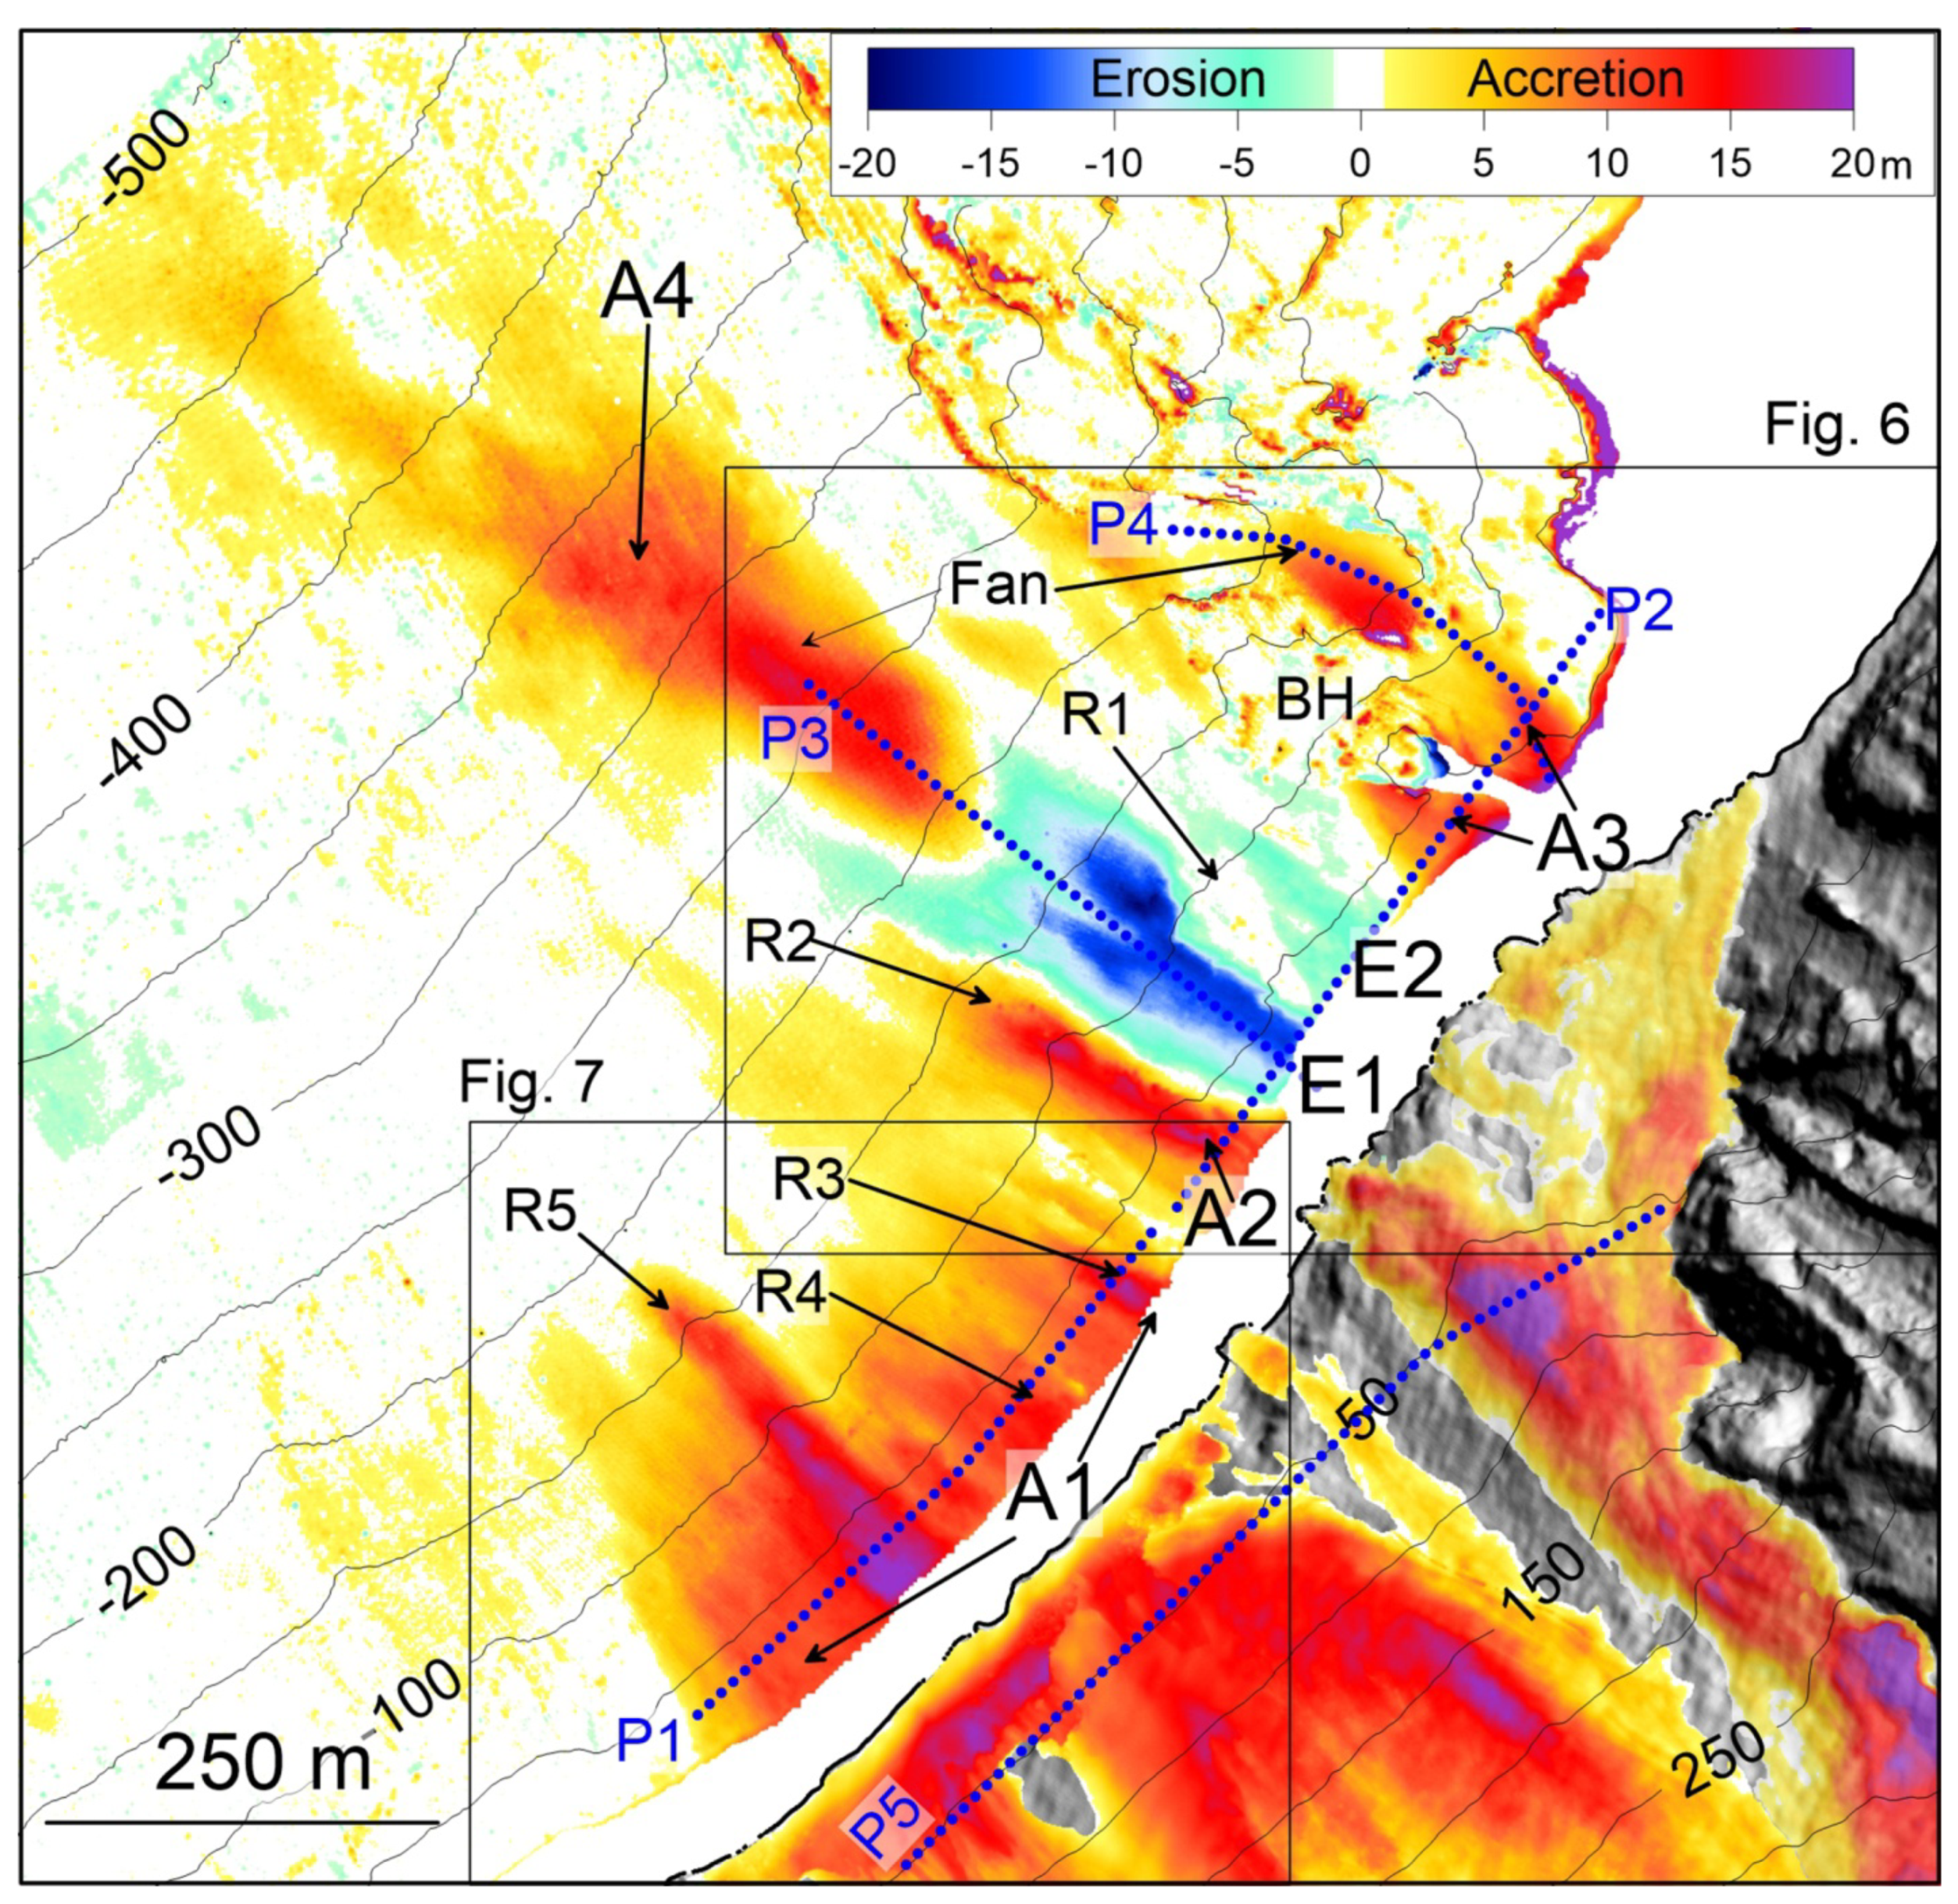
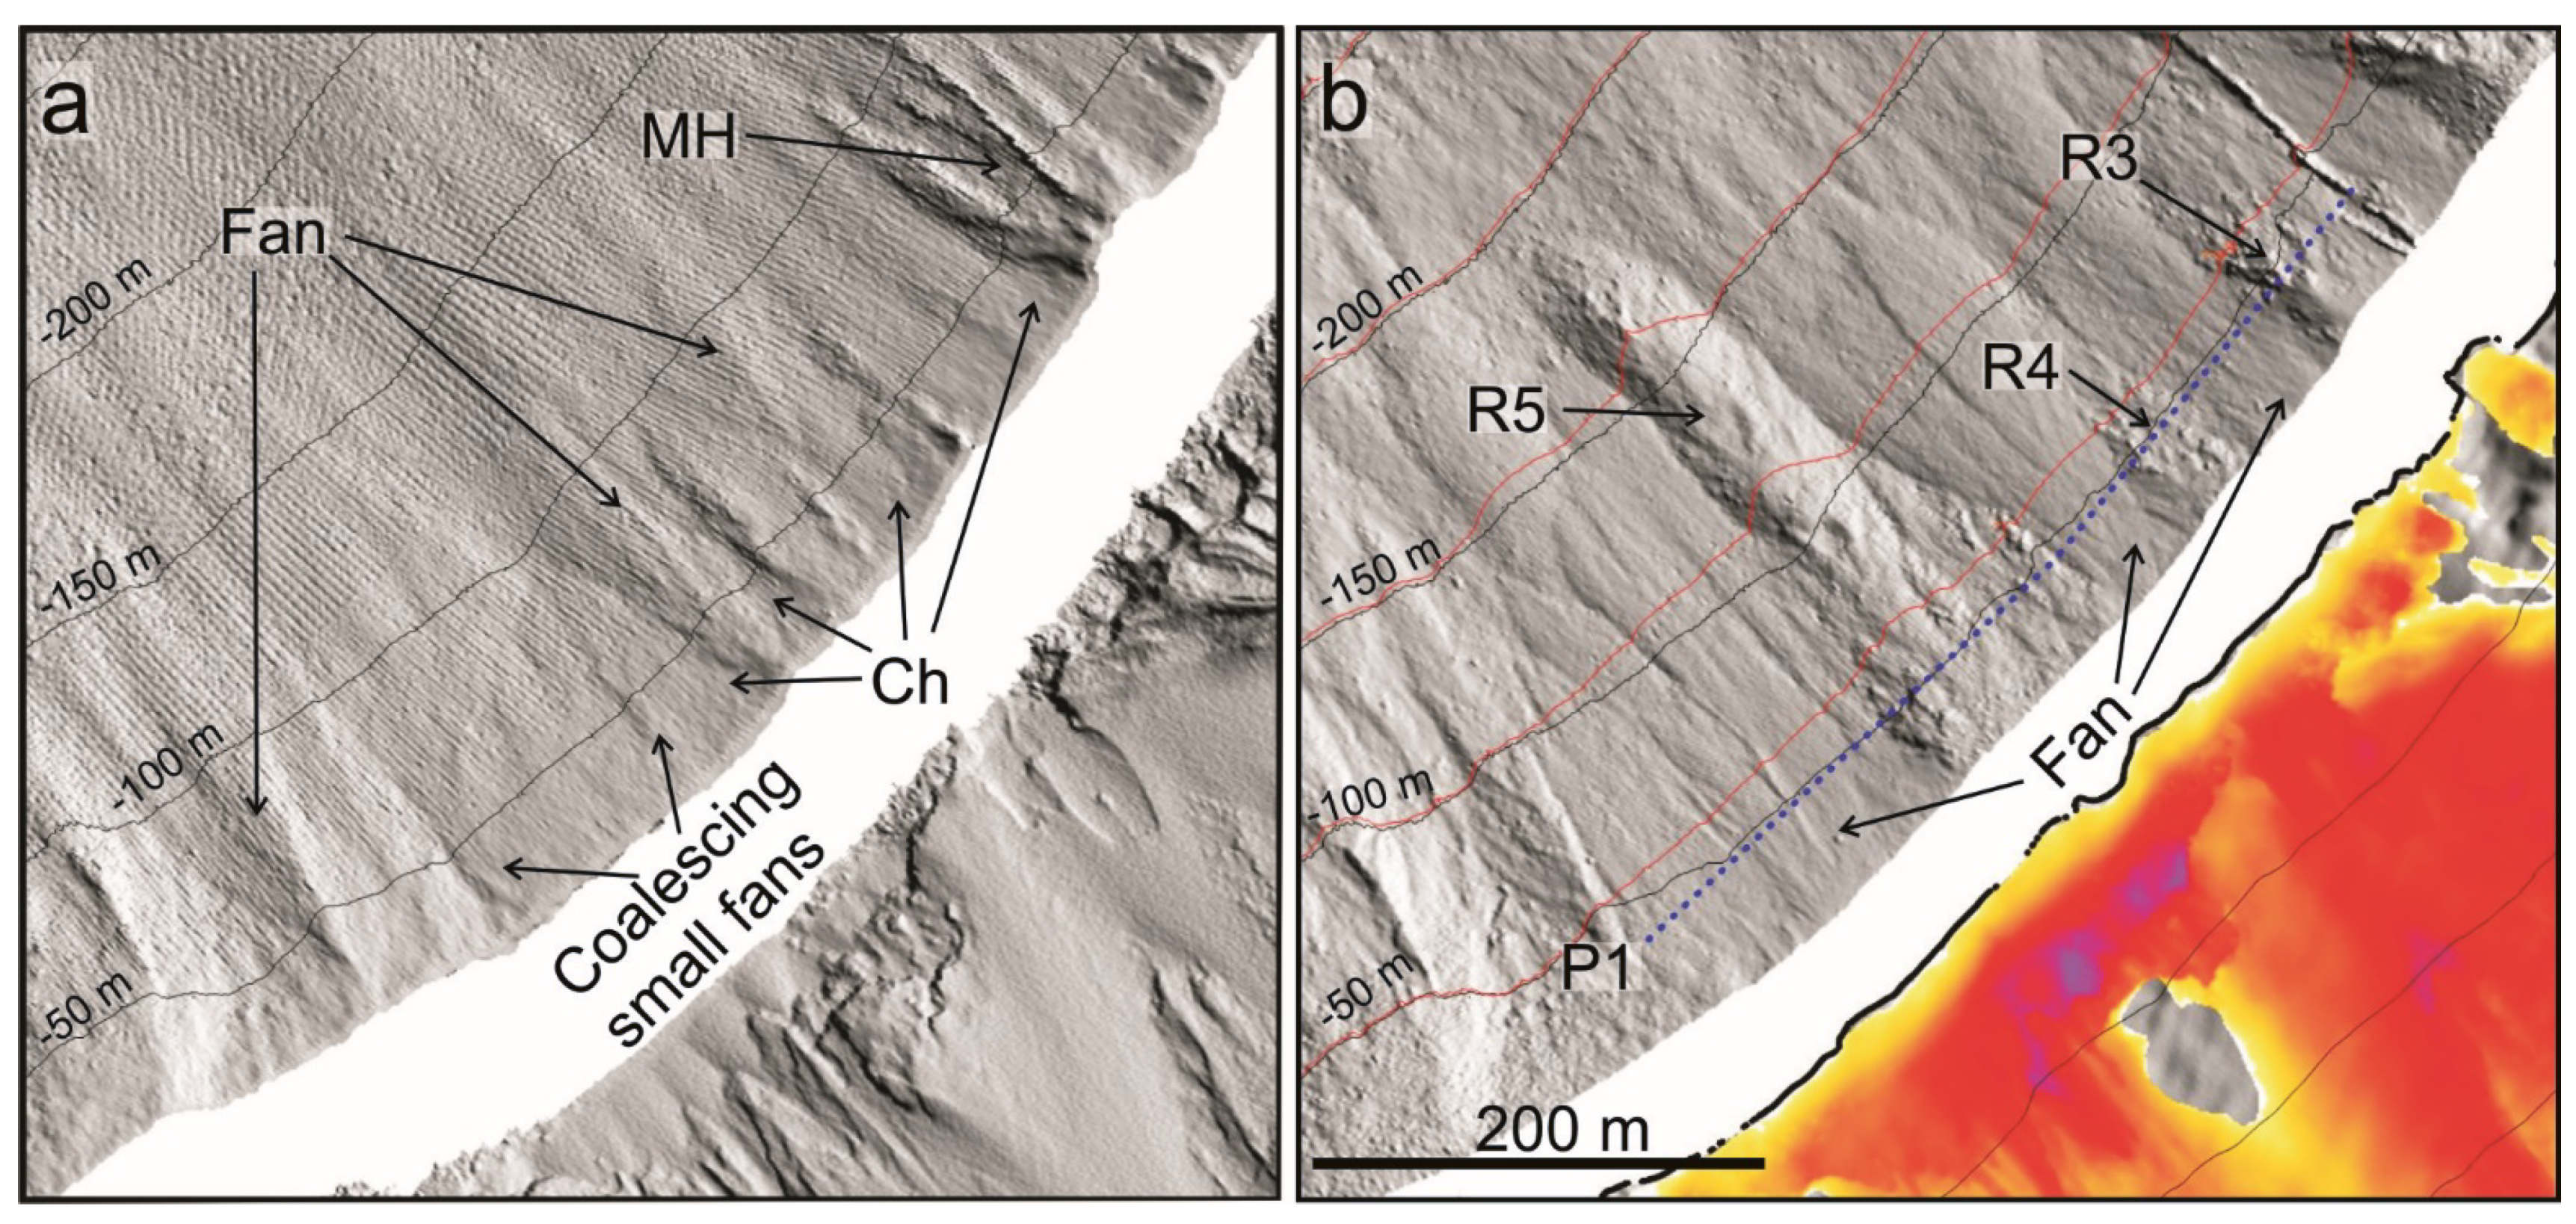
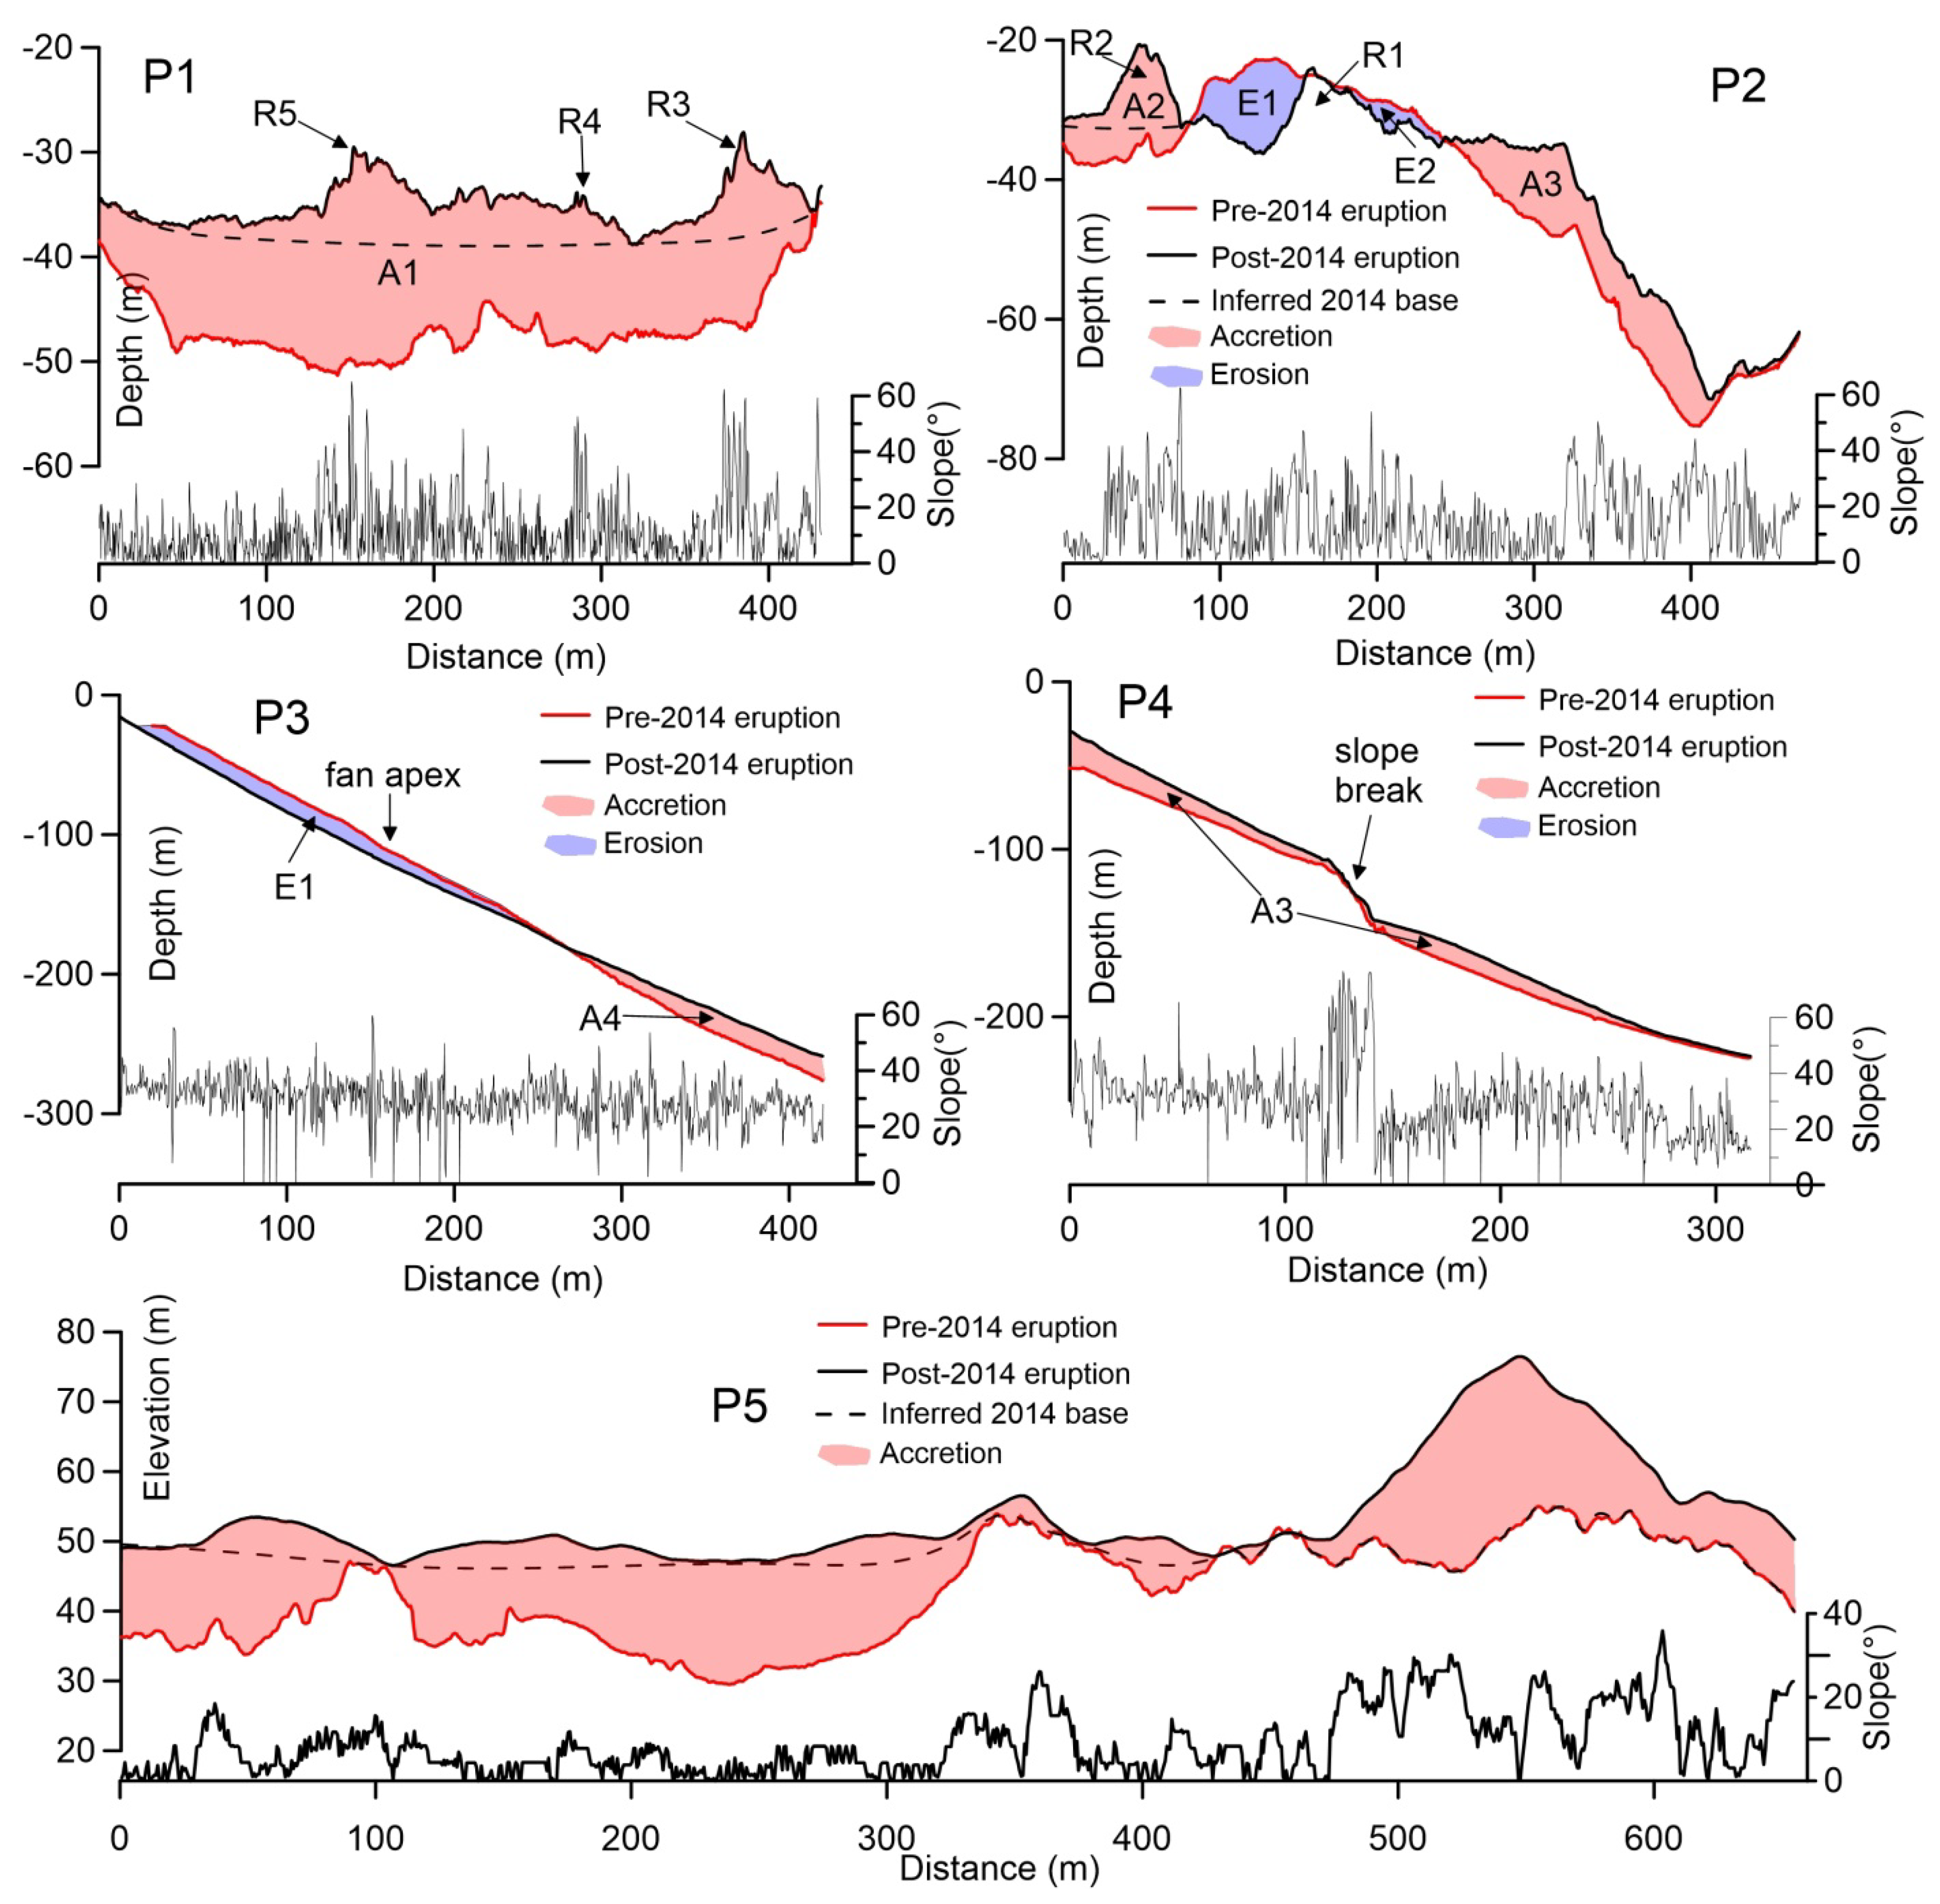
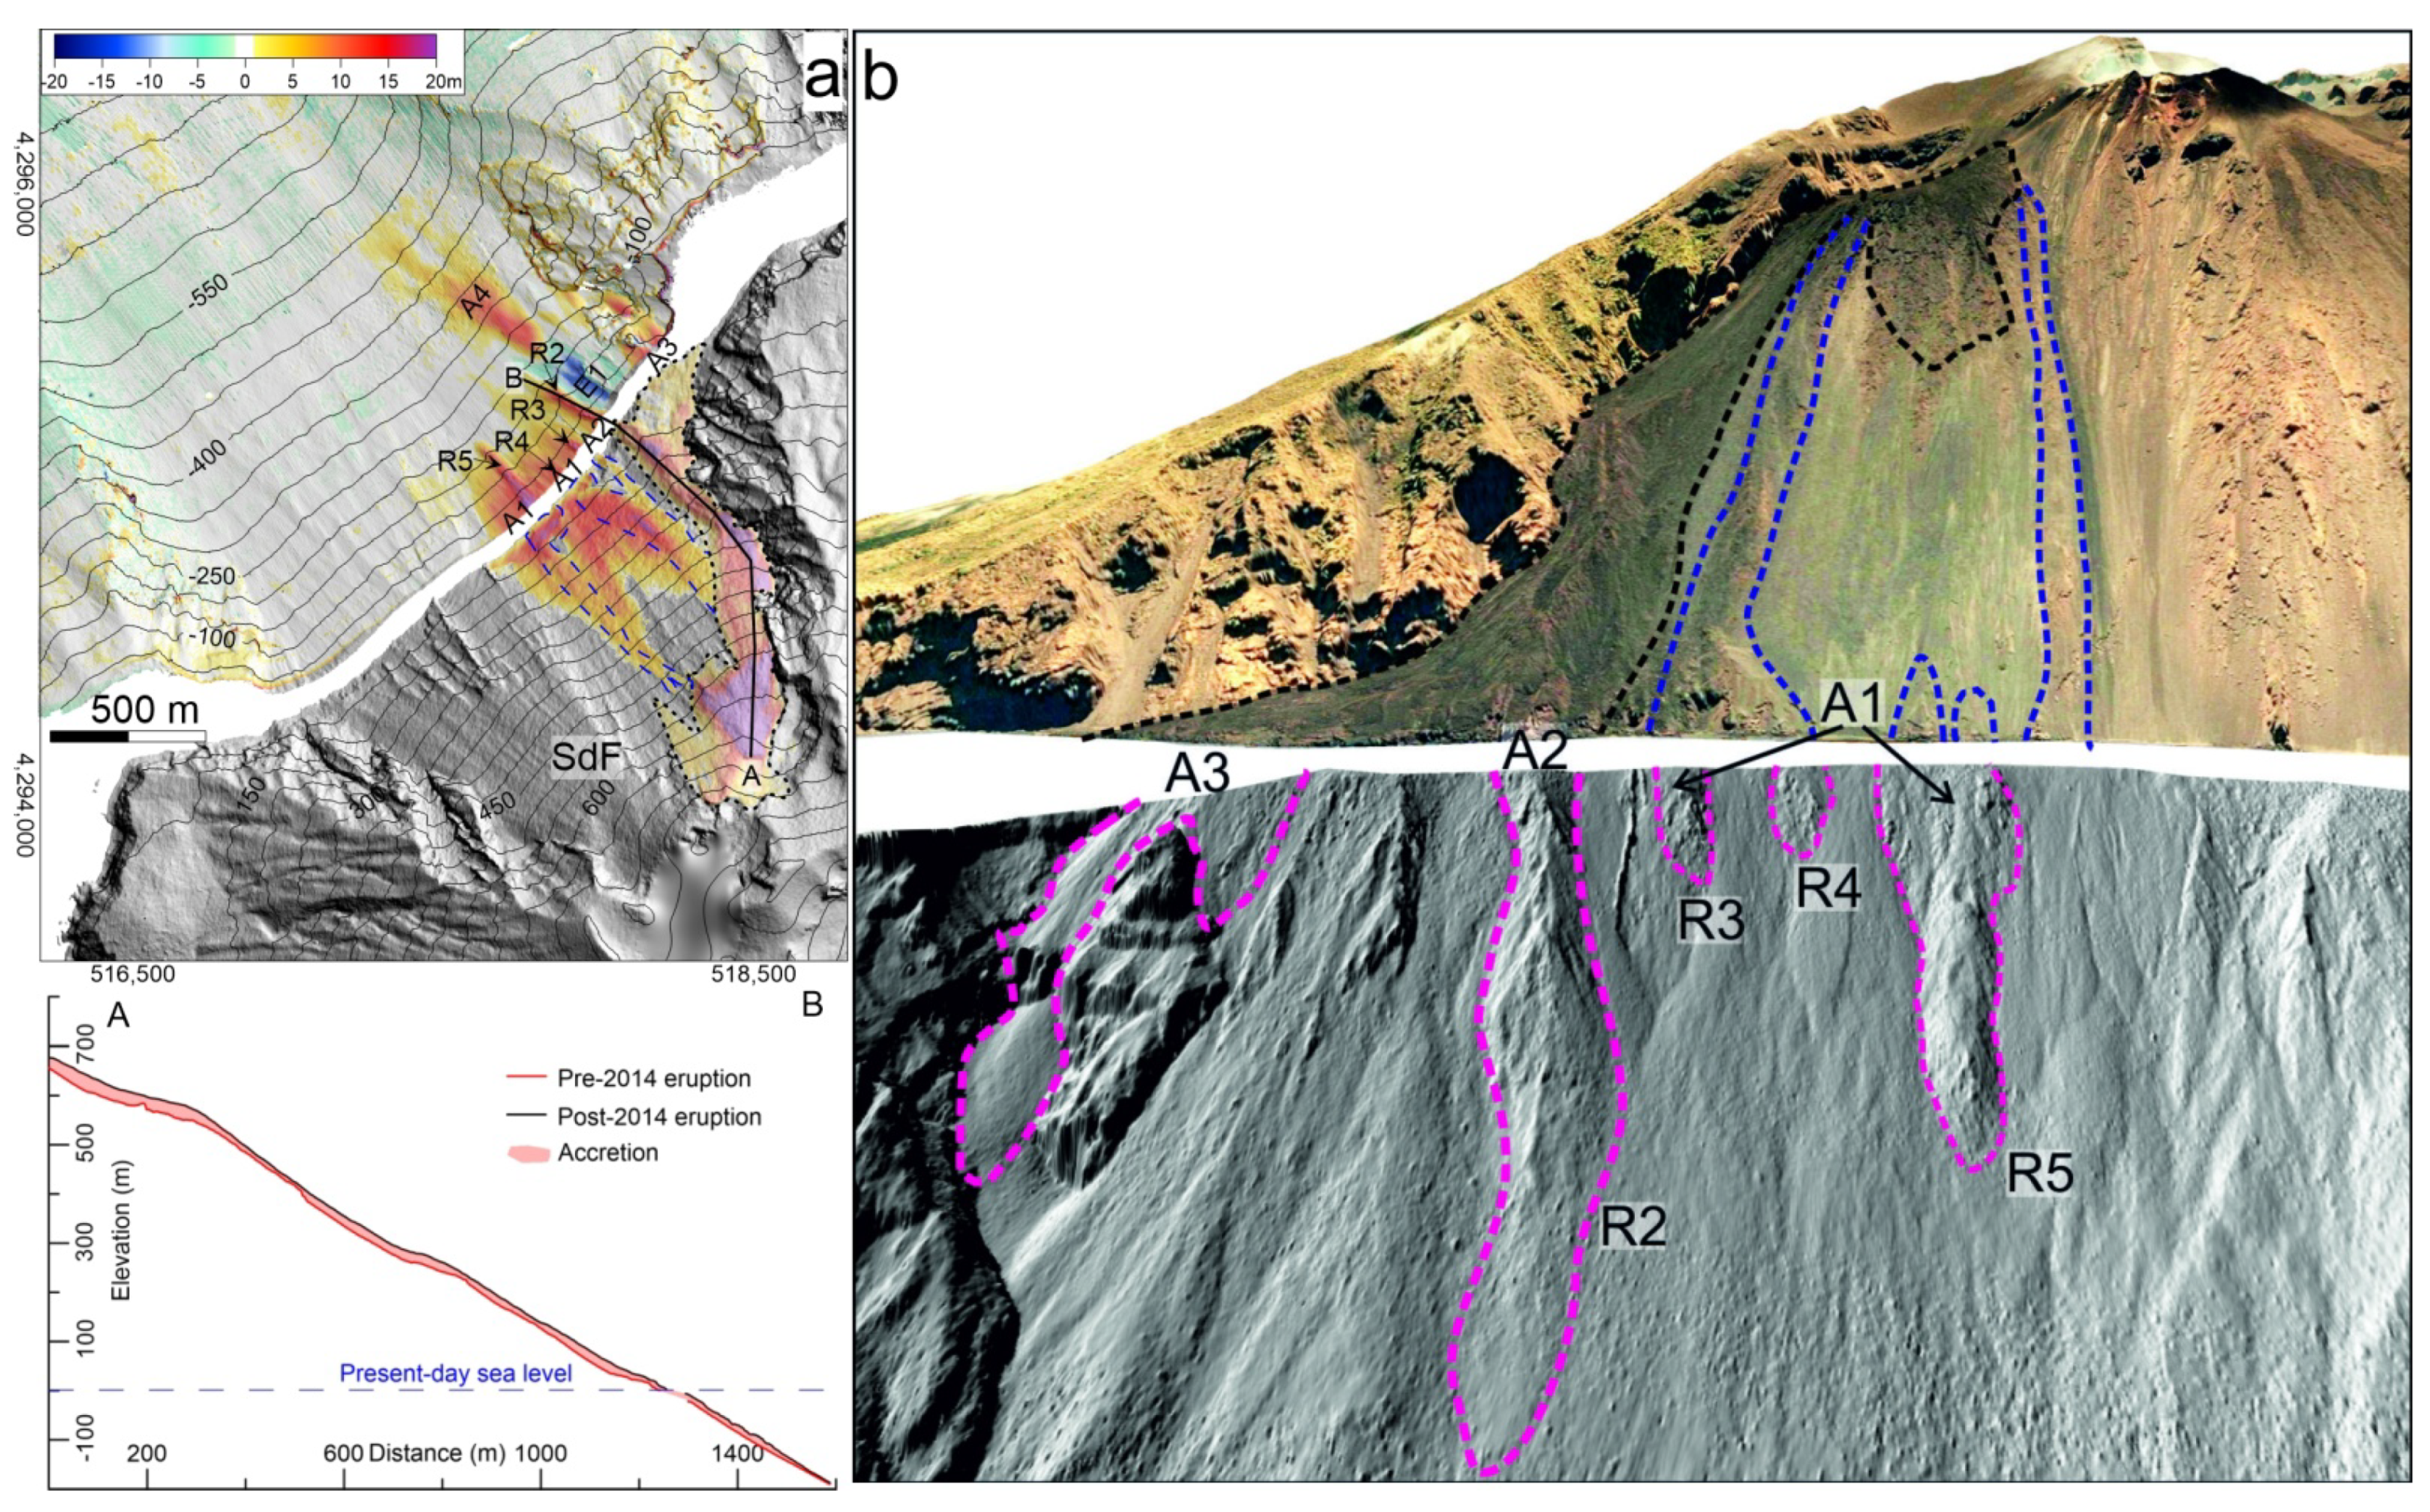
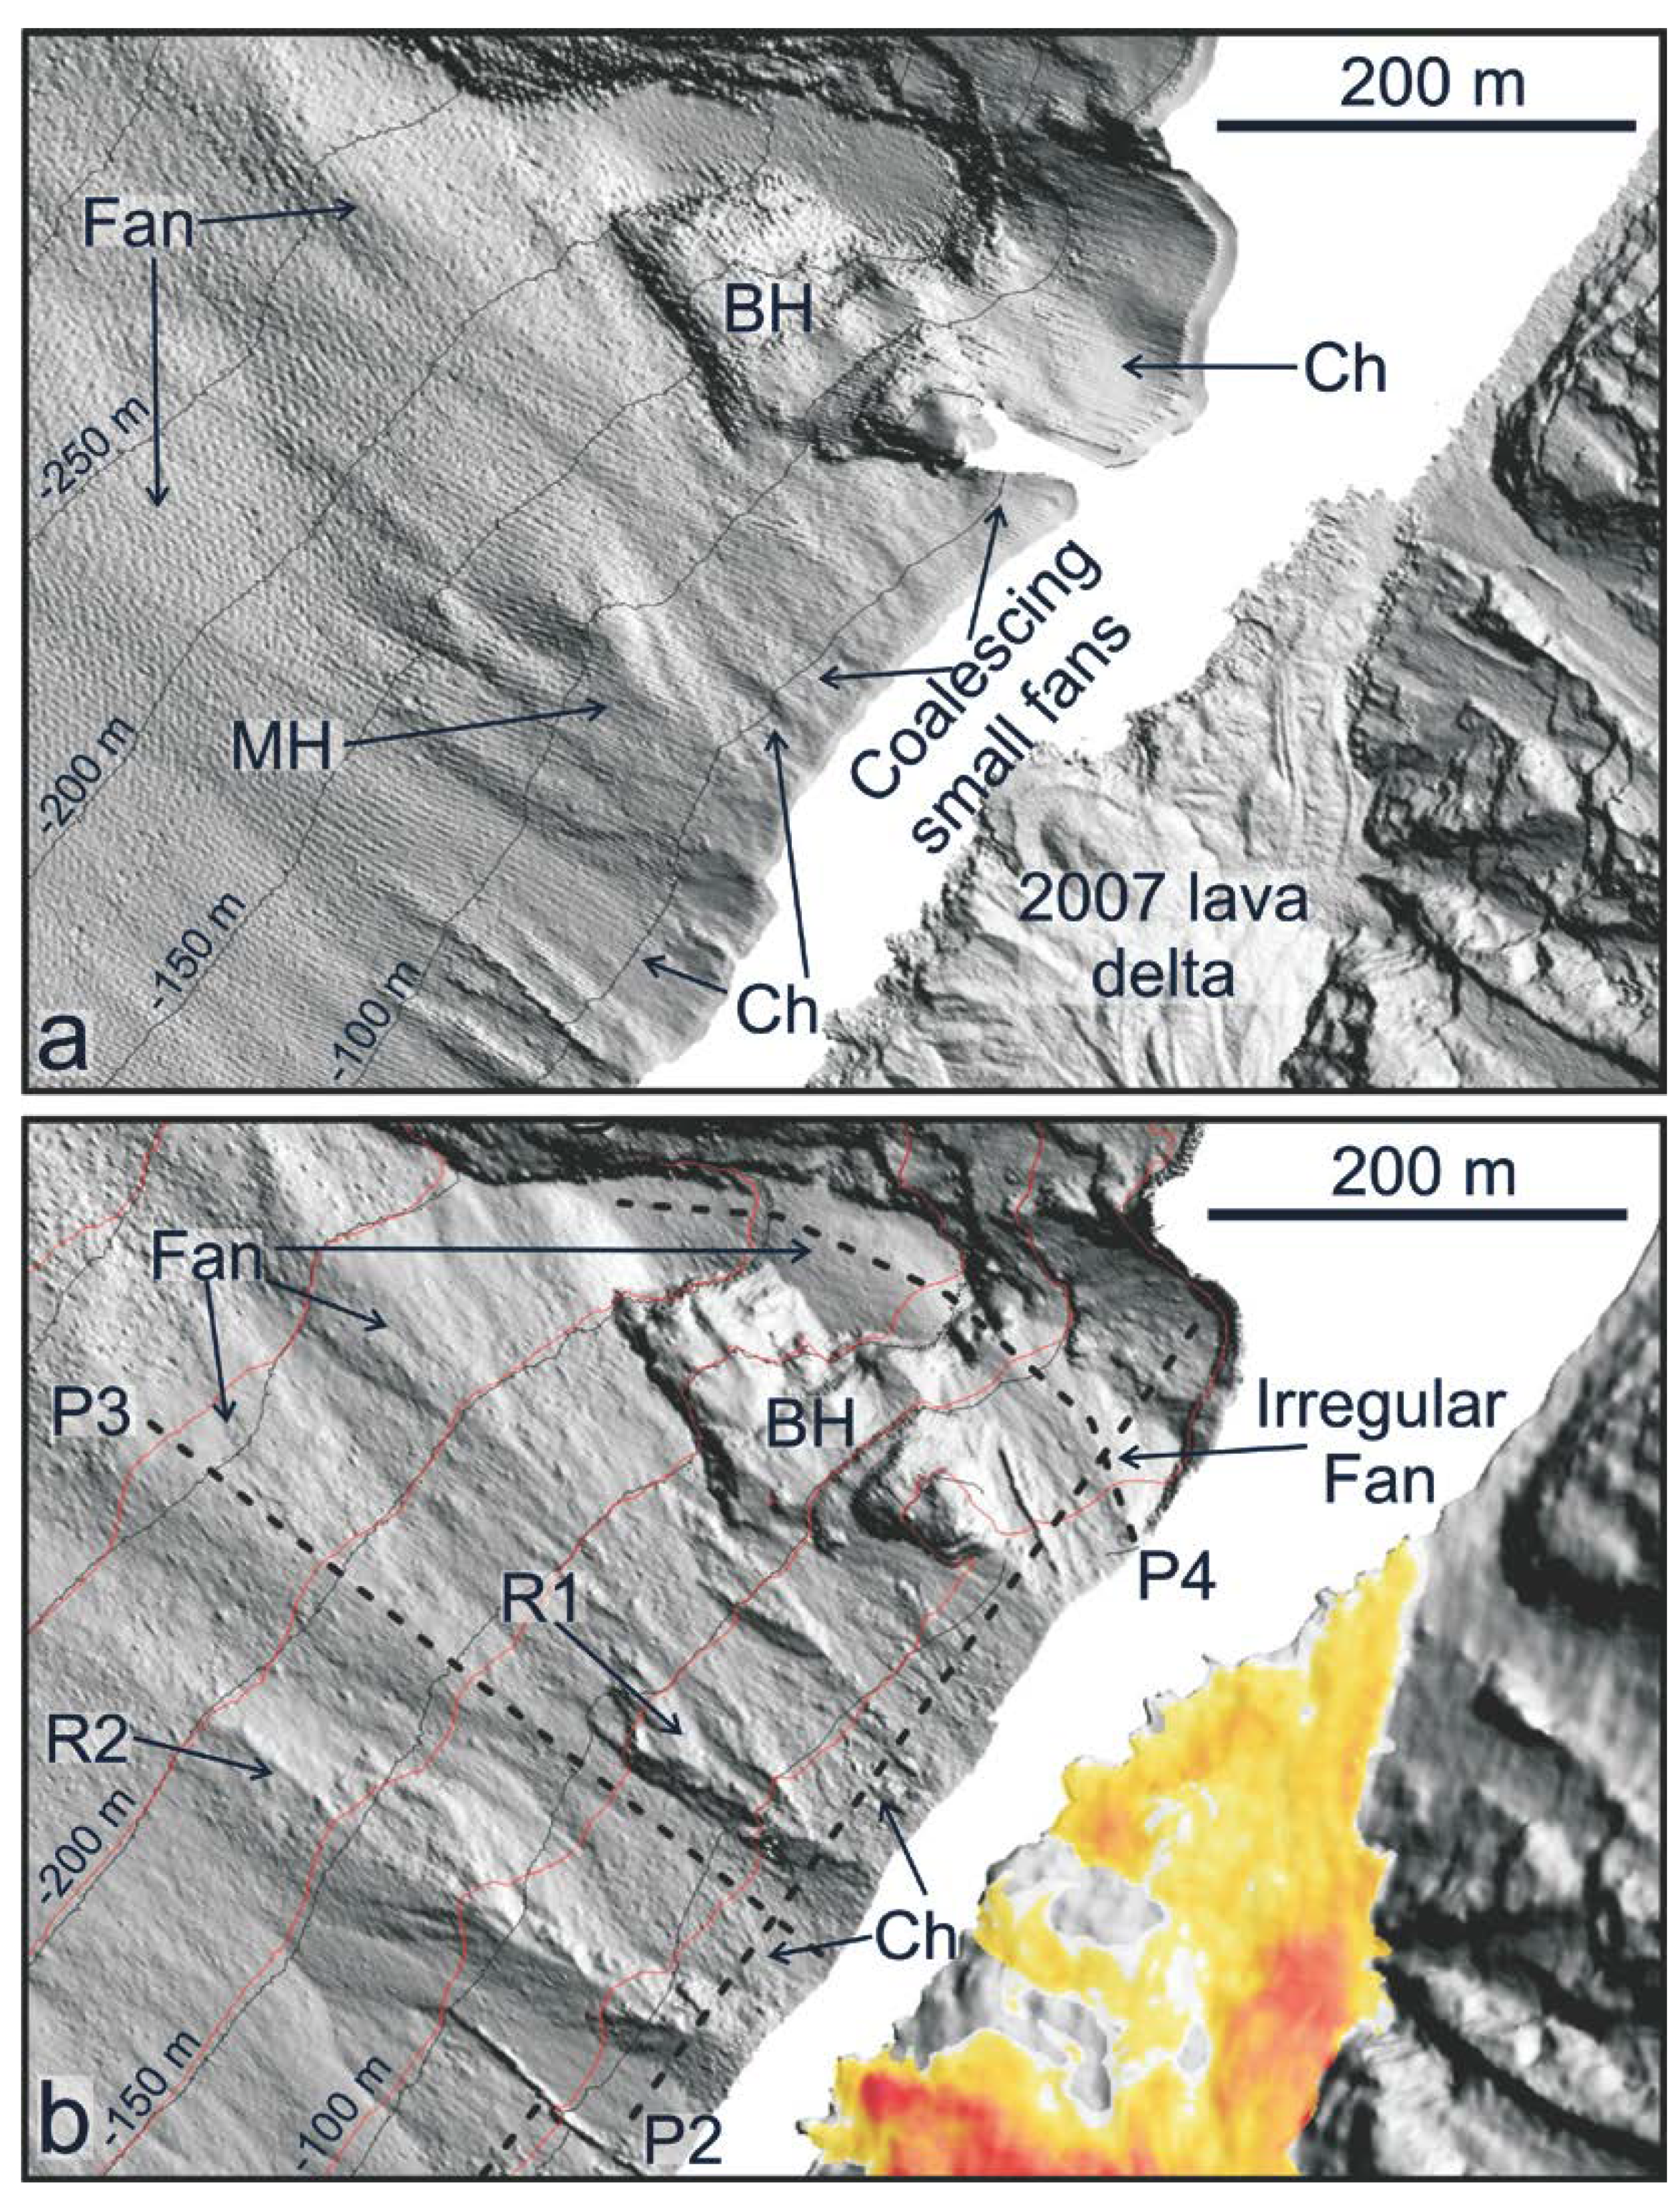
4.1. Morphological Evolution of the Submarine SdF between 2013 and 2016
4.2. CSK-SAR Data Collected between May and August 2014
5. Discussion
5.1. Seafloor Accretion Associated with the 2014 Eruption
5.2. Seafloor Erosion Associated with the 2014 Eruption
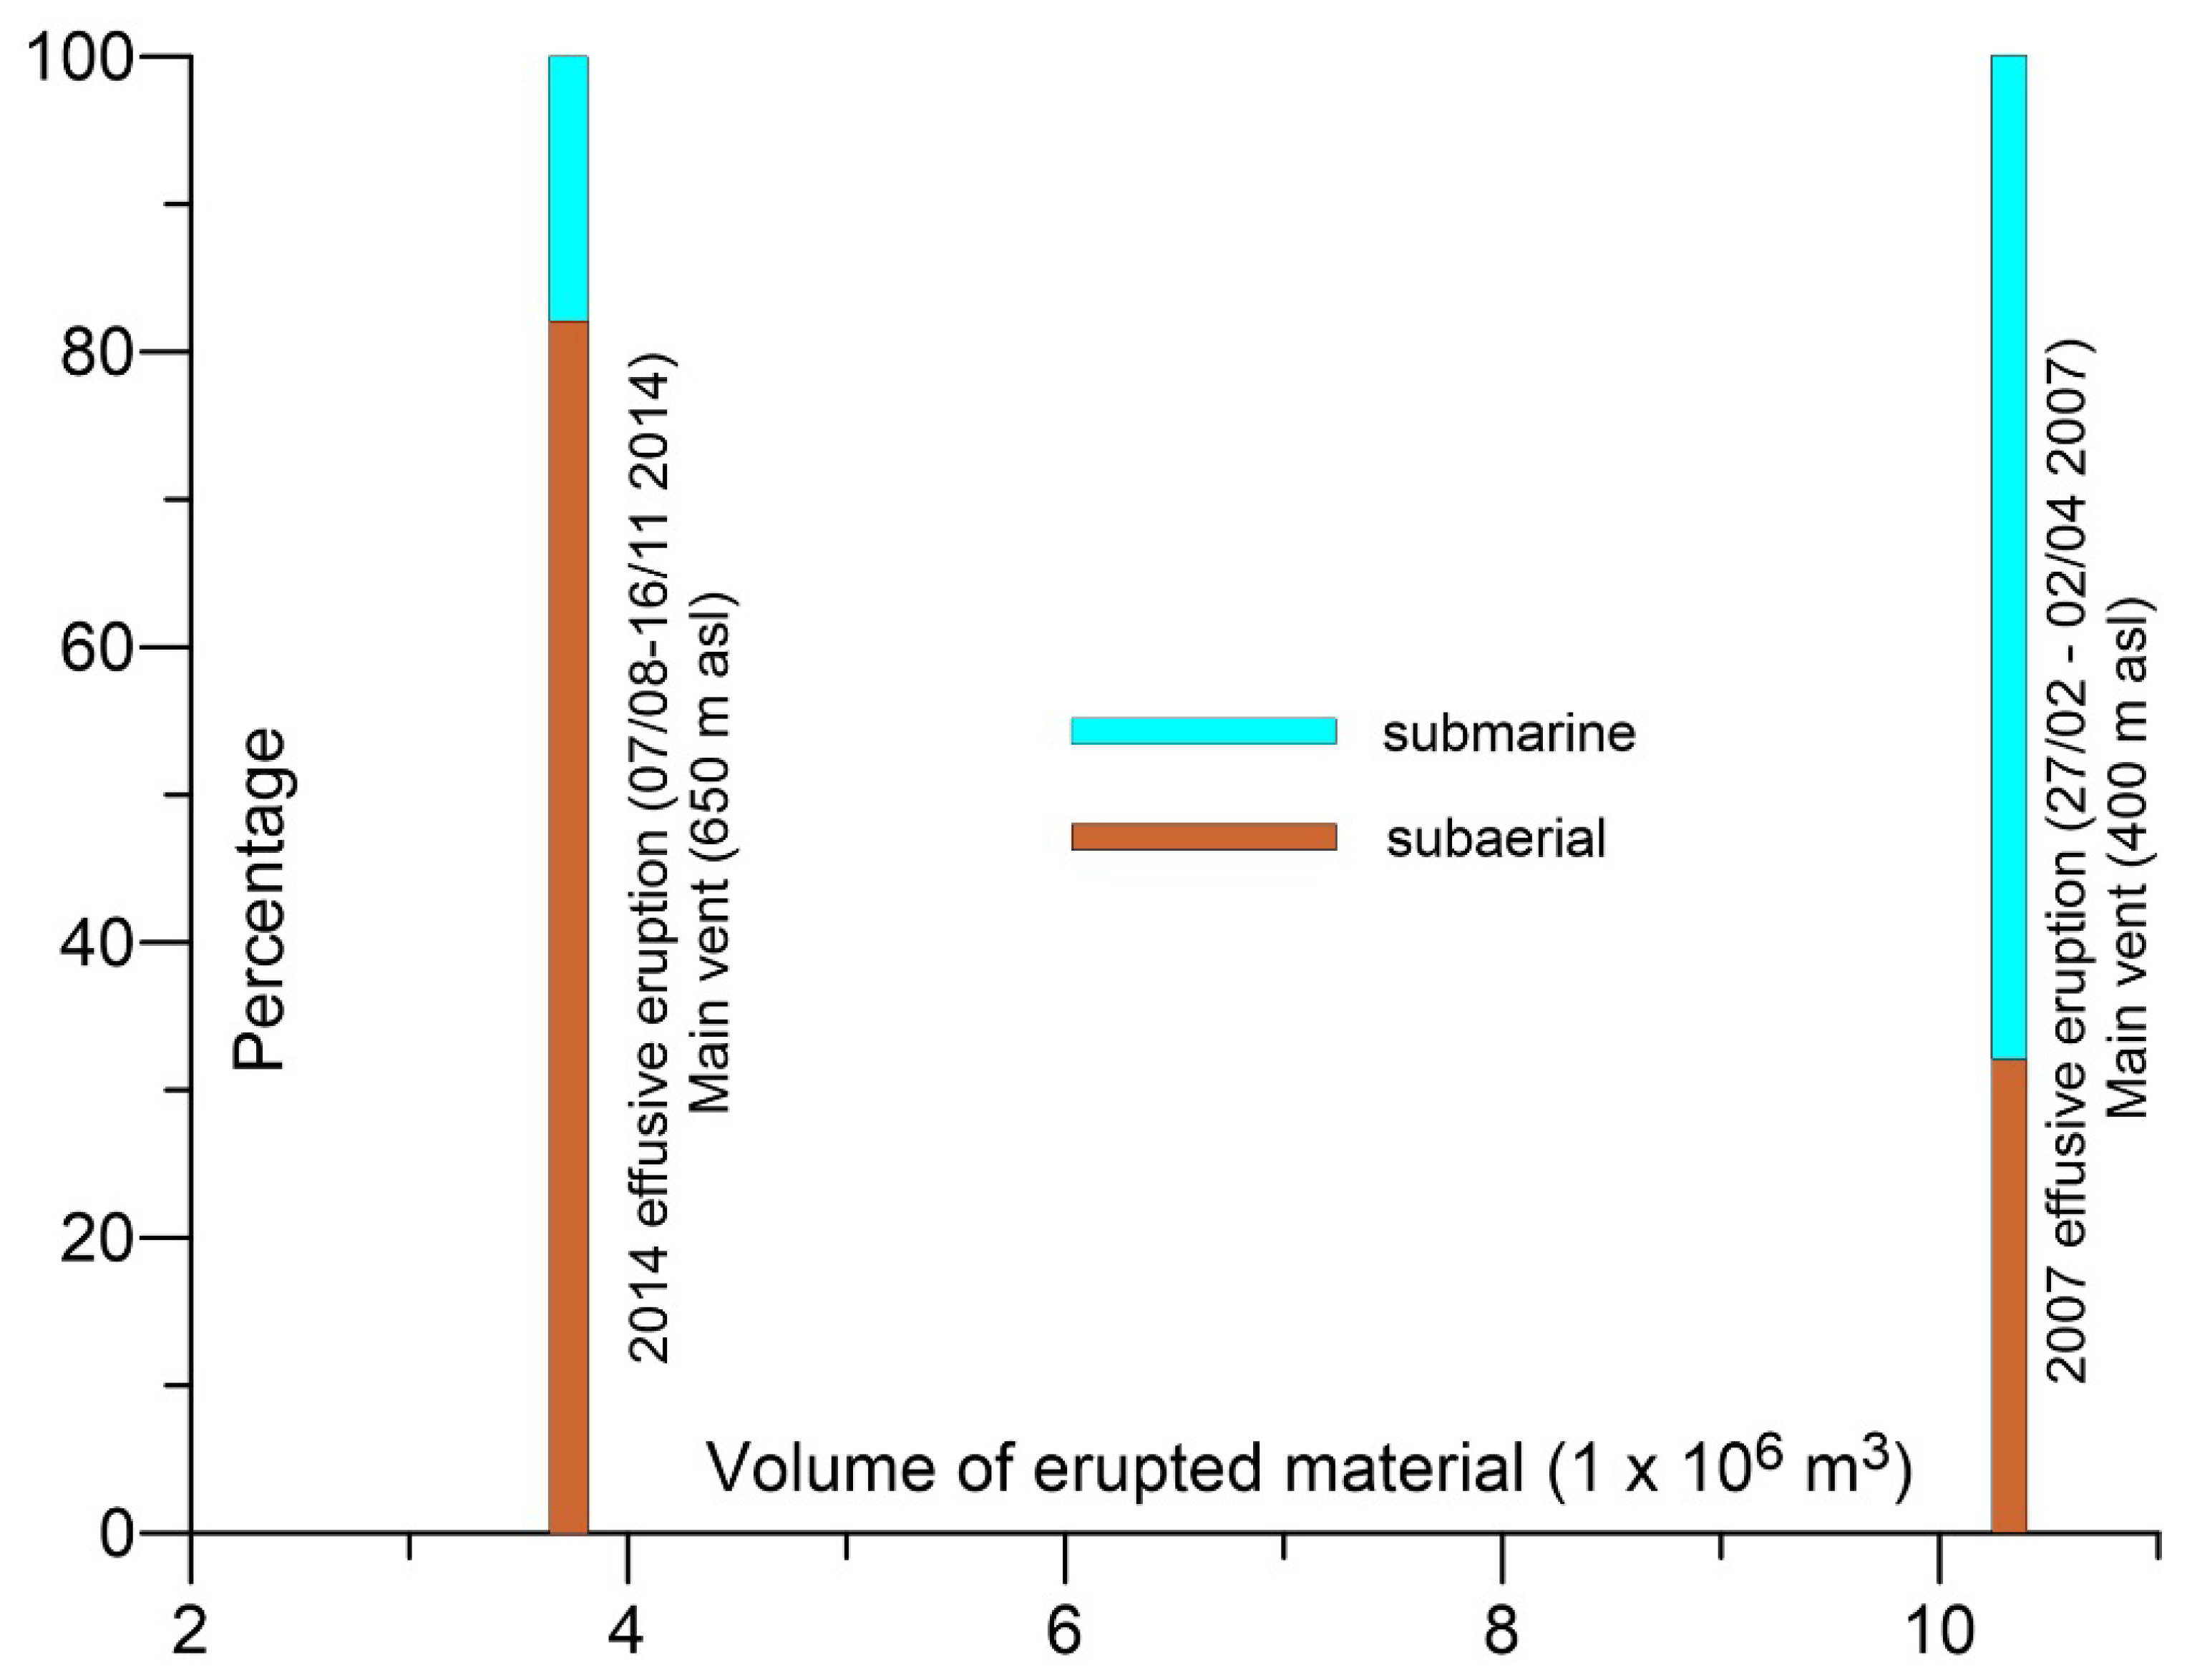
5.3. Volumetric Considerations on the 2014 Eruption and SdF Infilling
6. Conclusions
Author Contributions
Funding
Data Availability Statement
Acknowledgments
Conflicts of Interest
References
- Bosman, A.; Chiocci, F.L.; Romagnoli, C. Morpho-structural setting of Stromboli volcano revealed by high-resolution bathymetry and backscatter data of its submarine portions. Bull. Volcanol. 2009, 71, 1007–1019. [Google Scholar] [CrossRef]
- Francalanci, L.; Lucchi, F.; Keller, J.; De Astis, G.; Tranne, C.A. Chapter 13 Eruptive, volcano-tectonic and magmatic history of the Stromboli volcano (north-eastern Aeolian archipelago). Geol. Soc. Lond. Memoirs 2013, 37, 397–471. [Google Scholar] [CrossRef]
- Calvari, S.; Bonaccorso, A.; Madonia, P.; Neri, M.; Liuzzo, M.; Salerno, G.G.; Behncke, B.; Caltabiano, T.; Cristaldi, A.; Giuffrida, G.; et al. Major eruptive style changes induced by structural modifications of a shallow conduit system: The 2007–2012 Stromboli case. Bull. Volcanol. 2014, 76, 1–15. [Google Scholar] [CrossRef]
- Kokelaar, P.; Romagnoli, C. Sector collapse, sedimentation and clast population evolution at an active island-arc volcano: Stromboli, Italy. Bull. Volcanol. 1995, 57, 240–262. [Google Scholar] [CrossRef]
- Romagnoli, C.; Casalbore, D.; Chiocci, F.L.; Bosman, A. Offshore evidence of large-scale lateral collapses on the eastern flank of Stromboli, Italy, due to structurally-controlled, bilateral flank instability. Mar. Geol. 2009, 262, 1–13. [Google Scholar] [CrossRef]
- Bosellini, A. Outline of the Geology of Italy. In Landscapes and Landforms of Italy; Springer: Cham, Switzerland, 2017; pp. 21–27. [Google Scholar]
- Romagnoli, C.; Kokelaar, P.; Casalbore, D.; Chiocci, F.L. Lateral collapses and active sedimentary processes on the northwestern flank of Stromboli volcano, Italy. Mar. Geol. 2009, 265, 101–119. [Google Scholar] [CrossRef]
- Barberi, F.; Rosi, M.; Sodi, A. Volcanic hazard assessment at Stromboli based on review of historical data. Acta Vulcanol. 1993, 3, 173–187. [Google Scholar]
- Bevilacqua, A.; Bertagnini, A.; Pompilio, M.; Landi, P.; Del Carlo, P.; Di Roberto, A.; Aspinall, W.; Neri, A. Major explosions and paroxysms at Stromboli (Italy): A new historical catalog and temporal models of occurrence with uncertainty quantification. Sci. Rep. 2020, 10, 17357. [Google Scholar] [CrossRef] [PubMed]
- Giudicepietro, F.; López, C.; Macedonio, G.; Alparone, S.; Bianco, F.; Calvari, S.; De Cesare, W.; Donne, D.D.; Di Lieto, B.; Esposito, A.M.; et al. Geophysical precursors of the July-August 2019 paroxysmal eruptive phase and their implications for Stromboli volcano (Italy) monitoring. Sci. Rep. 2020, 10, 10296. [Google Scholar] [CrossRef]
- Calvari, S.; Intrieri, E.; Di Traglia, F.; Bonaccorso, A.; Casagli, N.; Cristaldi, A. Monitoring crater-wall collapse at active volcanoes: A study of the 12 January 2013 event at Stromboli. Bull. Volcanol. 2016, 78, 39. [Google Scholar] [CrossRef]
- Calvari, S.; Di Traglia, F.; Ganci, G.; Giudicepietro, F.; Macedonio, G.; Cappello, A.; Nolesini, T.; Pecora, E.; Bilotta, G.; Centorrino, V.; et al. Overflows and Pyroclastic Density Currents in March-April 2020 at Stromboli Volcano Detected by Remote Sensing and Seismic Monitoring Data. Remote Sens. 2020, 12, 3010. [Google Scholar] [CrossRef]
- De Fino, M. The Stromboli eruption of 6 December 1985–25 April 1986: Volcanological, petrological and seismological data. Rend. Soc. Ital. Mineral. Petrol. 1988, 43, 1021–1038. [Google Scholar]
- Lodato, L.; Spampinato, L.; Harris, A.; Calvari, S.; Dehn, J.; Patrick, M. The morphology and evolution of the Stromboli 2002–2003 lava flow field: An example of a basaltic flow field emplaced on a steep slope. Bull. Volcanol. 2007, 69, 661–679. [Google Scholar] [CrossRef]
- Marsella, M.; Baldi, P.; Coltelli, M.; Fabris, M. The morphological evolution of the Sciara del Fuoco since 1868: Reconstructing the effusive activity at Stromboli volcano. Bull. Volcanol. 2011, 74, 231–248. [Google Scholar] [CrossRef]
- Di Traglia, F.; Calvari, S.; D’Auria, L.; Nolesini, T.; Bonaccorso, A.; Fornaciai, A.; Esposito, A.; Cristaldi, A.; Favalli, M.; Casagli, N. The 2014 Effusive Eruption at Stromboli: New Insights from In Situ and Remote-Sensing Measurements. Remote Sens. 2018, 10, 2035. [Google Scholar] [CrossRef] [Green Version]
- Bonaccorso, A.; Calvari, S.; Linde, A.; Sacks, S.; Boschi, E. Dynamics of the shallow plumbing system investigated from borehole strainmeters and cameras during the 15 March, 2007 Vulcanian paroxysm at Stromboli volcano. Earth Planet. Sci. Lett. 2012, 357–358, 249–256. [Google Scholar] [CrossRef]
- Di Traglia, F.; Nolesini, T.; Intrieri, E.; Mugnai, F.; Leva, D.; Rosi, M.; Casagli, N. Review of ten years of volcano de-formations recorded by the ground-based InSAR monitoring system at Stromboli volcano: A tool to mitigate volcano flank dynamics and intense volcanic activity. Earth Sci. Rev. 2014, 139, 317–335. [Google Scholar] [CrossRef] [Green Version]
- Tommasi, P.; Baldi, P.; Chiocci, F.L.; Coltelli, M.; Marsella, M.; Pompilio, M.; Romagnoli, C. The Landslide Sequence Induced by the 2002 Eruption at Stromboli Volcano. In Landslides; Springer: Berlin/Heidelberg, Germany, 2005; pp. 251–258. [Google Scholar]
- Chiocci, F.L.; Romagnoli, C.; Tommasi, P.; Bosman, A. The Stromboli 2002 tsunamigenic submarine slide: Characteristics and possible failure mechanisms. J. Geophys. Res. Solid Earth 2008, 113. [Google Scholar] [CrossRef]
- Tinti, S.; Pagnoni, G.; Zaniboni, F. The landslides and tsunamis of the 30th of December 2002 in Stromboli analysed through numerical simulations. Bull. Volcanol. 2006, 68, 462–479. [Google Scholar] [CrossRef]
- Maramai, A.; Graziani, L.; Tinti, S. Tsunamis in the Aeolian Islands (southern Italy): A review. Mar. Geol. 2005, 215, 11–21. [Google Scholar] [CrossRef]
- Fornaciai, A.; Favalli, M.; Nannipieri, L. Numerical simulation of the tsunamis generated by the Sciara del Fuoco landslides (Stromboli Island, Italy). Sci. Rep. 2019, 9, 1–12. [Google Scholar] [CrossRef] [PubMed] [Green Version]
- Chiocci, F.L.; Romagnoli, C.; Bosman, A. Morphologic resilience and depositional processes due to the rapid evolution of the submerged Sciara del Fuoco (Stromboli Island) after the December 2002 submarine slide and tsunami. Geomorphology 2008, 100, 356–365. [Google Scholar] [CrossRef]
- Bosman, A.; Casalbore, D.; Romagnoli, C.; Chiocci, F.L. Formation of an ‘a’ā lava delta: Insights from time-lapse multibeam bathymetry and direct observations during the Stromboli 2007 eruption. Bull. Volcanol. 2014, 76, 1–12. [Google Scholar] [CrossRef]
- Casalbore, D.; Passeri, F.; Tommasi, P.; Verrucci, L.; Bosman, A.; Romagnoli, C.; Chiocci, F.L. Small-scale slope instability on the submarine flanks of insular volcanoes: The case-study of the Sciara del Fuoco slope (Stromboli). Int. J. Earth Sci. 2020, 109, 2643–2658. [Google Scholar] [CrossRef]
- Marsella, M.; Proietti, C.; Sonnessa, A.; Coltelli, M.; Tommasi, P.; Bernardo, E. The evolution of the Sciara del Fuoco subaerial slope during the 2007 Stromboli eruption: Relation between deformation processes and effusive activity. J. Volcanol. Geotherm. Res. 2009, 182, 201–213. [Google Scholar] [CrossRef]
- Valade, S.; Lacanna, G.; Coppola, D.; Laiolo, M.; Pistolesi, M.; Donne, D.D.; Genco, R.; Marchetti, E.; Ulivieri, G.; Allocca, C.; et al. Tracking dynamics of magma migration in open-conduit systems. Bull. Volcanol. 2016, 78, 78. [Google Scholar] [CrossRef]
- Giudicepietro, F.; Calvari, S.; Alparone, S.; Bianco, F.; Bonaccorso, A.; Bruno, V.; Caputo, T.; Cristaldi, A.; D’Auria, L.; De Cesare, W.; et al. Integration of Ground-Based Remote-Sensing and In Situ Multidisciplinary Monitoring Data to Analyze the Eruptive Activity of Stromboli Volcano in 2017–2018. Remote Sens. 2019, 11, 1813. [Google Scholar] [CrossRef] [Green Version]
- Di Lieto, B.; Romano, P.; Scarpa, R.; Linde, A.T. Strain Signals Before and During Paroxysmal Activity at Stromboli Volcano, Italy. Geophys. Res. Lett. 2020, 47. [Google Scholar] [CrossRef]
- Ripepe, M.; Donne, D.D.; Genco, R.; Maggio, G.; Pistolesi, M.; Marchetti, E.; Lacanna, G.; Ulivieri, G.; Poggi, P. Volcano seismicity and ground deformation unveil the gravity-driven magma discharge dynamics of a volcanic eruption. Nat. Commun. 2015, 6, 6998. [Google Scholar] [CrossRef] [Green Version]
- Rizzo, A.L.; Federico, C.; Inguaggiato, S.; Sollami, A.; Tantillo, M.; Vita, F.; Bellomo, S.; Longo, M.; Grassa, F.; Liuzzo, M. The 2014 effusive eruption at Stromboli volcano (Italy): Inferences from soil CO2 flux and 3 He/4 He ratio in thermal waters. Geophys. Res. Lett. 2015, 42, 2235–2243. [Google Scholar] [CrossRef]
- Inguaggiato, S.; Vita, F.; Cangemi, M.; Calderone, L. Increasing Summit Degassing at the Stromboli Volcano and Relationships with Volcanic Activity (2016–2018). Geoscience 2019, 9, 176. [Google Scholar] [CrossRef] [Green Version]
- Schaefer, L.N.; Di Traglia, F.; Chaussard, E.; Lu, Z.; Nolesini, T.; Casagli, N. Monitoring volcano slope instability with Synthetic Aperture Radar: A review and new data from Pacaya (Guatemala) and Stromboli (Italy) volcanoes. Earth Sci. Rev. 2019, 192, 236–257. [Google Scholar] [CrossRef]
- Massimetti, F.; Coppola, D.; Laiolo, M.; Valade, S.; Cigolini, C.; Ripepe, M. Volcanic Hot-Spot Detection Using SENTINEL-2: A Comparison with MODIS–MIROVA Thermal Data Series. Remote Sens. 2020, 12, 820. [Google Scholar] [CrossRef] [Green Version]
- Baldi, P.; Bosman, A.; Chiocci, F.L.; Marsella, M.; Romagnoli, C.; Sonnessa, A. Integrated subaerial-submarine morphological evolution of the Sciara del Fuoco after the 2002 landslide. In The Stromboli Volcano: An Integrated Study of the 2002–2003 Eruption. Available online: https://0-agupubs-onlinelibrary-wiley-com.brum.beds.ac.uk/doi/10.1029/182GM15 (accessed on 21 May 2021).
- Zakšek, K.; Hort, M.; Lorenz, E. Satellite and Ground Based Thermal Observation of the 2014 Effusive Eruption at Stromboli Volcano. Remote Sens. 2015, 7, 17190–17211. [Google Scholar] [CrossRef] [Green Version]
- Soule, S.A.; Zoeller, M.; Parcheta, C. Submarine lava deltas of the 2018 eruption of Kīlauea volcano. Bull. Volcanol. 2021, 83, 1–16. [Google Scholar] [CrossRef]
- Mattox, T.N.; Mangan, M.T. Littoral hydrovolcanic explosions: A case study of lava–seawater interaction at Kilauea Volcano. J. Volcanol. Geotherm. Res. 1997, 75, 1–17. [Google Scholar] [CrossRef] [Green Version]
- Poland, M.P.; Orr, T.R. Identifying hazards associated with lava deltas. Bull. Volcanol. 2014, 76, 1–10. [Google Scholar] [CrossRef]
- Moore, J.; Phillips, R.L.; Grigg, R.W.; Peterson, D.W.; Swanson, D.A. Flow of lava into the sea, 1969–1971, Kilauea volcano, Hawaii. GSA Bull. 1973, 84, 537–546. [Google Scholar] [CrossRef]
- Tribble, G.W. Underwater observations of active lava flows from Kilauea volcano, Hawaii. Geology 1991, 19, 633–636. [Google Scholar] [CrossRef]
- Di Traglia, F.; Battaglia, M.; Nolesini, T.; Lagomarsino, D.; Casagli, N. Shifts in the eruptive styles at Stromboli in 2010–2014 revealed by ground-based InSAR data. Sci. Rep. 2015, 5, 13569. [Google Scholar] [CrossRef] [Green Version]
- Di Traglia, F.; Nolesini, T.; Ciampalini, A.; Solari, L.; Frodella, W.; Bellotti, F.; Fumagalli, A.; De Rosa, G.; Casagli, N. Tracking morphological changes and slope instability using spaceborne and ground-based SAR data. Geomorphology 2018, 300, 95–112. [Google Scholar] [CrossRef]
- Ripepe, M.; Pistolesi, M.; Coppola, D.; Donne, D.D.; Genco, R.; Lacanna, G.; Laiolo, M.; Marchetti, E.; Ulivieri, G.; Valade, S. Forecasting Effusive Dynamics and Decompression Rates by Magmastatic Model at Open-vent Volcanoes. Sci. Rep. 2017, 7, 1–9. [Google Scholar] [CrossRef] [PubMed]
- Di Traglia, F.; Nolesini, T.; Solari, L.; Ciampalini, A.; Frodella, W.; Steri, D.; Allotta, B.; Rindi, A.; Marini, L.; Monni, N.; et al. Lava delta deformation as a proxy for submarine slope instability. Earth Planet. Sci. Lett. 2018, 488, 46–58. [Google Scholar] [CrossRef]
- Di Traglia, F.; Fornaciai, A.; Favalli, M.; Nolesini, T.; Casagli, N. Catching geomorphological response to volcanic activity on steep slope volcanoes using multi-platform remote sensing. Remote Sens. 2020, 12, 438. [Google Scholar] [CrossRef] [Green Version]
- Bagnardi, M.; Gonzalez, P.J.; Hooper, A. High-resolution digital elevation model from tri-stereo Pleiades-1 satellite imagery for lava flow volume estimates at Fogo Volcano. Geophys. Res. Lett. 2016, 43, 6267–6275. [Google Scholar] [CrossRef] [Green Version]
- Arnold, D.; Biggs, J.; Wadge, G.; Ebmeier, S.; Odbert, H.; Poland, M. Dome growth, collapse, and valley fill at Soufrière Hills Volcano, Montserrat, from 1995 to 2013: Contributions from satellite radar measurements of topographic change. Geosphere 2016, 12, 1300–1315. [Google Scholar] [CrossRef] [Green Version]
- Arnold, D.W.D.; Biggs, J.; Anderson, K.; Vargas, S.V.; Wadge, G.; Ebmeier, S.K.; Naranjo, M.F.; Mothes, P. Decaying Lava Extrusion Rate at El Reventador Volcano, Ecuador, Measured Using High-Resolution Satellite Radar. J. Geophys. Res. Solid Earth 2017, 122, 9966–9988. [Google Scholar] [CrossRef] [Green Version]
- Chaussard, E. A low-cost method applicable worldwide for remotely mapping lava dome growth. J. Volcanol. Geotherm. Res. 2017, 341, 33–41. [Google Scholar] [CrossRef]
- Wadge, G.; Cole, P.; Stinton, A.; Komorowski, J.-C.; Stewart, R.; Toombs, A.C.; Legendre, Y. Rapid topographic change measured by high-resolution satellite radar at Soufriere Hills Volcano, Montserrat, 2008–2010. J. Volcanol. Geotherm. Res. 2011, 199, 142–152. [Google Scholar] [CrossRef]
- Ebmeier, S.K.; Biggs, J.; Muller, C.; Avard, G. Thin-skinned mass-wasting responsible for widespread deformation at Arenal volcano. Front. Earth Sci. 2014, 2, 35. [Google Scholar] [CrossRef] [Green Version]
- Rignot, E.J.; Van Zyl, J.J. Change detection techniques for ERS-1 SAR data. IEEE Trans. Geosci. Remote Sens. 1993, 31, 896–906. [Google Scholar] [CrossRef] [Green Version]
- Carr, P.F.; Jones, B.G. The influence of palaeoenvironment and lava flux on the emplacement of submarine, near-shore Late Permian basalt lavas, Sydney Basin (Australia). J. Volcanol. Geotherm. Res. 2001, 112, 247–266. [Google Scholar] [CrossRef]
- Gregg, T.K.; Fink, J.H. A laboratory investigation into the effects of slope on lava flow morphology. J. Volcanol. Geotherm. Res. 2000, 96, 145–159. [Google Scholar] [CrossRef]
- Smellie, J.L.; Wilch, T.I.; Rocchi, S. ‘A‘ā lava-fed deltas: A new reference tool in paleoenvironmental studies. Geology 2013, 41, 403–406. [Google Scholar] [CrossRef]
- Coppola, D.; Laiolo, M.; Piscopo, D.; Cigolini, C. Rheological control on the radiant density of active lava flows and domes. J. Volcanol. Geotherm. Res. 2013, 249, 39–48. [Google Scholar] [CrossRef]


| Survey | Date | Time Elapsed | Elevation Range | Cell-Size | |||
|---|---|---|---|---|---|---|---|
| LiDAR | 4-8/05/2012 | −27 months | 0–981 m a.s.l. | 1 m | |||
| Bathymetry EM710 (70–100 kHz) | 15/2/2013 | −18 months | 25–700 mwd | 3 m | |||
| SAR amplitude COSMO-SkyMed | 8/5/2014 | −91 days | 0–981 m a.s.l. | 3 m | |||
| SAR amplitude | 24/5/2014 | −75 days | 0–981 m a.s.l. | 3 m | |||
| SAR amplitude | 9/6/2014 | −59 days | 0–981 m a.s.l. | 3 m | |||
| SAR amplitude | 25/6/2014 | −43 days | 0–981 m a.s.l. | 3 m | |||
| SAR amplitude | 11/7/2014 | −27 days | 0–981 m a.s.l. | 3 m | |||
| SAR amplitude | 27/7/2014 | −11 days | 0–981 m a.s.l. | 3 m | |||
| SAR amplitude | 12/8/2014 | +5 days after the onset | 0–981 m a.s.l. | 3 m | |||
| Bathymetry Teledyne Reson 7125 (455 kHz) Teledyne Reson 8160 (45 kHz) | 1/1/2016 | +14 months | 10–100 mwd 50–700 mwd | 1–3 m | |||
| Photogrammetric PLÉIADES tri-stereo | 26/05/2017 | +30 months | 0–981 m a.s.l. | 1 m | |||
| CSK-SAR dataset description: COSMO-SKYMED | |||||||
| Wavelength: 3.12 cm | Geometry: Descending | Sensor mode: H4-01 | Track: 98 | ||||
| Line of sight angles | 25.48° | 11.19° | |||||
| Line of sight versors | V: 0.903 | N: −0.084 | E: 0.422 | ||||
| 2013–2016 submarine morphological changes | Volume (m3) |
| Seafloor accretion (10–500 mwd) | ≈+1.75 × 10⁶ m3 |
| Seafloor erosion (10–500 mwd) | ≈−3.5 × 10⁵ m3 |
| 2014 Eruption (accretion and erosion) | Volume (m3) |
| Main subaerial lava flows in the NE part of the SdF | ≈2.7 × 10⁶ |
| Subaerial lava flows in the central part of the SdF | ≈3.5 × 10⁵ |
| Total subaerial volume related to the 2014 eruption | ≈3.05 × 10⁶ |
| Seafloor accretion off the main lava flows (A2 and A3) | ≈3.3 × 10⁵ |
| Seafloor accretion in the central part of the SdF (A1) | ≈1.5 × 10⁵ |
| * Seafloor accretion inferred within the first 10 mwd | ≈2 × 10⁵ |
| Total submarine volume related to the 2014 eruption | ≈6.8 × 10⁵ |
| Total volume related to the 2014 eruption | ≈3.73 × 10⁶ |
| Main submarine landslide related to the 2014 eruption | ≈−3.5 × 10⁵ |
| Submarine landslide deposits related to the 2014 eruption (A4) | ≈6 × 10⁵ |
| Volcaniclastic material in the central part of the SdF | Volume (m3) |
| Volcaniclastic in the subaerial slope (first 500 m a.s.l.) | ≈1.35 × 10⁶ |
| Volcaniclastic in the submarine slope (10–250 mwd) | ≈4.9 × 10⁵ |
| * Volcaniclastic inferred in the submarine slope (<−10 mwd) | ≈2.1 × 10⁵ |
| Total volcaniclastic in the submarine slope | ≈7 × 10⁵ |
| Total volcaniclastic material in the SdF slope | ≈1.84 × 10⁶ |
Publisher’s Note: MDPI stays neutral with regard to jurisdictional claims in published maps and institutional affiliations. |
© 2021 by the authors. Licensee MDPI, Basel, Switzerland. This article is an open access article distributed under the terms and conditions of the Creative Commons Attribution (CC BY) license (https://creativecommons.org/licenses/by/4.0/).
Share and Cite
Casalbore, D.; Di Traglia, F.; Bosman, A.; Romagnoli, C.; Casagli, N.; Chiocci, F.L. Submarine and Subaerial Morphological Changes Associated with the 2014 Eruption at Stromboli Island. Remote Sens. 2021, 13, 2043. https://0-doi-org.brum.beds.ac.uk/10.3390/rs13112043
Casalbore D, Di Traglia F, Bosman A, Romagnoli C, Casagli N, Chiocci FL. Submarine and Subaerial Morphological Changes Associated with the 2014 Eruption at Stromboli Island. Remote Sensing. 2021; 13(11):2043. https://0-doi-org.brum.beds.ac.uk/10.3390/rs13112043
Chicago/Turabian StyleCasalbore, Daniele, Federico Di Traglia, Alessandro Bosman, Claudia Romagnoli, Nicola Casagli, and Francesco Latino Chiocci. 2021. "Submarine and Subaerial Morphological Changes Associated with the 2014 Eruption at Stromboli Island" Remote Sensing 13, no. 11: 2043. https://0-doi-org.brum.beds.ac.uk/10.3390/rs13112043