1. Introduction
Today, remotely sensed data are valuable sources of information for disaster management and satellite-based emergency mapping (SEM) is increasingly used by actors involved in emergency response activities [
1,
2,
3,
4]. They are an independent source of information, able to cover large areas, which is especially relevant in the absence of precise information on the location and extent of the impacted area. Furthermore, they allow obtaining information for areas that are difficult to access, relatively quickly and with less effort than a field visit would involve. Besides technological improvements which have greatly enhanced the capability of satellites to capture the impact of disasters (spatial and spectral resolution, frequency of observations), the operationalization of workflows ranging from the tasking to the delivery of value-added information products to a user has boosted this development. The most relevant international SEM mechanisms today are the International Charter for Space and Major disaster (the Charter, [
5]), Sentinel Asia [
6], UNOSAT Rapid Mapping Service of the United Nations [
7], and the Copernicus Emergency Management Service (CEMS) [
8]. Some countries have setup their own national capacity such as the Satellitengestützter Krisen- Und Lagedienst in Germany [
9] (since 2021 replacing DLR’s Zentrum für Satellitengestützte Kriseninformation [
10]) or SERTIT-ICube’s Service de Cartographie Rapide in France [
11].
The timeliness of crisis-information delivery is key to the success of SEM and involved actors continuously strive to improve workflow efficiency for faster crisis information delivery. While there are certain limitations set by the satellite technology, such as orbits and latency, there are ways to fine-tune the SEM workflow as a whole.
The key to the effectiveness of SEM is the acquisition of satellite images, given that they are the main source of information. Experience shows that satellite image acquisition takes most of the time in SEM ([
2,
12]) and it is one of the aspects to address to improve the SEM workflow.
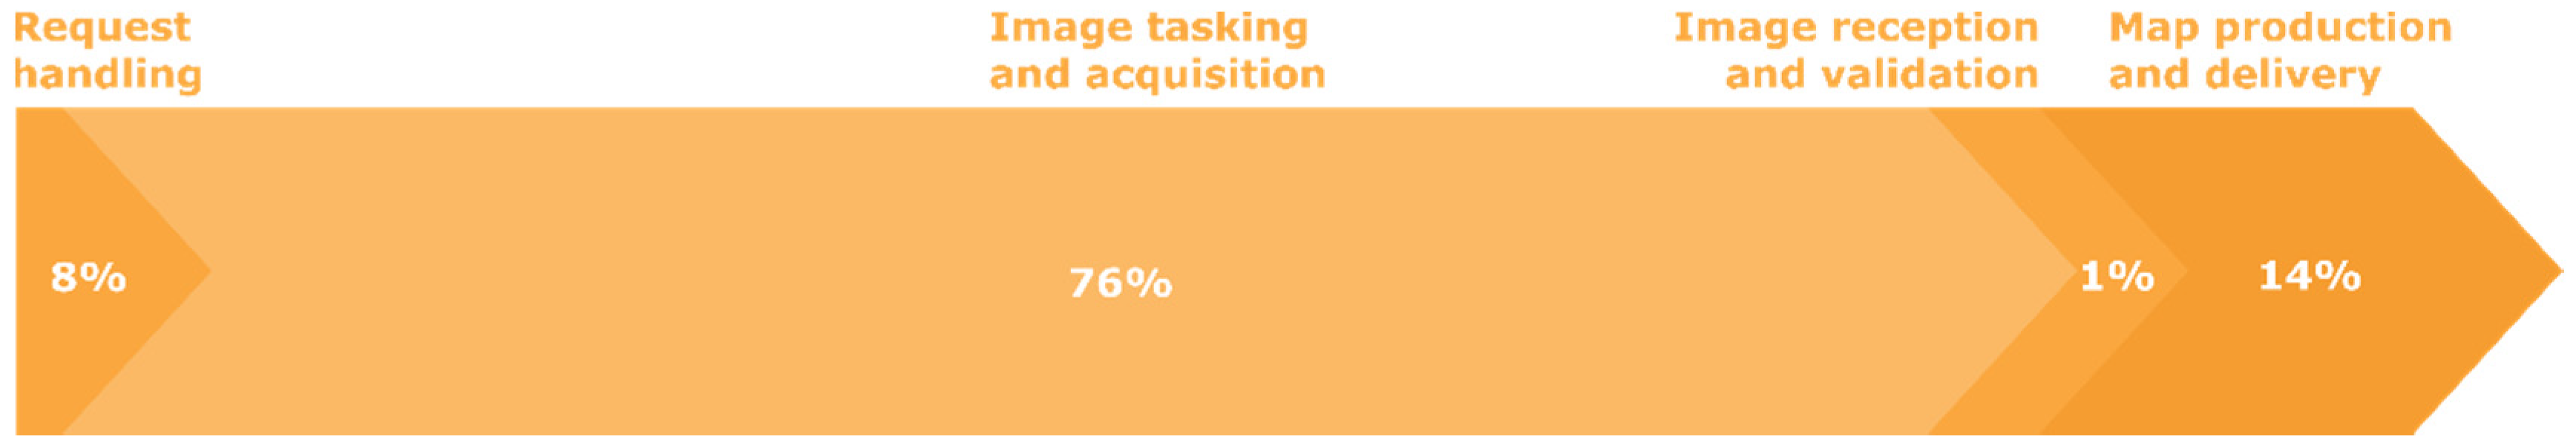
Figure 1 shows how this impacts the satellite-based emergency mapping service of the Copernicus Emergency Management Service—Rapid Mapping (RM) where, on average, satellite tasking and acquisition together cover up to 76% of the entire workflow. The resulting delay between a request and image acquisition often prevents geospatial data providers from capturing the initial phases or the peak of maximum intensity of a hazardous event. This is aggravated by the fact that a user acts in an emergency context and is typically not an expert in remote sensing technology and therefore not necessarily aware of the implications of satellite latency.
For certain hazardous events, such as riverine floods, the request from a user to map a certain area is usually submitted after the flood has started. Early warning for upcoming floods in a specific area can potentially reduce this time and thus increase the efficiency of the service. The forecasting capacity of early warning systems (EWS) may help strategic planning of the satellite image acquisition based on the predicted timing and potential impact of the event. This has two positive consequences. Firstly, the likelihood of acquiring a useful image improves. Reliable predictions of an event, such as a flood, increase the chance of capturing the early phases of that flood and the maximum flood extent. This provides additional relevant information for service activation. As satellites move along fixed orbits, they can only view the earth at specific moments in time and many satellites need to be programmed to acquire an image. Proactive data acquisition increases the number of opportunities that a satellite has to capture an event. Overall, this improves the likelihood of acquiring images at a critical moment. Secondly, in SEM which often requires to be triggered by a user, instead of waiting for a formal request, the system proactively triggers the tasking of image acquisitions at the time predicted by the EWS. The earlier information availability can significantly improve the overall situational awareness and effective crisis response.
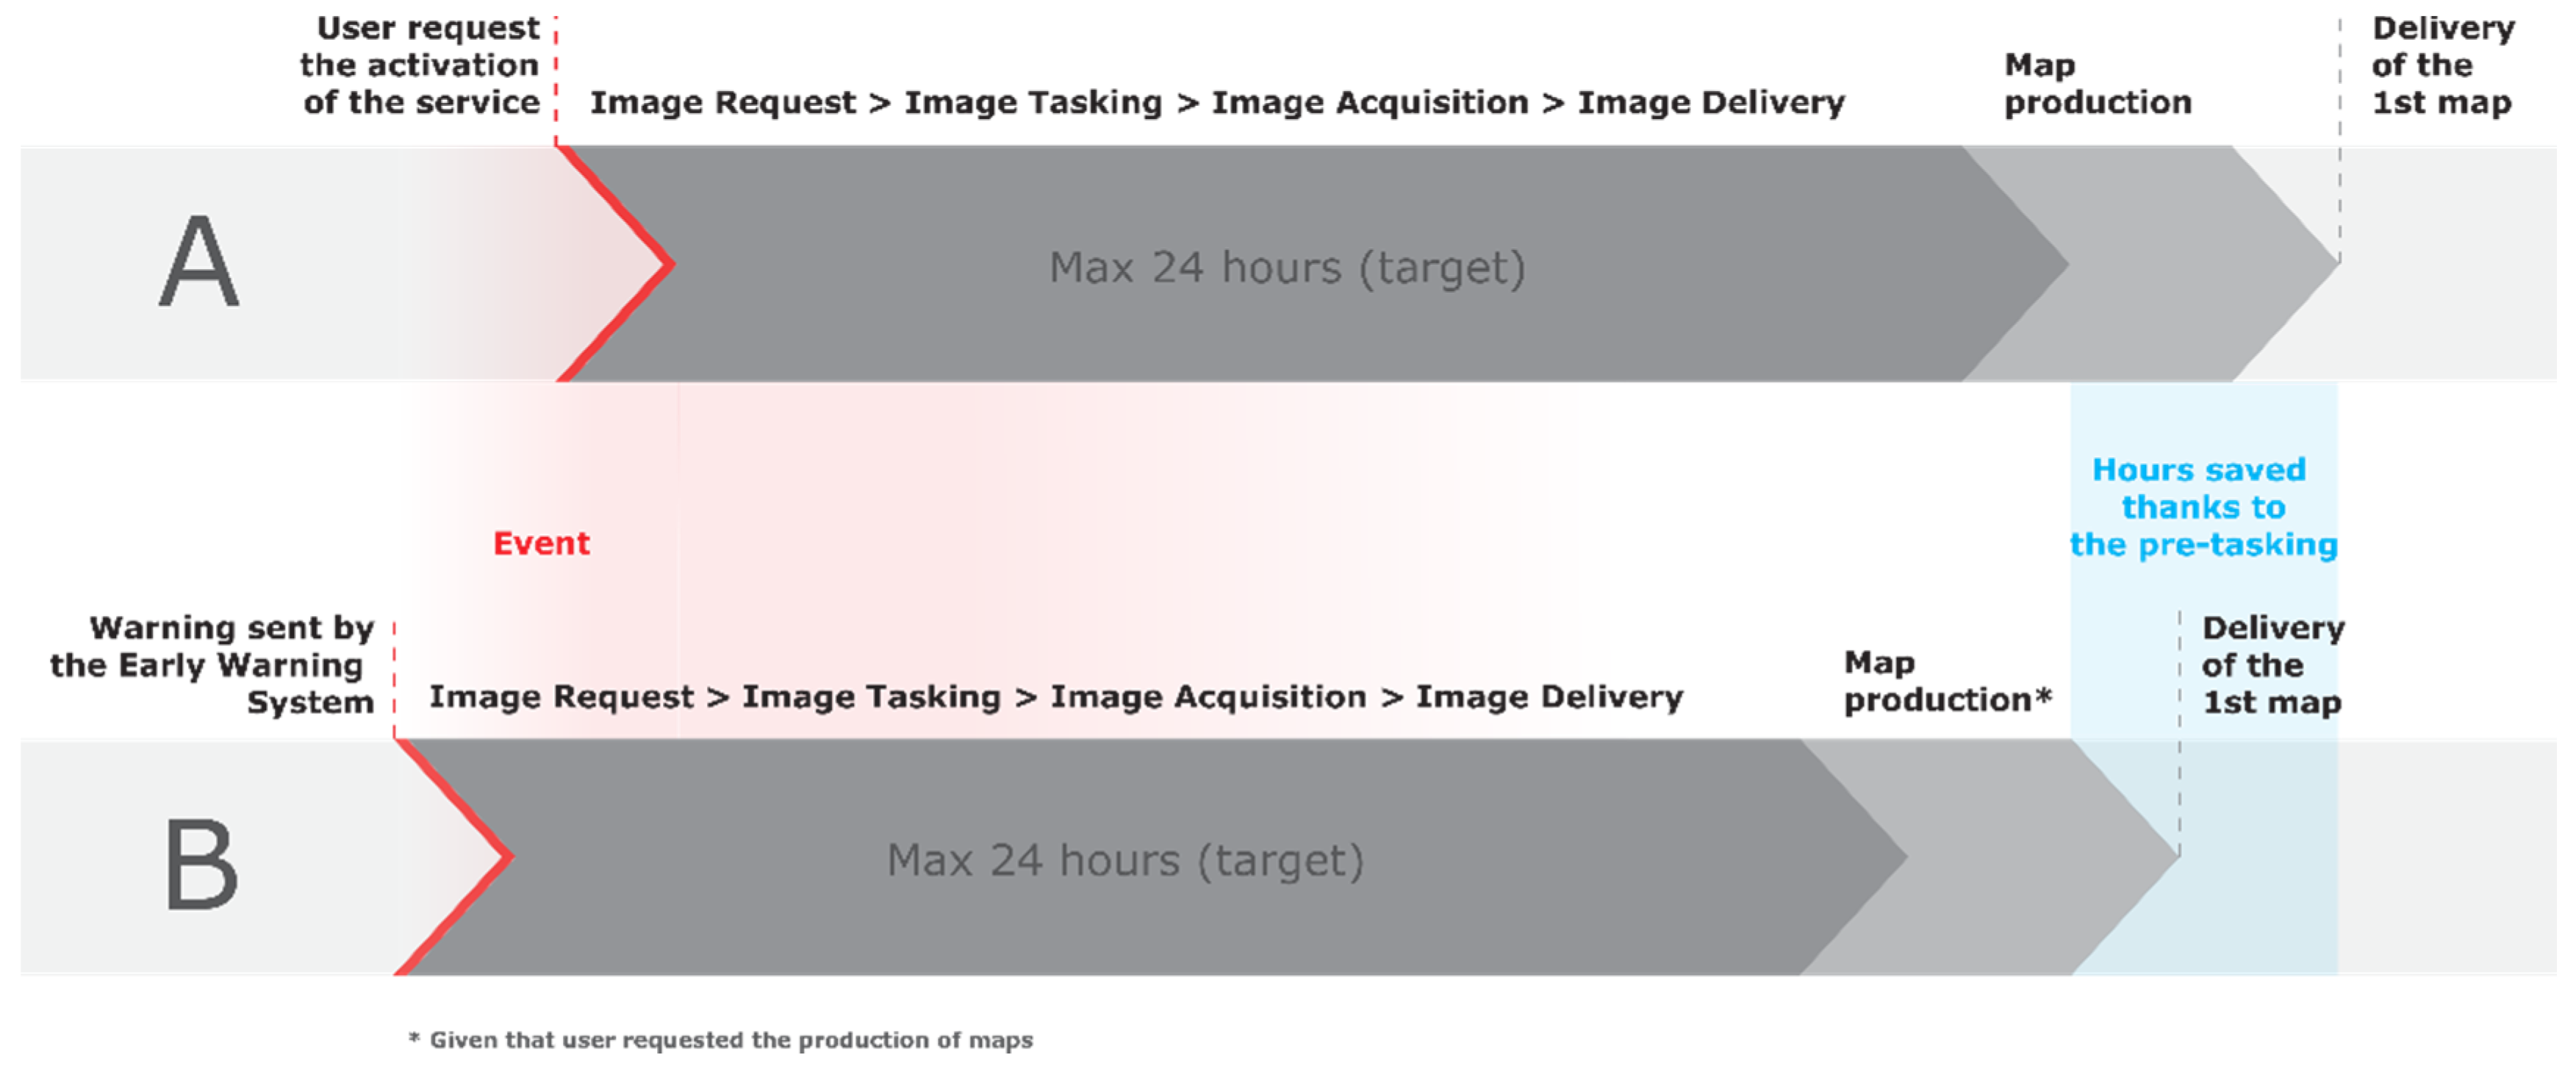
We believe that integrating EWS in SEM overall helps to deliver relevant crisis information shortly after the onset of an event, and earlier than with the standard SEM workflow.
Figure 2 shows how the concept would affect the SEM workflow, comparing the standard workflow with the integrated workflow using EWS. Thanks to the warning sent by the EWS (scenario B), the delivery of the first product would happen temporally closer to the event than without the EWS warning (scenario A).
The concept of integrating EWS predictions in SEM workflows was addressed in a white paper of the International Working Group for Satellite-based Emergency Mapping (IWG-SEM), which provides an inventory of existing early warning systems [
1]. Most show pertinent information related to possible damaging, disrupting events, but do not necessarily push out alerts. The working group concluded that potential flood prediction alerts and storm impact systems are the most advanced and integrated into rapid mapping activation workflows. Ajmar et al. [
3] explored and evaluated the use of GDACS for more timely satellite tasking following alerts for tsunamis.
Besides this, there is no other similar evidence of efforts in this area. Most SEM services or mechanisms providing satellite data for emergency situations imply a triggering process from a user. This relies above all on the user’s knowledge about the location and dynamics of a disaster. With our approach, we aim at supporting the decision-making process of SEM users with the information they might not have at this level of detail and which often is not from their domain.
Over the past five years, efforts were made in CEMS to explore synergies between the EWS and SEM components. CEMS is one of the six core services of the Copernicus program of the European Union and one of the most operationalized SEM mechanisms. The focus for linking EWS and SEM in CEMS was on establishing a pilot procedure for riverine flood events which would link the European Flood Awareness System (EFAS) with the Rapid Mapping component (RM) [
13]. This paper describes the procedure and summarizes the results of the test phase since mid-2016. The conclusions will contribute to the review of the pilot procedure. Our results show that the EFAS based pre-tasking improves the timeliness of the first product delivery and this is mostly because images could be acquired earlier than in activations that were not related to pre-tasking. Furthermore, it supports activating users in the decision process and overall raises awareness about EFAS.
Section 2 describes the framework under which this pilot procedure was run, the procedure linking EFAS with the Rapid Mapping module and the base dataset used in this study.
Section 3 summarizes the main results and focuses on the comparison of activation timestamps with and without pre-tasking (
Section 3.1), the analysis of reported and forecasted timing of flood events (
Section 3.2), the comparison of EFAS and user-defined Areas of Interest (AOIs) (
Section 3.3). Furthermore, more details are provided for two example activations (
Section 3.4).
In
Section 4 we discuss the efficiency of the EWS, focusing on our hypothesis that the flood EWS increases the timeliness of SEM-based flood mapping, and discuss future developments.
In
Section 5 we summarize the conclusions from this pilot test phase and make recommendations for a review of the procedure.
2. Materials and Methods
This study uses the experience from the Copernicus Emergency Management Service (CEMS,
https://emergency.copernicus.eu/, accessed on 15 March 2021), which supports all actors involved in the management of natural or manmade disasters by providing geospatial data and images for informed decision making. CEMS constantly monitors Europe and the globe for signals of an impending disaster or evidence of one happening in real-time. The service immediately notifies national authorities of their findings or can be activated on-demand and offers to provide them with maps, time series or other relevant information to better manage disaster risk. CEMS products are created using satellite, in-situ (non-space) and model data.
CEMS consists of two main components: the early warning and monitoring component and the on-demand Mapping component. The first provides continuous disaster forecasting and monitoring information to assist with preparedness and emergency response for floods, droughts and forest fires. The second provides on-demand support to emergency management activities in the immediate aftermath of any kind of natural disaster or to support disaster management activities including prevention, preparedness, risk reduction and recovery phases. During the past five years, efforts have been made to explore synergies between these two components. This study presents the outcomes of the efforts aiming at linking the European Flood Awareness System (EFAS) with the Rapid Mapping module to increase the timeliness of the provision of crisis information for riverine flood events.
2.1. CEMS Rapid Mapping
The Rapid Mapping module is an on-demand 24/7 service with highly standardized workflows and products to allow very fast handling of mapping requests, tasking of satellites, map production and dissemination. The service aims at providing crisis information within a max of 24 h after a user has requested it. Authorized users can request the activation of the service, including National Focal Points (NFPs) in European Union Member States and in most countries participating in the European Civil Protection Mechanism as well as European Commission Services, the Situation Room of the European External Action Service (EEAS) and the EU delegations. All mapping products are available for free on the portal and in the activation viewer (except for sensitive activations).
The Rapid Mapping service offers four standard products: one pre-event product (reference) and three post-event products (delineation, grading and the first estimate, the latter introduced in April 2019). A detailed description of the service portfolio is available at
http://emergency.copernicus.eu/mapping/ems/rapid-mapping-portfolio, accessed on 15 March 2021.
Table 1 gives an overview of the products and delivery times in the fastest production mode (service level 1, 24/7). While the delineation product informs about the event’s impact and its extent, the grading product focuses on providing information about the damage grade, its spatial distribution and extent. Both products are derived from images acquired as soon as possible after the emergency event. The first estimate product (FEP) instead is an early information product that aims at providing an extremely fast (yet rough) assessment of most affected locations within the area of interest. Such information is derived from the earliest suitable available post-event image (which could also have been acquired before the activation start). A user can choose between any of these products and is meant to specify their choice when submitting the request to activate the service.
Satellite imagery is provided through the REACT mechanism (Rapid Emergency Activation for Copernicus Tasking), which is a dedicated mechanism for emergency requests provided under the Space Component of the Copernicus program. REACT gives access to the archive and new acquisitions from ca. 30 different Copernicus Contributing Missions (CCM). These are in addition to the publicly available Sentinel data and complementary as the portfolio of missions covers all resolution classes for both optical and SAR sensors (
https://spacedata.copernicus.eu/data-offer/missions, accessed on 15 March 2021).
From its start in April 2012 until December 2020, the Rapid Mapping service has been activated 491 times. As an on-demand service, the volume varies over time and as the service evolved, the number of activations per year has continuously increased, levelling out during the past four years to 5 to 6 activations per month on average. Among the main event types, flood is the one for which the service is activated most with 35% of all activations corresponding to 173 activations (25% wildfires, 14% storms, 5% earthquakes, 21% for other events including landslides, volcanic eruptions, humanitarian crisis, epidemics, industrial accidents). Since April 2017 it is distinguished in the database between four flood types: the large majority of flood activations were for riverine floods (69%), while flash floods account for 24.7%, coastal floods for 4.1% and ice jam-related floods for 2.1%.
Concerning the location of the events, 60.6% of the 491 activations were for events located in Europe and 61.2% of all riverine floods mapped by the service occurred in Europe.
The most common product provided in flood activations is the delineation product, followed by the relatively new FEP. Grading products are provided much less frequently and then only in the later stage and once the flood has retreated.
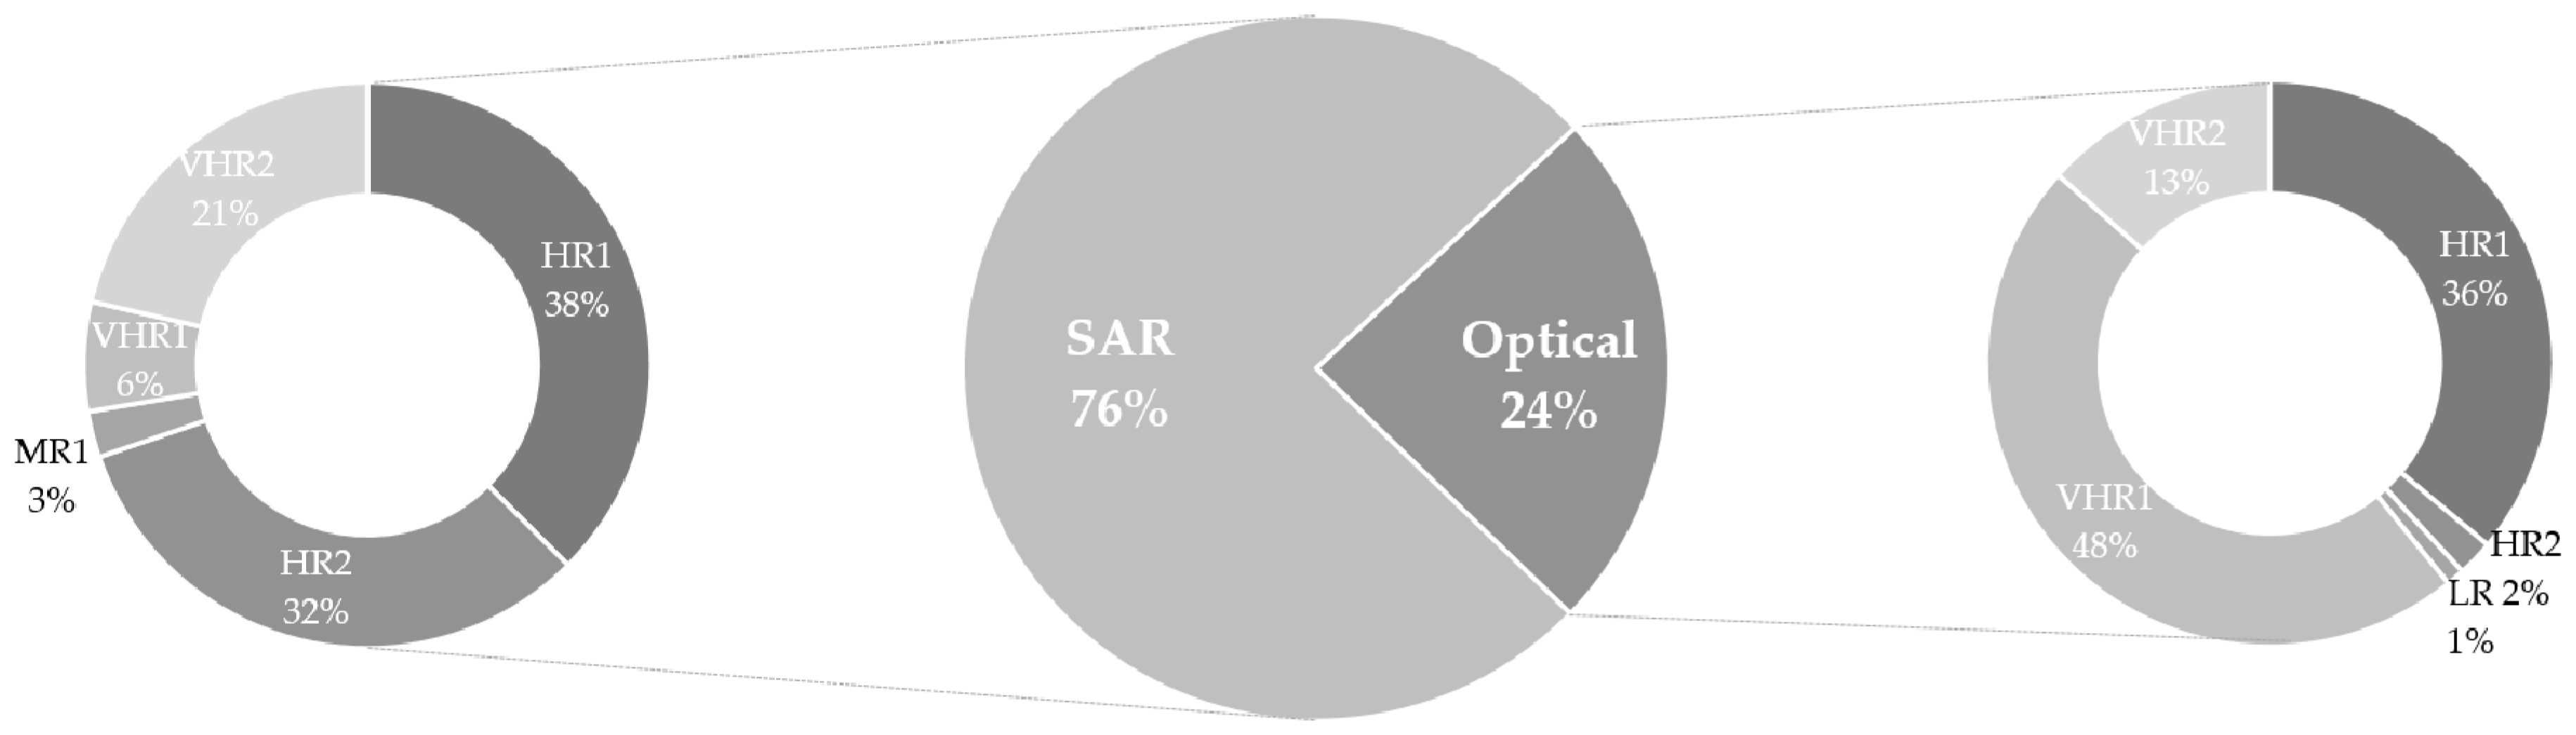
Figure 3 shows the share of sensor types (optical or SAR) and resolution classes in the images used for riverine flood-related post-event products between May 2016 and December 2020. SAR images were used in 76% of the cases. As also stated in [
2] for previous years, SAR data are mostly used for mapping the impact of floods. This sensor type is known to be advantageous with its all-weather and all-light capabilities especially for adverse weather events causing flooding. In addition, its all-light capabilities offer the possibility to acquire an image twice per day, i.e., for both the morning and evening pass over Europe.
The analyzed SAR images are typically in the two lower resolution classes with 38% being between 4 and 10 m (HR1) and 32% between 10 and 30 m resolution (HR2). This reflects a compromise between the need to cover the large areas which are usually involved in flood events and the provision of sufficient spatial detail on which to base further analysis and decision making.
2.2. CEMS Early Flood Awareness System (EFAS)
The European Flood Awareness Systems (EFAS) is an operational pan-European flood forecasting and monitoring system. EFAS provides a wide range of early flood forecasting information to support European, national and regional authorities responsible for flood risk management and arranging preparatory measures before an event strikes. Specifically, EFAS provides hydrological (river flow) forecasts and observations across Europe and neighboring countries for riverine and flash flood events. In addition, the service also estimates and maps the potential socio-economic impact of riverine flood events ([
14]). More details are available on the EFAS website (
www.efas.eu, accessed on 15 March 2021).
2.3. EFAS-Based Pre-Tasking in CEMS
In 2016 the pre-tasking workflow was developed to integrate EFAS into the Copernicus Rapid Mapping workflow ([
13]). EFAS is used to pre-task satellites over areas with the highest likelihood to be flooded. This is in view of a possible RM activation during which the pre-tasked image will be analyzed. Pre-tasking accordingly would allow monitoring a critical flood situation to support emergency management and capturing the largest flood extent for post-event damage assessments.
For this system to be effective, a command chain was set up with a clear workflow to follow.
Figure 4 shows the workflow with the five main steps and the actors involved.
(1) In the first step, EFAS sends a notification by e-mail simultaneously to the Emergency Response Coordination Centre (ERCC), the EFAS partners, which are mainly the relevant flood forecasting authorities, and the rapid mapping service provider. This notification includes information about the expected flood (e.g., expected event peak, recommended acquisition window, potentially affected area) and constitutes a request for pre-tasking for the service provider.
(2) In Step 2 therefore, the service provider starts coordinating with REACT about the acquisition of images over a specific area(s) within a specific time window. In parallel, the ERCC informs the authorized user of RM about the notification sent by EFAS and asks about his/her interest in activating the service for this event.
(3) In Step 3, the rapid mapping service provider sends the schedule of the image acquisition to the ERCC, following the coordination work with REACT in Step 2.
(4) In Step 4, the ERCC forwards this information to the user.
(5) Depending on the user’s decision, Step 5 can result in (i) the delivery of maps in case the user decided to request the activation of the service; (ii) the cancellation of the image tasking in case the user replied that he/she is not interested in requesting the activation of the service; and (iii) the archiving of the image acquired in case no answer was received from the user.
For this system to be effective in potentially high impact events, an alert is sent simultaneously to national/local EFAS partners and authorities in the field, and to the satellite operators. Satellite operators can begin tasking images immediately following an EWS prediction. In the event of an alert, the national/local partners and authorities are informed about the high risk forecasted by EFAS. Partners can compare data provided against their own EWS and other information sources. They can also take action if needed. This includes suggesting to the authorized user of RM to trigger the service. Typically, the EFAS partners and the Rapid Mapping authorized users in one country are not the same organization. While the former generally denotes hydro-meteorological authorities, the latter is the national Civil Protection Agency. Coordination between both entities is expected to increase the efficiency of the procedure. The RM analysts and map producers can start analyzing the data as soon as the first image becomes available. The outcome of the analysis is delivered to local/national partners and authorities within hours.
According to the procedure, the pre-tasking request is issued by EFAS ca. 48 h before the start of the expected event. Conventionally, in the pre-tasking workflow, the expected event start corresponds to the timing when the EFAS ensemble mean exceeds the EFAS 5-year return level for the first time. This threshold was selected to identify the moment when a flood wave might reach a potentially dangerous condition, thus requiring monitoring of the flood event and possible consequences. Note that when the hydrological situation is more complex (complex river network or presence of flood control structures) or the forecast uncertainty is extremely high, the pre-tasking timing may be shorter than 48 h. EFAS adopts a risk matrix as guiding criteria to trigger pre-tasking, considering the potential impact on the population and the likelihood of occurrence, the latter evaluated as the time to flood peak. Pre-tasking is generally done for the events with a high likelihood of medium impact (>1000 people affected and 24 h of lead time to the flood peak) and/or events with medium to high likelihood of high impact (>10,000 people affected and up to 48 h of lead time to the flood peak). However, the pre-tasking can also be activated for events with different probabilities of occurrence and potential impact. Even though EFAS also provides flood forecast information with lead times > 48 h, the pre-tasking request is issued for lead times < 48 h to reduce forecast uncertainty and because this time window is usually sufficient to have at least one satellite pass over the area of interest.
The tasking request is a priori targeting SAR 10–30 m resolution data. With EFAS notifications being issued in general twice per day at 9:00 and 15:00 CET, this means both the morning and evening SAR satellite passes can be possibly tasked first. The request consists of an email which is sent to the Rapid Mapping service provider, containing the following information: short description of the situation, phenomenon type, expected start of the event, expected event peak, expected duration (days), recommended acquisition window (start and end date), affected country(s), regions, major city(s) and river basins. Together with the request, areas of interest (AOI) are also provided for those considered most at risk of being affected by the flood event.
2.4. Data
For this study, we used all EFAS pre-tasking requests and RM activations in the fastest production mode (service level 1) between 1 June 2016 and 31 December 2020. During this period, RM was activated 327 times, of which 77 were for riverine flood events (excluding flash floods, coastal floods, floods due to ice jam), called from now on simply “flood activations” (
Table 2). Of those 77 flood activations, 50 were in Europe (note that EFAS covers only Europe) and 14 of these were preceded by an EFAS pre-tasking request. In addition to these 14, there were another 18 EFAS based pre-tasking requests that were not followed by an RM activation.
Table 3 below shows all 14 activations which followed an EFAS pre-tasking request, with the timestamps of the request and the activation start (see
Section 2.5 for the description of each). We used the timestamps as registered by the RM service provider and by EFAS. All timestamps in this study are in UTC. In addition, we used the areas of interest provided with the EFAS pre-tasking request and those provided by the user when requesting the activation of RM (as part of the service request form).
2.5. Methods
Obtaining a flood map (called first product in the following), once an RM activation has started, requires acquiring an image, receiving this image and producing a product based on this image (including analyzing it). We analyzed the delivery timeliness of the first product based on pre-tasked images using the following timestamps (in brackets the term used throughout the manuscript for this timestamp):
Time when the EFAS pre-tasking request was sent to the RM service provider (EFAS pre-tasking request);
Time of the flood peak forecasted by EFAS according to the predicted flow (EFAS ensemble mean) at the most representative locations (either real gauging station or dynamically created hydrologically relevant locations) for a certain river stretch under consideration (EFAS forecasted peak);
Time of the start of the EFAS recommended acquisition window according to the predicted flow (EFAS ensemble mean) at the most representative locations (either real gauging station or dynamically created hydrologically relevant locations) for a certain river stretch under consideration (start of the acquisition window);
Time of the flood peak observed, according to either river discharge measurements (where available in EFAS databases) or post-event EFAS simulations based on observed meteorological data (observed peak);
Time of the RM activation start, which corresponds to the time when the RM service provider receives the request for activation (activation start);
Time of the event, as indicated by the user requesting activation of the RM service (user-defined event time);
Time of the 1st image acquisition (as a consequence of the EFAS pre-tasking request) (image acquisition);
Time of the 1st image reception (image delivery);
Time for the delivery of the first product, which corresponds to the time when the very 1st rapid mapping product (vector or raster package) is delivered to the user (first product delivery).
Figure 5 shows the sequence of the various time stamps. While the sequence of EFAS pre-tasking request, user-defined event time, activation start, EFAS forecasted peak and first product delivery are stable, records show that the image acquisition can be before or after the activation start, before or after the EFAS forecasted peak, and is almost always within the recommended EFAS acquisition window.
The timestamps of an EFAS pre-tasking request and RM activation are driven by the dynamics of the event. In comparison, satellite passes and related cut-off times for the submission of tasking requests are predefined and entirely independent from disaster events. The event-specific SEM activities, such as image ordering, therefore fit into this pre-set sequence as relevant and feasible, always aiming at the fastest delivery of crisis information. Sometimes a useful image is already available when the activation starts (whether as a result of the pre-tasking or not) and is then used for the production of the first product.
In order to assess the influence of the pre-tasking on the delivery timeliness of the first product, the difference between the timestamps was computed using as reference the start of the RM activation. It marks the start of the RM production workflow and therefore sets the baseline for the time accounting in the provision of crisis information.
Furthermore, we compared the location of areas of interest defined for the pre-tasking by EFAS with those submitted by the user at RM activation request. While these are crucial for starting any SEM activity and essential for its efficiency, defining AOIs in emergency situations is challenging for RM users. With the comparison of the AOIs, we aim at assessing the added value of using EFAS to support this task.
3. Results
3.1. Influence of Pre-Tasking on the Delivery Time of the First Product
Table 4 shows the time when the first product was available in RM activations for floods, distinguishing between those which were related to a pre-tasking request and those which were not. It also shows the average times needed for each of the three intermediate steps leading to the delivery of the first product. In general, the time differences are smaller for activations related to EFAS pre-tasking. The effect of the pre-tasking is most visible in the delivery times of the first product and image acquisition time. For the 14 activations related to an EFAS pre-tasking request, the first crisis information provided was delivered on average 16:05 h after the activation start. Without pre-tasking, the delivery time for the first product was on average 28:47 h after the activation start. As a consequence, with pre-tasking, first products were delivered on average 12:37 earlier. Looking at the image provision, on average, pre-tasked images were acquired 07:25 h earlier than other images and the delivery of pre-tasked images after the acquisition was 04:04 h earlier than for other images. Finally, the delivery of the first products based on pre-tasked images (after they were delivered) was almost 1 h earlier.
Pre-tasked images were acquired earlier than other images because the tasking was carried out before the activation start. Indeed, the process of acquiring the image (which implies coordination among the service providers, REACT and the CCMs) had already started before the user expressed his/her interest in activating the service. In addition, as per procedure, only SAR sensors are pre-tasked, while in other flood activations optical images are also sometimes tasked, the share overall remaining relatively small. Due to the dependence of optical images on appropriate illumination conditions, which are typically unfavorable in flood events, the acquisition of a useful optical image is sometimes delayed, in which case this delay is at least one day. On average in RM flood activations, it takes more than twice the time to acquire optical images after the activation start than SAR images (44:10 for optical and 13:11 for SAR as shown in
Table 5). The numbers in
Table 5 below exclude two outliers. In these two flood activations (not related to pre-taskings) the users had requested to base the first products on images that were much older than the typical average in RM, leading to artificially high differences between acquisition and delivery. These exceptions (EMSR261 and EMSR446) are usually not addressed in RM, which is a priori designed to address very urgent cases and hence their exclusion.
When looking at the individual time differences between EFAS request and RM activation start, and the time the user had to wait before receiving the first product, we can distinguish three groups.
Table 6 below presents the three groups and the average delivery times for the first products (for individual numbers see
Table A3). Accordingly, the user who activated RM within the hours immediately after receiving the EFAS pre-tasking request waited 24:43 before receiving the product which is longer than the users who requested the activation ca. 1 day after the EFAS pre-tasking request (17:06) and much longer than the ones who requested ca. 2 days after (06:05).
Figure 6 shows the duration of the four steps in the three groups for each activation. The difference is mostly related to the timing of the acquisition: while the user waits to activate, the acquisition may be happening already. This was always the case for Group 3, for which the images were already acquired when the activation started. At activation start, the service providers could directly start analyzing the image and publish the results. On the other extreme, when the user activated few hours after the EFAS pre-tasking request (Group 1), the pre-tasked image had not yet been acquired and the service provider had, therefore, to wait before starting the analysis (with the exception of EMSR471, for which a Sentinel-1 image was used). If we consider the lead time of EFAS pre-tasking requests (depending on the likelihood and impact level it is 24 or 48 h before the forecasted peak, refer to
Section 2.3) and that there are two SAR acquisition opportunities per day, in the case of group 2 the user has missed at least two and in group 3 at least three acquisition opportunities.
There are four cases for which the images were delivered more than 10 h after acquisition, which is 8 to 14 h more than the average time (EMSR258, EMSR422, EMSR444, EMSR471). For the 14 activations related to pre-tasking, the image was delivered on average 02:25 h after acquisition. These exceptionally rapid delivery times can be explained by the early acquisitions of the images used for the first products, meaning before the activation start. In these cases, the RM service provider had access to the acquired images shortly after acquisition, but was waiting for the user’s request for activation before downloading the image (which corresponds here to the image delivery).
Three exceptional cases were excluded from
Figure 6 to show the main trend. Technical issues led here to a delay and this was not related to the pre-tasking activity as such (late cancellation by the satellite mission delaying the acquisitions for EMSR437, EMSR465 and procedural delays in case of EMSR187).
In most cases, the pre-tasking had a positive influence on the delivery of the first product by allowing significant time savings. To be useful, however, the product must not only be delivered quickly, but also be based on a relevant image and delivered shortly after the time of acquisition so as to not show outdated information or to avoid that it is outdated at the time of publication.
3.2. Comparison of User-Defined Event Time, Forecasted and Observed Event Peak and Relation to Image Acquisition Time
To be useful, satellite images must be acquired during the critical moments of a flood event. While monitoring the flood evolution is useful for disaster management, a particularly important moment is when the flooded surface area was at its largest, which we assume here is the flood peak, in order to capture the maximum possible impact of the flood. Because flood events are typically dynamic and spatially spread, defining an event peak is challenging as it happens in different locations at different times. EFAS forecasted peak is defined as the maximum predicted flow (EFAS ensemble mean) at the most representative locations (either real gauging stations or dynamically created hydrologically relevant locations) for a certain river stretch under consideration.
For this study, the following data were used:
Table 7 shows the event time indicated by the user compared to the peak forecasted by EFAS, the observed peak, the start of the acquisition window recommended by EFAS, and the activation start. The differences between the activation start and the user-defined event time indicate that except for one flood, users are activating after the event had already started. Except for two cases, it is also before the peak predicted by EFAS (26 h) and before the observed peak (22 h), but only 07:30 h before the start of the acquisition window.
This indicates that the user-defined event time does not correspond to the flood peak but rather to the beginning of the flood. Most of the users are emergency responders who most probably define the event time when the forecasted evolution of an event indicates that it exceeds the nominal conditions, which is usually before the peak. While the user-defined event time seems to be the beginning of the flood and not actually related to the EFAS forecasted peak, the EFAS forecasted peak is an empirical value based on factual information. The pre-tasking procedure is based on the assumption that it can be considered as a critical moment of the event and be a good indicator for scheduling image acquisitions. The median of the differences between the EFAS forecasted peak and the observed peak is 0 h and overall supports our approach to use EFAS as EWS for starting the RM workflow.
When comparing the image acquisition time with the forecasted and observed flood peaks, on average, the images were acquired about 6 h after the EFAS forecasted peak and the observed peak (
Table 8). The probability of capturing the maximum extent of the flood is therefore high thanks to the pre-tasking. As mentioned in
Section 3.1, the production and release of the product after the image is received took on average about 4 h. Therefore, the pre-tasking and quick handling of the data increase the chances that the product captures the situation close to the critical moment of the event and is still useful when received by the user. To be useful, however, the product must not only be delivered quickly and be based on an image acquired at a critical moment, but also be well located so as to not miss the most affected areas.
3.3. Comparison of EFAS Forecasted AOIs and User-Defined AOIs
The areas of interest (AOIs) provided in the EFAS pre-tasking request are areas considered most at risk of being affected by the flood event and they are used for the tasking of images. Based on the availability of satellites, the pre-tasked images cover entirely or partially the EFAS AOIs. When requesting the activation of the RM service, the user can choose either to keep the EFAS AOI(s) or to submit others. If the user adopts the EFAS AOIs, the pre-tasked image can be used to produce the first product. If the user submits other AOIs, the pre-tasked image can only be used if it covers at least partially the user AOI. There are cases where the RM service provider suggested additional areas to the user based on a first screening of the pre-tasked image for flooding. The EFAS AOIs are defined using modeling, which includes a number of sources of uncertainty originating mainly from the forecasts, the digital elevation model used or the lack of representation of protective structures (e.g., dams) or processes (e.g., flooding of polders) in the model. The user activating RM instead might have more precise information from the local authorities and this might lead to modified or additional AOIs.
Table 9 shows the results of the comparison between EFAS and user AOIs. In 9 out of the 14 cases, the user AOIs (i.e., submitted by the user at the activation start or included during the activation) overlapped fully or partially with the EFAS AOIs. In two cases, the user AOIs did not overlap at all with the EFAS AOIs, but the pre-tasked images could still be used for the first products because they also covered areas outside the EFAS AOIs and which were included in the user AOIs. The table excludes one case in which the pre-tasking request did not include an AOI (EMSR187). The overlap ranges therefore from 0% to 100% overlap, with a median of 32.1%. In 4 cases the overlap is above 60%.
The fact that the users keep on average one-third of the EFAS AOIs not only proves the relevance of the EFAS forecast in terms of location, but also highlights the important contribution of the RM users and EFAS partners for defining with more accuracy the area(s) to analyze. In addition, the pre-tasked images always covered relevant areas, i.e., areas considered by the user/national authorities and/or the EFAS model as highly at risk, and where impact assessment would be helpful to support emergency response activities. Flood was also detected on all pre-tasked images, with one exception (EMSR358). In this case, the area in which no flood was detected was however a user AOI, confirming once more the relevance of the EFAS AOIs.
3.4. Examples
In the following section, more details are provided for two of the pre-taskings which were followed by Rapid Mapping activations. The examples are flood events in April 2018 along the Ebro river in Spain and in Ukraine in June 2020. The EFAS flood prediction is compared with the satellite-based flood mapping. The focus is on the first product which was delivered and the flood peak as predicted and observed.
3.4.1. Floods on Ebro River, Spain, April 2018
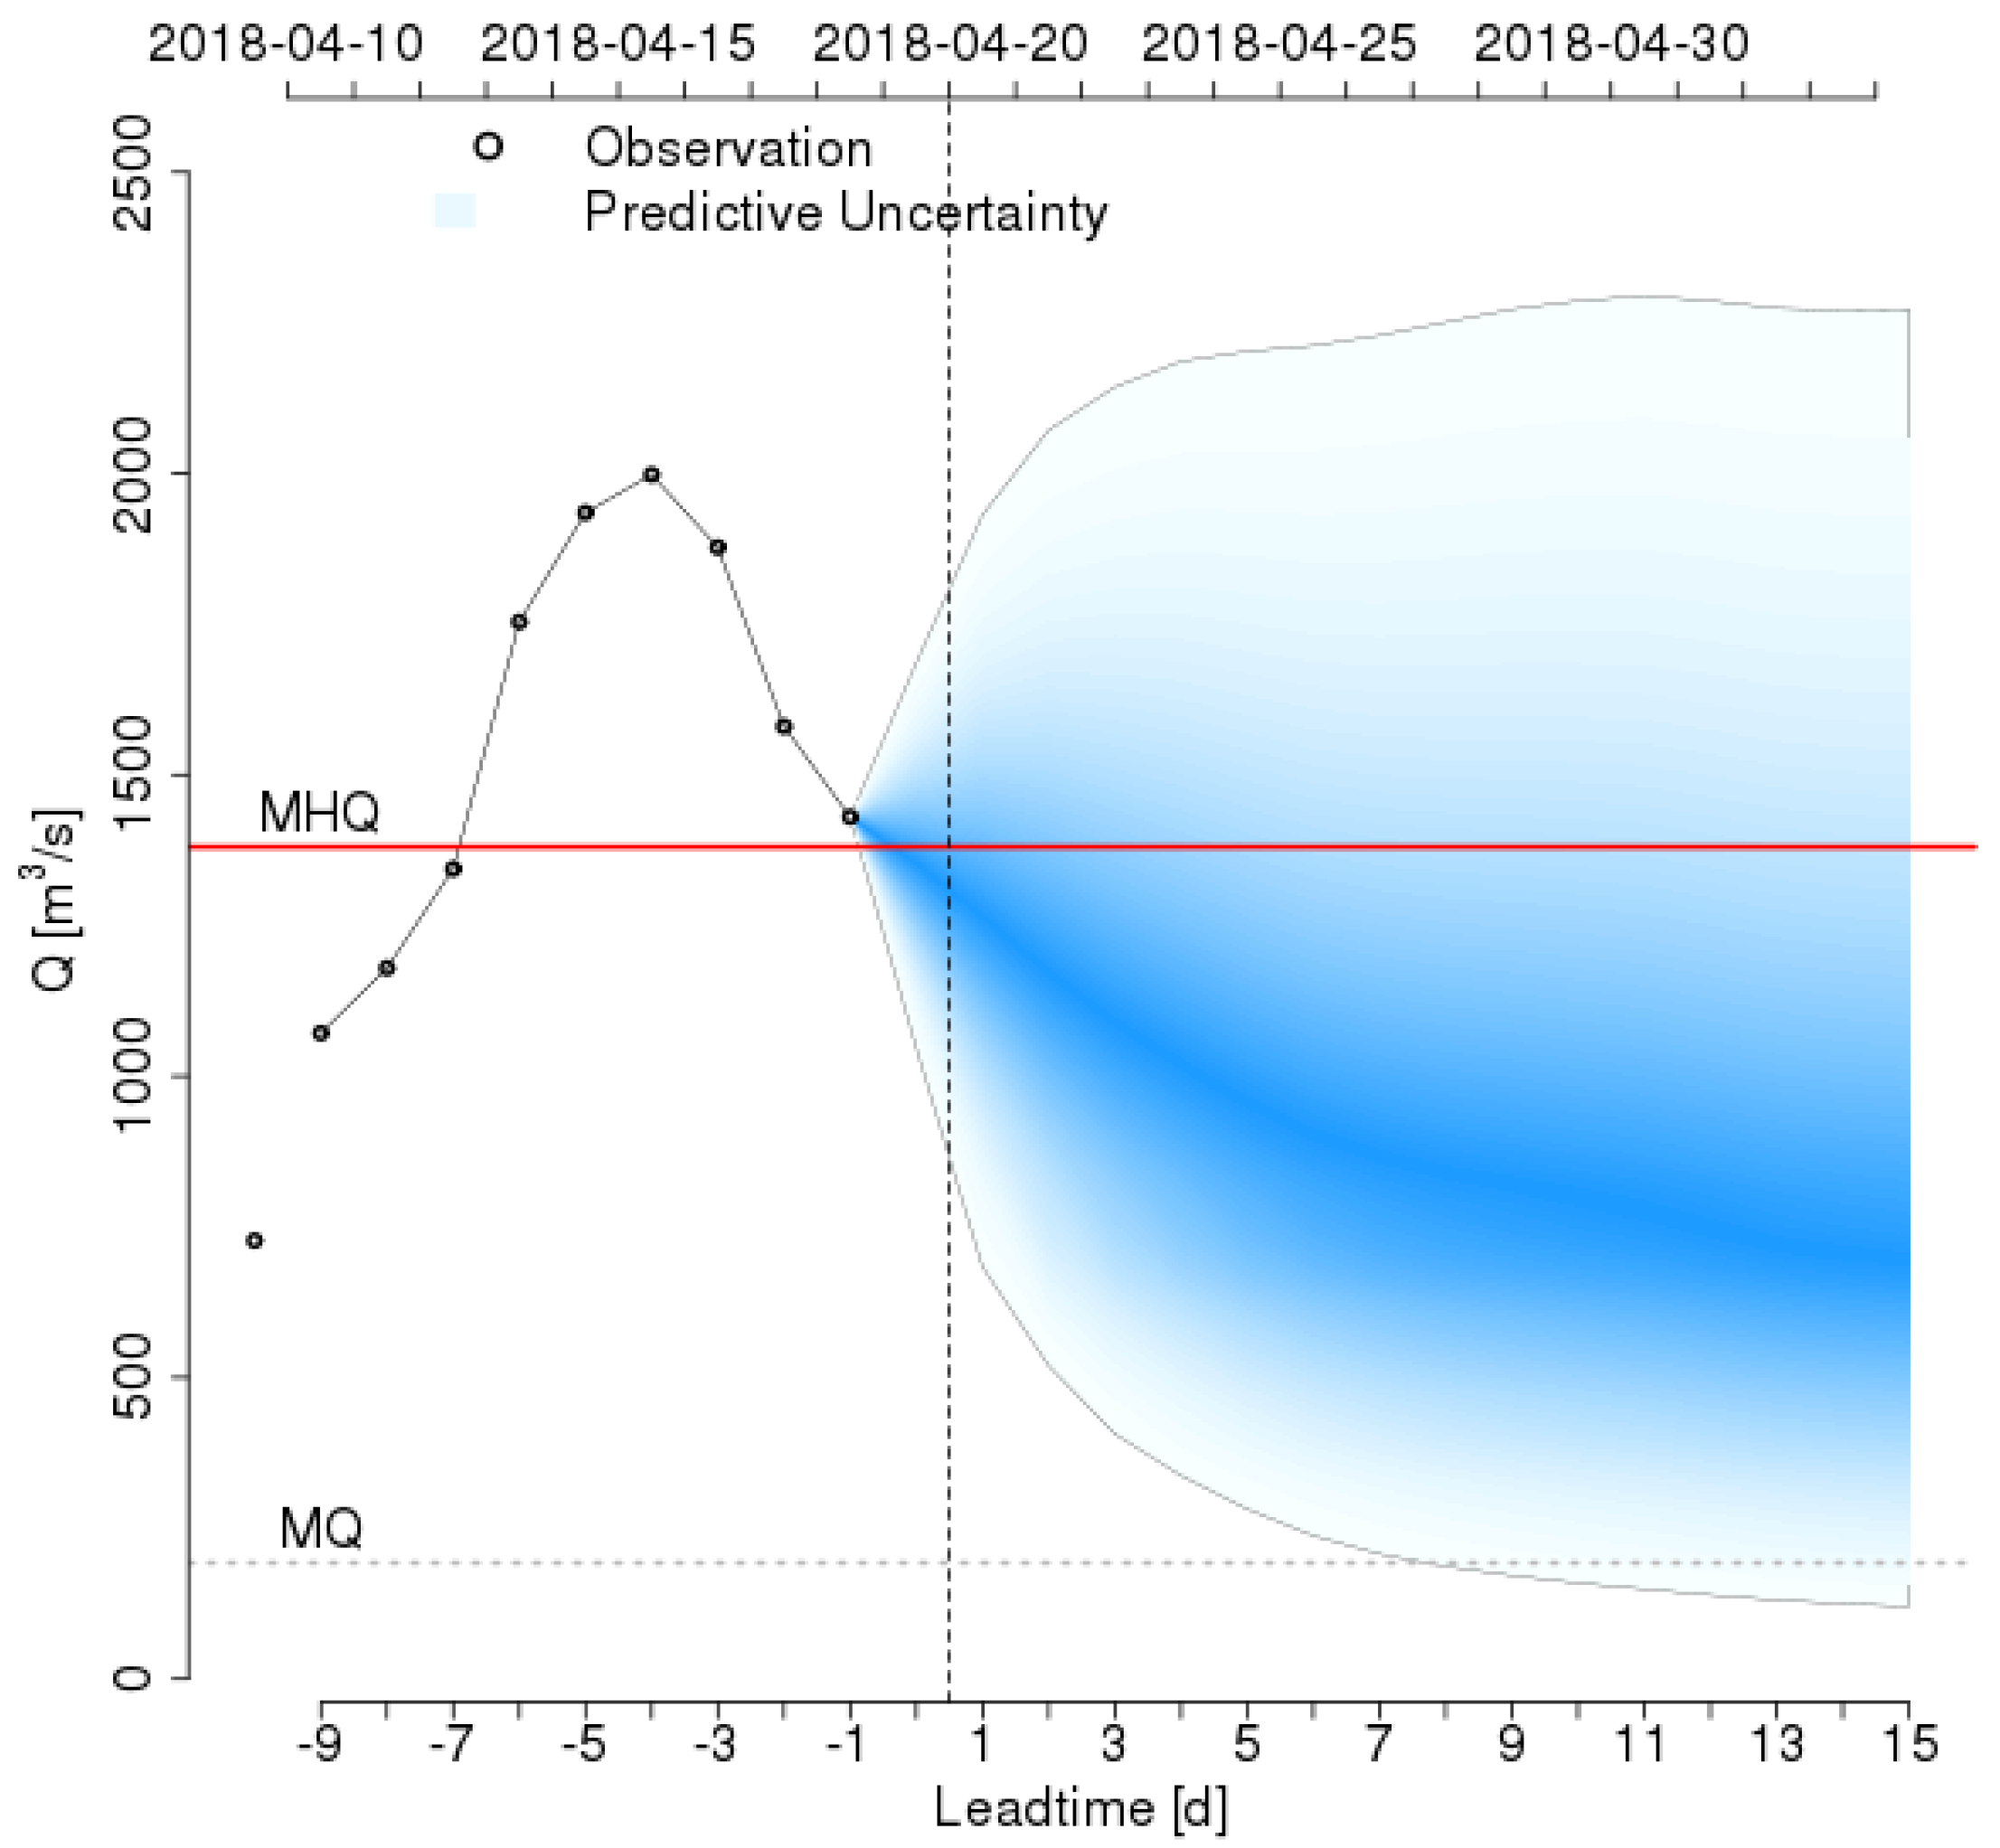
In April 2018, heavy rainfall and snowmelt in the Pyrenees mountains had caused a severe flooding event in the Ebro basin, Spain. The flooding started on 12 April and affected Castejón town in Navarra province where a state of emergency was declared. The peak of the flood was foreseen to occur in the area of Tudela already on 13 April. The EFAS request for pre-tasking was submitted on 12 April at 14:51 for areas extending from north-west to south-east along the Ebro river from Castejón towards Zaragoza and beyond (see
Figure 7). The peak was predicted on 13 April at noon.
At 09:31 on 13 April, the Spanish Civil Protection Directorate-General activated the RM service, requesting to map the same areas as defined by the EFAS request, plus two additional areas further upstream covering other rivers of the Ebro basin (Zadorra, Arga-Ega). Thanks to the pre-tasking request, the first product was released shortly after midnight on 14 April from an image acquired in the late afternoon (17:54, time stamps see
Table A2).
Figure 8 shows the timeline for this event.
Figure 9 below shows the evolution of the flood as measured at the river station in Zaragoza and predicted by EFAS. It confirms that the flood had occurred (exceedance of the average high water discharge MHQ from 13 April onwards) with a peak observed on 15 April, which was two days after the EFAS forecasted peak. Indeed, for the same AOI, the flooded area detected from SAR imagery had increased from 13 to 15 April by 110% (from 34.4 km
2 to 72.2 km
2). The difference between forecasted and observed peaks might be attributed to flood regulation structures (e.g., reservoirs) along the Ebro river basin. While such structures are mostly included in the hydrological model underlying EFAS, related operating rules are usually unknown and thus not reproducible.
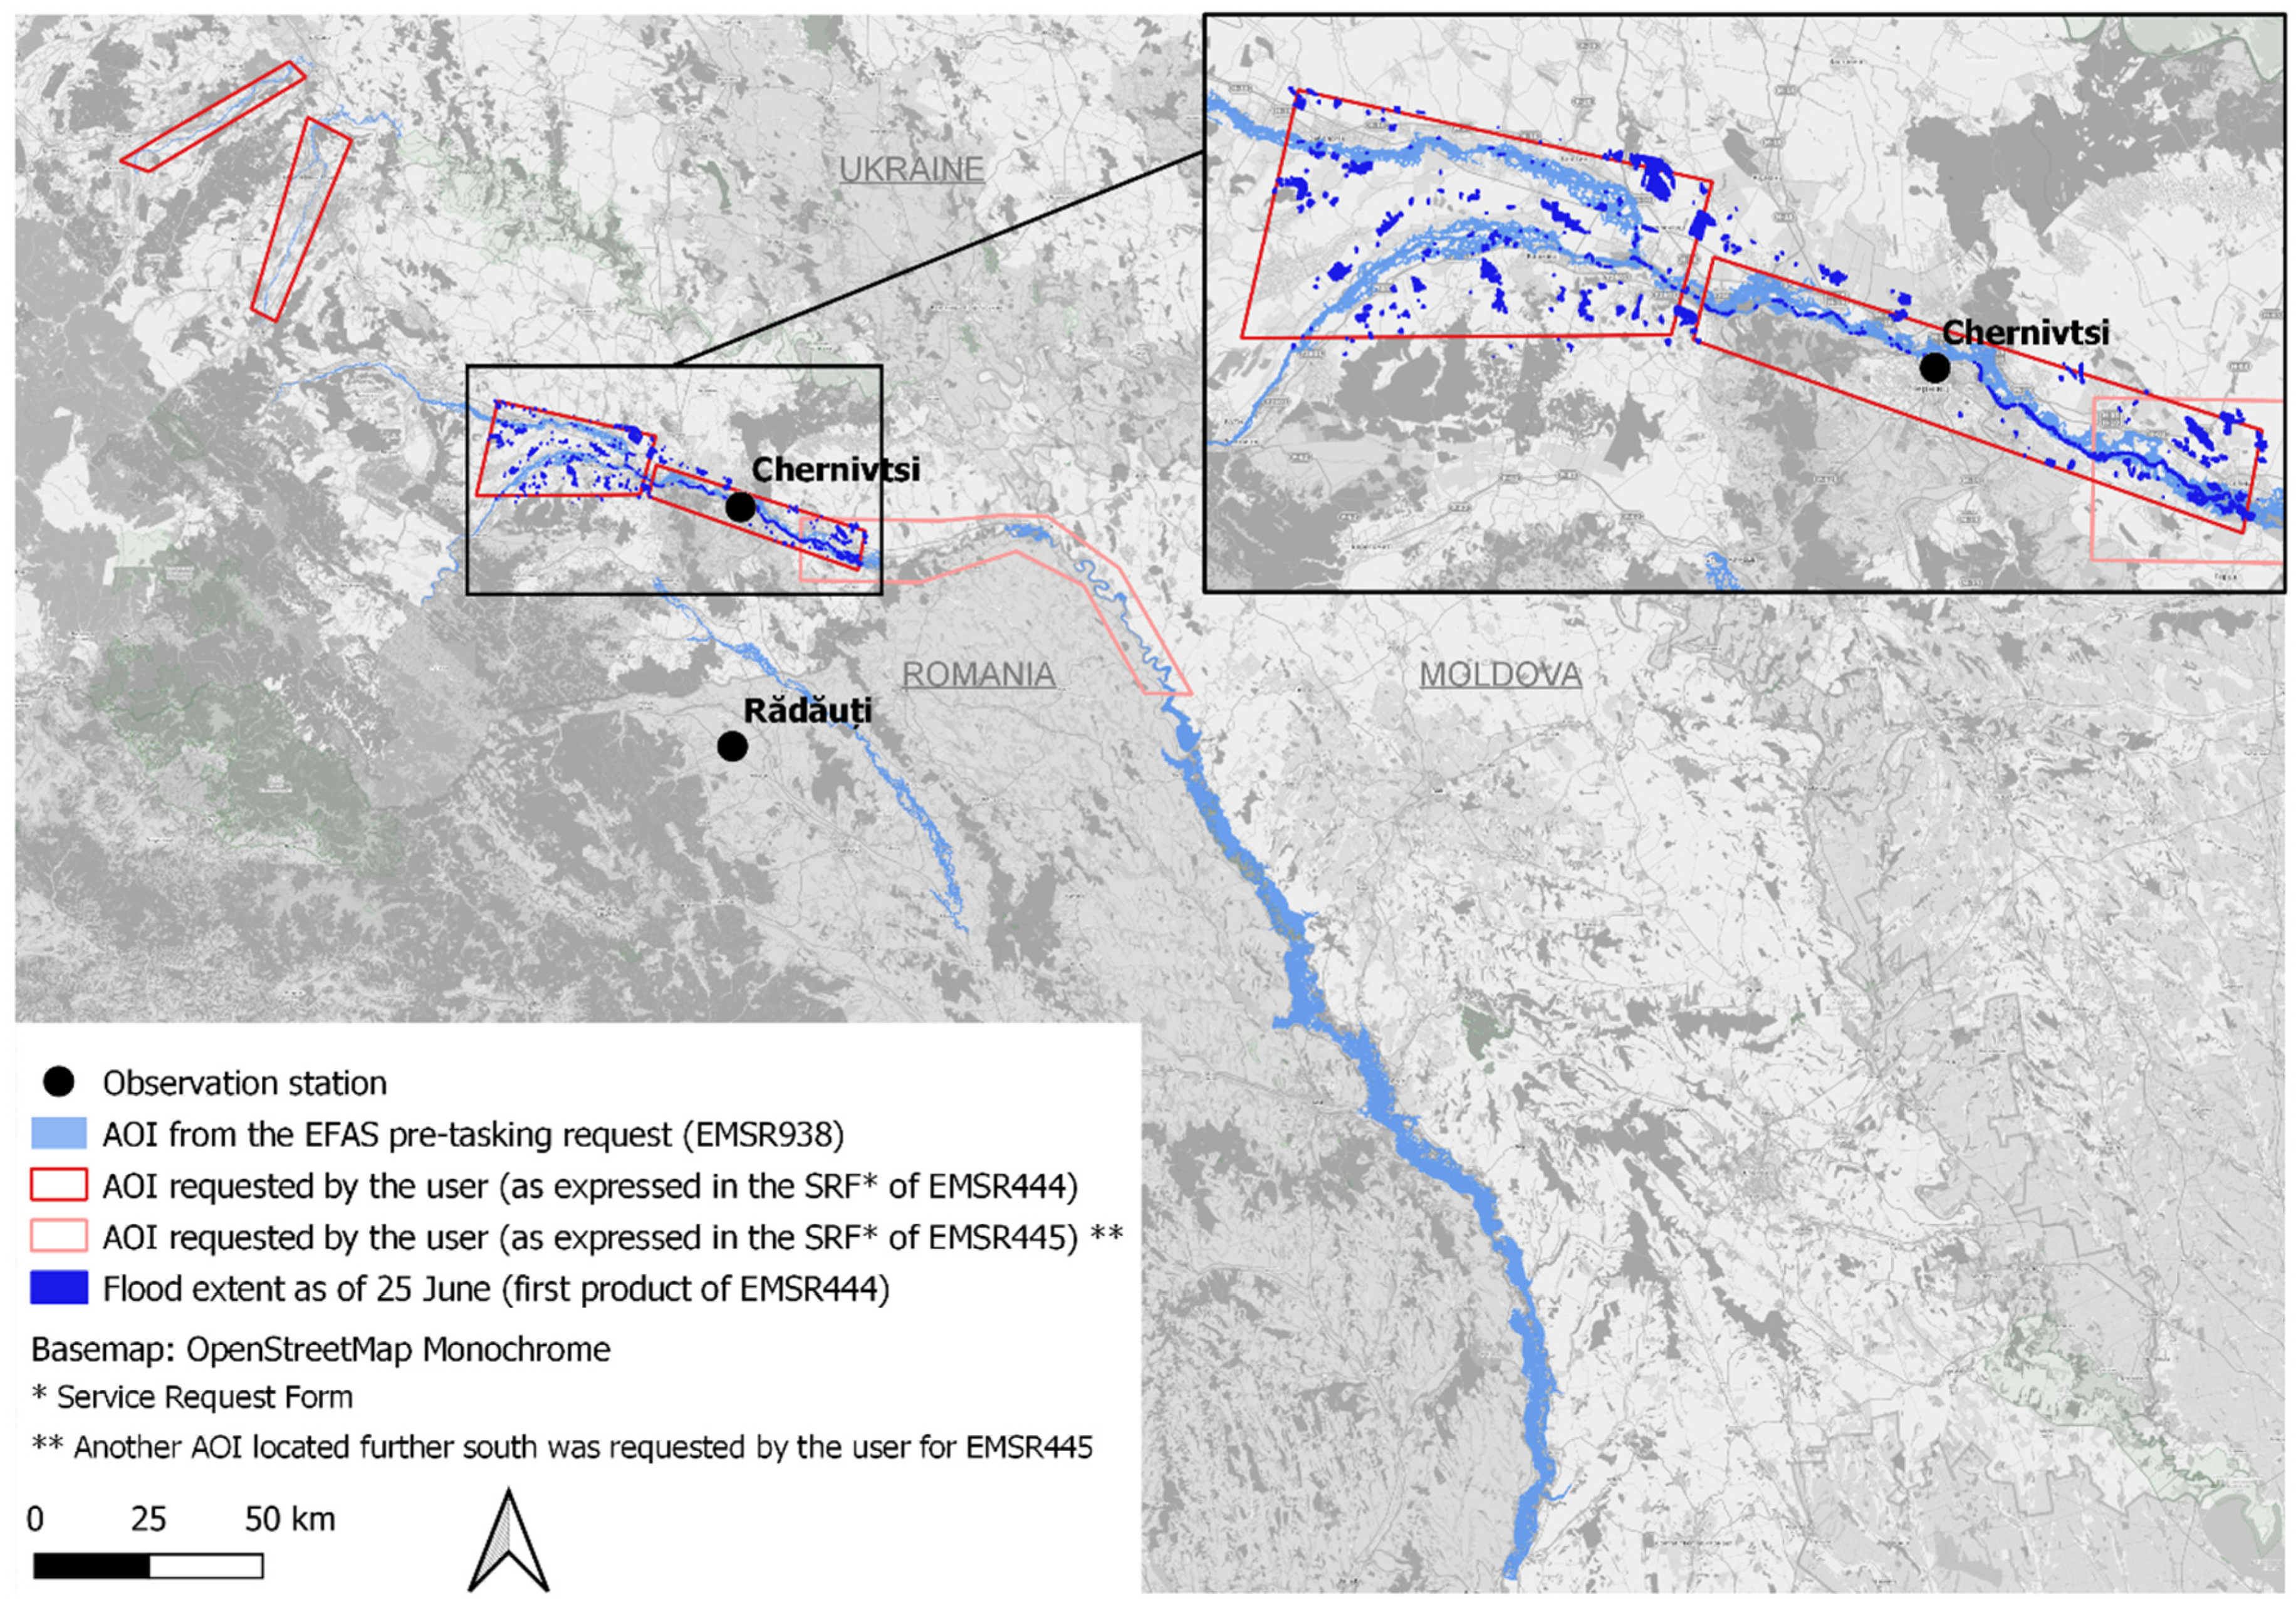
3.4.2. Floods in Ukraine and Romania, June 2020
In June 2020, heavy rains in Eastern Europe led to the most extensive flooding in western Ukraine in the last 50 years and extreme conditions in Romania. Already on 16 June, EFAS had issued an alert to Romania, Ukraine and Moldova, predicting a high probability of river flows exceeding the EFAS 5-year threshold. As the EFAS Rapid Risk Assessment continued to indicate a high probability of high impact, it finally sent out the pre-tasking request on 23 June for the areas shown in
Figure 10, predicting a peak on 24 June.
The European Emergency Response Coordination Centre (ERCC) activated RM two days later on 25 June to map the areas located in the south-west of Ukraine. By that time already two consecutive SAR images had been acquired and the one closer to the activation time was finally used to provide the first flood extent, which was released within 06:05 h after the service was triggered. This is one of the fastest activations in the history of the RM service. In addition to the SAR images, optical data in the resolution class VHR2 was tasked in the following days over all AOIs, given the relatively good weather conditions and damage already reported, to delineate with higher accuracy the flood extent and impact. One day after the start of the activation in Ukraine (26 June), the Romanian authorized user (National Operations Centre—General Inspectorate for Emergency Situations) requested the activation of the service for mapping flood along the Prut river at the border of Romania/Ukraine (EMSR445).
Figure 11 shows the timeline for this event.
The user AOIs were overlapping with the EFAS AOIs on the Romanian territory. A second AOI was added later along the Jiu river further south-west (outside the map extent), whose level had also increased. This activation benefited from the image that was used to produce the first product in EMSR444, leading to the delivery of the first flood extent within 09:45 h after activation start. The first product actually showed more flooding than in the adjacent Ukraine AOI and confirmed the EFAS forecast.
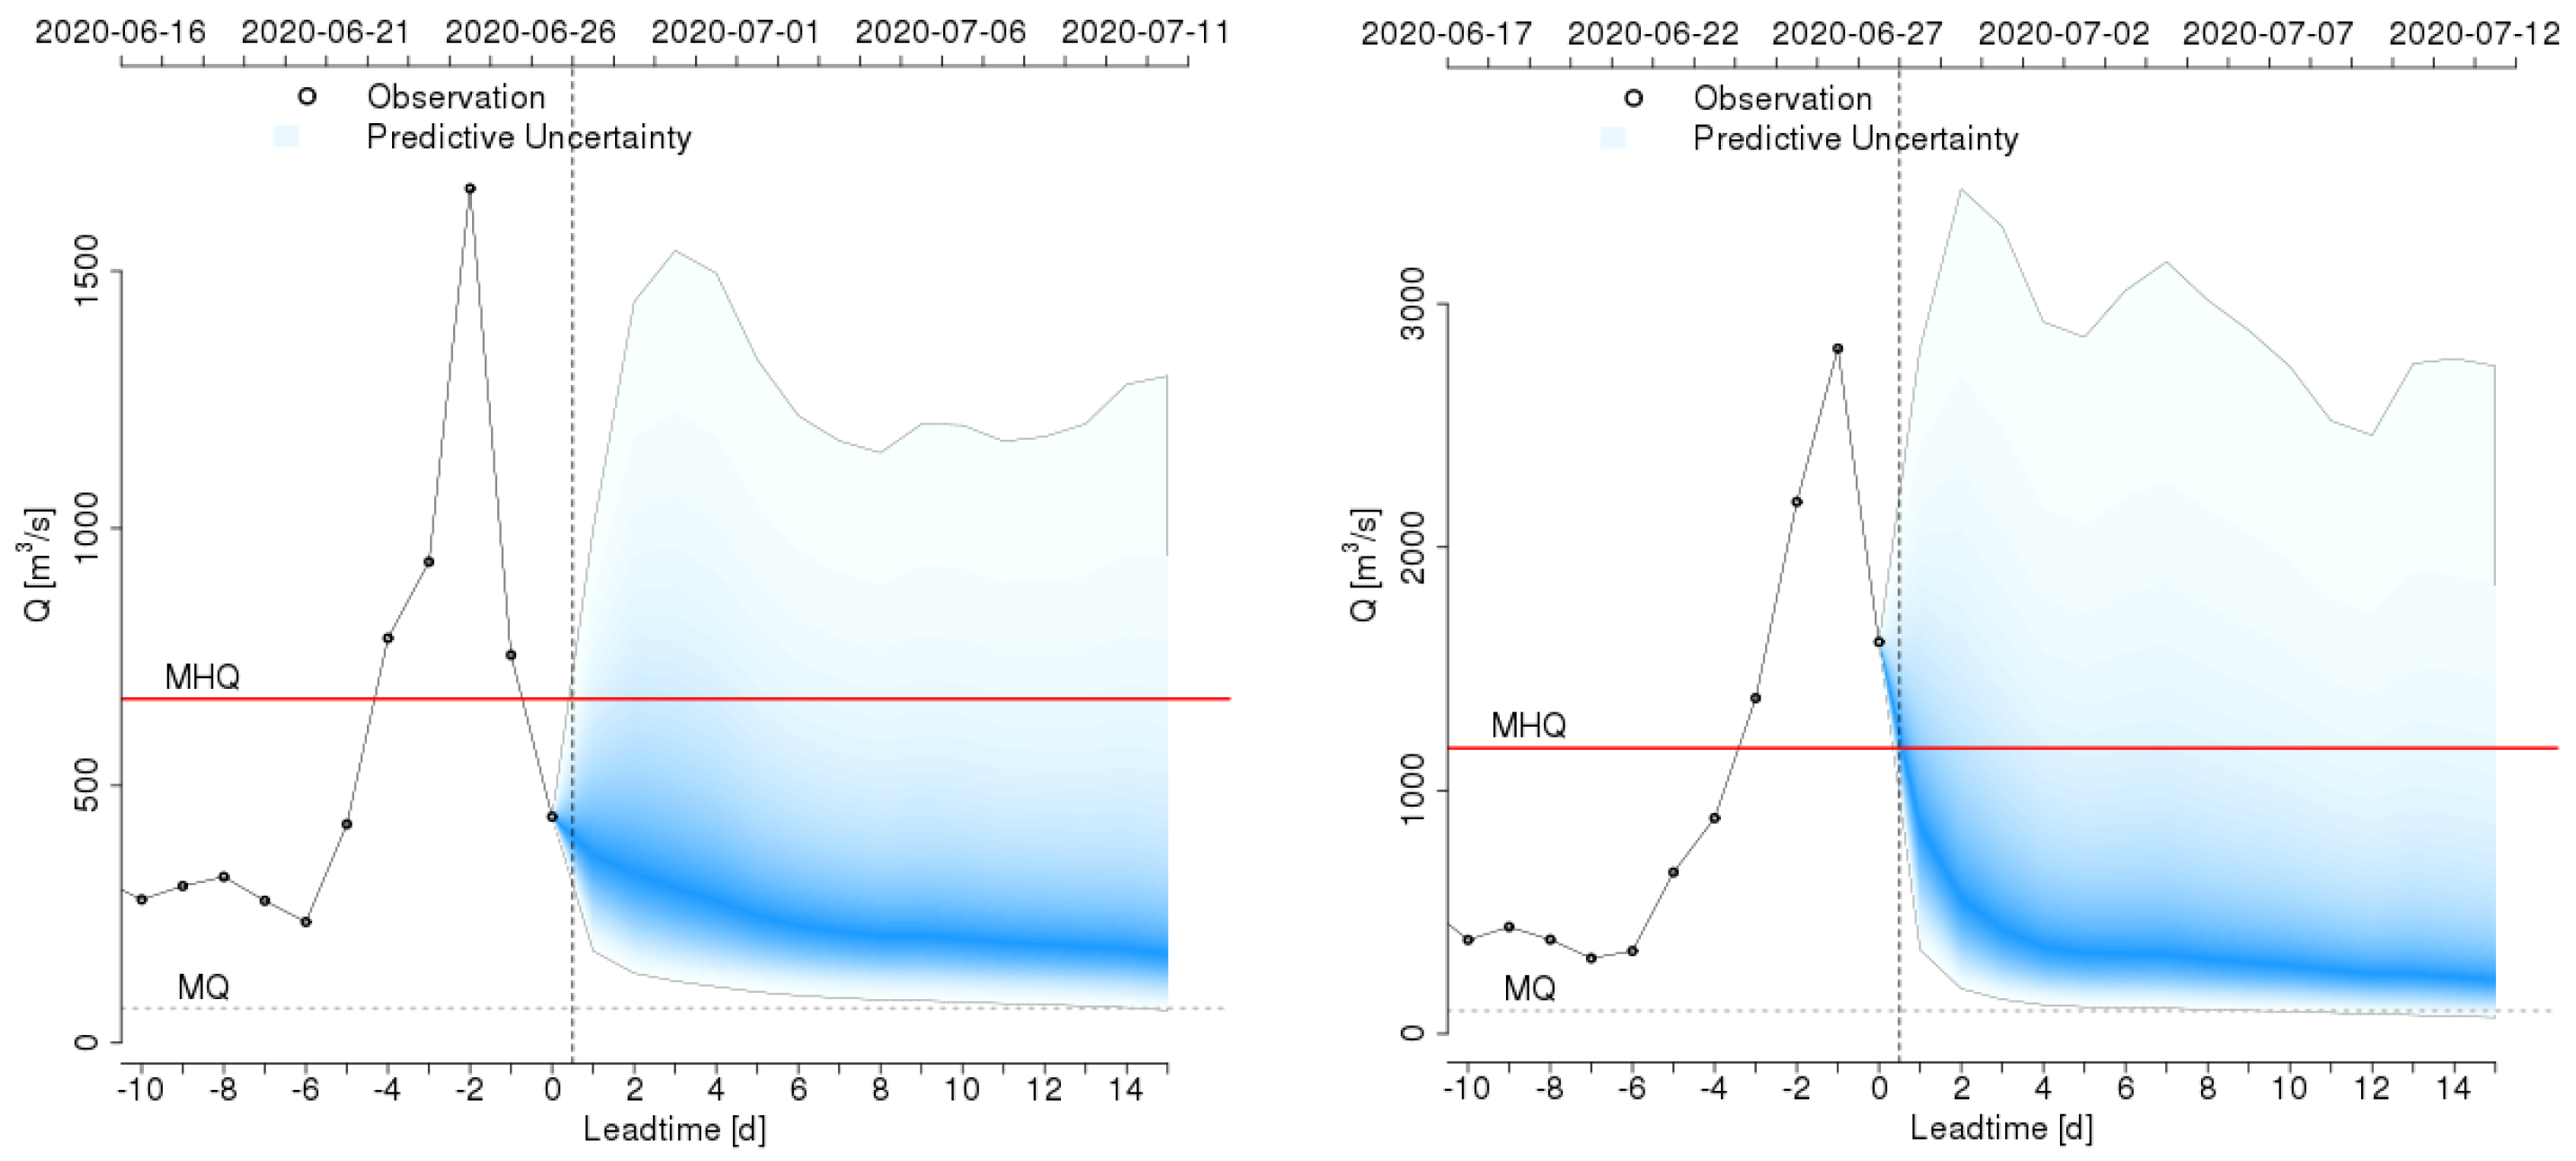
Figure 12 shows the post-processed EFAS forecast with the observed peak at stations Chernivtsi on 24 June and Rădăuți on 26 June.
This example also shows the evolution of the pre-tasking procedure. Initially, AOIs were defined manually around areas at risk using rectangular shapes, which was in line with the setup of the RM service. In April 2019, changes were introduced, one of which proposed one single AOI per request, reflecting the potentially affected area as much as possible including natural terrain conditions (river bed, relief) and moving away from rectangular shapes. As a consequence, pre-tasking AOIs were optimized using EFAS flood hazard maps and terrain information [
14] to focus more on the river network and flood plains and exclude areas unlikely to be flooded (see also
Section 4.5).
4. Discussion
The influence of EFAS based pre-tasking on RM can be summarized by the following three observations: it increases the efficiency of satellite tasking through a more accurate definition of areas of interest, allows better identification of critical moments of the event, such as the flood peak, and ultimately leads to faster delivery of the first product. There are a number of influencing factors some of which are not systematic or predictable. In the following sections, we will discuss the influence of the most important ones.
4.1. Image Related Aspects
4.1.1. Image Availability
For activations related to pre-tasking, the first product is typically not based on previously acquired images (archived) but rather on tasked ones or images soon to be acquired by systematically acquiring missions such as Sentinel-1 (in four cases it was used to produce the first product,
Table A2 in
Appendix B). Our results show that thanks to the procedure tasked acquisitions happen on average 7:25 h earlier than without pre-tasking (after activation start).
Instead, the availability times after acquisition are much longer if an already existing image is used. This happens often when FEP was issued as the first product. As opposed to tasked imagery, this image is then not directly delivered once acquired but only when the service provider requests it to REACT after the activation has started. Because of this, the image availability after acquisition is 19:34 h on average for FEP, compared to 5:09 h for delineation products (median values for all flood activations). The FEP was introduced in April 2019 in RM among others in order to take advantage of already acquired imagery, including suboptimal imagery.
In several cases, the first flood map was not necessarily produced from the first pre-tasked image but from subsequent ones. The first image coming out of the pre-tasking was used in six activations. In three activations, it was instead an image acquired during the following morning or afternoon passes. In two of these, the first crisis information was then available in roughly six hours from the user request, which is much faster than the average for all flood activations (28:47 h). The pre-tasking, in fact, prepared the series of acquisitions which in the case of SAR is at least twice per day.
4.1.2. Sensor Type
The pre-tasking procedure currently targets only SAR imagery. This choice was made because flood is an event type that allows SAR-based analysis as opposed to other events where this is not equally applicable for, e.g., damage assessment which requires optical data or more complex analysis with SAR data and image pairs with the same acquisition parameters (interferometry). Due to the independence of SAR sensors from weather and light conditions, it is on average faster to acquire a SAR image than an optical one. Indeed, often more than one attempt (with at least one day between two attempts) is necessary to obtain a useful optical image. As shown in
Table 5, it takes more than twice the time to acquire optical images after the activation start than for SAR images. Thereby the first product based on SAR imagery is also delivered earlier. There were cases in RM when a useful optical image was available in the early phase of a flood, but the probability of this repeating remains low because of the unfavorable weather conditions during flood events. In the future, pre-tasking could also target optical data but this should be in addition to the SAR pre-tasking to provide additional datasets.
Independent from pre-tasking we expect however an increasing use of optical data from systematic acquisitions such as Sentinel-2 or PlanetScope. For the moment, both sensors are rarely used for first products and this is due to the comparably slow availability after acquisition which is beyond five hours. As both constellations and requirements for these evolve, influenced by use cases such as RM, the use might increase over the next years and this could possibly increase the amount of available imagery and timeliness of RM overall.
4.2. Influencing Factors on Production Time
The delivery time of the image marks the starting point for the default production times in RM. As presented in
Section 3.1, the first products for the activations related to pre-tasking were delivered on average 1 h earlier than for those not related to pre-tasking after reception of the image.
While this difference is relatively short considering the average delivery times, it can be partly explained here also by the influence of the product type on the time needed for producing the crisis information and hence on the delivery times of the first products. The workflow for the production of the deliverables (ready-to-print maps and vector data) for activations related to pre-tasking, and the deliverables themselves, are not different from that of a normal activation. However, the target production time differs depending on the product type, and the fastest products were more often used in activations related to pre-tasking than in the others. Indeed, for the 14 activations related to pre-tasking, 11 of the first products were FEP or preliminary releases of the delineation with the FAM (Until March 2019 preliminary results of the delineation product could be released within 3 h as so-called First Available Map (FAM)), whose target delivery times are respectively 2 and 3 h. The delineation on the other hand (with a target delivery time of 7 h) is the most common product in flood activations (48 cases among the 59 flood activations not related to pre-tasking). Because of the complexity of analysis (usually visual interpretation at building level) typically no grading products are delivered first in flood activations.
The time needed to produce the first product is also influenced by the size of the area. The average size of the first products for the 14 activations related to pre-tasking was 1704 km2, whereas it was 2279 km2 for the RM flood activations. We can therefore assume that, due to the smaller sizes of the areas to analyse in the activations related to pre-tasking, less time was required for producing the crisis information than for the other flood activations. The difference in the areas covered indicates that the pre-tasking AOIs are more focusing on the actual flood-prone areas, given that they are based on flood modelling. Indeed, sometimes the AOIs submitted by the users were very large and covered also areas where the terrain conditions would normally not qualify for flooding. However, this assumption needs further analysis.
4.3. Role of the Event Time
We assume that the efficiency of RM increases with the amount and precision of information about an event as such because it is a crucial input to the RM workflow (for tasking satellites and preparing the following analysis and production of value-added information). We assume that information from early warning systems such as EFAS helps to improve the precision of event information available at activation start and we believe that a more systematic use would improve RM’s efficiency overall. In RM, most of the information is provided by the user requesting the activation, assuming that the user is closest to reliable information sources (even local) to which the RM service does not have access. This assumption is challenged by the fact that the user defines the request in an emergency situation in which the time for processing information is very short and challenged by different simultaneous inputs.
In this context, a crucial timestamp provided in an activation request is the event time (mandatory element of the service request form). The reliability of this information cannot be quantified but the results of this study indicate that it is of varying robustness and strongly depends on the expertise of the requestor and how much he/she knows at this point in time. Additionally, in dynamic events like floods which evolve over days or even weeks, the definition of the event time is especially challenging.
RM users activate typically after the event has started and on average 41 h after the event time indicated in the service request form (average of all 59 flood activations). In 6 out of the 14 pre-tasking-related activations, this occurred after 24 h, which is also the minimum time needed on average by RM to provide crisis information after a user request. A comparison of the event time as indicated by the user in the service request form with the EFAS forecasted peak and with the start of the recommended acquisition window indicates that a user considers event time to be the beginning of a flood and not its peak. Indeed, the user-defined event time is on average 07:30 before the start of the recommended acquisition window and 26:00 before the EFAS forecasted peak (median values).
The heterogeneity observed in the computed differences suggests that there is no clear definition of this timestamp and that the definition varies between users and does not necessarily reflect the actual event. This could be improved by introducing a definition of this timestamp in the operational procedures of RM. However, the start of an event also strongly depends on a number of factors such as geographic reference, and the local context. Alternatively, the event peak could be used as a reference time for the RM workflow.
4.4. The Role of Users and EFAS Partners
The role of users and EFAS partners is the least predictable parameter in the workflow and our results reveal different aspects. The examples with reaction times below half a day after a pre-tasking request show for example that the procedure can raise awareness and if users trust the information, they feel encouraged to activate earlier than usual. In the cases with longer reaction times (2 days), we assume that the user received other information from local sources which conflicted with the EFAS forecast. However, waiting before requesting the activation means also not having an influence on the location of the pre-tasked image (see
Section 3.3), and the risk of missing the EFAS forecasted peak.
Indeed, in some cases, EFAS predictions might overestimate the actual flood event, given that the modelling can include only what is known to EFAS. More in general, the accuracy of EFAS forecasts might vary depending on many factors: the accuracy of meteorological forecasts for the event, the robustness of the hydrological and impact modelling framework, the knowledge of existing flood regulation and flood protection structures (see [
14] for a detailed discussion). Conflicting information might also have been the case for the 18 pre-taskings which were not followed by RM activations. Other reasons could have been the availability of enough national resources to cope with the flood, not requiring the activation of RM, or the user not being aware of the RM workflow and link to EFAS based pre-tasking.
Our observations support the need to further develop the involvement of RM users and EFAS partners in the pre-tasking activity, and this includes training and awareness-raising. In a dedicated study conducted by the internal CEMS Validation module ([
15]), RM authorized users (national focal point), end-users (from local or regional organizations) and EFAS partners were interviewed on some of the activations and related pre-taskings, all being generally positive about the procedure. Some users said that they were working on implementing EFAS information in their workflow and that improved training of users would make the procedure even more effective. This is because not all users are fully aware of the limitations and possibilities of SEM and different factors have an influence, such as rotating focal points, technical background, etc.
Furthermore, the local knowledge RM users and EFAS partners can contribute to the pre-tasking activity. It is important to complement EFAS alerts with the information provided by local authorities using, for example, national or local early warning systems for a better understanding of the ongoing event and a more accurate identification of the area to be selected. In [
15] users indicated as reasons for not activating the RM service or including different AOIs with respect to those provided in the EFAS alerts (i) contradicting information after consultation of alternative local sources like the hydro-meteorological institute, as well as field observations, (ii) despite the predicted flood event was accurately forecasted by EFAS, it was prone to occur and evolve rapidly and thus, its detection by satellite imagery was unlikely, (iii) the flood occurred outside the AOIs provided by EFAS. It is therefore important to provide users the possibility to integrate local knowledge into the pre-tasking. However, this requires that such local information is translated into a better defined AOI by an experienced user in a timely manner to not lose the improved product timeliness introduced by the pre-tasking procedure.
4.5. Ongoing and Future Developments
Optimizing AOIs used for the pre-tasking is important for the overall success of the procedure, since adjusting the study area to the zones that would be likely affected by flooding may reduce the processing time and production cost, while allowing the user to take a better-informed decision when activating the service. Tests were run for optimizing the AOIs’ extent (i.e., reducing the AOI extent while limiting the omission of crisis information) using other EFAS information such as the European and Global Floods Hazard maps and the Coastal Hazards maps (as part of [
15,
16]). It was concluded that these layers, complemented with additional ones like a DEM and minor processing, are useful to reshape AOIs in case of riverine floods in plain areas. Ideally, these improvements should take into account the need of users for a level of precision that pan-European datasets and models often cannot provide.
Following internal evaluations, adjustments to the procedure were made during the past years, such as including the recommended acquisition windows in the EFAS request for pre-tasking to give more guidance to the RM service provider for the image tasking. Thresholds for issuing pre-tasking requests were set and GIS-friendly formats were included in the EFAS request, so users can implement the complementary inputs provided in their own prediction models. Finally, a more informative web page was published within the EMS and EFAS portals to increase user’s awareness about the EFAS—RM link and its benefits.
Currently, the pre-tasking procedure covers only riverine floods. Other types of floods such as flash floods and coastal floods are not considered, despite both can lead to equally high negative impacts. Especially fast-evolving events like flash floods are difficult to predict because of their dynamics both temporally and spatially. Work is ongoing to include also this flood type in EFAS. However, as these cause mostly damage requiring optical images, the relevance of pre-tasking is less relevant.
Initially, the activities related to pre-tasking focused only on floods using EFAS. Recently and following the same logic, this activity was extended to alert systems like the Global Disaster Alert and Coordination System (GDACS) for other natural disasters such as earthquakes or tropical cyclones. It can be used to trigger satellite tasking (or encourage satellite mission owners to task their satellites) over a predicted affected area shortly after the alert and before an actual activation of RM, following the required request by an authorized user. This would allow having relevant imagery once the activation is triggered. The results in [
3] indicate the potential benefits of using GDACS alert and impact information for early-tasking of satellite post-event imagery to reduce the time delay between the event itself and the availability of the first SEM-based damage assessment.
Along these lines, a similar protocol was developed in 2019 in cooperation with the European Space Agency (ESA) for other events, namely tropical cyclones and earthquakes. The so-called Pro-Active Tasking (PAT) uses the early warning system GDACS to anticipate tasking activities over relevant areas (e.g., where the disaster has just happened or is about to happen) in case of earthquakes and tropical cyclones. Based on the GDACS alerts, CCMs start tasking in order to possibly remove the delay between the RM provider’s request for images and the subsequent tasking by the CCMs [
17]. Between 1 October 2019 and 15 January 2020, the PAT was tested in RM operations. The efficiency and usefulness of this test phase were assessed by [
18,
19]. The assessment showed that PAT can help to reduce the time between the event and the first post-event product further because it anticipates an activation of RM by a user. It increased the likelihood of acquiring useful images, both in terms of timeliness and location. Recommendations for improvement are currently being assessed in order to prepare for the integration of the protocol in operations in the near future. Related to this, and in view of this protocol to become operational, GDACS has been working on the automatic impact-based generation of areas of interest which has been tested for earthquakes [
20] and is currently extended to tropical cyclones and tsunamis.
Another evolution impulse is expected by the always-on flood mapping service from S-1, which will be introduced in CEMS in the second half of 2021. The service module will be complementary to the on-demand RM, which will focus on providing flood impact information at higher spatial and temporal resolution. In combination with EFAS and RM, we therefore expect this to improve the timeliness of flood mapping provided by CEMS. It will also refocus the pre-tasking activity on CCM imagery and is expected overall to contribute to an optimization of the procedure.
Finally, it is worth mentioning studies that look into complementing EO data with social media content in CEMS to detect and assess the impact of disaster events especially in the initial phases of the crisis in parallel or as a complement to satellite-based emergency mapping. [
21] used social media among others for the refinement and prioritization of pre-tasking AOIs for flood events. [
22] used EWS for different event types to trigger RM, as well as the activation of the social media analytics and crowdsourcing campaigns to enrich the satellite-based information. [
23] proposes an automatic system based on machine learning and automated analysis of images from social media, which could improve the decision-making process in disaster monitoring, impact analysis and early warning.
5. Conclusions
The integration of Early Warning Systems and SEM services is clearly feasible for hydro-meteorological events that can be forecasted up to a few days ahead. In the Copernicus Emergency Management Service (CEMS) such integration began testing in mid-2016 through a procedure that links the European Flood Awareness System (EFAS) with the Rapid Mapping (RM) module. The procedure aims at anticipating satellite tasking requests in view of an upcoming request for rapid flood mapping and with this increases the probability of delivering relevant information to emergency response actors at the right moment during a flood event. Data collected between mid-2016 and December 2020 were analyzed with the overall goal to evaluate if and how much the integration improves the timeliness of satellite-based flood mapping. Results show that, compared to standard RM activations, pre-tasking reduces the delivery time of the first flood map by half a day, which is considered a significant improvement with respect to the target delivery time in RM (24 h after activation start) and especially relevant in rapidly evolving events like floods. This reduction is mostly induced by image acquisitions happening on average 7:25 h earlier than without pre-tasking (with respect to a user’s activation of RM). The fastest times prove that up to one day can be gained thanks to the pre-tasking and increases chances for receiving flood impact information closer to the activation time. Despite numbers indicating a small improvement also in some other steps of the RM workflow, we do not assume that the pre-tasking had an actual influence as such but rather other factors, such as the product type and availability of an image acquired prior to the activation request. The observed influence of the product type suggests that FEP should be introduced as a default in the pre-tasking procedure.
Even if the first flood maps were not always produced from the first pre-tasked image but in some cases from the following ones, our results demonstrate the advantage of the pre-tasking activity, because it starts the series of acquisitions early enough with respect to the flood evolution and increases the chances to obtain one acquisition out of the two satellite passes of SAR sensors per day which, in case of multiple-mission access, would even multiply the opportunities.
Regarding sensor specificities, our results suggest continuing with SAR imagery as the prime sensor type for pre-tasking in case of riverine floods. Optical sensors could complement these but their usefulness continues to be limited due to their dependence on daylight and cloud-free conditions. Systematic acquisitions from constellations such as Sentinel-1 and -2 and PlanetScope which do not require tasking will positively influence the timeliness of RM overall. If for the latter two missions the availability time after acquisition can be further shortened to a few hours, these can efficiently complement the SAR missions and possibly help save resources. With the long-term strategy for the Sentinel-1 mission we can expect these to keep playing a role in the pre-tasking for RM but they will remain a complementary sensor given the frequency is not daily. With the S-1 availability times after acquisition being nowadays more systematic and reliable, the revised pre-tasking procedure should systematically consider the first S-1 as the priority sensor and only if the timeliness does not match the EFAS event forecast, CCMs should be tasked. The future S-1 based always-on flood mapping service under CEMS will complement EFAS and RM and is expected to also have an influence on the flood pre-tasking procedure.
The comparison between forecasted flood peak and user-defined event time provides arguments for including information from EFAS in the RM workflow. The event time is essential information provided by the user when requesting an RM activation as it drives scheduling the satellite tasking. With users typically activating RM after a riverine flood event has started, chances for delivering timely flood impact information are reduced. Our results also indicate that the user-defined event time usually is before the EFAS peak (ca. 26 h), which theoretically still allows scheduling a relevant acquisition. The RM workflow would therefore benefit from a clear definition of the event time and from considering the flood peak when submitting the tasking requests. Considering the observed differences between the EFAS forecasted peak and the EFAS pre-tasking, we suggest reducing that the maximum lead time for EFAS pre-tasking requests to 24 h, instead of the current 48 h. This would further reduce the forecast uncertainty and therefore improving the definition of AOIs.
In addition to a better characterization of the flood event, EFAS also proved to increase the efficiency of the definition of areas of interest for satellite tasking. These could be further optimized by other information sources such as hazard maps but also information from local sources to which RM users or EFAS partners have access. Furthermore, together with the local knowledge, the first assessments based on pre-tasked imagery can be used to redefine and prioritize AOIs.
A further improvement in the pre-tasking procedure is expected thanks to the recent enhances of EFAS river flow forecasts (e.g., hydrological simulations based on new model calibration, expanded datasets and using a 6-h time step instead of the previous 24-h step).
Besides gaining time, the introduction of the pre-tasking procedure also raised awareness about the information provided under CEMS by the early warning system with both the EFAS and RM user community. This even helped to connect involved actors from both communities, which is not only beneficial for the procedure as such, but for emergency management in general. In addition, the example for Ukraine and Romania showed the potential of a European early warning system, which actively informs all affected countries at the same time and who then as a consequence can all benefit from the imagery acquired in the pre-tasking activity. Again, the different reaction times of users after being informed about a pre-tasking request show that more awareness-raising needs to be done.
Despite technical limitations of tasking satellites for a new acquisition (orbits, cut-off-times for scheduling a new tasking), the experience in CEMS since 2016 has shown that time can be gained by submitting a tasking as soon as there is a very high probability that an event will occur (e.g., floods, tropical storms) or as soon as an event has occurred (e.g., earthquakes, tsunamis, volcanic eruptions). Impact forecasts provided by Early Warning and Alert Systems like EFAS and GDACS provide enough information which can be used to define the schedule and areas to cover in a satellite tasking request.
This study provides a sufficient number of elements to promote and continue the pre-tasking procedure and to improve it further, the overall objective here being to support emergency management in order to reduce the negative impact of floods. This is all the more relevant if we consider the trend towards higher frequency of extreme events and the significant share of floods in economic loss related to disasters worldwide.
Author Contributions
Conceptualization, A.W., I.J.-B., F.D., M.K. and P.S.; Data curation, A.W., I.J.-B., F.D. and M.K.; Formal analysis, A.W., I.J.-B. and F.D.; Investigation, A.W., I.J.-B., F.D., M.K. and P.S.; Methodology, A.W., F.D., M.K. and P.S.; Visualization, A.W., I.J.-B. and F.D.; Writing—original draft, A.W. and I.J.-B.; Writing—review and editing, A.W., I.J.-B., F.D., M.K. and P.S. All authors have read and agreed to the published version of the manuscript.
Funding
This research received no external funding.
Institutional Review Board Statement
Not applicable.
Informed Consent Statement
Not applicable.
Data Availability Statement
The EFAS simulations data presented in this study are available for download at
https://www.efas.eu/data-download (accessed on 15 March 2021). The data from river gauge stations are owned by national authorities and not publicly available.
Acknowledgments
The authors would like to thank Paola Rufolo for her comments on the draft version of the manuscript and for discussions on the outcomes of the CEMS Validation activations EMSV051 and EMSV057. Moreover, we are grateful for Alan Steel’s help on improving the English of the manuscript.
Conflicts of Interest
The authors declare no conflict of interest.
Appendix A
Table A1.
List of acronyms.
Table A1.
List of acronyms.
| Acronym | Full Name |
|---|
| AOI | Area Of Interest |
| CCM | Copernicus Contributing Mission |
| CEMS | Copernicus Emergency Management Service |
| EFAS | European Flood Awareness System |
| ERCC | Emergency Response Coordination Centre |
| EWS | Early Warning System |
| FAM | First Available Map |
| FEP | First Estimate Product |
| HR | High Resolution |
| LR | Low Resolution |
| MR | Medium Resolution |
| REACT | Rapid Emergency Activation for Copernicus Tasking |
| RM | Rapid Mapping |
| SEM | Satellite-based Emergency Mapping |
| VHR | Very High Resolution |
Appendix B
Table A2.
Time stamps used to calculate the differences in
Section 3.1.
Table A2.
Time stamps used to calculate the differences in
Section 3.1.
| Activation ID | Area of Interest
(Number Name) | Product Type | Mission | Resolution Class | Image
Acquisition | Image
Delivery | First Product Delivery |
|---|
| EMSR165 | 02 FONTAINEBLEAU | Delineation * (FAM **) | Radarsat-2 | MR1 | 01.06.2016 17:40 | 01.06.2016 18:30 | 01.06.2016 22:00 |
| EMSR187 | 03 CUZAVODA | Delineation (FAM **) | COSMO-SkyMed | VHR2 | 14.10.2016 15:55 | 14.10.2016 17:40 | 14.10.2016 20:03 |
| EMSR258 | 14 FUSHEKRUJE | Delineation (FAM **) | Radarsat-2 | HR1 | 01.12.2017 04:56 | 01.12.2017 15:00 | 01.12.2017 16:33 |
| EMSR265 | 01 DRAVEIL | Delineation | Radarsat-2 | HR1 | 23.01.2018 05:49 | 23.01.2018 09:20 | 24.01.2018 06:07 |
| EMSR279 | 05 ZARAGOZA | Delineation (FAM **) | Sentinel-1 | HR2 | 13.04.2018 17:54 | 13.04.2018 21:00 | 14.04.2018 00:35 |
| EMSR358 | 01 SANSKI MOST | FEP | Sentinel-1 | HR2 | 15.05.2019 05:01 | 15.05.2019 06:15 | 15.05.2019 08:16 |
| EMSR388 | 01 ONTINYENT | FEP | COSMO-SkyMed | HR2 | 12.09.2019 18:52 | 12.09.2019 22:58 | 13.09.2019 06:43 |
| EMSR397 | 02 BARCELONA | FEP | Sentinel-1 | HR2 | 23.10.2019 06:01 | 23.10.2019 07:25 | 23.10.2019 11:32 |
| EMSR416 | 01 PEYREHORADE | FEP | COSMO-SkyMed | HR2 | 14.12.2019 17:57 | 14.12.2019 19:17 | 14.12.2019 22:26 |
| EMSR422 | 01 GIRONA TER TORDERA | FEP | COSMO-SkyMed | HR1 | 23.01.2020 05:22 | 23.01.2020 18:22 | 23.01.2020 22:13 |
| EMSR437 | 06 ROQUEFORT | Delineation | COSMO-SkyMed | HR2 | 12.05.2020 05:59 | 12.05.2020 07:31 | 12.05.2020 15:11 |
| EMSR444 | 02 CERNIVTSI | FEP | COSMO-SkyMed | HR2 | 25.06.2020 03:53 | 25.06.2020 20:00 | 25.06.2020 22:39 |
| EMSR465 | 01 KARDITSA | Delineation | COSMO-SkyMed | HR2 | 20.09.2020 16:09 | 20.09.2020 17:20 | 20.09.2020 23:53 |
| EMSR471 | 01 KOSICE | FEP | Sentinel-1 | HR2 | 14.10.2020 04:44 | 14.10.2020 21:15 | 15.10.2020 00:19 |
Table A3.
Time difference between activation start and (1) EFAS pre-tasking request, (2) image acquisition, (3) image delivery and (4) delivery of the first product (in hh:mm) for all 14 pre-taskings and grouping according to the difference between activation start and delivery of the first product. Negative values mean that the time stamp was before the activation start.
| Activation ID | Group | EFAS Pre-Tasking Request | Image Acquisition | Image Delivery | First Product Delivery |
|---|
| EMSR437 | 1 | −09:21 | 34:24 | 35:56 | 43:36 |
| EMSR416 | 1 | −05:34 | 21:49 | 23:09 | 26:18 |
| EMSR397 * | 1 | −04:23 | 17:36 | 19:00 | 23:07 |
| EMSR471 * | 1 | −04:13 | −12:09 | 04:22 | 07:26 |
| EMSR265 | 2 | −34:30 | −13:28 | −09:57 | 10:50 |
| EMSR388 | 2 | −25:54 | 05:15 | 09:21 | 17:06 |
| EMSR187 | 2 | −25:49 | 43:14 | 44:59 | 47:22 |
| EMSR358 * | 2 | −25:47 | 14:44 | 15:58 | 17:59 |
| EMSR465 | 2 | −20:23 | 30:23 | 31:34 | 38:07 |
| EMSR258 | 2 | −20:05 | −04:42 | 05:22 | 06:55 |
| EMSR279 * | 2 | −18:40 | 08:23 | 11:29 | 15:04 |
| EMSR444 | 3 | −55:17 | −12:41 | 03:26 | 06:05 |
| EMSR165 | 3 | −53:42 | −01:05 | −00:15 | 03:15 |
| EMSR422 | 3 | −50:45 | −10:30 | 02:30 | 06:21 |
| Average | | −25:19 | 08:40 | 14:04 | 19:15 |
| Median | | −23:05 | 06:49 | 10:25 | 16:05 |
| Min | | −55:17 | −13:28 | −09:57 | 03:15 |
| Max | | −04:13 | 43:14 | 44:59 | 47:22 |
Table A4.
Time stamps used to calculate the time differences between the user-defined event time and the EFAS forecasted peak, the observed peak and the start of EFAS recommended acquisition window (
Section 3.2).
Table A4.
Time stamps used to calculate the time differences between the user-defined event time and the EFAS forecasted peak, the observed peak and the start of EFAS recommended acquisition window (
Section 3.2).
| Activation ID | EFAS Forecasted Peak | Observed Peak | Start of Acquisition Window |
|---|
| EMSR165 | 01/06/2016 12:00 | 01/06/2016 00:00 | Na * |
| EMSR187 | 12/10/2016 00:00 | Na * | Na * |
| EMSR258 | 01/12/2017 23:00 | Na * | 01/12/2017 08:00 |
| EMSR265 | 23/01/2018 12:00 | 23/01/2018 00:00 | 22/01/2018 12:00 |
| EMSR279 | 13/04/2018 12:00 | 15/04/2018 00:00 | 13/04/2018 00:00 |
| EMSR358 | 14/05/2019 00:00 | 14/05/2019 00:00 | 13/05/2019 18:00 |
| EMSR388 | 14/09/2019 00:00 | Na * | 12/09/2019 18:00 |
| EMSR397 | 23/10/2019 00:00 | 23/10/2019 00:00 | 22/10/2019 18:00 |
| EMSR416 | 15/12/2019 00:00 | 15/12/2019 00:00 | 14/12/2019 06:00 |
| EMSR422 | 22/01/2020 00:00 | 23/01/2020 00:00 | 21/01/2020 18:00 |
| EMSR437 | 11/05/2020 12:00 | 11/05/2020 00:00 | 11/05/2020 06:00 |
| EMSR444 | 24/06/2020 00:00 | 24/06/2020 00:00 | 22/06/2020 12:00 |
| EMSR465 | 19/09/2020 12:00 | Na * | 18/09/2020 20:00 |
| EMSR471 | 15/10/2020 12:00 | 14/10/2020 00:00 | 15/10/2020 06:00 |
References
- Voigt, S.; Giulio-Tonolo, F.; Lyons, J.; Kučera, J.; Jones, B.; Schneiderhan, T.; Platzeck, G.; Kaku, K.; Hazarika, M.K.; Czaran, L.; et al. Global Trends in Satellite-Based Emergency Mapping. Science 2016, 353, 247. [Google Scholar] [CrossRef] [PubMed]
- Ajmar, A.; Boccardo, P.; Broglia, M.; Kucera, J.; Giulio-Tonolo, F.; Wania, A. Response to flood events: The Role of Satellite-based Emergency Mapping and the Experience of the Copernicus Emergency Management Service. In Flood Damage Survey and Assessment: New Insights from Research and Practice; Molinari, D., Menoni, S., Ballio, F., Eds.; Wiley: Hoboken, NJ, USA, 2017; pp. 213–228. [Google Scholar]
- Ajmar, A.; Annunziato, A.; Boccardo, P.; Giulio-Tonolo, F.; Wania, A. Tsunami Modeling and Satellite-Based Emergency Mapping: Workflow Integration Opportunities. Geosciences 2019, 9, 314. [Google Scholar] [CrossRef] [Green Version]
- Battiston, S.; Clandillon, S.; Faivre, R.; Tinel, C.; Wania, A. L’utilisation Des Services Cartographiques Numériques d’urgence Par Satellite à Des Fins de Sécurité Intérieure. Ann. Mines Responsab. Environ. 2019, 94, 66. [Google Scholar] [CrossRef]
- International Charter Space and Major Disasters. Available online: https://disasterscharter.org/ (accessed on 31 January 2021).
- Sentinel Asia. Available online: https://sentinel-asia.org/ (accessed on 31 January 2021).
- UNOSAT Rapid Mapping Service. Available online: https://www.unitar.org/maps/unosat-rapid-mapping-service (accessed on 31 January 2021).
- European Commission Copernicus Emergency Management Service—Mapping. Available online: https://emergency.copernicus.eu/mapping (accessed on 15 March 2021).
- BKG Satellitengestützter Krisen—Und Lagedienst (SKD). Available online: https://www.bkg.bund.de/DE/Fernerkundungsdienste/SKD/SKD.html (accessed on 21 March 2021).
- DLR Zentrum Für Satellitengestützte Kriseninformation (ZKI). Available online: https://www.dlr.de/eoc/desktopdefault.aspx/tabid-12937/22595_read-51635/ (accessed on 21 March 2021).
- SERTIT-ICube Service de Cartographie Rapide. Available online: https://sertit.unistra.fr/ (accessed on 21 March 2021).
- International Working Group (IWG-SEM) on Satellite-Based Emergency Mapping (IWG-SEM). Rapid Mapping and Early Warning Systems v1.0; White Paper; IWG-SEM: Online, 2018; p. 18. [Google Scholar]
- Wania, A.; Salamon, P.; Thiemig, V.; Dottori, F.; Kucera, J.; Mazzara, V.; Villette, F.; Luzietti, L. Linking Early Warning Systems with Rapid Mapping—Procedures for Pre-Tasking of Satellites for Disaster Impact Mapping; European Commission: Ispra, Italy, 2018. [Google Scholar] [CrossRef]
- Dottori, F.; Kalas, M.; Salamon, P.; Bianchi, A.; Alfieri, L.; Feyen, L. An Operational Procedure for Rapid Flood Risk Assessment in Europe. Nat. Hazards Earth Syst. Sci. 2017, 17, 1111–1126. [Google Scholar] [CrossRef] [Green Version]
- CEMS Validation. Service Product Validation Report EMSV051—Validation of EMSR298/930/931/920/921/922: EFAS-RM Pre-Tasking and AOI Definition; Copernicus EMS; European Commission: Ispra, Italy, 2020. [Google Scholar]
- CEMS Validation. Service Product Validation Report EMSV057: Decision Tree for Area of Interest Re-Design in Case of Flood Events; Copernicus EMS Validation Reports; European Commission: Ispra, Italy, 2020. [Google Scholar]
- Faluschi, S.; Ferner, D. Technical Note—Simulation and Test Phases for First-Good-Delivery and Pro-Active-Tasking Emergency Scenarios, Version 4.5; European Space Agency: Frascati, Italy, 2019. [Google Scholar]
- Wania, A.; Joubert-Boitat, I.; Dalmasso, S.; Luzietti, L.; Probst, P. Evaluation of New Rush-Satellite Tasking Schemas for Copernicus EMS-Rapid Mapping—Results of the Test Phase October 2019–January 2020; Publications Office of the European Union: Luxemburg, 2020; JRC122411; p. 43. [Google Scholar]
- Ferner, D.; Faluschi, S.; Schiarini, S. New Operational Scenarios First Good Delivery and Pro Active Tasking—Final Report; European Space Agency: Frascati, Italy, 2020. [Google Scholar]
- Annunziato, A.; Joubert-Boitat, I.; Paris, S.; Probst, P.; Proietti, C.; Santini, M.; Wania, A. Saving Time in Satellite Mapping in Case of Large Disasters: The Automatic Identification of Areas of Interest Based on the Global Human Settlement (GHS)—Settlement Model Grid (SMOD). In Atlas of the Human Planet 2020—Open Geoinformation for Research, Policy, and Action; European Commission, Joint Research Centre; Publications Office of the European Union: Luxemburg, 2020; pp. 45–46. [Google Scholar] [CrossRef]
- Dottori, F.; Kalas, M.; Lorini, V.; Wania, A.; Pappenberger, F.; Salamon, P.; Ramos, M.H.; Cloke, H.; Castillo, C. Testing an Innovative Framework for Flood Forecasting, Monitoring and Mapping in Europe. In Proceedings of the 19th EGU General Assembly, EGU2017, Vienna, Austria, 23 April 2017. [Google Scholar]
- Havas, C.; Resch, B.; Francalanci, C.; Pernici, B.; Scalia, G.; Fernandez-Marquez, J.L.; Van Achte, T.; Zeug, G.; Mondardini, M.R.; Grandoni, D.; et al. E2mC: Improving Emergency Management Service Practice through Social Media and Crowdsourcing Analysis in Near Real Time. Sensors 2017, 17, 2766. [Google Scholar] [CrossRef] [PubMed] [Green Version]
- Rufolo, P.; Muraro, D.; Lorini, V. Social Media Image Analysis in the Immediate Aftermath of the 2020 Beirut Blast; JRC Technical Report; Publications Office of the European Union: Luxembourg, 2021. [Google Scholar] [CrossRef]
Figure 1.
Time required in the CEMS Rapid Mapping Service, from a user request to post-event product delivery (average April 2019 to October 2020).
Figure 1.
Time required in the CEMS Rapid Mapping Service, from a user request to post-event product delivery (average April 2019 to October 2020).
Figure 2.
Timeline of Satellite-based emergency mapping (example of CEMS-RM activations), without EWS (A) and with EWS (B).
Figure 2.
Timeline of Satellite-based emergency mapping (example of CEMS-RM activations), without EWS (A) and with EWS (B).
Figure 3.
Sensor type and spatial resolution of images used for riverine flood post-event products between 30 May 2016 and 31 December 2020 (303 images). Resolution classes are according to the Copernicus Space Component Data Access: VHR1 ≤ 1 m, VHR2 > 1 m and ≤4 m, HR1 > 4 m and ≤10 m, HR2 > 10 m and ≤30 m, MR1 > 30 m and ≤100 m.
Figure 4.
Workflow for EFAS-based pre-tasking for Rapid Mapping with five distinct steps, actors and roles as well as related actions.
Figure 4.
Workflow for EFAS-based pre-tasking for Rapid Mapping with five distinct steps, actors and roles as well as related actions.
Figure 5.
Sequence of timestamps in RM activations related to EFAS pre-tasking generalized using data between June 2016 and December 2020.
Figure 5.
Sequence of timestamps in RM activations related to EFAS pre-tasking generalized using data between June 2016 and December 2020.
Figure 6.
Categorization of the activations related to pre-tasking in 3 groups, and time differences to the activation start (excludes 3 outliers).
Figure 6.
Categorization of the activations related to pre-tasking in 3 groups, and time differences to the activation start (excludes 3 outliers).
Figure 7.
Comparison of areas of interest for the EFAS pre-tasking request EMSR913 (light blue) and as submitted by the user for the RM activation request EMSR279 (red outline). Location of observation station in Zaragoza and flood extent identified from the pre-tasked image (first product).
Figure 7.
Comparison of areas of interest for the EFAS pre-tasking request EMSR913 (light blue) and as submitted by the user for the RM activation request EMSR279 (red outline). Location of observation station in Zaragoza and flood extent identified from the pre-tasked image (first product).
Figure 8.
Timeline for the Ebro floods pre-tasking (EMSR913) and RM activation (EMSR279).
Figure 8.
Timeline for the Ebro floods pre-tasking (EMSR913) and RM activation (EMSR279).
Figure 9.
Post-processed EFAS forecast for 20 April 2018, with the observed discharges until the same day and the flood peak for the Ebro River at Zaragoza, Spain.
Figure 9.
Post-processed EFAS forecast for 20 April 2018, with the observed discharges until the same day and the flood peak for the Ebro River at Zaragoza, Spain.
Figure 10.
Comparison of areas of interest for the EFAS pre-tasking request EMSR938 (light blue) and as submitted by the user for the RM activation request EMSR444 (red) and EMSR445 (pink). Location of observation station in Chernivtsi and Rădăuți.
Figure 10.
Comparison of areas of interest for the EFAS pre-tasking request EMSR938 (light blue) and as submitted by the user for the RM activation request EMSR444 (red) and EMSR445 (pink). Location of observation station in Chernivtsi and Rădăuți.
Figure 11.
Timeline for the floods in Ukraine and Romania: pre-tasking (EMSR938), and RM activations EMSR444 and EMSR445.
Figure 11.
Timeline for the floods in Ukraine and Romania: pre-tasking (EMSR938), and RM activations EMSR444 and EMSR445.
Figure 12.
Post-processed EFAS forecast with the observed peak at stations Chernivtsi (left) and Rădăuți (right).
Figure 12.
Post-processed EFAS forecast with the observed peak at stations Chernivtsi (left) and Rădăuți (right).
Table 1.
Product types and target delivery times in Copernicus EMS Rapid Mapping (service level 1) (time in hours after image delivery). Delivery times since April 2019 are those for the vector package (delivered before raster package).
Table 1.
Product types and target delivery times in Copernicus EMS Rapid Mapping (service level 1) (time in hours after image delivery). Delivery times since April 2019 are those for the vector package (delivered before raster package).
| Product Type | Information Content | 2015–2019 | 2019–Current |
|---|
| Reference | Pre-event situation | 9 | 10 |
| First Estimate (FEP) | Fast and rough impact assessment | NA | 2 |
| Delineation | Detailed assessment of the impacted area | 12 | 7 |
| Grading | Detailed damage assessment | 12 | 10 |
Table 2.
Number of Rapid Mapping activations and EFAS based pre-taskings 1 June 2016 and 31 December 2020.
Table 2.
Number of Rapid Mapping activations and EFAS based pre-taskings 1 June 2016 and 31 December 2020.
| | Number of Activations | Activations in Europe | Related to EFAS Pre-Tasking |
|---|
| (riverine) Flood | 77 | 50 | 14 |
| Other events | 250 | 152 | na |
| Total | 327 | 202 | 14 |
Table 3.
List of the 14 EFAS pre-taskings and related Rapid Mapping (RM) activations request and activation start times (in dd/mm hh:mm), event time as defined by the user in the RM activation request, disaster location (country).
Table 3.
List of the 14 EFAS pre-taskings and related Rapid Mapping (RM) activations request and activation start times (in dd/mm hh:mm), event time as defined by the user in the RM activation request, disaster location (country).
| Year | EFAS Pre-Tasking ID | EFAS Pre-Tasking Request Time | RM Activation ID | RM Activation Start Time | User-Defined Event Time | Disaster Location |
|---|
| 2016 | 900 | 30/05 13:03 | EMSR165 | 01/06 18:45 | 30/05 08:00 | France |
| 901 | 11/10 18:52 | EMSR187 | 12/10 20:41 | 12/10 12:00 | Romania |
| 2017 | 907 | 30/11 13:33 | EMSR258 | 01/12 09:38 | 01/12 09:00 | Albania |
| 2018 | 910 | 22/01 08:47 | EMSR265 | 23/01 19:17 | 22/01 12:00 | France |
| 913 | 12/04 14:51 | EMSR279 | 13/04 09:31 | 12/04 00:00 | Spain |
| 2019 | 928 | 13/05 12:30 | EMSR358 | 14/05 14:17 | 12/05 00:00 | Bosnia and Herzegovina |
| 930 | 11/09 11:43 | EMSR388 | 12/09 13:37 | 11/09 12:00 | Spain |
| 931 | 22/10 08:02 | EMSR397 | 22/10 12:25 | 22/10 11:00 | Spain |
| 934 | 13/12 14:34 | EMSR416 | 13/12 20:08 | 13/12 20:00 | France |
| 2020 | 936 | 21/01 13:07 | EMSR422 | 23/01 15:52 | 23/01 10:00 | Spain |
| 937 | 10/05 10:14 | EMSR437 | 10/05 19:35 | 10/05 22:00 | France |
| 938 * | 23/06 09:17 | EMSR444 | 25/06 16:34 | 22/06 12:00 | Ukraine |
| 939 | 18/09 13:23 | EMSR465 | 19/09 09:46 | 18/09 18:30 | Greece |
| 943 | 14/10 12:40 | EMSR471 | 14/10 16:53 | 13/10 08:00 | Slovakia, Hungary |
Table 4.
Time differences between activation start and all steps leading to the delivery of the first (median in hh:mm) for all flood activations (73), distinguishing those which were related to a pre-tasking request (14) from those which were not (59).
Table 4.
Time differences between activation start and all steps leading to the delivery of the first (median in hh:mm) for all flood activations (73), distinguishing those which were related to a pre-tasking request (14) from those which were not (59).
| | From Activation Start to: | From Image Acquisition to Image Delivery | From Image Delivery to First Product Delivery |
|---|
| Image Acquisition | First Product Delivery |
|---|
| Activations related to pre-tasking | 6:49 | 16:05 | 2:25 | 3:59 |
| Activations NOT related to pre-tasking | 14:14 | 28:47 | 6:29 | 4:51 |
| Difference | 7:25 | 12:37 | 4:04 | 0:52 |
Table 5.
Time differences between activation start and acquisition of the first image (in hh:mm) for all flood activations (June 2016–December 2020, excluding two outliers and those related to the 14 pre-taskings) per sensor type.
Table 5.
Time differences between activation start and acquisition of the first image (in hh:mm) for all flood activations (June 2016–December 2020, excluding two outliers and those related to the 14 pre-taskings) per sensor type.
| | Optical (9) | SAR (48) |
|---|
| Average | 39:31 | 06:23 |
| Median | 44:10 | 13:11 |
| Min | −29:51 | −54:04 |
| Max | 109:15 | 45:06 |
Table 6.
Three groups of pre-tasking activations defined based on the difference between delivery time of the first product and activation start.
Table 6.
Three groups of pre-tasking activations defined based on the difference between delivery time of the first product and activation start.
| Group | Description | Number of Cases | Delivery Time of the First Product (Median in hh:mm) |
|---|
| 1 | The user activated RM within the next hours after receiving the EFAS pre-tasking request | 3 | 24:43 |
| 2 | After receiving the EFAS pre-tasking request the user waited ca. 1 day before activating RM | 7 | 17:06 |
| 3 | After receiving the EFAS pre-tasking request, the user waited ca. 2 days before activating RM | 4 | 06:05 |
Table 7.
Detailed time differences between the user-defined event time and the EFAS forecasted peak, the observed peak, the start of the acquisition window and the activation start (in hh:mm, for base time stamps see
Table 3 and
Table A4 in
Appendix B). Negative values mean that the time stamp was before the user-defined event time and that the observed peak was before the forecasted peak.
| Activation ID | Difference to the User-Defined Event Time | Forecasted Peak to Observed Peak |
|---|
| EFAS Forecasted Peak | Observed Peak | Start of the Acquisition Window | Activation Start |
|---|
| EMSR165 | 52:00 | 40:0 | na * | 58:45 | −12:00 |
| EMSR187 | −12:00 | na * | na * | 08:41 | na * |
| EMSR258 | 14:00 | na * | −01:00 | 00:38 | na * |
| EMSR265 | 24:00 | 12:00 | 00:00 | 31:17 | −12:00 |
| EMSR279 | 36:00 | 72:00 | 24:00 | 33:31 | 36:00 |
| EMSR358 | 48:00 | 48:00 | 42:00 | 62:17 | 00:00 |
| EMSR388 | 60:00 | na * | 30:00 | 25:37 | na * |
| EMSR397 | 13:00 | 13:00 | 07:00 | 01:25 | 00:00 |
| EMSR416 | 28:00 | 28:60 | 10:00 | 00:08 | 00:00 |
| EMSR422 | −34:00 | −10:00 | −40:00 | 05:52 | 24:00 |
| EMSR437 | 14:00 | 02:00 | 08:00 | −02:25 | −12:00 |
| EMSR444 | 36:00 | 36:00 | 00:00 | 76:34 | 00:00 |
| EMSR465 | 17:30 | na * | 01:30 | 15:16 | na * |
| EMSR471 | 52:00 | 16:00 | 46:00 | 32:53 | −36:00 |
| Average | 24:54 | 25:42 | 10:38 | 25:02 | −01:12 |
| Median | 26:00 | 22:00 | 07:30 | 20:27 | 00:00 |
| Min | −34:00 | −10:00 | −40:00 | −02:25 | −36:00 |
| Max | 60:00 | 72:00 | 46:00 | 76:34 | 36:00 |
Table 8.
Detailed time differences between the EFAS forecasted peak, the observed peak and the image acquisition (in hh:mm).
Table 8.
Detailed time differences between the EFAS forecasted peak, the observed peak and the image acquisition (in hh:mm).
| Activation ID | EFAS Forecasted Peak to Image Acquisition | Observed Peak to Image Acquisition |
|---|
| EMSR165 | 05:40 | 17:40 |
| EMSR187 | 63:55 | na * |
| EMSR258 | −18:04 | na * |
| EMSR265 | −06:11 | 05:49 |
| EMSR279 | 05:54 | −30:06 |
| EMSR358 | 29:01 | 29:01 |
| EMSR388 | −29:08 | na * |
| EMSR397 | 06:01 | 06:01 |
| EMSR416 | −06:03 | −06:03 |
| EMSR422 | 29:22 | 05:22 |
| EMSR437 | 17:59 | 29:59 |
| EMSR444 | 27:53 | 27:53 |
| EMSR465 | 28:09 | na * |
| EMSR471 | −31:16 | 04:44 |
| Average | 08:48 | 09:02 |
| Median | 05:58 | 05:55 |
| Min | −31:16 | −30:06 |
| Max | 63:55 | 29:59 |
Table 9.
Overlap of the EFAS AOIs and the user AOIs for the activations related to pre-tasking (excluding EMSR187).
Table 9.
Overlap of the EFAS AOIs and the user AOIs for the activations related to pre-tasking (excluding EMSR187).
| Activation ID | EFAS AOIs (in km2) | User AOIs (in km2) | Overlap (in km2) | Share of the Overlap on EFAS AOIs (in %) |
|---|
| EMSR165 | 76,900.5 | 8855.2 | 0 | 0 |
| EMSR258 | 4080.6 | 4973.8 | 3920.4 | 96.1 |
| EMSR265 | 483.2 | 27,066.4 | 483.2 | 100.0 |
| EMSR279 | 5211.7 | 24,826.3 | 4842.9 | 92.9 |
| EMSR358 | 847.1 | 2759.2 | 255.9 | 30.2 |
| EMSR388 | 3350.8 | 4902.7 | 1074.5 | 32.1 |
| EMSR397 | 1008.5 | 7495.1 | 613.5 | 60.8 |
| EMSR416 | 14,536.6 | 15,696.3 | 870.5 | 6.0 |
| EMSR422 | 3398.5 | 4357.6 | 1457.3 | 42.9 |
| EMSR437 | 2774.0 | 3133.1 | 741.2 | 26.7 |
| EMSR444 | 3183.0 | 3335.0 | 456.3 | 14.3 |
| EMSR465 | 2697.4 | 3874.4 | 0 | 0 |
| EMSR471 | 2370.4 | 6861.5 | 820.8 | 34.6 |
| Average | 9295.6 | 9087.4 | 1195.1 | 41.3 |
| Median | 3183.0 | 4973.8 | 741.2 | 32.1 |
| Min | 483.2 | 2759.2 | 0 | 0 |
| Max | 76,900.5 | 27,066.4 | 4842.9 | 100.0 |
| Publisher’s Note: MDPI stays neutral with regard to jurisdictional claims in published maps and institutional affiliations. |
© 2021 by the authors. Licensee MDPI, Basel, Switzerland. This article is an open access article distributed under the terms and conditions of the Creative Commons Attribution (CC BY) license (https://creativecommons.org/licenses/by/4.0/).

 ,
, 

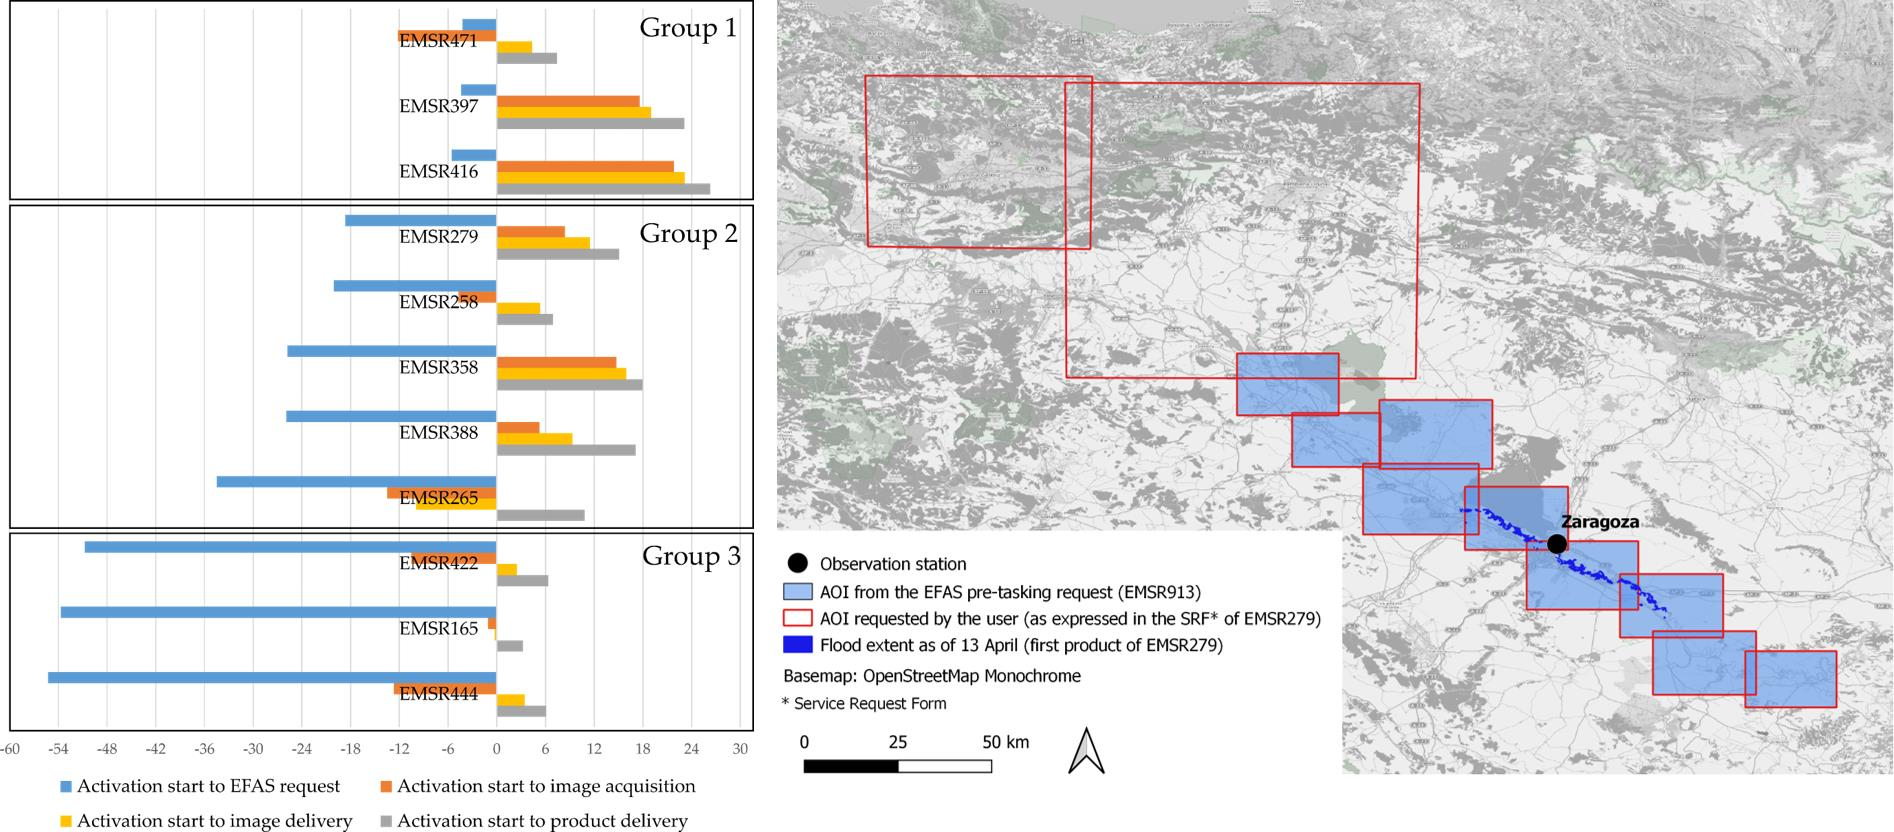
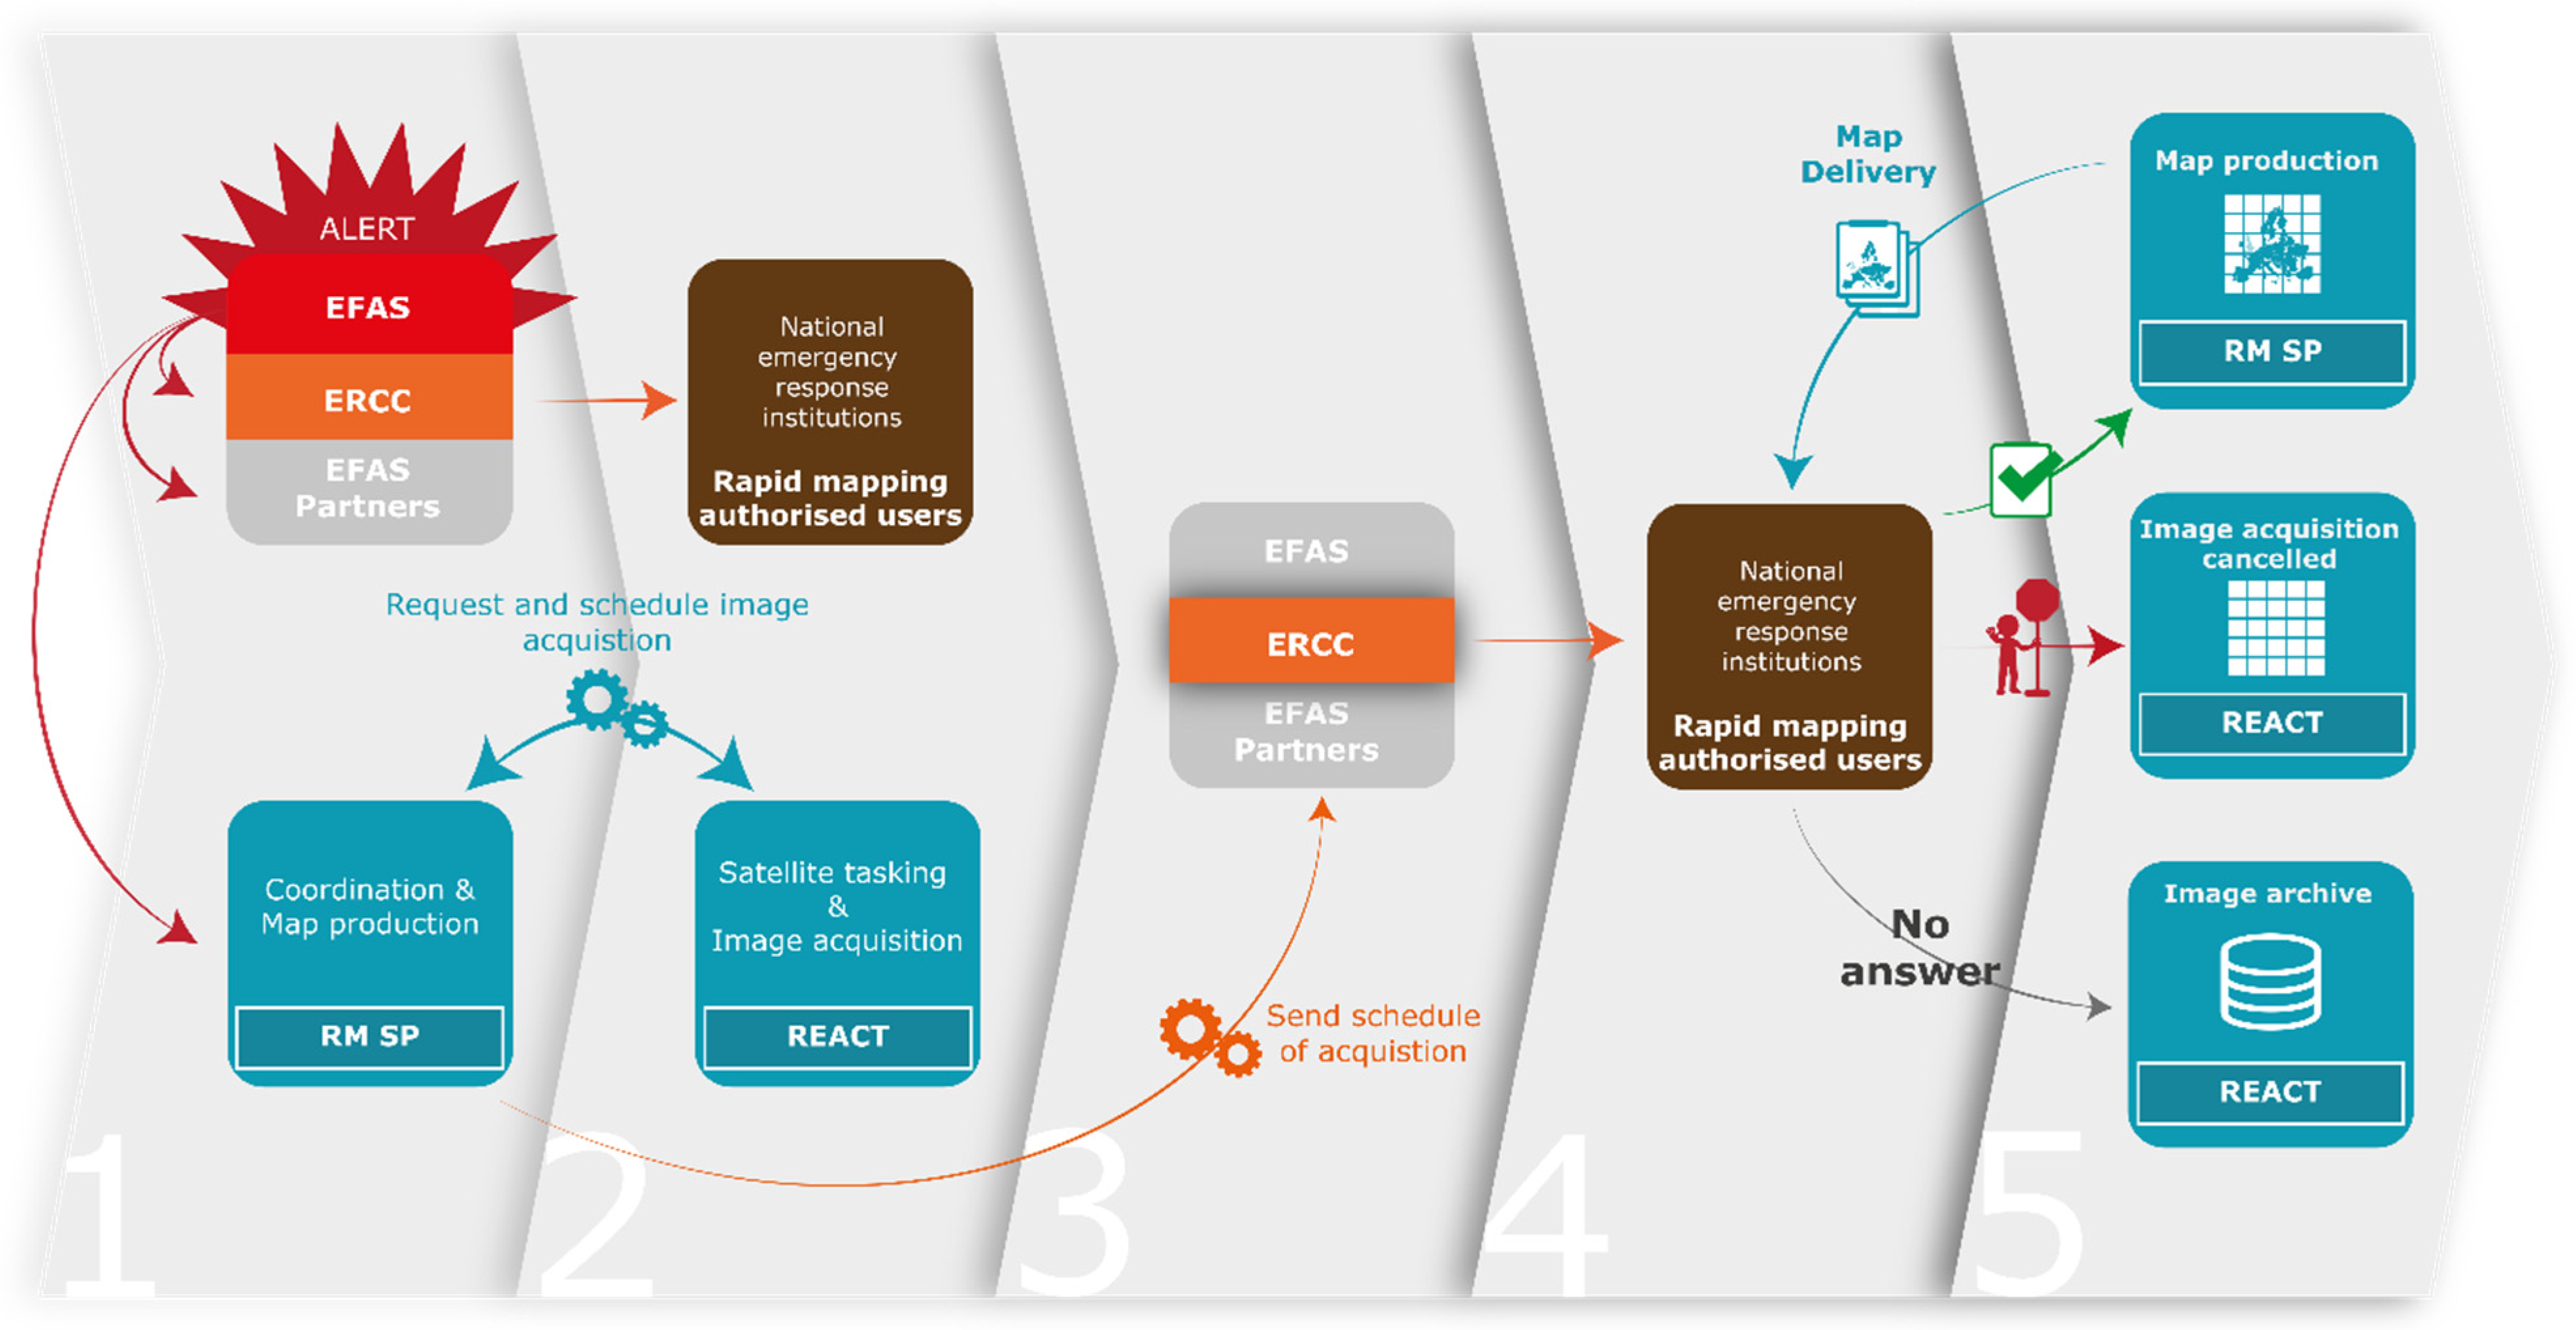
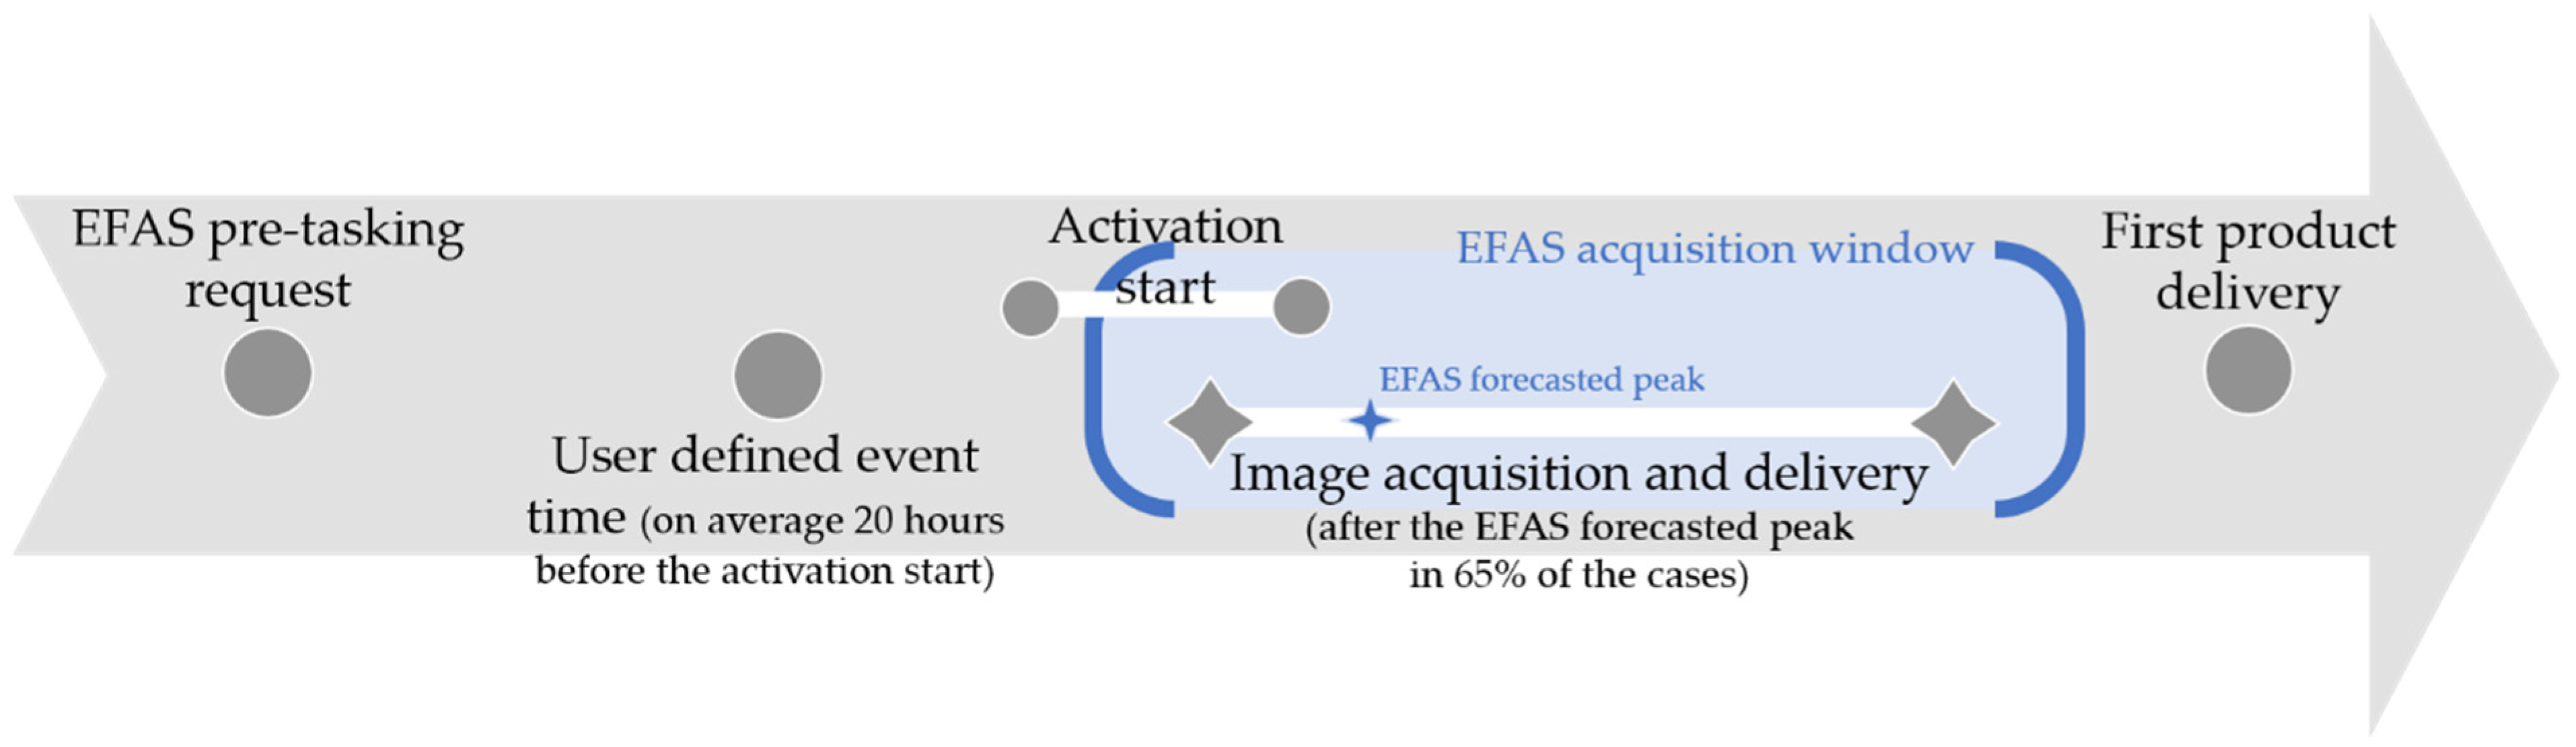
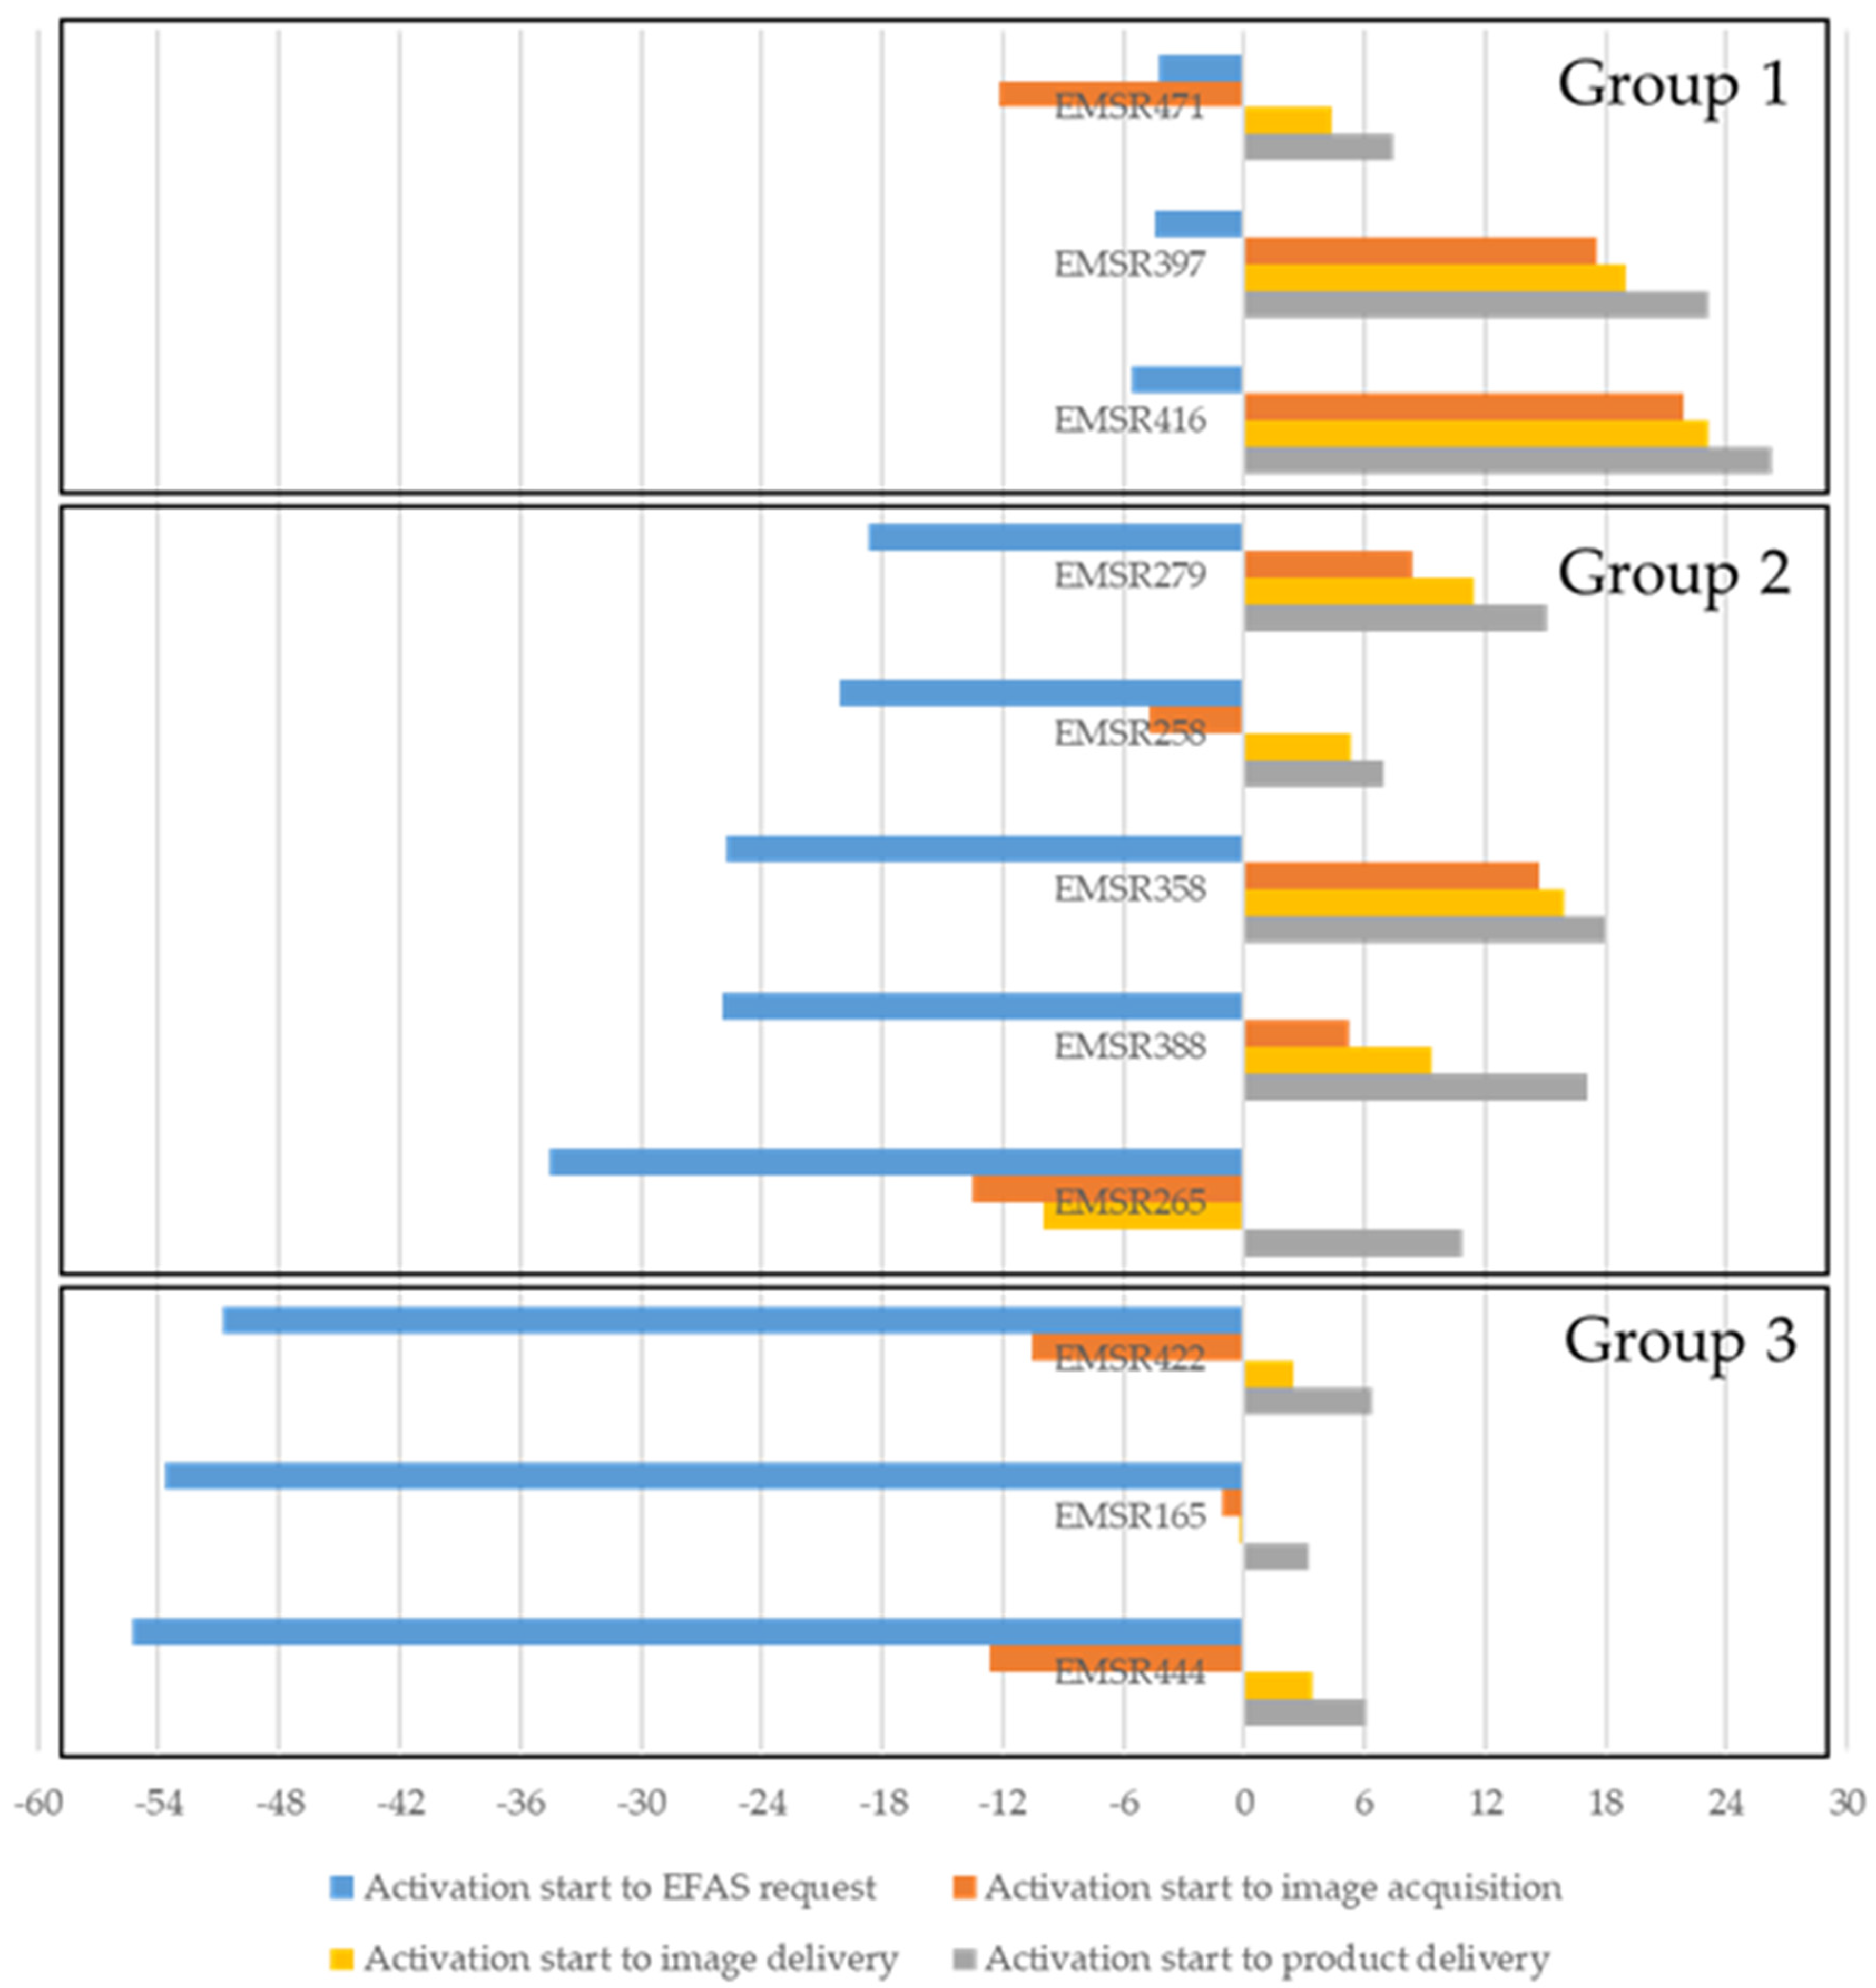
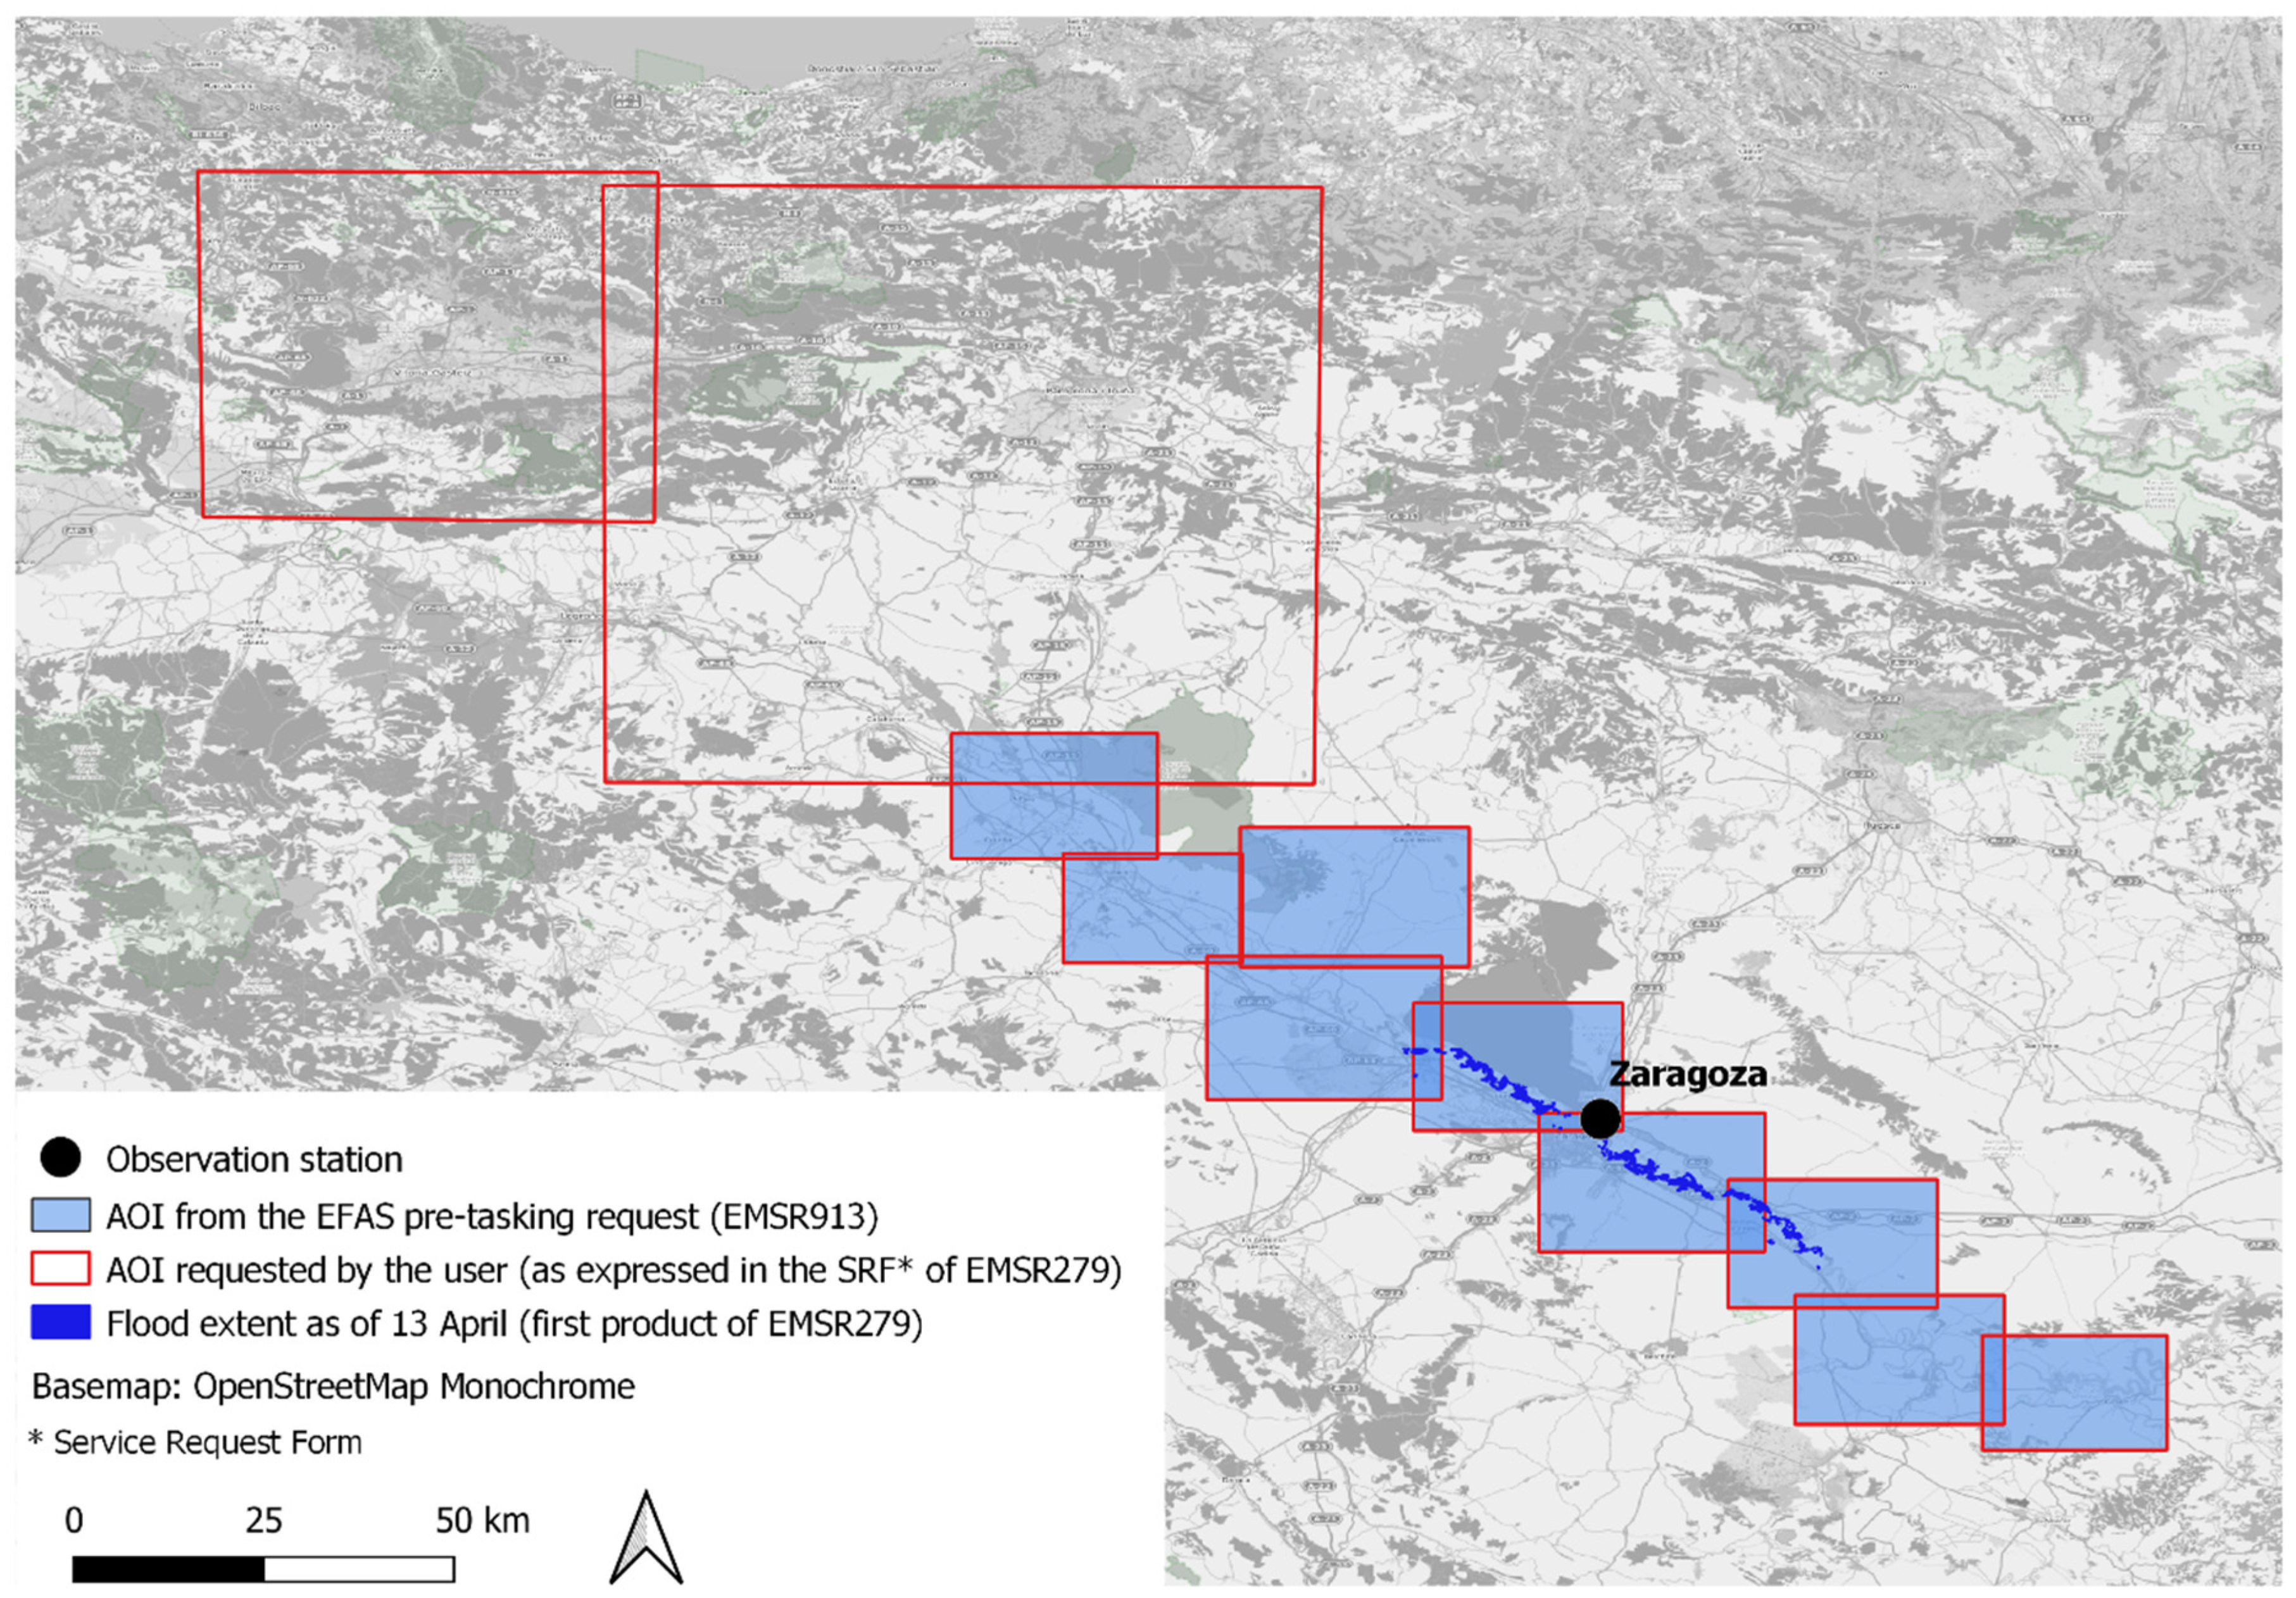
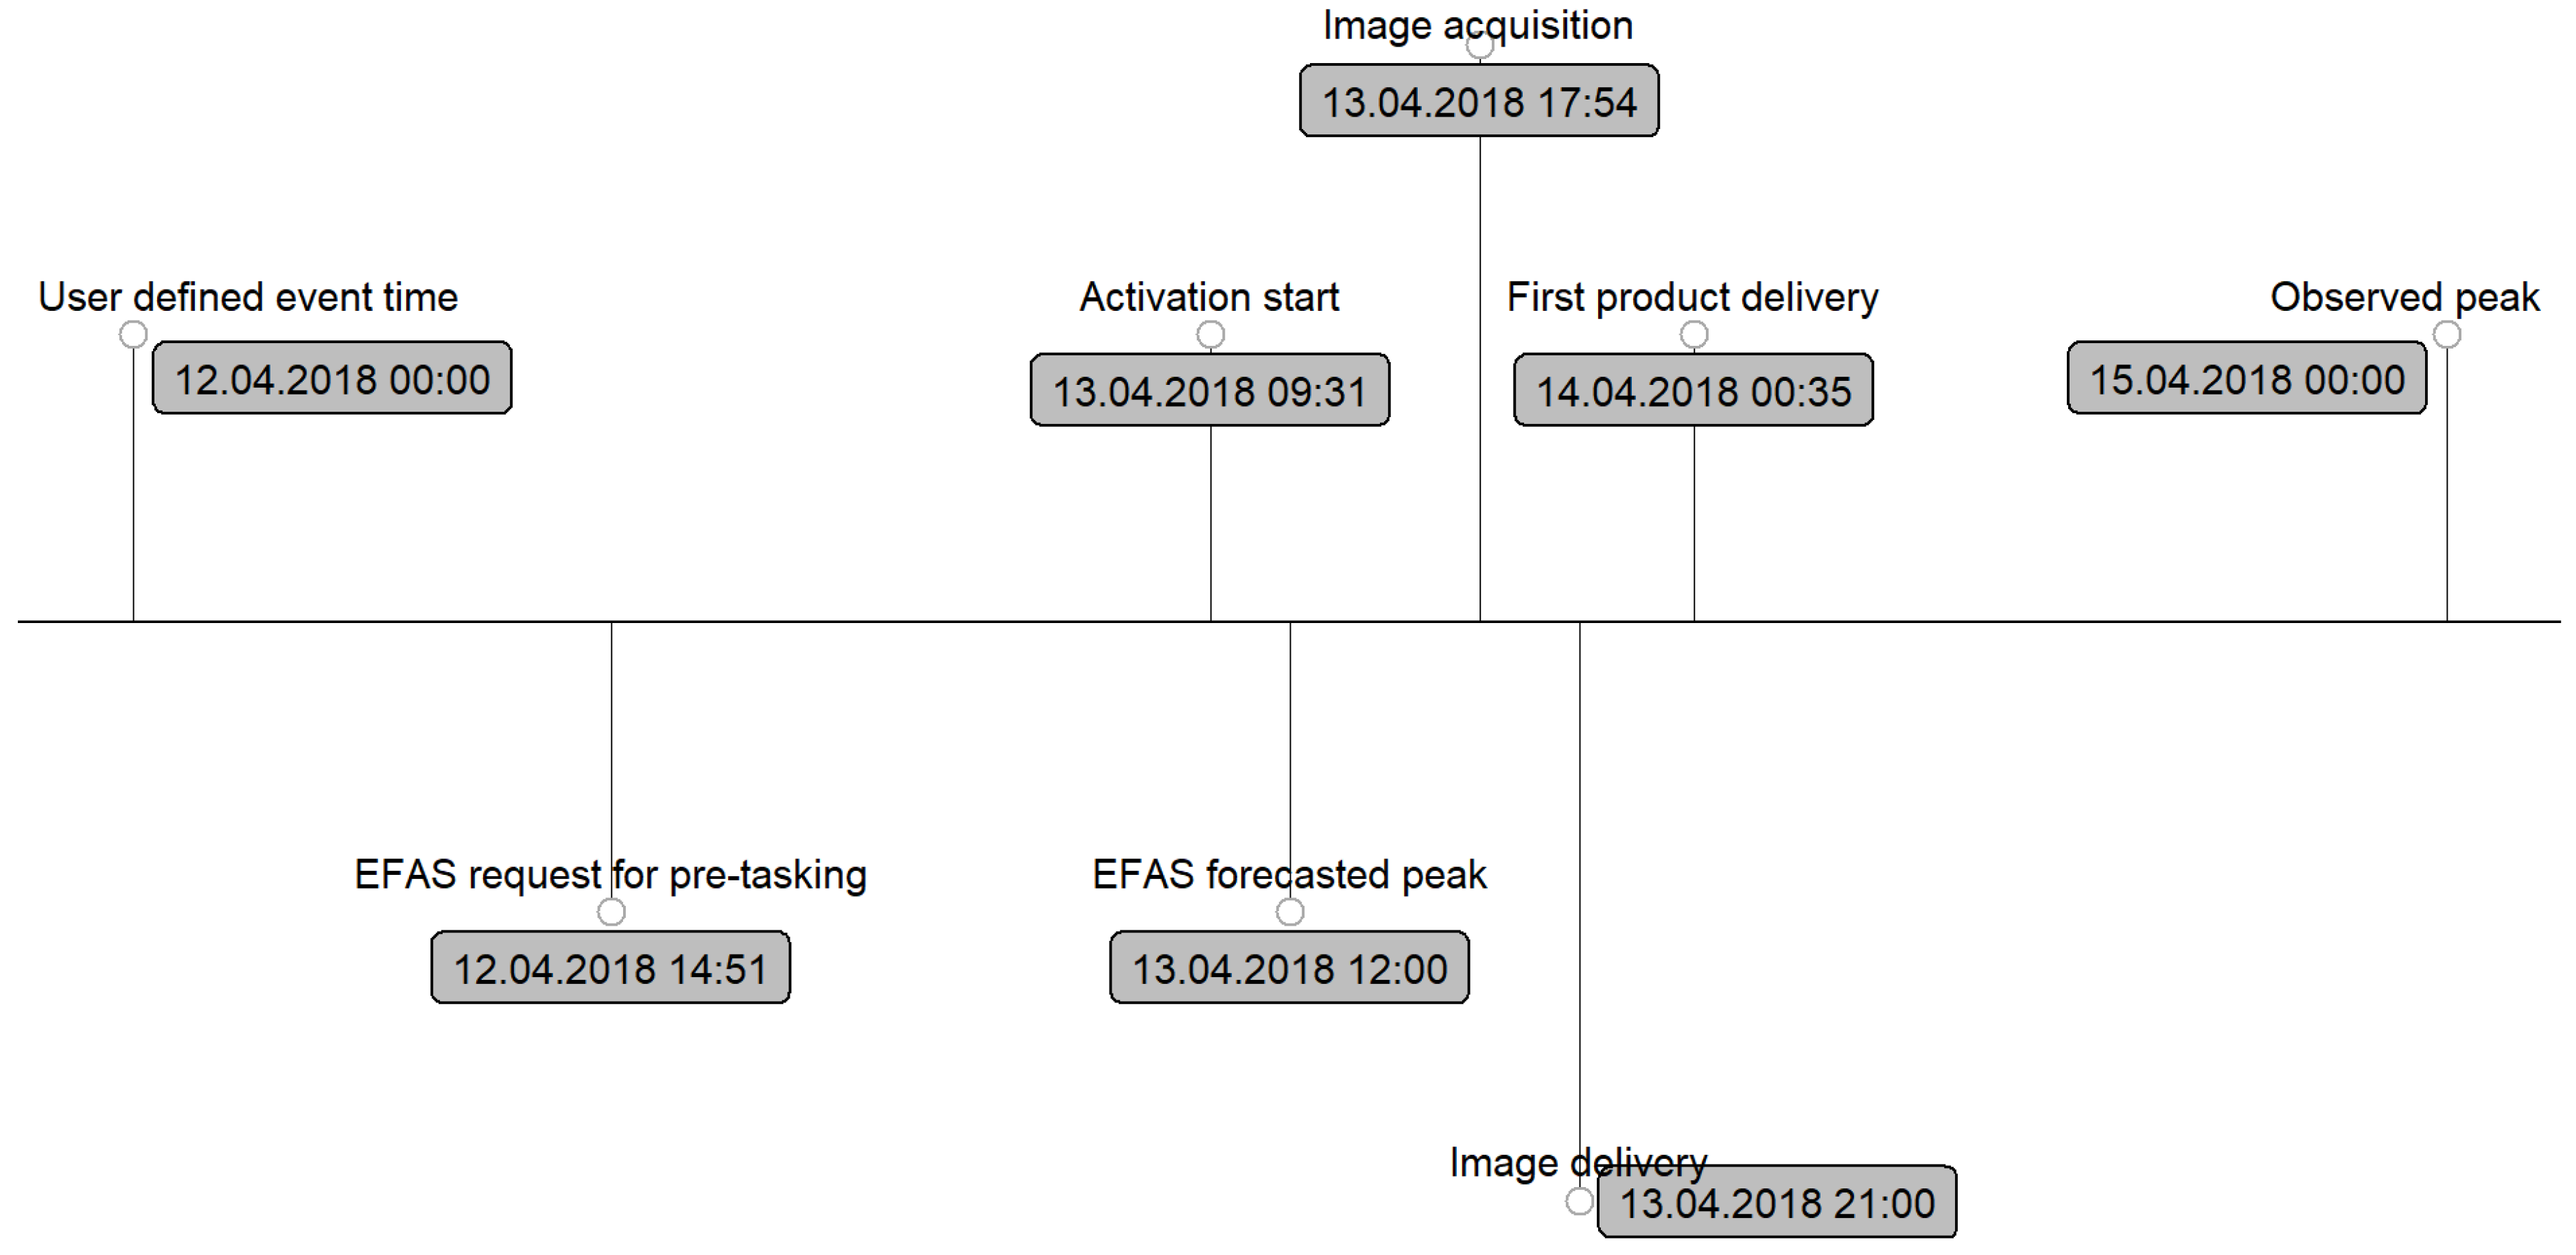