Article

Fast and Fine Location of Total Lightning from Low Frequency Signals Based on Deep-Learning Encoding Features

1
State Key Laboratory of Severe Weather, Chinese Academy of Meteorological Sciences, Beijing 100089, China
2
College of Electronic Engineering, Chengdu University of Information Technology, Chengdu 610200, China
3
Meteorological Observation Center of CMA, Beijing 100089, China
4
Department of Atmospheric and Oceanic Sciences and Institute of Atmospheric Sciences, Fudan University, Shanghai 200433, China
*
Author to whom correspondence should be addressed.
Remote Sens. 2021, 13(11), 2212; https://0-doi-org.brum.beds.ac.uk/10.3390/rs13112212
Submission received: 18 May 2021 / Accepted: 30 May 2021 / Published: 5 June 2021

Abstract

:
Lightning location provides an important means for the study of lightning discharge process and thunderstorms activity. The fine positioning capability of total lightning based on low-frequency signals has been improved in many aspects, but most of them are based on post waveform processing, and the positioning speed is slow. In this study, artificial intelligence technology is introduced for the first time to lightning positioning, based on low-frequency electric-field detection array (LFEDA). A new method based on deep-learning encoding features matching is also proposed, which provides a means for fast and fine location of total lightning. Compared to other LFEDA positioning methods, the new method greatly improves the matching efficiency, up to more than 50%, thereby considerably improving the positioning speed. Moreover, the new algorithm has greater fine-positioning and anti-interference abilities, and maintains high-quality positioning under low signal-to-noise ratio conditions. The positioning efficiency for return strokes of triggered lightning was 99.17%, and the standard deviation of the positioning accuracy in the X and Y directions was approximately 70 m.

1. Introduction

A lightning flash may include many discharge events such as initial breakdown, leader, return stroke, M component, continuous current, and K process [1,2,3]. Although the distribution of lightning flashes is different in different regions and thunderstorms, the lightning flashes generate similar discharge events, and the discharge signals corresponding to the same discharge events have similar characteristics. Taking return stroke as an example, the characteristics of 223 return strokes (RSs) in Brazil are almost the same as those of 209 RSs in the United States. The geometric mean of time interval between return strokes is 61.4 ms and 61.6 ms, respectively. The geometric mean of peak current of the first return stroke is –22.3 kA and –26.3 kA, respectively [4]. Other discharge events in different regions also have similar waveform characteristics [2,5,6,7,8,9,10,11].
Lightning discharge can generate signals from very low frequency (VLF), low frequency (LF) to very high frequency (VHF), which are often used for lightning positioning. The VHF signal of lightning is very rich, which lasts for the whole process of lightning discharge. Based on this signal, the fine positioning results of the lightning channel can be obtained [12,13,14]. However, compared to the VLF/LF signal, the VHF signal propagates along a straight line with weak strength and short transmission distance, so it can be easily blocked by ground objects and is affected by the local electromagnetic environment. Therefore, the lightning VHF positioning systems [15,16,17] are only used in some key fields or scientific research. In contrast, the VLF/LF signal of lightning has strong signal strength and long transmission distance, and is relatively less affected by environmental factors [18,19]. Therefore, the positioning technology based on VLF/LF signals is still the main means of business applications, and has been widely used in a wide range of lightning monitoring. Many countries and regions had built commercial two-dimensional cloud-to-ground (CG) lightning location networks based on VLF/LF signals, since the end of last century [20,21,22,23]. With the progress of detection technology, some commercial CG lightning location systems are being upgraded or redeveloped since the beginning of this century, to have a total lightning location capability, but their total lightning detection efficiency is not high [24,25,26,27,28].
In the past 10 years, various studies have been carried out on fine-positioning technology of low-frequency total lightning, which plays a great role in understanding the lightning process. For example, low-frequency fine-positioning technology has greatly promoted the understanding of the lightning initiation process [29,30]. Fine-positioning results are applied to thunderstorm research to improve the understanding of the fine configuration relationship between lightning activity and thunderstorm structure [31,32].
At present, the time of arrival (TOA) method is generally used in the low-frequency total lightning location technology applied in scientific research [33,34]. The basic principle of the TOA algorithm is as follows. When lightning discharges, its electromagnetic signal propagates freely into space, and the signals received by the distributed stations are different in time. The time and location of the discharge signal can be calculated according to the time difference between the signal time recorded by the distributed stations. According to the different matching methods of pulse signals, the TOA method can be divided into two types [35,36].
One type uses simple pulse features to match multiple pulses and then uses the TOA method for location. In the process of pulse matching, either only the time limit is determined by the station spacing [37] or both the time limit and the similarity of pulse amplitudes are considered [38,39,40]. The method based on the pulse matching of simple pulse features is easy to implement, but the positioning is not precise enough. At the same time, when the pulses are abundant, the amount of calculation increases geometrically.
Another type of TOA method is based on the original waveform, gradually narrowing the waveform window for waveform correlation matching (referred to as waveform cross-correlation matching), and then using the TOA method for location [41,42,43]. Compared to the TOA method based on pulse-peak feature matching, the precision of the location is improved due to the use of the original waveform. Furthermore, an empirical mode decomposition (EMD) technology is used to filter the original waveform before matching, which further improves the positioning accuracy [44]. This method uses waveform cross-correlation processing and complex signal filtering, which greatly increases the amount of calculation and reduces the positioning speed.
Time reversal technology can also be used in the three-dimensional location of low-frequency lightning discharges [45,46]. For example, Chen et al. [46] used the time reversal method to find the optimal solution in the space limited by the linear initial solution of the TOA method. In their processing, waveform cross-correlation matching is still used. In cases of a low signal-to-noise ratio (SNR), fewer matching stations or lower time accuracy, the method can still obtain accurate positioning results. However, it takes a long time to use the time reversal method for space optimization, and it is difficult to locate the whole thunderstorm process in real-time.
Recently, a graphics processing unit-based grid traversal localization algorithm (GPU-GTA) has been proposed. The algorithm establishes the time difference of arrival (TDOA) grid database in advance, and finds the grid matching with the measured TDOA, by searching [47]. This method has a fast location speed, but the matching ability is not improved, so it is difficult to obtain fine lightning locations.
In addition, artificial intelligence technology has been applied to lightning detection and early warning technology, which improves the classification ability of lightning types and the performance of lightning early warning. For example, Zhu et al. [48] used a support vector machine to classify the lightning electric field signals collected by the Cordoba Marx Meter Array, and the effective classification accuracy rate of cloud flashes and ground flashes was 97%. Wang et al. [49] used a multi-layer one-dimensional convolutional neural network to automatically extract VLF/LF lightning waveform features, and then classified lightning discharges based on the features. The overall classification accuracy on the lightning dataset was 99.11%. Zhou et al. [50] has built a deep-learning network that integrates satellite, radar, and lightning positioning data to predict the occurrence of lightning. It has a good performance in the short-term lightning prediction of 0–1 h. Since the beginning of this century, as an effective method of extracting target features, autoencoder has been widely used in various fields, which can get low dimensional encoding features from high-dimensional data through a multi-layer neural network [51]. In recent years, convolutional neural networks have achieved excellent performance in extracting features of multiple targets [52,53], which directly promote the generation of convolutional autoencoders. The convolutional autoencoder integrates the convolutional neural network structure into the autoencoder, so that the feature weight is shared globally in the input, and the local integrity is maintained, thereby better preserving the data features [54]. The convolutional autoencoder can be used to extract the characteristics of lightning pulses, so as to obtain the low dimensional feature of lightning signal.
In summary, the lightning 3D positioning system currently used in the business is based on simple features to locate discharge event, which has a fast positioning speed, but cannot finely locate the lightning channel. In the field of scientific research, although the precise location of the lightning channel has been realized, most are based on the original waveform, and the speed is relatively slow. At present, there is still no mature technology with both fine positioning and fast positioning capability for low-frequency lightning signals. At the same time, artificial intelligence technology has achieved good results in feature extraction. Therefore, here, artificial intelligence technology is introduced into total lightning positioning based on low frequency signals, and the TOA method based on deep-learning encoding feature-matching (a new algorithm) is proposed. This method has fine positioning ability, and greatly improves the matching efficiency and positioning speed.

2. Materials and Methods

2.1. LFEDA System

LFEDA is a three-dimensional (3D) lightning positioning system for thunderstorm monitoring built by the Chinese Academy of Meteorological Sciences in Conghua, Guangzhou. 
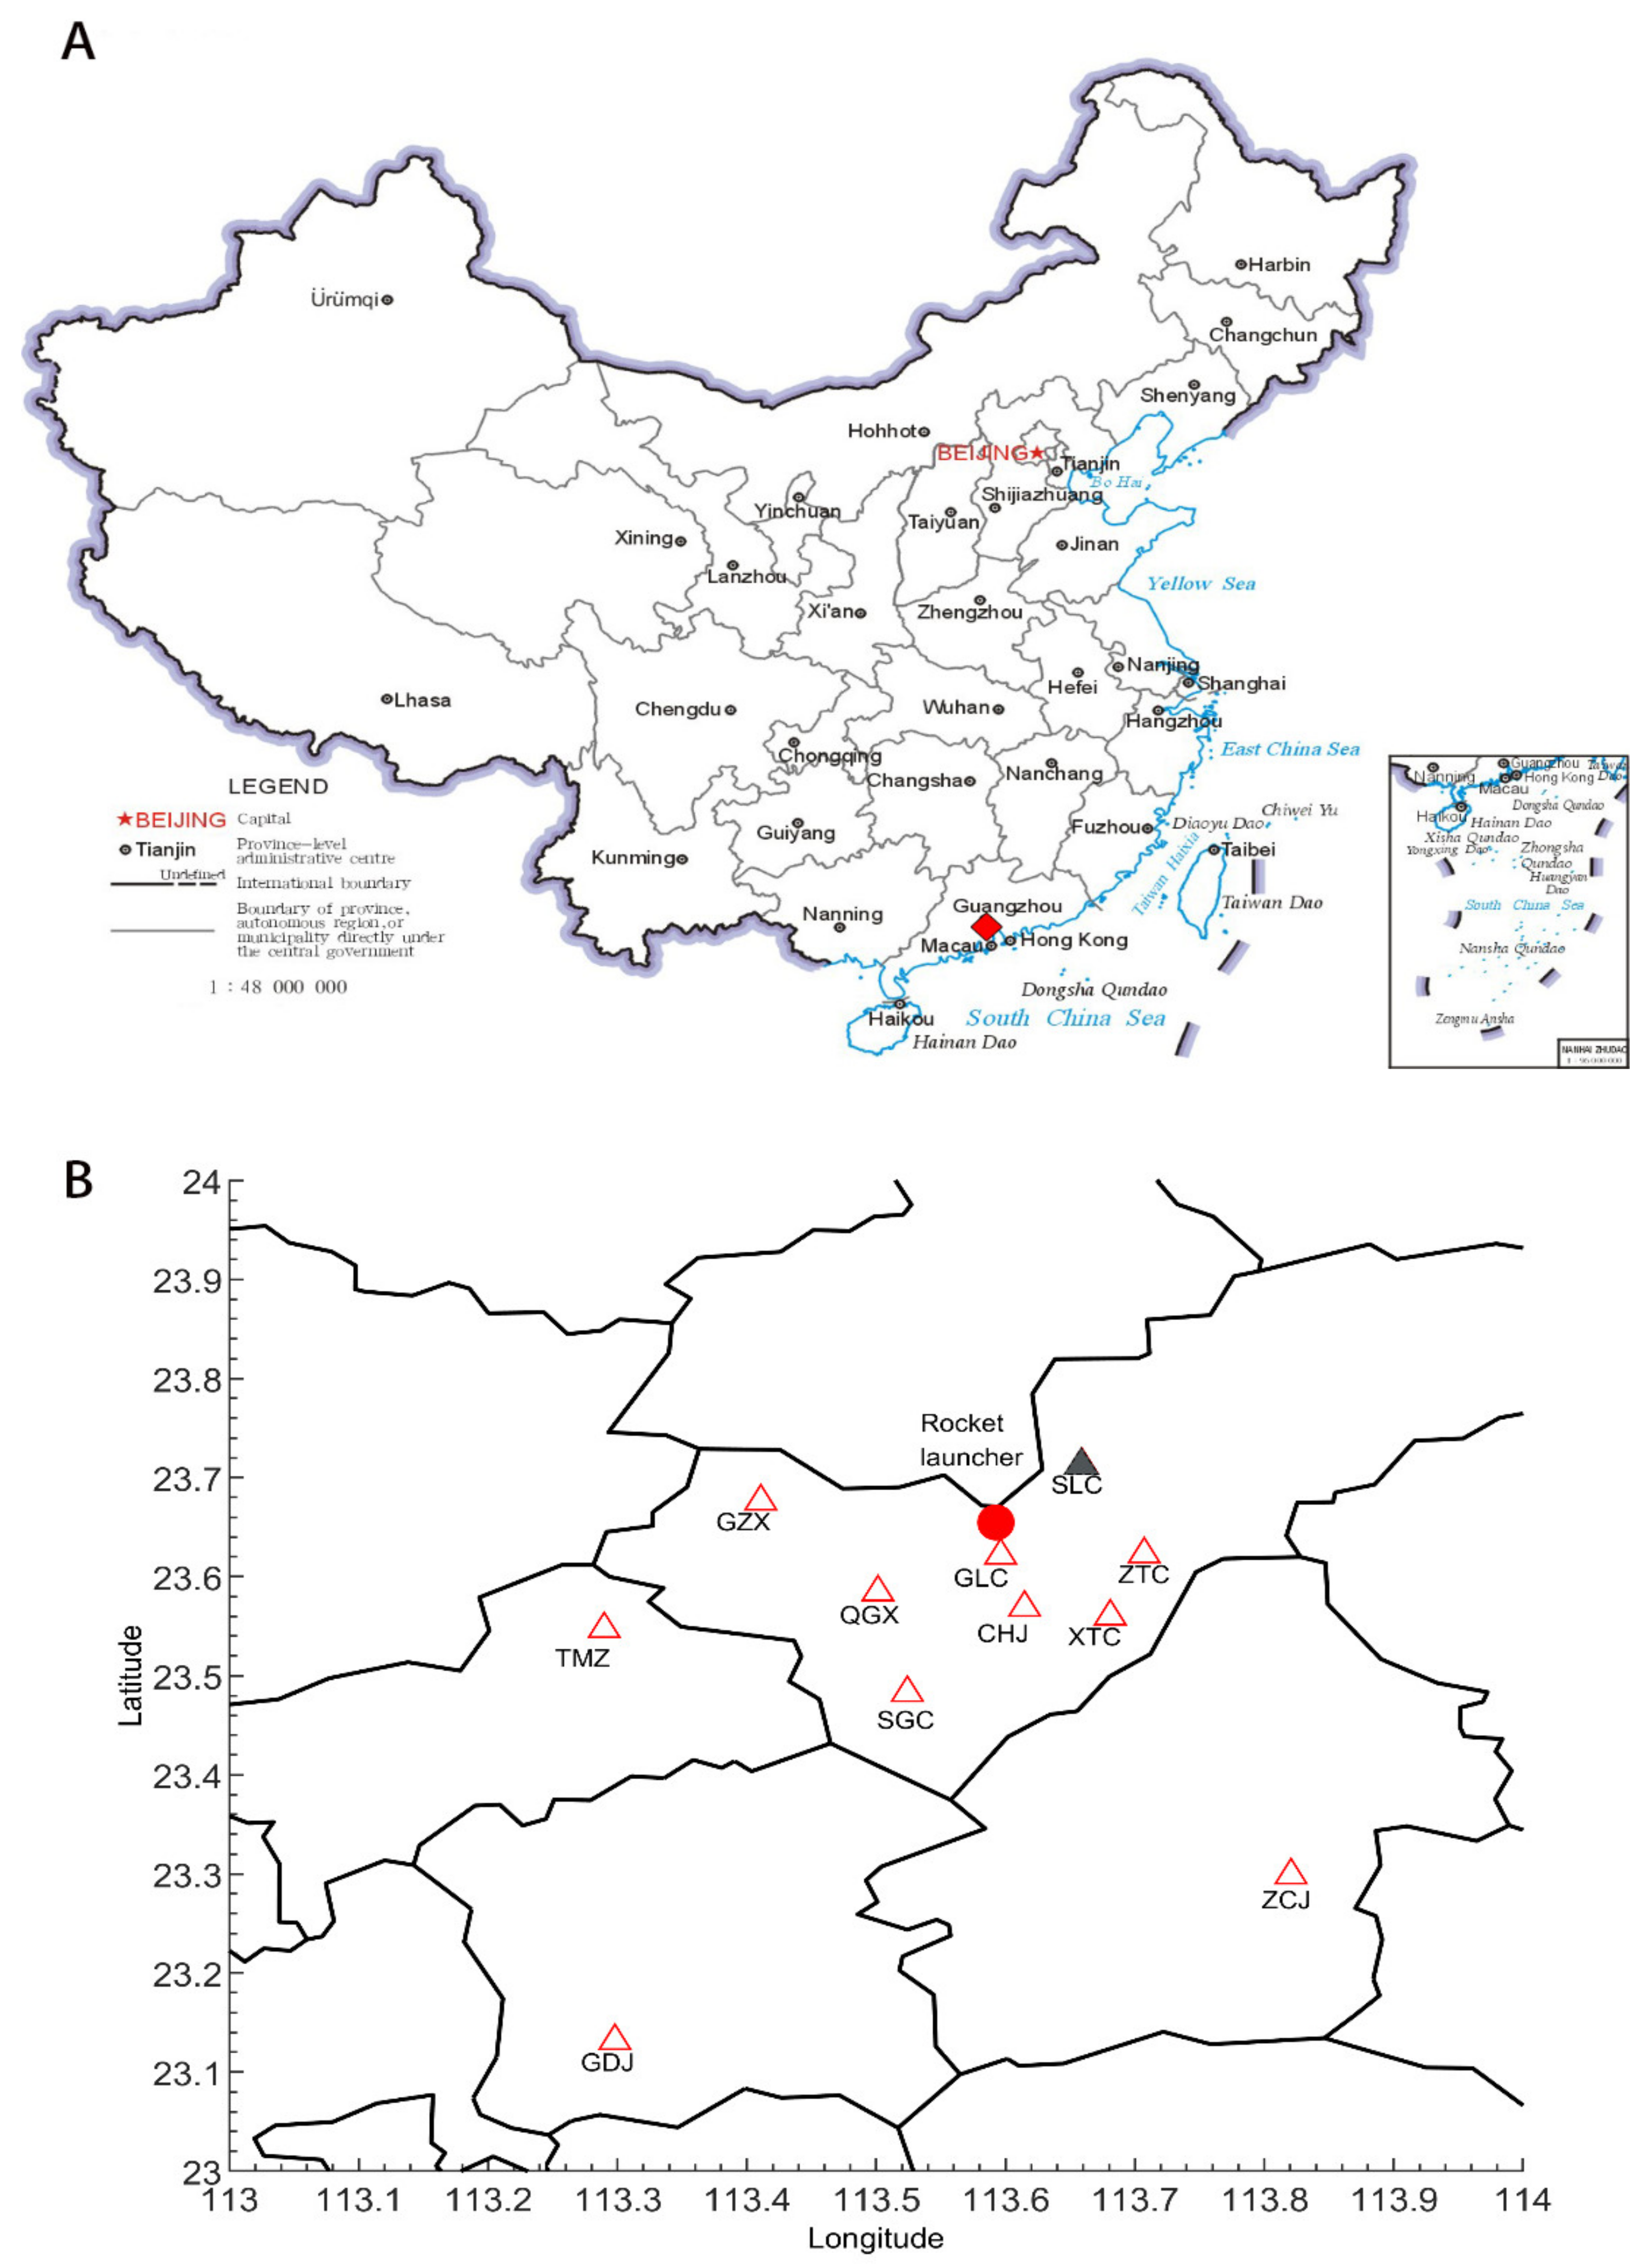
Figure 1A is the map of China, and the red diamond represents the location of LFEDA. As shown in Figure 1B, the LFEDA is composed of 10 distributed substations with a baseline of 6–60 km and an average distance between other stations and CHJ is 22 km, which accurately locates lightning discharges within 100 km. The SLC station was relocated to the ZTC station in 2017. 
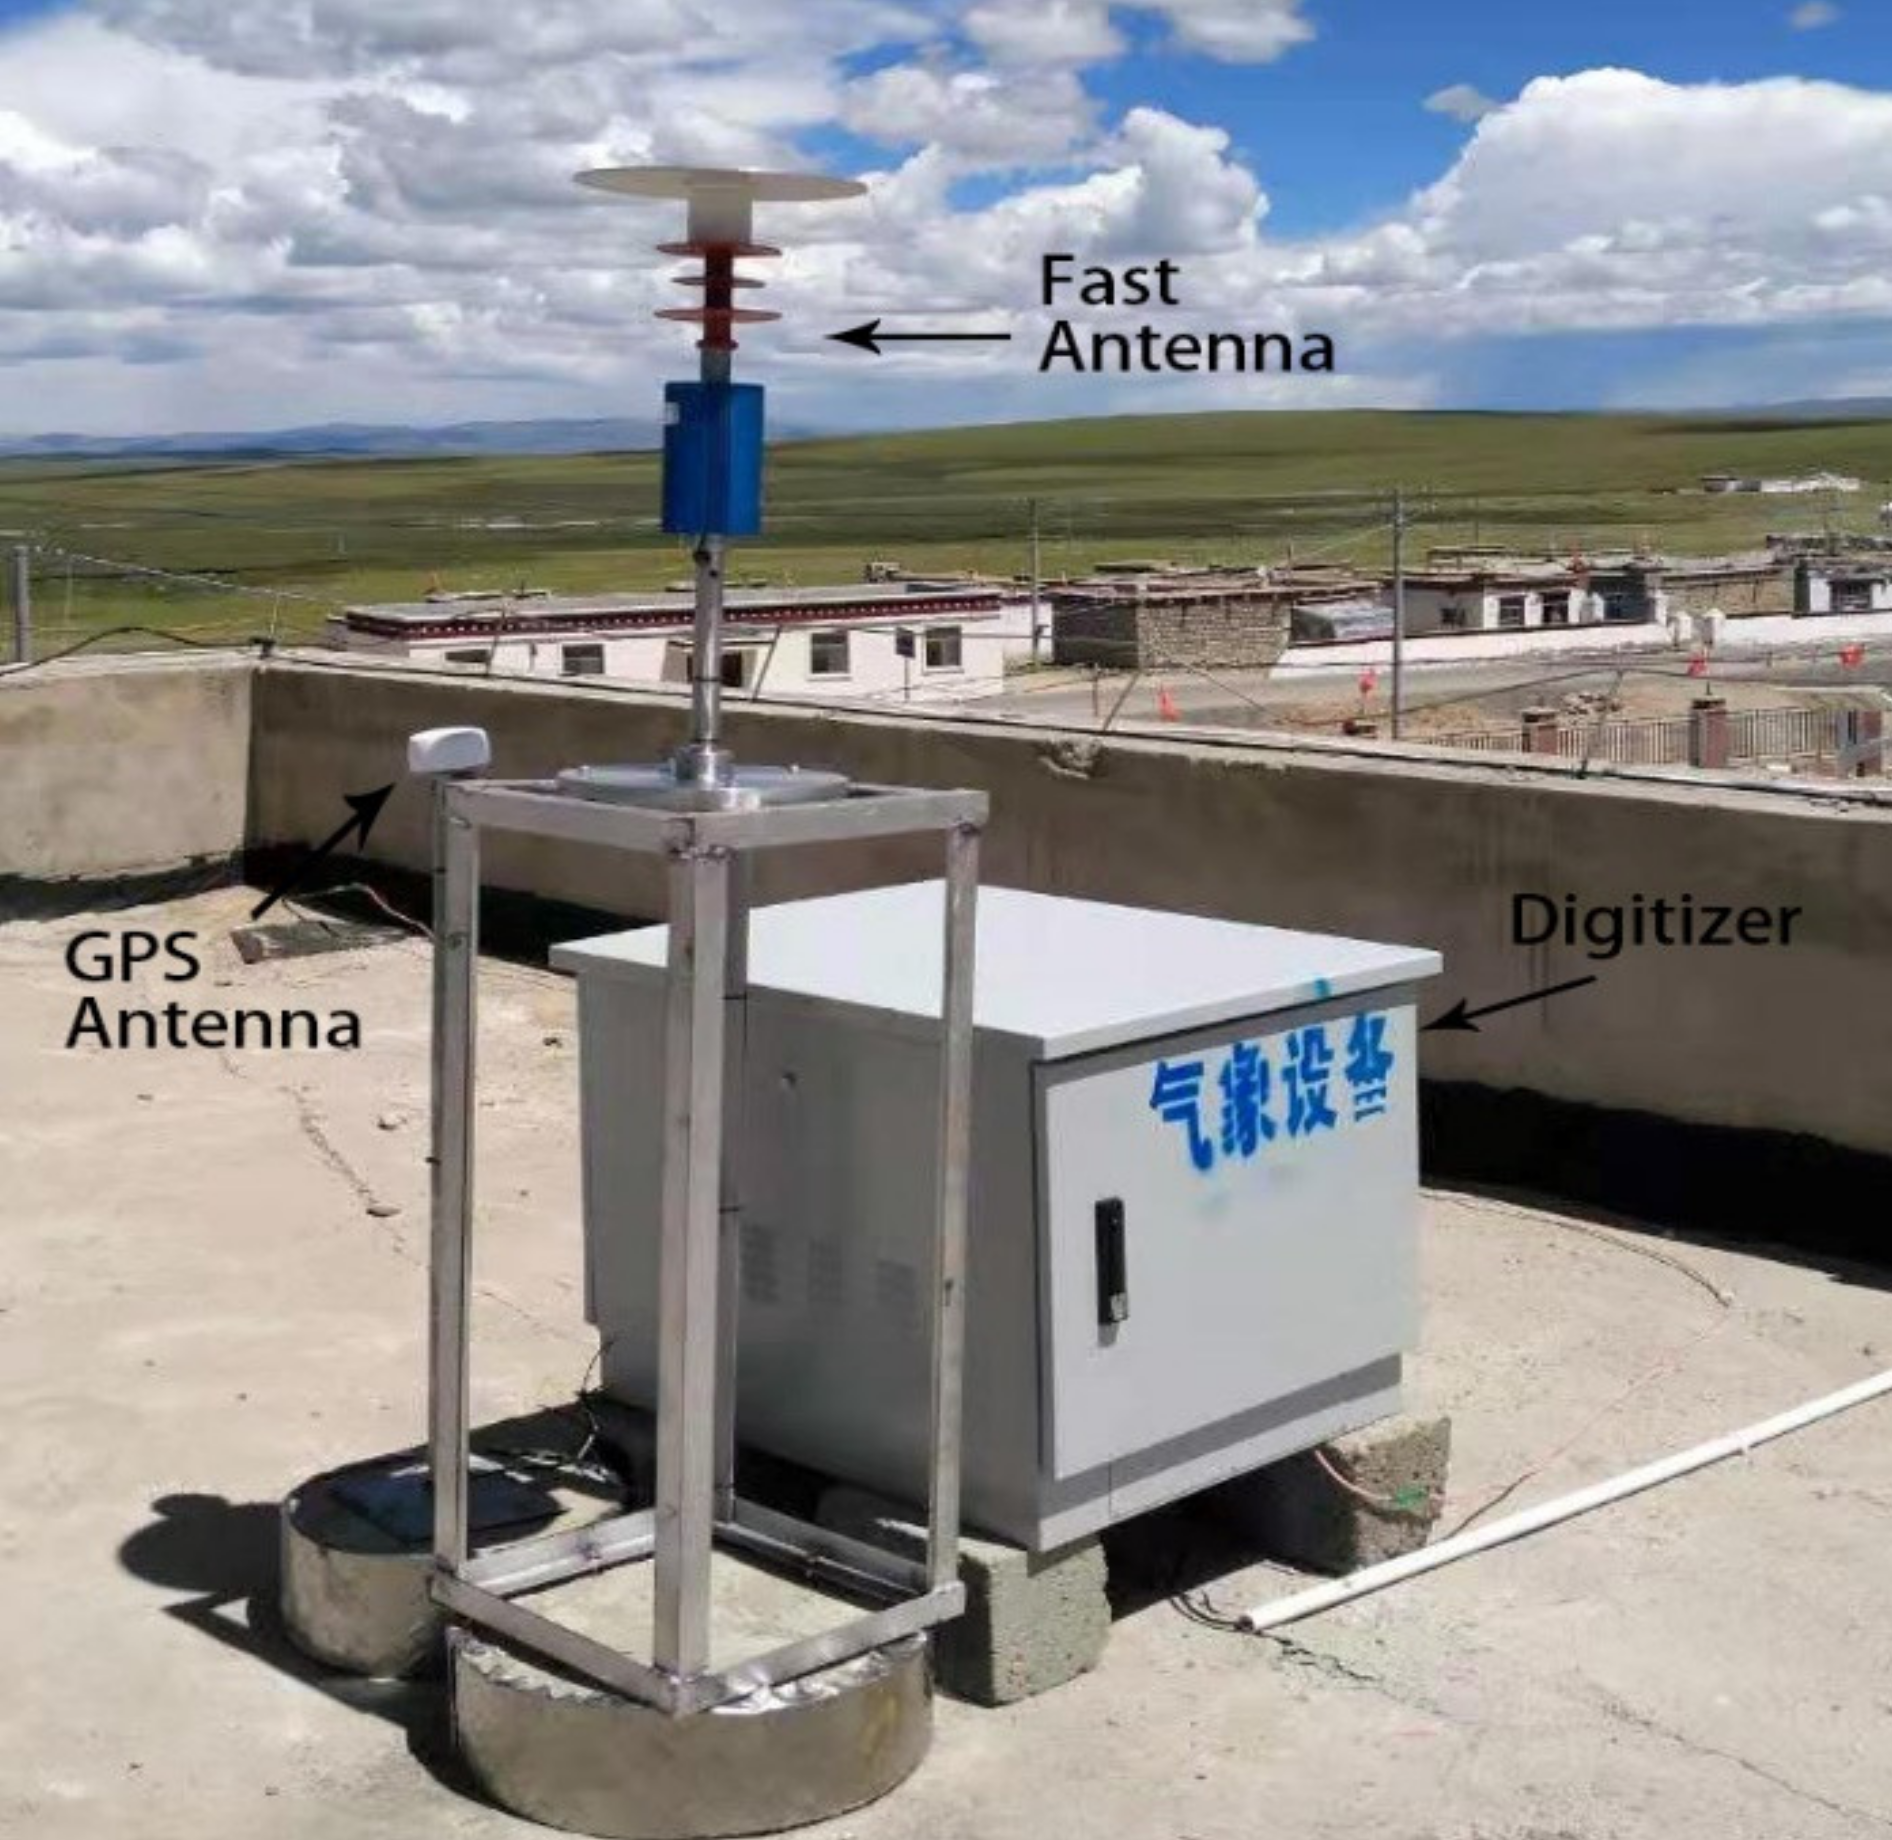
Figure 2 is the equipment of each substation, which is composed of a digitizer, a fast antenna, and a global positioning system (GPS) clock source. Each substation uses a fast antenna to detect the electric field change signal from 160 Hz to 600 kHz, and adopts segmented trigger acquisition technology to record the signal waveform in sections, while marking the time. The principle of the fast antenna is similar to that for the Los Alamos Sferic Array sensor [38], but it receives the spatial electric field change signal through an upright capacitor plate, and an active integration circuit with a time constant of 1 ms. The time precision is ~100 ns, the sampling rate is 10 MS/s, the trigger sampling length is 1 ms, the pre-trigger length is 0.2 ms, and a 12-bit analog to digital data acquisition is used. This paper presents algorithm research based on LFEDA observation data of a typical cloud-to-ground lightning process on 15 August 2015. Moreover, the performance of the new algorithm was tested based on artificially triggered lightning flashes, which occurred in the LFEDA network.

2.2. Experiments with Artificially Triggered Lightning

The triggered lightning flashes used to evaluate the detection performance were obtained by the experiments of artificial triggered lightning. The experiment was jointly carried out since 2006, by the State Key Laboratory of Severe Weather of the Chinese Academy of Meteorological Sciences and the Guangzhou Institute of Tropical Marine Meteorology, China Meteorological Administration, in the Conghua district, Guangzhou. Thus far, 189 lightning flashes have been triggered successfully. Figure 3A shows the layout of the triggered lightning test site. The rocket launcher and lightning rod are located inside the LFEDA network. Figure 3B shows a photo of a triggered lightning, which was triggered at the position of the lightning rod through a metal wire pulled up by the rocket. For each triggered lightning flashes, the close-range electromagnetic field and channel-based current were detected synchronously, and the recording time was 5 s, which could ensure the complete acquisition of a lightning process. At the same time, the optical channel observations at 1.9 km and 600 m provided direct optical records of lightning return stroke channels. In order to compare the positioning results of this study with others, the triggered lightning flashes with return stroke in 2015 and 2017 were used in this study. Please refer to the articles of Chen et al. [55] for specific information on artificially triggered lightning.

2.3. Location Method

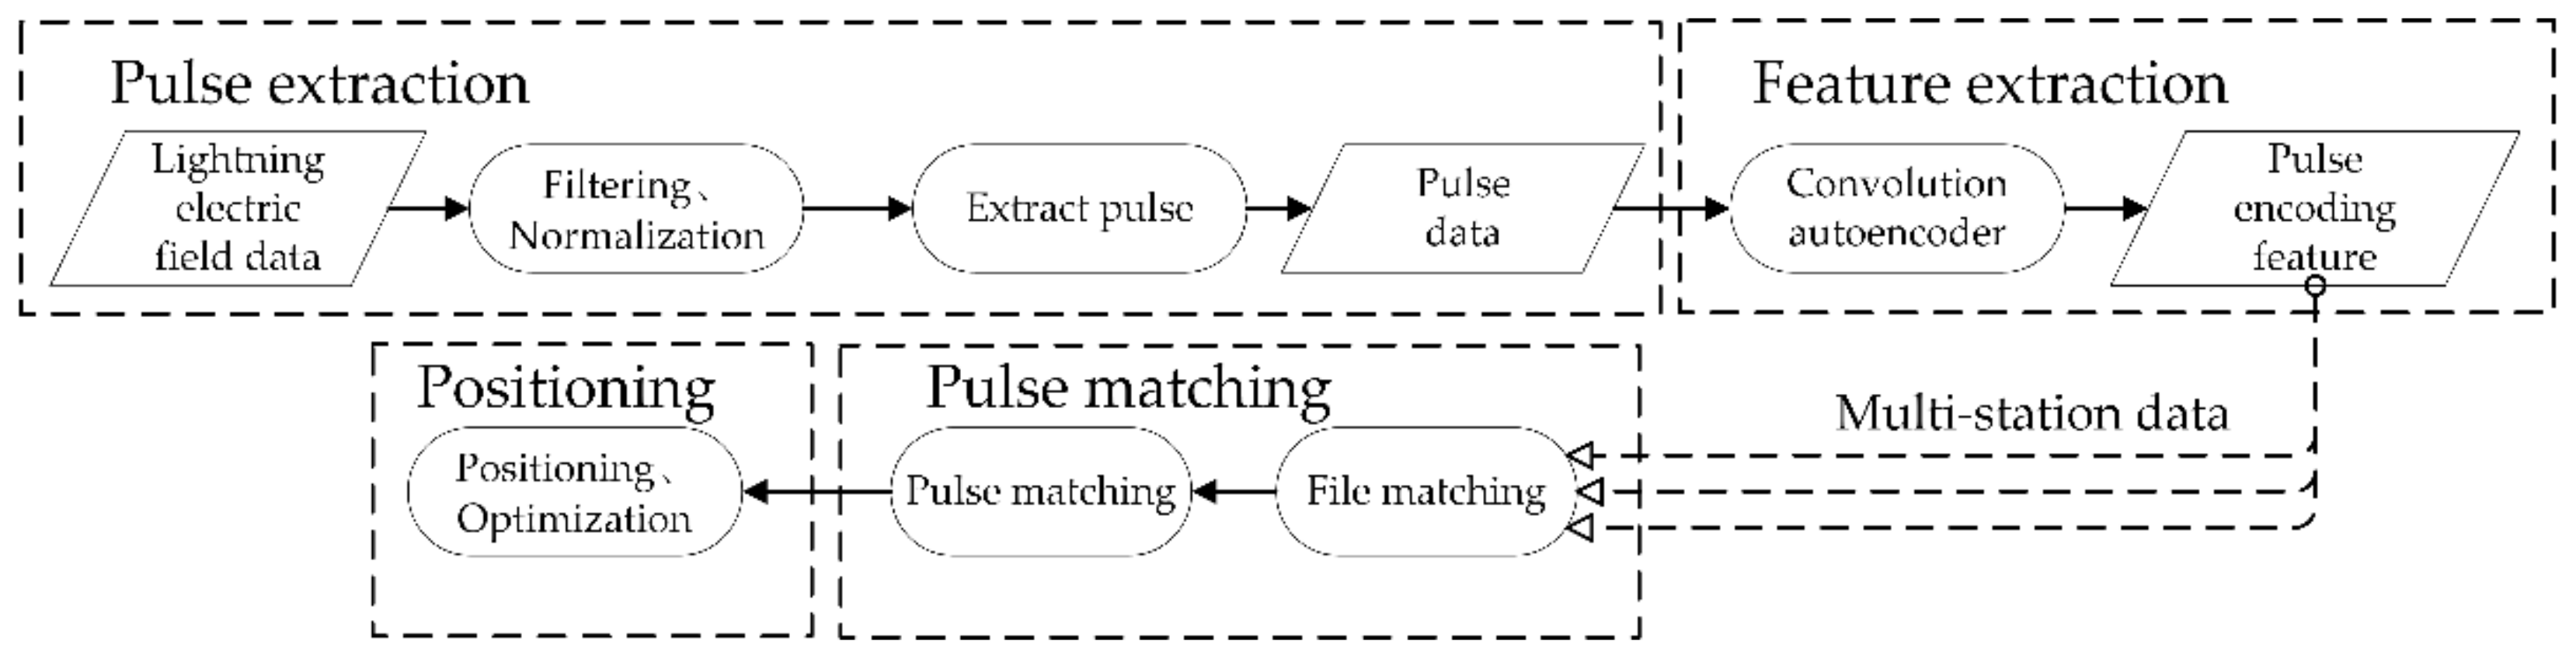
The new algorithm based on deep-learning encoding feature (hereinafter referred to as encoding feature) matching is mainly divided into 4 steps—pulse extraction, feature extraction, pulse matching, and positioning (Figure 4).
Pulse extraction: The lightning waveforms of all stations are filtered by a bandpass filter to remove the frequency components above 100 kHz and below 5 kHz, and is then normalized. After that, according to the threshold of noise and peak-to-peak interval (1 μs), the pulse peak is found, and a 25.6 μs waveform including the pulse peak is intercepted.
Feature extraction: The extracted pulse waveform is input into the trained convolutional autoencoder to obtain the encoding features, which together with the pulse-peak time constitute the pulse feature vector.
Pulse matching: First, one station is selected as the master station, and the pulses of other stations are matched with the master station pulse, one by one, according to the correlation coefficients of the encoding features. The matching condition is that the peak time difference between the two stations does not exceed the propagation time of light between the two stations, and the pulse encoding features of the two stations have the highest correlation. After the pulses are matched successfully, a set of matching pulse-peak time data is obtained from the pulse feature vectors.
Positioning: According to the matched pulse-peak time data and the geographic location of each station, the TOA method is used to calculate the occurrence time and location of the lightning discharge event. Taking the matching signals of 5 stations as an example, the details are as follows. For matched signals of any stations, according to the distance from the discharge event to 5 stations, five equations in the form of Equation (1) can be listed. By subtracting the four stations remaining from one of them, four equations in the form of Equation (2) can be obtained, which can be converted into matrix multiplication, to obtain linear initial solutions.
In Equation (1), (x, y, z, t) represents the position and time of lightning discharge, (xi, yi, zi, ti) represents the location and recorded pulse-peak time of the substation, c is the speed of light (c = 3 × 10⁸ m/s), and i is the serial number of the substation. In Equation (2), (x, y, z, t), (xi, yi, zi, ti), c and i have the same meanings in Equation (1), and (xm, ym, zm, tm) represents the position and recorded pulse-peak time of the main station.
x i x 2 + y i y 2 + z i z 2 = c t i t
x x i x m + y y i y m + z z i z m c 2 t t i t m = x i + y i + z i 2 x m + y m + z m 2 c 2 t i 2 t m 2 2
Then, the Levenberg Marquardt algorithm is used to fit Equation (3) to obtain the final accurate numerical solution. (x, y, z, t) represents the location and time of lightning discharge, (xi, yi, zi, ti), c, and i have the same meaning in Equations (1) and (2). Finally, the output positioning results are screened by the goodness of fit (χ 2), under the condition of χ 2 < 5.
f i = t i t x x i 2 + y y i 2 + z z i 2 2 c

2.4. Establishment of Convolutional Autoencoder Model

To improve the matching ability, we establish a convolutional autoencoder for lightning signals, which is mainly composed of an encoder and a decoder. The encoder extracts fixed-length encoding feature from the input pulse waveform for subsequent matching and positioning. The encoding feature is the abstract information of pulse waveform, which is used to decode and recover the waveform to the maximum extent. The decoder is only used to calculate the encoder error during the training process. The convolutional autoencoder details are as follows.
First, based on the LFEDA data, a fixed-length lightning signal is input into the encoder, and the shallowest features are extracted through the first layer of the neural network. Then, the features are condensed through the maximum pooling layer, reducing the feature length by 1/2. The latter two layers of neural networks continue the above operations on the features extracted from the previous layer, and finally form 32 encoding features. The structure of the decoder is similar to that of the encoder but is only used to reconstruct the original signal to test the effect of encoding and training.
The convolutional autoencoder is trained for 10 trials. During the training process, the adaptive moment estimation (ADAM) algorithm is used for optimization. ADAM algorithm is a simple and computationally efficient algorithm for gradient-based optimization of stochastic objective functions. This algorithm combines the advantages of other algorithms, which can make the training process shorter and occupy less memory. The optimized loss function is shown in Equation (4), where n is the length of the data, i is the serial number of the data, Etrue is the true electric-field value, and Epred is the predicted electric-field value. When the loss is minimum, the weight of neural network is the most suitable for feature extraction of lightning signals.
loss = 1 n i = 1 n E true i E pred i 2
The fixed-length waveform segments corresponding to 225,476 real lightning discharge events in a thunderstorm on 15 June 2017 were used as the training data set. The data included various lightning discharge events, so the features of various lightning discharge pulses could be accurately extracted.

2.5. Selection of the Model Key Parameter

The length of input pulse waveform and the encoding feature are two key parameters in the model, which need to be determined through the test. Taking pulse CHJ-1 in Figure 5a as an example, we analyze the influence of different pulse waveform length and encoding feature length on feature extraction. The correlation coefficients between the original waveforms and the decoded waveforms are calculated in different cases, which reflects the encoding effect. The larger the correlation coefficient, the more similar the waveforms and the better the feature expression. Table 1 shows the influence of encoding feature length on the correlation coefficients between the original waveform and the decoded waveform. With an increase in the encoding feature length, the correlation coefficient between the decoded waveform and the original waveform increases, which means that the decoded waveform is more accurate. When the lengths of encoding feature increases to 32 and 64, the correlation coefficients are greater than 0.99, indicating that the decoded waveforms are basically consistent with the original waveforms. However, a large encoding feature length significantly increases the amount of computation. Therefore, considering the decoding effect and computing speed, we chose 32 as the length of the encoding feature.
Table 2 shows the influence of pulse waveform length on the correlation coefficients between the original waveform and the decoded waveform. Although the correlation coefficients between the decoded waveforms and the original waveforms increased with the increase of pulse waveform length, the correlation coefficient change was not obvious. However, considering the distribution range of the duration of lightning pulse detected by LFEDA (ranging from several to tens of us), we chose 25.6 μs as the input waveform length of the model to ensure that most pulses could extract complete features instead of local features.

2.6. Matching Ability of New Algorithm

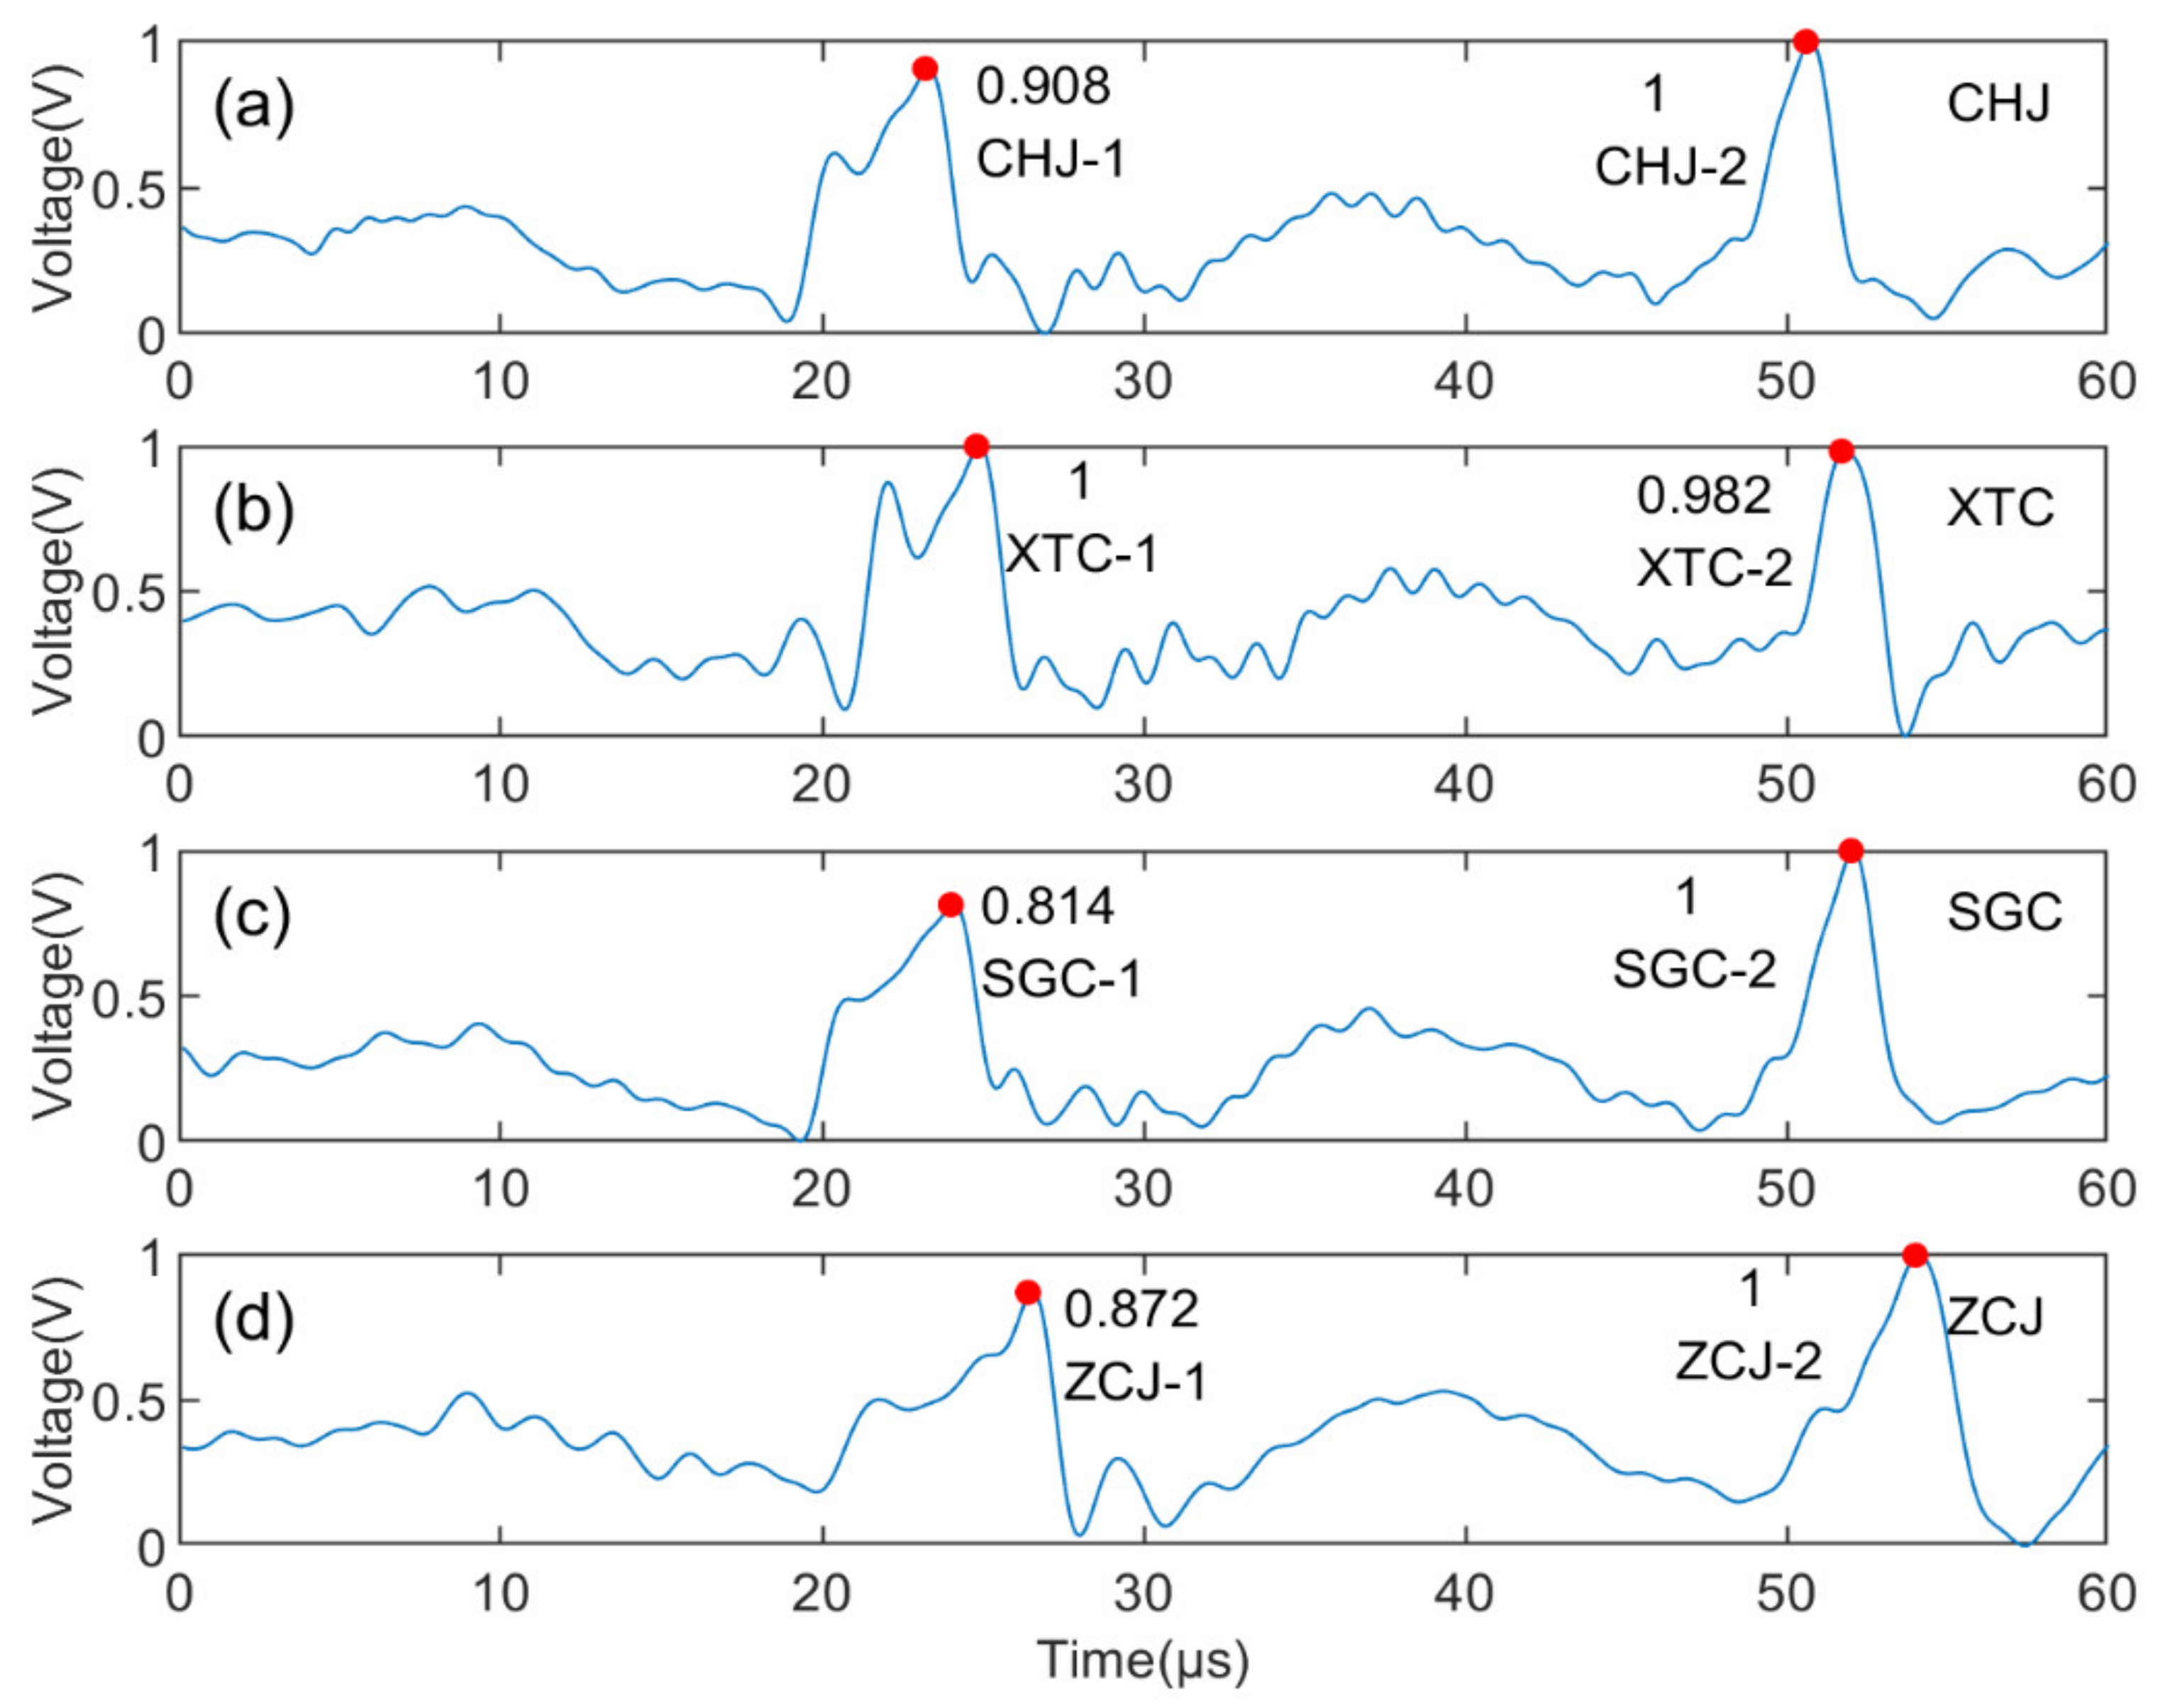
Taking two continuous pulse signals recorded synchronously by four stations as an example (Figure 5), we compared the matching ability of the encoding feature matching method, pulse-peak feature (peak amplitude and time) matching method, and the pulse-multiple features (rising edge, falling edge, energy, peak, half width, duration, 10–90% rising edge, 10–90% falling edge, 30–70% rising edge, and 30–70% falling edge) matching method. The pulse-multiple feature matching method calculates the correlation coefficients of multiple features between different pulses, on the premise of meeting the time limit of signal propagation between stations, and finds the pulses with the highest correlation coefficients as the matching pulses. The matching method based on pulse-peak features finds the best match on the amplitude sequence and time sequence, by considering the similarity of pulse amplitudes on the basis of the time limit.
For the pulse-peak feature matching method, due to the different propagation paths of the lightning signal received by each substation, the pulse amplitudes of different stations are different, resulting in an incorrect match between XTC-1 and CHJ-2. The pulse multiple features matching method uses the correlation coefficients between the pulse multiple features of the CHJ station and the other three stations to match. Only those pulses whose correlation coefficient of feature is greater than the set threshold are regarded as matching pulses. When the pulses of other stations are matched with those of the master station (CHJ), the greater the difference between the correlation coefficients of the correctly matched pulses and the wrongly matched pulses, the better the matching ability, indicating that different pulses can be clearly distinguished. As shown in Table 3, there is no significant difference in the correlation coefficients of multiple features for different pulses, and sometimes the correlation coefficients of mismatched pulses are higher. For example, the correlation coefficients between the XTC-1 and CHJ-1 pulses and between the XTC-1 and CHJ-2 pulses are 0.999999 and 0.999995, respectively. The matching is correct, but the difference of the correlation coefficient between correct matching and wrong matching is only 0.000004 (0.999999 − 0.999995 = 0.000004). The correlation coefficients between the ZCJ-2 and CHJ-1 pulses and between the ZCJ-2 and CHJ-2 pulses are 0.999950 and 0.999898, respectively. The higher correlation coefficients between ZCJ-2 and CHJ-1 leads to incorrect matching.
For the encoding feature matching method, the correlation coefficients between the encoding features of the CHJ station and the other three stations were calculated. As shown in Table 4, there was no matching error, and the difference in correlation coefficients between different discharge signals was considerable. For example, the correlation coefficients between the XTC-1 and CHJ-1 pulses and between the XTC-1 and CHJ-2 pulses were 0.95147 and 0.78790, respectively, and the difference between the correlation coefficients was 0.16357, which was much larger than that based on pulse multiple features with a value of 0.000004.
It can be seen from the above examples that when the traditional pulse-peak feature and pulse multiple features are used for matching, the difference of correlation coefficients between the correctly matched pulse and the incorrectly matched pulse is small, even when an incorrect matching occurs. However, when encoding features are used, the correlation coefficients are significantly different, and the pulses can be matched correctly. Since pulse matching is the key of lightning fine location, the location based on encoding features can further improve the fine location ability of LFEDA.

3. Results

3.1. Positioning Results

Figure 6A shows the new algorithm positioning result of a typical cloud-to-ground lightning flashes that occurred at 16:25 on 15 August 2015. In order to compare with the results of Chen et al. [46], some regions in Figure 6A are enlarged in Figure 6B; these enlarged regions were the same as those in Chen et al. [46] (east–west direction, −10–15 km; North–South, −15–0 km; same as Figures 7A(d), 8A(d), 9A(d), 11A(d), 12A(d), and 13A(d). This lightning was detected by 8 LFEDA substations, and the goodness of fit threshold value was set to 5. A total of 2719 positioning points were obtained. As shown in Figure 6A(b), the discharge in the cloud was mainly the distributed heights of approximately 5 km and 10 km, corresponding to the upper main positive charge area and the middle main negative charge area, respectively. The lightning started from a height of 6–7 km and developed upwards. After entering the upper positive charge region for a period of time, it began to develop bidirectionally in the positive and negative charge regions. After 25.7 s, multiple K processes occurred between the positively and negatively charged areas, and the return stroke was formed. The overall position and development pattern were consistent with the results of historical research [40,44,46], but the details are more abundant.
Based on the positioning results of the same lightning process, the TOA method based on the pulse-peak feature matching (similar to Shi et al. [40]), the time of arrival–time reversal (TOA–TR) method (Chen et al. [46]), the empirical mode decomposition-time of arrival (EMD–TOA, Fan et al. [44]) method and the new algorithm were compared.
Figure 7 shows the positioning results of the TOA method based on pulse-peak feature matching. Compared to the new algorithm of 2719 location points, only 498 location points were obtained by this method. The part near the ground of the return stroke in Figure 7A(a) at 26.5 s failed to be effectively located. As compared to the planar distribution of the partial development in the same area of Figure 6B(d) and Figure 7B(d), this method could not give continuous and clear channels.
The TOA–TR method locates 1659 discharge events for the same lightning process, which is shown in Figure 8 (Refer to Figure 6 of Chen et al. [46], the graph is redrawn based on the data from https://zenodo.org/record/2644811#.YEB-PU7isdV (accessed on 4 March 2021)). Although every part of the whole process was located, there were fewer location points than in the new algorithm, and the details and precision were not as good as those of the new algorithm. The improvement of refinement was mainly manifested in the more obvious and continuous small channels of lightning. Comparing the same partial development in Figure 6B(d) with that in Figure 8B(d), the new method was far beyond that of the TOA–TR method, with 639 points and 248 points, respectively. The new method gave more channel details, especially in the lower left corner, where more bifurcated channels were located. In addition, the new algorithm had a faster calculation speed. The calculation time of the TOA–TR method for this case was more than 0.5 h, while that of the new algorithm was less than 2 min.
The EMD–TOA method locates 2296 discharge events for the same lightning process, which is shown in Figure 9 (Refer to Figure 12 of Fan et al. [44], the graph is redrawn based on the data from https://zenodo.org/record/1133810#.YEoEHbDisdV (accessed on 4 March 2021)). This method uses EMD technology to filter the original waveform and combines with it waveform cross-correlation matching to improve the positioning precision. However, the locations of some lightning channels were not continuous. For example, the part indicated by the arrow in Figure 6A(e) was not continuous in the positioning result of the EMD–TOA method (Figure 9A(e)). This may be due to EMD filtering, which filters out some useful bands of the waveforms. In addition, as a complex waveform processing method, EMD processing also greatly reduces the calculation efficiency, resulting in a location time of greater than 0.5 h, for the same lightning.

3.2. Performance Evaluation of New Algorithm

The performance of the new algorithm was evaluated by artificially triggered lightning. In this assessment, the position of the lightning rod was taken as the real position of the return stroke, and the number of return strokes calculated by the direct measurement of the current waveform was regarded as the number of real discharge events. Under the conditions of existing observation capability, the evaluation of location results based on artificially triggered lightning is a relatively objective evaluation method, which has been widely used [56,57]. The three-dimensional location of return stroke is located in the channel of return stroke, and its height is generally between tens of meters and hundreds of meters. When evaluating the plane error, the position of the lightning rod was taken as the grounding point of return stroke. Considering the small inclination angle of lightning return stroke channel (as shown in Figure 3B), the projection of three-dimensional return stroke position on the horizontal plane showed a small deviation from the position of lightning rod, so the evaluation of plane positioning error was credible.
Table 5 lists the information of 20 artificially triggered lightning flashes that generated 121 return strokes in 2015 and 2017. The maximum and minimum currents of return strokes were approximately 46 kA and 3.5 kA, respectively. Figure 10 shows the positioning results of the new algorithm for the return strokes of artificial triggered lightning flashes, and 120 return strokes were located by the new algorithm. The positioning efficiency of return stroke was 99.17% (120/121). The average value of plane positioning error was 100 m. The average errors in the east–west and north–south directions were 51 m and 73 m, respectively, and the corresponding standard deviations were 62 m and 77 m, respectively. As long as one of the return strokes was successfully located in a lightning flash, the lightning flash was considered to be located. Based on this, the detection efficiency of the lightning flash was 100%.
For the same cases of triggered lightning in 2017, Chen et al. [46] obtained 100% positioning efficiency of lightning flashes and 95.6% location efficiency of return strokes, using the TOA–TR method. The average plane error of return strokes was 153 m, and the standard deviations in the east–west and north–south directions were 88 m and 95 m, respectively.
For the same cases of triggered lightning in 2015, all 13 lightning flashes and 69 of 76 return strokes were successfully located, using the TOA method, based on pulse-peak feature matching (Shi et al. [40]). The positioning efficiency of the lightning flashes and the return strokes were 100% and 90.78%, respectively. The average plane error of return strokes was 102 m, and the average error in the east–west and north–south directions were 40 m and 84 m, respectively.
Compared to the results of the TOA–TR method (Chen et al. [46]) and the TOA method based on pulse-peak feature matching (Shi et al. [40]), the location efficiency of the return strokes of the new algorithm was significantly improved. Further analysis showed that the new algorithm could match and locate most return strokes due to its improved matching ability, but the two algorithms in Chen et al. [46] and Shi et al. [40] failed to match the partial saturation return strokes. In terms of positioning accuracy, compared to the results of the TOA–TR method (Chen et al. [46]), the plane positioning error and the standard deviations in the north–south and east–west directions of the new algorithm were significantly reduced.

4. Analysis and Discussion

4.1. Matching Efficiency of the New Algorithm

This section compares the matching efficiency of the new algorithm, the TOA method based on pulse-peak feature matching (similar to Shi et al. [40]) and the TOA–TR method (Chen et al. [46]). The latter two methods were introduced in the introduction. The number of screened positioning points was regarded as the effective number of matches, and the number of effective matches was divided by the matched pulse number obtained in the matching process as the matching efficiency.
Table 6 shows the matching efficiency of the three algorithms for the same lightning. The efficiency of the TOA method based on pulse-peak feature matching was only 3.45%, and the number of effective positioning points was 498. The matching efficiency of the TOA–TR method was improved to 20.48%, and the number of positioning points reached 1659. The new method further improved the matching efficiency to 51.54%, which was twice that of the TOA–TR method, and the number of positioning points was increased to 2719. The new algorithm used encoding features to obtain a more accurate description of lightning discharge pulses, thus, reducing the possibility of similar pulse mismatches (confirmed in Section 2.6) and significantly improving the positioning efficiency.

4.2. Positioning Capability under Low SNR Signal

To test the positioning ability under low SNR conditions (such as interference conditions and long-distance weak lightning signals), we add Gaussian white noise to the original lightning signals to reduce the SNR to 5 dB, and compare the positioning results of the new algorithm, the TOA method based on pulse-peak feature matching and the TOA–TR method. The goodness of fit threshold was set to 5.
Figure 11 shows the positioning results of the new algorithm. A total of 1884 discharge events were located. The channel development was relatively continuous, and the discharge in the cloud was distributed at heights 5 km and 10 km. The overall channel structure was basically similar to that obtained by using the original waveform in Figure 6. As shown in the partial development of Figure 11B(d), compared to the positioning result from the original signal in Figure 6B(d), although the positioning ability of the small branch channel was somewhat reduced, the structure of the small branch channel could still be distinguished.
The result of the TOA method based on pulse-peak feature matching is shown in Figure 12. A total of 415 positioning points was obtained. Compared to the positioning result of the new algorithm (Figure 11), although the overall contour of radiation sources was similar, the continuity of the channel and the integrity of the entire positioning process were low. Compared the partial development in Figure 11B(d) with those in Figure 12B(d), it was obvious that the result was less fine and that the small branch channels were not clear.
As shown in Figure 13, for the same lightning data with the same 5 dB SNR, the TOA–TR method located 1014 discharge events (Refer to Figure 11 of Chen et al. [46], the graph is redrawn based on the data from https://zenodo.org/record/2644811#.YEB-PU7isdV (accessed on 4 March 2021)), 870 fewer than the new algorithm. The continuity of the middle and upper channels (y: 25–40 km) in the plane distribution of Figure 13A(d) was lower than that in Figure 11A(d). Compared to the partial development of Figure 11B and Figure 13B, the number of points localized by the new algorithm was more than three times the number localized by the TOA–TR method (424 and 132, respectively).

5. Conclusions

In this paper, a fast and fine positioning method for low-frequency total lightning is proposed. Artificial intelligence technology was introduced into the matching technology of LFEDA for the first time, and exciting results were achieved. In this method, the encoding features of lightning pulses were obtained by deep learning, and then 3D fine positioning was carried out after pulse matching according to the encoding features. This method had the characteristics of high matching efficiency, fine positioning, and strong anti-interference ability. The main conclusions are as follows.
  • A low-frequency total lightning TOA method based on deep-learning encoding feature matching is proposed. This method uses deep-learning convolutional autoencoders to accurately extract the characteristics of lightning discharge pulses. Compared to the pulse-peak feature matching and waveform cross-correlation matching methods (TOA-TR method), the matching efficiency is greatly improved, by up to 50%, which improves the efficiency of positioning calculation and the ability of real-time positioning.
  • The new algorithm has better fine 3D channel positioning capabilities. Compared to the TOA method based on the pulse-peak feature matching, the TOA–TR algorithm, and the EMD–TOA algorithm, the new algorithm had the most abundant location points and more continuous location channels. Moreover, the EMD–TOA algorithm requires complex waveform processing, and the TOA–TR method requires multiple spatial optimizations, both of which require considerable computing time (the positioning time of the above two methods for the same lightning was more than 0.5 h), resulting in a significant reduction in location efficiency (speed). The new algorithm produces results in less than 2 min.
  • The new algorithm has good anti-interference ability. Under the condition of a low SNR, high-quality positioning effects can be obtained, which is beneficial to the positioning of weak lightning and long-distance lightning. For the lightning example of the same 5 dB SNR signal, the TOA method based on pulse-peak feature matching and the TOA–TR method have significantly fewer positioning points.
  • The test results based on artificially triggered lightning showed that the new algorithm has a high positioning accuracy and positioning efficiency. The average location accuracy of the new algorithm is 100 m, and the location efficiency of the return strokes is 99.17%. While the location accuracy and location efficiency of the TOA–TR method are 150 m and 95.6%, respectively. The corresponding values of the TOA method based on pulse-peak feature matching is 102 m and 90.78%, respectively.
The above-mentioned characteristics of the new algorithm are particularly suitable for applications in real-time positioning systems for low-frequency lightning signals. The new algorithm can be deployed in the acquisition and processing software of each substation to obtain the pulse encoding features (with a small amount of data relative to the waveform data), and then transmit them to the central station through the network to realize real-time 3D fine positioning of total lightning to improve the current situation, in which the refined positioning of postprocessing used in scientific research is difficult to apply in non-academic contexts. In the next step, we will further optimize the method, improve the fine positioning speed, and achieve a low-frequency total lightning real-time mapping array similar to the lightning mapping array.

Author Contributions

Conceptualization, Y.Z. (Yang Zhang); methodology, J.W., Y.Z. (Yang Zhang) and Y.T.; software, J.W.; validation, Z.C., D.Z. and Y.Z. (Yijun Zhang); investigation, Z.C.; data curation, Y.F.; writing—original draft preparation, J.W.; writing—review and editing, Y.Z. (Yang Zhang); funding acquisition, Y.Z. (Yang Zhang). All authors have read and agreed to the published version of the manuscript.

Funding

This research was funded by the National Key Research and Development Program of China (2017YFC1501501), the National Natural Science Foundation of China (41775009, 41775007, and 41905004).

Institutional Review Board Statement

Not applicable.

Informed Consent Statement

Not applicable.

Data Availability Statement

All lightning data from low-frequency electric-field detection array (LFEDA) were collected by State Key Laboratory of Severe Weather, Chinese Academy of Meteorological Sciences, and the data used in this paper can be obtained from the website (https://0-doi-org.brum.beds.ac.uk/10.5281/zenodo.4890249).

Acknowledgments

We are thankful to all members of the lightning group of the State Key Laboratory of Severe Weather, as well as Shaodong Chen, Xu Yan, Sai Du, and Fanchao Lyu for the assistance in experimental maintenance.

Conflicts of Interest

The authors declare no conflict of interest.

References

  1. Qie, X.; Zhang, Y. A review of atmospheric electricity research in China from 2011 to 2018. Adv. Atmos. Sci. 2019, 36, 994–1014. [Google Scholar] [CrossRef]
  2. De Miranda, F.J.; Pinto, O.; Saba, M.M.F. A study of the time interval between return strokes and k-changes of negative cloud-to-ground lightning flashes in Brazil. J. Atmos. Sol. Terr. Phys. 2003, 65, 293–297. [Google Scholar] [CrossRef]
  3. Zhang, Y.; Zhang, Y.; Xie, M.; Zheng, D.; Lu, W.; Chen, S.; Yan, X. Characteristics and correlation of return stroke, m component and continuing current for triggered lightning. Electr. Power Syst. Res. 2016, 139, 10–15. [Google Scholar] [CrossRef]
  4. Saraiva, A.C.V.; Saba, M.M.F.; Pinto, O.; Cummins, K.L.; Krider, E.P.; Campos, L.Z.S. A comparative study of negative cloud-to-ground lightning characteristics in São Paulo (Brazil) and Arizona (United States) based on high-speed video observations. J. Geophys. Res. 2010, 115. [Google Scholar] [CrossRef] [Green Version]
  5. Wu, B.; Zhang, G.; Wen, J.; Zhang, T.; Li, Y.; Wang, Y. Correlation analysis between initial preliminary breakdown process, the characteristic of radiation pulse, and the charge structure on the Qinghai-Tibetan plateau. J. Geophys. Res. Atmos. 2016, 121, 12434–12459. [Google Scholar] [CrossRef]
  6. Shi, D.; Wang, D.; Wu, T.; Takagi, N. Temporal and spatial characteristics of preliminary breakdown pulses in intracloud lightning flashes. J. Geophys. Res. Atmos. 2019, 124, 12901–12914. [Google Scholar] [CrossRef]
  7. Harley, J.; Zimmerman, L.A.; Edens, H.E.; Stenbaek-Nielsen, H.C.; Haaland, R.K.; Sonnenfeld, R.G.; McHarg, M.G. High-speed spectra of a bolt from the blue lightning stepped leader. J. Geophys. Res. Atmos. 2021, 126. [Google Scholar] [CrossRef]
  8. Kotovsky, D.A.; Uman, M.A.; Wilkes, R.A.; Jordan, D.M. High-speed video and lightning mapping array observations of in-cloud lightning leaders and an m component to ground. J. Geophys. Res. Atmos. 2019, 124, 1496–1513. [Google Scholar] [CrossRef]
  9. Visacro, S.; Araujo, L.; Guimarães, M.; Vale, M.H.M. M-component currents of first return strokes in natural negative cloud-to-ground lightning. J. Geophys. Res. Atmos. 2013, 118, 12132–12138. [Google Scholar] [CrossRef]
  10. Rakov, V.A.; Crawford, D.E.; Rambo, K.J.; Schnetzer, G.H.; Uman, M.A.; Thottappillil, R. M-component mode of charge transfer to ground in lightning discharges. J. Geophys. Res. Atmos. 2001, 106, 22817–22831. [Google Scholar] [CrossRef]
  11. Thottappillil, R.; Rakov, V.A.; Uman, M.A. K and M changes in close lightning ground flashes in Florida. J. Geophys. Res. Atmos. 1990, 95, 18631–18640. [Google Scholar] [CrossRef]
  12. Thomas, R.J. Accuracy of the lightning mapping array. J. Geophys. Res. 2004, 109. [Google Scholar] [CrossRef] [Green Version]
  13. Zhang, Y.; Zhang, Y.J.; Zheng, D.; Lu, W.T. Characteristics and discharge processes of m events with large current in triggered lightning. Radio Sci. 2018, 53, 974–985. [Google Scholar] [CrossRef]
  14. Lyu, F.; Cummer, S.A.; Chen, M.; Qin, Z.; Lyu, W.; Sun, J. Three-dimensional mapping of two coincident flashes—An upward positive flash triggered by the in-cloud activity of a downward negative flash. Atmos. Res. 2021, 250, 105408. [Google Scholar] [CrossRef]
  15. Boccippio, D.J.; Heckman, S.; Goodman, S.J. A diagnostic analysis of the Kennedy space center LDAR network: 2. Cross-sensor studies. J. Geophys. Res. Atmos. 2001, 106, 4787–4796. [Google Scholar] [CrossRef] [Green Version]
  16. Pu, Y.; Cummer, S.A. Needles and lightning leader dynamics imaged with 100–200 MHz broadband vhf interferometry. Geophys. Res. Lett. 2019, 46, 13556–13563. [Google Scholar] [CrossRef]
  17. Fuchs, B.R.; Bruning, E.C.; Rutledge, S.A.; Carey, L.D.; Krehbiel, P.R.; Rison, W. Climatological analyses of LMA data with an open-source lightning flash-clustering algorithm. J. Geophys. Res. Atmos. 2016, 121, 8625–8648. [Google Scholar] [CrossRef]
  18. Takayanagi, Y.; Akita, M.; Nakamura, Y.; Yoshida, S.; Morimoto, T.; Ushio, T.; Kawasaki, Z.-I.; Yamamoto, K. Development of VLF/LF bands interferometer and its initial observations. Electr. Eng. Jpn. 2013, 185, 9–17. [Google Scholar] [CrossRef]
  19. Betz, H.D.; Marshall, T.C.; Stolzenburg, M.; Schmidt, K.; Oettinger, W.P.; Defer, E.; Konarski, J.; Laroche, P.; Dombai, F. Detection of in-cloud lightning with VLF/LF and VHF networks for studies of the initial discharge phase. Geophys. Res. Lett. 2008, 35. [Google Scholar] [CrossRef]
  20. Cummins, K.L.; Murphy, M.J.; Bardo, E.A.; Hiscox, W.L.; Pyle, R.B.; Pifer, A.E. A combined TOA/MDF technology upgrade of the U.S. National lightning detection network. J. Geophys. Res. Atmos. 1998, 103, 9035–9044. [Google Scholar] [CrossRef]
  21. Smith, D.A. The los alamos sferic array: A research tool for lightning investigations. J. Geophys. Res. 2002, 107. [Google Scholar] [CrossRef] [Green Version]
  22. Chen, L.; Zhang, Y.; Lu, W.; Zheng, D.; Zhang, Y.; Chen, S.; Huang, Z. Performance evaluation for a lightning location system based on observations of artificially triggered lightning and natural lightning flashes. J. Atmos. Ocean. Technol. 2012, 29, 1835–1844. [Google Scholar] [CrossRef]
  23. Naccarato, K.P.; Pinto, O. Improvements in the detection efficiency model for the Brazilian lightning detection network (BrasilDAT). Atmos. Res. 2009, 91, 546–563. [Google Scholar] [CrossRef]
  24. Burrows, W.R.; King, P.; Lewis, P.J.; Kochtubajda, B.; Snyder, B.; Turcotte, V. Lightning occurrence patterns over Canada and adjacent United States from lightning detection network observations. Atmos. Ocean 2002, 40, 59–80. [Google Scholar] [CrossRef]
  25. Betz, H.D.; Schmidt, K.; Laroche, P.; Blanchet, P.; Oettinger, W.P.; Defer, E.; Dziewit, Z.; Konarski, J. LINET—an international lightning detection network in Europe. Atmos. Res. 2009, 91, 564–573. [Google Scholar] [CrossRef]
  26. Cai, L.; Zou, X.; Wang, J.; Li, Q.; Zhou, M.; Fan, Y. The Foshan total lightning location system in china and its initial operation results. Atmosphere 2019, 10, 149. [Google Scholar] [CrossRef] [Green Version]
  27. Cummins, K.L.; Murphy, M.J. An overview of lightning locating systems: History, techniques, and data uses, with an in-depth look at the U.S. NLDN. IEEE Trans. Electromagn. Compat. 2009, 51, 499–518. [Google Scholar] [CrossRef]
  28. Ma, Z.; Jiang, R.; Qie, X.; Xing, H.; Liu, M.; Sun, Z.; Qin, Z.; Zhang, H.; Li, X. A low frequency 3D lightning mapping network in north China. Atmos. Res. 2021, 249, 105314. [Google Scholar] [CrossRef]
  29. Wu, T.; Wang, D.; Takagi, N. Locating preliminary breakdown pulses in positive cloud-to-ground lightning. J. Geophys. Res. Atmos. 2018, 123, 7989–7998. [Google Scholar] [CrossRef]
  30. Karunarathne, S.; Marshall, T.C.; Stolzenburg, M.; Karunarathna, N.; Vickers, L.E.; Warner, T.A.; Orville, R.E. Locating initial breakdown pulses using electric field change network. J. Geophys. Res. Atmos. 2013, 118, 7129–7141. [Google Scholar] [CrossRef]
  31. Zheng, D.; Shi, D.; Zhang, Y.; Zhang, Y.; Lyu, W.; Meng, Q. Initial leader properties during the preliminary breakdown processes of lightning flashes and their associations with initiation positions. J. Geophys. Res. Atmos. 2019, 124, 8025–8042. [Google Scholar] [CrossRef]
  32. Zheng, D.; MacGorman, D.R. Characteristics of flash initiations in a supercell cluster with tornadoes. Atmos. Res. 2016, 167, 249–264. [Google Scholar] [CrossRef] [Green Version]
  33. Yoshida, S.; Wu, T.; Ushio, T.; Takayanagi, Y. Lightning observation in 3D using a multiple LF sensor network and comparison with radar reflectivity. Electr. Eng. Jpn. 2016, 194, 1–10. [Google Scholar] [CrossRef]
  34. Bitzer, P.M.; Christian, H.J.; Stewart, M.; Burchfield, J.; Podgorny, S.; Corredor, D.; Hall, J.; Kuznetsov, E.; Franklin, V. Characterization and applications of VLF/LF source locations from lightning using the Huntsville Alabama Marx Meter Array. J. Geophys. Res. Atmos. 2013, 118, 3120–3138. [Google Scholar] [CrossRef]
  35. Alammari, A.; Alkahtani, A.A.; Ahmad, M.R.; Noman, F.M.; Esa, M.R.M.; Kawasaki, Z.; Tiong, S.K. Lightning mapping: Techniques, challenges, and opportunities. IEEE Access 2020, 8, 190064–190082. [Google Scholar] [CrossRef]
  36. Honma, N.; Suzuki, F.; Miyake, Y.; Ishii, M.; Hidayat, S. Propagation effect on field waveforms in relation to time-of-arrival technique in lightning location. J. Geophys. Res. Atmos. 1998, 103, 14141–14145. [Google Scholar] [CrossRef]
  37. Wang, Y.; Qie, X.; Wang, D.; Liu, M.; Su, D.; Wang, Z.; Liu, D.; Wu, Z.; Sun, Z.; Tian, Y. Beijing lightning network (BLNET) and the observation on preliminary breakdown processes. Atmos. Res. 2016, 171, 121–132. [Google Scholar] [CrossRef]
  38. Shao, X.-M.; Stanley, M.; Regan, A.; Harlin, J.; Pongratz, M.; Stock, M. Total lightning observations with the new and improved Los Alamos Sferic Array (LASA). J. Atmos. Ocean. Technol. 2006, 23, 1273–1288. [Google Scholar] [CrossRef]
  39. Yoshida, S.; Wu, T.; Ushio, T.; Kusunoki, K.; Nakamura, Y. Initial results of LF sensor network for lightning observation and characteristics of lightning emission in LF band. J. Geophys. Res. Atmos. 2014, 119, 12034–12051. [Google Scholar] [CrossRef]
  40. Shi, D.; Zheng, D.; Zhang, Y.; Zhang, Y.; Huang, Z.; Lu, W.; Chen, S.; Yan, X. Low-frequency E-field detection array (LFEDA)—construction and preliminary results. Sci. China Earth Sci. 2017, 60, 1896–1908. [Google Scholar] [CrossRef]
  41. Lyu, F.; Cummer, S.A.; Solanki, R.; Weinert, J.; McTague, L.; Katko, A.; Barrett, J.; Zigoneanu, L.; Xie, Y.; Wang, W. A low-frequency near-field interferometric-toa 3D lightning mapping array. Geophys. Res. Lett. 2014, 41, 7777–7784. [Google Scholar] [CrossRef]
  42. Wu, T.; Wang, D.; Takagi, N. Lightning mapping with an array of fast antennas. Geophys. Res. Lett. 2018, 45, 3698–3705. [Google Scholar] [CrossRef]
  43. Zhu, Y.; Bitzer, P.; Stewart, M.; Podgorny, S.; Corredor, D.; Burchfield, J.; Carey, L.; Medina, B.; Stock, M. Huntsville Alabama Marx Meter Array 2: Upgrade and Capability. Earth Space Sci. 2020, 7. [Google Scholar] [CrossRef] [Green Version]
  44. Fan, X.P.; Zhang, Y.J.; Zheng, D.; Zhang, Y.; Lyu, W.T.; Liu, H.Y.; Xu, L.T. A new method of three-dimensional location for low-frequency electric field detection array. J. Geophys. Res. Atmos. 2018, 123, 8792–8812. [Google Scholar] [CrossRef]
  45. Liu, B.; Shi, L.H.; Qiu, S.; Liu, H.Y.; Sun, Z.; Guo, Y.F. Three-dimensional lightning positioning in low-frequency band using time reversal in frequency domain. IEEE Trans. Electromagn. Compat. 2020, 62, 774–784. [Google Scholar] [CrossRef]
  46. Chen, Z.; Zhang, Y.; Zheng, D.; Zhang, Y.; Fan, X.; Fan, Y.; Xu, L.; Lyu, W. A method of three-dimensional location for LFEDA combining the time of arrival method and the time reversal technique. J. Geophys. Res. Atmos. 2019, 124, 6484–6500. [Google Scholar] [CrossRef]
  47. Qin, Z.; Chen, M.; Lyu, F.; Cummer, S.A.; Zhu, B.; Liu, F.; Du, Y. A GPU-based grid traverse algorithm for accelerating lightning geolocation process. IEEE Trans. Electromagn. Compat. 2020, 62, 489–497. [Google Scholar] [CrossRef]
  48. Zhu, Y.; Bitzer, P.; Rakov, V.; Ding, Z. A machine-learning approach to classify cloud-to-ground and intracloud lightning. Geophys. Res. Lett. 2021, 48. [Google Scholar] [CrossRef]
  49. Wang, J.; Huang, Q.; Ma, Q.; Chang, S.; He, J.; Wang, H.; Zhou, X.; Xiao, F.; Gao, C. Classification of VLF/LF lightning signals using sensors and deep learning methods. Sensors 2020, 20, 1030. [Google Scholar] [CrossRef] [Green Version]
  50. Zhou, K.; Zheng, Y.; Dong, W.; Wang, T. A deep learning network for cloud-to-ground lightning nowcasting with multisource data. J. Atmos. Ocean. Technol. 2020, 37, 927–942. [Google Scholar] [CrossRef]
  51. Hinton, G.E.; Salakhutdinov, R.R. Reducing the dimensionality of data with neural networks. Science 2006, 313, 504–507. [Google Scholar] [CrossRef] [Green Version]
  52. Schmidhuber, J. Deep learning in neural networks: An overview. Neural Netw. 2015, 61, 85–117. [Google Scholar] [CrossRef] [Green Version]
  53. Krizhevsky, A.; Sutskever, I.; Hinton, G.E. Imagenet classification with deep convolutional neural networks. Commun. ACM 2017, 60, 84–90. [Google Scholar] [CrossRef]
  54. Du, B.; Xiong, W.; Wu, J.; Zhang, L.; Zhang, L.; Tao, D. Stacked convolutional denoising auto-encoders for feature representation. IEEE Trans. Cybern. 2017, 47, 1017–1027. [Google Scholar] [CrossRef] [PubMed]
  55. Chen, Z.; Zhang, Y.; Fan, Y.; Wang, J.; Zheng, D.; Fan, X.; Xu, L.; Lyu, W.; Zhang, Y. Evolution characteristics during initial stage of triggered lightning based on directly measured current. Atmosphere 2020, 11, 658. [Google Scholar] [CrossRef]
  56. Zhu, Y.; Rakov, V.A.; Tran, M.D.; Stock, M.G.; Heckman, S.; Liu, C.; Sloop, C.D.; Jordan, D.M.; Uman, M.A.; Caicedo, J.A.; et al. Evaluation of ENTLN performance characteristics based on the ground truth natural and rocket-triggered lightning data acquired in Florida. J. Geophys. Res. Atmos. 2017, 122, 9858–9866. [Google Scholar] [CrossRef]
  57. Nag, A.; Mallick, S.; Rakov, V.A.; Howard, J.S.; Biagi, C.J.; Hill, J.D.; Uman, M.A.; Jordan, D.M.; Rambo, K.J.; Jerauld, J.E.; et al. Evaluation of U.S. National lightning detection network performance characteristics using rocket-triggered lightning data acquired in 2004–2009. J. Geophys. Res. 2011, 116. [Google Scholar] [CrossRef] [Green Version]
Figure 1. (A) The site of LFEDA in the map of China. The red diamond represents the location of LFEDA. (B) Geographical layout of low-frequency electric field detection array substations in the Guangzhou area. Stations are represented by triangles, and experiments with artificially triggered lightning are conducted at the position marked by the circle. The SLC station was relocated to the ZTC station in 2017.
Remotesensing 13 02212 g001
Figure 2. Pictures of a Low-frequency E-field Detection Array substation (Digitizer, Fast antenna, and GPS antenna).
Remotesensing 13 02212 g002
Figure 3. (A) Layout of the triggered lightning test site. ➀ Control room; ➁ region for measurement of electromagnetic signals, ➂ artificially triggered lightning device, including six rocket launcher, lightning rods, and lightning current measurement equipment in the cabin. (B) A photo of a triggered lightning.
Remotesensing 13 02212 g003
Figure 4. Schematic of the new algorithm.
Remotesensing 13 02212 g004
Figure 5. The synchronous electric field waveforms of CHJ (a), XTC (b), SGC (c) and ZCJ (d) observed by LFEDA at 16:26:00 on 15 August 2015 (Beijing time) The red dot represents the position of the identified pulse peak, and the number represents the specific value of the pulse peak. The two large pulse signals of each station are represented by station name-1 and station name-2.
Remotesensing 13 02212 g005
Figure 6. (A) Positioning results of a lightning process at 16:26 on 15 August 2015 by the new algorithm and (B) the partial development. In each subgraph, (a) height–time plots; (b) north–south vertical projection; (c) height distribution of radiation events; (d) plan view; and (e) east–west vertical projection of lightning radiation sources.
Remotesensing 13 02212 g006
Figure 7. (A) Positioning results of a lightning process at 16:26 on 15 August 2015 by the TOA method based on pulse-peak feature matching and (B) the partial development. In each subgraph, (a) height–time plots; (b) north–south vertical projection; (c) height distribution of radiation events; (d) plan view; and (e) east–west vertical projection of lightning radiation sources.
Remotesensing 13 02212 g007
Figure 8. (A) Positioning results of a lightning process at 16:26 on 15 August 2015 by the TOA–TR method and (B) the partial development. In each subgraph, (a) height–time plots; (b) north–south vertical projection; (c) height distribution of radiation events; (d) plan view; and (e) east–west vertical projection of lightning radiation sources. Refer to Figure 6 of Chen et al. [46], the graph is redrawn based on the data from https://zenodo.org/record/2644811#.YEB-PU7isdV (accessed on 4 March 2021).
Remotesensing 13 02212 g008
Figure 9. (A) Positioning results of a lightning process at 16:26 on 15 August 2015 by the EMD–TOA method and (B) the partial development. In each subgraph, (a) height–time plots; (b) north–south vertical projection; (c) height distribution of radiation events; (d) plan view; and (e) east–west vertical projection of lightning radiation sources. Refer to Figure 12 of Fan et al. [44], the graph is redrawn based on the data from https://zenodo.org/record/1133810#.YEB-6E7isdV (accessed on 4 March 2021).
Remotesensing 13 02212 g009
Figure 10. The positioning results of the new algorithm on the artificial trigger lightning return strokes detected by LFEDA in 2015 and 2017. The red triangle represents the actual position of the artificial trigger lightning device, and the black dots represent the points located by the new algorithm.
Remotesensing 13 02212 g010
Figure 11. (A) The positioning results of the lightning process at 16:26 on 15 August 2015 under 5 dB SNR signals by the new method and (B) the partial developments. In each subgraph, (a) height–time plots; (b) north–south vertical projection; (c) height distribution of radiation events; (d) plan view; and (e) east–west vertical projection of lightning radiation sources.
Remotesensing 13 02212 g011
Figure 12. (A) The positioning results of the lightning process at 16:26 on 15 August 2015 under 5 dB SNR signals by the TOA method based on pulse-peak feature matching and (B) the partial developments. In each subgraph, (a) height–time plots; (b) north–south vertical projection; (c) height distribution of radiation events; (d) plan view; and (e) east–west vertical projection of lightning radiation sources.
Remotesensing 13 02212 g012
Figure 13. (A) The positioning results of the lightning process at 16:26 on 15 August 2015 under 5 dB SNR signals by the TOA–TR method and (B) the partial developments. In each subgraph, (a) height–time plots; (b) north–south vertical projection; (c) height distribution of radiation events; (d) plan view; and (e) east–west vertical projection of lightning radiation sources. Refer to Figure 11 of Chen et al. [46], the graph is redrawn based on the data from https://zenodo.org/record/2644811#.YEB-PU7isdV (accessed on 4 March 2021).
Remotesensing 13 02212 g013
Table 1. The correlation coefficients between the original waveform and the waveform decoded by different lengths of the encoding feature.
The Length of Encoding FeatureThe Length of the Input Pulse WaveformCorrelation Coefficients
825.6 μs0.745
1625.6 μs0.935
3225.6 μs0.992
6425.6 μs0.998
Table 2. The correlation coefficients between the original waveform and the waveform decoded by different lengths of the pulse waveform.
The Length of Encoding FeatureThe Length of the Input Pulse WaveformCorrelation Coefficients
3225.6 μs0.992
3212.8 μs0.985
326.4 μs0.978
Table 3. Correlation coefficients and matching results between the pulse multiple features of the CHJ station and the other three stations.
CHJ-1CHJ-2Matching Result
XTC-10.9999990.999995XTC-1, CHJ-1
XTC-20.9999850.999999XTC-2, CHJ-2
SGC-10.9999930.999968SGC-1, CHJ-1
SGC-20.9999900.999999SGC-2, CHJ-2
ZCJ-10.9999590.999912ZCJ-1, CHJ-1
ZCJ-20.9999500.999898ZCJ-2, CHJ-1(wrong)
Table 4. Correlation coefficients and matching results between the encoding features of the CHJ station and the other three stations.
CHJ-1CHJ-2Matching Result
XTC-10.951470.78790XTC-1, CHJ-1
XTC-20.662560.90240XTC-2, CHJ-2
SGC-10.953390.79090SGC-1, CHJ-1
SGC-20.823020.97719SGC-2, CHJ-2
ZCJ-10.751710.58466ZCJ-1, CHJ-1
ZCJ-20.836620.92085ZCJ-2, CHJ-2
Table 5. Artificially triggered lightning flashes information in 2015 and 2017.
NumberTriggered TimeNumber of Return Strokes
111 June 2015, 18:051
211 June 2015, 18:222
311 June 2015, 18:2911
412 June 2015, 16:057
512 June 2015, 16:123
612 June 2015, 16:162
722 July 2015, 18:169
822 July 2015, 18:221
913 August 2015, 18:267
1013 August 2015, 18:327
1114 August 2015, 15:2513
1217 August 2015, 16:034
1317 August 2015, 16:079
1415 June 2017, 21:166
1516 June 2017, 00:051
1616 June 2017, 17:4411
178 July 2017, 18:523
188 July 2017, 18:596
1910 July 2017, 15:0710
2010 July 2017, 15:278
Table 6. Matching efficiency of the new algorithm, TOA–TR method and TOA method based on pulse-peak feature matching.
Matched Pulse NumberEffective Matches NumberMatching Efficiency
New algorithm6544271951.54%
TOA–TR 110154165920.48%
TOA method based on pulse-peak feature matching144344983.45%
1 The matching number of the TOA–TR method is provided by Chen, and the location number is given in Chen’s paper.
Publisher’s Note: MDPI stays neutral with regard to jurisdictional claims in published maps and institutional affiliations.

