Article

SAMIRA-SAtellite Based Monitoring Initiative for Regional Air Quality

by
Kerstin Stebel
1,*,
Iwona S. Stachlewska
2,
Anca Nemuc
3,
Jan Horálek
4,
Philipp Schneider
1,
Nicolae Ajtai
5,
Andrei Diamandi
6,
Nina Benešová
4,
Mihai Boldeanu
3,7,
Camelia Botezan
5,
Jana Marková
4,
Rodica Dumitrache
6,
Amalia Iriza-Burcă
6,
Roman Juras
4,8,
Doina Nicolae
3,
Victor Nicolae
3,9,
Petr Novotný
10,
Horațiu Ștefănie
2,5,
Lumír Vaněk
10,
Ondrej Vlček
4,
Olga Zawadzka-Manko
2,5 and
Claus Zehner
11
add Show full author list remove Hide full author list
1
NILU–Norwegian Institute for Air Research, 2027 Kjeller, Norway
2
Institute of Geophysics, Faculty of Physics, University of Warsaw, 02-093 Warsaw, Poland
3
National Institute of Research and Development for Optoelectronics (INOE), 077125 Magurele, Romania
4
Czech Hydrometeorological Institute (CHMI), 14306 Prague, Czech Republic
5
Faculty of Environmental Science and Engineering, Babeş-Bolyai University, 400294 Cluj-Napoca, Romania
6
National Meteorological Administration (NMA), 013686 Bucharest, Romania
7
Faculty of Electronics, Telecommunications and Information Technology, University Politehnica of Bucharest, 060042 Bucharest, Romania
8
Faculty of Environmental Sciences, Czech University of Life Sciences Prague, 16500 Prague, Czech Republic
9
Faculty of Physics, University of Bucharest, 077125 Măgurele, Romania
10
IDEA-ENVI s.r.o, 75701 Valašské Meziříčí, Czech Republic
11
ESA/ESRIN, 00044 Frascati, Italy
*
Author to whom correspondence should be addressed.
Remote Sens. 2021, 13(11), 2219; https://0-doi-org.brum.beds.ac.uk/10.3390/rs13112219
Submission received: 6 May 2021 / Revised: 29 May 2021 / Accepted: 1 June 2021 / Published: 5 June 2021
(This article belongs to the Special Issue The Future of Air Quality Monitoring by Remote Sensing)

Abstract

:
The satellite based monitoring initiative for regional air quality (SAMIRA) initiative was set up to demonstrate the exploitation of existing satellite data for monitoring regional and urban scale air quality. The project was carried out between May 2016 and December 2019 and focused on aerosol optical depth (AOD), particulate matter (PM), nitrogen dioxide (NO2), and sulfur dioxide (SO2). SAMIRA was built around several research tasks: 1. The spinning enhanced visible and infrared imager (SEVIRI) AOD optimal estimation algorithm was improved and geographically extended from Poland to Romania, the Czech Republic and Southern Norway. A near real-time retrieval was implemented and is currently operational. Correlation coefficients of 0.61 and 0.62 were found between SEVIRI AOD and ground-based sun-photometer for Romania and Poland, respectively. 2. A retrieval for ground-level concentrations of PM2.5 was implemented using the SEVIRI AOD in combination with WRF-Chem output. For representative sites a correlation of 0.56 and 0.49 between satellite-based PM2.5 and in situ PM2.5 was found for Poland and the Czech Republic, respectively. 3. An operational algorithm for data fusion was extended to make use of various satellite-based air quality products (NO2, SO2, AOD, PM2.5 and PM10). For the Czech Republic inclusion of satellite data improved mapping of NO2 in rural areas and on an annual basis in urban background areas. It slightly improved mapping of rural and urban background SO2. The use of satellites based AOD or PM2.5 improved mapping results for PM2.5 and PM10. 4. A geostatistical downscaling algorithm for satellite-based air quality products was developed to bridge the gap towards urban-scale applications. Initial testing using synthetic data was followed by applying the algorithm to OMI NO2 data with a direct comparison against high-resolution TROPOMI NO2 as a reference, thus allowing for a quantitative assessment of the algorithm performance and demonstrating significant accuracy improvements after downscaling. We can conclude that SAMIRA demonstrated the added value of using satellite data for regional- and urban-scale air quality monitoring.

Graphical Abstract

1. Introduction

Despite positive developments in emission reductions, air quality is still of concern in Europe. Particulate matter (PM), nitrogen dioxide (NO2), and ground-level ozone (O3) are Europe’s most problematic pollutants negatively affecting human health. The European Environment Agency (EEA) estimated that in 2018 in the 28 European Union member states 379,000 premature deaths could have been caused by long-term exposure to particles with a diameter of 2.5   μ m or less (PM2.5), 54,000 to NO2, and 19,400 to O3 [1]. According to the EEA, in 2018 48% and 74% of the urban population in Europe (EU-28) was exposed to concentrations above the World Health Organization (WHO) air quality guidelines (AQG) for particles with a diameter of 10 μ m or less (PM10) (annual mean 20 μ g m 3 ) and PM2.5 (annual mean 10 μ g m 3 ), respectively. Fortunately in most European countries NO2 concentrations steadily decreased between 2009 and 2018. Only 4% of the European population were exposed to NO2 concentrations above the EU annual limit value, which is equal to the AQG (40 μ g m 3 in a calendar year) in 2018 [1]. SO2 pollution plays only a minor role in Europe these days, although, for example in vicinities of large power plants infrequent exceedances of limit values do occur (daily 20 μ g m 3 ) and in 2018, based on the WHO AQGs, 19% of the urban population in Europe was affected [1].
Air quality maps are generated to inform the public about air pollution levels in the region they are living in. They serve as visualization of the actual situation and as a basis for air quality assessments. In situ observations, satellite measurements, and output from chemical transport modeling (CTM) are three mutually complimentary sources for generating air quality maps. In situ measurements provide accurate actual levels of concentrations, satellite data provide observations of spatial and temporal patterns (but not concentrations directly) and modeling outputs provide spatially continuous coverage of given area. The satellite based monitoring initiative for regional air quality (SAMIRA) project was set up to explore the added value of satellite data for air quality mapping through their synergistic use together with in situ air quality and modeling data. Satellite observations used in the project were acquired by the geostationary spinning enhanced visible and infrared imager (SEVIRI) onboard Meteosat second generation (MSG) [2], the ozone monitoring instrument (OMI) onboard NASA’s Aura platform [3] and the TROPOspheric monitoring instrument (TROPOMI) on the Sentinel-5 Precursor (S5P) satellite [4].
For estimating human exposure to air pollution the knowledge of PM concentration is essential. Ground-level concentration of PM2.5 can be estimated from satellite observations of total-column aerosol optical depth (AOD) utilizing various approaches (see e.g., [5,6,7], and references therein). Geostationary satellites instruments like SEVIRI allow for the retrieval of AOD (e.g., [8,9,10]) at high temporal frequency and are, therefore, particularly interesting for air quality applications. Therefore, the SEVIRI near-real-time (NRT) AOD retrieval was a first task within SAMIRA. Satellite AOD is a convolution of the contribution from within the planetary boundary layer (PBL) and the free troposphere, locally-produced, and long range transported aerosols. Due to the complex spatial and temporal relationship between the total column aerosol optical depth and ground-level particulate matter, AOD-to-PM conversion, the second activity within SAMIRA, is a rather complex challenge. A multitude of methods for the AOD-to-PM conversion were developed throughout the years, for example using empirical and multivariate relations (e.g., [11,12]), scaling of the satellite AOD with the PM2.5/AOD ratio from a CTM [13], synergistic satellite and ground-based AOD [14], spectral and synergistic satellite information [15,16], fused satellite and model-calibrated PM2.5 [17], and machine learning [18,19,20]. For SAMIRA we chose a physical based AOD-to-PM conversion method, the foundation of which goes back to work of [21].
SAMIRA dealt also with NO2 and SO2, which was of particular interesting due to the improvement in spatial resolution and sensitivity introduced by TROPOMI. Whereas OMI pixels have a spatial resolution of up to 13 × 24 km2 at nadir, TROPOMI has a footprint of 3.5 × 5.5 km2 at nadir (since August 2019). For OMI, the QA4ECV NO2 is one of the most recent NO2 retrieval products [22]; for TROPOMI NO2 see [23]. For Romania, which was one of our study regions, [24] reported that annual SO2 from power plants decreased between 2005 and 2015, while NO2 emissions were more or less stable during that time period. TROPOMI led to a new area of top-down NO2 emission monitoring from space [25,26], as well as bringing advances for surface NO2 concentration estimates (e.g., [27]). For SO2, despite the increased sensitivity of TROPOMI, in 2018/2019 only the largest SO2 emitters in Europe, e.g., the Polish Bełchatów coal power plant, were visible from space, due to the installation of flue gas desulfurization systems in the European Union [28].
An essential goal of SAMIRA was to improve the societal relevance of air quality data measured from space. This can be done by combining ground-based in situ data with model output and satellite data products. For the combination of different data sources, a range of methods can be used to create spatial concentration fields. Such methods are often referred to as data assimilation and data fusion [29], the latter being a subset of data assimilation methods in a wider sense [30]. Therefore, within the SAMIRA initiative, an operational algorithm for data fusion of multiple heterogeneous datasets was extended to make use of various NRT satellite-based air quality products.
Although with the launch of the TROPOMI instrument the spatial resolution of air quality-related satellite products has significantly improved, the available resolution is still relatively coarse for urban- and local-scale applications, where air pollution tends to have the most significant consequences for the human population. Therefore, we investigated the feasibility of statistical downscaling of OMI and TROPOMI data with the help of geostatistics and a fine-scale proxy datasets. The proposed technique builds upon extensive previous research in geostatistics [31,32,33,34]. In geostatistical terms, downscaling is essentially a change of support problem (with support denoting the area of an observation, e.g., a point, a pixel, a grid cell, or a polygon), where the coarse spatial support of the original dataset is seen as an areal support and the fine spatial support of the target resolution is seen as a point support.
Finally, a pre-operational in situ PM10 data assimilation system was developed within SAMIRA. This development did not include satellite data yet. Therefore, it is only briefly described for completeness, being the first step towards a full air quality data assimilation system for Romania.
With this paper we want to give an overview and share lessons learned within the SAMIRA initiative. Following this introduction, in Section 2 we present the general methodology used in the project. Example results from the data product development are shown in Section 3. In Section 4 the validation of the datasets is presented. Section 5 illustrates the visualization system of the data. A discussion of the results, conclusions, and outlooks are summarized in Section 6.

2. SAMIRA Methodology

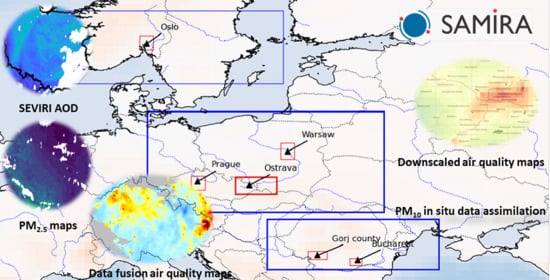
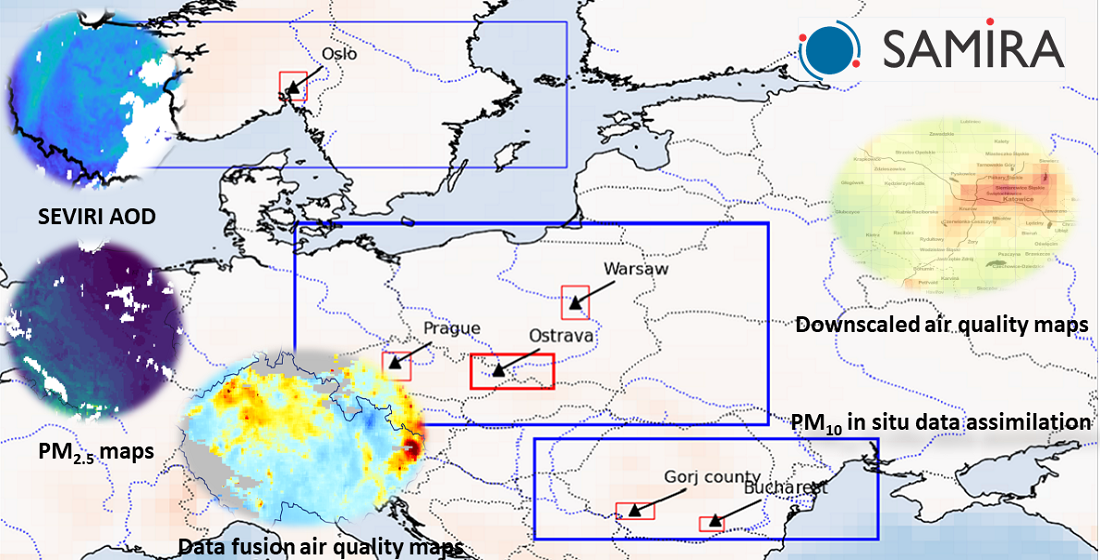
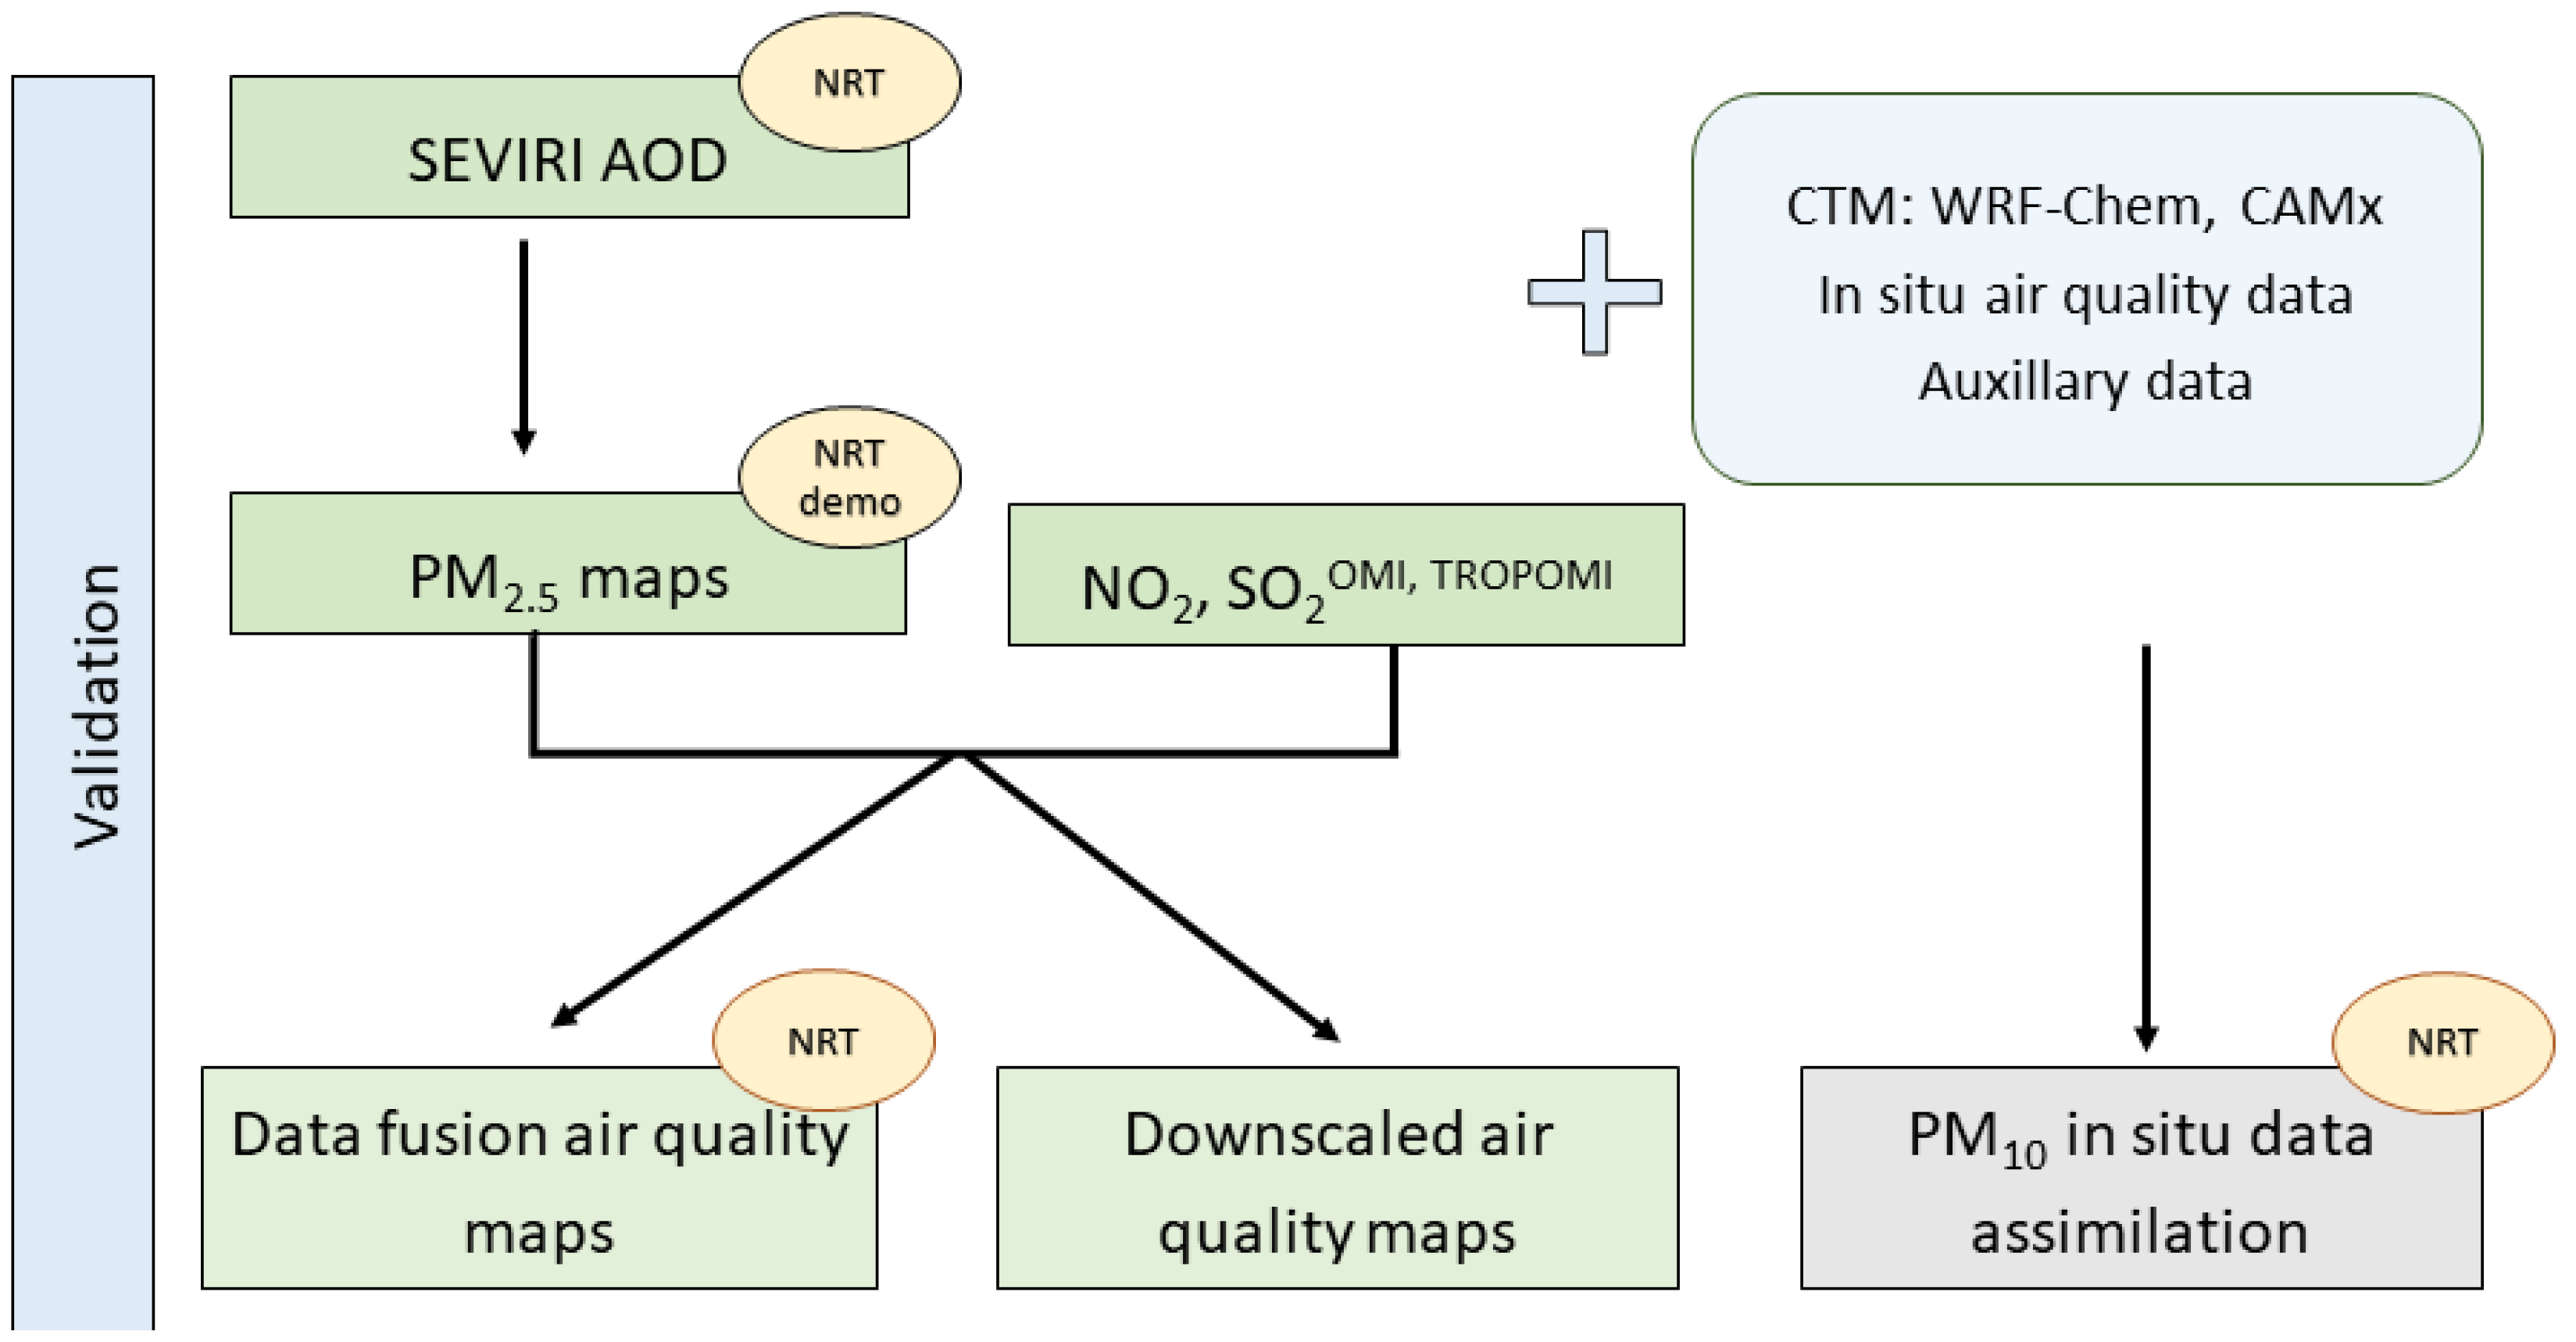
The overall approach, the activities and the logical flow of the SAMIRA project are illustrated in Figure 1. SAMIRA evolved around five primary research tasks: a. the SEVIRI AOD retrieval, b. the PM2.5 retrieval, i.e., the AOD to PM2.5 conversion, c. the data fusion methodology, which means the integration of satellite-based datasets with in situ monitoring and modeling data, d. the downscaling methodology, i.e., the development of algorithms for increasing the spatial resolution of satellite-based air quality products, and e. the in situ PM10 data assimilation. All activities marked in green in Figure 1 made use of satellite data, which were to various extents combined with ground-based in situ, model data and auxiliary datasets.
The SAMIRA data product development took place in two subsequent steps: a. the retrieval of historical data (June–September 2014) and their validation, and b. the demonstration and development of the products in near-real-time. The SEVIRI NRT AOD retrieval was developed based on an existing optimal estimation algorithm to provide up-to-date high-frequency AOD maps for Poland, Romania, the Czech Republic, and southern Norway (see Section 2.1). SEVIRI AOD and output from the weather research and forecasting (WRF) model coupled with chemistry (WRF-Chem) [35,36,37] was combined to calculate near-surface hourly PM2.5 (see 
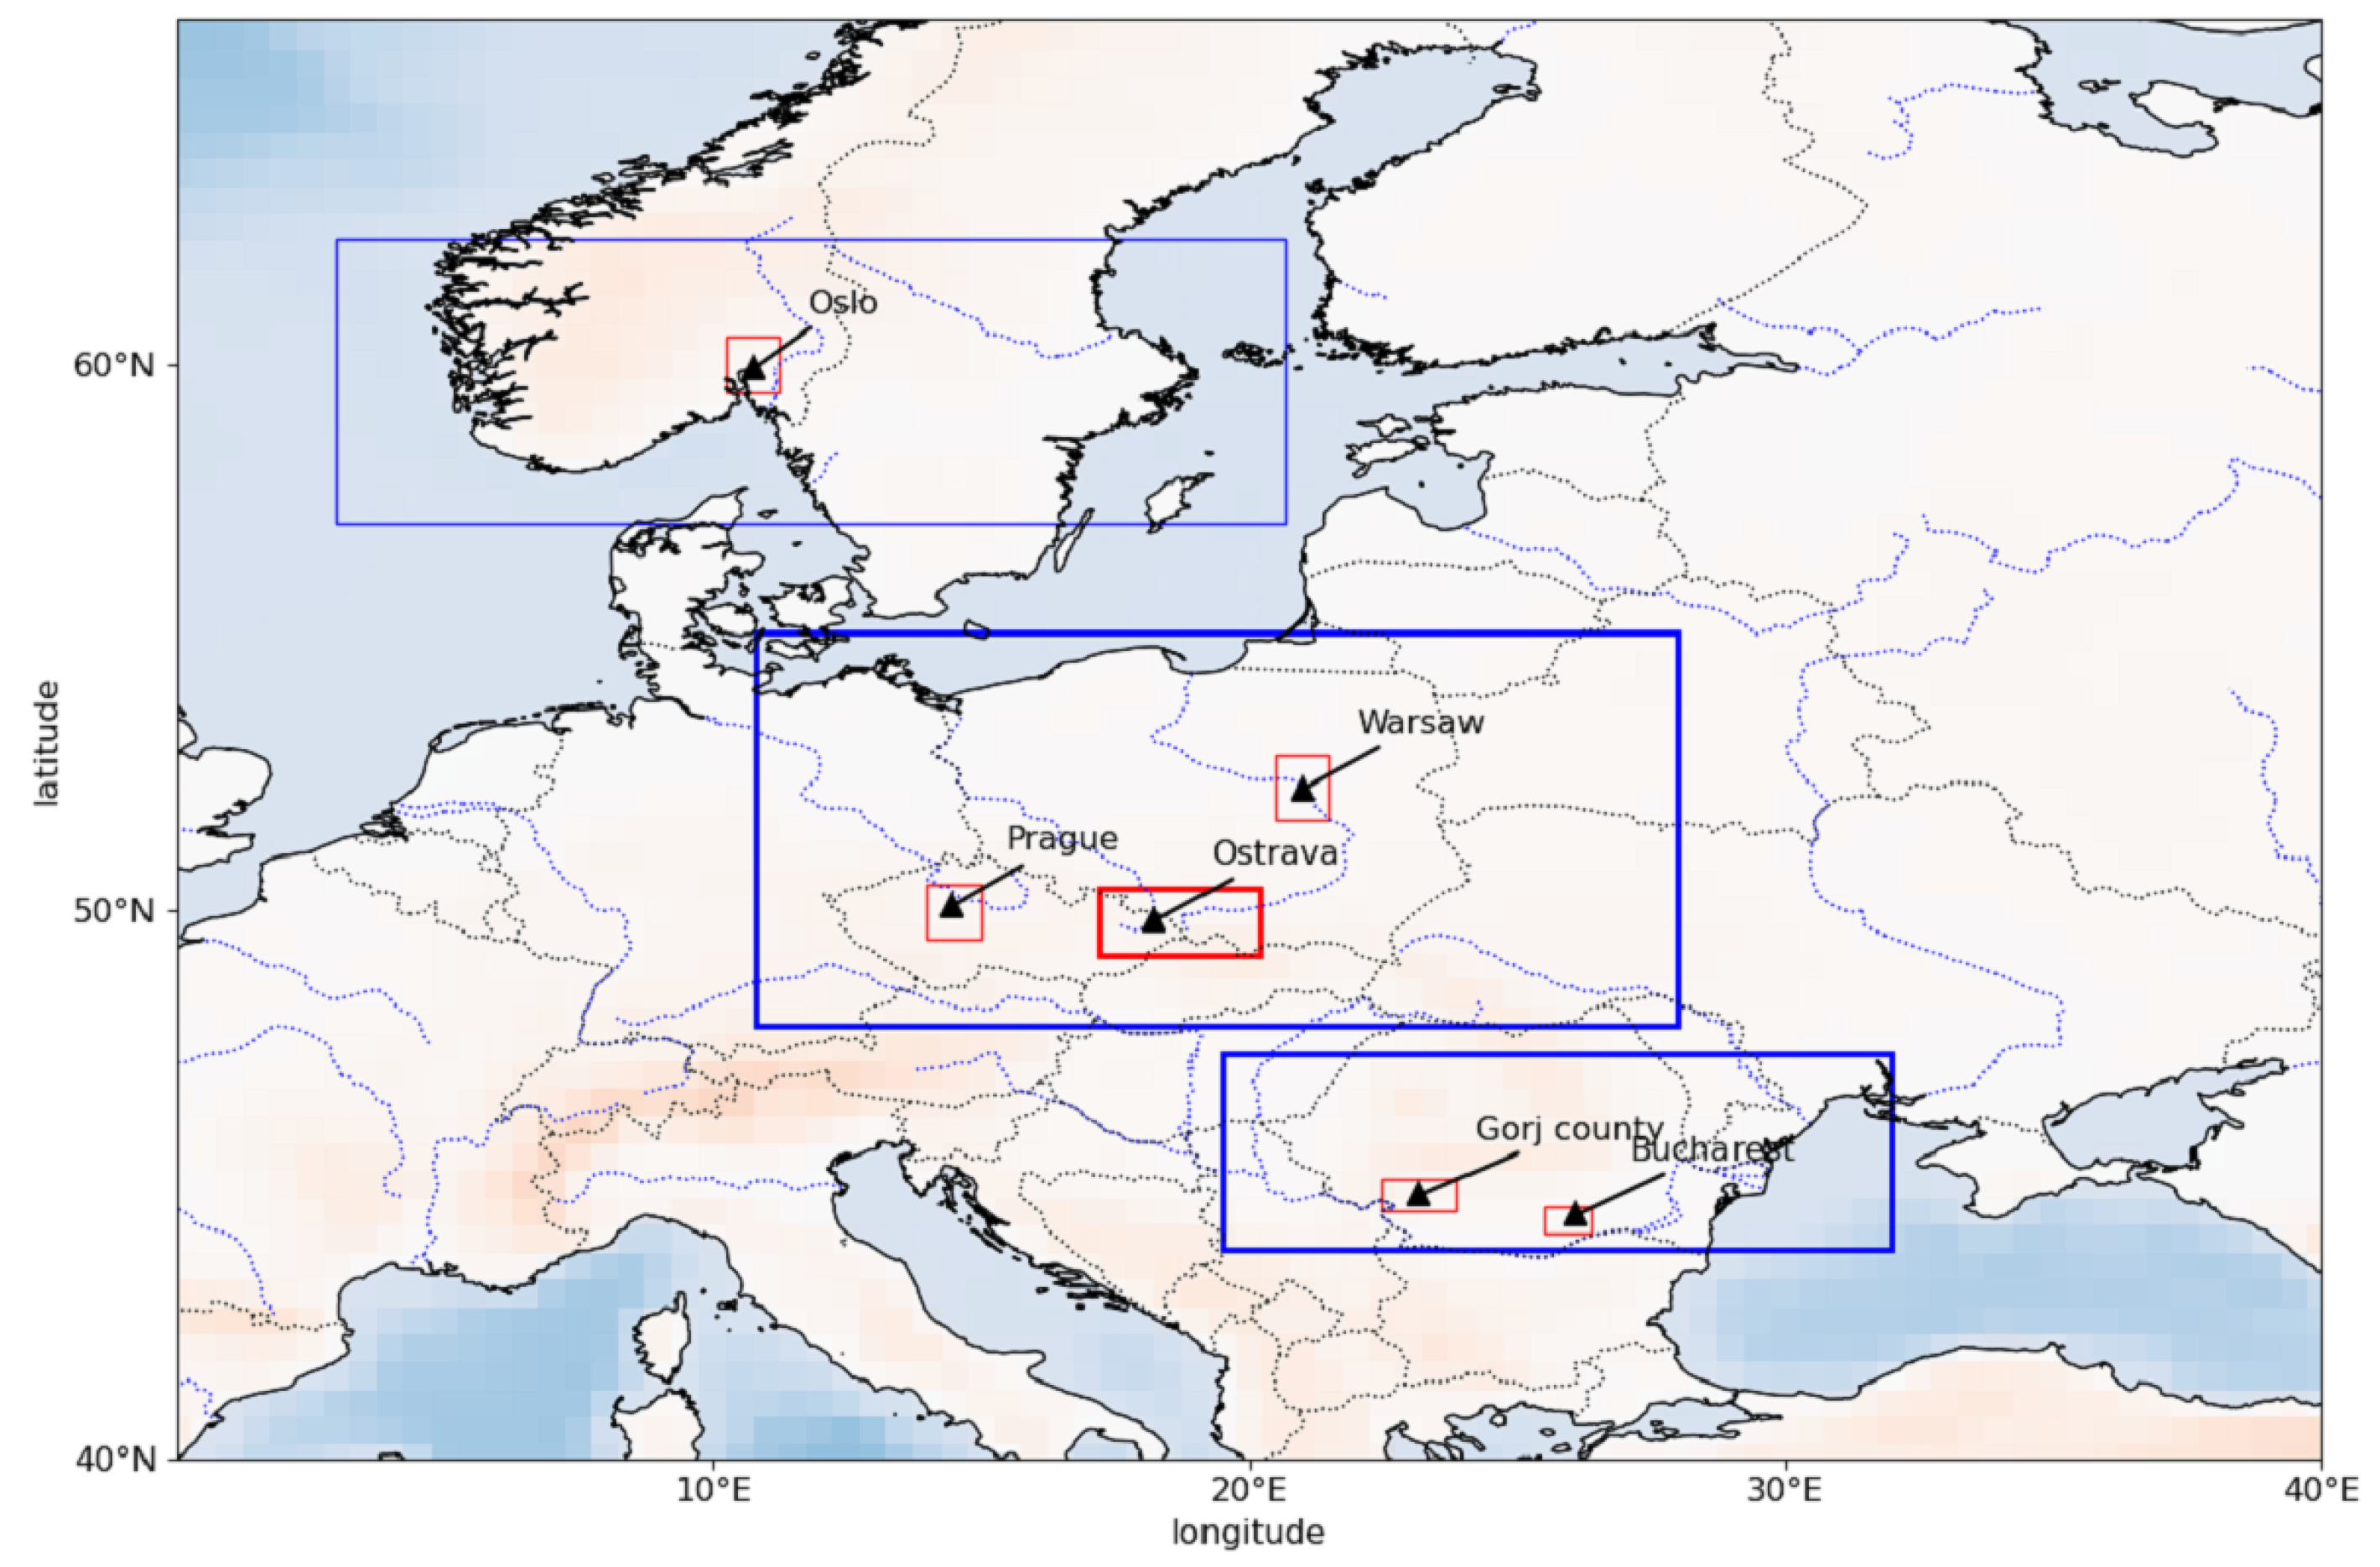
Section 2.2). WRF-Chem was run on the Babeş-Bolyai University (UBB) high performance computer for June–September 2014 in multiple configurations. The WRF-Chem model was integrated for the entire European area at two horizontal resolutions: 15 km and 5 km. From the model integration at 15 km horizontal resolution, nested domains were run for each country and region of interest, at 5 km (country) and 1 km (region) horizontal resolution, respectively (see Figure 2). For areas marked in bold, we show exemplary results in the following. We combined in situ with satellite data and output from a chemistry transport model (CTM), either WRF-Chem or the comprehensive air quality model with extensions (CAMx) using data fusion techniques (see Section 2.3); the methodology was demonstrated for Europe and the Czech Republic. In the current paper we focus on regional and local air quality matters, therefore, we show results from the latter only. Finally, to make the coarse spatial resolution of satellite observations more suitable for local applications, satellite data were downscaled with the help of the high-resolution CTM output and alternative time-invariant proxies using geostatistics (see Section 2.4). The methodology was demonstrated for NO2, SO2, and AOD/PM using OMI and TROPOMI data for the capitals of the four countries and areas, which are known for their bad air quality, e.g., the Ostrava/Katowice area. Finally, preparatory work for the development of an operational PM air quality forecast system in Romania was done by assimilation of in situ PM10 into the WRF-Chem model (see Section 2.5). In the following all retrievals are described briefly.

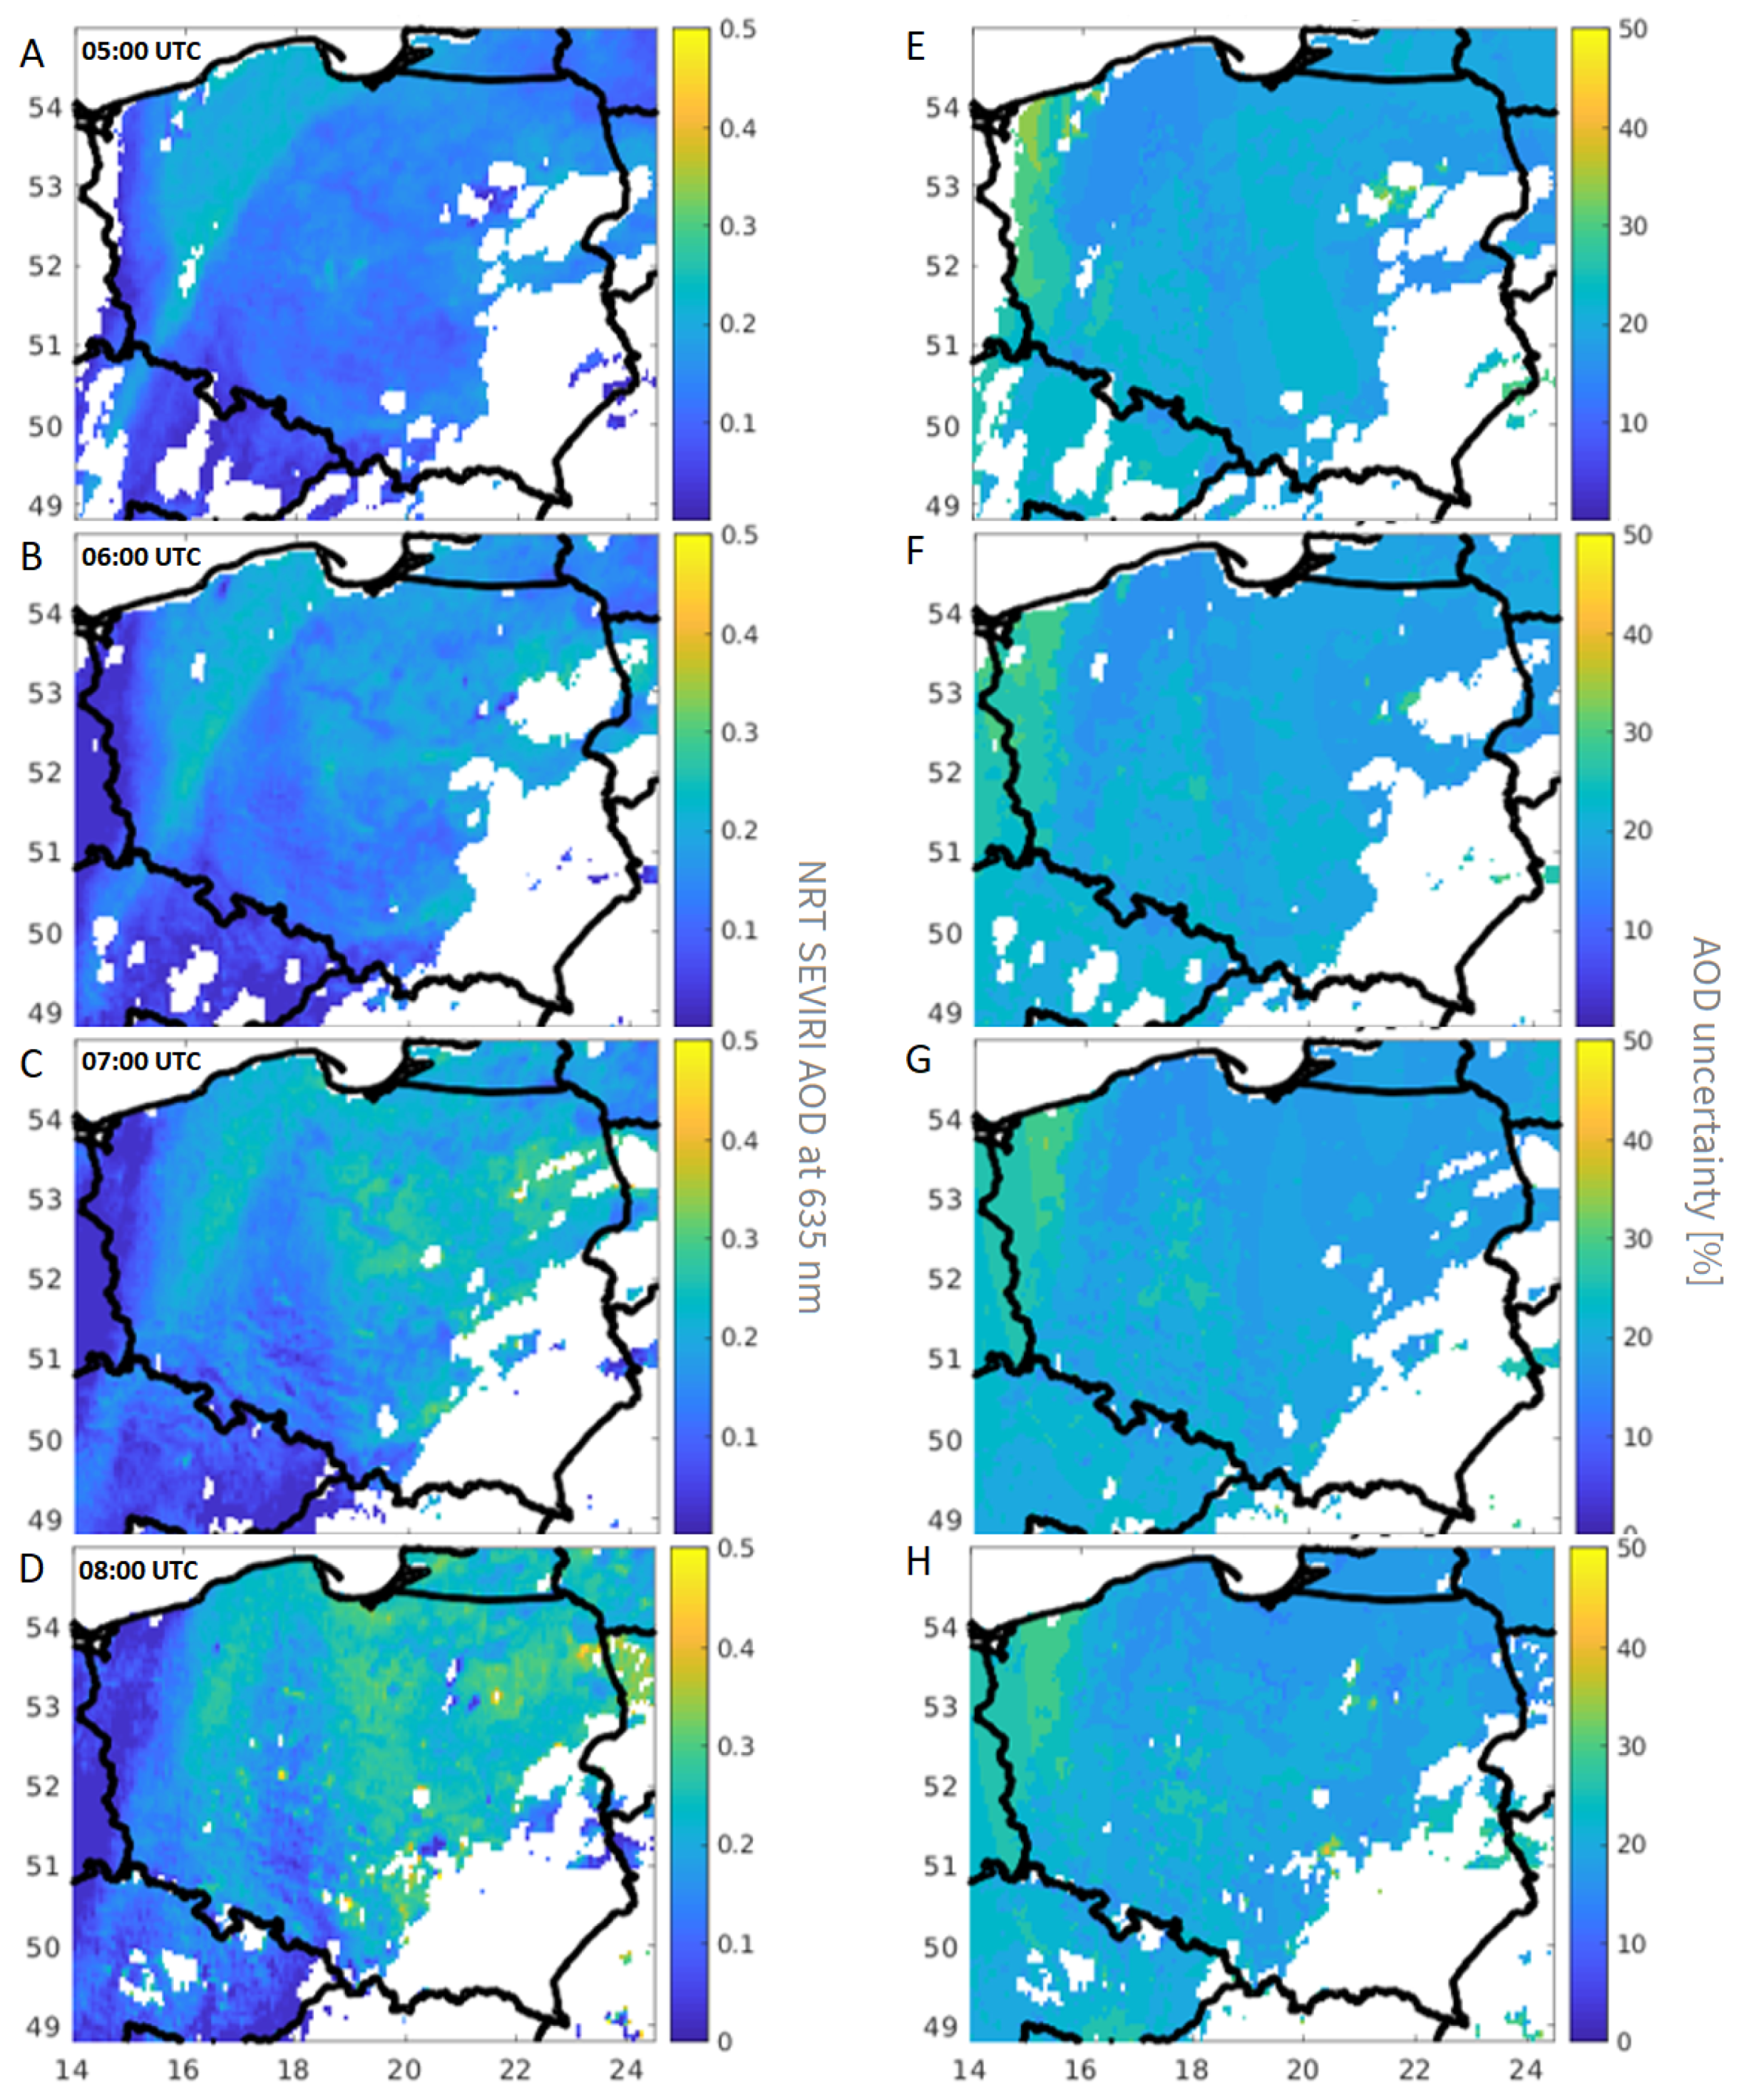
2.1. SEVIRI AOD Retrieval

The first step in the SAMIRA air quality product development was the SEVIRI NRT AOD retrieval. A prototype algorithm was initially developed for Poland [38] and within SAMIRA it was improved and extended to the Czech Republic, Romania, and Southern Norway. The algorithm was modified based on case studies presented in [39,40,41]. Improvements that were made are related to the surface reflectance estimation, the improved cloud screening, and the uncertainty calculation. For a full description of the final version of the algorithm, we refer the interested readers to [42]. In short, the computation consists of a few steps. At first, a reference day with a low AOD and low cloud cover is chosen, for which the surface reflectance is calculated from SEVIRI data utilizing the operational global-scale Copernicus atmosphere monitoring service (CAMS) AOD forecast product (https://atmosphere.copernicus.eu/) as background information on the spatial AOD distribution. CAMS AOD is corrected using sun-photometer measurements from several aerosol robotic network (AERONET) [43] stations in the respective country using an optimal interpolation method [38]. Then the surface reflectance is estimated with the use of corrected CAMS AOD. The AOD is calculated for several days around the reference day. Finally, the AOD at 635 nm is interpolated to a regular grid of 0.07° × 0.045°, corresponding approximately to 5.5 × 5.5 km2 for Poland. Besides AOD, AOD pixel-level uncertainties are estimated.
For the NRT retrieval, each day at 00:21 UTC surface reflectances are calculated. This is done for each country separately. At 7:00 UTC the following conditions are checked: a. the mean AOD, which is calculated using CAMS data, is below or equal to 0.15 and b. the cloud cover is less or equal to 65% (SEVIRI cloud mask). If fulfilled, surface reflectances are calculated for the previous day using data from SEVIRI, AERONET (both automatically downloaded), and CAMS AOD forecast data (downloaded every day at around 03:00 UTC). The SEVIRI AOD retrieval starts at the 7th, 23rd, 38th, and 53rd minute of each hour (within the time period between 5:00 and 9:45 UTC, and 13:00 and 16:45 UTC). There is about 20 to 23 min delay in receiving the data, which means that, e.g., the calculation for 7:00 UTC starts at 7:23 UTC. AOD computations take a few minutes, depending on the number of valid pixels (cloud-free and containing a surface reflectance). For each time the following is checked: the mean AOD (CAMS) is >0.15 and the cloud cover is ≤65%. If these conditions are fulfilled, AOD and its uncertainties are calculated from SEVIRI data and surface reflectances (for the reference day, being one of the previous days). The choice of the reference day for the surface reflectance calculation is done with a constraint that the span between the day for which the AOD map is derived and the closest available reference day cannot be more than 15 days.

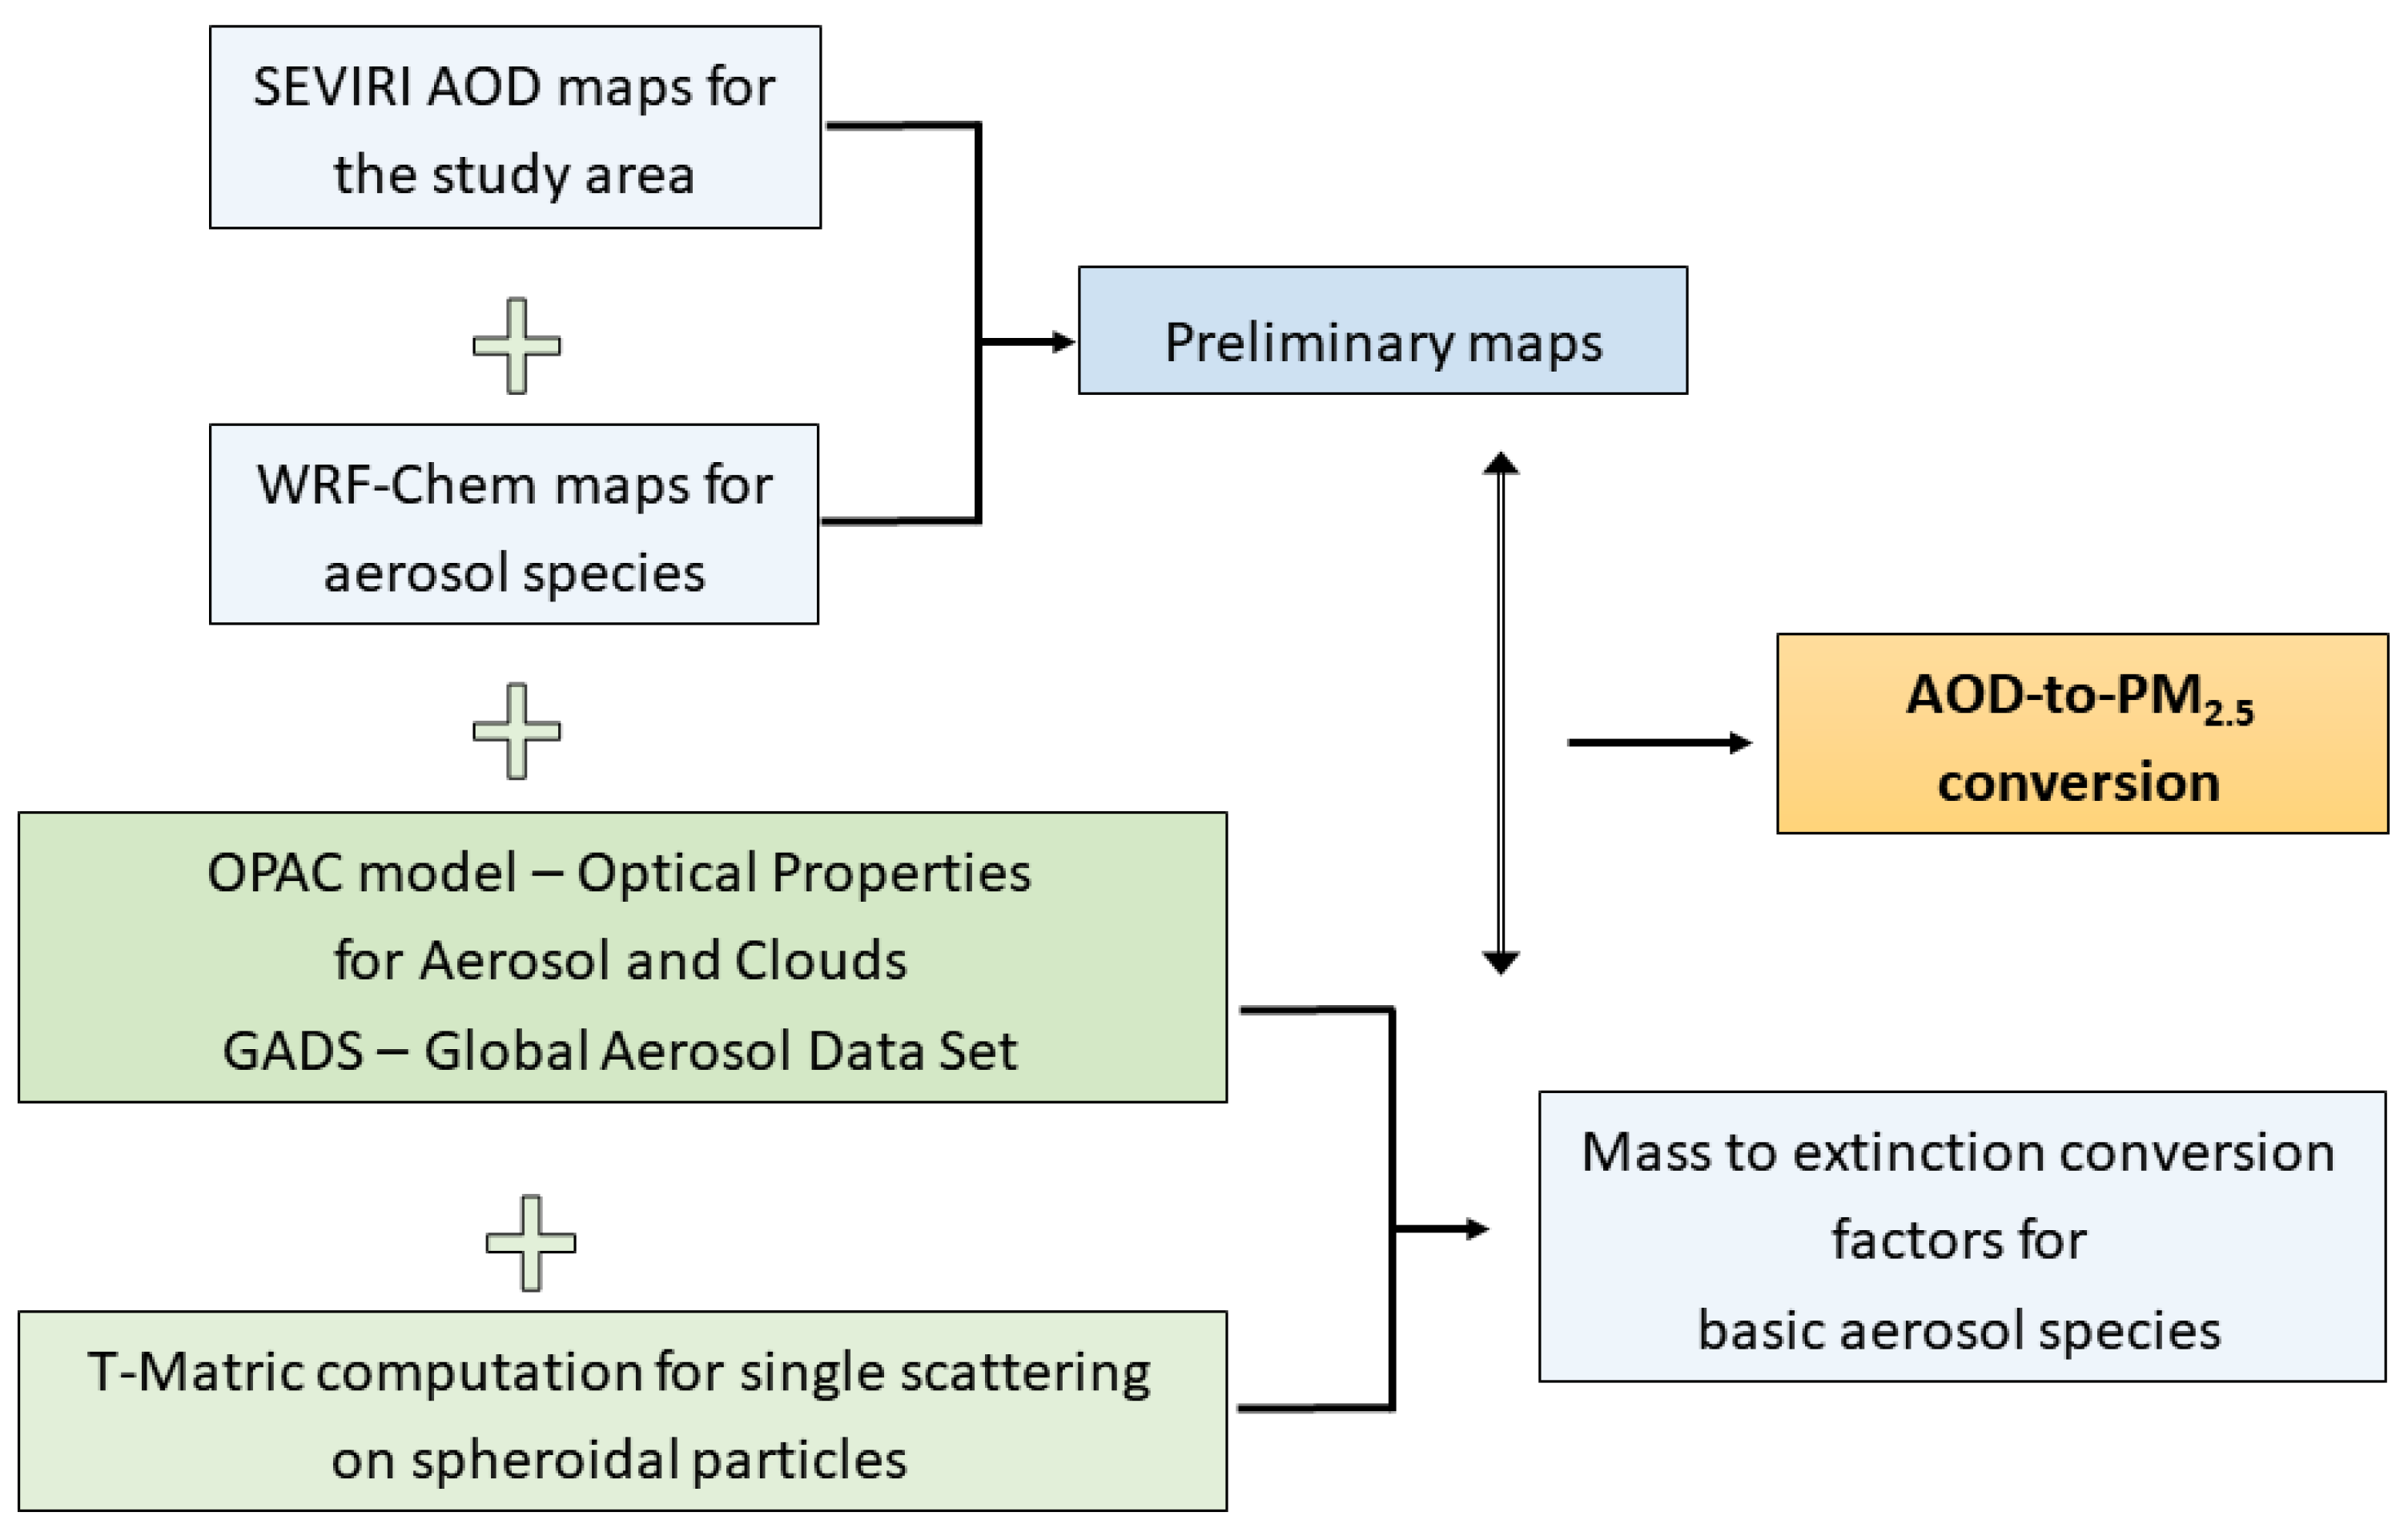
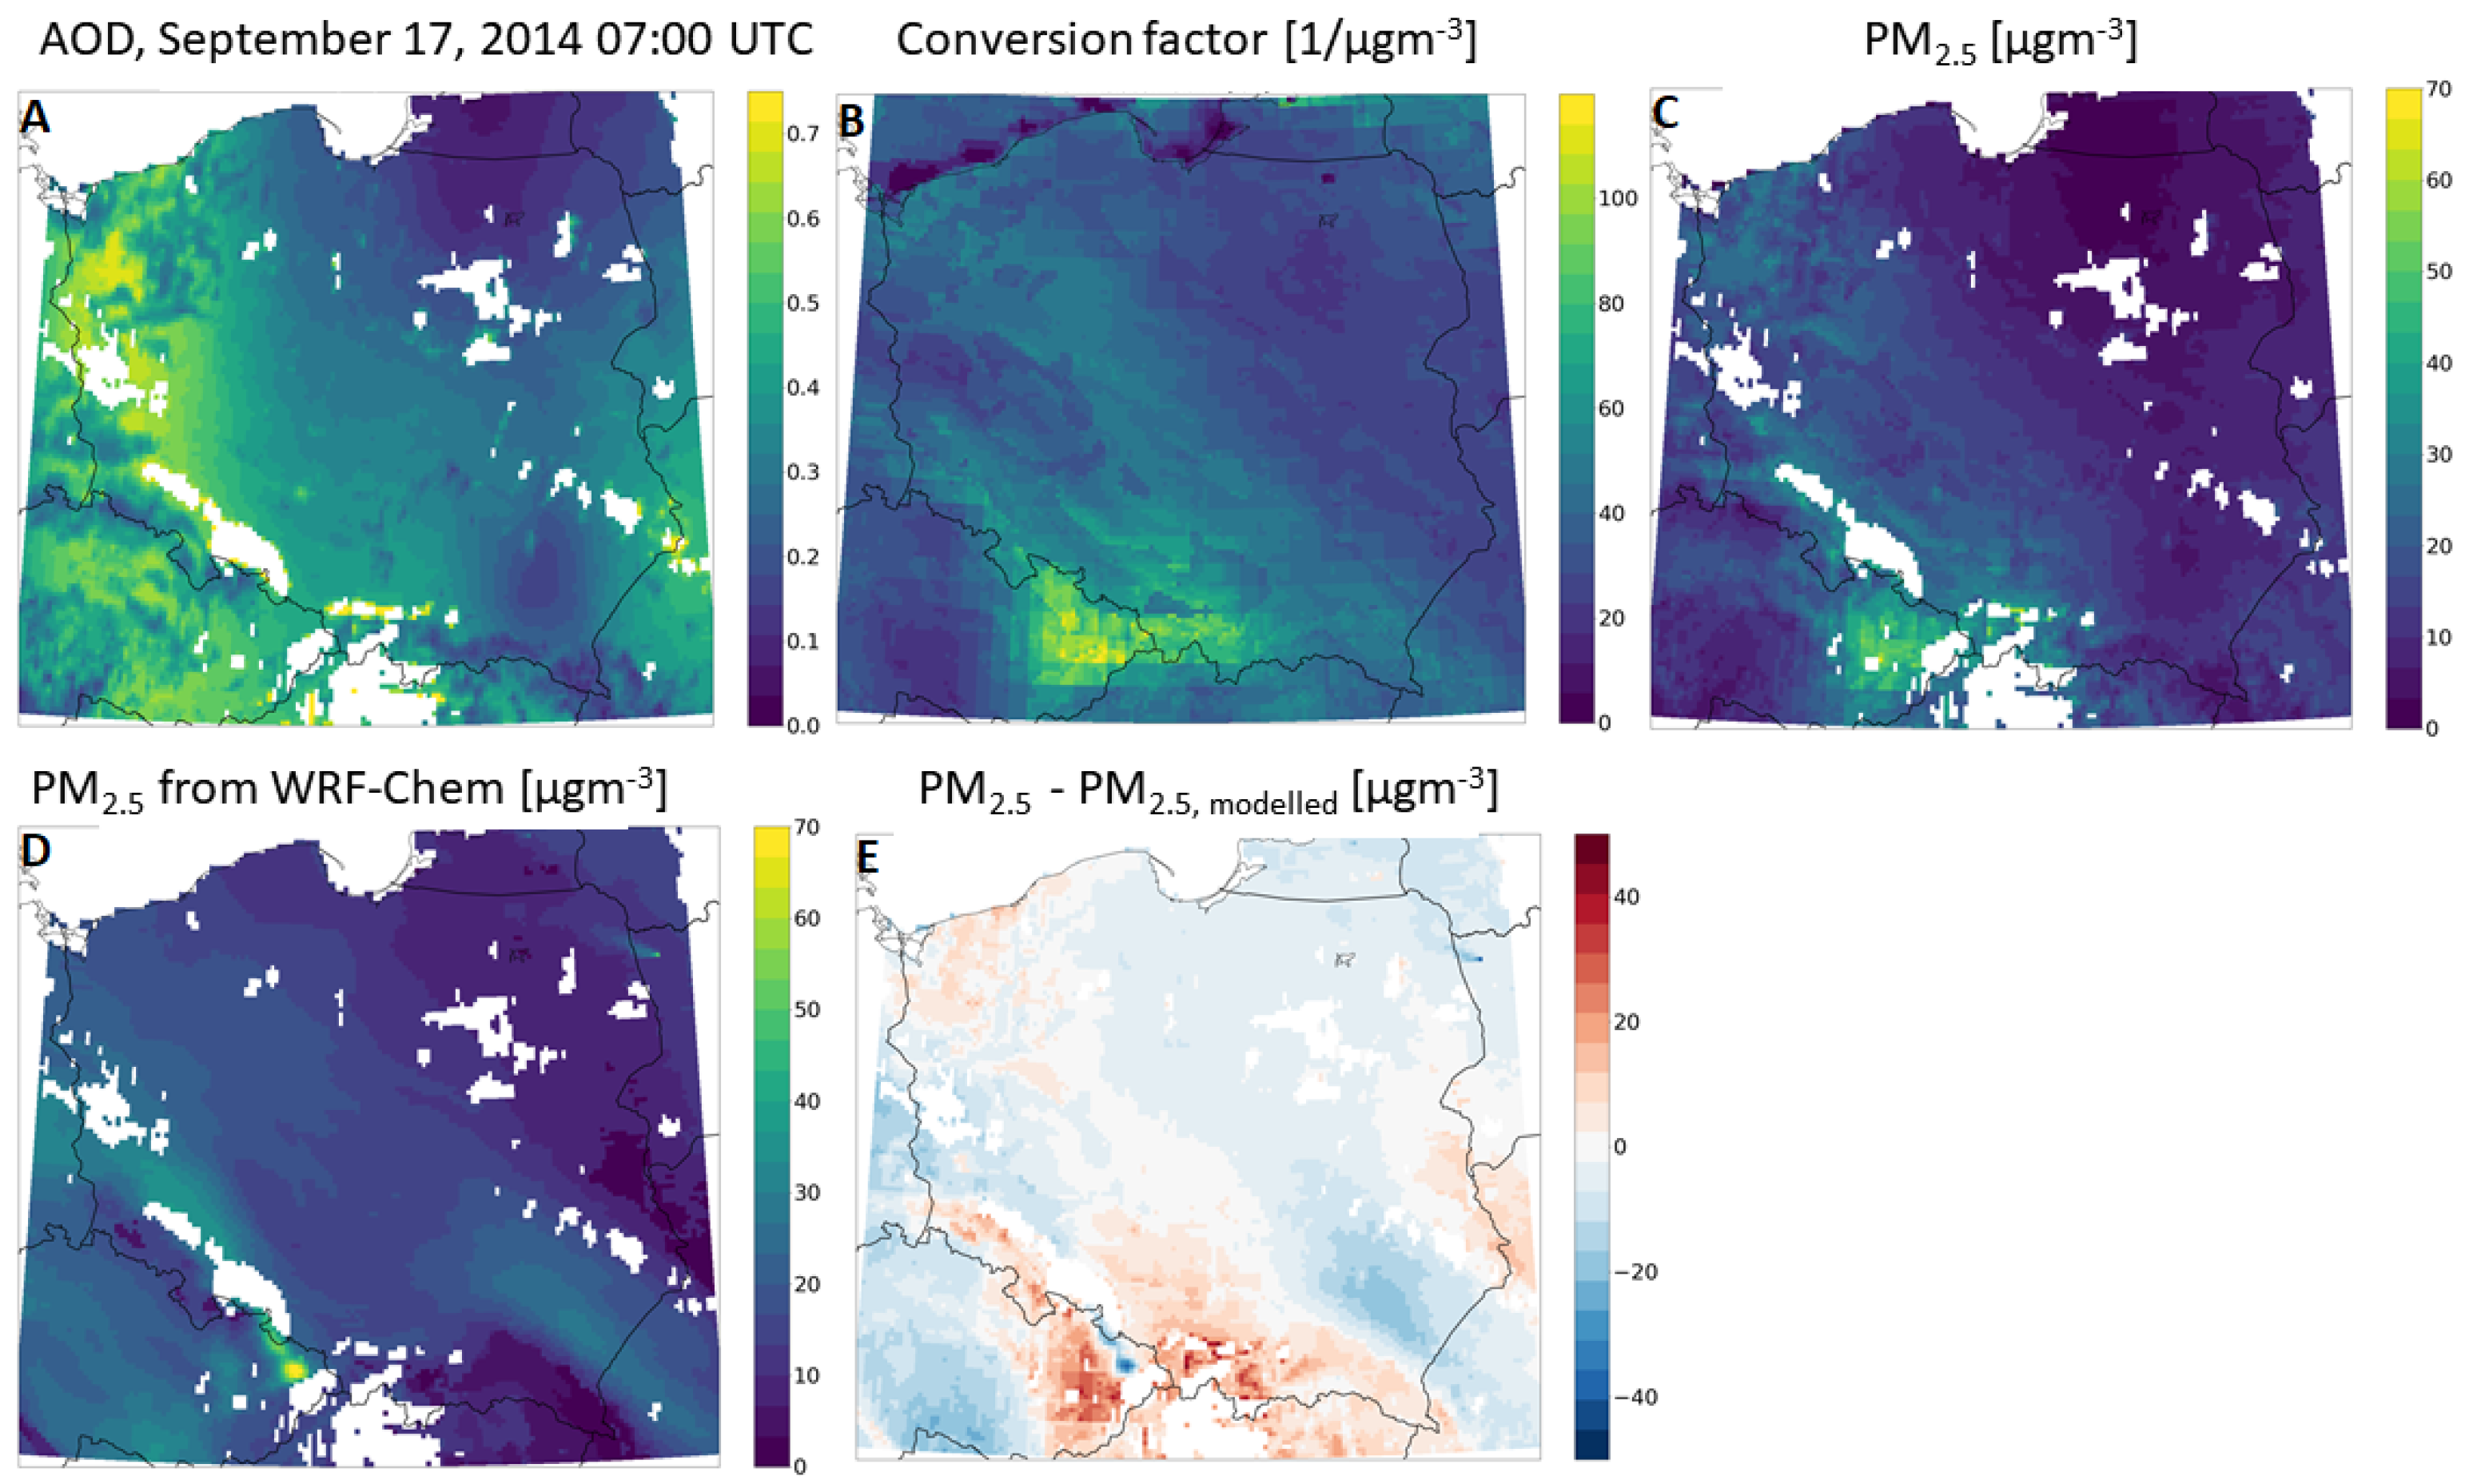
2.2. PM2.5 Retrieval: AOD to PM2.5 Conversion

The near-surface hourly PM2.5 concentrations were retrieved from temporally averaged SEVIRI AOD data [44]. Estimating PM2.5 from satellite observations of total-column AOD requires knowledge of the aerosol properties (microphysical and optical), their vertical distribution (PBL height and fraction of AOD in the PBL), and AOD. More specific, see Equation (1) from [21].
P M = 4 ρ r e f f 3 Q e x t × f P B L h P B L × A O D
with ρ being the density and r e f f the effective radius of the aerosol mixture, Q e x t the extinction coefficient, f P B L the fraction of AOD in the PBL, and h P B L the height of the PBL.
The workflow for our PM2.5 retrieval is illustrated in Figure 3. The most computationally intensive part is obtaining the optical and microphysical properties of aerosols in an online fashion. This was handled by creating a look-up table of properties for a range of aerosol mixtures at a number of relative humidity levels. Using the algorithm developed in [45] for aerosol typing a synthetic database was generated by simulating the optical properties of various aerosol types based on available information on the microphysics.
The algorithm combines the global aerosol dataset (GADS) database [46], the optical properties of aerosol and clouds (OPAC model) [47] and T-Matrix code for light scattering by non-spherical particles [48] in order to compute in an iterative way the optical properties of different aerosol classes in various humidity conditions and mass proportions starting from the microphysical properties. From GDAS we used the extinction, scattering and absorption coefficients, the single scattering albedo and the asymmetry parameter. From OPAC microphysical properties used are the density of aerosol particles, the aerosol mass per cubic meter, and the mode radius. Information from the CTM is used to compute the mass mixing ratios of the aerosols which are part of PM
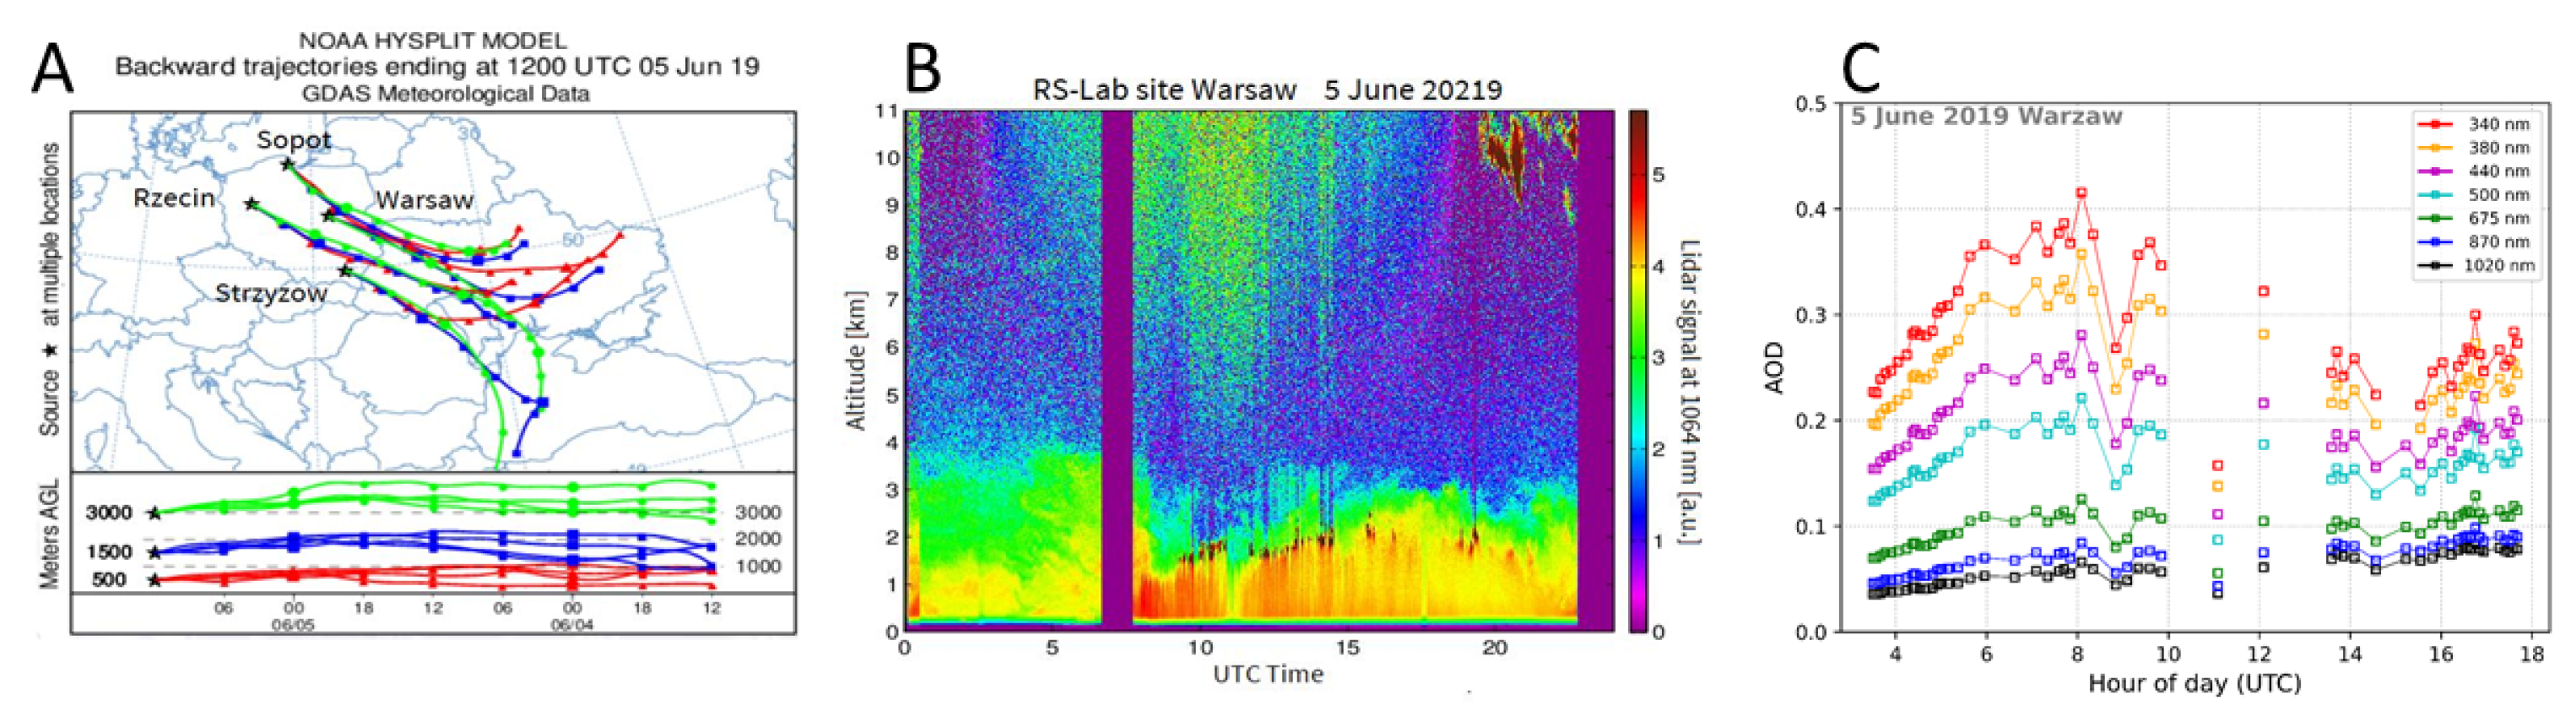
2.5. Using the model we computed the relative humidity, mass mixing ratios for four major aerosol types (soot, water soluble, insoluble, sulfates), and the PBL height. The AOD fraction in the PBL was computed using WRF-Chem and the same aerosol type was assumed at all levels. Uncertainties due to the use of WRF-Chem cross-sections and the assumption of an unique aerosol type in the column were evaluated in post-processing mode by comparisons with the cloud–aerosol LIDAR with orthogonal polarization (CALIOP) onboard the CALIPSO mission [49] and ground-based LIDAR data.
T-matrix calculations are very time consuming (approximately 3 s per mixture/grid point). This would have taken about a day of computation to get results (150 × 200 grid point), therefore, look-up tables were pre-computed. A master-script handled the inputs and errors, e.g., caused by missing input variables. It could run in automated or manual mode; the latter plotted all intermediate steps for debugging and quality control. Within SAMIRA we could demonstrate the NRT capability of our AOD-to-PM2.5 retrieval, with PM2.5 maps being ready within 5 min after the AOD maps became available on a server.

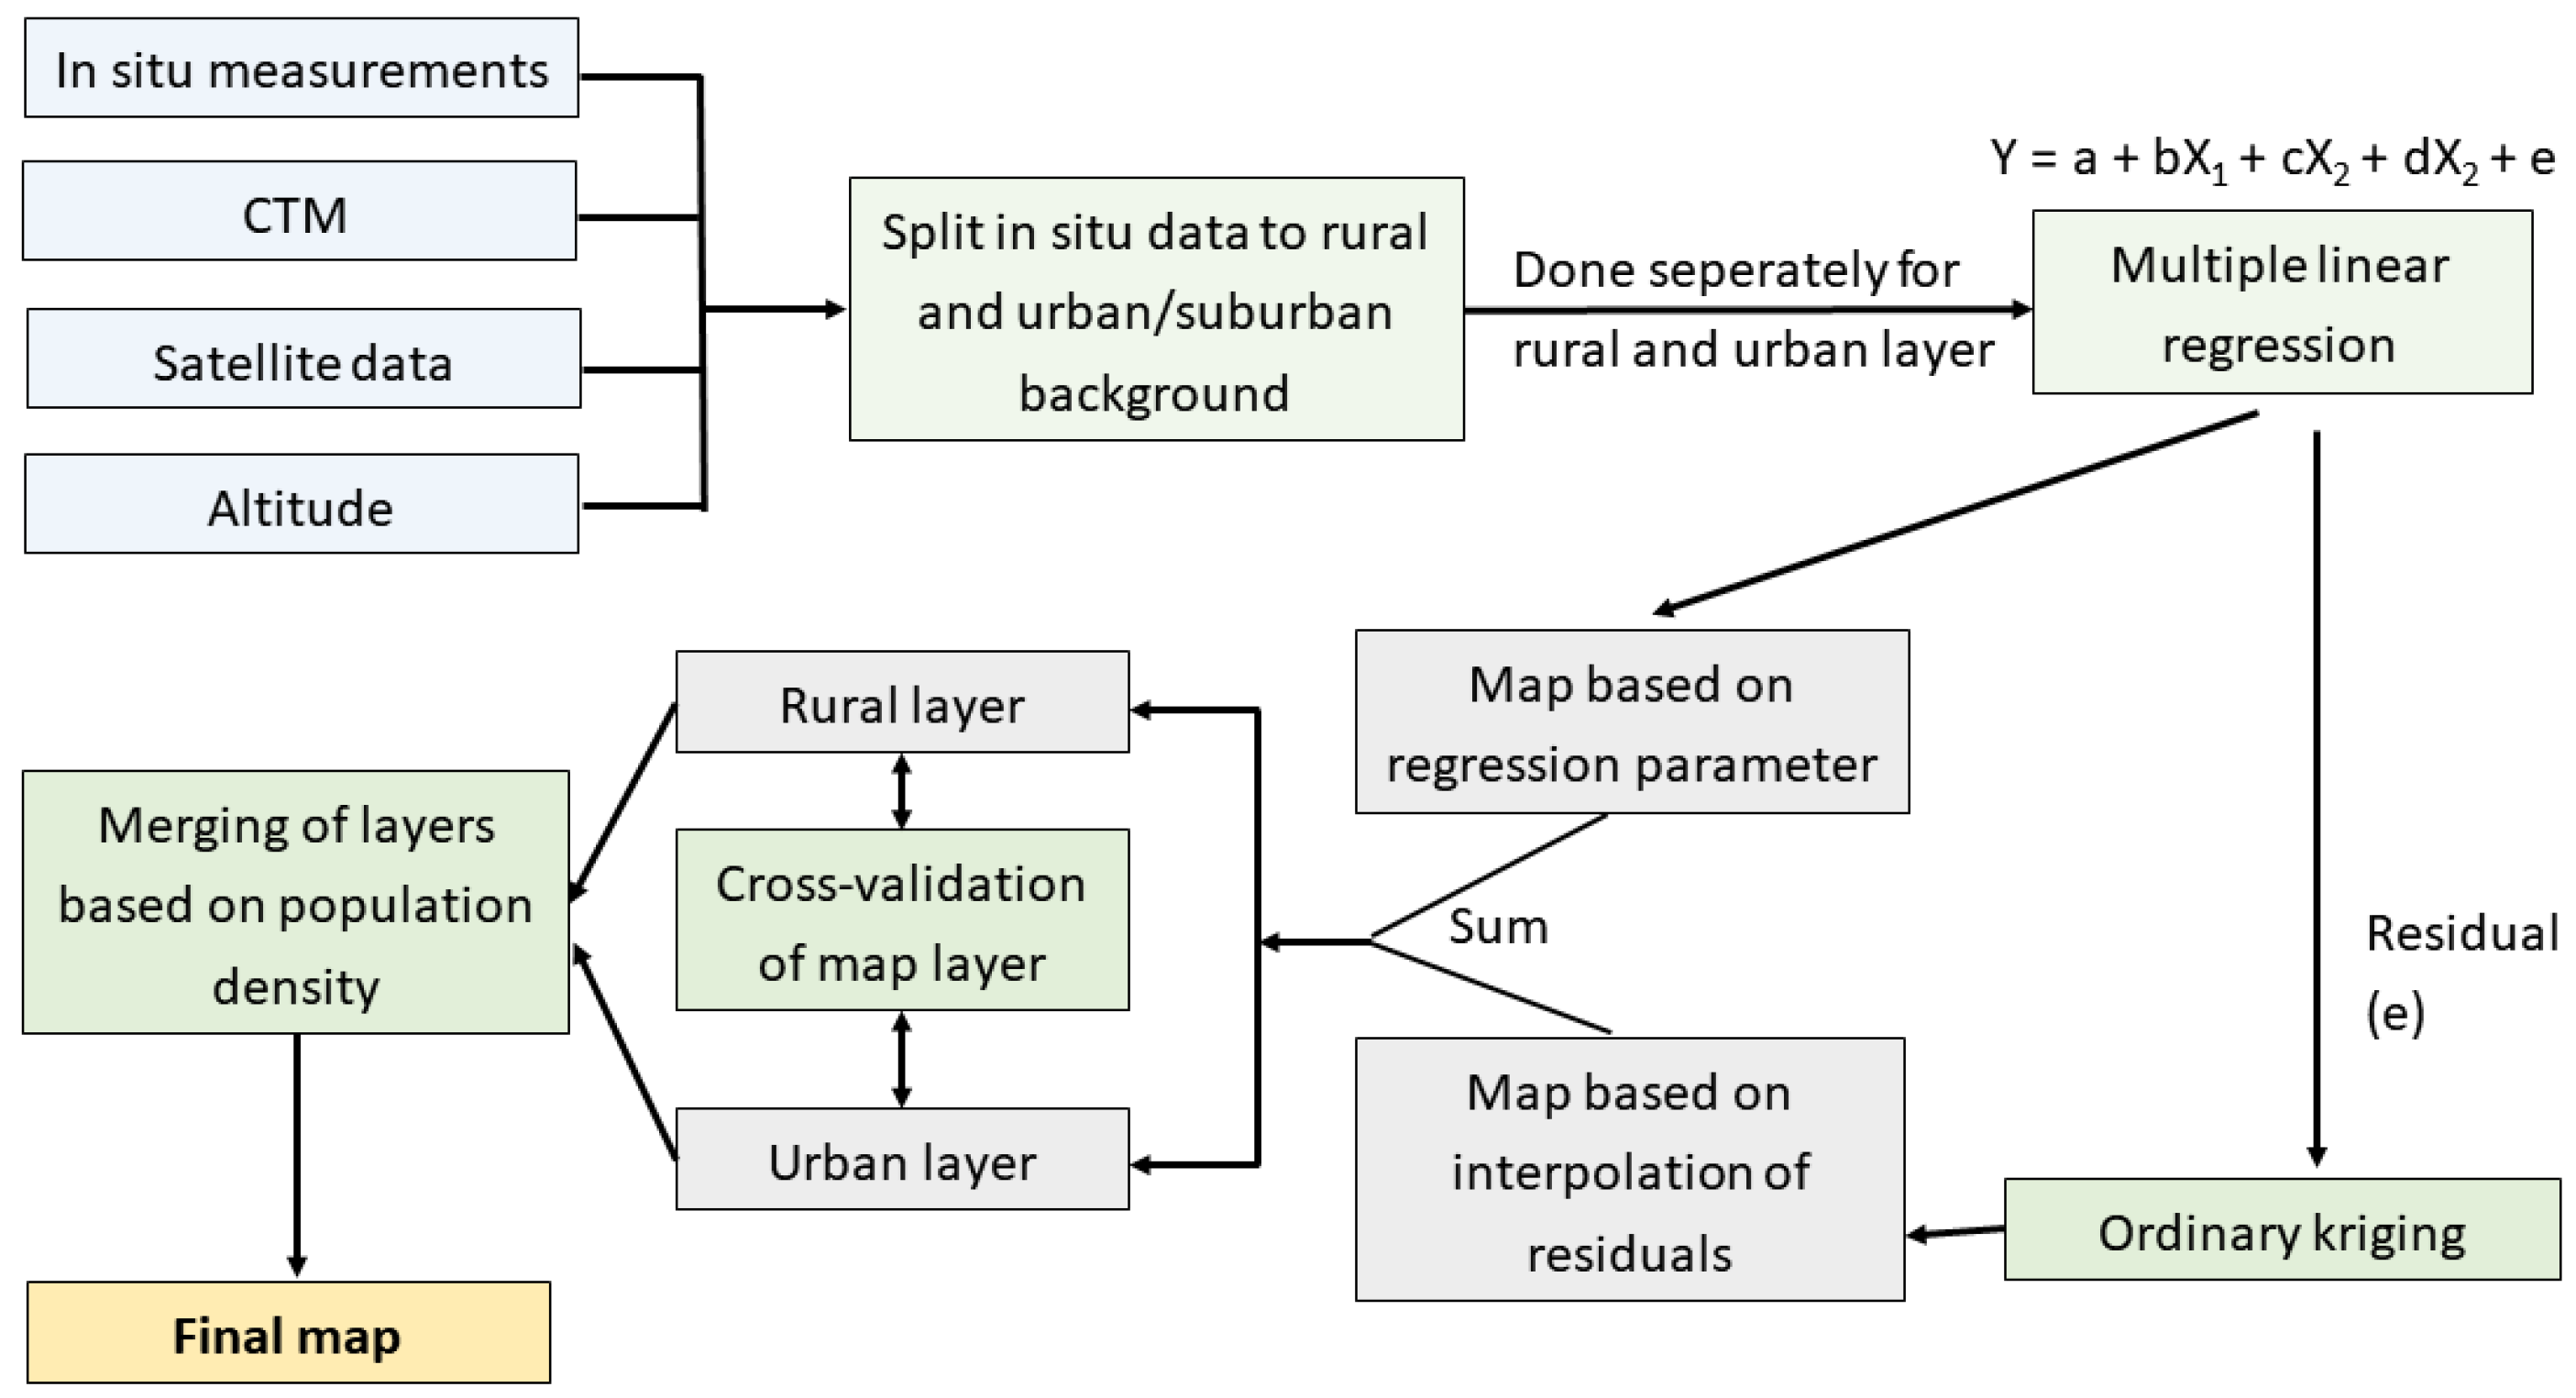
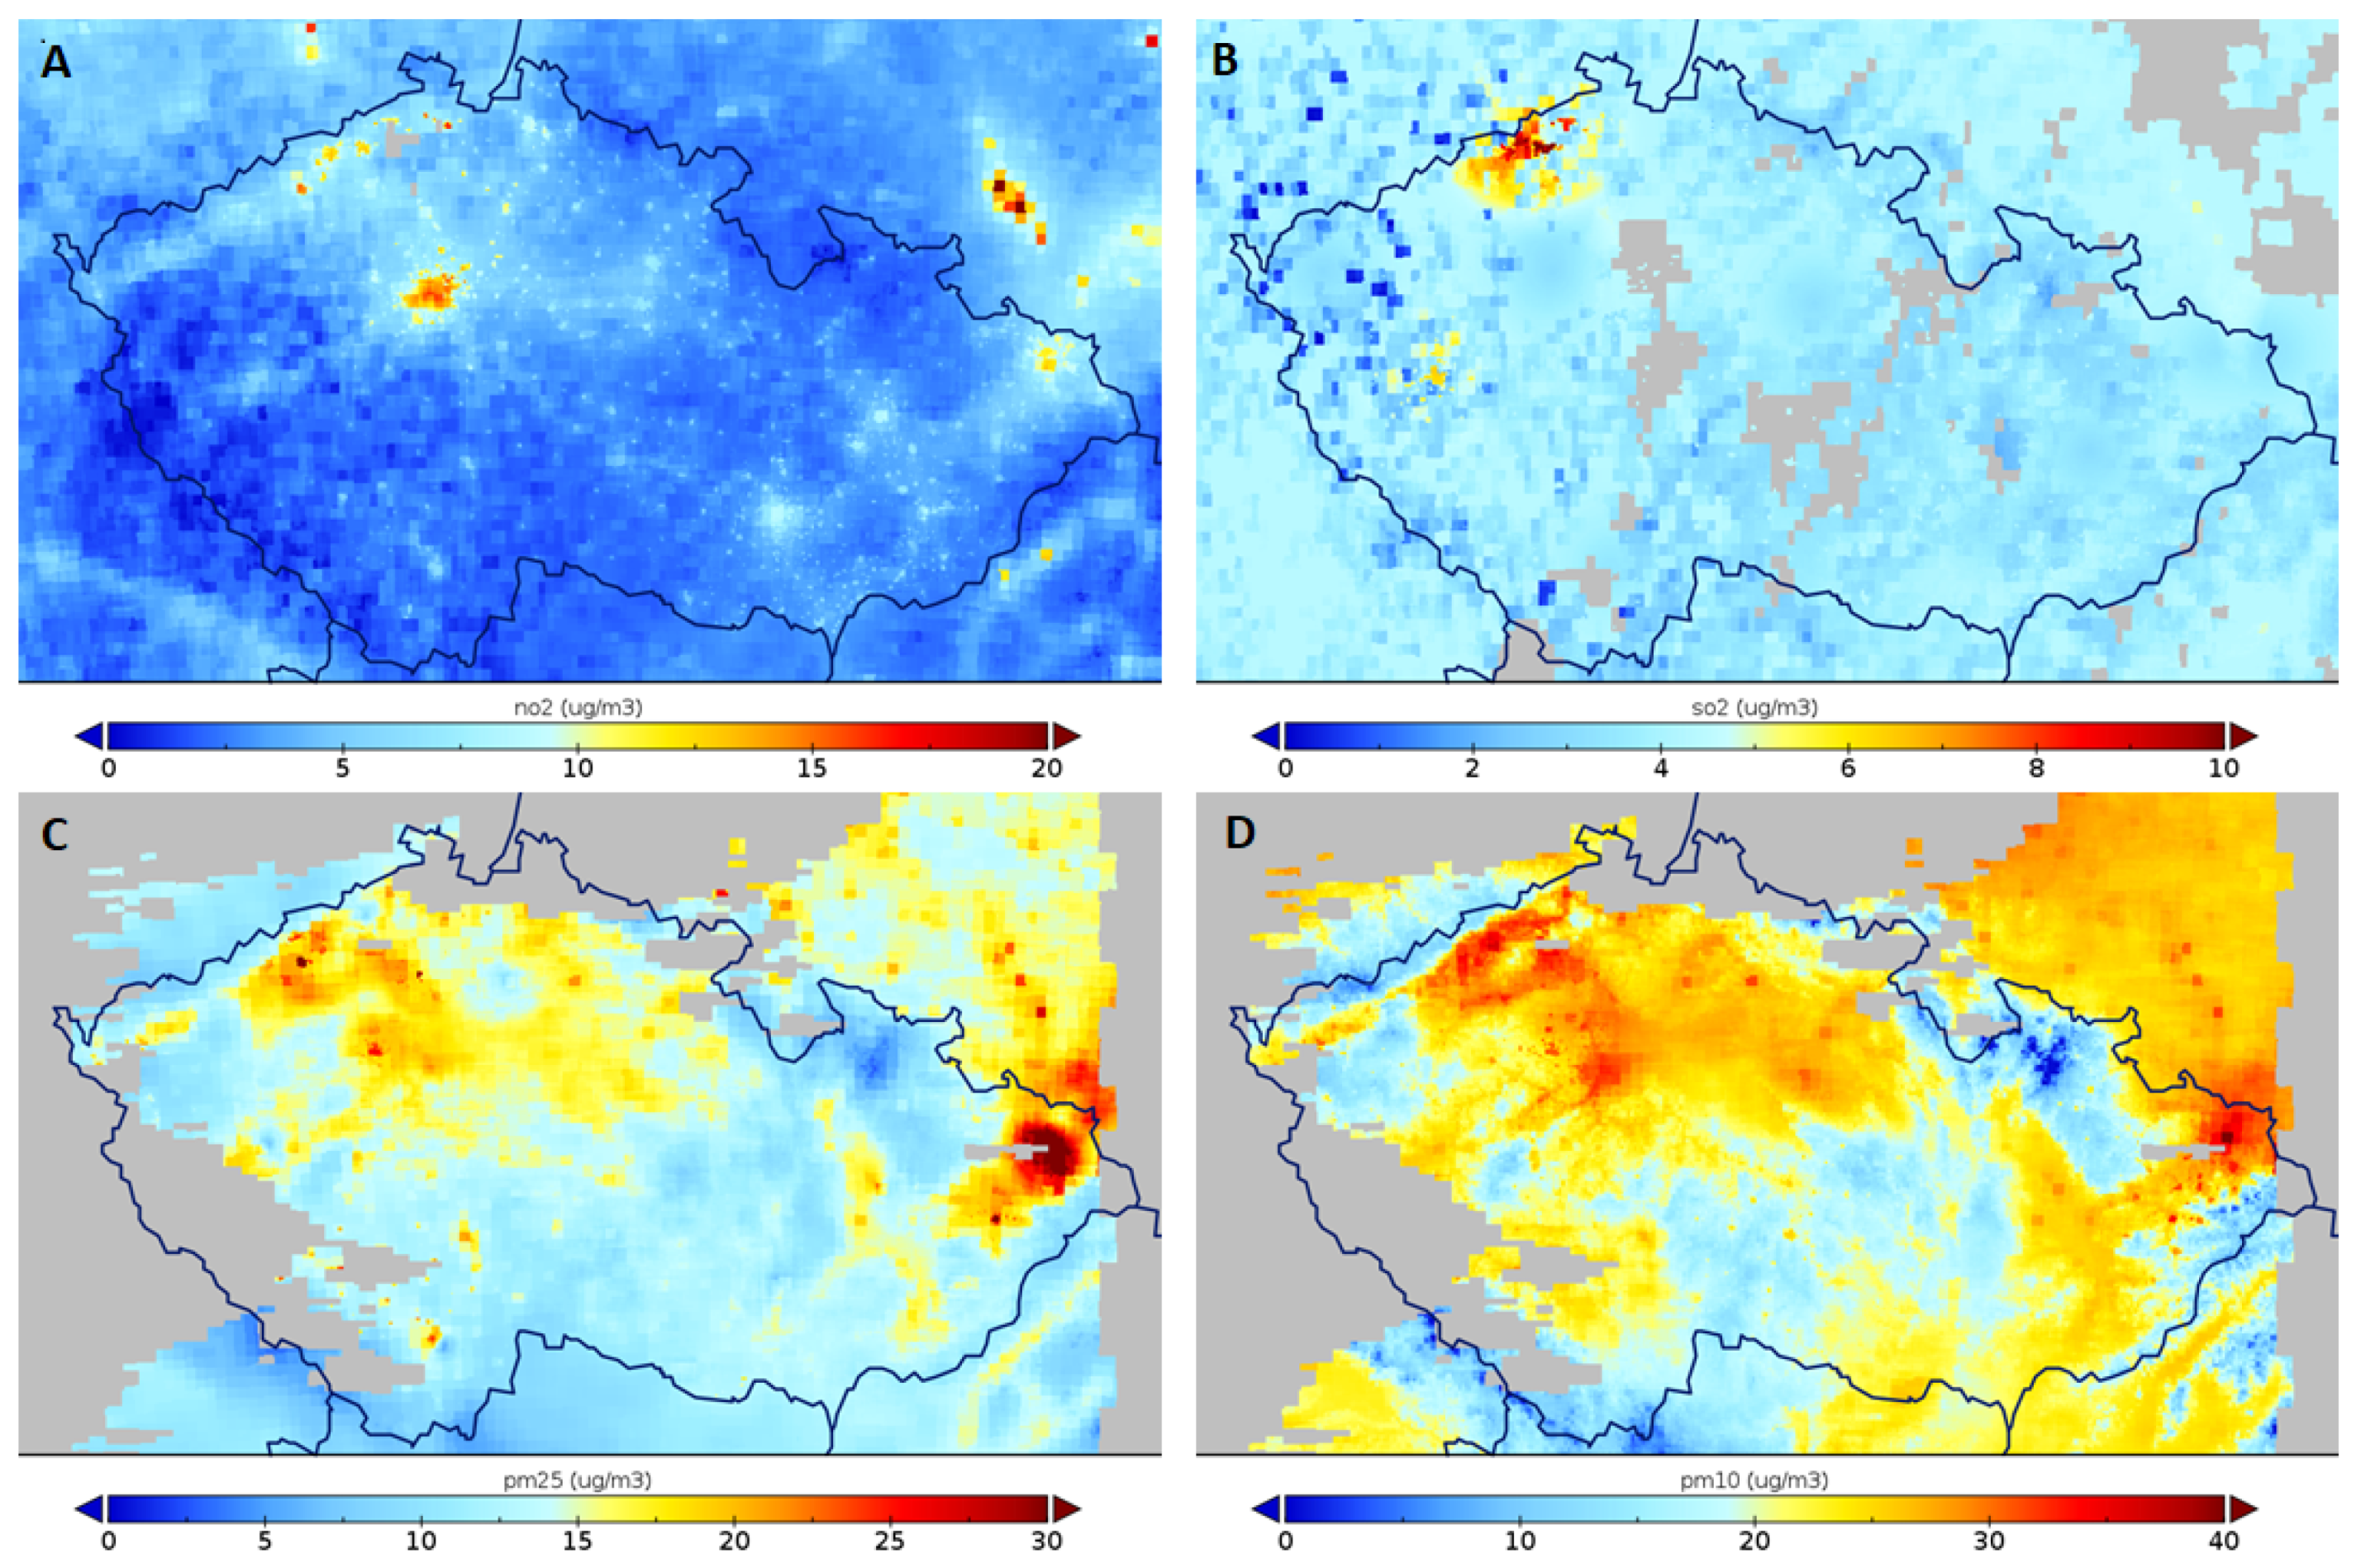
2.3. Data Fusion Methodology

The data fusion methodology used for SAMIRA is illustrated in Figure 4. It is a variant of the regression–interpolation–merging mapping [50,51], which is an improved residual kriging method. Residual kriging is a frequently used data fusion method [52]. In residual kriging, monitoring, modeling and other supplementary data are combined in multiple linear regression and subsequent spatial interpolation of its residuals is done by ordinary kriging [53]. Separate map layers were created for rural and urban background areas on a grid at a 1 × 1 km2 spatial resolution. The rural layer was based on the rural background stations, while the urban layer was based on the urban and suburban background stations. Residual kriging was applied separately for the rural and urban background areas with the subsequent merging of these map layers by population density.
Air quality in situ data were acquired from the Czech national air pollution database, the air quality information system (AQIS) [54] and the EEA’s air quality e-reporting database [55]. Model data were acquired from three models: CAMx for the Czech domain at 4.7 × 4.7 km2 spatial resolution, WRF-Chem for the European domain (hourly and daily time steps) at 5 × 5 km2 spatial resolution and the European Monitoring and Evaluation Programme (EMEP) model [56] for the European domain (annual averages) at 10 × 10 km2 spatial resolution. Various satellite datasets were used. SEVIRI AOD from SAMIRA (temporally aggregated into hourly and daily time averages) was used for the creation of data-fused PM2.5 and PM10 maps. The PM2.5 product from SAMIRA was used for data-fused PM2.5 maps. NO2 and SO2 from OMI, complemented by data from the Global Ozone Monitoring Experiment–2 (GOME-2), were used for the development of historical test data for 2014. NRT NO2 and SO2 data were obtained from TROPOMI. Supplementary datasets needed were altitudes from the database ZAGABED prepared by the Czech Office for Surveying, Mapping and Cadastre (https://geoportal.cuzk.cz/) and Global Multi-resolution Terrain Elevation Data 2010 (GMTED2010) [57]. Merging of the rural and urban map layers was done using population density based on Geostat 2011 grid dataset [58] and data from the Czech Office for Surveying, Mapping, and Cadastre.

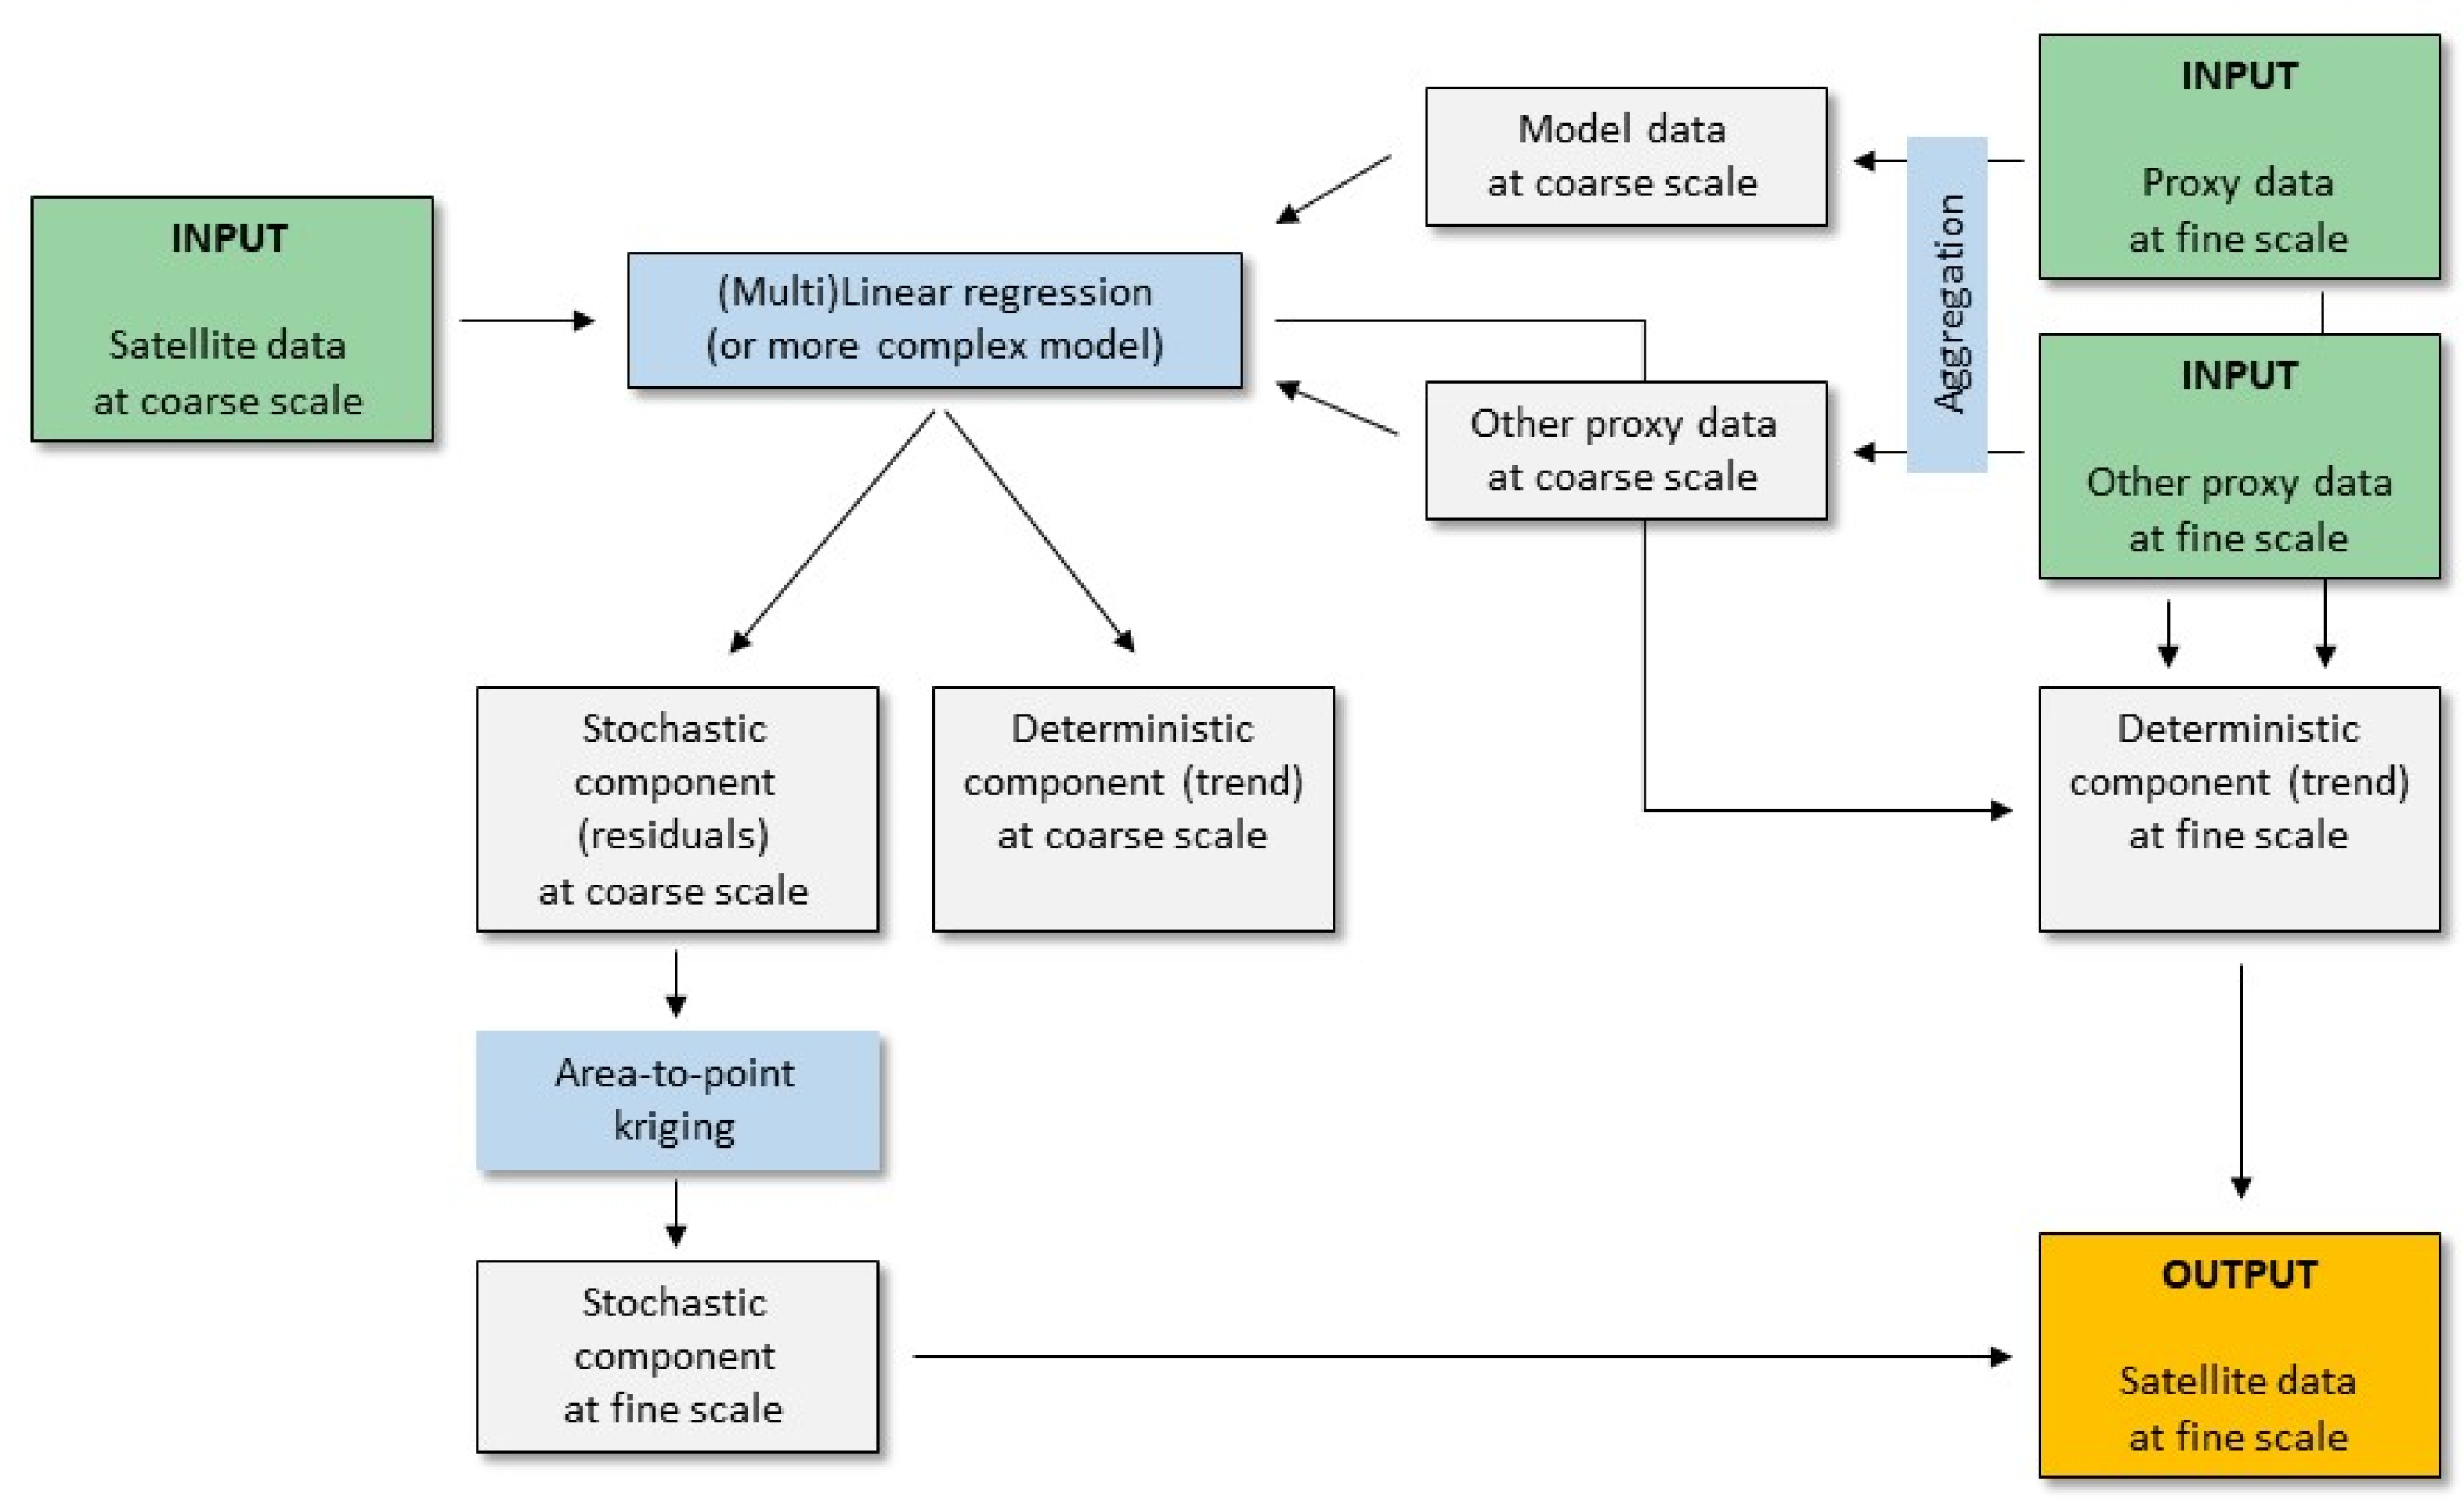
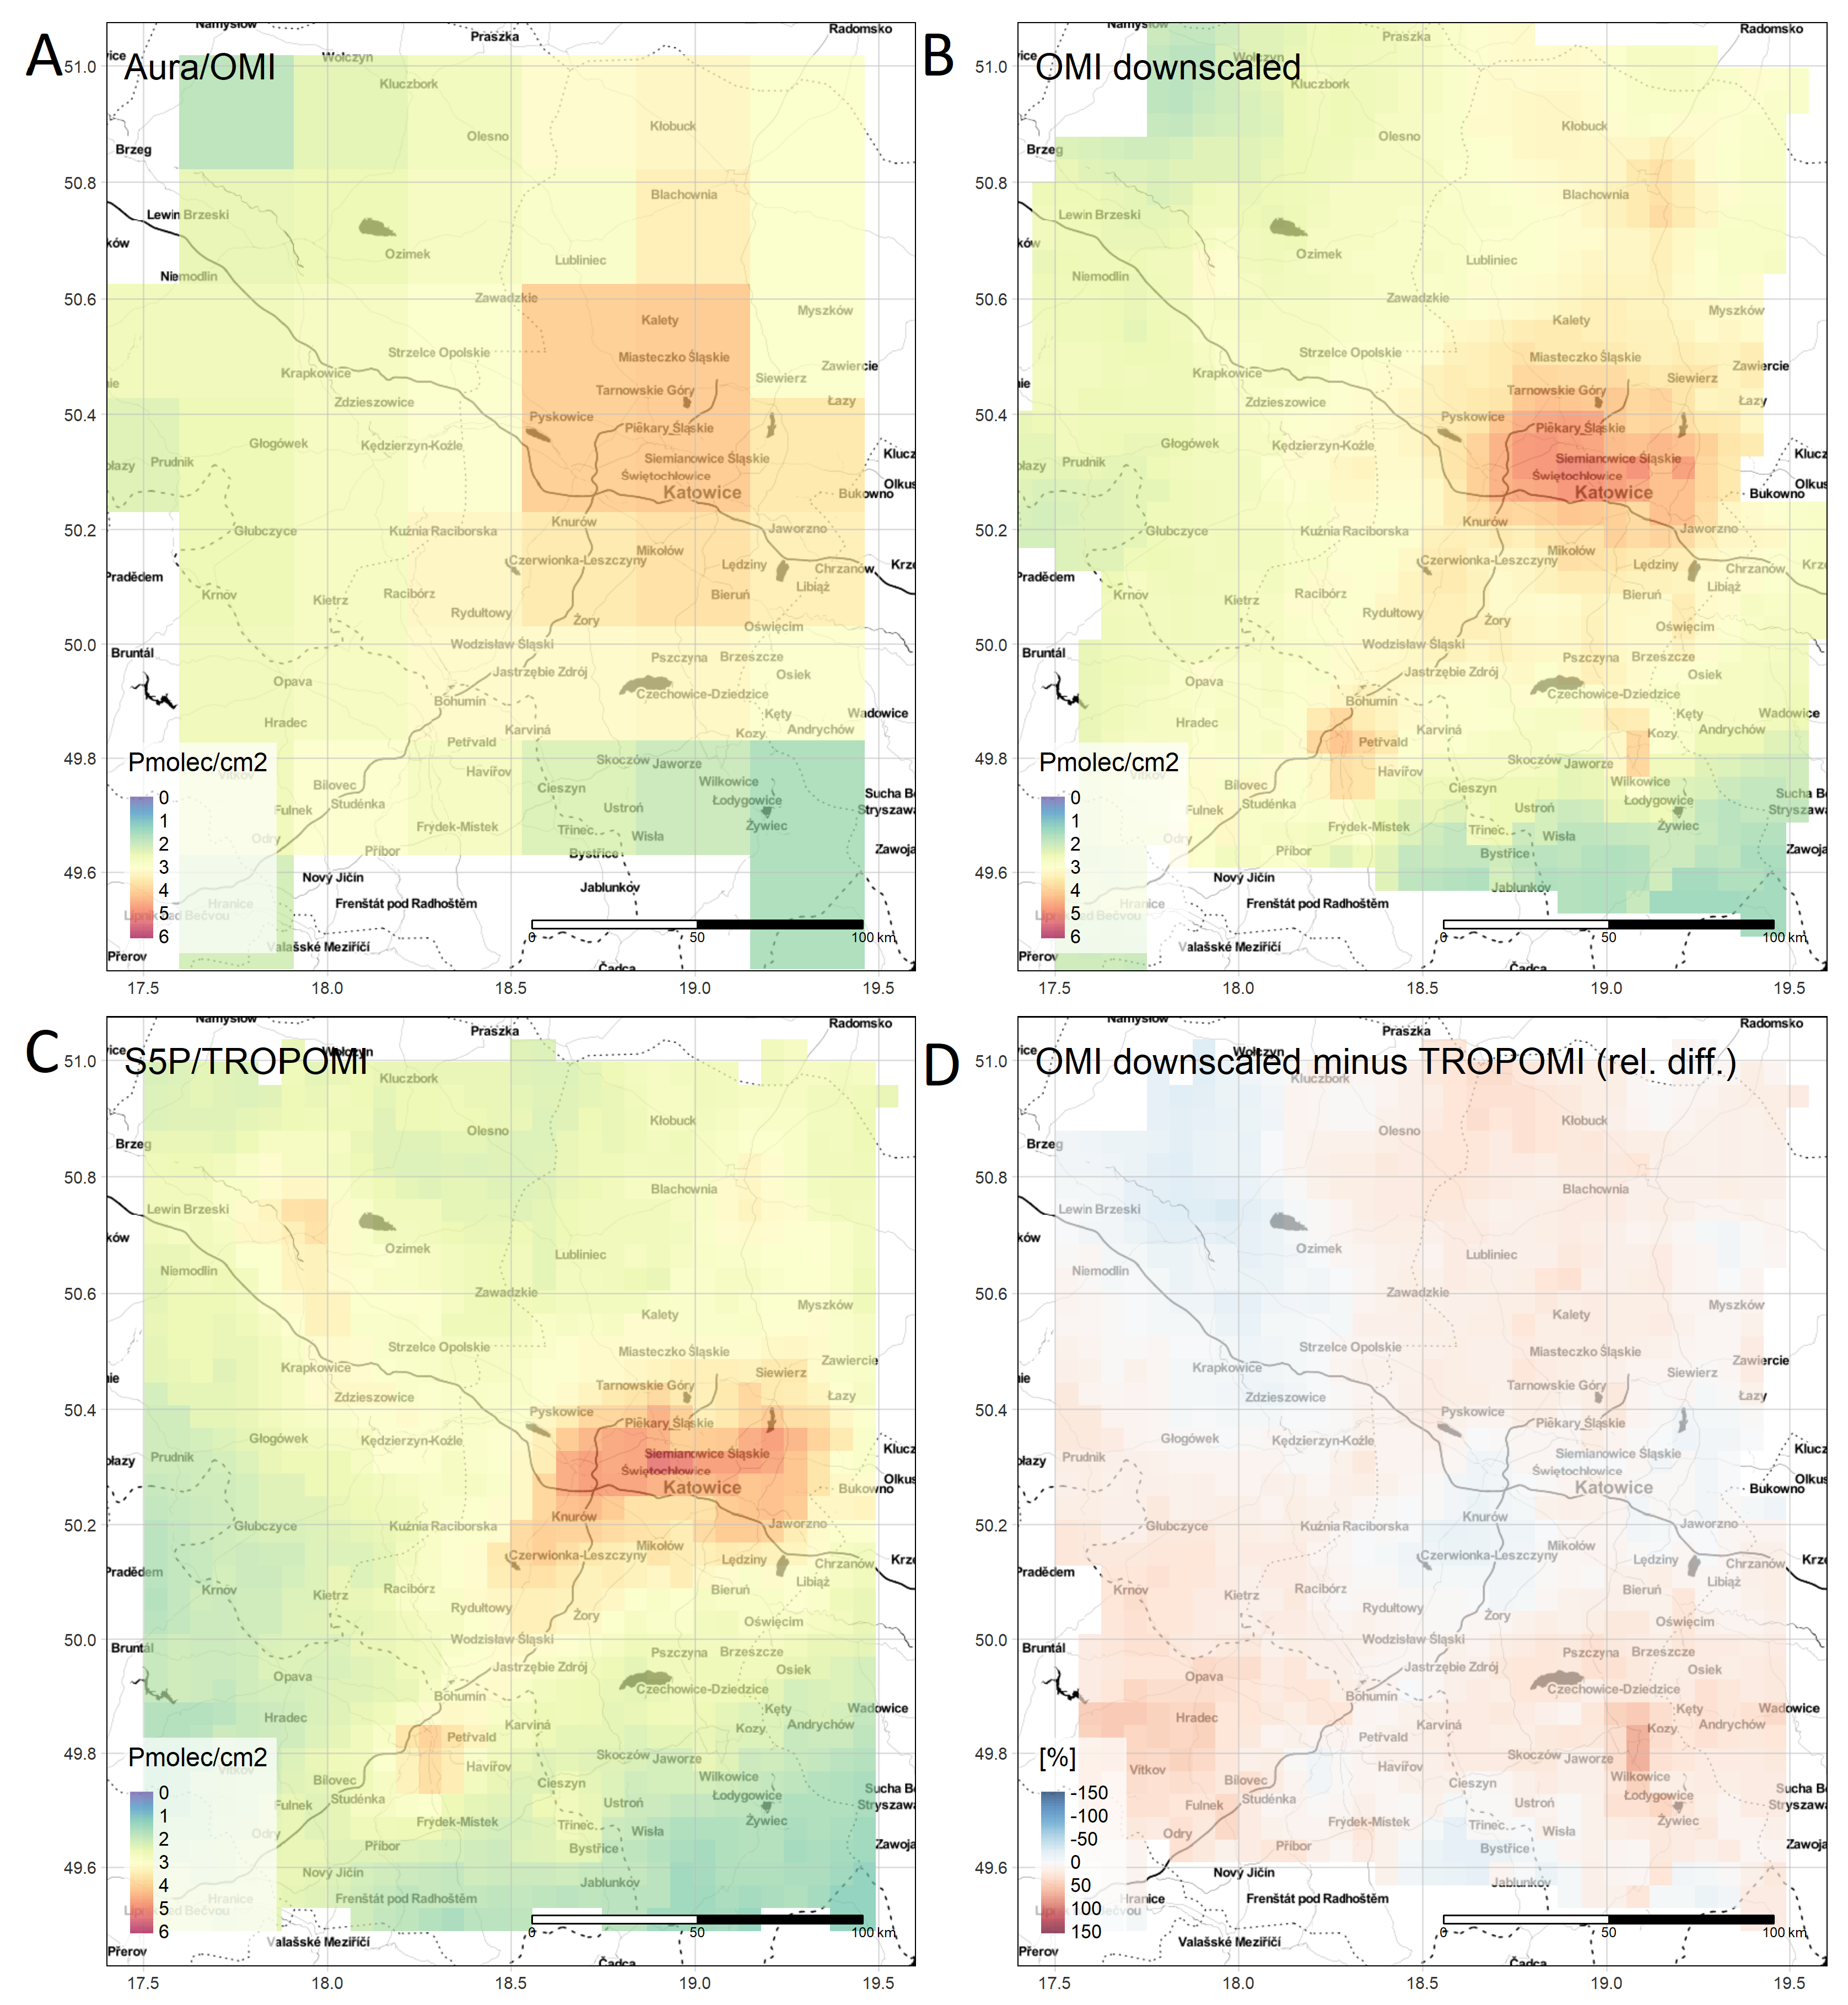
2.4. Downscaling Methodology

The downscaling methodology used for SAMIRA is, just like many other downscaling techniques, essentially based on increasing the spatial resolution of a coarse source dataset (in our case satellite data of air quality) with the help of spatial proxy or auxiliary datasets that are available at a fine spatial resolution and that are, to some extent, correlated with the source dataset. As such, the technique makes use of the assumption that the spatial patterns of the unknown fine-scale field of the source variable will be similar to the spatial patterns of the fine-scale proxy datasets.
Figure 5 illustrates the SAMIRA downscaling methodology. In simplified terms, the various input datasets were brought to the same coarse resolution and a statistical model was fitted to directly relate the satellite and the proxy data. The model choice was arbitrary and could range from simple linear regression models to more advanced non-linear models such as random forest or similar. Subsequently, the spatial residuals from the model were calculated, downscaled to the fine target resolution using area-to-point kriging [33], and added to the deterministic trend component of the fitted model.

2.5. In Situ PM10 Assimilation

For completeness, the SAMIRA pre-operational in situ PM10 air quality data assimilation forecast system should be mentioned. Based on the prototype system developed in the ESA SiAiR project (2014–2015) [59], the WRF-Chem model was setup to run at 5 km horizontal resolution, covering most of Europe. The emission pre-processor was developed by the Central Institute for Meteorology and Geodynamics (ZAMG) in order to prepare data from emission inventories for WRF-Chem. Emissions were taken from the TNO-MACC II emission inventory [60] and the EMEP inventory (http://www.ceip.at/ceip-reports, accessed on 30 October 2018) for areas not covered by TNO emissions. This development was a first step towards a full air quality data assimilation system for Romania. It was designed to allow extension to other observational datasets. Thus, adding processor(s) for Sentinel 3, Sentinel 5P, and future missions is desirable.

3. SAMIRA Product Examples

In the following we show exemplary data products developed during the SAMIRA project.

3.1. SEVIRI AOD

As a first example, SEVIRI NRT AOD and AOD uncertainties for Poland for four consecutive retrievals in the morning of 5 June 2019 are shown in Figure 6. During that day an interesting case of strong aerosol loading was observed over Poland. AOD rising by the hour are clearly captured. AOD at 635 nm is increasing starting from below 0.1 at 05:00 UTC to above 0.3 at 08:00 in Central and Eastern Poland. More maps from that day are available via www.polandaod.pl (accessed on 5 June 2020).
To better understand the development of the AOD, we looked at complementary data. HySplit trajectories indicate air-mass inflow to Poland from Eastern Europe (see Figure 7A), passing over areas with wildfires (FIRMS Firemaps; https://firms2.modaps.eosdis.nasa.gov, accessed on 5 June 2020, not shown for brevity). The PollyXT LIDAR (http://polly.tropos.de), which is located at the Remote Sensing Lab in Warsaw, showed high values in the LIDAR signals up to 4 km of altitude, with a clear gradual increase after 5:00 UTC (Figure 7B). The co-located AERONET sun photometer (Level 2.0 Direct Sun and Level 1.5 Version 3 Inversion data; https://aeronet.gsfc.nasa.gov, accessed on 5 June 2020, Figure 7C) showed the highest increase in AOD for shorter wavelengths with almost unrecognizable change for the longer ones. It indicates that the observed aerosol was dominated by small particles, resulting in relatively high Ångström exponents (1.8–1.9), typical for biomass burning aerosol. This is consistent with the increase in AOD seen in the calculated SEVIRI AOD maps. The aerosol size distribution derived by AERONET was dominated by the fine mode particles (fine mode fraction >0.8). The situation changed in the afternoon, when size distribution between the modes was more equal (fine mode fraction around 0.6) and precipitable water vapor column decreased, leading to lower AOD. The change in AOD was also captured by the SEVIRI NRT AOD retrieval for the afternoon; although more cloud appeared over Poland area (not shown for brevity).

3.2. Satellite-Based PM2.5 Retrieval

As a second example, the PM2.5 retrieval for September 17, 2014 is shown in Figure 8. Historical data from summer 2014 was used to test and validate our methodology to retrieve ground-based PM2.5 from satellite AOD. The data shown in Figure 8 are the PM2.5 related air pollution in the morning of 17 September 2014, at 07:00 UTC. Besides the aggregated hourly AOD, a map of the AOD-to-PM2.5 conversion factor and a map showing the calculated hourly averaged PM2.5 for Poland is shown (Figure 8A–C). The closest in time AOD maps (15-min resolution) were cloud-screened (white areas on the map). The conversion factor map has the resolution of the WRF-Chem output (1-h). The final PM2.5 concentrations map for Poland combines the two. For comparison, the PM2.5 WRF-Chem model output and the difference between the calculated and the modeled PM2.5 is shown (Figure 8D–E).
PM2.5 values estimated with the WRF-CHEM model are a good starting point for air quality mapping due to the ability of the model to capture the seasonal or annual variations of aerosols well. The major downside is the fact that it does not represent well random pollution events and only takes into account documented sources. The differences between the WRF-Chem output and our method clearly show that the “smooth” gradients produced by the CTM are far from what the spatial aerosol patterns visible in the AOD shows, which can improve the ground-level PM2.5 estimates. See also Section 4.2 for PM2.5 validation.

3.3. Data Fusion Maps

A third example shows output from the data fusion. The methodology was developed and tested first on historical data, including in situ data, CTM model output (CAMx, WRF–Chem, EMEP), and satellite data (SEVIRI AOD, satellite-based PM2.5, as well as NO2, and SO2 from OMI and GOME-2) to generate maps for the following pollutants: NO2, SO2, PM2.5, and PM10. In a second phase of the SAMIRA project the data fusion was run in near real time to generate up-to-date hourly maps utilizing NO2 and SO2 from TROPOMI. Note that for 2019 WRF-Chem data were not available due to technical problems with the UBB high performance computer, therefore, SEVIRI AOD was used as proxy for the data fusion of PM. As an example, in Figure 9 we show NRT air quality maps for the Czech Republic. Maps of NO2, SO2, PM2.5, and PM10 at different temporal slots are shown to illustrate the data fusion results.
The SO2 map shows increased concentrations in the north-eastern Bohemia. In both PM10 and PM2.5 maps, elevated concentrations around Prague, in the north-western part of Bohemia and in Ostrava region can be seen. The same areas show also increased NO2 levels, although the increase is less distinct were compared to PM. The data fusion maps well represent the concentration levels across the given area and correspond to the expected concentrations due to known pollution sources [61]. Both satellite and modeling data provide spatial representation, while the in situ measurement data assures the levels are not biased. The main limitation of these maps is caused by missing satellite data in the clouded areas. This can be overcome by a gap filling, e.g., using data calculated based on the in situ measurement and model data only.

3.4. Downscaling

Within the SAMIRA project a downscaling algorithm was developed and tested for several study sites (Oslo, Warsaw, Prague, Bucharest, Ostrava/Katowice), time periods (mostly 2014 and 2018), and pollutants (primarily NO2 and AOD). As a final example, in Figure 10 we show downscaling results for the area along the border between the Czech Republic and Poland that traditionally have significant problem with air quality. An OMI dataset representing the NO2 average for July through September 2018 at a spatial resolution of 0.25° by 0.25° was downscaled to the same resolution as TROPOMI (here gridded to 0.05° × 0.05°). This allows for comparing the downscaled OMI dataset with the “true” high-resolution TROPOMI measurements and to both quantitatively and qualitatively evaluate the correspondence between the two datasets, and, thus, the performance of the downscaling algorithm, as well as the used proxy. Qualitatively, Figure 10 indicates that the downscaling technique is able to bring out spatial detail that was not available in the original coarse-resolution OMI dataset. For example the elongated east–west extent of the hotspot in the center of the domain and smaller isolated hotspots related to local pollution. This can be seen for the entire area around Katowice but also for the hotspot in the southwest of the domain south of Bohumin that is visible in both the downscaled OMI dataset, as well as the TROPOMI data. Note that, with levels of 5–6 × 10¹⁵ molecules cm−2, the downscaled dataset provides accurate estimates of the actual tropospheric column amounts of NO2 over the Katowice area that are very close to those actually measured by TROPOMI at high resolution, even though the actual OMI-observed values were significantly lower due to the averaging over the area of coarser pixels. Later on, in Section 4.4, we will show further quantitative results of the same datasets.
There are some limitations of the method which result in patterns that were not observed by TROPOMI. For instance the area in the northwest of the domain north of Krapkowice that shows a clear hotspot in the TROPOMI dataset is somewhat underestimated in the downscaled dataset. The reason for this is not entirely clear because the small hotspot observable in the TROPOMI dataset is large enough that it should also be picked up by the OMI instrument to some extent. It is visible in the downscaled map as a small area of increased tropospheric NO2 columns, but the values are significantly lower than those in the TROPOMI map. A similar issue can be seen in the area south of Katowice in the Kozy area where the downscaled map show a clear hotspot, but this hotspot is not present in the TROPOMI dataset. The original OMI values in this area are generally higher than TROPOMI.
It is important to note that while the the downscaling technique uses a high-resolution proxy dataset, the downscaled values are entirely constrained by the original satellite measurements, i.e., if the downscaled results are re-aggregated to the coarse resolution, the corresponding values will match exactly the original OMI observations. The use of OMI for downscaling in this example was entirely driven by the possibility to have a high-resolution reference with the TROPOMI data. Although we cannot demonstrate it here, due to the lack of very high resolution reference data, initial experiments with downscaling TROPOMI indicate that the methods has significant potential for also downscaling TROPOMI to even higher spatial resolutions.

4. Validation Results

Validation was an essential part of SAMIRA and is essential to understanding the achievements made. It was part of the algorithm developments, as well as done independently. Due to the nature of the different data sets, the validation approach had to be different for the various products. SAMIRA data products, reference data, and approaches used for validation are summarized in Table 1.

4.1. Validation of SEVIRI AOD

For the validation of SEVIRI AOD the historical data from June–September 2014 were used. They were compared with data from AERONET, the Poland-AOD network, and the 3 km AOD product (at 550 nm) from the moderate resolution imaging spectroradiometer (MODIS) [62,63]. The latter was chosen despite its lower accuracy compared to the 10 km MODIS AOD data, because of its better comparability to the spatial resolution of SEVIRI (5.5 × 5.5 km2). In 2014, AERONET measurements were made at four stations in Romania and at two locations in Poland using the CIMEL Electronique 318A sun photometers (675 nm). The Poland-AOD network measurements were done at three stations with the multifilter rotating shadowband radiometers MFR-7 radiometers (613 and 674 nm). In Table 2, the comparisons between SEVIRI AOD data at 635 nm and AOD from the ground-based sun-photometer are shown for closest matches within 15 min. For the SEVIRI – MODIS comparison one hour was used as a temporal co-location criteria. An AOD value of 0.15, which is the recommended threshold for `clean’ reference days, was used as a lower limit for the comparisons [42].
The country averaged correlation coefficient (R) between AOD from SEVIRI and AOD from the ground-based stations varies between 0.61 and 0.62 with a mean bias between 0.09 and 0.12. The bias differences are only in small proportion influenced by the different wavelengths at which the data were collected (10−2 order of magnitude). We found varying correlations values between individual sites, which can be explained by different reflectance values specific to the land use classes within the satellite pixel. SEVIRI AOD did not correlate as well as with the 3 km AOD product from MODIS, with R and biases between 0.32 and 0.39, and 0.07 and 0.11, respectively. Detailed validation results for the individual AERONET and Poland-AOD sites, as well as map comparisons between SEVIRI and MODIS AOD, are given in [64].

4.2. Validation of Satellite-Based PM2.5

The reference data for the validation of satellite-based PM2.5 concentrations were PM2.5 observations from the ground–based national air quality networks. When validating satellite derived PM, it was found important to take into consideration details related to the location of the measurement sites. This is illustrated in Figure 11. Sub-pixel variability, e.g., half of the pixel is forested area and the other half is in a urban area, or close-by localized emission sources can have the effect that in situ stations are not being representative for the satellite pixel. Although homogeneous urban areas such as the one shown in Figure 11A were found to be proper validation sites, coastal stations (Figure 11B) were not, because marine aerosol was not included in our model.
Validation was done separately for the three countries. For Poland and the Czech Republic, 36 and 35 ground stations, respectively, had reported hourly values of PM2.5. For Romania only daily means of PM2.5 at nine ground stations were available for the time period June–September 2014. After eliminating the non-representative sites, correlation coefficients between the satellite-based PM2.5 and the in situ station are 0.49 and 0.56 for the Czech Republic and Poland, respectively. This is significantly higher than the correlation between the WRF-Chem PM2.5 and the in situ station data (see Table 3). Note that for the correlation between WRF-Chem and the air quality sites there is basically no difference between the entire set of stations and the selected ones. For Romania no hourly PM2.5 station data were available, therefore, daily averages are given in Table 3.

4.3. Validation of Data Fusion Mapping Results

The validation of the data fusion mapping results is based on the ‘leave one out’ cross-validation method. It computes the quality of the spatial interpolation of residuals for each measurement point from all available information except from the point in question, i.e., it withholds one data point and then makes a prediction at the spatial location of that point. Data fusion analyses were executed for four pollutants, i.e., NO2, SO2, PM2.5, and PM10 for the Czech Republic, based on the 2014 dataset. For all pollutants, daily and hourly time steps were examined, while the annual time step was carried out for NO2, SO2 only due to the lack of annual PM or AOD satellite data. In Table 4, the root mean square error and biases are shown for rural and urban background areas separately. The results for annual NO2 and SO2 data can be found in Table 5.
Comparing the data fusion variants without and with the satellite data, we found that the inclusion of the satellite data improves the daily and hourly mapping results of NO2 in the rural areas. Although for hourly NO2 data there is an improvement noticed for rural background areas, this does not seem true for the urban environment (see Table 4). Including satellite NO2 data improved the annual data, both in the rural and in the urban regions (see Table 5). Looking at SO2, the inclusion of satellite data slightly improves both, rural and urban mapping results for hourly, daily and annual data. For PM10, SEVIRI AOD was used as a proxy, and the original 15-minute data were temporally aggregated into hourly and daily data. For PM2.5, two values are shown in Table 4, a. with SEVIRI AOD as proxy and b. using SAMIRA PM2.5 data. For daily PM2.5 mapping the results show largest improvement in rural areas when AOD was used and in urban areas when PM2.5 was included in the data fusion. The inclusion of satellite data (either AOD or PM2.5) can improve the results for PM10 and PM2.5 for the Czech Republic. However, it is important to note that the results for PM were calculated for a much smaller number of days (June–September 2014) than for NO2 and SO2 and did not include winter months.

4.4. Validation of Downscaling Algorithm

The downscaling algorithm itself was initially validated using synthetic data. Using simulated fields for testing the algorithm has the advantage that the fine-resolution truth is known, and the performance of the downscaling method can be evaluated accurately by comparing against the truth. Table 6 shows the corresponding summary datasets for each method. The SAMIRA method (area-to-point kriging with a covariate) outperforms all the other methods. In particular, the root mean square error (RMSE) decreases significantly for area-to-point kriging with a covariate.
In addition, the algorithm was validated using satellite data with higher spatial resolution. Figure 12 shows a comparison of original OMI NO2 (panel A) and the downscaled OMI NO2 (panel B) against TROPOMI NO2, the latter acting here as a reference. The overall scatter and the alignment with the 1:1 line is significantly improved after downscaling the OMI data. In fact, the R2 value shows a quite significant increase from 0.53 to 0.71. The results of the comparison are summarized in Table 7. It is evident that six out of seven summary metrics were improved by applying the downscaling algorithm to the coarse-resolution dataset.

5. SAMIRA Air Quality Data Mapping Portals

Since March 2019, up-to date hourly maps for NO2, SO2, PM2.5 and PM10 and daily maps for PM10 and PM2.5 were created operationally for the Czech Republic and the European domains. These, as well as the historical data from June–September 2014, were visualized with a custom-build responsive mapping portal. As an example, a map showing hourly averaged Czech NO2 for 23 November 2019 is shown in Figure 13. Furthermore, NRT AOD maps for Poland are shown on the Poland AOD network site (http://www.polandaod.pl/; in the Polish language version only). General background information about SAMIRA can be found on the project website https://samira.nilu.no.

6. Conclusions and Outlook

The SAMIRA initiative led to increase in knowledge and better exploitation of synergistic satellite-based air quality products. A distributed NRT system for satellite-based regional air quality was set up, thus successfully demonstrating a complex technical interplay between multiple research and operational institutions located in four European countries. Advances were made in the following research areas:
1. The SEVIRI AOD optimal estimation algorithm was improved and geographically extended from Poland to Romania, the Czech Republic and Southern Norway. Alongside AOD, pixel-level uncertainties were estimated. After testing for historical data (June-–September 2014), a NRT retrieval was implemented and is currently operational (for details see [42]). The benefit of using SEVIRI for air quality application is the possibility to obtain data with a high temporal resolution (15 min). The largest limitation of any geostationary AOD algorithm is related to the surface hot-spot effect for scattering angles close to 180° and a small solar zenith angle, limiting the retrieval to day-times up to 10:00 UTC and after 14:00 UTC. The exact range, however, depends on the time of the year and geographical position. A specific issue for the SEVIRI optimal interpolation AOD retrieval is the choice of the reference day (a clean day with low AOD and clear sky) and that the availability of regular ground-based AOD measurements is required. This hinders the retrieval for regions where no photometer data are available, as it was in the case for the Czech Republic. Due to the northern geographic location of Norway scattering geometry is unfavorable and clouds frequently obstruct the scenes, therefore AOD data for Norway are sparse. Validation against ground-based sun-photometers, located in Romania and Poland, using the data from 2014, showed generally good agreements with country mean correlation coefficients (R) between 0.61 and 0.62, a bias of 0.09–0.12, and an RMSE of 0.12–0.14, but did not correlate as well with the 3 km AOD product from MODIS. For more details see [64].
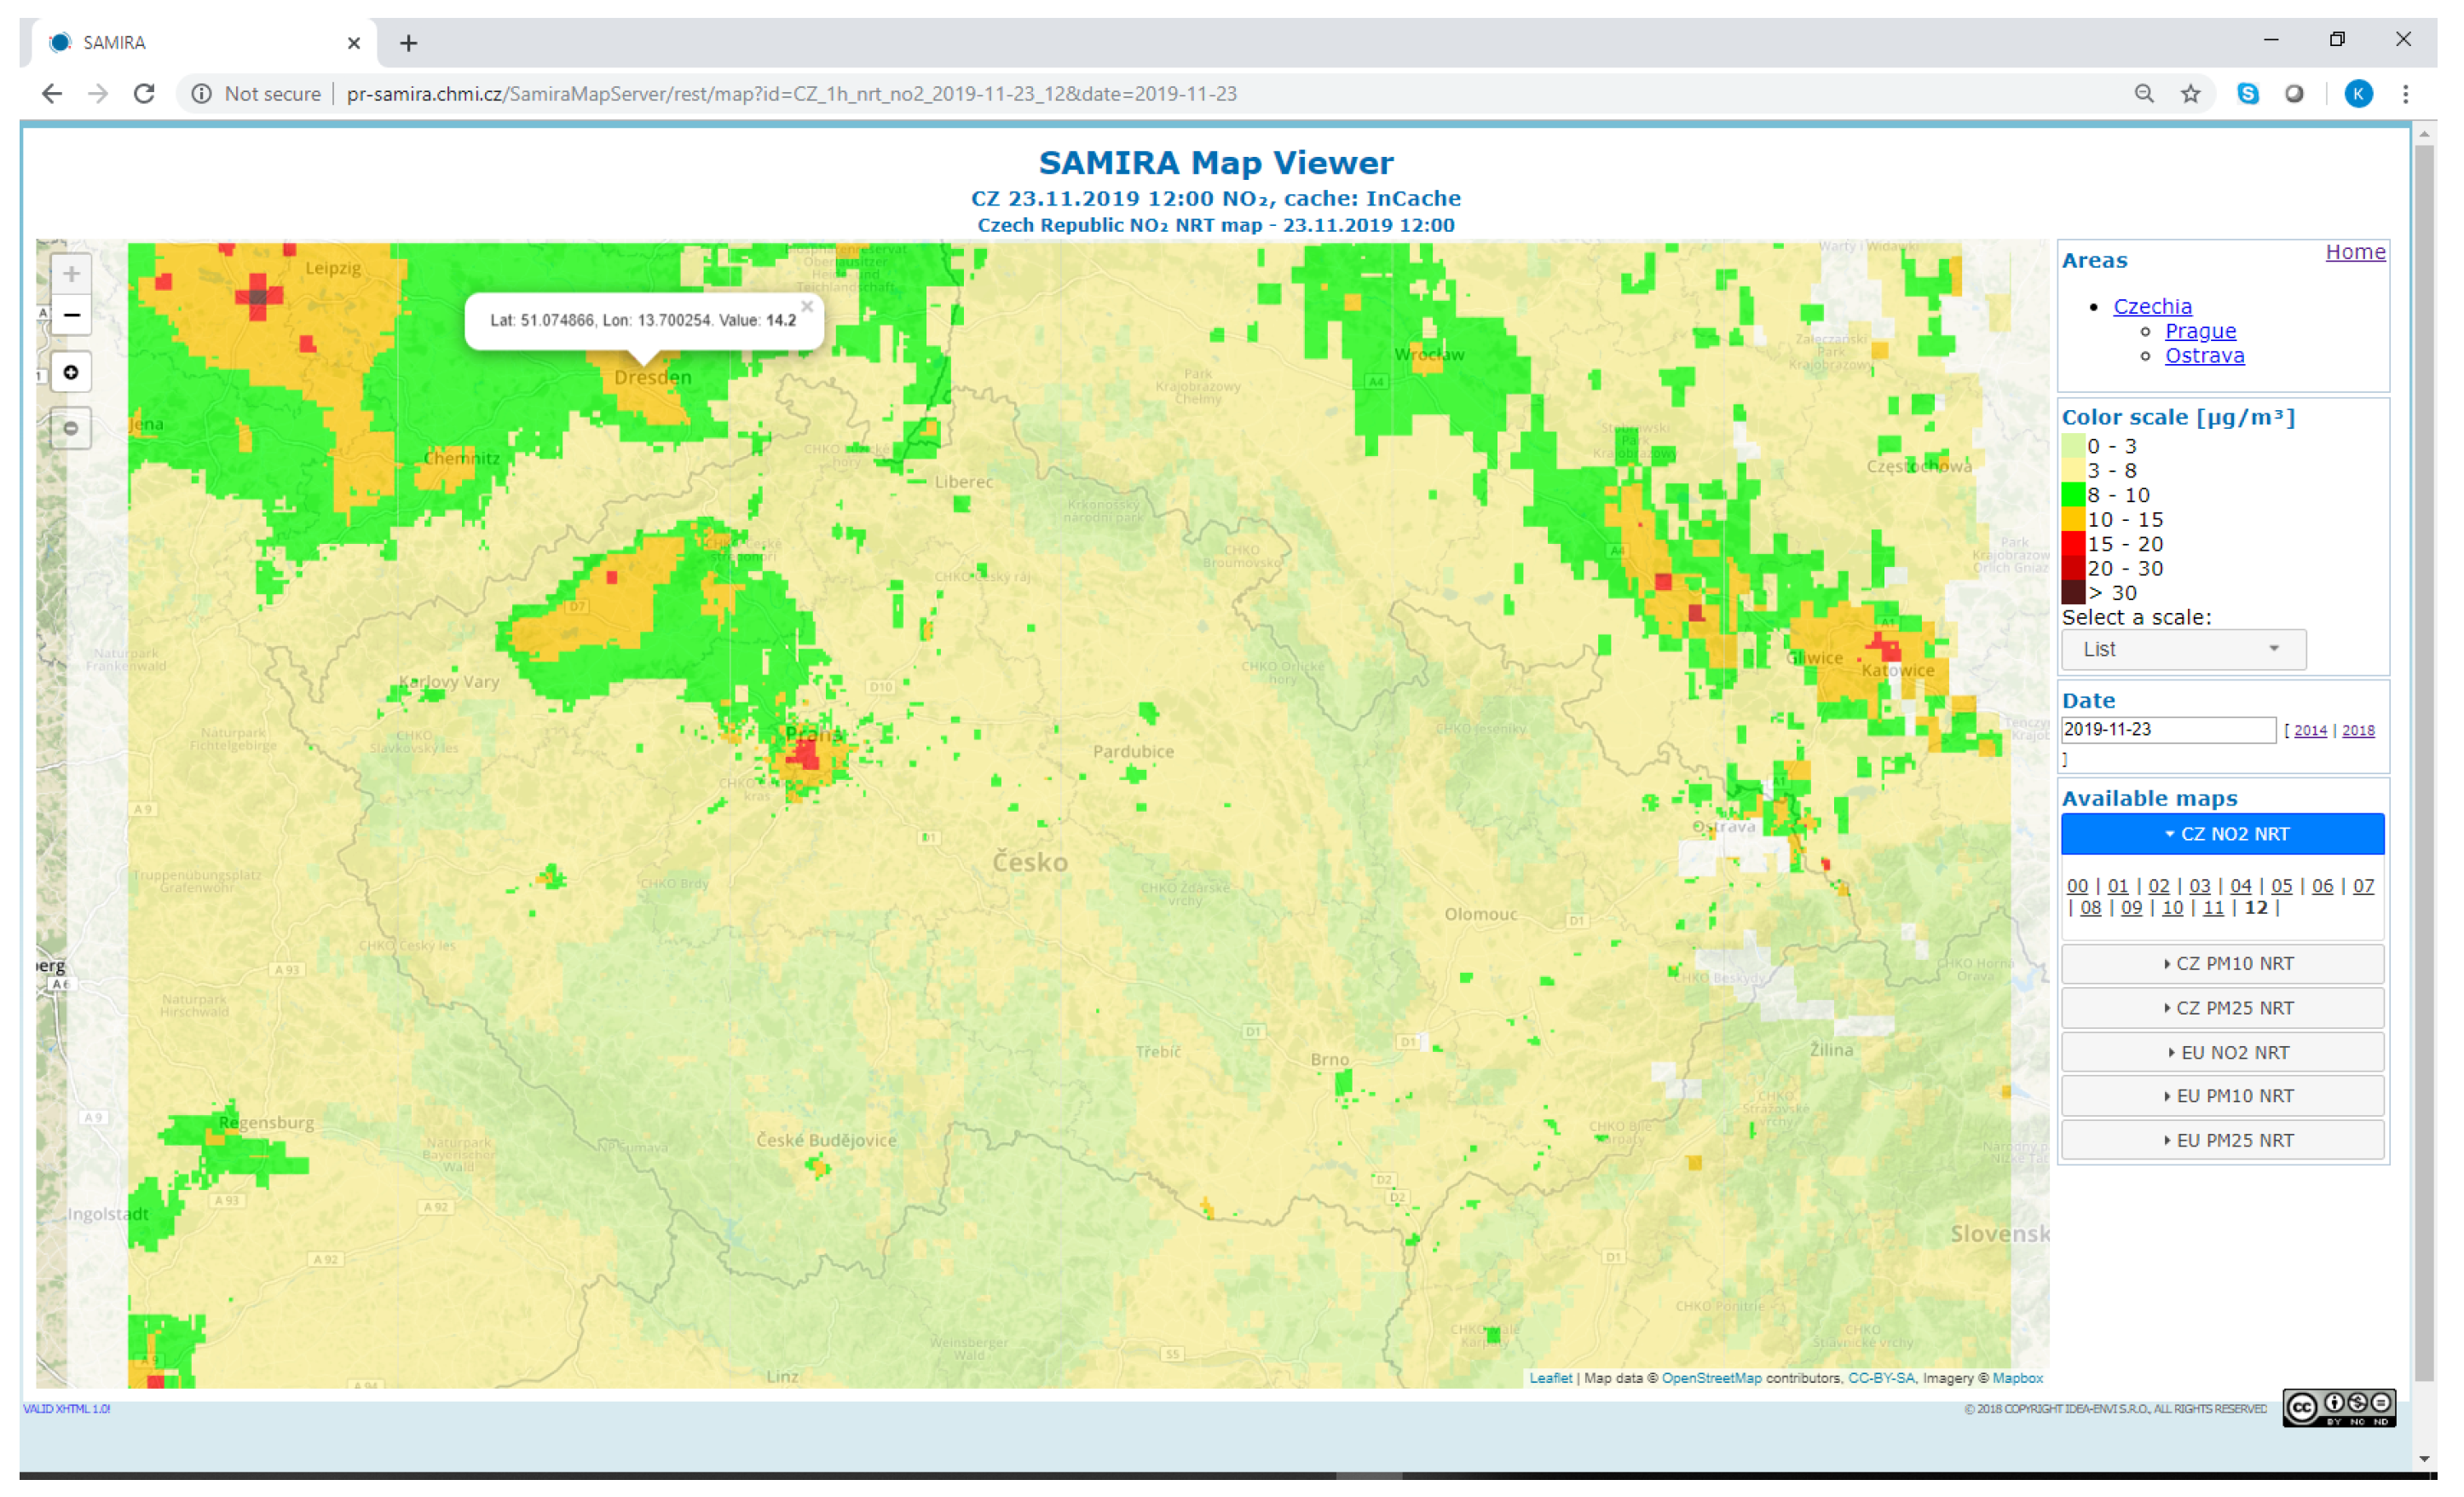
2. A retrieval for ground-level concentrations of PM2.5 was implemented using the SEVIRI AOD in a combination with WRF-Chem output. NRT capability for the AOD–to–PM2.5 retrieval was demonstrated. The satellite-based PM2.5 data product from our method was validated using ground-based in situ PM2.5 observations from National air quality networks. An important lesson learned is that the representativity of the air quality monitoring stations is a very important factor to take into account when evaluating the methodology. For representative sites in Poland and the Czech Republic correlations between 0.56 and 0.49 were found between satellite-based PM2.5 and PM2.5 measured at air quality sites; this is nearly double the correlation between WRF-ChemPM2.5 and PM2.5 observed at the in situ sites. Uncertainties in the PM2.5 retrieval, as well as AOD and WRF-Chem uncertainties contribute to those from the satellite-based PM2.5. The boundary layer altitude were found to be an important parameter for a potential future improvement of the PM2.5 retrieval.
3. The added value of including satellite data when creating air quality maps was demonstrated. An operational algorithm for data fusion with the capability of optimally merging and mapping multiple heterogeneous datasets was extended to make use of various satellite-based air quality products (NO2, SO2, AOD, PM2.5, and PM10). Validation results showed that in multiple cases the inclusion of satellite data can improve the mapping for the Czech Republic for both, historical as well as NRT data. Moreover, an inclusion of satellite data improves the daily and hourly mapping results of NO2 in the rural areas and annual data, both in the rural background and in the urban regions. Inclusion of satellite SO2 slightly improves both rural and urban mapping results for hourly, daily, and annual data. Including AOD or PM2.5 derived from satellite AOD improved the results for PM2.5 and PM10. The main limitation for the operational use of such data lies in the limited satellite data coverage due to lack of daylight and cloudiness. Gap filling in the cloudy areas, using model and in situ data only, can be considered a suitable way to improve coverage, as long as is properly flagged.
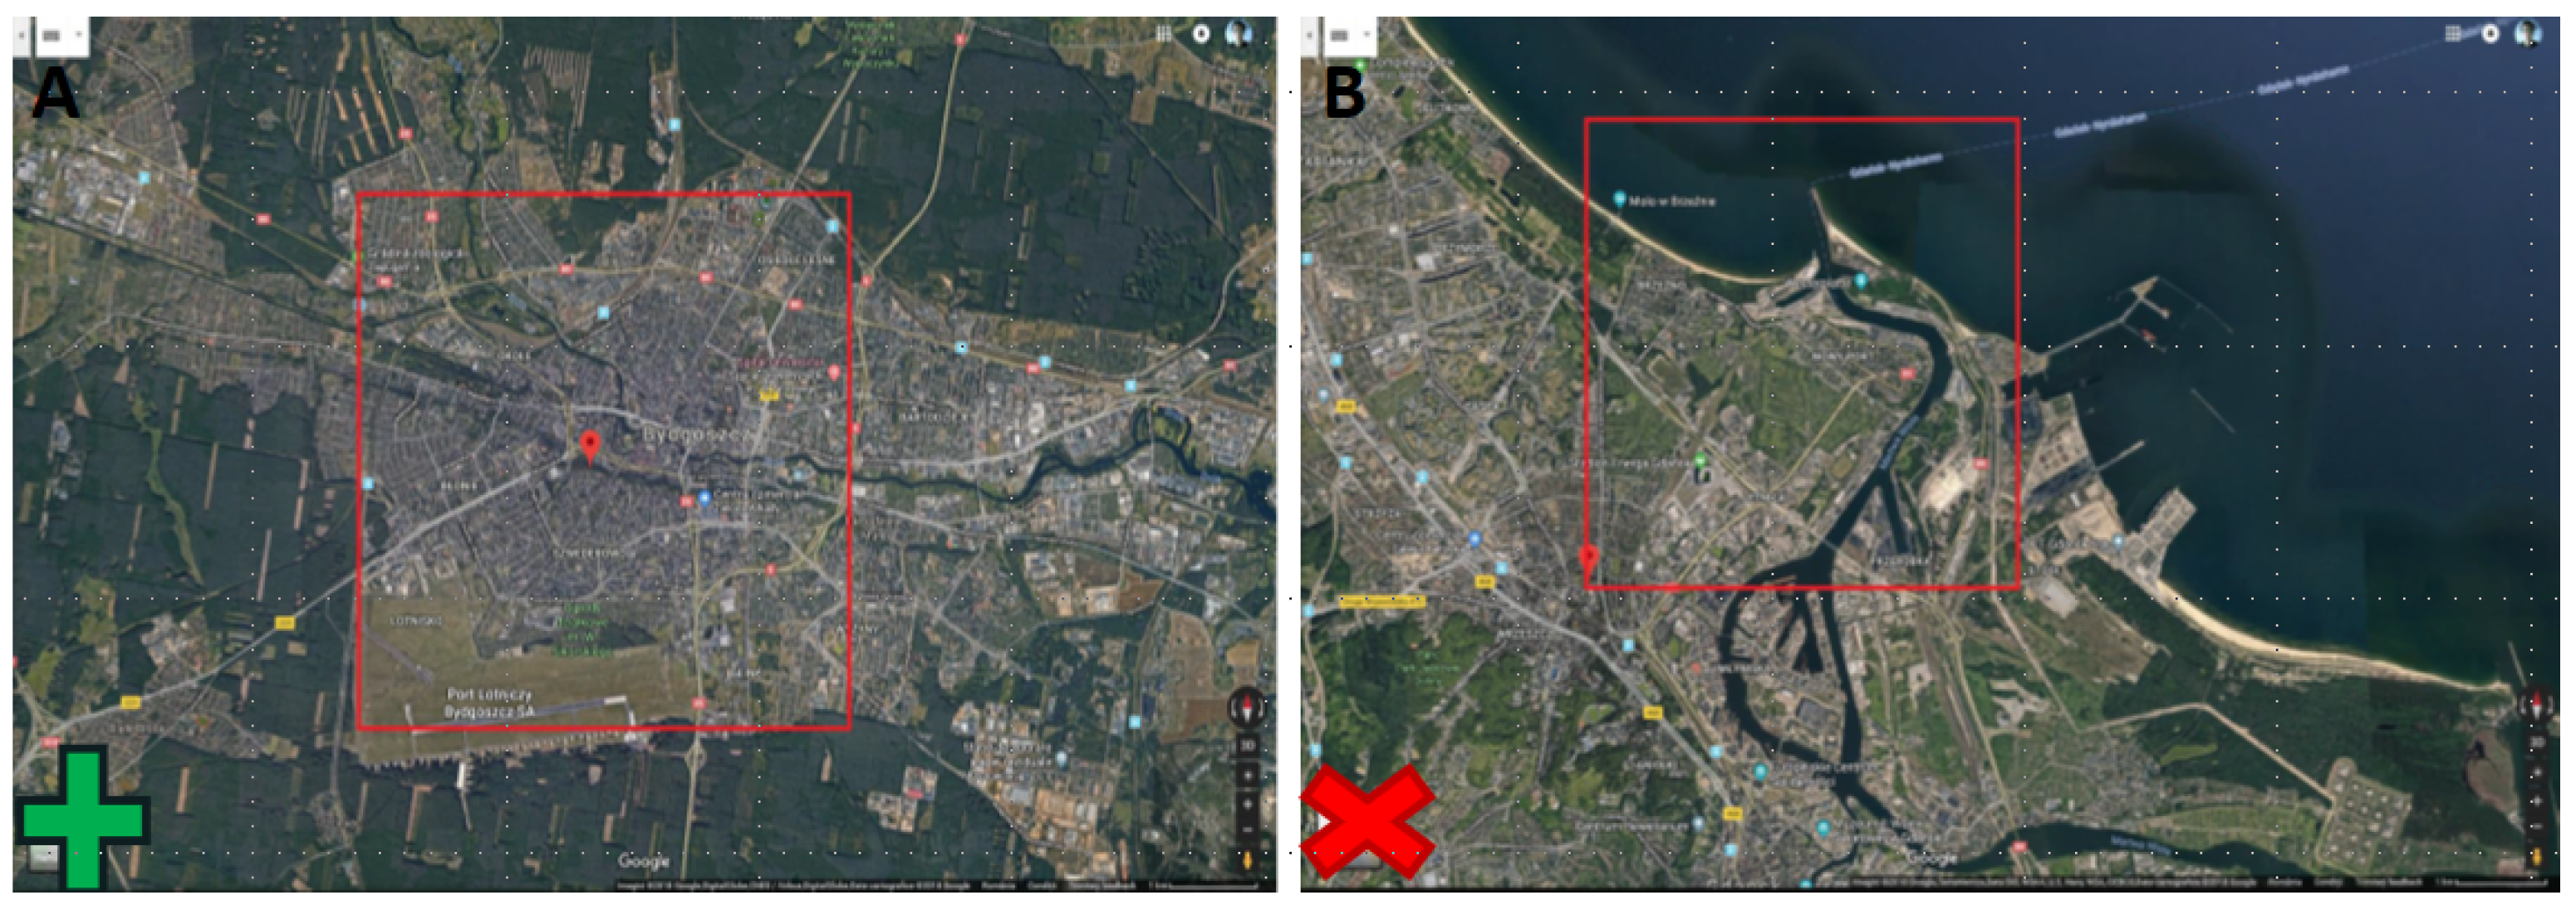
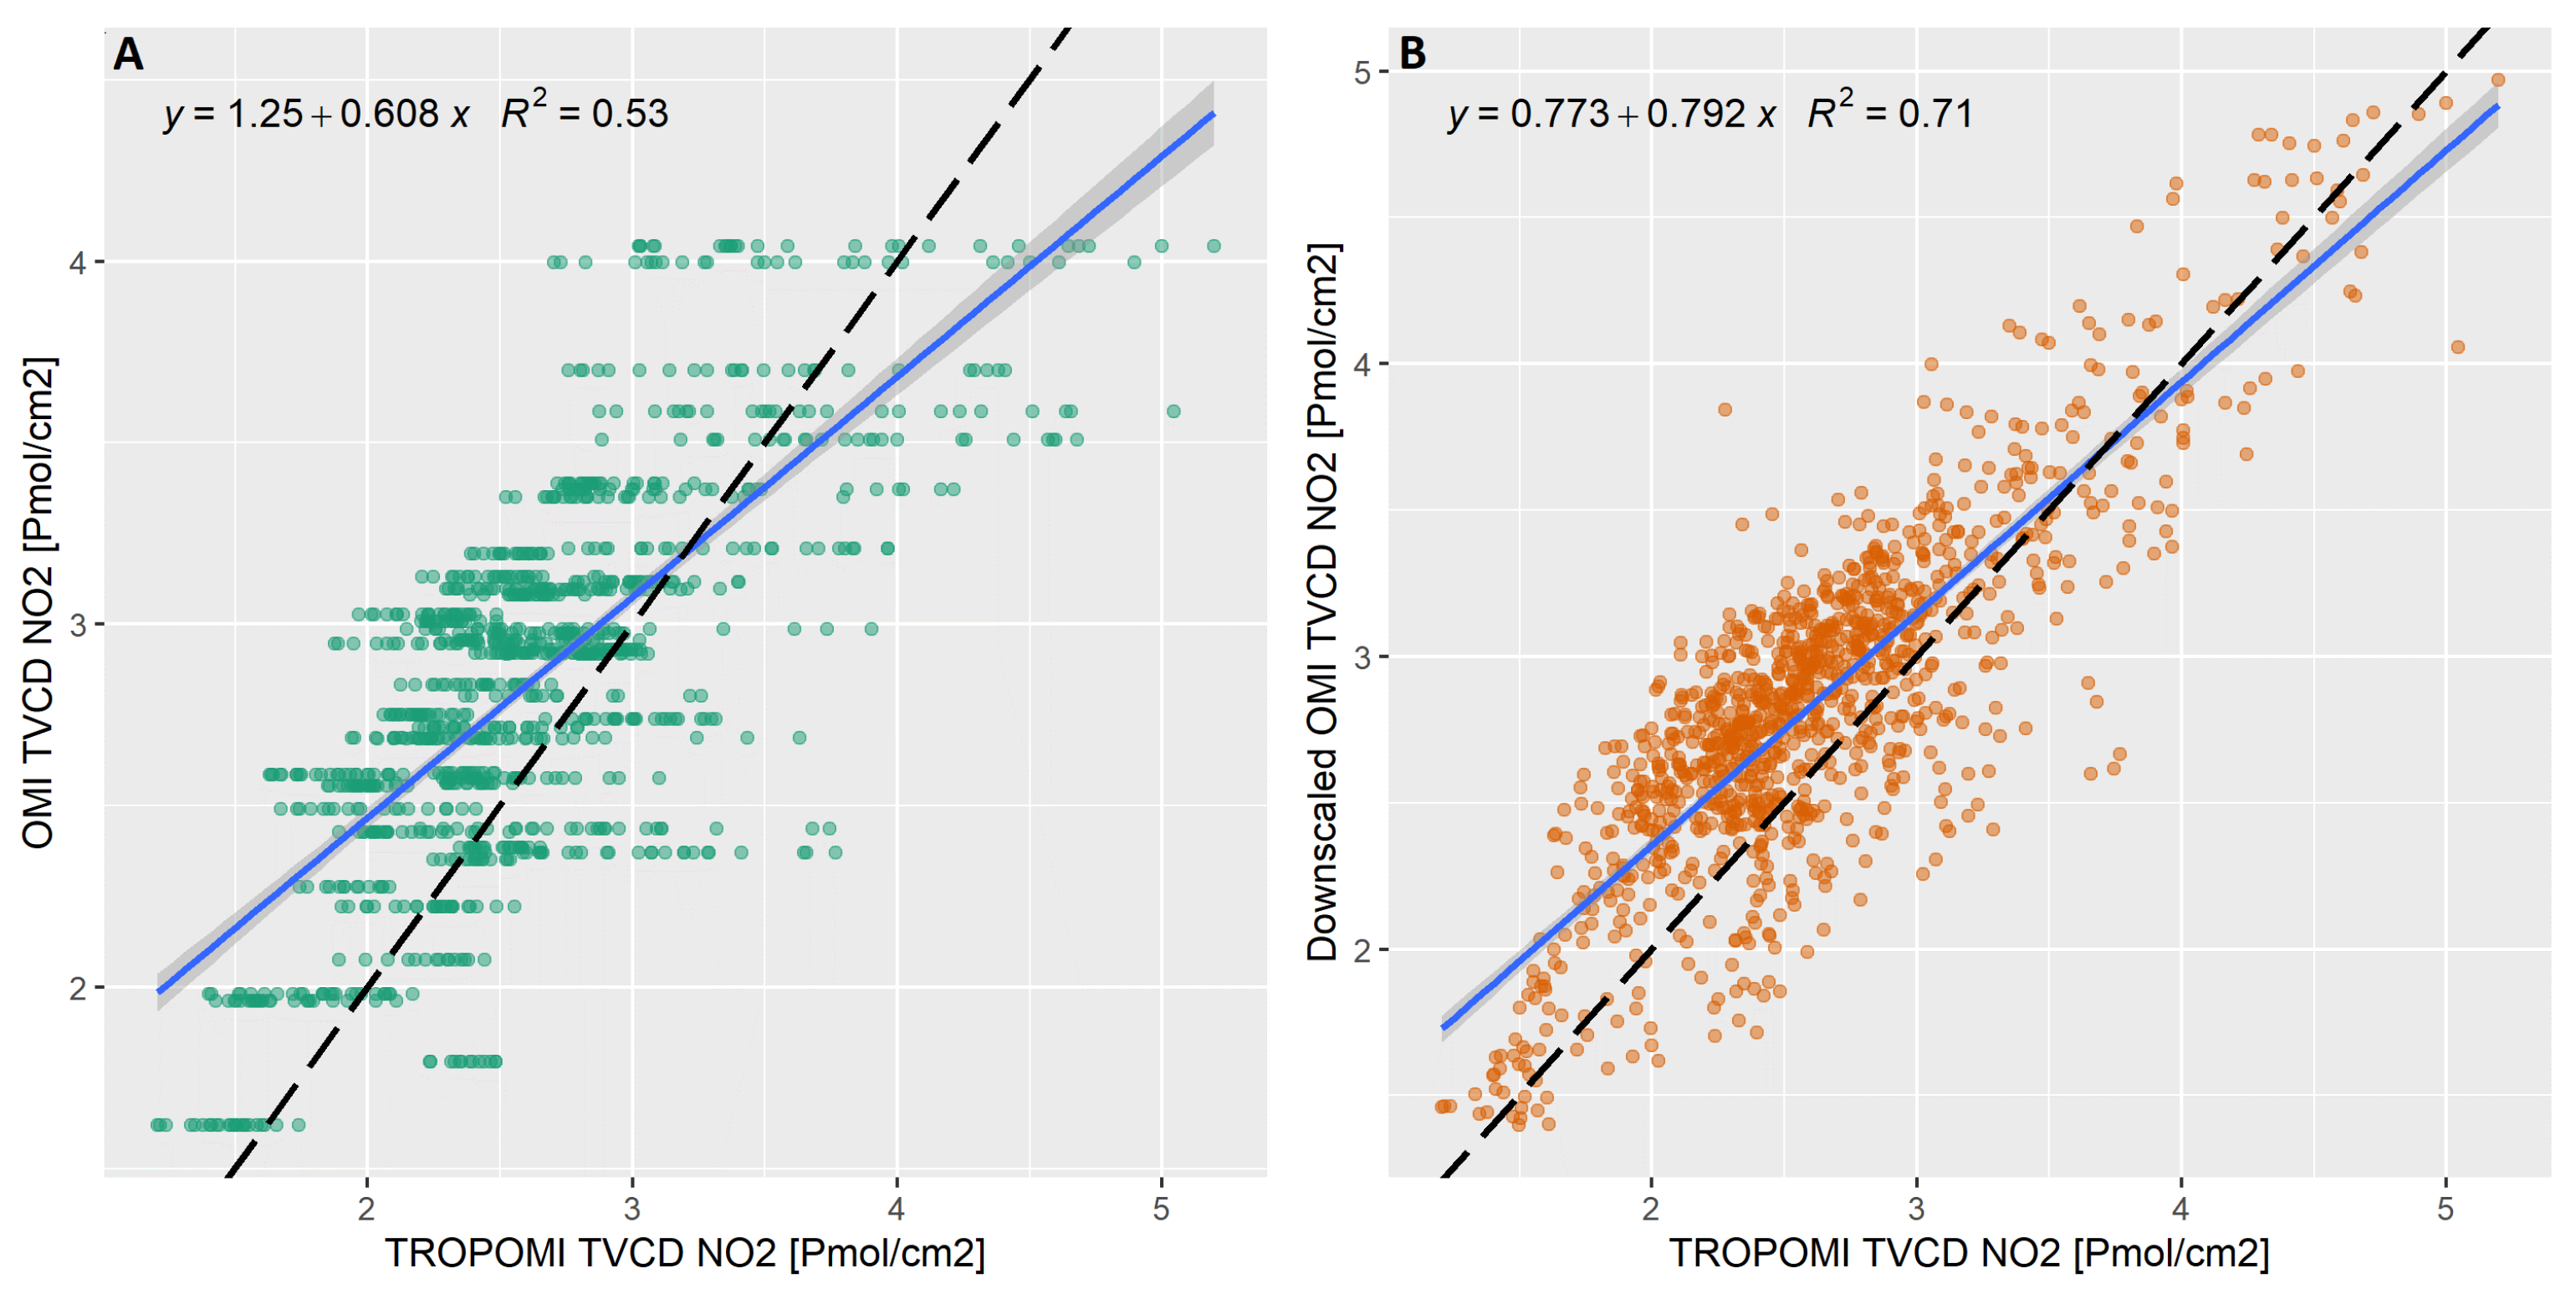
4. A geostatistical downscaling algorithm was developed and tested to bridge the gap between satellite products of air quality (typically provided at spatial resolutions on the order of several kilometres) and urban-scale applications (for which spatial resolution of hundreds of meters are required). Statistical downscaling has been carried out in many disciplines in the past and substantial efforts have also been made in satellite remote sensing. However, so far to our knowledge no studies have used or implemented such approaches for downscaling satellite-based air quality products. In a first step, the SAMIRA downscaling algorithm was validated using synthetic data. Then, we found that it performs well in extracting spatial details that can be seen in the true high-resolution data field. We successfully demonstrated downscaling OMI NO2 data to the spatial resolution of TROPOMI, with NO2 data from the latter acting as a true high-resolution reference. It is expected that the advantage provided by the downscaling algorithm will also hold for even finer spatial scales. It is important to note here that—when using a time-invariant proxy—the downscaling on a daily basis (i.e., not for a longer-term average) for a high-resolution instrument, such as TROPOMI, is limited to relatively calm winds in the area and no significant plumes forming. In the case of a substantial plume the downscaling algorithm will spatially redistribute in areas where the original emissions causing the plume have not actually originated, thus leading to erroneous results.
We can conclude that the SAMIRA project was a significant step forward towards a better exploitation of the Earth observation capabilities for air quality monitoring in Europe. Geostationary satellite instruments, like SEVIRI and the upcoming Sentinel 4 mission [65] (launch planned in 2023) are particularly interesting for air quality applications. Setting up a European or international initiative, analogue to, e.g., the Production and Evaluation of Aerosol Climate Data Records from European Satellite Observations (Aerosol_cci) [66], but with focus on geostationary AOD retrievals, would be an important step forward in improving satellite-based air quality. This is also true for the estimation of the information content for satellite-based PM2.5 retrieval. Outcomes from SAMIRA, together with the work performed for the EEA [67], led to the inclusion of satellite data in the EEA air quality mapping in Europe. A geospatial downscaling algorithm was implemented and we could demonstrate its skills. More work is necessary to better understand the uncertainties and limitations associated with the resulting downscaled products. All of the work shown above is about data integration. Linking the NO2 columnar data with surface concentrations of NO2, for which several hundreds of stations are available in Europe, is a natural next step in the development of satellite-based urban-scale air quality monitoring.

Author Contributions

The concept for SAMIRA was developed by K.S., D.N., I.S.S., N.A., A.D., J.H., P.S. and C.Z. The manuscript was prepared by K.S. with main input provided by I.S.S., M.B., N.A., J.H., J.M., P.S. and with additional writing—review by O.V. and R.J. Main responsibilities for the SEVIRI AOD retrieval lied with O.Z.-M. (case study analysis: I.S.S.), the PM2.5 retrieval with M.B. and A.N. (who were supported by V.N. and D.N.), the data fusion with J.H., J.M. and R.J., downscaling with P.S. and the in situ PM10 data assimilation with A.D. (with support from R.D. and A.I.-B.). R.D, N.A., N.B. and O.V. were responsible for the modeling (supported by A.I.-B.). N.A., H.Ș., C.B. and K.S. contributed to the independent product validation (supported by I.S.S. and O.Z.-M.). P.N. and L.V. developed the SAMIRA data mapping portal. K.S. was responsible for scientific project management. All authors have read and agreed to the published version of the manuscript.

Funding

This research was conducted in the frame of the satellite based monitoring initiative for regional air quality (SAMIRA) project funded by the European Space Agency, ESA-ESRIN Contract No. 4000117393/16/I-NB. Additional partial funding for the downscaling activity was provided by the Norwegian Space Agency through the SAT4AQN project (NRS Contract No. NIT.05.16.5). Part of the work for this research was funded by the European Regional Development Fund through the Competitiveness Operational Programme 2014–2020, POC-A.1-A.1.1.1-F-2015, project Research Centre for environment and Earth Observation CEO-Terra, SMIS code 108109, contract No. 152/2016.

Institutional Review Board Statement

Not applicable.

Informed Consent Statement

Not applicable.

Data Availability Statement

All data generated within the SAMIRA project are available from the authors upon request.

Acknowledgments

The SEVIRI data were obtained from EUMETSAT, license number 50001643. This paper contains modified Copernicus Atmosphere Monitoring Service Information (2018); neither the EC nor the ECMWF is responsible for any use that may be made of the information it contains. We thank the PIs and their teams for the effort in establishing and maintaining the AERONET and Poland-AOD sites. Some of the presented figures use basemaps copyright OpenStreetMap contributors and map tiles by Stamen Design, under CC BY 3.0.

Conflicts of Interest

The authors declare no conflict of interest.

References

  1. EEA. Air Quality in Europe-2020 Report; EEA Report No 09/2020; European Environment Agency: Copenhagen, Denmark, 2020. [Google Scholar] [CrossRef]
  2. Schmid, J. The SEVIRI Instrument. In Proceedings of the 2000 EUMETSAT Meteorological Satellite Data Users’ Conference, Bologna, Italy, 29 May–2 June 2000; pp. 23–32. Available online: https://www-cdn.eumetsat.int/files/2020-04/pdf_ten_msg_seviri_instrument.pdf (accessed on 31 July 2020).
  3. Levelt, P.F.; van den Oord, G.H.J.; Dobber, M.R.; Malkki, A.; Visser, H.; de Vries, J.; Stammes, P.; Lundell, J.; Saari, H. The Ozone Monitoring Instrument. IEEE T. Geosci. Remote Sens. 2006, 44, 1093–1101. [Google Scholar] [CrossRef]
  4. Veefkind, J.; Aben, I.; McMullan, K.; Förster, H.; de Vries, J.; Otter, G.; Claas, J.; Eskes, H.; de Haan, J.; Kleipool, Q.; et al. TROPOMI on the ESA Sentinel-5 Precursor: A GMES mission for global observations of the atmospheric composition for climate, air quality and ozone layer applications. Remote Sens. Environ. 2012, 120, 70–83. [Google Scholar] [CrossRef]
  5. Hoff, R.M.; Sundar, S.C. Remote Sensing of Particulate Pollution from Space: Have we reached the promised land? J. Air Waste Manage. Assoc. 2009, 59, 645–675. [Google Scholar] [CrossRef]
  6. Shin, M.; Kang, Y.; Park, S.; Im, J.; Yoo, C.; Quackenbush, L.J. Estimating ground-level particulate matter concentrations using satellite-based data: A review. GIsci. Remote Sens. 2020, 57, 174–189. [Google Scholar] [CrossRef]
  7. Ranjan, A.K.; Patra, A.; Gorai, A.K. A review on estimation of particulate matter from satellite-based aerosol optical depth: Data, methods, and challenges. Asia-Pacific J. Atmos. Sci. 2020. [Google Scholar] [CrossRef]
  8. Govaerts, Y.M.; Wagner, S.; Lattanzio, A.; Watts, P. Joint retrieval of surface reflectance and aerosol optical depth from MSG/SEVIRI observations with an optimal estimation approach: 1. Theory. J. Geophys. Res. 2010, 115, D02203. [Google Scholar] [CrossRef]
  9. Mei, L.; Xue, Y.; de Leeuw, G.; Holzer-Popp, T.; Guang, J.; Li, Y.; Yang, L.; Xu, H.; Xu, X.; Li, C.; et al. Retrieval of aerosol optical depth over land based on a time series technique using MSG/SEVIRI data. Atmos. Chem. Phys. 2012, 12, 9167–9185. [Google Scholar] [CrossRef] [Green Version]
  10. Carrer, D.; Ceamanos, X.; Six, B.; Roujean, J.-L. AERUS-GEO: A newly available satellite-derived aerosol optical depth product over Europe and Africa. Geophys. Res. Lett. 2014, 41, 7731–7738. [Google Scholar] [CrossRef]
  11. Chu, D.A.; Kaufman, Y.J.; Zibordi, G.; Chern, J.D.; Mao, J.; Li, C.; Holben, B.N. Global monitoring of air pollution over land from the Earth Observing System-Terra Moderate Resolution Resolution Imaging Spectroradiometer (MODIS). J. Geophys. Res. Atmos. 2003, 108, 4661. [Google Scholar] [CrossRef]
  12. Liu, Y.; Sarnat, J.A.; Kilaru, V.; Jacob, D.J.; Koutrakis, P. Estimating ground level PM2.5 in the eastern United States using satellite remote sensing. Environ. Sci. Technol. 2005, 39, 3269–3278. [Google Scholar] [CrossRef] [Green Version]
  13. van Donkelaar, A.; Martin, R.V.; Spurr, R.J.D.; Drury, E.; Remer, L.A.; Levy, R.C.; Wang, J. Optimal estimation for global ground-level fine particulate matter concentrations. J. Geophys. Res. Atmos. 2013, 118, 5621–5636. [Google Scholar] [CrossRef] [Green Version]
  14. Fu, D.; Xi, A.X.; Wang, J.; Zhang, X.; Li, X.; Liu, J. Synergy of AERONET and MODIS AOD products in the estimation of PM2.5 concentrations in Beijing. Sci. Rep. 2018, 8, 10174. [Google Scholar] [CrossRef] [Green Version]
  15. Kokhanovsky, A.A.; von Hoyningen-Huene, W.; Burrows, J.P. Atmospheric aerosol load as derived from space. Atmos. Res. 2006, 81, 176–185. [Google Scholar] [CrossRef]
  16. Holzer-Popp, T.; Schroedter-Homscheidt, M.; Breitkreuz, H.; Martynenko, D.; Klüser, L. Improvements of synergetic aerosol retrieval for ENVISAT. Atmos. Chem. Phys. 2008, 8, 7651–7672. [Google Scholar] [CrossRef] [Green Version]
  17. Wang, Q.; Zeng, Q.; Tao, J.; Sun, L.; Zhang, L.; Gu, T.; Wang, Z.; Chen, L. Estimating PM2.5 concentrations based on MODIS AOD and NAQPMS data over Beijing–Tianjin–Hebei. Sensors 2019, 19, 1207. [Google Scholar] [CrossRef] [Green Version]
  18. Shen, H.; Li, T.; Yuan, Q.; Zhang, L. Estimating regional ground-level PM2.5 directly from satellite top-of-atmosphere reflectance using deep belief networks. J. Geophys. Res. Atmos. 2018, 123, 875–886. [Google Scholar] [CrossRef] [Green Version]
  19. Park, S.; Shin, M.; Im, J.; Song, C.-K.; Choi, M.; Kim, J.; Lee, S.; Park, R.; Kim, J.; Lee, D.-W.; et al. Estimation of ground-level particulate matter concentrations through the synergistic use of satellite observations and process-based models over South Korea. Atmos. Chem. Phys. 2019, 19, 1097–1113. [Google Scholar] [CrossRef] [Green Version]
  20. Li, L. A Robust Deep Learning Approach for Spatiotemporal Estimation of Satellite AOD and PM2.5. Remote Sens. 2020, 12, 264. [Google Scholar] [CrossRef] [Green Version]
  21. Koelemeijer, R.B.A.; Homan, C.D.; Matthijsen, J. Comparison of spatial and temporal variations of aerosol optical thickness and particulate matter over Europe. Atmos. Environ. 2006, 40, 5304–5315. [Google Scholar] [CrossRef]
  22. Boersma, K.F.; Eskes, H.J.; Richter, A.; De Smedt, I.; Lorente, A.; Beirle, S.; van Geffen, J.H.G.M.; Zara, M.; Peters, E.; Van Roozendael, M.; et al. Improving algorithms and uncertainty estimates for satellite NO2 retrievals: Results from the quality assurance for the essential climate variables (QA4ECV) project. Atmos. Meas. Tech. 2018, 11, 6651–6678. [Google Scholar] [CrossRef] [Green Version]
  23. van Geffen, J.; Boersma, K.F.; Eskes, H.; Sneep, M.; ter Linden, M.; Zara, M.; Veefkind, J.P. S5P TROPOMI NO2 slant column retrieval: Method, stability, uncertainties and comparisons with OMI. Atmos. Meas. Tech. 2020, 13, 1315–1335. [Google Scholar] [CrossRef] [Green Version]
  24. Krotkov, N.A.; McLinden, C.A.; Li, C.; Lamsal, L.N.; Celarier, E.A.; Marchenko, S.V.; Swartz, W.H.; Bucsela, E.J.; Joiner, J.; Duncan, B.N.; et al. Aura OMI observations of regional SO2 and NO2 pollution changes from 2005 to 2015. Atmos. Chem. Phys. 2016, 16, 4605–4629. [Google Scholar] [CrossRef] [Green Version]
  25. Beirle, S.; Borger, C.; Dörner, S.; Li, A.; Hu, Z.; Liu, F.; Wang, Y.; Wagner, T. Pinpointing nitrogen oxide emissions from space. Sci. Adv. 2019, 5. [Google Scholar] [CrossRef] [Green Version]
  26. Lorente, A.; Boersma, K.F.; Eskes, H.J.; Veefkind, J.P.; van Geffen, J.H.G.M.; de Zeeuw, M.B.; Denier van der Gon, H.A.C.; Beirle, S.; Krol, M.C. Quantification of nitrogen oxides emissions from build-up of pollution over Paris with TROPOMI. Sci Rep 9 2019, 20033. [Google Scholar] [CrossRef] [PubMed]
  27. Chan, K.L.; Khorsandi, E.; Liu, S.; Baier, F.; Valks, P. Estimation of surface NO2 concentrations over Germany from TROPOMI satellite observations using a machine learning method. Remote Sens. 2021, 13, 969. [Google Scholar] [CrossRef]
  28. Fioletov, V.; McLinden, C.A.; Griffin, D.; Theys, N.; Loyola, D.G.; Hedelt, P.; Krotkov, N.A.; and Li, C. Anthropogenic and volcanic point source SO2 emissions derived from TROPOMI on board Sentinel-5 Precursor: First results. Atmos. Chem. Phys. 2020, 20, 5591–5607. [Google Scholar] [CrossRef]
  29. EEA. The application of models under the European Union’s Air Quality Directive: A technical reference guide. In EEA Technical Report; No 10/2011; European Environment Agency: Copenhagen, Denmark, 2011. [Google Scholar] [CrossRef]
  30. Lahoz, W.A.; Schneider, P. Data assimilation: Making sense of Earth Observation. Front. Environ. Sci. 2014, 2, 1–28. [Google Scholar] [CrossRef] [Green Version]
  31. Atkinson, P.M.; Tate, N.J. Spatial scale problems and geostatistical solutions: A review. Prof. Geogr. 2000, 52, 607–623. [Google Scholar] [CrossRef]
  32. Goovaerts, P. Geostatistics for Natural Resources Evaluation; Appl. Geostatistics Series; Oxford University Press: Oxford, UK, 1997; p. 483. ISBN 0-19-511538-4. [Google Scholar]
  33. Kyriakidis, P.C. A geostatistical framework for area-to-point spatial interpolation. Geogr. Anal. 2004, 36, 259–289. [Google Scholar] [CrossRef]
  34. Park, N.-W. Spatial downscaling of TRMM precipitation using geostatistics and fine scale environmental variables. Adv. Meteorol. 2013, 237126. [Google Scholar] [CrossRef]
  35. Grell, G.A.; Peckham, S.E.; Schmitz, R.; McKeen, S.A.; Frost, G.; Skamarock, W.C.; Eder, B. Fully coupled `online’ chemistry in the WRF model. Atmos. Environ. 2005, 39, 6957–6976. [Google Scholar] [CrossRef]
  36. Fast, J.D.; Gustafson, W.I., Jr.; Easter, R.C.; Zaveri, R.A.; Barnard, J.C.; Chapman, E.G.; Grell, G.A. Evolution of ozone, particulates, and aerosol direct forcing in an urban area using a new fully-coupled meteorology, chemistry, and aerosol model. J. Geophys. Res. 2006, 111, D21305. [Google Scholar] [CrossRef]
  37. Peckham, S.; Grell, G.A.; McKeen, S.A.; Barth, M.; Pfister, G.; Wiedinmyer, C.; Fast, J.D.; Gustafson, W.I.; Zaveri, R.; Easter, R.C.; et al. WRF-Chem Version 3.3 User’s Guide. NOAA Tech. Memo. 2011, 98. Available online: https://repository.library.noaa.gov/view/noaa/11119 (accessed on 30 October 2018).
  38. Zawadzka, O.; Markowicz, K.M. Retrieval of aerosol optical depth from optimal interpolation approach applied to SEVIRI data. Remote Sens. 2014, 6, 7182–7211. [Google Scholar] [CrossRef] [Green Version]
  39. Stachlewska, I.S.; Zawadzka, O.; Engelmann, R. Effect of Heat Wave Conditions on Aerosol Optical Properties Derived from Satellite and Ground-Based Remote Sensing over Poland. Remote Sens. 2017, 9, 1199. [Google Scholar] [CrossRef] [Green Version]
  40. Stachlewska, I.S.; Samson, M.; Zawadzka, O.; Harenda, K.M.; Janicka, L.; Poczta, P.; Szczepanik, D.; Heese, B.; Wang, D.; Borek, K.; et al. Modification of Local Urban Aerosol Properties by Long-Range Transport of Biomass Burning Aerosol. Remote Sens. 2018, 10, 412. [Google Scholar] [CrossRef] [Green Version]
  41. Zawadzka, O.; Stachlewska, I.S.; Markowicz, K.M.; Nemuc, A.; Stebel, K. Validation of new satellite aerosol optical depth retrieval algorithm using Raman LIDAR observations at radiative transfer laboratory in Warsaw. EPJ Web Conf. 2018, 176, 04008. [Google Scholar] [CrossRef] [Green Version]
  42. Zawadzka-Manko, O.; Stachlewska, I.S.; Markowicz, K.M. Near-Real-Time Application of SEVIRI Aerosol Optical Depth Algorithm. Remote Sens. 2020, 12, 1481. [Google Scholar] [CrossRef]
  43. Brent, N.; Eck, T.F.; Slutsker, I.; Tanre, D.; Buis, J.P.; Setzer, A.; Vermote, E.; Reagan, J.A.; Kaufman, Y.J.; Nakajima, T.; et al. AERONET-A federated instrument network and data archive for aerosol characterization. Remote Sens. Environ. 1998, 66, 1–16. [Google Scholar] [CrossRef]
  44. Boldeanu, M.; Nemuc, A.; Nicolae, D.; Nicolae, V.; Ajtai, N.; Stefanie, H.; Diamandi, A.; Dumitrache, R.; Stachlewska, I.; Zawadzka, O.; et al. Estimation of particulate matter concentration using SEVIRI and model data. Geophysical Research Abstracts Volume 21, EGU2019-14068. 2019. Poster presentation, EGU General Assembly 2019. Available online: https://meetingorganizer.copernicus.org/EGU2019/EGU2019-14068.pdf (accessed on 31 July 2020).
  45. Nicolae, D.; Vasilescu, J.; Talianu, C.; Binietoglou, I.; Nicolae, V.; Andrei, S.; Antonescu, B. A neural network aerosol-typing algorithm based on LIDAR data. Atmos. Chem. Phys. 2018, 18, 14511–14537. [Google Scholar] [CrossRef] [Green Version]
  46. Koepke, P.; Hess, M.; Schult, I.; Shettle, E.P. Global Aerosol Data Set. In Report No. 243 of the Max-Planck-Institut für Meteorologie; Max-Planck-Institut für Meteorologie: Hamburg, Germany, 1997; ISSN 0937-1060. Available online: https://mpimet.mpg.de/fileadmin/publikationen/Reports/MPI-Report_243.pdf (accessed on 30 October 2018).
  47. Hess, M.; Koepke, P.; Schult, I. Optical Properties of Aerosols and Clouds: The Software Package OPAC. Bull. Am. Meteorol. Soc. 1998, 79, 831–844. [Google Scholar] [CrossRef]
  48. Mishchenko, M.I. Calculation of the amplitude matrix for a nonspherical particle in a fixed orientation. Appl. Opt. 2000, 39, 1026–1031. Available online: https://www.giss.nasa.gov/staff/mmishchenko/t_matrix.html (accessed on 30 October 2018). [CrossRef]
  49. Winker, D.M.; Vaughan, M.A.; Omar, A.; Hu, Y.; Powell, K.A.; Liu, Z.; Hunt, W.H.; Young, S.A. Overview of the CALIPSO Mission and CALIOP Data Processing Algorithms. J. Atmos. Ocean. Technol. 2009, 26, 2310–2323. [Google Scholar] [CrossRef]
  50. Horálek, J.; Denby, B.; de Smet, P.; de Leeuw, F.; Kurfürst, P.; Swart, R.; van Noije, T. Spatial mapping of air quality for European scale assessment. ETC/ACC Technical Paper 2006/6. 2007. Available online: http://www.eionet.europa.eu/etcs/etc-atni/products/etc-atni-reports/etcacc_technpaper_2006_6_spat_aq (accessed on 31 July 2020).
  51. Horálek, J.; de Smet, P.; de Leeuw, F.; Kurfürst, P.; Benešová, N. European air quality maps for 2014. ETC/ACM Technical Paper 2016/6. 2016. Available online: http://www.eionet.europa.eu/etcs/etc-atni/products/etc-atni-reports/etcacm_tp_2016_6_aqmaps2014 (accessed on 31 July 2020).
  52. Denby, B.; Schaap, M.; Segers, A.; Builtjes, P.; Horálek, J. Comparison of two data assimilation methods for assessing PM10 exceedances on the European scale. Atmos. Environ. 2008, 42, 7122–7134. [Google Scholar] [CrossRef]
  53. Cressie, N. Statistics for Spatial Data; Wiley Series: New York, NY, USA, 1993. [Google Scholar]
  54. Agencija za zaštitu okoliša. ISZO-Informacijski sustav zaštite okoliša [Croatian Environment Agency-Air Quality Information System, in Croatian]. Available online: http://iszo.azo.hr/ (accessed on 6 December 2020).
  55. Air Quality e-Reporting (AQ e-Reporting). Available online: https://www.eea.europa.eu/data-and-maps/data/aqereporting-8 (accessed on 6 December 2020).
  56. Simpson, D.; Benedictow, A.; Berge, H.; Bergström, R.; Emberson, L.D.; Fagerli, H.; Flechard, C.R.; Hayman, G.D.; Gauss, M.; Jonson, J.E.; et al. The EMEP MSC-W chemical transport model–technical description. Atmos. Chem. Phys. 2012, 12, 7825–7865. [Google Scholar] [CrossRef] [Green Version]
  57. Danielson, J.J.; Gesch, D.B. Global Multi-Resolution Terrain Elevation Data 2010 (GMTED2010); U.S. Geological Survey Open-File Report 2011–1073, US Department of the Interior: Washington, DC, USA, 2011. [Google Scholar] [CrossRef]
  58. Eurostat. GEOSTAT 2011 Grid Dataset. Population Distribution Dataset. 2014. Available online: http://ec.europa.eu/eurostat/web/gisco/geodata/reference-data/population-distribution-demography (accessed on 31 July 2020).
  59. Diamandi, A. SiAiR-Satellite & in-situ Information for Advanced Air Quality Forecast Services project, ESRIN/Contract No. 44000110941/LG/I-LG. Available online: https://www.google.com.hk/url?sa=t&rct=j&q=&esrc=s&source=web&cd=&ved=2ahUKEwiUxJqHg4DxAhW9xosBHafjDyQQFnoECAQQAA&url=http%3A%2F%2Fseom.esa.int%2Fatmos2015%2Ffiles%2Fpresentation215.pdf&usg=AOvVaw3r2U8kpXHY5PqgvdYx-mAw (accessed on 31 July 2020).
  60. Kuenen, J.J.P.; Visschedijk, A.J.H.; Jozwicka, M.; Denier van der Gon, H.A.C. TNO-MACC_II emission inventory; a multi-year (2003–2009) consistent high-resolution European emission inventory for air quality modelling. Atmos. Chem. Phys. 2014, 14, 10963–10976. [Google Scholar] [CrossRef] [Green Version]
  61. CHMI. Air Pollution in the Czech Republic in 2018, Graphical Yearbook (Czech/English); Czech Hydrometeorological Institute: Prague, Czech Republic, 2019. [Google Scholar]
  62. Remer, L.A.; Mattoo, S.; Levy, R.C.; Munchak, L.A. MODIS 3 km aerosol product: Algorithm and global perspective. Atmos. Meas. Tech. 2013, 6, 1829–1844. [Google Scholar] [CrossRef] [Green Version]
  63. Wei, J.; Li, Z.; Sun, L.; Peng, Y.; Liu, L.; He, L.; Qin, W.; Cribb, M. MODIS Collection 6.1 3 km resolution aerosol optical depth product: Global evaluation and uncertainty analysis. Atmos. Environ. 2020, 240, 117768. [Google Scholar] [CrossRef]
  64. Ajtai, N.; Mereuta, A.; Stefanie, H.; Radovici, A.; Botezan, C.; Zawadzka-Manko, O.; Stachlewska, I.S.; Stebel, K.; Zehner, C. SEVIRI Aerosol Optical Depth Validation Using AERONET and Intercomparison with MODIS in Central and Eastern Europe. Remote Sens. 2021, 13, 844. [Google Scholar] [CrossRef]
  65. Ingmann, P.; Veihelmann, B.; Langen, J.; Lamarre, D.; Stark, H.; Courrèges-Lacoste, G.B. Requirements for the GMES Atmosphere Service and ESA’s implementation concept: Sentinels-4/-5 and -5p. Remote Sens. Environ. 2012, 120, 58–69. [Google Scholar] [CrossRef]
  66. Popp, T.; De Leeuw, G.; Bingen, C.; Brühl, C.; Capelle, V.; Chedin, A.; Clarisse, L.; Dubovik, O.; Grainger, R.; Griesfeller, J.; et al. Development, Production and Evaluation of Aerosol Climate Data Records from European Satellite Observations (Aerosol_cci). Remote Sens. 2016, 8, 421. [Google Scholar] [CrossRef] [Green Version]
  67. Horálek, J.; de Smet, P.; Schneider, P.; Maiheu, B.; de Leeuw, F.; Janssen, S.; Benešová, N.; Lefebvre, W. Satellite Data Inclusion and Kernel Based Potential Improvements in NO2 Mapping. ETC/ACM Technical Paper 14/2017. 2018. Available online: http://www.eionet.europa.eu/etcs/etc-atni/products/etc-atni-reports/etcacm_tp_2017_14_improved_aq_no2mapping (accessed on 31 July 2020).
Figure 1. SAMIRA overview work-flow diagram. Activities marked in green made use of satellite data. For more details see Section 2.1, Section 2.2, Section 2.3, Section 2.4 and Section 2.5.
Remotesensing 13 02219 g001
Figure 2. WRF-Chem model domains at 5 km (blue) and 1 km (red) horizontal resolution. Bold marked areas indicate regions for which exemplary results are discussed in this text.
Remotesensing 13 02219 g002
Figure 3. Methodology used in SAMIRA for AOD to PM2.5 conversion: data flow of the algorithm.
Remotesensing 13 02219 g003
Figure 4. Data fusion process used in SAMIRA: regression-interpolation-merging mapping.
Remotesensing 13 02219 g004
Figure 5. General concept of the SAMIRA downscaling methodology. Green boxes indicate input data, white boxes indicate intermediate datasets, blue boxes represent processing steps, and the orange box indicates the final output.
Remotesensing 13 02219 g005
Figure 6. SEVIRI NRT AOD (AD) and AOD uncertainty maps (E,F) over Poland for every fourth retrieval in the morning of 5 June 2019, at 05:00 UTC (A,E), 06:00 UTC (B,F), 07:00 UTC (C,G), and 08:00 UTC (D,H). The pixel resolution is 5.5 × 5.5 km2 and each map represent 15 min.
Remotesensing 13 02219 g006
Figure 7. For 5 June 2019, backward trajectories for 12:00 UTC calculated with the HySplit Model (A), the Warsaw PollyXT LIDAR signal (B), and multi-wavelengths AOD for the Warsaw sun-photometer (C).
Remotesensing 13 02219 g007
Figure 8. AOD (panel A), conversion factor (panel B) and PM2.5 (panel C) map calculated for Poland, 17 September 2014 07:00 UTC. For comparison, in the lower panel PM2.5 output from WRF-Chem (panel D), and the difference between the calculated and the modeled PM2.5 is shown (panel E).
Remotesensing 13 02219 g008
Figure 9. Hourly NRT air quality maps for the Czech Republic. (A): NO2 map for 15 August 2019 15:00 UTC; (B): SO2 map for 15 August 2019 15:00 UTC; (C): PM2.5 for 23 August 2019 07:00 UTC; (D): PM10 for 23 August 2019 07:00 UTC. Note that grey areas in the Czech Republic show regions with no satellite data due to cloud coverage.
Remotesensing 13 02219 g009
Figure 10. Real-world validation of the downscaling method using TROPOMI as a high-resolution reference for the area of the Ostrava/Katowice area for July through September 2018. Panel A shows the original OMI data (gridded at 0.25° × 0.25°). Panel B shows the result of downscaling the OMI data using the QUARK NO2 dataset (https://ec.europa.eu/environment/air/pdf/NO2%20exposure%20technical%20manual.pdf, accessed on 30 October 2018) as a proxy. For a direct comparison, panel C shows the original TROPOMI data gridded to a spatial resolution of 0.05° × 0.05°. Panel D shows the relative difference between the downscaled OMI data and the TROPOMI data.
Remotesensing 13 02219 g010
Figure 11. Illustration of land cover and land-use within a 5 km × 5 km square SEVIRI pixel. (A): urban area, (B): coastal site.
Remotesensing 13 02219 g011
Figure 12. Scatterplots showing a comparison of the original OMI NO2 product (panel A) and the downscaled OMI NO2 product (panel B) against the TROPOMI NO2 product [in 1015 molecules cm−2] for the area of the Czech Republic for July through September 2018. Note that due to its coarse resolution a pixel of the original OMI product represents multiple TROPOMI pixels, thus explaining the striped patterns in panel A.
Remotesensing 13 02219 g012
Figure 13. SAMIRA Map Viewer showing hourly averaged NRT NO2 for 23 November 2019 12:00 over the Czech Republic.
Remotesensing 13 02219 g013
Table 1. SAMIRA data products and reference data used for validation.
SAMIRA ProductsDatasets Used for Product DevelopmentDatasets Suitable for Validation
  (Methodology)
SEVIRI AODall days: reflectance from SEVIRIAOD from AERONET, the Poland
 reference day: AOD from AERONET,AOD network and MODIS
 Poland AOD network, and CAMS(statistical scores)
PM2.5 from AODSEVIRI AOD from SAMIRAPM2.5 from ground–based national
 WRF-Chem model outputair quality networks (correlation)
Data fusionAQIS database data for Czech RepublicSubsets not used in the analysis
NO2, SO2, PM2.5CAMx output, auxiliary data(cross-validation)
 AOD, PM2.5 from SAMIRA
 NO2, SO2 from OMI, GOME-2, TROPOMI
DownscalingAOD, PM2.5 from SAMIRASynthetic data, satellite data
NO2, SO2NO2, SO2 from OMI, TROPOMIwith higher spatial resolution
AOD, PM2.5Model output (WRF-Chem, WRF-EMEP)(statistical scores)
 QUARK NO2
Table 2. Validation of SEVIRI AOD using AOD from AERONET, the Poland AOD network, and the 3 km AOD product from MODIS. N: number of co-locations, R: correlation coefficient, RMSE: root mean square error.
DataDomainNRBiasRMSE
AERONETRomania9820.620.120.14
AERONETPoland2890.610.100.12
POLAND-AODPoland5440.610.090.12
MODISRomania90,7400.320.110.15
MODISPoland48,9120.390.090.14
MODISCzech Republic16,1540.350.070.15
Table 3. Correlation (R) between WRF-Chem and satellite-based PM2.5 and PM2.5 measured at ground-based stations.
CountryTemporalWRF-Chem, allAll StationsRepresentative Stations
 Average/Representative Stations(Number of Stations)(Number of Stations)
Polandhourly0.32/0.300.40 (36)0.56 (16)
Czech Republichourly0.25/0.270.41 (35)0.49 (13)
Romaniadaily0.440.53 (09) 
Table 4. Comparison of different spatial interpolation variants showing cross-validation parameters root mean square error (RMSE) and bias, as annual statistics average, based on the specified pollutants daily and hourly maps across 2014 for the Czech Republic. Numbers are given for without (x|) and with (|x) inclusion of satellite data, and superior results are marked in bold. For PM superscripts indicate which satellite dataset was used. For PM2.5 three values are shown for without (x|) and with (|xa|xb) inclusion of satellite data a. with SEVIRI AOD as proxy and b. using SAMIRA PM2.5 data. Units: μ g m 3 .
 Rural AreasUrban Background Areas
 RMSEBiasRMSEBias
NO2 daily3.37| 3.24−0.06| 0 . 04 5.18|5.14−0.01| 0.02
NO2 hourly5.46| 5.22−0.01| 0.008.96 |9.040.10| 0.12
SO2 daily3.68| 3.610.04| 0.045.56|5.53−0.11|−0.07
SO2 hourly5.75| 5.590.09| 0.035.93|5.91−0.10|−0.04
PM10AOD daily4.76| 4.57−0.14| 0.005.06 |5.17−0.18|−0.12
PM10AOD hourly14.00|12.501.24| 0.0113.28|8.260.77|−0.13
PM2.5AOD,PM2.5 daily4.17|3.39|3.650.02|0.00|−0.014.35|4.60|4.190.07|−0.15|−0.10
PM2.5AOD,PM2.5 hourly7.26|7.07|6.98−0.07|0.00| 0.019.29|8.26|8.670.13|−0.13|−0.16
Table 5. Comparison of spatial interpolation variants without and with the use of satellite data showing cross-validation parameters RMSE, bias, and R2, based on NO2 and SO2 annual average map for the Czech Republic for 2014. RMSE and bias are given in μ g m 3 .
 Rural AreasUrban Background Areas
 RMSEBiasR2RMSEBiasR2
NO22.83|2.110.03|0.000.33|0.633.52|3.480.24| 0.150.42| 0.43
SO23.11|2.98−0.13|−0.130.25|0.312.97|2.750.01| −0.300.21|0.33
Table 6. Summary statistics of a various downscaling methods for the simulated dataset (A.U.). Marked in bold are the best values for several relevant metrics. SD: standard deviation, MAE: mean absolute error, RMSE: root means square error.
MethodCovariateMean BiasSDMAERMSEInterceptSlopeR 2
Bilinear interpolationno0.041.421.131.42−0.731.040.91
Area-to-point krigingno−0.011.321.051.32−0.541.030.93
Simple linear regressionyes−0.021.461.151.460.960.950.91
Robust linear regressionyes0.111.591.261.59 3 .111.170.91
Area-to-point krigingyes0.000.690.540.690.950.950.98
Table 7. Summary statistics comparing the original OMI NO2 data and the downscaled OMI NO2 data, respectively, against the high-resolution TROPOMI NO2 data (in 1015 molecules cm−2), shown here for area of the Ostrava/Katowice region. The better metrics are marked in bold. SD: standard deviation, MAE: mean absolute error, RMSE: root means square error.
DatasetMean BiasSDMAERMSEInterceptSlopeR2
OMI Original0.220.430.400.481.250.610.53
OMI Downscaled0.230.340.340.400.770.790.71
Publisher’s Note: MDPI stays neutral with regard to jurisdictional claims in published maps and institutional affiliations.

