
Tropospheric Volcanic SO2 Mass and Flux Retrievals from Satellite. The Etna December 2018 Eruption

 , , , , ,
  , and
, and
Abstract
:
1. Introduction
2. Satellite Instrument Characteristics, SO2 Mass and Flux Retrieval Procedure Description
3. Data Available and Cross-Comparison Strategy Description
4. Results
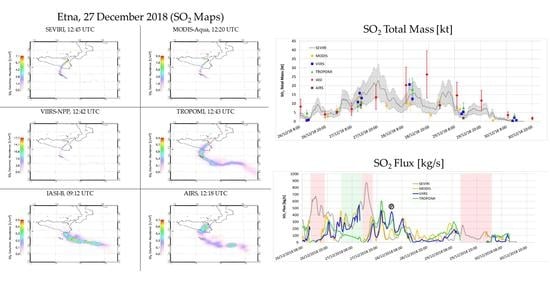
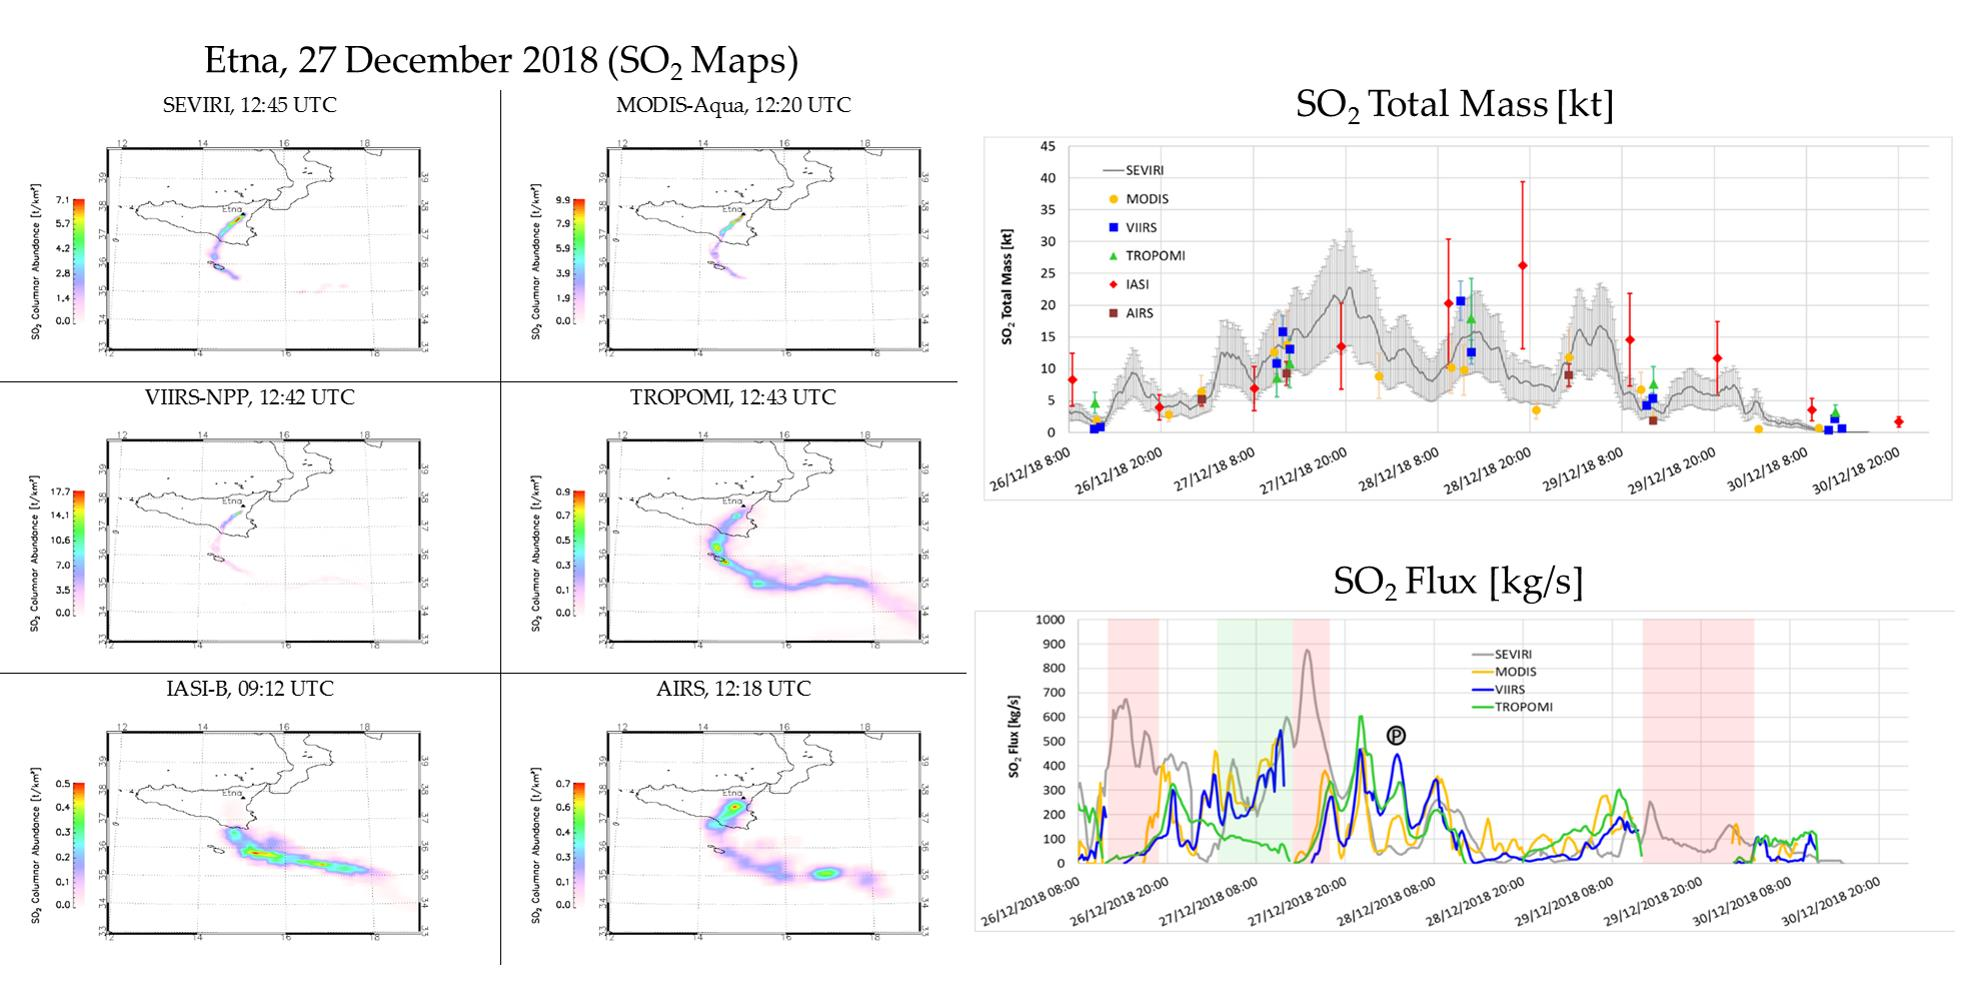
4.1. SO2 Total Mass and Area
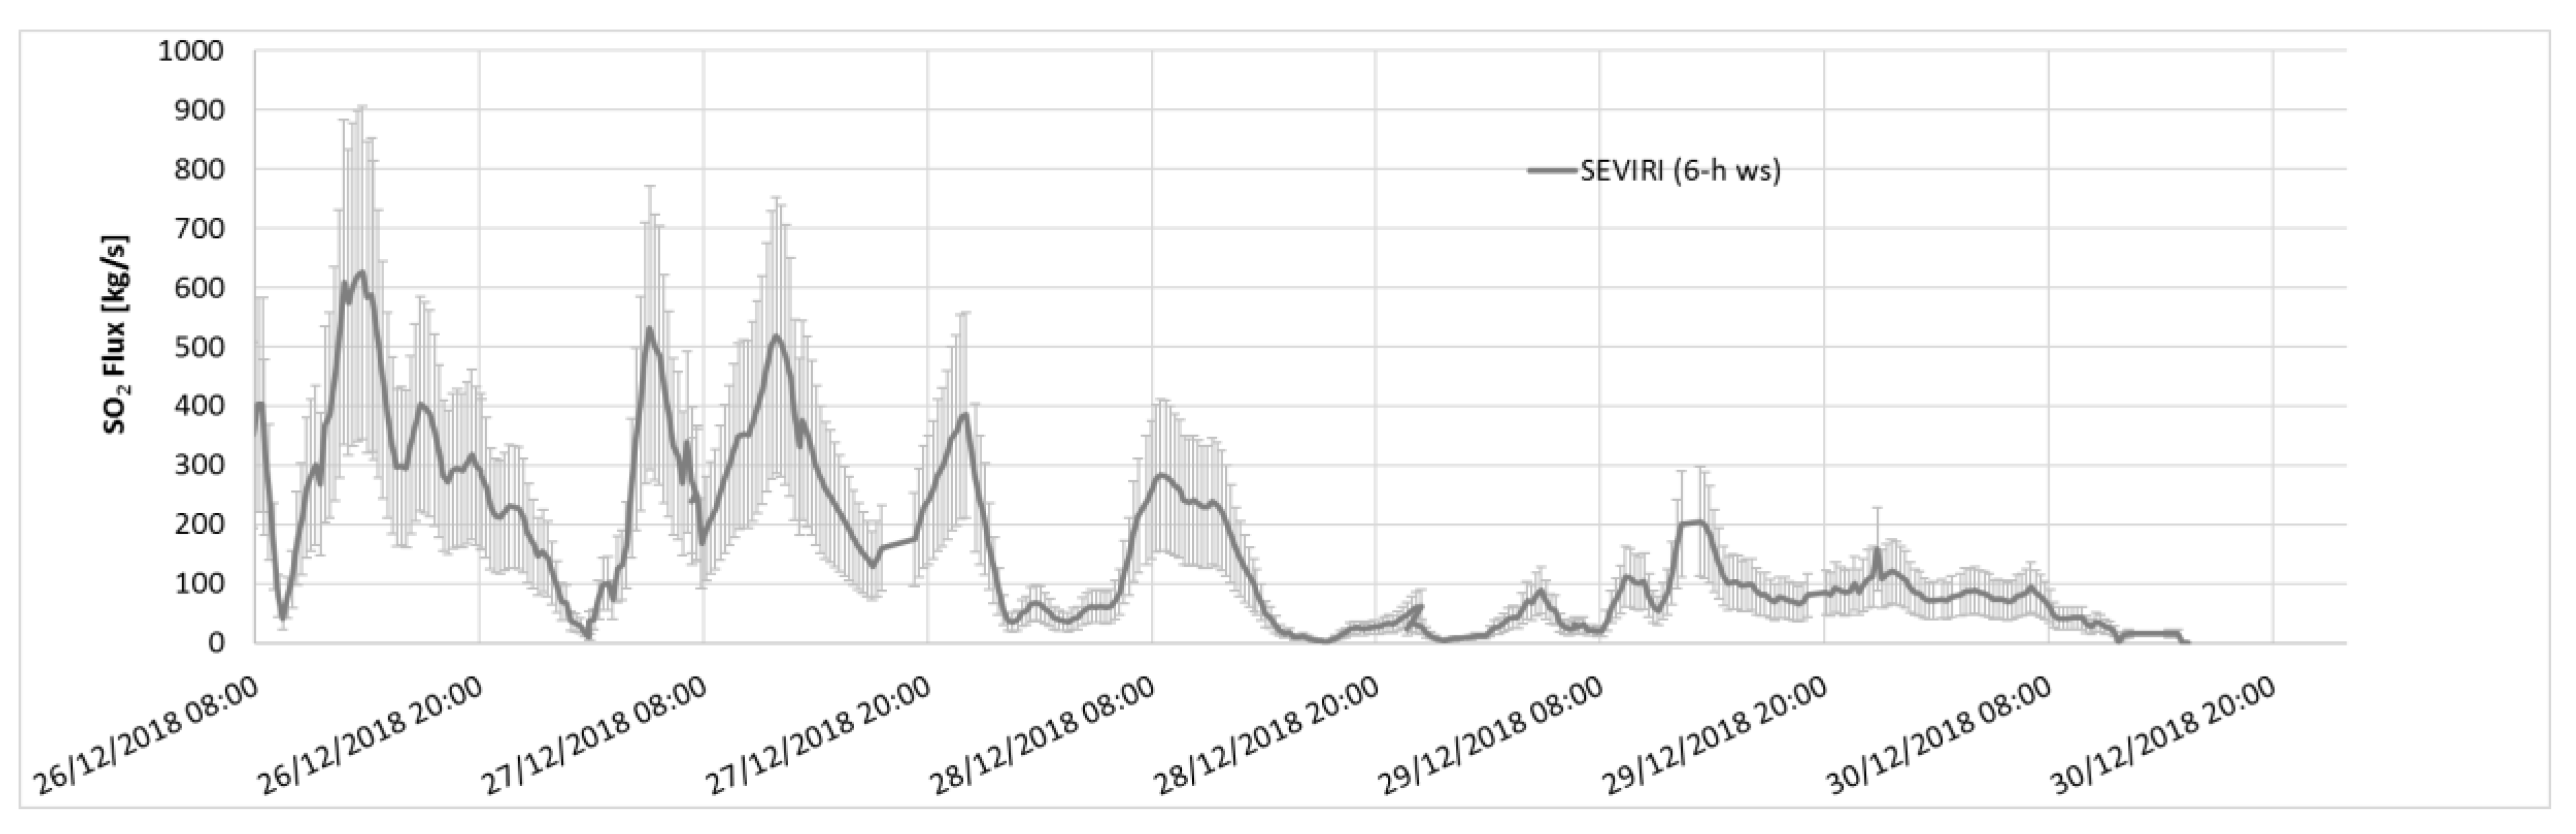
4.2. SO2 Flux
5. SO2 Flux Uncertainty Reduction and Assessment
6. Discussion
7. Conclusions
Author Contributions
Funding
Institutional Review Board Statement
Informed Consent Statement
Data Availability Statement
Acknowledgments
Conflicts of Interest
References
- Oppenheimer, C.; Scaillet, B.; Martin, R.S. Sulfur Degassing from Volcanoes: Source Conditions, Surveillance, Plume Chemistry and Earth System Impacts. Rev. Miner. Geochem. 2011, 73, 363–421. [Google Scholar] [CrossRef] [Green Version]
- Shinohara, H. Excess degassing from volcanoes and its role on eruptive and intrusive activity. Rev. Geophys. 2008, 46, 4005. [Google Scholar] [CrossRef] [Green Version]
- Chin, M.; Jacob, D.J. Anthropogenic and natural contributions to tropospheric sulfate: A global model analysis. J. Geophys. Res. Space Phys. 1996, 101, 18691–18699. [Google Scholar] [CrossRef]
- Oppenheimer, C.; Kyle, P.; Eisele, F.; Crawford, J.; Huey, G.; Tanner, D.; Kim, S.; Mauldin, L.; Blake, D.; Beyersdorf, A.; et al. Atmospheric chemistry of an Antarctic volcanic plume. J. Geophys. Res. Space Phys. 2010, 115, 04303. [Google Scholar] [CrossRef] [Green Version]
- Thordasson, H.; Self, S. Atmospheric and environmental effects of the 1783–1784 Laki eruption: A review and reassessment. J. Geophys. Res. 2003, 108, AAC7-1–AAC7-29. [Google Scholar]
- Wilson, T.M.; Stewart, C.; Sword-Daniels, V.; Leonard, G.; Johnston, D.; Cole, J.W.; Wardman, J.; Wilson, G.; Barnard, S.T. Volcanic ash impacts on critical infrastructure. Phys. Chem. Earth 2012, 45, 5–23. [Google Scholar] [CrossRef]
- Delmelle, P.; Stix, J.; Baxter, P.P.; Garcia-Alvarez, J.; Barquero, J. Atmospheric dispersion, environmental effects and potential health hazard associated with the low-altitude gas plume of Masaya volcano, Nicaragua. Bull. Volcanol. 2002, 64, 423–434. [Google Scholar] [CrossRef]
- Craig, H.; Wilson, T.; Stewart, C.; Outes, V.; Villarosa, G.; Baxter, P. Impacts to agriculture and critical infrastructure in Argentina after ashfall from the 2011 eruption of the Cordón Caulle volcanic complex: An assessment of published damage and function thresholds. J. Appl. Volcanol. 2016, 5, 1. [Google Scholar] [CrossRef] [Green Version]
- Haywood, J.; Boucher, O. Estimates of the direct and indirect radiative forcing due to tropospheric aerosols: A review. Rev. Geophys. 2000, 38, 513–543. [Google Scholar] [CrossRef]
- Robock, A. Volcanic eruptions and climate. Rev. Geophys. 2000, 38, 191–219. [Google Scholar] [CrossRef]
- Solomon, S.; Daniel, J.S.; Neely, R.R.; Vernier, J.-P.; Dutton, E.G.; Thomason, L.W. The Persistently Variable “Background” Stratospheric Aerosol Layer and Global Climate Change. Science 2011, 333, 866–870. [Google Scholar] [CrossRef] [Green Version]
- Bourassa, A.E.; Robock, A.; Randel, W.J.; Deshler, T.; Rieger, L.A.; Lloyd, N.D.; Llewellyn, E.J.; Degenstein, D.A. Large Volcanic Aerosol Load in the Stratosphere Linked to Asian Monsoon Transport. Science 2012, 337, 78–81. [Google Scholar] [CrossRef] [PubMed] [Green Version]
- Casadevall, T.J. The 1989/1990 eruption of Redoubt Volcano Alaska: Impacts on aircraft operations. J. Volcanol. Geotherm. Res. 1994, 62, 301–316. [Google Scholar] [CrossRef]
- Baxter, P.J.; Ing, R.; Falk, H.; Plikaytis, B. Mount St. Helens Eruptions: The Acute Respiratory Effects of Volcanic Ash in a North American Community. Arch. Environ. Health Int. J. 1983, 38, 3. [Google Scholar] [CrossRef] [PubMed]
- A Mather, T.; Pyle, D.M.; Oppenheimer, C. Tropospheric volcanic aerosol. Extreme Events 2003, 139, 189–212. [Google Scholar] [CrossRef] [Green Version]
- Horwell, C.J.; Baxter, P.J. The respiratory health hazards of volcanic ash: A review for volcanic risk mitigation. Bull. Volcanol. 2006, 69, 1–24. [Google Scholar] [CrossRef]
- Horwell, C.; Baxter, P.; Hillman, S.; Calkins, J.; Damby, D.; Delmelle, P.; Donaldson, K.; Dunster, C.; Fubini, B.; Kelly, F.; et al. Physicochemical and toxicological profiling of ash from the 2010 and 2011 eruptions of Eyjafjallajökull and Grímsvötn volcanoes, Iceland using a rapid respiratory hazard assessment protocol. Environ. Res. 2013, 127, 63–73. [Google Scholar] [CrossRef] [Green Version]
- Thomas, H.E.; Prata, A.J. Sulphur dioxide as a volcanic ash proxy during the April–May 2010 eruption of Eyjafjallajökull Volcano, Iceland. Atmos. Chem. Phys. Discuss. 2011, 11, 6871–6880. [Google Scholar] [CrossRef] [Green Version]
- Sears, T.M.; Thomas, G.E.; Carboni, E.; Smith, A.J.A.; Grainger, R.G. SO2 as a possible proxy for volcanic ash in aviation hazard avoidance. J. Geophys. Res. Atmos. 2013, 118, 5698–5709. [Google Scholar] [CrossRef]
- Allard, P.; Carbonelle, J.; Metrich, N.; Loyer, H.; Zetwoog, P. Solphur ouput and magma degassing budget of Stromboli volcano. Nature 1994, 368, 326–330. [Google Scholar] [CrossRef]
- Caltabiano, T.; Romano, R.; Budetta, G. SO2 flux measurements at Mount Etna (Sicily). J. Geophys. Res. Space Phys. 1994, 99, 12809–12819. [Google Scholar] [CrossRef]
- Edmonds, M.; Oppenheimer, C.; Pyle, D.; Herd, R.; Thompson, G. SO2 emissions from Soufrière Hills Volcano and their relationship to conduit permeability, hydrothermal interaction and degassing regime. J. Volcanol. Geotherm. Res. 2003, 124, 23–43. [Google Scholar] [CrossRef]
- Burton, M.R.; Sawyer, G.M.; Granieri, D. Deep Carbon Emissions from Volcanoes. Rev. Miner. Geochem. 2013, 75, 323–354. [Google Scholar] [CrossRef] [Green Version]
- Aiuppa, A.; Giudice, G.; Gurrieri, S.; Liuzzo, M.; Burton, M.; Caltabiano, T.; Mcgonigle, A.J.S.; Salerno, G.G.; Shinohara, H.; Valenza, M. Total volatile flux from Mount Etna. Geophys. Res. Lett. 2008, 35. [Google Scholar] [CrossRef]
- Aiuppa, A.; Burton, M.; Allard, P.; Caltabiano, T.; Giudice, G.; Gurrieri, S.; Liuzzo, M.; Salerno, G. First observational evidence for the CO2-driven origin of Stromboli’s major explosions. Solid Earth 2011, 2, 135–142. [Google Scholar] [CrossRef] [Green Version]
- Daag, A.; Tubianosa, B.; Newhall, C.; Tungol, N.; Javier, D.; Dolan, M.; Perla, J.; Reyes, D.; Arboleda, R.; Martinez, A.; et al. Monitoring Sulfur Dioxide Emission at Mount Pinatubo. In Fire and Mud: Eruptions and Lahars of Mount Pinatubo, Philippines; Newhall, C., Punongbayan, R., Eds.; PHILVOLCS and USGS: Reston, VA, USA, 1996. [Google Scholar]
- Olmos, R.; Barrancos, J.; Rivera, C.; Barahona, F.; López, D.L.; Henriquez, B.; Hernández, A.; Benitez, E.; Hernandez, P.A.; Pérez, N.M.; et al. Anomalous Emissions of SO2 During the Recent Eruption of Santa Ana Volcano, El Salvador, Central America. Pure Appl. Geophys. 2007, 164, 2489–2506. [Google Scholar] [CrossRef]
- Inguaggiato, S.; Vita, F.; Rouwet, D.; Bobrowski, N.; Morici, S.; Sollami, A. Geochemical evidence of the renewal of volcanic activity inferred from CO2 soil and SO2 plume fluxes: The 2007 Stromboli eruption (Italy). Bull. Volcanol. 2011, 73, 443–456. [Google Scholar] [CrossRef]
- Krueger, A.J. Sighting of El Chichon Sulfur Dioxide Clouds with the Nimbus 7 Total Ozone Mapping Spectrometer. Science 1983, 220, 1377–1379. [Google Scholar] [CrossRef] [Green Version]
- Krueger, A.J.; Walter, L.S.; Bhartia, P.K.; Schnetzler, C.C.; Krotkov, N.A.; Sprod, I.; Bluth, G.J.S. Volcanic sulfur dioxide measurements from the Total Ozone Mapping Spectrometer (TOMS) Instruments. J. Geophys. Res. 1995, 100, 14057–14076. [Google Scholar] [CrossRef] [Green Version]
- Carn, S.A.; Krueger, A.J.; Bluth, G.; Schaefer, S.J.; Krotkov, N.A.; Watson, I.M.; Datta, S. Volcanic eruption detection by the Total Ozone Mapping Spectrometer (TOMS) instruments: A 22-year record of sulphur dioxide and ash emissions. Geol. Soc. Lond. Spéc. Publ. 2003, 213, 177–202. [Google Scholar] [CrossRef] [Green Version]
- Eisinger, M.; Burrows, J.P. Tropospheric sulfur dioxide observed by the ERS-2 GOME instrument. Geophys. Res. Lett. 1998, 25, 4177–4180. [Google Scholar] [CrossRef] [Green Version]
- Rix, M.; Valks, P.; Hao, N.; Van Geffen, J.; Clerbaux, C.; Clarisse, L.; Coheur, P.-F.; Diego, L.; Erbertseder, T.; Zimmer, W.; et al. Satellite Monitoring of Volcanic Sulfur Dioxide Emissions for Early Warning of Volcanic Hazards. IEEE J. Sel. Top. Appl. Earth Obs. Remote. Sens. 2009, 2, 196–206. [Google Scholar] [CrossRef]
- Rix, M.; Valks, P.; Hao, N.; Loyola, D.; Schlager, H.; Huntrieser, H.; Flemming, J.; Koehler, U.; Schumann, U.; Inness, A.; et al. Volcanic SO2, BrO and plume height estimations using GOME-2 satellite measurements during the eruption of Eyjafjallajökull in May 2010. J. Geophys. Res. Space Phys. 2012, 117. [Google Scholar] [CrossRef] [Green Version]
- Afe, O.T.; Richter, A.; Sierk, B.; Wittrock, F.; Burrows, J.P. BrO emission from volcanoes: A survey using GOME and SCIAMACHY measurements. Geophys. Res. Lett. 2004, 31. [Google Scholar] [CrossRef] [Green Version]
- Krotkov, N.; Carn, S.; Krueger, A.; Bhartia, P.; Yang, K. Band residual difference algorithm for retrieval of SO/sub 2/ from the aura ozone monitoring instrument (OMI). IEEE Trans. Geosci. Remote. Sens. 2006, 44, 1259–1266. [Google Scholar] [CrossRef]
- Fioletov, V.E.; McLinden, C.; A Krotkov, N.; Moran, M.D.; Yang, K. Estimation of SO2 emissions using OMI retrievals. Geophys. Res. Lett. 2011, 38. [Google Scholar] [CrossRef]
- Li, C.; Krotkov, N.A.; Carn, S.; Zhang, Y.; Spurr, R.J.D.; Joiner, J. New-generation NASA Aura Ozone Monitoring Instrument (OMI) volcanic SO2 dataset: Algorithm description, initial results, and continuation with the Suomi-NPP Ozone Mapping and Profiler Suite (OMPS). Atmos. Meas. Tech. 2017, 10, 445–458. [Google Scholar] [CrossRef] [Green Version]
- Clarisse, L.; Coheur, P.-F.; Prata, A.J.; Hurtmans, D.; Razavi, A.; Phulpin, T.; Hadji-Lazaro, J.; Clerbaux, C. Tracking and quantifying volcanic SO2 with IASI, the September 2007 eruption at Jebel at Tair. Atmos. Chem. Phys. Discuss. 2008, 8, 7723–7734. [Google Scholar] [CrossRef] [Green Version]
- Clarisse, L.; Hurtmans, D.; Clerbaux, C.; Hadji-Lazaro, J.; Ngadi, Y.; Coheur, P.-F. Retrieval of sulphur dioxide from the infrared atmospheric sounding interferometer (IASI). Atmos. Meas. Tech. 2012, 5, 581–594. [Google Scholar] [CrossRef] [Green Version]
- Walker, J.C.; Carboni, E.; Dudhia, A.; Grainger, R.G. Improved detection of sulphur dioxide in volcanic plumes using satellite-based hyperspectral infrared measurements: Application to the Eyjafjallajökull 2010 eruption. J. Geophys. Res. Space Phys. 2012, 117, 117. [Google Scholar] [CrossRef] [Green Version]
- Carboni, E.; Grainger, R.; Walker, J.; Dudhia, A.; Siddans, R. A new scheme for sulphur dioxide retrieval from IASI measurements: Application to the Eyjafjallajökull eruption of April and May 2010. Atmos. Chem. Phys. Discuss. 2012, 12, 11417–11434. [Google Scholar] [CrossRef] [Green Version]
- Carn, S.A.; Strow, L.L.; de Souza-Machado, S.; Edmonds, Y.; Hannon, S. Quantifying tropospheric volcanic emissions with AIRS: The 2002 eruption of Mt. Etna (Italy). Geophys. Res. Lett. 2005, 32, L02301. [Google Scholar] [CrossRef]
- Corradini, S.; Pugnaghi, S.; Teggi, S.; Buongiorno, M.F.; Bogliolo, M.P. Will ASTER see the Etna SO2 plume? Int. J. Remote Sens. 2003, 24, 1207–1218. [Google Scholar] [CrossRef]
- Urai, M. Sulfur dioxide flux estimation from volcanoes using Advanced Spaceborne Thermal Emission and Reflection Radiometer—a case study of Miyakejima volcano, Japan. J. Volcanol. Geotherm. Res. 2004, 134, 1–13. [Google Scholar] [CrossRef]
- Pugnaghi, S.; Gangale, G.; Corradini, S.; Buongiorno, M. Mt. Etna sulfur dioxide flux monitoring using ASTER-TIR data and atmospheric observations. J. Volcanol. Geotherm. Res. 2006, 152, 74–90. [Google Scholar] [CrossRef]
- Campion, R.; Salerno, G.G.; Coheur, P.-F.; Hurtmans, D.; Clarisse, L.; Kazahaya, K.; Burton, M.; Caltabiano, T.; Clerbaux, C.; Bernard, A. Measuring volcanic degassing of SO2 in the lower troposphere with ASTER band ratios. J. Volcanol. Geotherm. Res. 2010, 194, 42–54. [Google Scholar] [CrossRef]
- Watson, I.M.; Realmuto, V.J.; Rose, W.I.; Prata, A.J.; Blutha, G.J.S.; Gua, Y.; Badera, C.E.; Yu, T. Thermal infrared remote sensing of volcanic emissions using the moderate resolution imaging spectroradiometer. J. Volcanol. Geoth. Res. 2004, 135, 75–89. [Google Scholar] [CrossRef]
- Corradini, S.; Merucci, L.; Prata, A.J. Retrieval of SO2 from thermal infrared satellite measurements: Correction procedures for the effects of volcanic ash. Atmos. Meas. Tech. 2009, 2, 177–191. [Google Scholar] [CrossRef] [Green Version]
- Corradini, S.; Merucci, L.; Prata, A.J.; Piscini, A. Volcanic ash and SO2 in the 2008 Kasatochi eruption: Retrievals comparison from different IR satellite sensors. J. Geophys. Res. Space Phys. 2010, 115, 21. [Google Scholar] [CrossRef]
- Corradini, S.; Guerrieri, L.; Stelitano, D.; Salerno, G.; Scollo, S.; Merucci, L.; Prestifilippo, M.; Musacchio, M.; Silvestri, M.; Lombardo, V.; et al. Near Real-Time Monitoring of the Christmas 2018 Etna Eruption Using SEVIRI and Products Validation. Remote. Sens. 2020, 12, 1336. [Google Scholar] [CrossRef] [Green Version]
- Realmuto, V.J.; Berk, A. Plume Tracker: Interactive mapping of volcanic sulfur dioxide emissions with high-performance radiative transfer modeling. J. Volcanol. Geotherm. Res. 2016, 327, 55–69. [Google Scholar] [CrossRef]
- Prata, A.J.; Kerkmann, J. Simultaneous retrieval of volcanic ash and SO2 using MSG-SEVIRI measurements. Geophys. Res. Lett. 2007, 34. [Google Scholar] [CrossRef] [Green Version]
- Gauthier, P.; Sigmarsson, O.; Gouhier, M.; Haddadi, B.; Moune, S. Elevated gas flux and trace metal degassing from the 2014–2015 fissure eruption at the Bárðarbunga volcanic system, Iceland. J. Geophys. Res. Solid Earth 2016, 121, 1610–1630. [Google Scholar] [CrossRef] [Green Version]
- Ishii, K.; Hayashi, Y.; Shimbori, T. Using Himawari-8, estimation of SO2 cloud altitude at Aso volcano eruption, on October 8, 2016. Earth Planets Space 2018, 70, 19. [Google Scholar] [CrossRef] [Green Version]
- Prata, A.T.; Mingari, L.; Folch, A.; Macedonio, G.; Costa, A. FALL3D-8.0: A computational model for atmospheric transport and deposition of particles, aerosols and radionuclides–Part 2: Model validation. Geosci. Model Dev. 2021, 14, 409–436. [Google Scholar] [CrossRef]
- Theys, N.; De Smedt, I.; Yu, H.; Danckaert, T.; Van Gent, J.; Hörmann, C.; Wagner, T.; Hedelt, P.; Bauer, H.; Romahn, F.; et al. Sulfur dioxide retrievals from TROPOMI onboard Sentinel-5 Precursor: Algorithm theoretical basis. Atmos. Meas. Tech. 2017, 10, 119–153. [Google Scholar] [CrossRef] [Green Version]
- Theys, N.; Hedelt, P.; De Smedt, I.; Lerot, C.; Yu, H.; Vlietinck, J.; Pedergnana, M.; Arellano, S.; Galle, B.; Fernandez, D.; et al. Global monitoring of volcanic SO2 degassing with unprecedented resolution from TROPOMI onboard Sentinel-5 Precursor. Sci. Rep. 2019, 9, 1–10. [Google Scholar] [CrossRef] [PubMed]
- Merucci, L.; Burton, M.; Corradini, S.; Salerno, G.G. Reconstruction of SO2 flux emission chronology from space-based measurements. J. Volcanol. Geotherm. Res. 2011, 206, 80–87. [Google Scholar] [CrossRef]
- Krueger, A.J.; Schnetzler, C.C.; Walter, L.S. The December 1981 eruption of Nyamuragira Volcano (Zaire), and the origin of the “mystery cloud” of early 1982. J. Geophys. Res. Space Phys. 1996, 101, 15191–15196. [Google Scholar] [CrossRef] [Green Version]
- Yurganov, L.N.; Rakitin, V.; Dzhola, A.; August, T.; Fokeeva, E.; George, M.; Gorchakov, G.; Grechko, E.; Hannon, S.; Karpov, A.; et al. Satellite- and ground-based CO total column observations over 2010 Russian fires: Accuracy of top-down estimates based on thermal IR satellite data. Atmos. Chem. Phys. Discuss. 2011, 11, 7925–7942. [Google Scholar] [CrossRef] [Green Version]
- Pardini, F.; Burton, M.; Vitturi, M.D.M.; Corradini, S.; Salerno, G.G.; Merucci, L.; Di Grazia, G. Retrieval and intercomparison of volcanic SO2 injection height and eruption time from satellite maps and ground-based observations. J. Volcanol. Geotherm. Res. 2017, 331, 79–91. [Google Scholar] [CrossRef] [Green Version]
- Queißer, M.; Burton, M.; Theys, N.; Pardini, F.; Salerno, G.G.; Caltabiano, T.; Varnam, M.; Esse, B.; Kazahaya, R. TROPOMI enables high resolution SO2 flux observations from Mt. Etna, Italy, and beyond. Sci. Rep. 2019, 9, 957. [Google Scholar] [CrossRef]
- Theys, N.; Campion, R.; Clarisse, L.; Brenot, H.; Van Gent, J.; Dils, B.; Corradini, S.; Merucci, L.; Coheur, P.-F.; Van Roozendael, M.; et al. Volcanic SO2 fluxes derived from satellite data: A survey using OMI, GOME-2, IASI and MODIS. Atmos. Chem. Phys. Discuss. 2013, 13, 5945–5968. [Google Scholar] [CrossRef] [Green Version]
- Carn, S.A.; Fioletov, V.E.; McLinden, C.; Li, C.; Krotkov, N.A. A decade of global volcanic SO2 emissions measured from space. Sci. Rep. 2017, 7, srep44095. [Google Scholar] [CrossRef] [Green Version]
- Behncke, B.; Branca, S.; Corsaro, R.A.; De Beni, E.; Miraglia, L.; Proietti, C. The 2011–2012 summit activity of Mount Etna: Birth, growth and products of the new SE crater. J. Volcanol. Geotherm. Res. 2014, 270, 10–21. [Google Scholar] [CrossRef]
- De Beni, E.; Behncke, B.; Branca, S.; Nicolosi, I.; Carluccio, R.; Caracciolo, F.D.; Chiappini, M. The continuing story of Etna’s New Southeast Crater (2012–2014): Evolution and volume calculations based on field surveys and aerophotogrammetry. J. Volcanol. Geotherm. Res. 2015, 303, 175–186. [Google Scholar] [CrossRef]
- Corsaro, R.; Andronico, D.; Behncke, B.; Branca, S.; Caltabiano, T.; Ciancitto, F.; Cristaldi, A.; De Beni, E.; La Spina, A.; Lodato, L.; et al. Monitoring the December 2015 summit eruptions of Mt. Etna (Italy): Implications on eruptive dynamics. J. Volcanol. Geotherm. Res. 2017, 341, 53–69. [Google Scholar] [CrossRef]
- Calvari, S.; Bilotta, G.; Bonaccorso, A.; Caltabiano, T.; Cappello, A.; Corradino, C.; Del Negro, C.; Ganci, G.; Neri, M.; Pecora, E.; et al. The VEI 2 Christmas 2018 Etna Eruption: A Small but Intense Eruptive Event or the Starting Phase of a Larger One? Remote. Sens. 2020, 12, 905. [Google Scholar] [CrossRef] [Green Version]
- Kearney, C.S.; Watson, I.M. Correcting satellite-based infrared sulfur dioxide retrievals for the presence of silicate ash. J. Geophys. Res. Space Phys. 2009, 114, 22208. [Google Scholar] [CrossRef] [Green Version]
- Krotkov, N.; Krueger, A.J.; Bhartia, P.K. Ultraviolet optical model of volcanic clouds for remote sensing of ash and sulfur dioxide. J. Geophys. Res. Space Phys. 1997, 102, 21891–21904. [Google Scholar] [CrossRef]
- Yang, K.; Liu, X.; Bhartia, P.; Krotkov, N.A.; Carn, S.A.; Hughes, E.J.; Krueger, A.J.; Spurr, R.J.D.; Trahan, S.G. Direct retrieval of sulfur dioxide amount and altitude from spaceborne hyperspectral UV measurements: Theory and application. J. Geophys. Res. Space Phys. 2010, 115, D00L09. [Google Scholar] [CrossRef] [Green Version]
- Gangale, G.; Prata, A.; Clarisse, L. The infrared spectral signature of volcanic ash determined from high-spectral resolution satellite measurements. Remote. Sens. Environ. 2010, 114, 414–425. [Google Scholar] [CrossRef]
- Clarisse, L.; Prata, F. Infrared Sounding of Volcanic Ash. In Volcanic Ash; Elsevier BV: Amsterdam, The Netherlands, 2016; pp. 189–215. [Google Scholar]
- Pugnaghi, S.; Guerrieri, L.; Corradini, S.; Merucci, L.; Arvani, B. A new simplified procedure for the simultaneous SO2 and ash retrieval in a tropospheric volcanic cloud. Atmos. Meas. Tech. 2013, 6, 1315–1327. [Google Scholar] [CrossRef] [Green Version]
- Pugnaghi, S.; Guerrieri, L.; Corradini, S.; Merucci, L. Real time retrieval of volcanic cloud particles and SO2 by satellite using an improved simplified approach. Atmos. Meas. Tech. 2016, 9, 3053–3062. [Google Scholar] [CrossRef] [Green Version]
- Guerrieri, L.; Merucci, L.; Corradini, S.; Pugnaghi, S. Evolution of the 2011 Mt. Etna ash and SO2 lava fountain episodes using SEVIRI data and VPR retrieval approach. J. Volcanol. Geotherm. Res. 2015, 291, 63–71. [Google Scholar] [CrossRef]
- Prata, A.J.; Bernardo, C. Retrieval of volcanic SO2 column abundance from Atmospheric Infrared Sounder data. J. Geophys. Res. Space Phys. 2007, 112, D20. [Google Scholar] [CrossRef]
- Corradini, S.; Pugnaghi, S.; Piscini, A.; Guerrieri, L.; Merucci, L.; Picchiani, M.; Chini, M. Volcanic Ash and SO2 retrievals using synthetic MODIS TIR data: Comparison between inversion procedures and sensitivity analysis. Ann. Geophys 2014, 57, 2. [Google Scholar]
- Bauduin, S.; Clarisse, L.; Hadji-Lazaro, J.; Theys, N.; Clerbaux, C.; Coheur, P.-F. Retrieval of near-surface sulfur dioxide (SO2) concentrations at a global scale using IASI satellite observations. Atmos. Meas. Tech. 2016, 9, 721–740. [Google Scholar] [CrossRef] [Green Version]
- Scollo, S.; Prestifilippo, M.; Pecora, E.; Corradini, S.; Merucci, L.; Spata, G.; Coltelli, M. Eruption column height estimation of the 2011-2013 Etna lava fountains. Ann. Geophys. 2014, 57, 0214. [Google Scholar]
- Scollo, S.; Prestifilippo, M.; Spata, G.; D’Agostino, M.; Coltelli, M. Monitoring and forecasting Etna volcanic plumes. Nat. Hazards Earth Syst. Sci. 2009, 9, 1573–1585. [Google Scholar] [CrossRef] [Green Version]
- Clarisse, L.; Coheur, P.-F.; Theys, N.; Hurtmans, D.; Clerbaux, C. The 2011 Nabro eruption, a SO2 plume height analysis using IASI measurements. Atmos. Chem. Phys. Discuss. 2014, 14, 3095–3111. [Google Scholar] [CrossRef] [Green Version]


| Sensor | Satellite | Orbit | Type | Spectral Range | Spatial Resolution (km2) | Temporal Resolution (@ Midlatitudes) (Per Day) | Algorithm for SO2 retrievals (*) = Operational Products | SO2 Absorption Band | Detection Limit (t/km2) (DU) | Errors (%) |
|---|---|---|---|---|---|---|---|---|---|---|
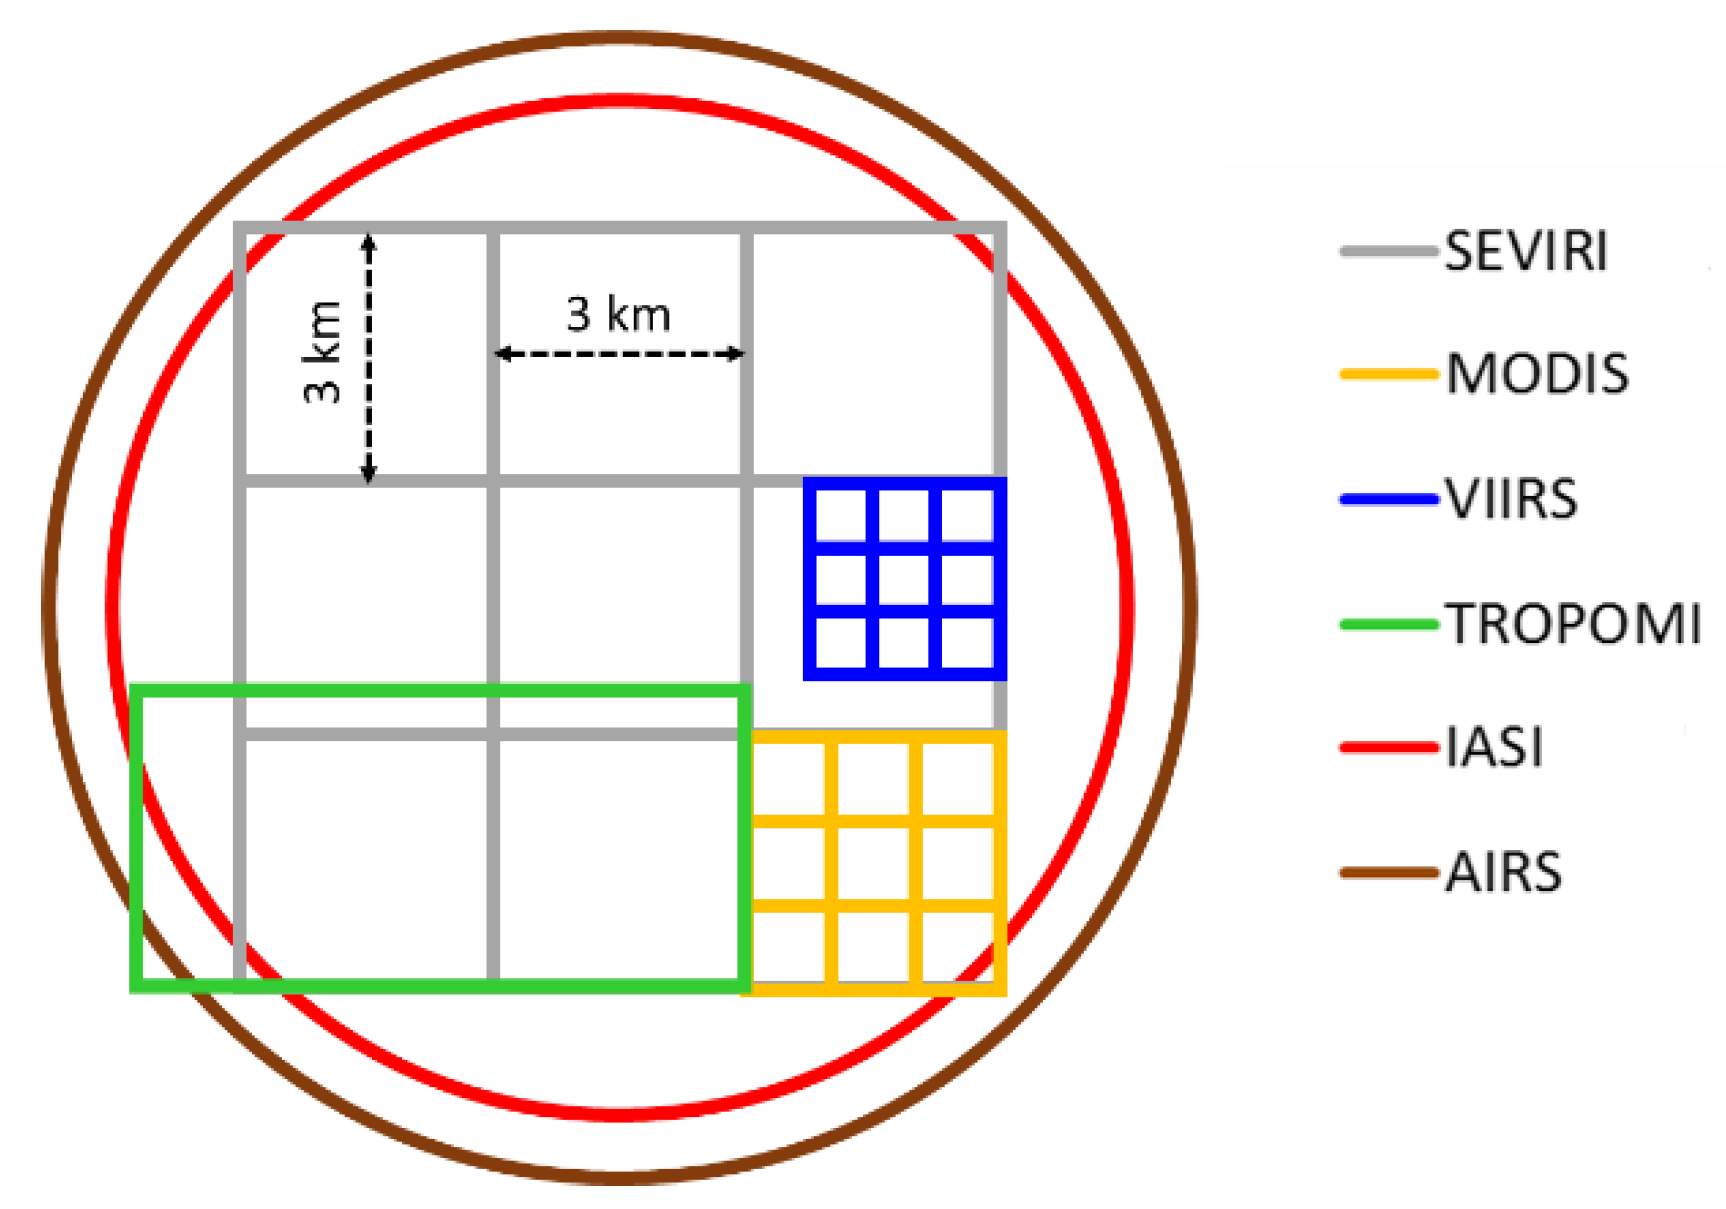
| SEVIRI | MSG (EUMETSAT) | GEO | Multi | VIS-TIR (0.6–13.4 μm,12 bands) | 3 × 3 | 96 or 288 (15 or 5 min) | VPR (Volcanic Plume Retrieval) [75,76,77] | TIR (8.7 μm) | 0.5 (20) | 40 [50,79] |
| MODIS | Terra/Aqua (NASA) | LEO | Multi | VIS-TIR (0.6–14.4 μm, 36 bands) | 1 × 1 (TIR) | 2–4 | VPR (Volcanic Plume Retrieval) [75,76,77] | TIR(8.7 μm) | 0.5 (20) | 40 [50,79] |
| VIIRS | NPP/NOAA20 (NASA) | LEO | Multi | VIS-TIR (0.6–12 μm, 22 bands) | 0.75 x 0.75 (TIR) | 2–4 | PT (Plume Tracker) [52] | TIR (8.7 μm) | 0.5 (20) | 15 [(**)] |
| TROPOMI | Sentinel5p (ESA) | LEO | Hyper | UV-SWIR (270–500 nm; 675–775 nm; 2305–2385 nm) | 3.5 × 7.2 (3.5 × 5.5 since 6 August 2019) | 1–2 | DOAS (Differential Optical Absorption Spectroscopy) [57,58] | UV (312–326 nm, 325–335 nm, 360–390 nm) | 0.009–0.02 (0.3–0.7) | 35 [58] |
| IASI | Metop-A/B (EUMETSAT) | LEO | Hyper | IR (3.6–15.5 μm) | Circular, 12 km diameter | 4 | LUT (look-up-table) [39,40] | TIR (7.3 μm) | 0.003–0.1 (*) (0.1–5) | 50 [40] |
| AIRS | Aqua (NASA) | LEO | Hyper | IR (3.7–6.6 μm; 8.8–15.4 μm; 6.2–8.2 μm) | Circular, 13.5 km diameter | 1–2 | Spectral Matching and Optimal Estimation [78] | TIR (7.3 μm) | 0.2 (6) | ±6 DU (rms) [78] |
| Instruments | Images Processed |
|---|---|
| SEVIRI (400 images) | From 26 December @ 08:00 UTC to 30 December @ 12:00 UTC, every 15 min |
| MODIS (14 images) | Aqua, 26/12 11:35 UTC; Terra, 26/12 21:00 UTC; Aqua, 27/12 01:15 UTC; Terra, 27/12 10:40 UTC; Aqua, 27/12 12:20 UTC; Aqua, 28/12 00:20 UTC; Aqua, 28/12 11:25 UTC; Terra, 28/12 09:45 UTC; Terra, 28/12 20:50 UTC; Aqua, 29/12 01:05 UTC; Terra, 29/12 10:30 UTC; Aqua, 29/12 12:05 UTC; Aqua, 30/12 01:45 UTC; Terra, 30/12 09:35 UTC |
| VIIRS (12 images) | NPP, 26/12 11:18 UTC; N20, 26/12 12:06 UTC; NPP, 27/12 11:00 UTC; N20, 27/12 11:48 UTC; NPP, 27/12 12:42 UTC; N20, 28/12 11:00 UTC; NPP, 28/12 12:18 UTC; N20; 09/12 11:12 UTC; NPP, 29/12 12:00 UTC; N20, 30/12 10:54 UTC; NPP, 30/12 11:42 UTC; N20, 30/12 12:36 UTC |
| TROPOMI (6 images) | 26/12 11:23 UTC; 27/12 11:03 UTC; 27/12 12:43 UTC; 28/12 12:23 UTC; 29/12 12:08 UTC; 30/12 11:48 UTC (from NRT product) |
| IASI (19 images) | IASI-A, 26/12 08:27 UTC; IASI-B, 26/12 09:33 UTC; IASI-A, 26/12 19:47 UTC; IASI-A, 27/12 08:06 UTC; IASI-B, 27/12 09:12 UTC; IASI-A, 27/12 19:26 UTC; IASI-B, 27/12 20:32 UTC; IASI-A, 28/12 08:36 UTC; IASI-B, 28/12 08:52 UTC; IASI-A, 28/12 19:05 UTC; IASI-B, 28/12 20:11 UTC; IASI-B, 29/12 08:31 UTC; IASI-A, 29/12 09:04 UTC; IASI-B, 29/12 19:50 UTC; IASI-A, 29/12 20:24 UTC; IASI-B, 30/12 08:10 UTC; IASI-A, 30/12 08:44 UTC; IASI-B, 30/12 19:30 UTC; IASI-A, 30/12 20:04 UTC (from NRT product) |
| AIRS (4 images) | 27/12 01:18 UTC; 27/12 12:18 UTC; 29/12 01:06 UTC; 29/12 12:06 UTC |
Publisher’s Note: MDPI stays neutral with regard to jurisdictional claims in published maps and institutional affiliations. |
© 2021 by the authors. Licensee MDPI, Basel, Switzerland. This article is an open access article distributed under the terms and conditions of the Creative Commons Attribution (CC BY) license (https://creativecommons.org/licenses/by/4.0/).
Share and Cite
Corradini, S.; Guerrieri, L.; Brenot, H.; Clarisse, L.; Merucci, L.; Pardini, F.; Prata, A.J.; Realmuto, V.J.; Stelitano, D.; Theys, N. Tropospheric Volcanic SO2 Mass and Flux Retrievals from Satellite. The Etna December 2018 Eruption. Remote Sens. 2021, 13, 2225. https://0-doi-org.brum.beds.ac.uk/10.3390/rs13112225
Corradini S, Guerrieri L, Brenot H, Clarisse L, Merucci L, Pardini F, Prata AJ, Realmuto VJ, Stelitano D, Theys N. Tropospheric Volcanic SO2 Mass and Flux Retrievals from Satellite. The Etna December 2018 Eruption. Remote Sensing. 2021; 13(11):2225. https://0-doi-org.brum.beds.ac.uk/10.3390/rs13112225
Chicago/Turabian StyleCorradini, Stefano, Lorenzo Guerrieri, Hugues Brenot, Lieven Clarisse, Luca Merucci, Federica Pardini, Alfred J. Prata, Vincent J. Realmuto, Dario Stelitano, and Nicolas Theys. 2021. "Tropospheric Volcanic SO2 Mass and Flux Retrievals from Satellite. The Etna December 2018 Eruption" Remote Sensing 13, no. 11: 2225. https://0-doi-org.brum.beds.ac.uk/10.3390/rs13112225