Article

Impact of Rapid Urban Sprawl on the Local Meteorological Observational Environment Based on Remote Sensing Images and GIS Technology

1
Collaborative Innovation Centre on Forecast and Evaluation of Meteorological Disasters, School of Geographical Sciences, Nanjing University of Information Science & Technology, Nanjing 210044, China
2
School of Atmospheric Physics, Nanjing University of Information Science & Technology, Nanjing 210044, China
3
Institute of Environment, Energy and Sustainability, The Chinese University of Hong Kong, Hong Kong 999077, China
4
State Key Laboratory of Loess and Quaternary Geology, Institute of Earth Environment, Chinese Academy of Sciences, Xi’an 710061, China
*
Author to whom correspondence should be addressed.
These authors contributed equally to this work.
Remote Sens. 2021, 13(13), 2624; https://0-doi-org.brum.beds.ac.uk/10.3390/rs13132624
Submission received: 11 May 2021 / Revised: 29 June 2021 / Accepted: 30 June 2021 / Published: 4 July 2021
(This article belongs to the Section Urban Remote Sensing)

Abstract

:
Rapid increases in urban sprawl affect the observational environment around meteorological stations by changing the land use/land cover (LULC) and the anthropogenic heat flux (AHF). Based on remote sensing images and GIS technology, we investigated the impact of changes in both LULC and AHF induced by urbanization on the meteorological observational environment in the Yangtze River Delta (YRD) during 2000–2018. Our results show that the observational environments around meteorological stations were significantly affected by the rapid expansion of built-up areas and the subsequent increase in the AHF, with a clear spatiotemporal variability. A positive correlation was observed between the proportion of built-up areas and the AHF around meteorological stations. The AHF was in the order urban stations > suburban stations > rural stations, but the increases in the AHF were greater around suburban and rural stations than around urban stations. Some meteorological stations need to be relocated to address the adverse effects induced by urbanization. The proportion of built-up areas and AHF around the new stations decreased significantly after relocation, weakening the urban heat island effect on the meteorological observations and substantially improving the observational environment. As a result, the observed daily mean temperature (relative humidity) decreased (increased) around the new stations after relocation. Our study comprehensively shows the impact of rapid urban sprawl on the observational environment around meteorological stations by assessing changes in both LULC and the AHF induced by urbanization. These findings provide scientific insights for the selection and construction of networks of meteorological stations and are therefore helpful in scientifically evaluating and correcting the impact of rapid urban sprawl on meteorological observations.

Graphical Abstract

1. Introduction

With the rapid increases in urban sprawl and economic development in China over the last 20 years, a large number of meteorological stations have gradually become surrounded by urban areas and many of them are now located in city centers. This has led to changes in the land use/land cover (LULC) around stations [1] and a deterioration in the representativeness of the meteorological observational environment [2]. This has had a severe impact on the accuracy, representativeness and homogeneity of meteorological observational data [3,4,5,6]. Scientific and quantitative assessments of the changes in the meteorological observational environment are therefore important in weather and climate research [7,8,9,10].
Traditional surveys of the observational environment have mainly used methods such as field surveys, which often have poor accuracy and timeliness. Previous studies of regional climate change and urbanization effects usually distinguished urban and rural stations based on the population of the surrounding area and then used the results in comparative analyses of the temperature elements [11]. This discrimination method does not consider factors such as whether the station is located within the city, the natural conditions around the station or the characteristics of the underlying surface [12]. Satellite remote sensing has the characteristics of wide-area coverage and periodicity and is used as an important technical for LULC in various regions of the world. The method details are constantly updated, with more application areas and better results [13,14,15]. Satellite data can provide accurate and extensive real-time information about changes at meteorological stations and in the surrounding observational environment, facilitate the accurate classification of stations and effectively reproduce historical environmental changes such as changes in LULC around stations [16,17].
With recent rapid developments in remote sensing technology, satellite data have been increasingly used to evaluate observational environments. For example, high-resolution remote sensing images on Google Earth [3], the land surface temperature inversion products of MODIS (the moderate resolution imaging spectroradiometer) [12] and nighttime light image [17] have all been used to obtain information about the land use types and thermal environments around meteorological stations to quantitatively evaluate the meteorological observational environment [12,18]. Shi et al. [6] analyzed the spatial distribution of the surface thermal environment in the buffer zone around stations and the temporal and spatial variation of the thermal environment contribution index. They showed that urban-type LULC is the main factor affecting the distribution of the thermal environment in the buffer zone around the station. This further consolidates the rationality for the assessment of urbanization-induced observational environment change around the meteorological station.
Many studies have shown that the anthropogenic heat flux (AHF) can affect meteorological observations and climate within 5 km of the station through turbulence and advection [19,20,21,22,23,24,25,26]. Therefore, changes in the thermal environment around the station cannot be ignored when analyzing and evaluating the representativeness of the observational environment based on the attributes of the underlying surface alone. In particular, it is not clear whether the changes in the AHF around the station caused by urbanization have temporal or spatial effects on the observational environment.
The distance between cities has decreased over the last 20 years and the rapid development of urban sprawl has greatly changed LULC and exacerbated the risk of extreme weather and climate events, posing serious threats to public health and agricultural production [27,28,29,30]. Therefore, assessing the impact of the rapid urban sprawl in the Yangtze River Delta (YRD) of China on the observational environment has important scientific significance and applications demonstration value [17,31]. Notably, YRD is one of the fastest urbanization areas in China and can typically represent the characteristics of the urbanization process in developing countries. Urbanization will bring the rapid growth of wealth, carbon emissions and urban population. These are the relevant indicators about globalization and the shifting centers of gravity of world’s human [32]. Therefore, the urbanization of the YRD is not only a domestic topic in China but also an international one. Exploring the impact of rapid urban sprawl on the local meteorological observational environment in the YRD is of a typical reference to the urbanization on a global scale.
We selected 76 meteorological stations within the YRD, and then identified the proportion of built-up area (PBA) and obtained AHF data in a 5 km buffer zone around each station from Landsat and night-time illumination data from satellites. We systematically explored the impact of various factors of rapid urban sprawl on the local meteorological observational environment, including the relocation of stations, changes in the underlying surface and the AHF. The rest of this paper is organized as follows. Section 2 introduces the data and analysis methods. Section 3 summarizes the impact of urbanization, AHF and station relocation on the meteorological observational environment. Section 4 discusses our results and future research directions. Our conclusions are provided in Section 5.

2. Materials and Methods
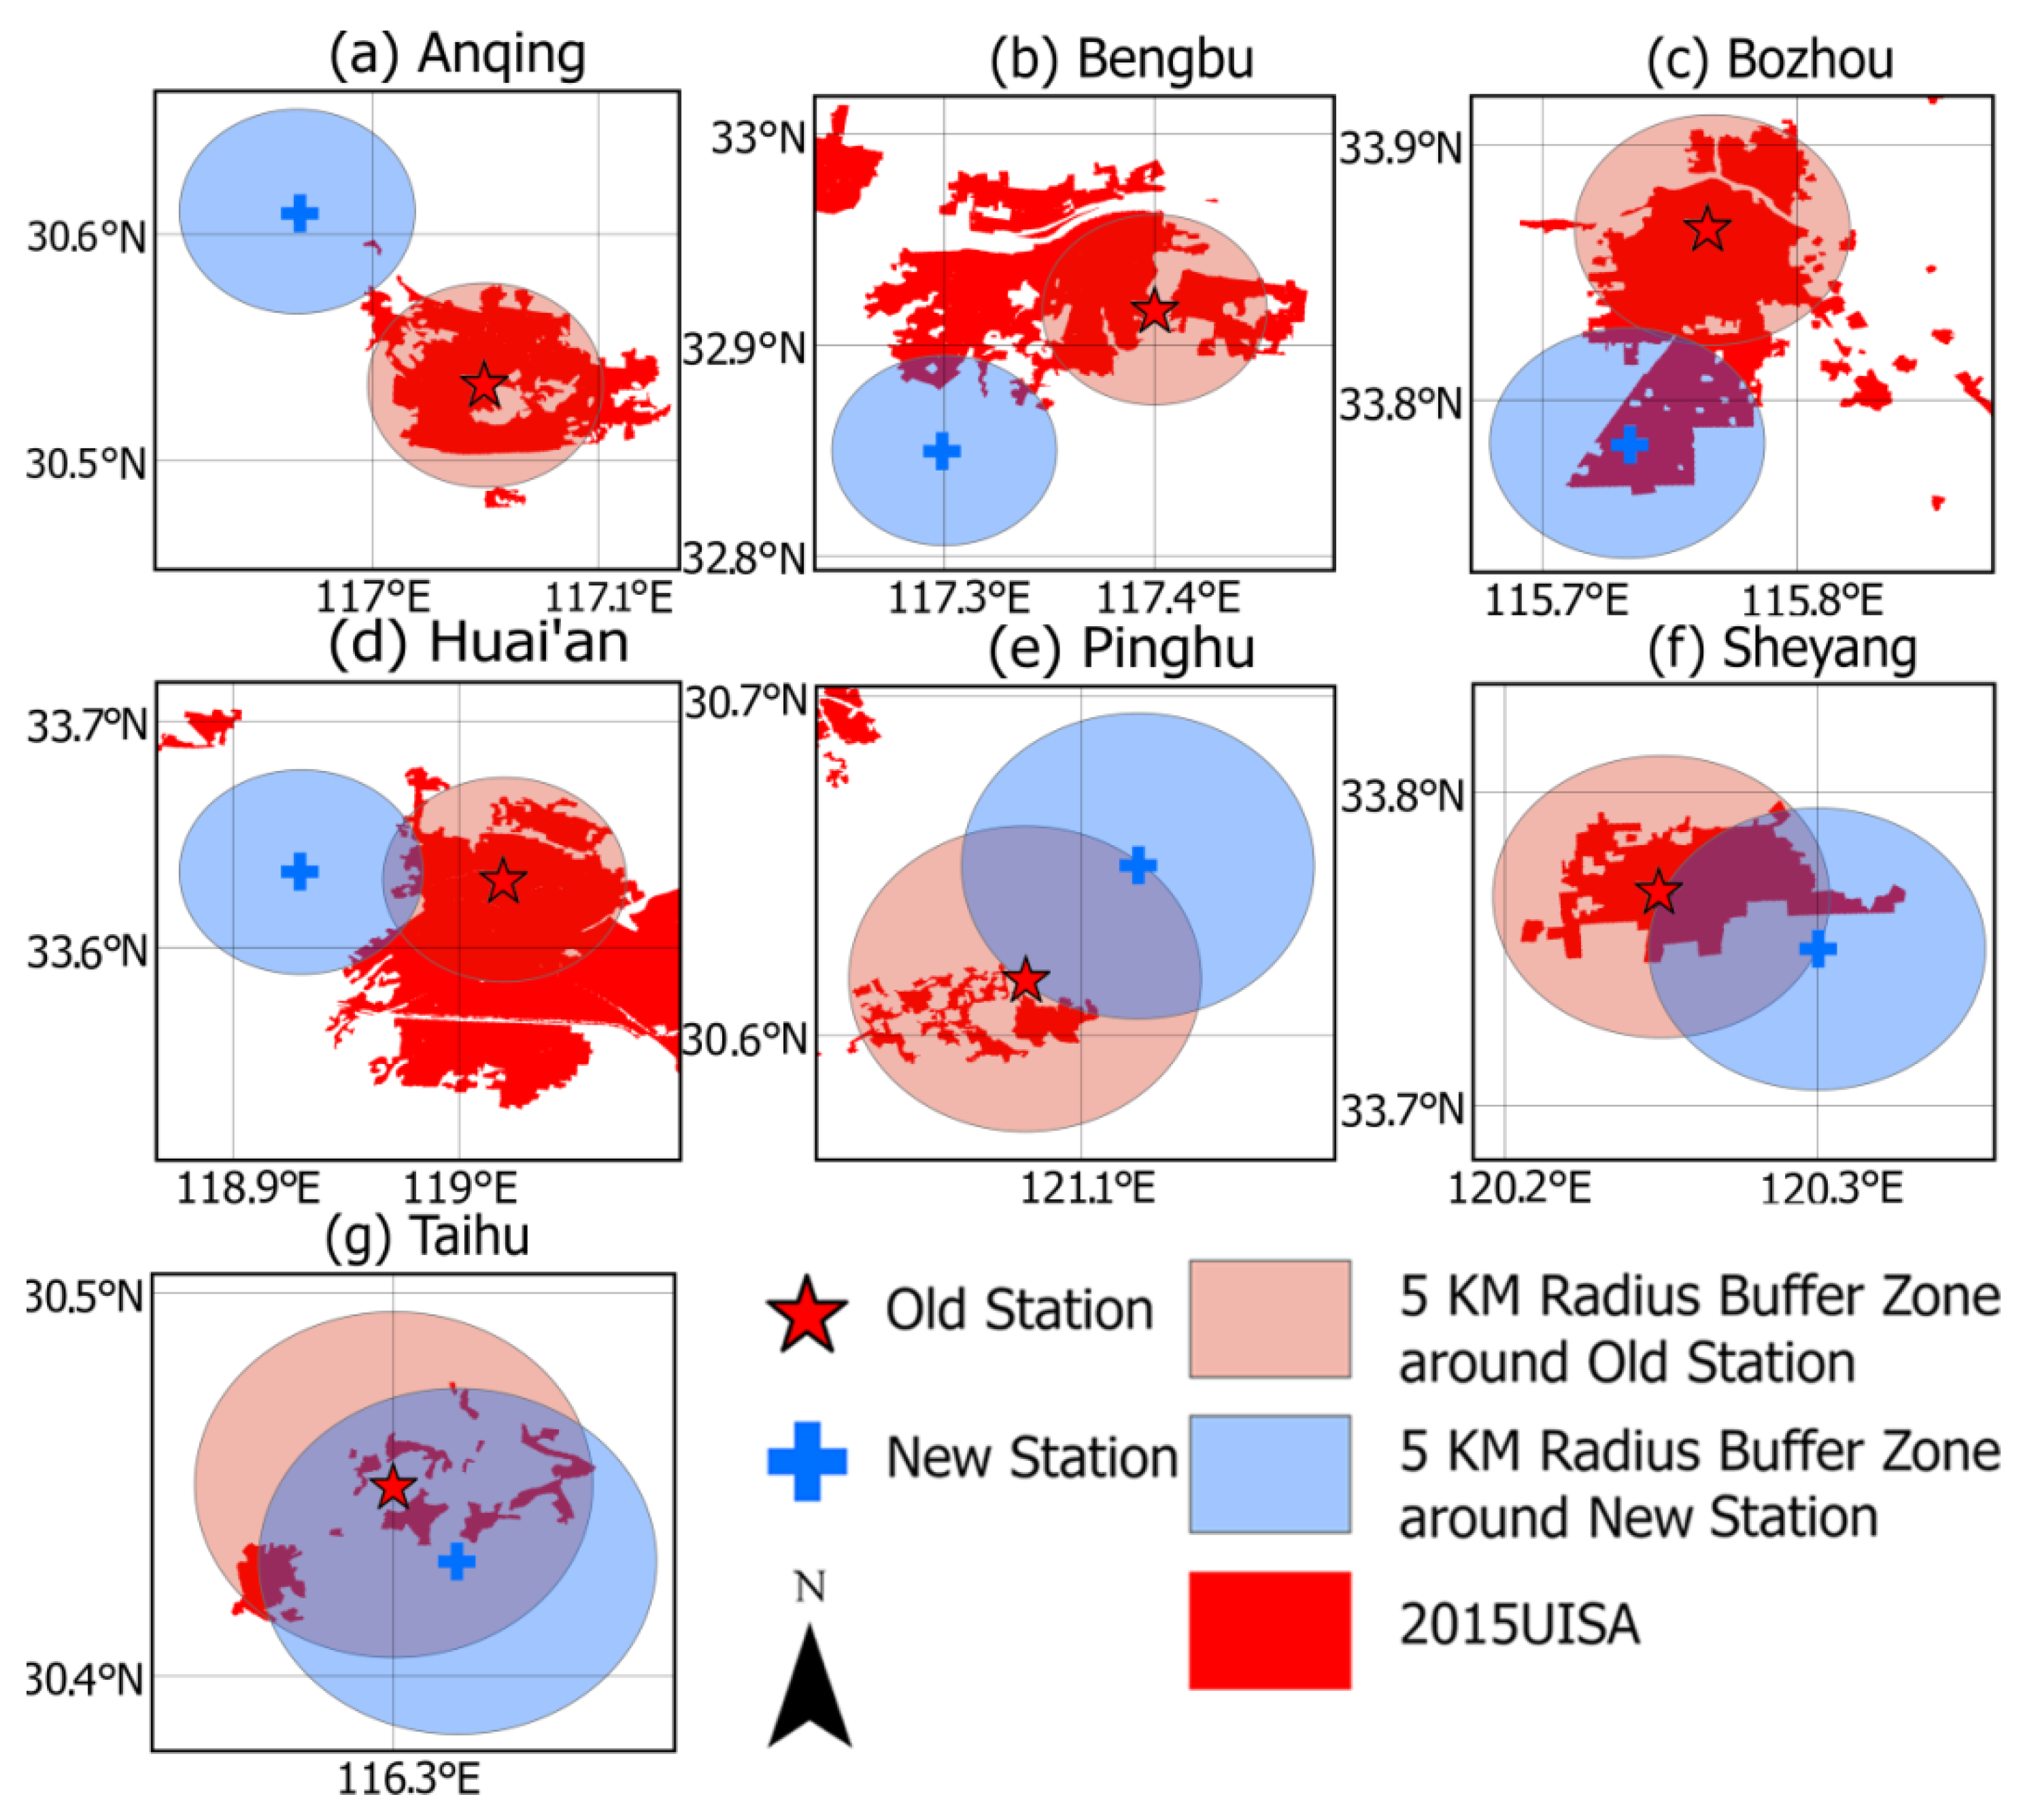
2.1. Study Areas

As shown in Figure 1, the YRD is an alluvial plain located in the lower reaches of the Yangtze River and ranges between 115–123°E, 32–29°N. It covers 26 cities in Jiangsu, Zhejiang and Anhui provinces and Shanghai, covering an area of 225,000 square kilometers. This region has the highest density of river networks in China and dominated by plains, with an average elevation of about 50 m. The subtropical monsoon climate controls in the YRD and thus induces the four distinct seasons. The annual average temperature is about 14–18 °C, January and July are observed the lowest and highest temperatures, respectively. The annual total precipitation is about 1000–1400 mm, concentrated in spring and summer seasons.

2.2. Selection of Meteorological Stations

Based on the observational environment around the stations in YRD and high-resolution satellite remote sensing imaging, we selected 76 meteorological stations as the example samples (Figure 1). The chosen stations met the following requirements: (1) the station type was the national benchmark climate station, national basic weather station or national general weather station; (2) the meteorological observational dataset from 2000 to 2018 was basically complete; (3) these meteorological stations were evenly distributed throughout the YRD and were surrounded by different types of LULC. The selected stations can therefore be used to explore the impact of rapidly increasing urban sprawl on the observational environment around meteorological stations. Previous studies have shown that the maximum range of affecting observational data under advection and turbulence transport conditions does not usually exceed 5 km [6,7]. We therefore took the meteorological stations as the center of the buffer area with a radius of 5 km to quantitatively evaluate the impact of urbanization on the observational environment.
Seven groups of relocated stations were selected to compare the observational environment before and after relocation (also see Figure 1). The chosen relocated stations met the following requirements [10]: (1) the relocation was mainly due to the deterioration of the meteorological observational environment; (2) the difference in elevation before and after relocation was < 50 m and the horizontal distance was 20 km; (3) there was no significant difference in topography before and after relocation; and (4) the type of observational instruments had not changed. Among the seven groups of stations, Bozhou, Bengbu and Anqing stations were located in the northern plains, middle hills and southern mountainous area of the YRD, respectively, which shows that they had good regional representation. On the other hand, after checking the meteorological dataset, we found that only the data of the daily mean temperature and relative humidity data (old station minus new station) at Anqing Station in 2012, Bengbu Station in 2013 and Bozhou Station in 2014 were complete, accurate and comparable. We chose them to analyze the observational data from the old and new stations and to explore the impact of the rapid increase in urban sprawl on the meteorological observations.
To compare the relationship between AHF and PBA of the relocated stations and other stations (also see Figure 1), seven reference stations without relocation history were selected. The selected reference stations should be located around the relocated stations and belong to different types of stations (including two city stations, three suburban stations, and two rural stations), indicating that these reference stations can represent the whole area of YRD. We selected the daily mean temperature of all relocated stations and reference stations from 2010 to 2015 for considering whether the characteristics of the relocated stations’ meteorological data were contextualized in a more general trend in the whole YRD region. All the relocations took place during this period, and the data of the 14 stations during this period were complete and accurate.

2.3. Classification of Meteorological Stations

The urban impervious surface area (UISA) [33] refers to the urban impervious surface features caused by artificial land use activities, such as building roofs, asphalt or cement roads and parking lots. The coverage of the impervious surface is the percentage of the existing impervious surface area to the total surface area. This is an important component of research on environmental change in urban areas and reflects the impact of urban sprawl on the underlying surface. We established a buffer zone with a radius of 5 km centered on the station and then calculated the proportion of impervious surface area in the buffer zone to the total area. Ranking all stations from the largest to smallest, the first to 26th (the top third) stations were classified as urban stations, the 27th to 51th (the middle third) were suburban stations and the last 26 stations (bottom third) were rural stations.

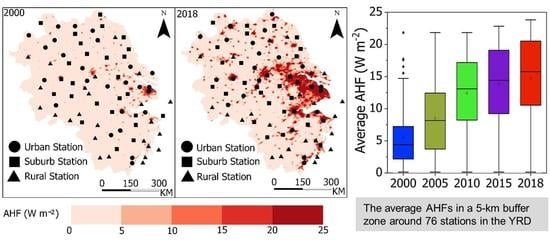
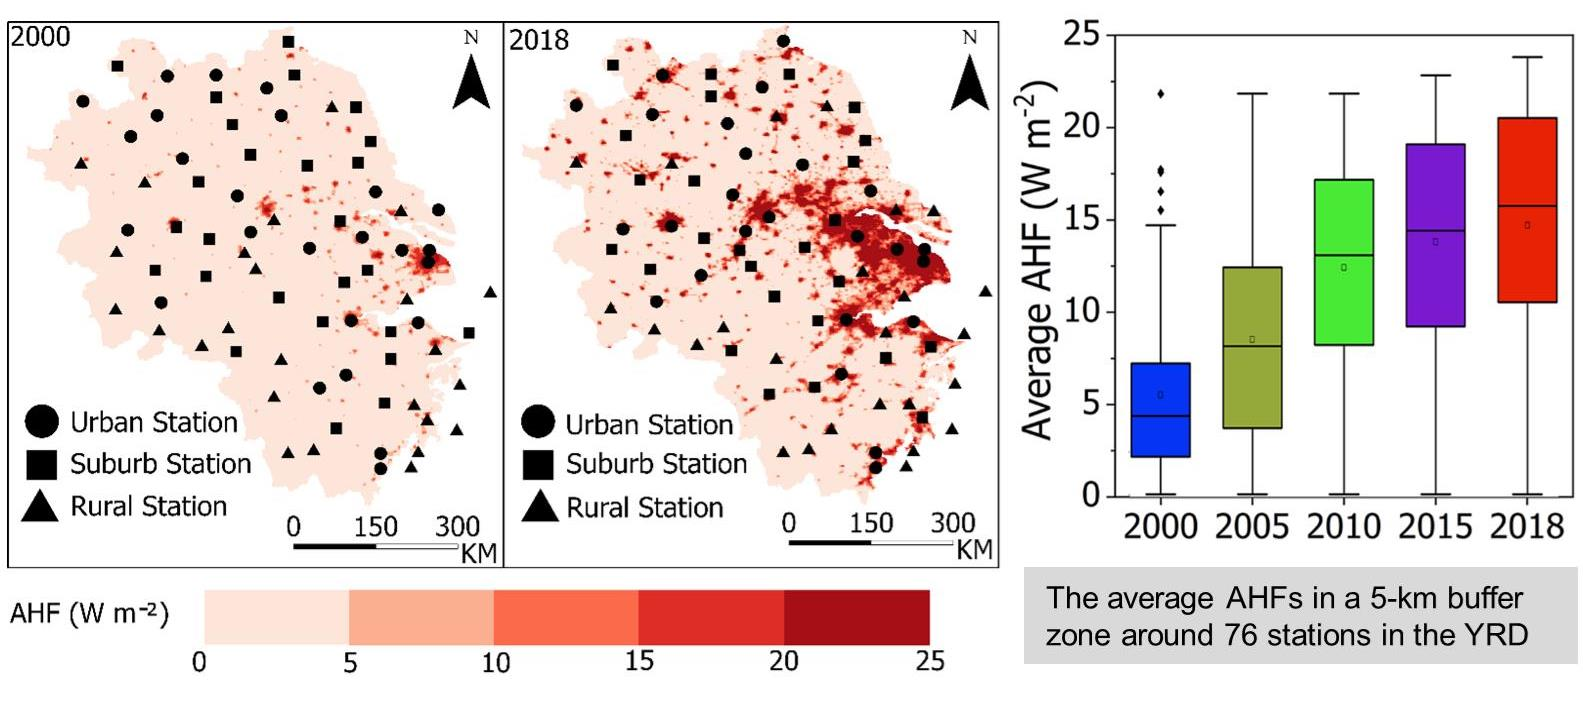
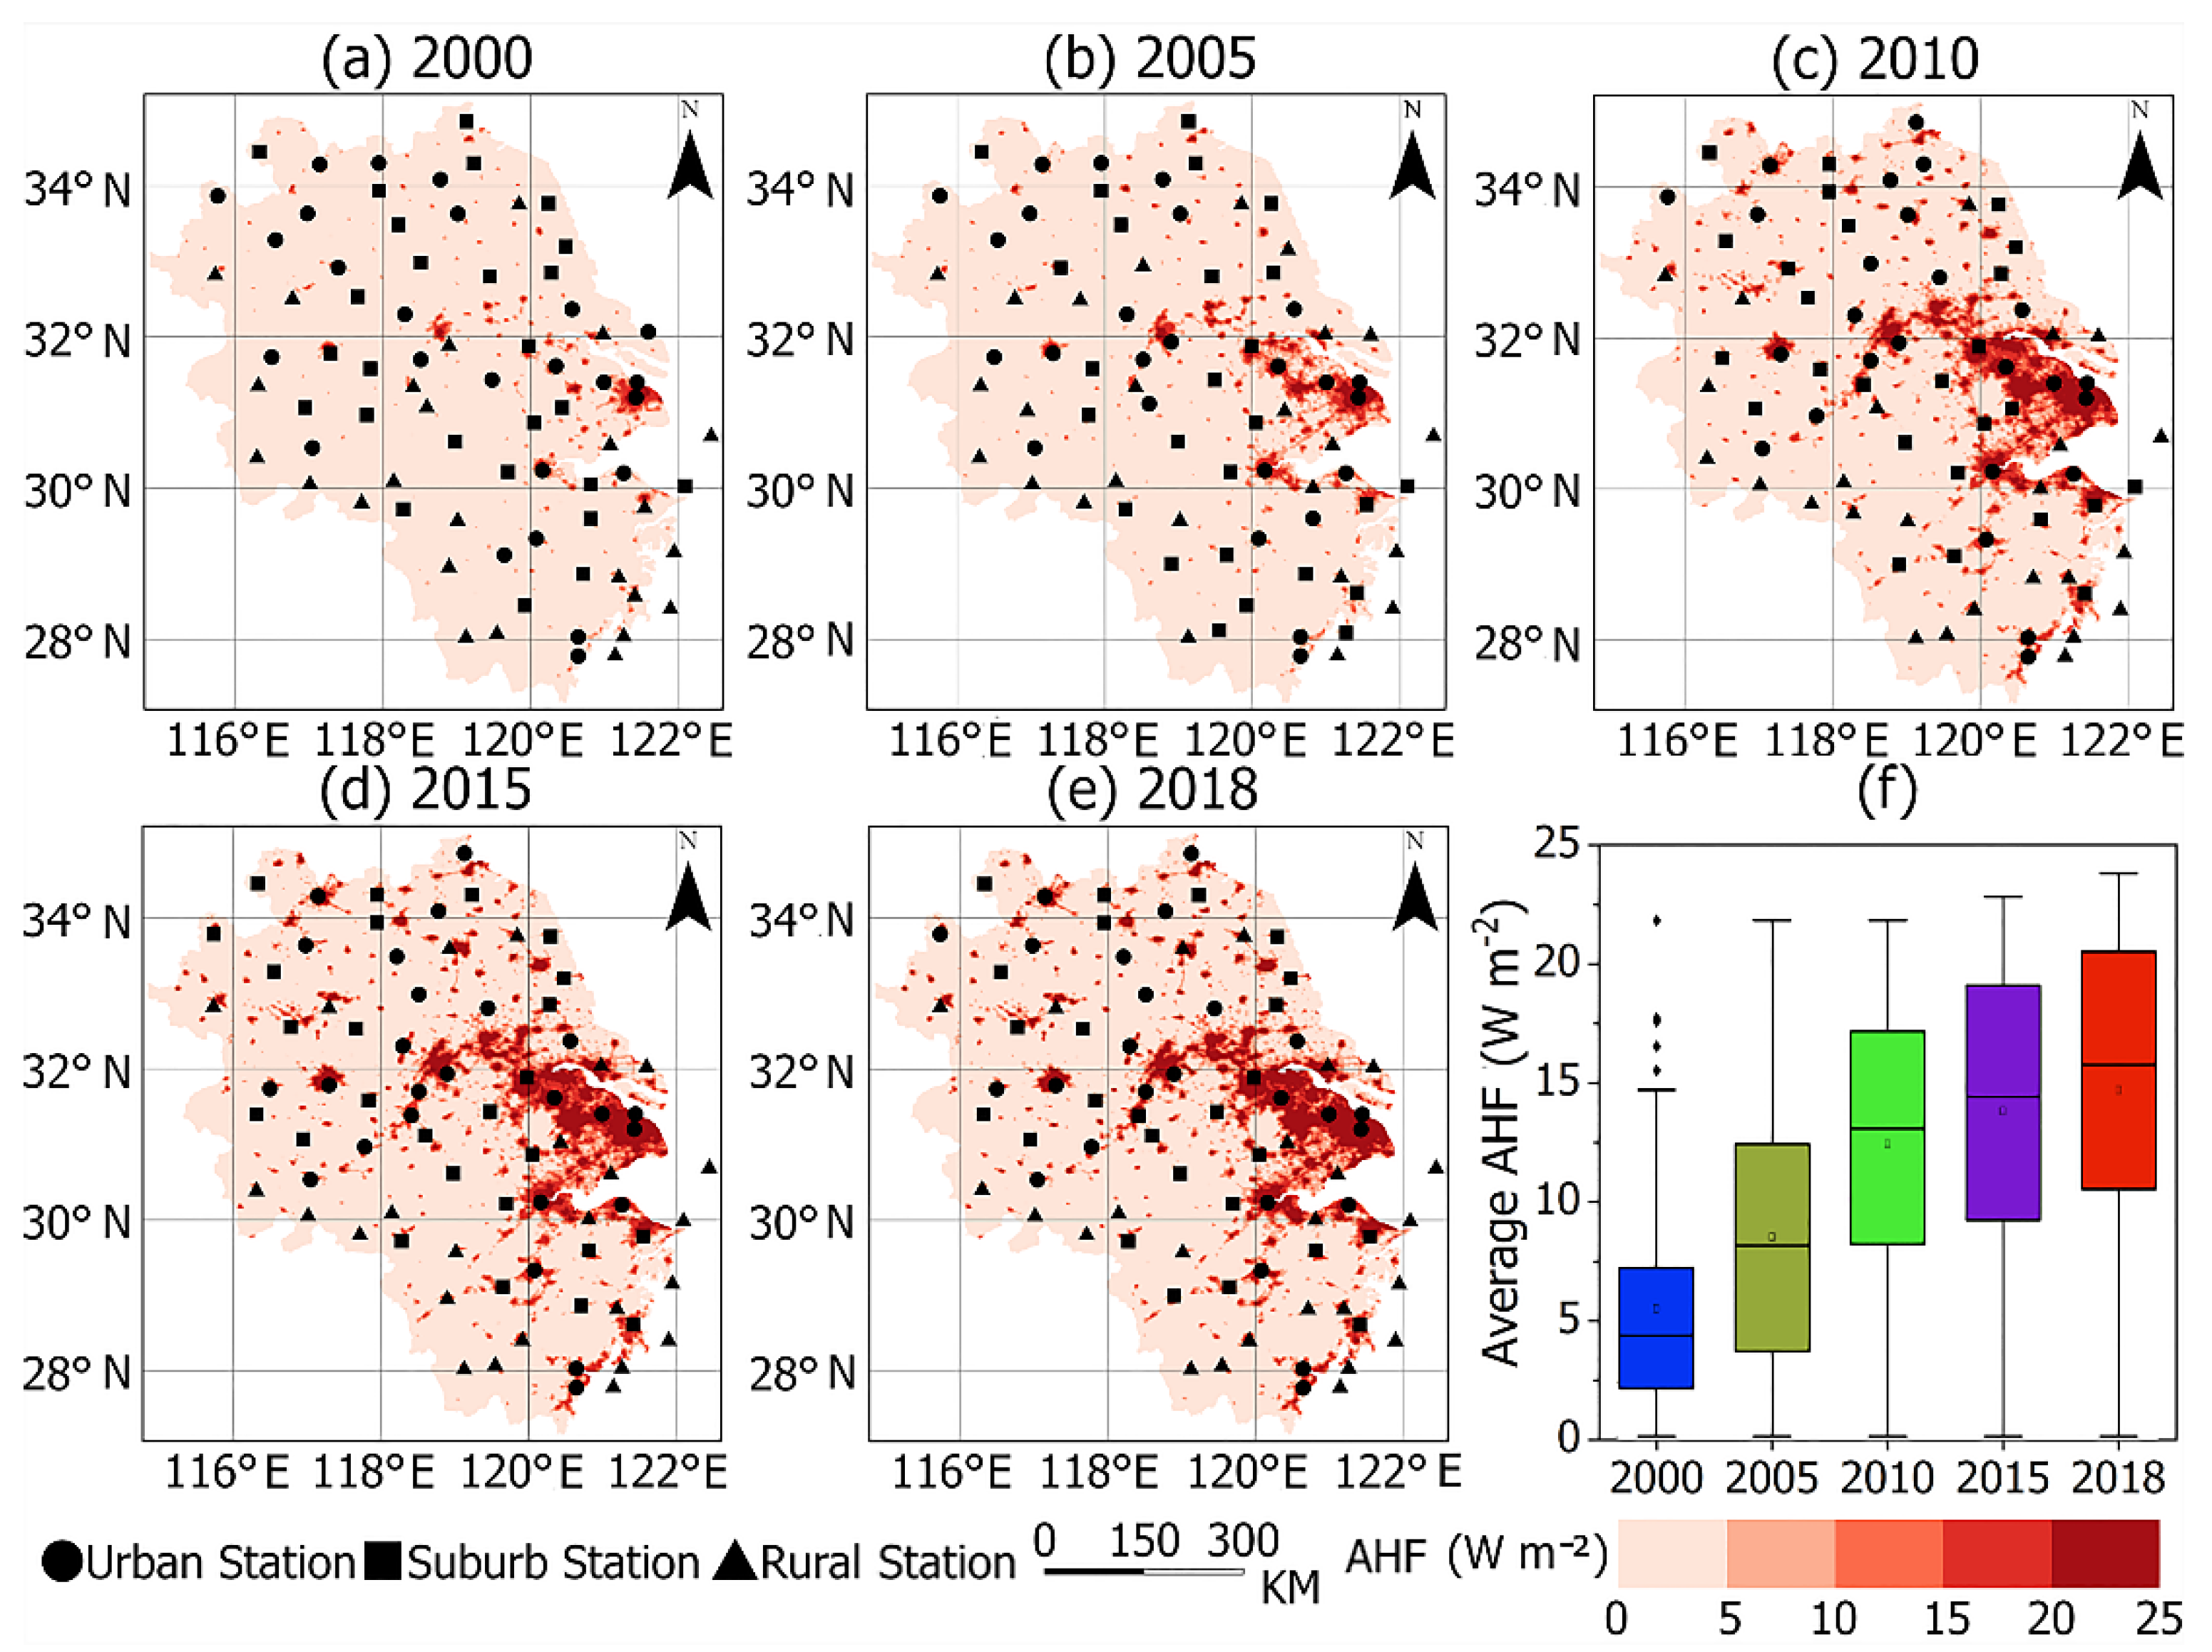
2.4. Anthropogenic Heat Environment around Meteorological Stations

Assuming that all the energy consumed by humans is eventually converted into heat, the AHF density (Qa, units: J s−1 m−2) in a specific area and time can be approximated by:
Q a = E c t · A ,
where E c , t and A represent the energy consumption, time and area, respectively. This method is based on the night-time satellite data being consistent with local economic development and energy consumption statistics and has been shown to help in estimating the AHF [16,17,18,19,20]. The high-resolution distribution of the AHF in the YRD was retrieved by acquiring data from two NOAA optical satellites operating during the night based on these principles. This study used inversion to obtain the high-resolution AHF in the YRD from the continuous, stable nighttime light data and energy statistics from 2000 to 2018 as described by Chen et al. [19].
We used two methods to determine the AHF around the meteorological stations. The first method was based on a classification system in which the AHF values in the buffer zone were divided into low AHF (L; <5 W m−2), sub-low AHF (SL; 5–10 W m−2), medium AHF (M; 10–15 W m−2), sub-high AHF (SH; 15–20 W m−2) and high AHF (H; >20 W m−2). The proportion of each AHF level in the buffer zone was calculated by:
PN = SN/ST,
where N takes the five levels of L, SL, M, SH and H. For example, PL is the proportion corresponding to level L and PN meets the relationship PL + PSL + PM + PSH + PH = 1. SL is the area corresponding to level L in the buffer zone and ST is the total area of the buffer zone. Based on this method, a station with a higher proportion of SH and H levels indicates that the AHF surrounding the station is higher.
The second method was based on the average value. This method counts the areas with different AHF values in the buffer zone, multiplies the AHF by the corresponding area, adds these values up and the divides the result by the total area of the buffer zone. The relationship can be written as:
Ave = 0 × S0 + 1 × S1 + 2 × S2 + … + N × SN/ST,
where Ave is the AHF value corresponding to each station, 0 to N are all the AHF values that appear in the buffer zone, S0 to SN is the area corresponding to each AHF value and ST is the total area of the buffer zone. Based on this method, station with larger average values indicate that the level of AHF surrounding the station is higher.

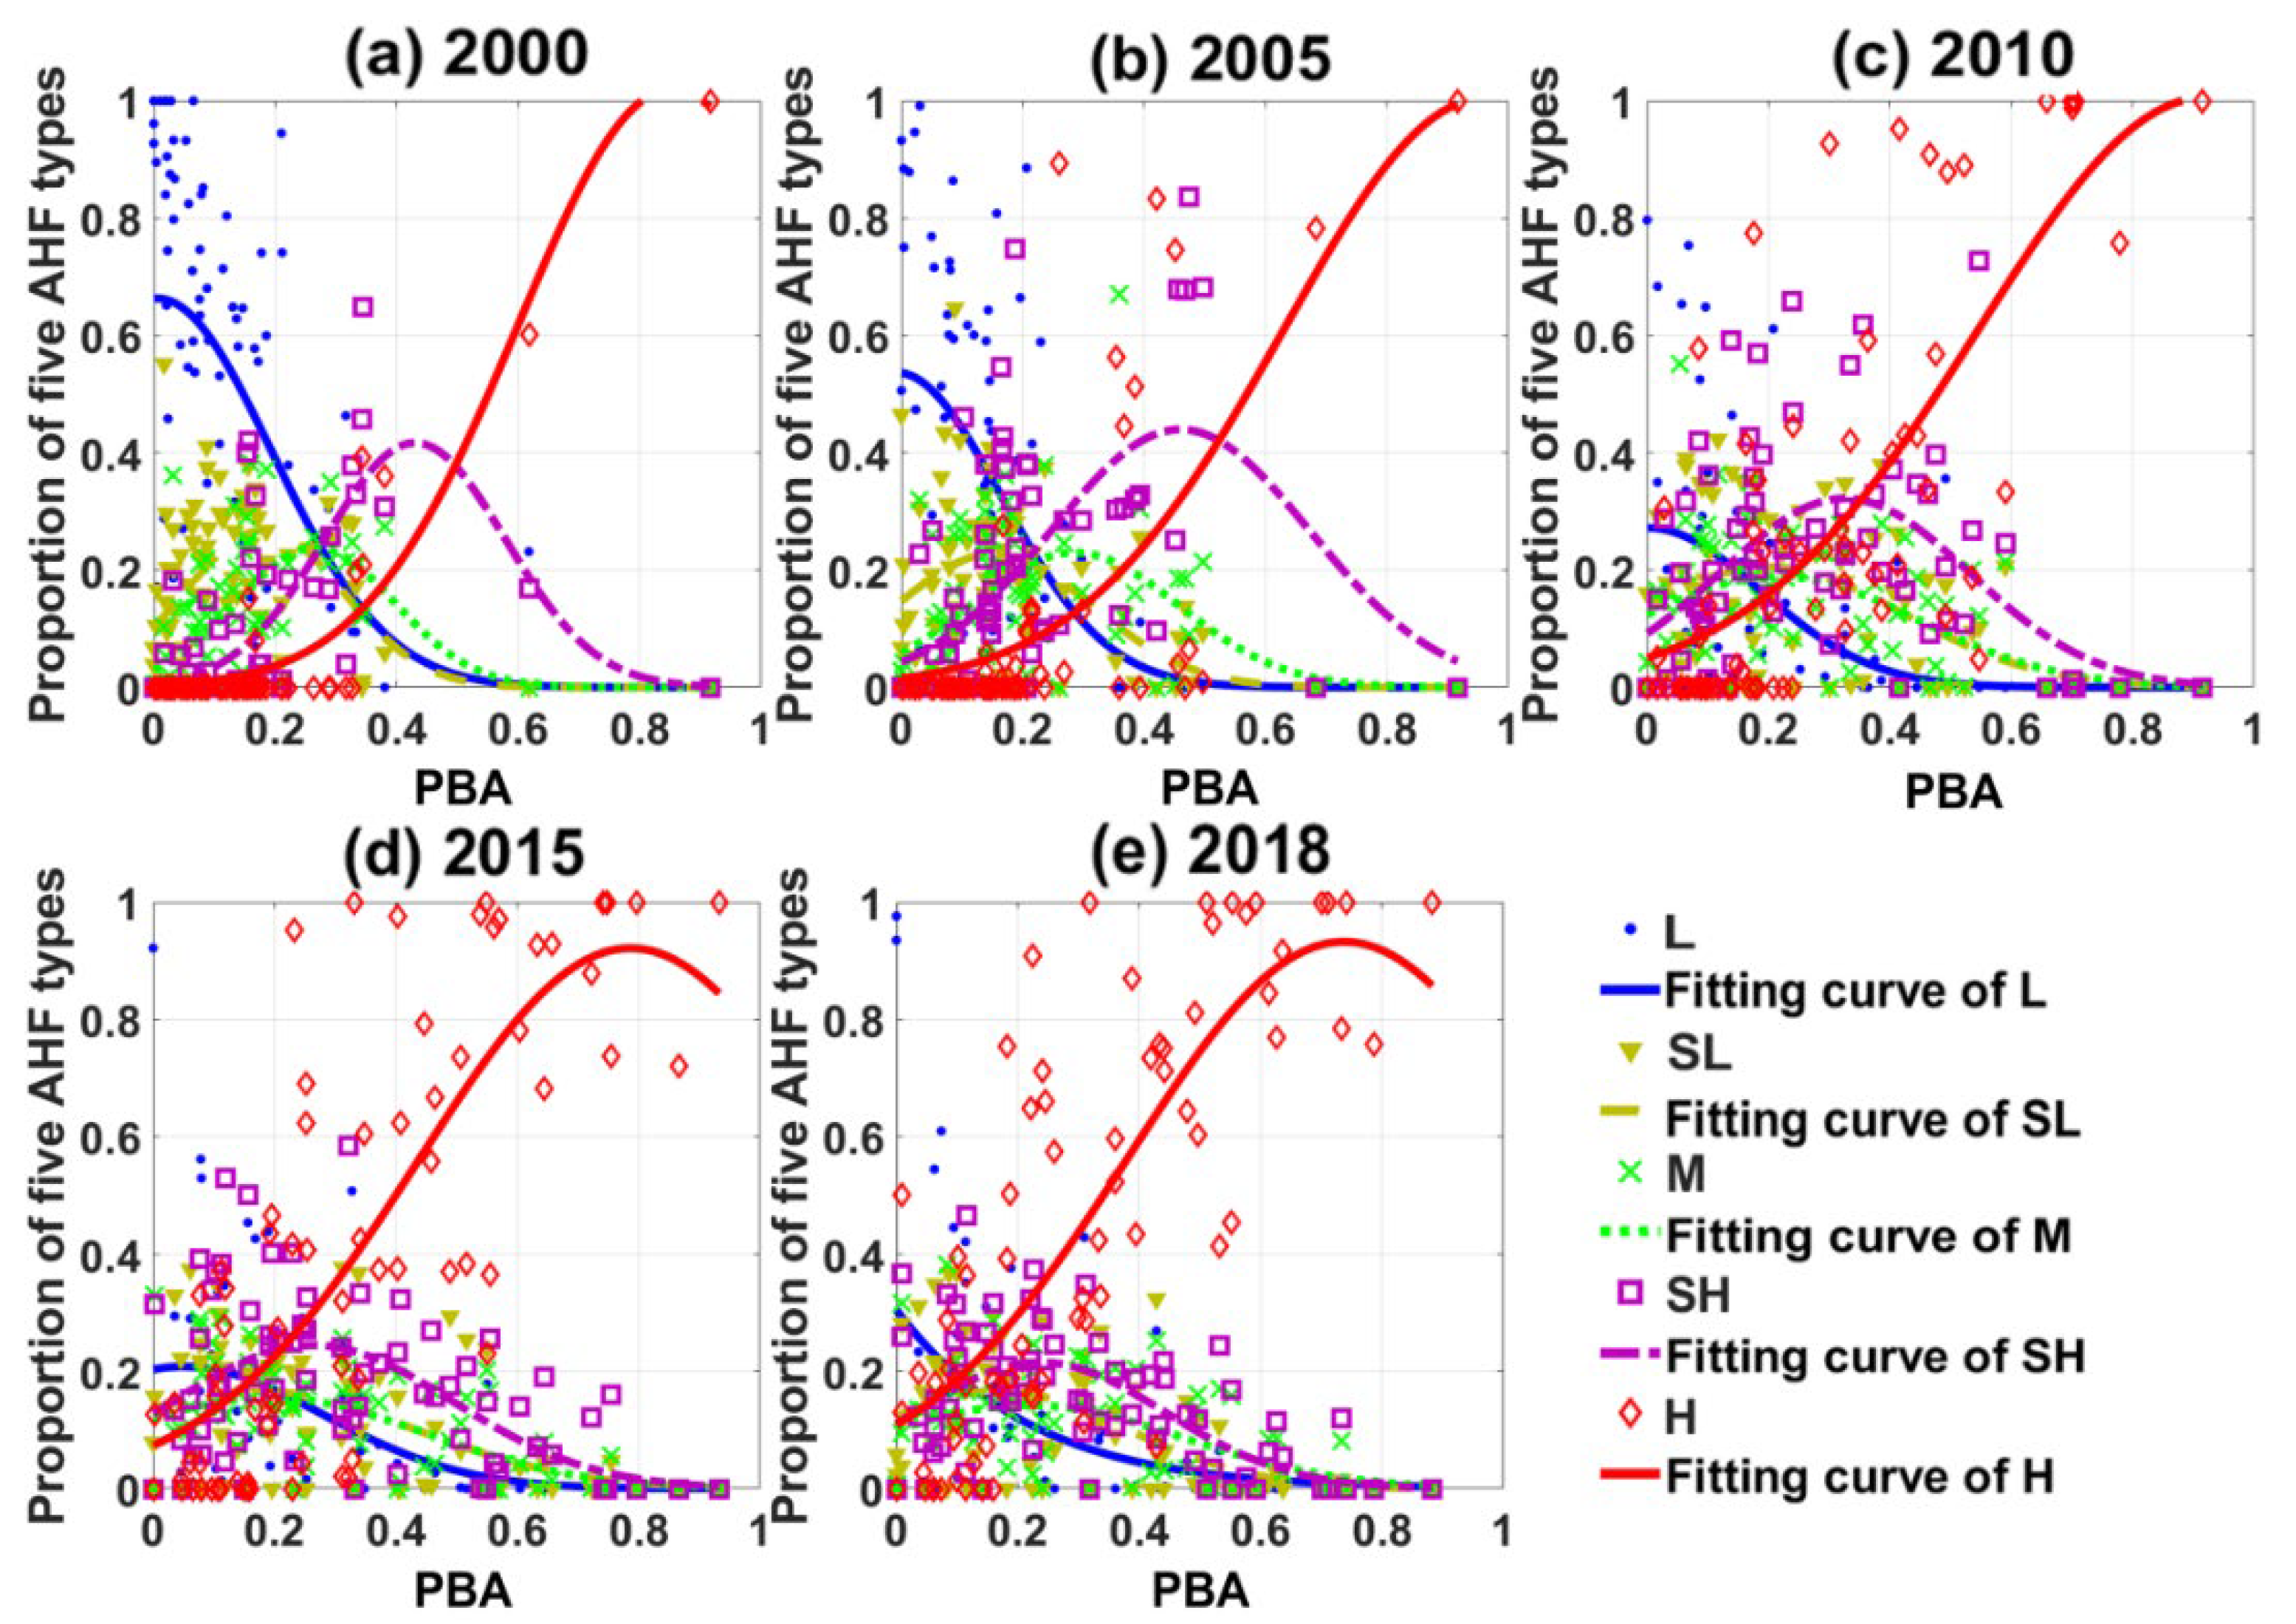
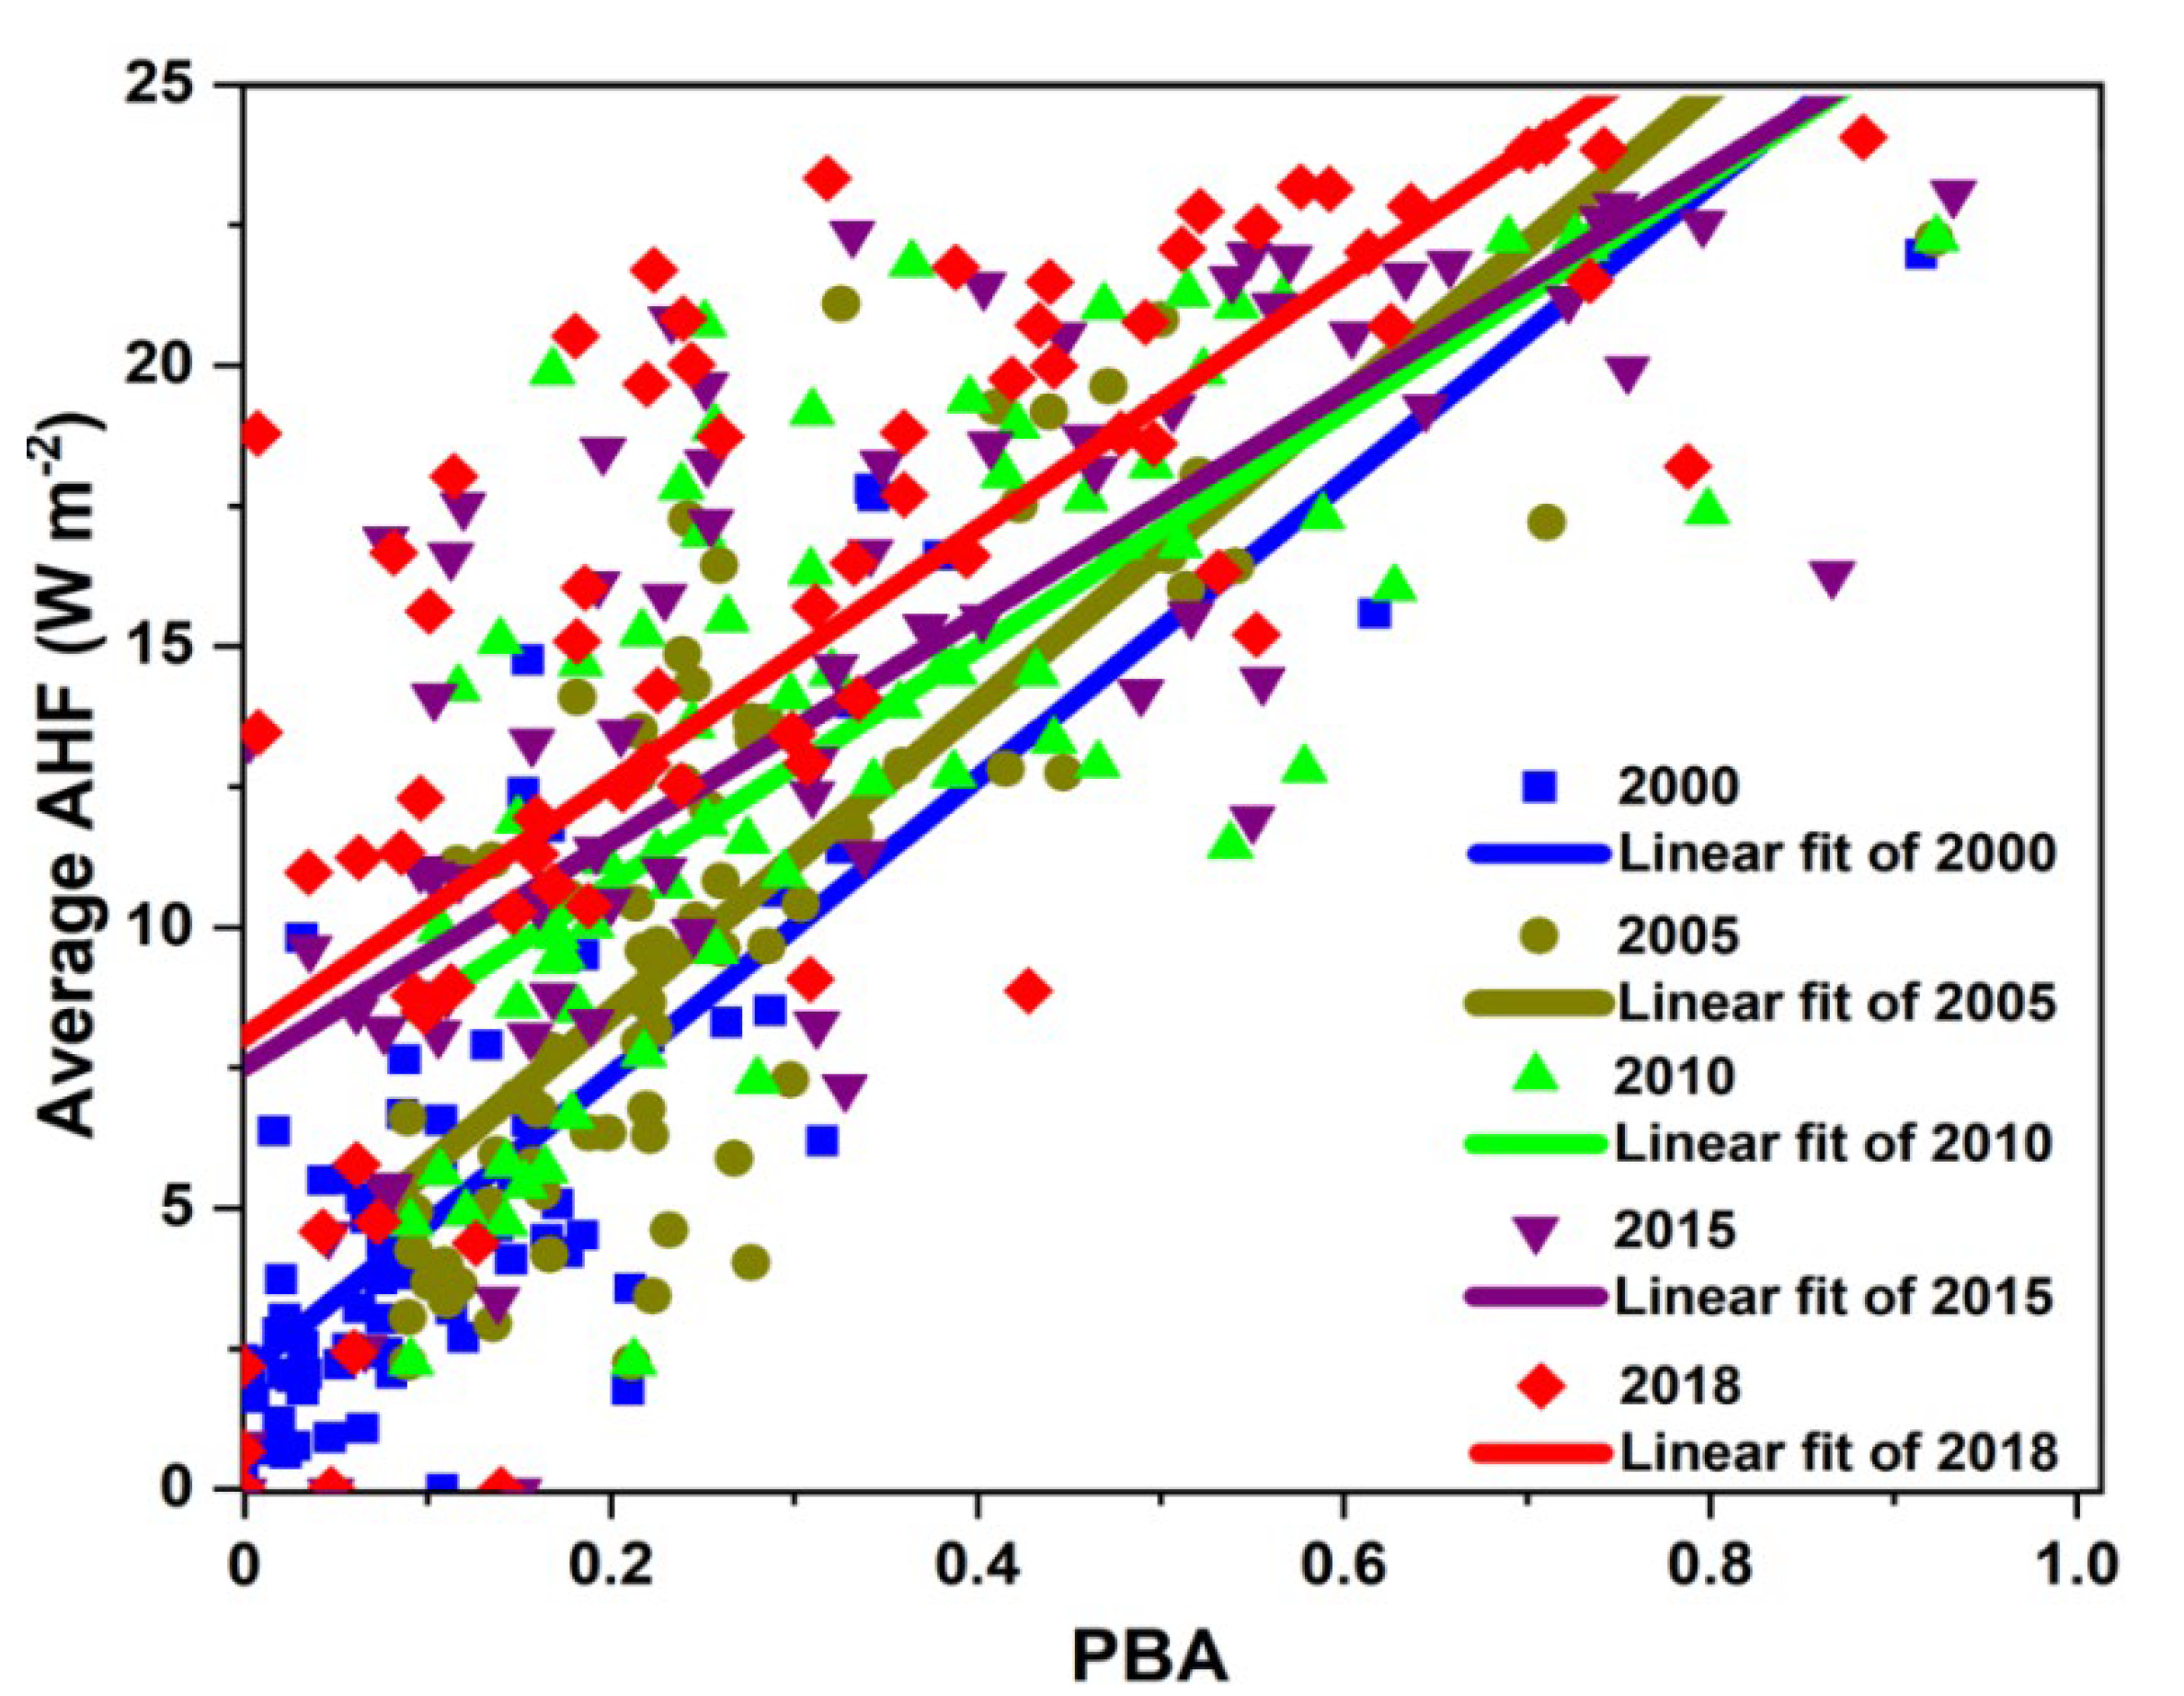
2.5. Correlation between Built-up Areas and the Anthropogenic Heat Environment

We used the following two methods to analyze the correlation between the PBA and the AHF in the buffer zone. In the first method, the PBA in the buffer zone was used as the independent variable x and the proportion of different grades of AHF was used as the dependent variable y. The x value of the peak of each AHF grade curve represents the PBA corresponding to that grade of AHF. If the value of x corresponding to the peak value of the high-level (SH and H) AHF curve is larger, then the built-up area is positively correlated with the AHF.
The second method used the linear equation y = ax + b, which with the PBA of buffer zone as the independent variable x and the average value of the AHF in the buffer zone as the dependent variable y. This equation was used to analyze the relationship between the change in the average AHF around the station and the variation in the built-up area.

3. Results

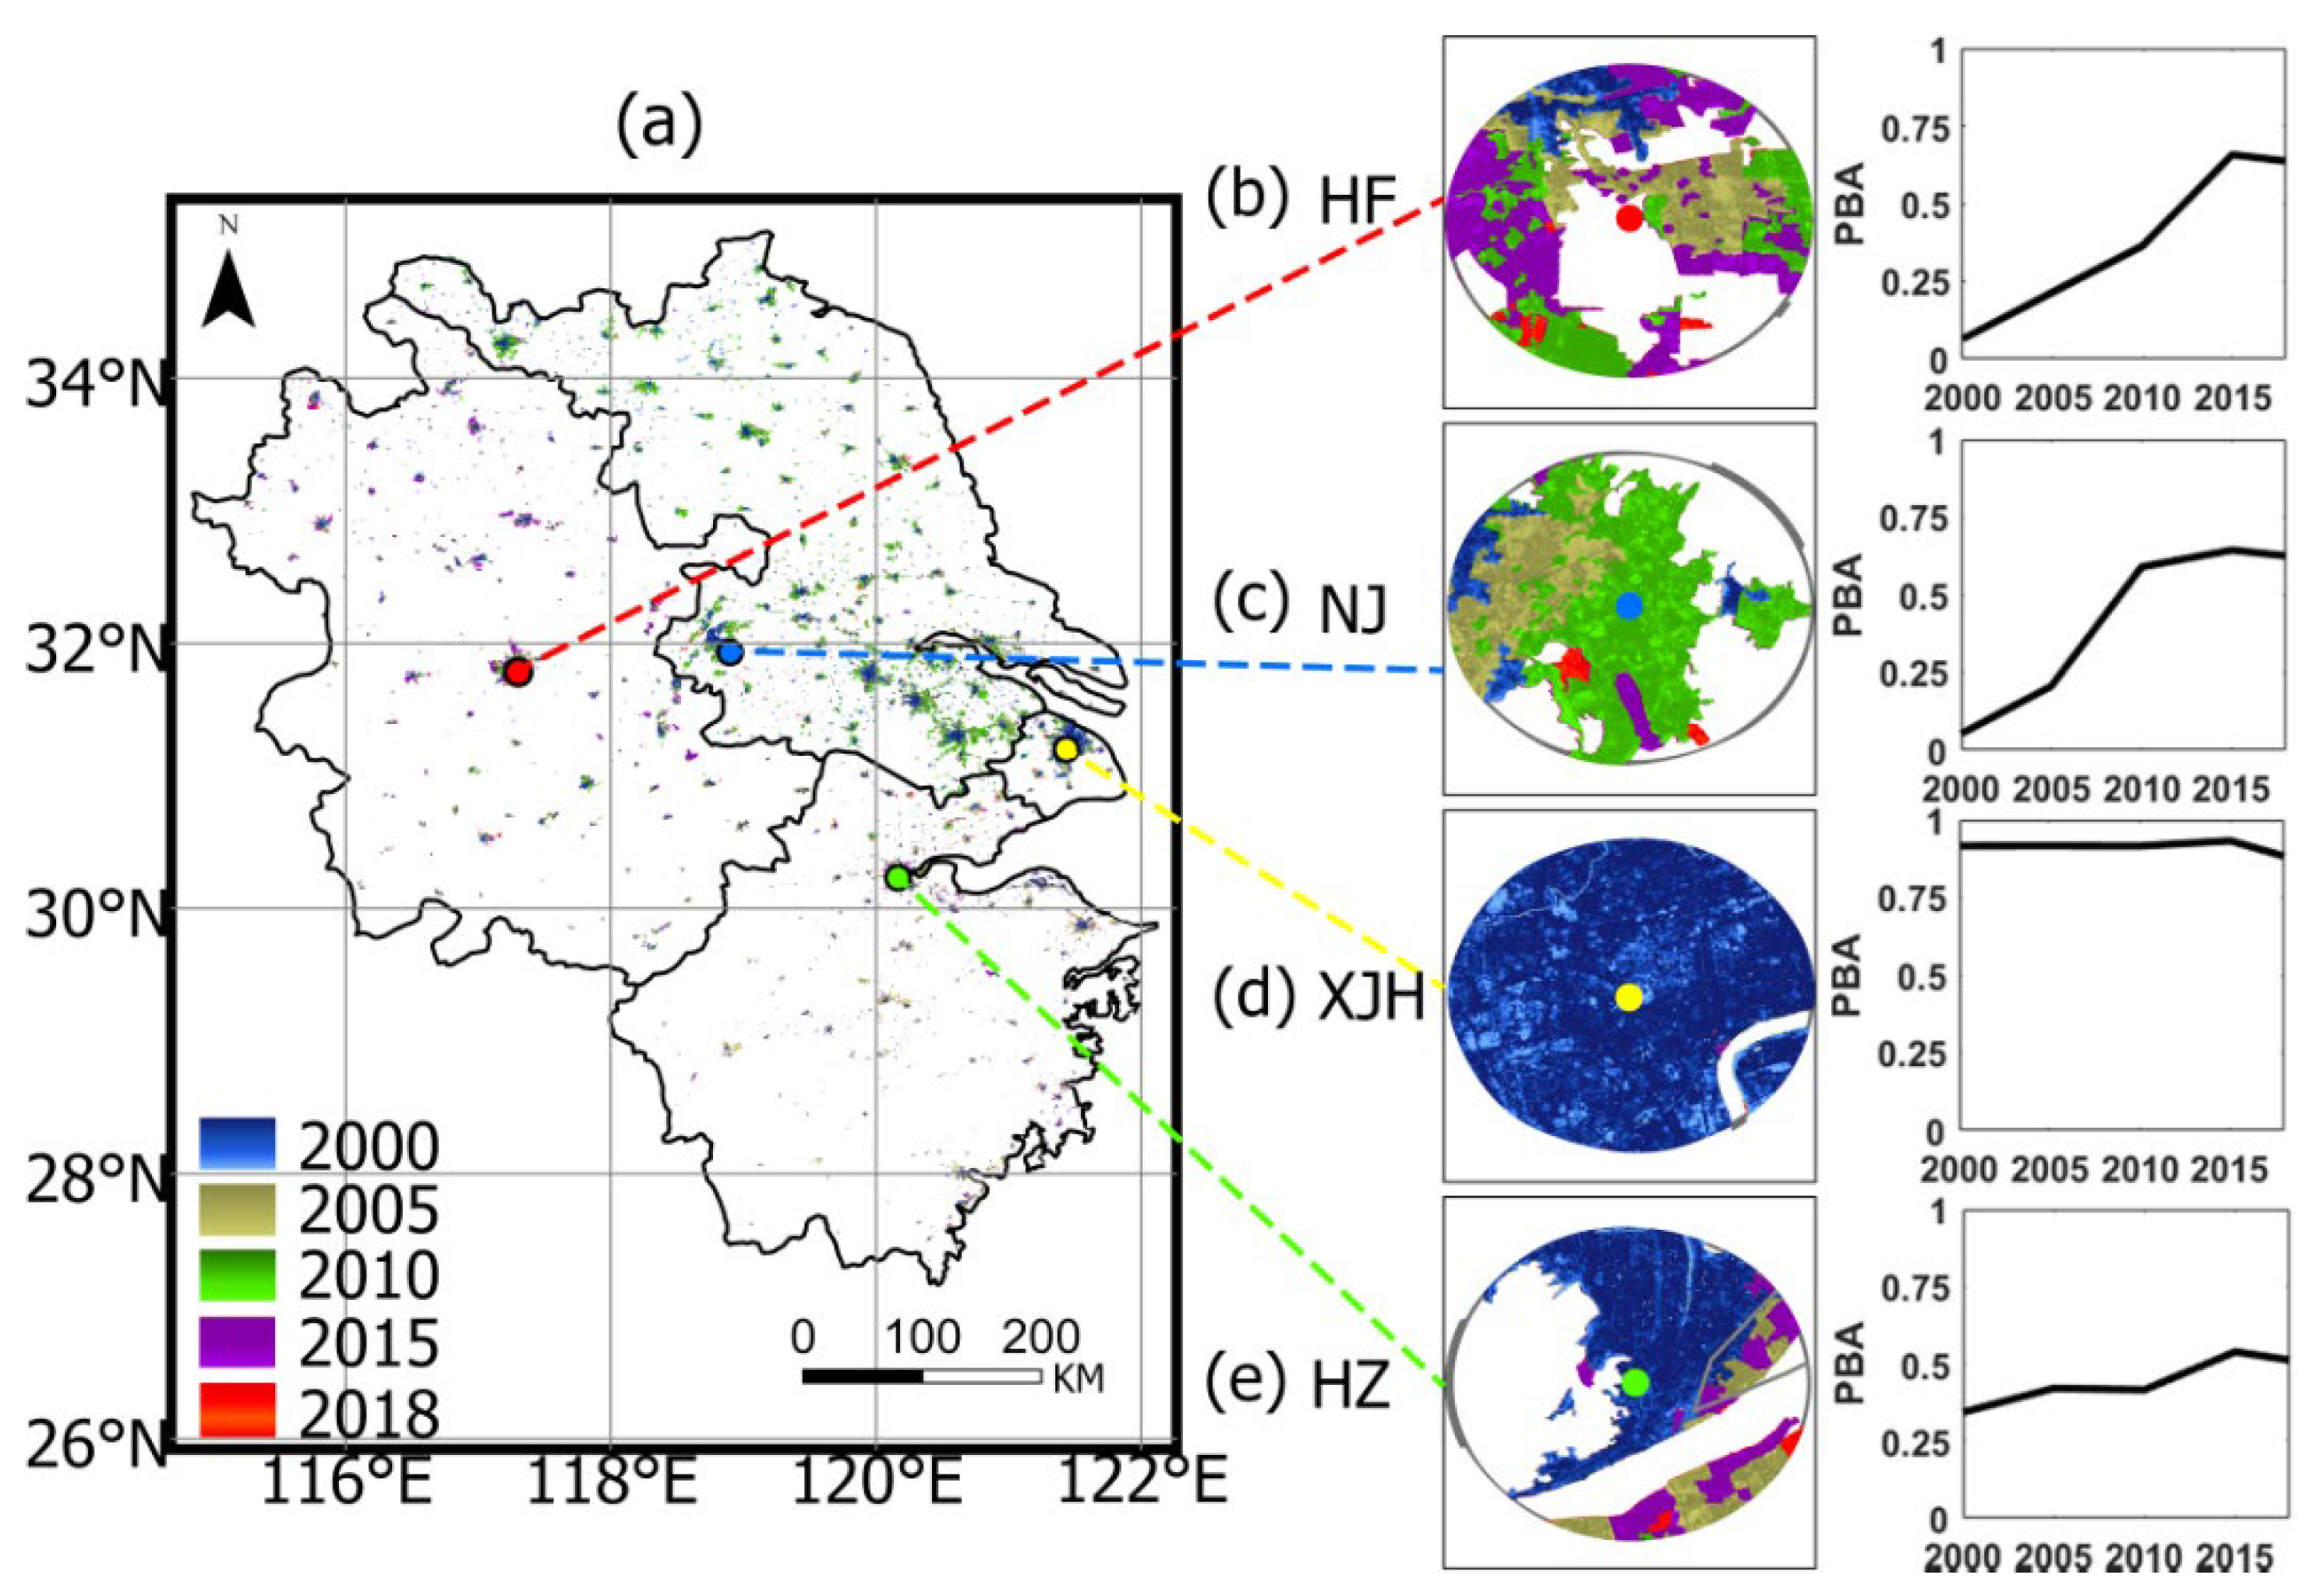
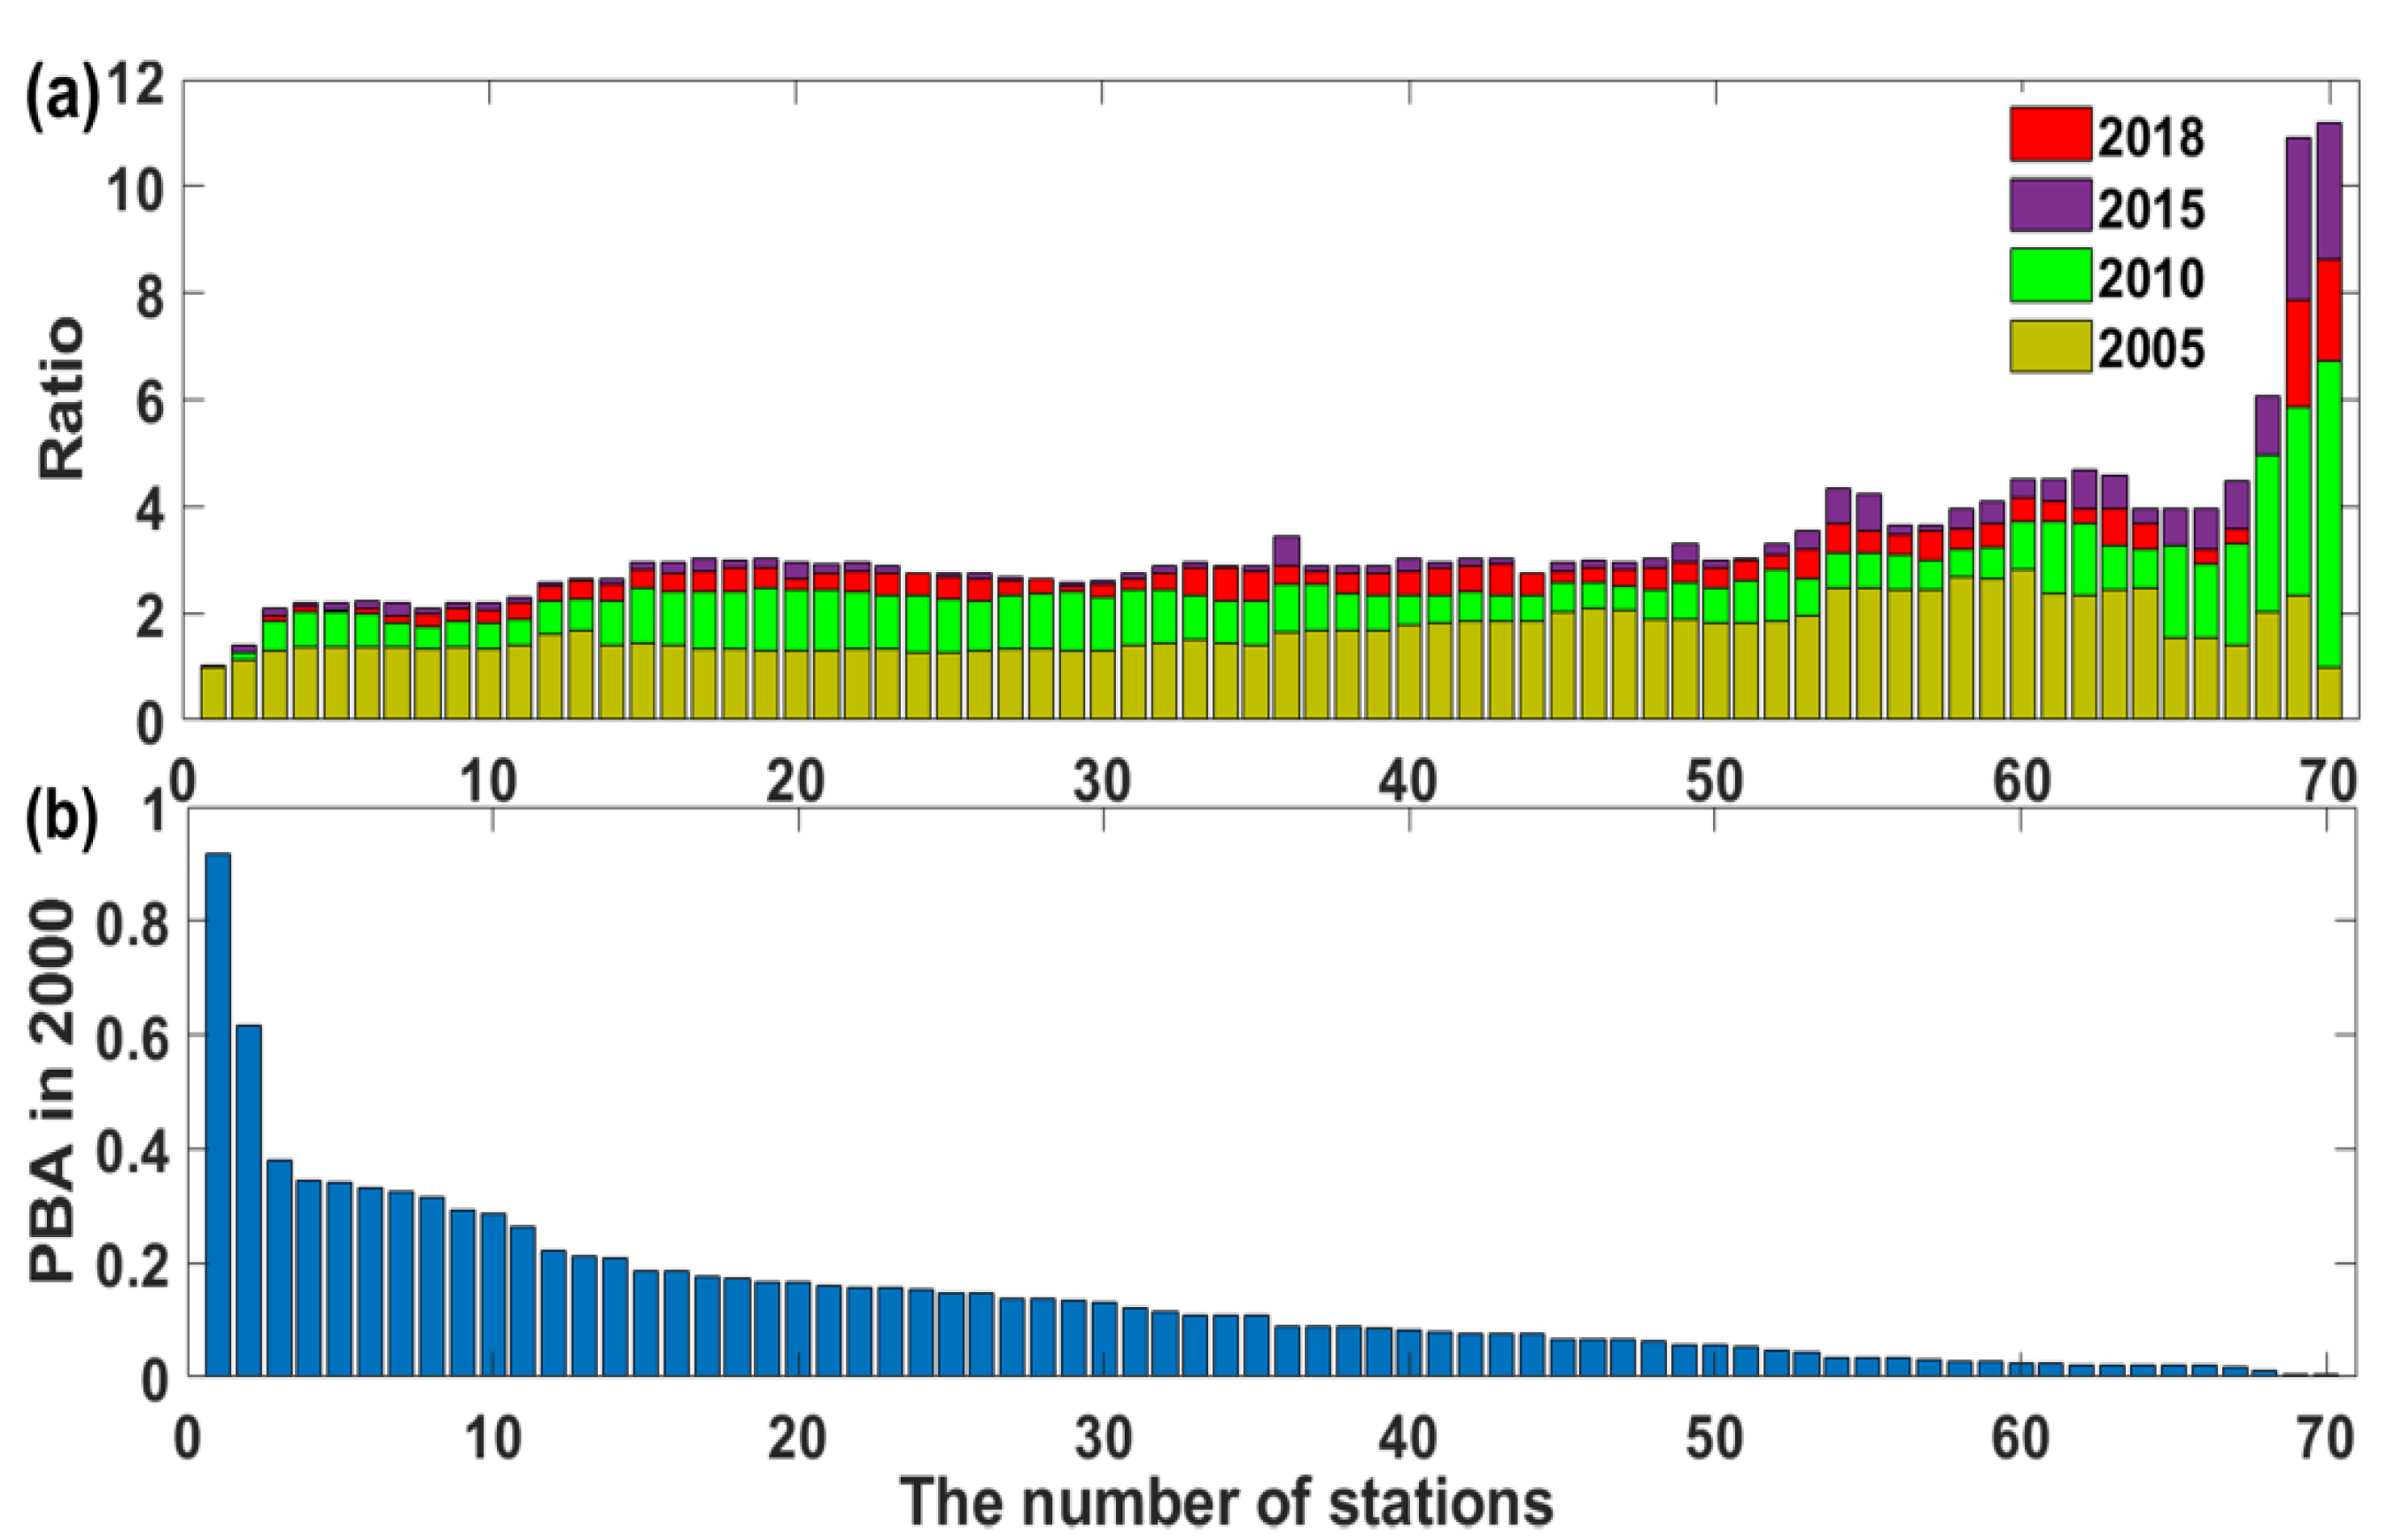
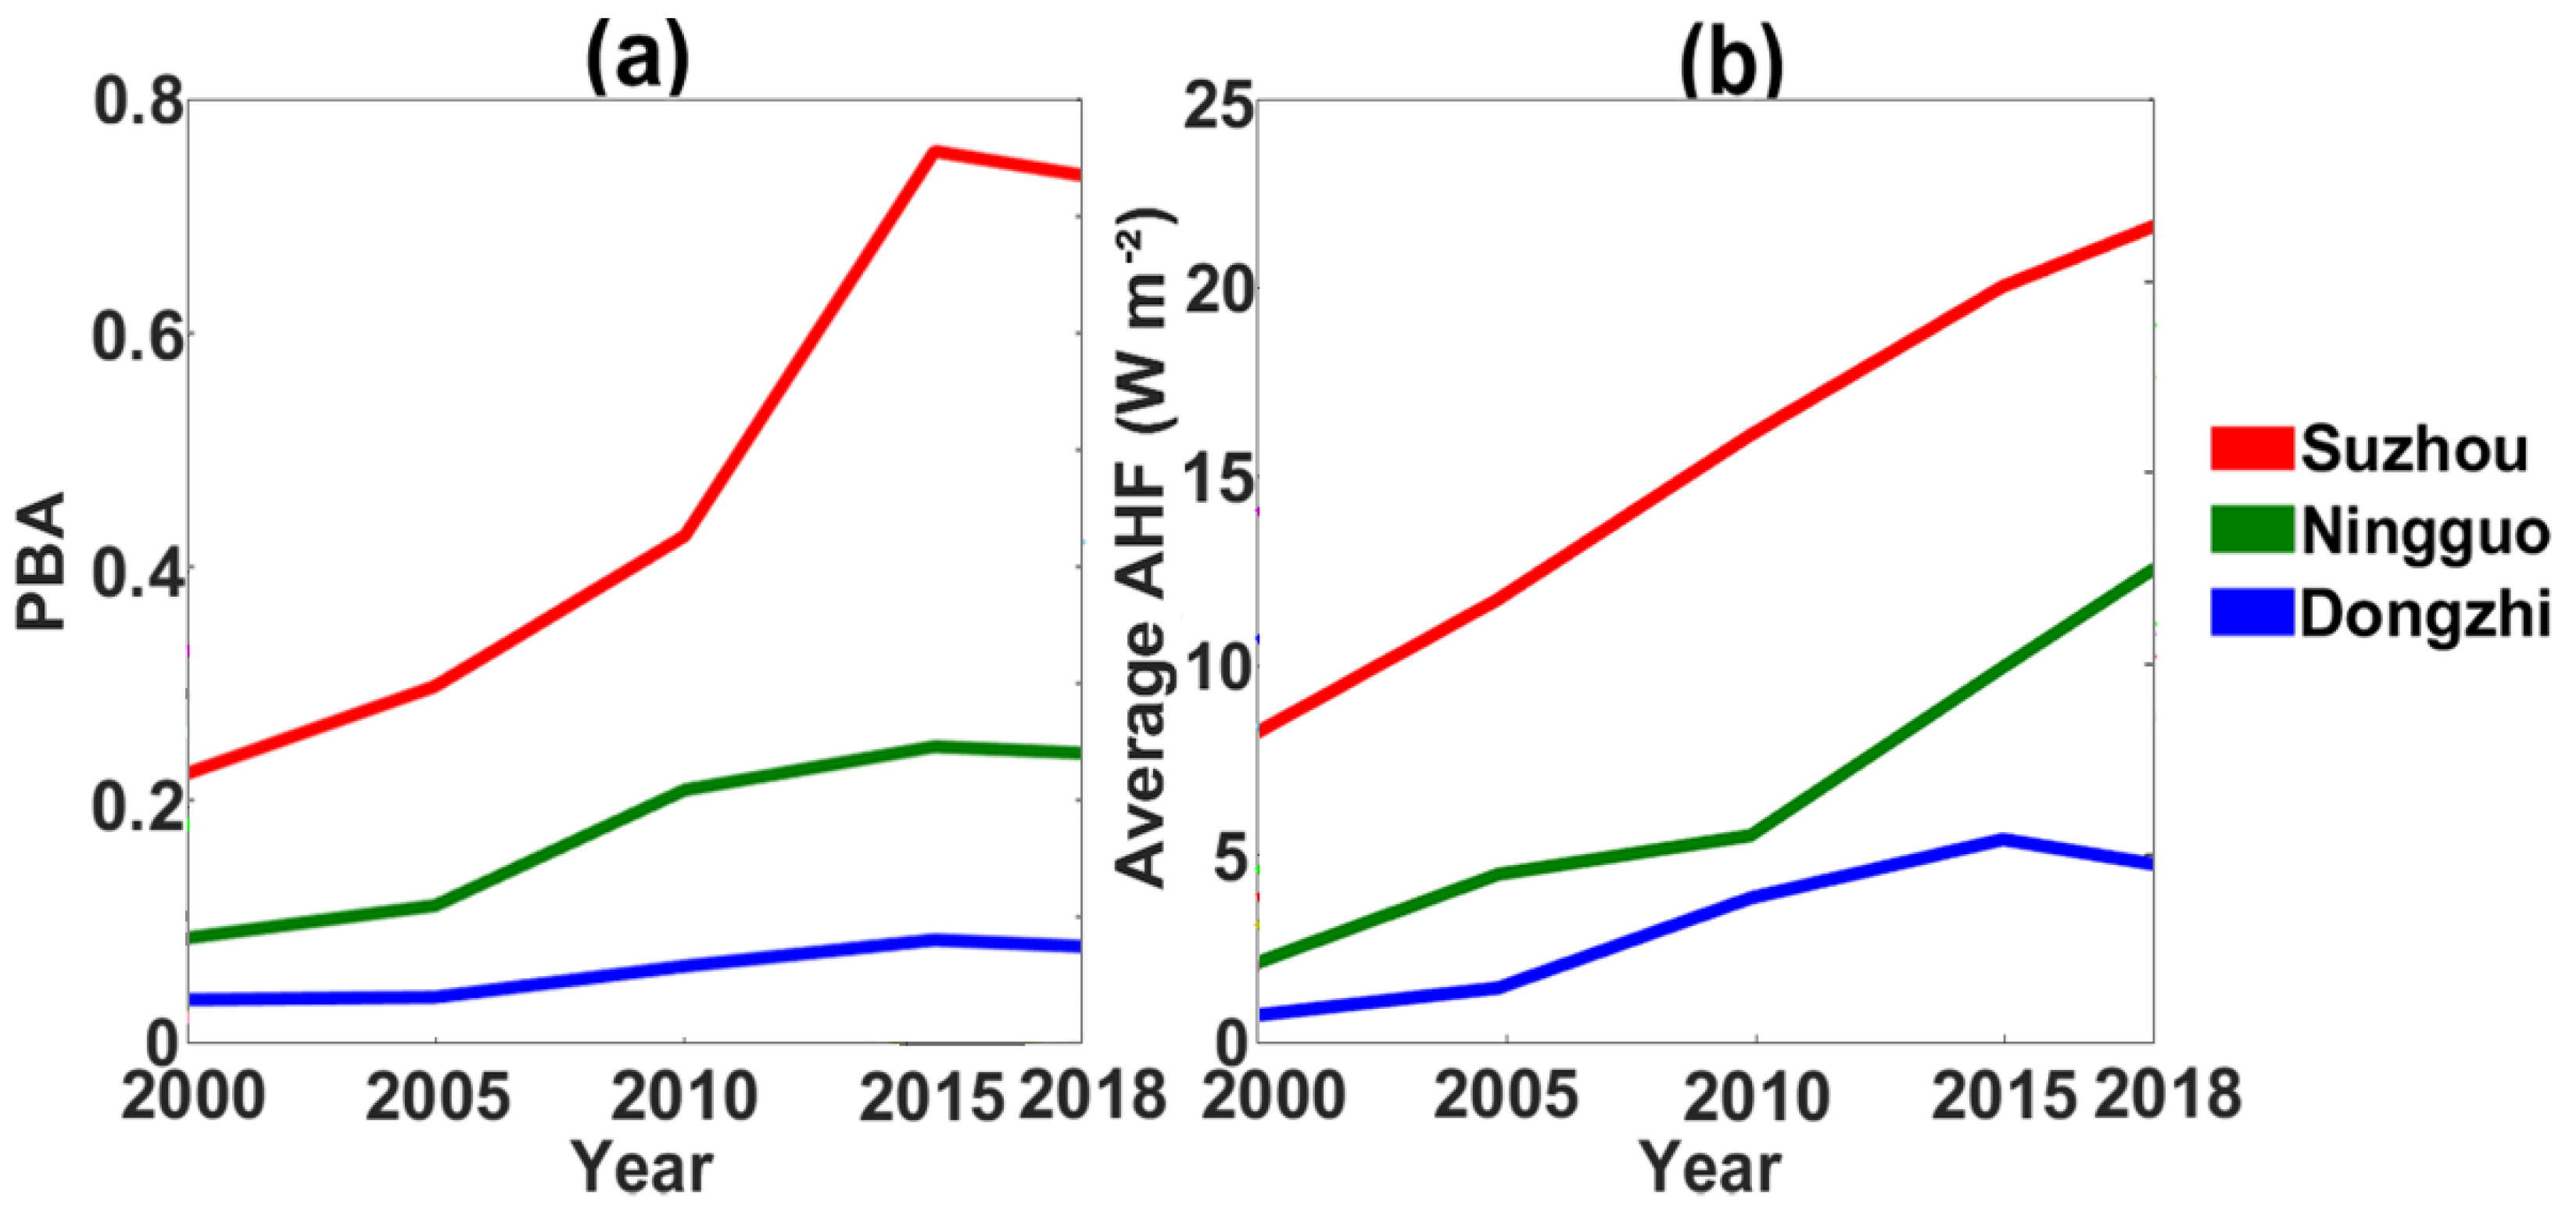
3.1. Urbanization Processes around Meteorological Stations

Taking the meteorological stations located in four provincial cities as examples, we can see that the urbanization process was significantly different at each station (Figure 2). The PBA in the buffer zone around both Nanjing and Hefei stations were <10% in 2000, but > 60% in 2015 (Figure 2b,c). The PBA in the buffer zone around Xujiahui Station in Shanghai had been at a very high level (>85%), reaching the highest value of 93.3% (Figure 2d). The development of the built-up area around Hangzhou Station was relatively small, from 34.3% in 2000 to 51.2% in 2018 (Figure 2e). These temporal and spatial differences in urban sprawl were seen at all 76 stations and were strongly affected by the scale of the city in which the stations were located.
The stations with the built-up area of 0%–5% in 2000 showed the largest changes in built-up area in their subsequent development (Figure 3). These stations were mainly rural or suburban and their development range was significantly larger than that of most city stations. Most of the built-up areas around stations showed their fastest development from 2005 to 2010, which corresponds to the period of rapid urban sprawl in the YRD. The built-up area of a few stations developed slowly from 2015 to 2018 and only five stations increased the PBA by >1% during this period. Another 55 stations even showed a negative growth in the PBA. This phenomenon was more pronounced for stations (mostly urban and suburban stations) that accounted for >5% of the built-up areas in 2000—that is, after urbanization had reached a certain level, the expansion rate of the cities and towns slowed down. This was also affected by factors such as sponge city and urban greening projects.

3.2. Relationship between Urban Sprawl and the Anthropogenic Heat Environment

The AHF increased significantly from 2000 to 2018 with the rapid urban sprawl in the YRD (Figure 4). The spatial distribution of the AHF generally exhibited two types: 1) If we take a large city like Hefei as a center, then the AHF was highest in a relatively small area, while low AHF in the surrounding areas of the Hefei city. 2) In contrast, from Nanjing along the Yangtze River to Shanghai, and from Shanghai along the coastline to Hangzhou Bay, there were one or more large cities and many smaller cities, forming an urban belt. Under the influence of these cities, the AHF was high over a large area. In general, the thermal environment around stations changed significantly as a result of the continuous increase in the overall AHF in the YRD. For example, the average value of AHF at 76 stations rapidly increased from 5.45 W m−2 in 2000, to 8.48 W m−2 in 2005 and to 12.44 W m−2 in 2010. Then the AHF increase was relatively slower in 2015 (13.84 W m−2) and 2018 (14.74 W m−2) (Figure 4f).
Figure 5 shows the correlation between the AHF and the level of urbanization. As the AHF in the buffer zone around the station increased, the x value of the curve’s peak moved to the right. This indicates a positive correlation between the AHF and the built-up areas. The difference between the five curves weakened over time and this phenomenon was concentrated in the SL, M and SH levels. The three curves moved closer together, showing that the relationship between the distribution of different AHF levels and urbanization was decreasing. However, the curve of the levels of L and H were still quite different from the other curves, the peak height of the L level curve was getting lower and lower, while the H level was gradually increasing. Among the average of the 76 stations, the L level decreased from 52.28% (2000) to 11.39% (2018), whereas the H grade increased from 3.94% (2000) to 43.93% (2018) (Figure 5). This shows that urbanization has increased significantly in different regions, leading to an increase in the AHF in the buffer zone of different stations; most of the trends were similar. Only the AHF of the stations in large cities was significantly higher than the AHF at other stations.
The slopes of the lines in Figure 6 are all positive and generally approach unity, indicating a positive correlation between the AHF and rapid urban sprawl. The lines moved upward over time, which means that the AHF increased over time. For example, the average AHF of all stations was 5.45 W m−2 in 2000 and it had increased to 14.74 W m−2 by 2018. By contrast, the slope of the lines decreased slightly, indicating that the difference in AHF between stations was gradually decreasing. In general, AHF was closely related to the change of built-up areas around the stations. Therefore, AHF can consider and reliably reflect both anthropogenic emission effects and land use change effects related to latent heat flux and sensible heat flux.
The changes in the thermal environment around the meteorological stations varied significantly among individual stations, with clear temporal and spatial differences. In most years, the average AHF growth was in the order urban stations > suburban stations > rural stations and there was a period of rapid growth in the AHF from 2000 to 2010 (Figure 7). The average growth rate of suburban and rural stations was >1.5 over a five-year period, significantly greater than that of urban stations. The overall growth rate of the AHF slowed from 2010 to 2018. From 2010 to 2015, the growth rates of the three types of station were 1.1, 1.1 and 1.2 and the growth rates were 1.0, 1.1 and 1.0 from 2015 to 2018. The difference in the magnitude of the change also decreased. Although growth of the AHF from 2015 to 2018 was the slowest, the average growth multiple of all meteorological stations was always >1 and there was no negative growth in the PBA in the buffer zone in the corresponding years.

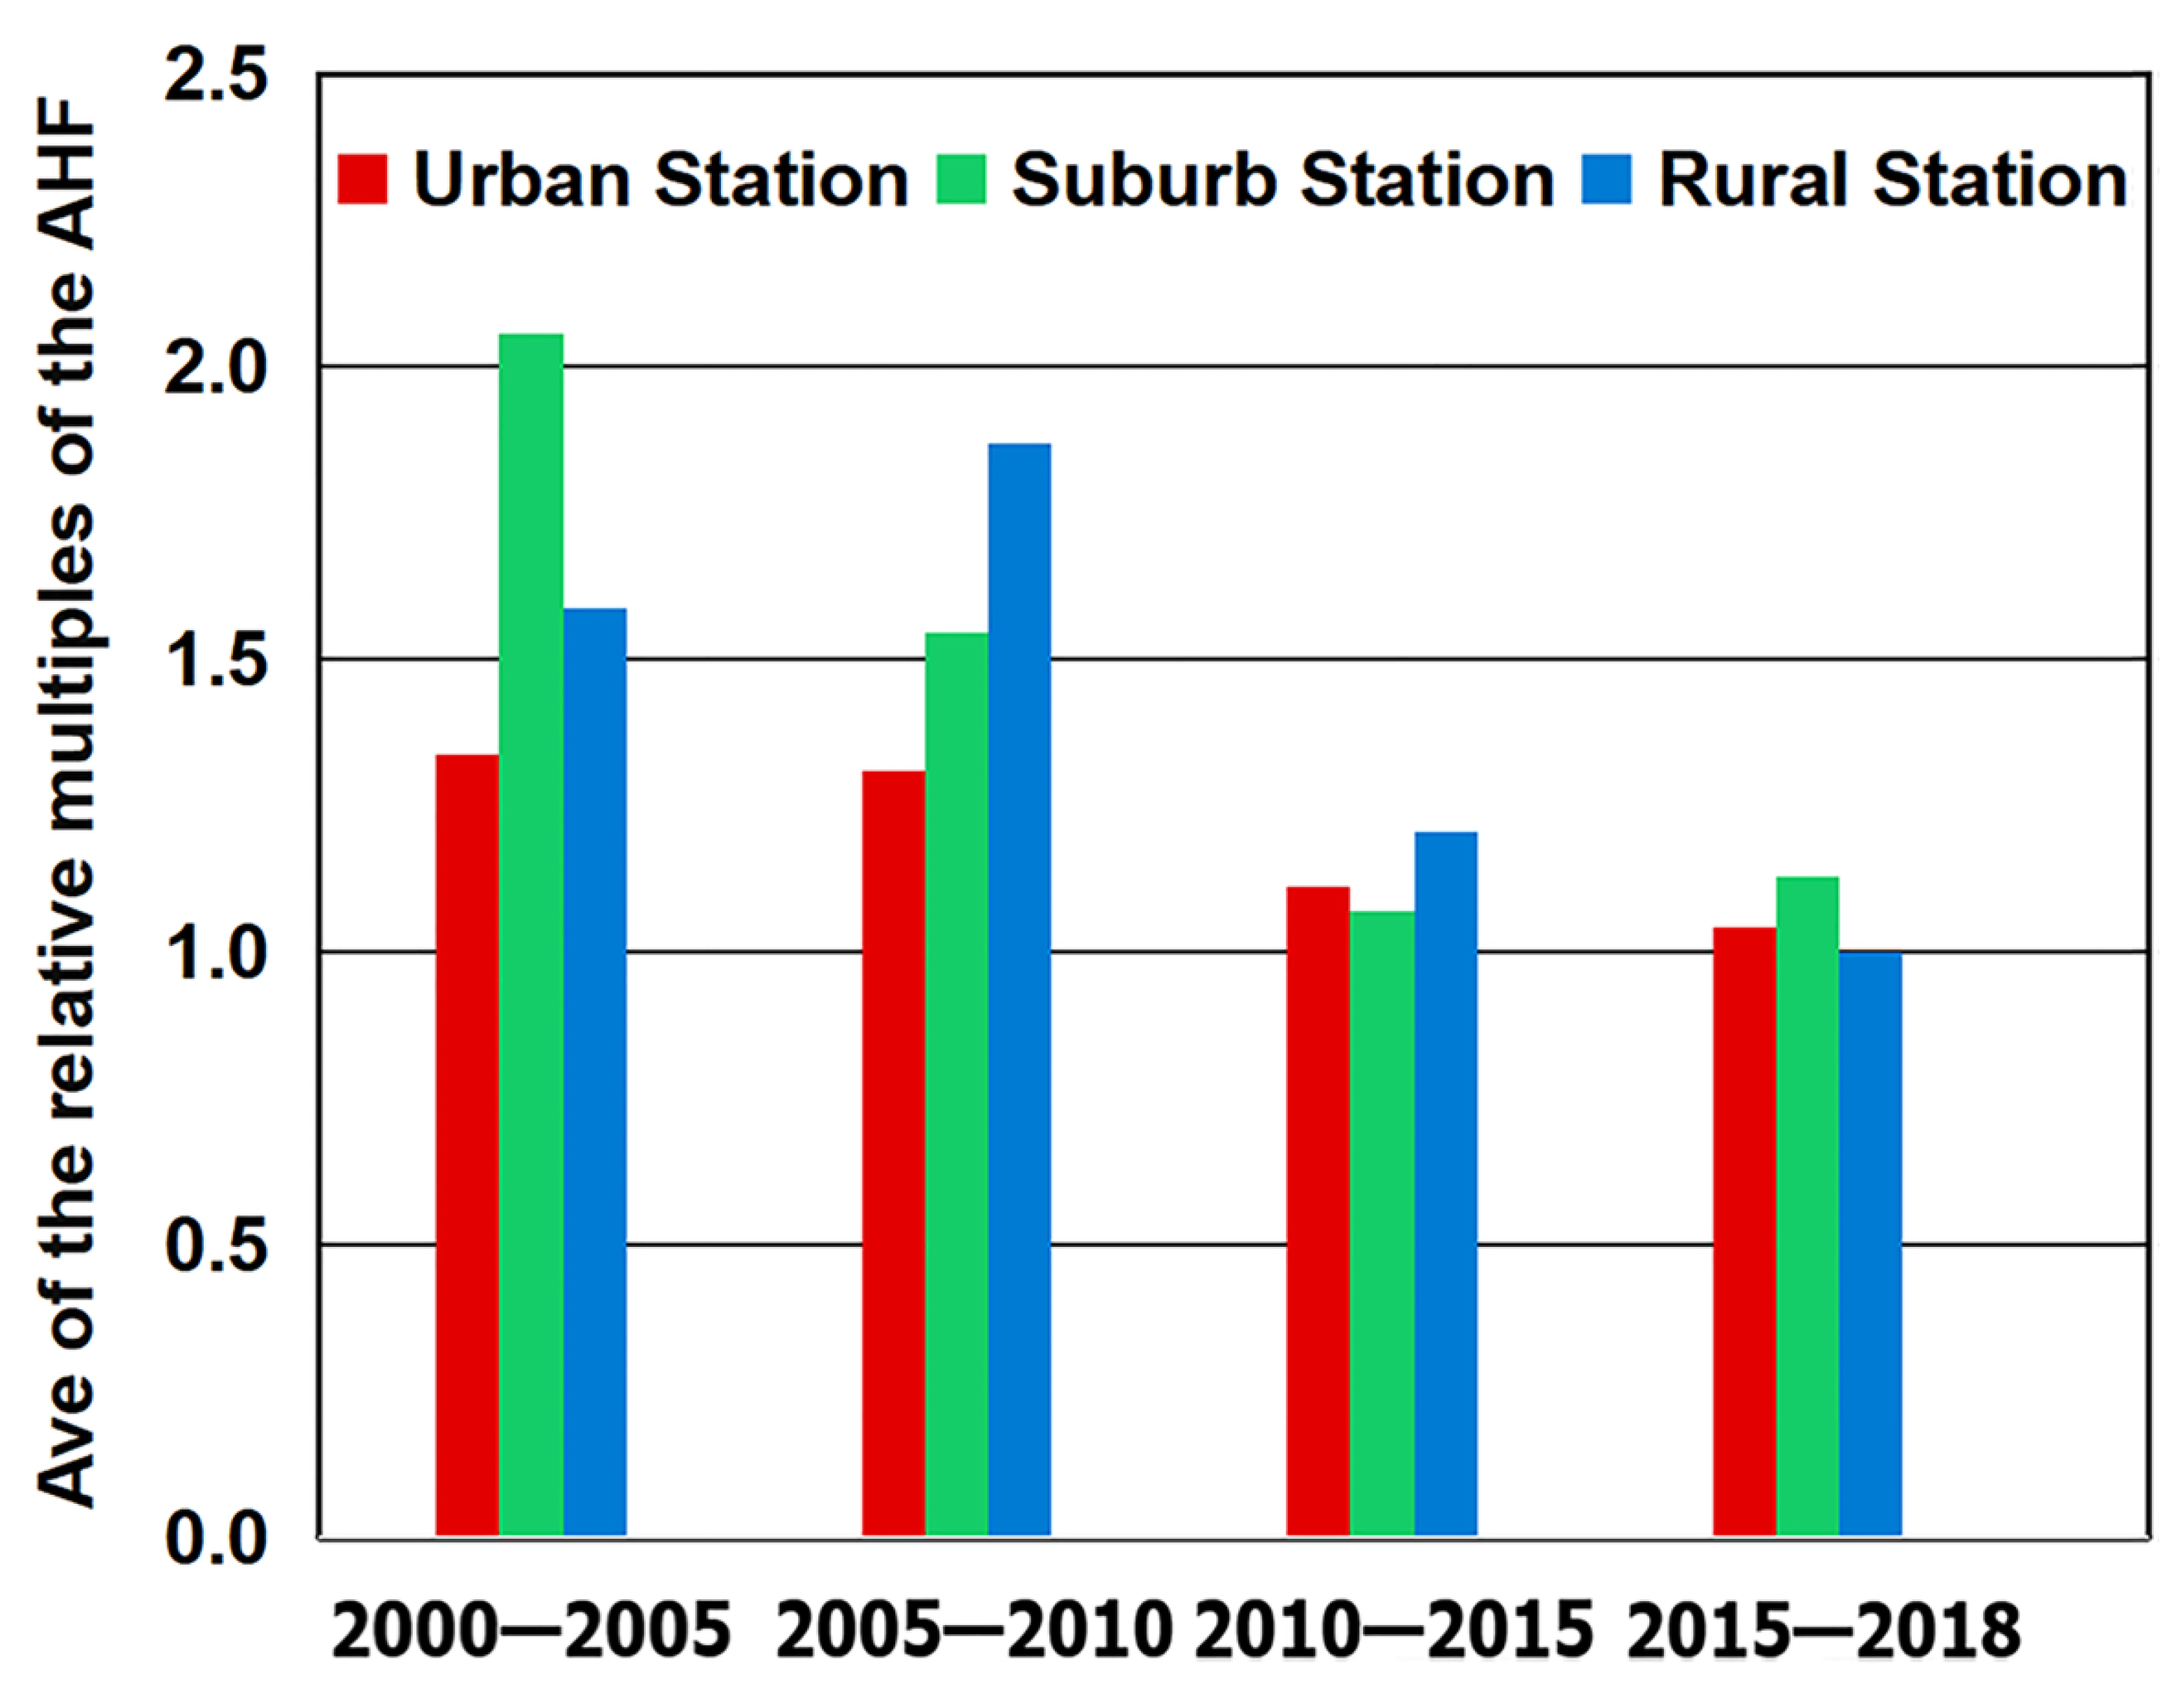
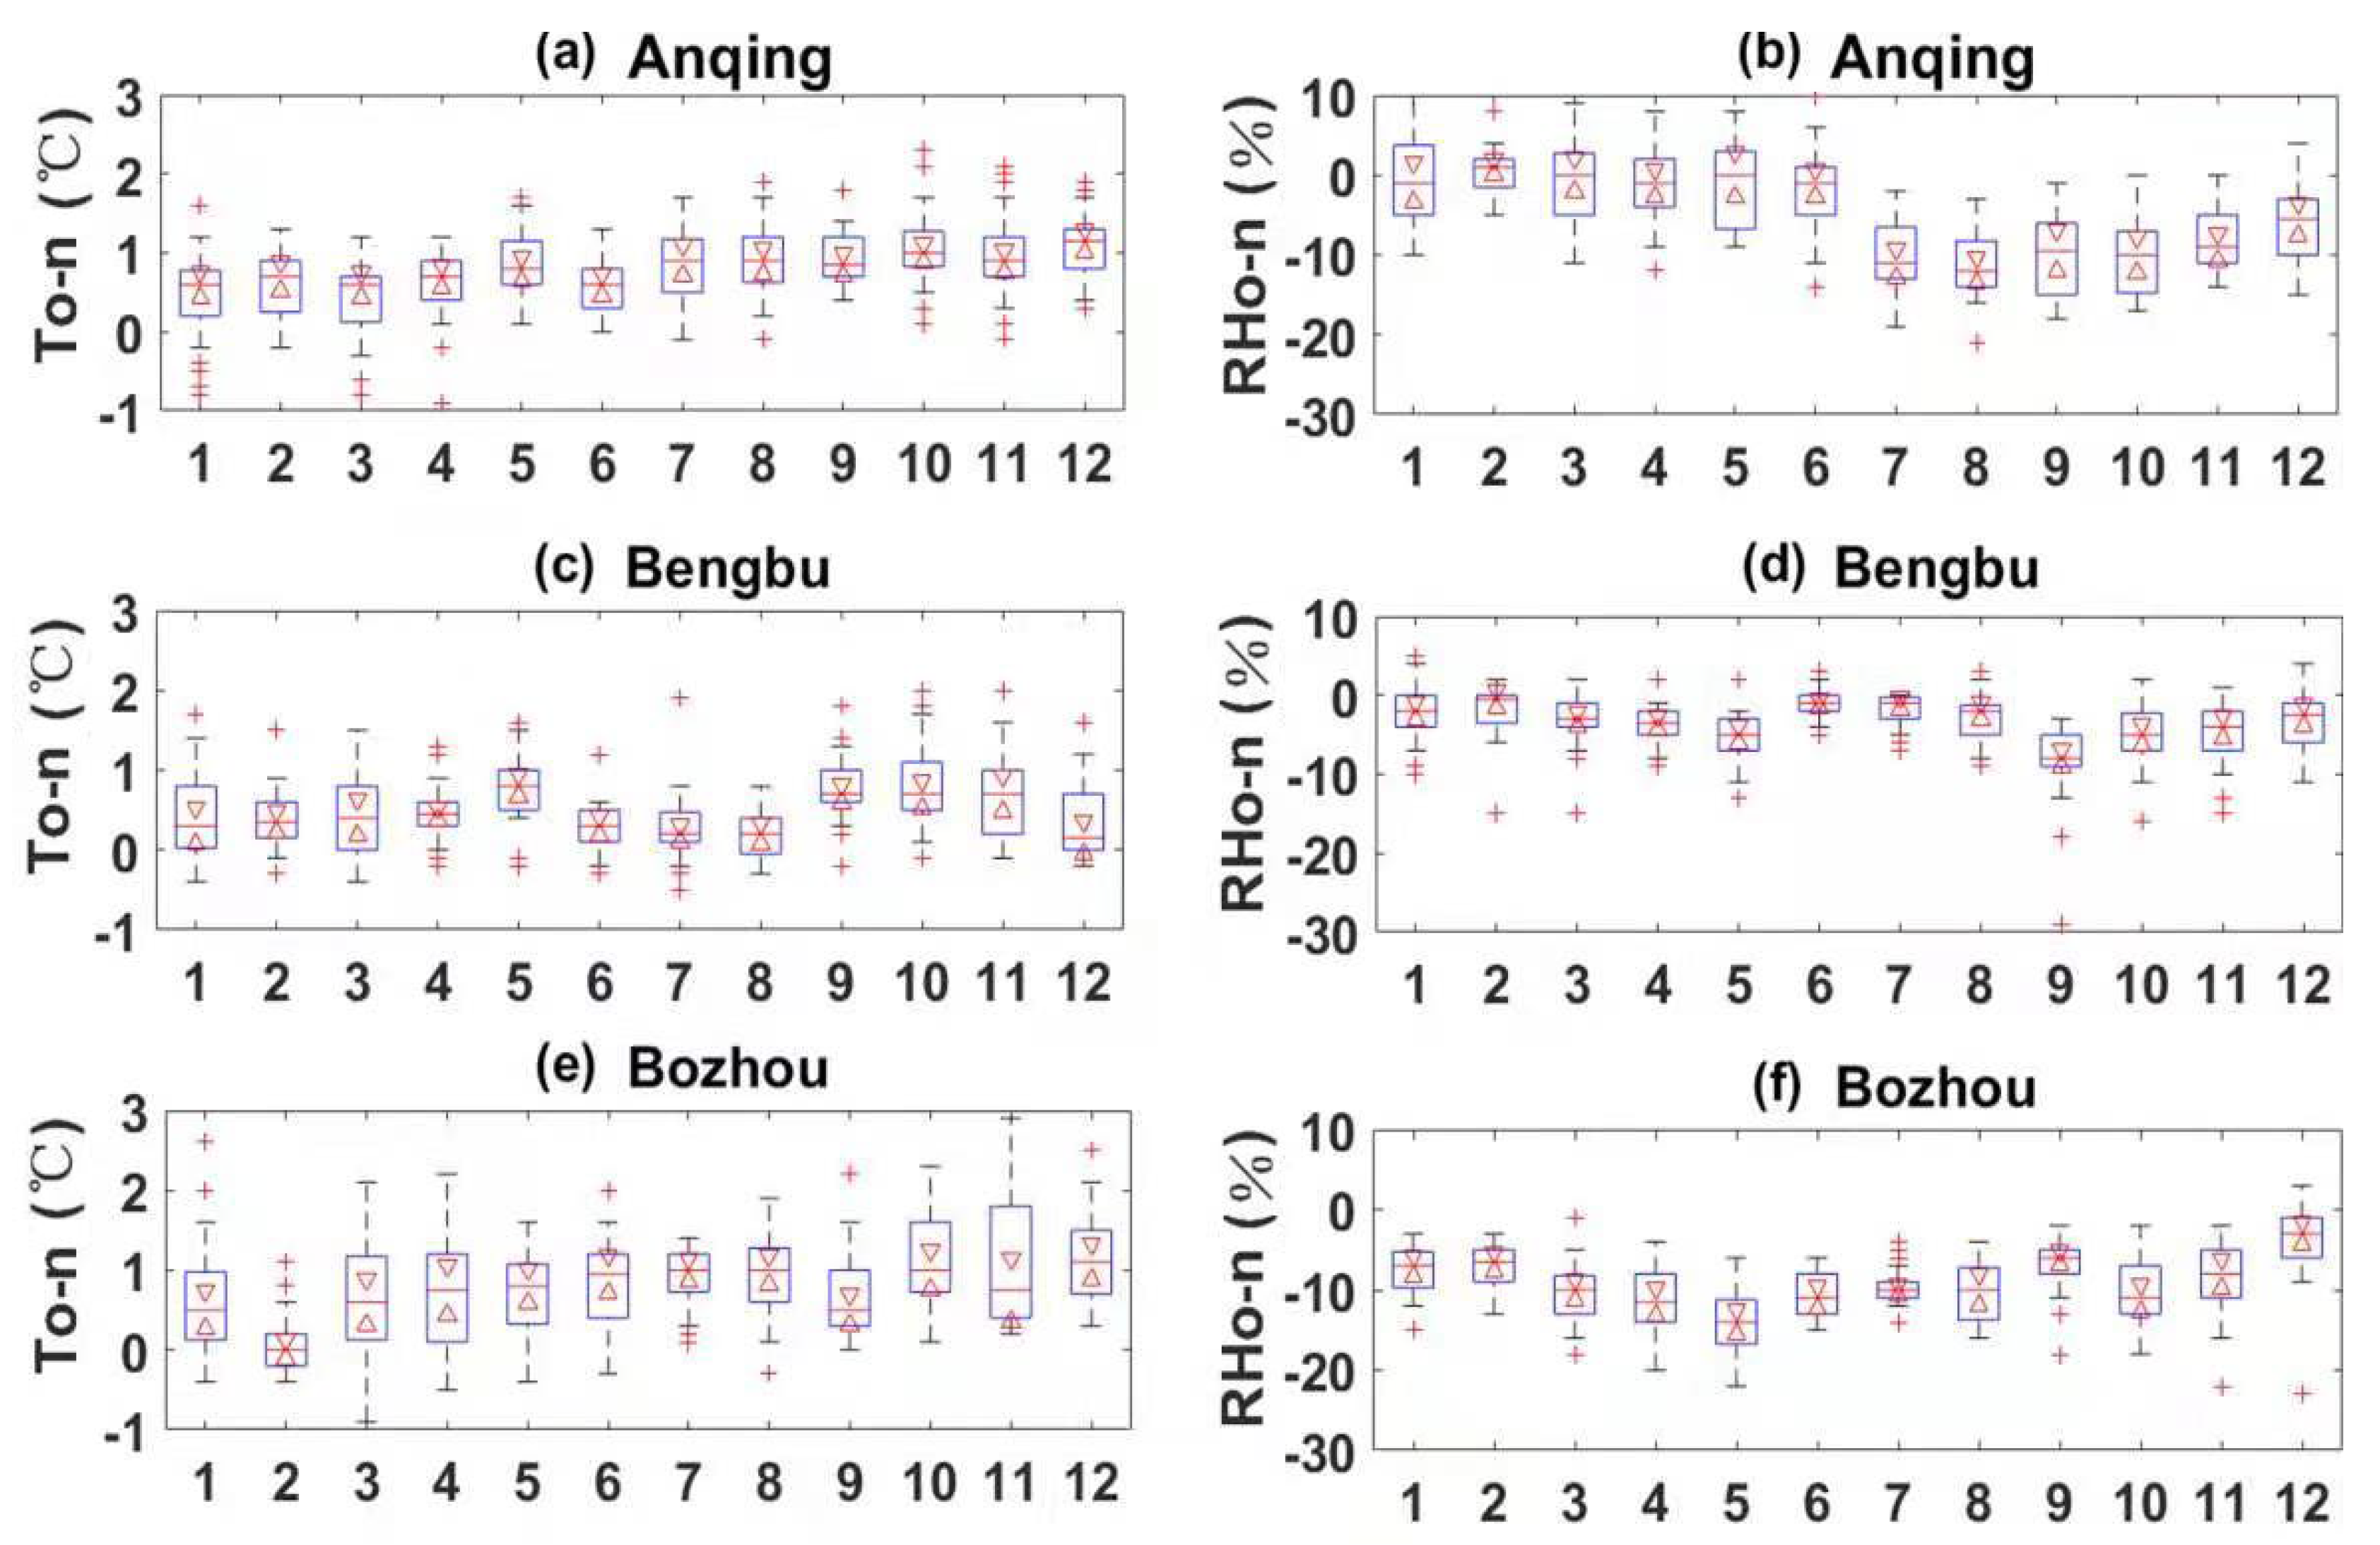
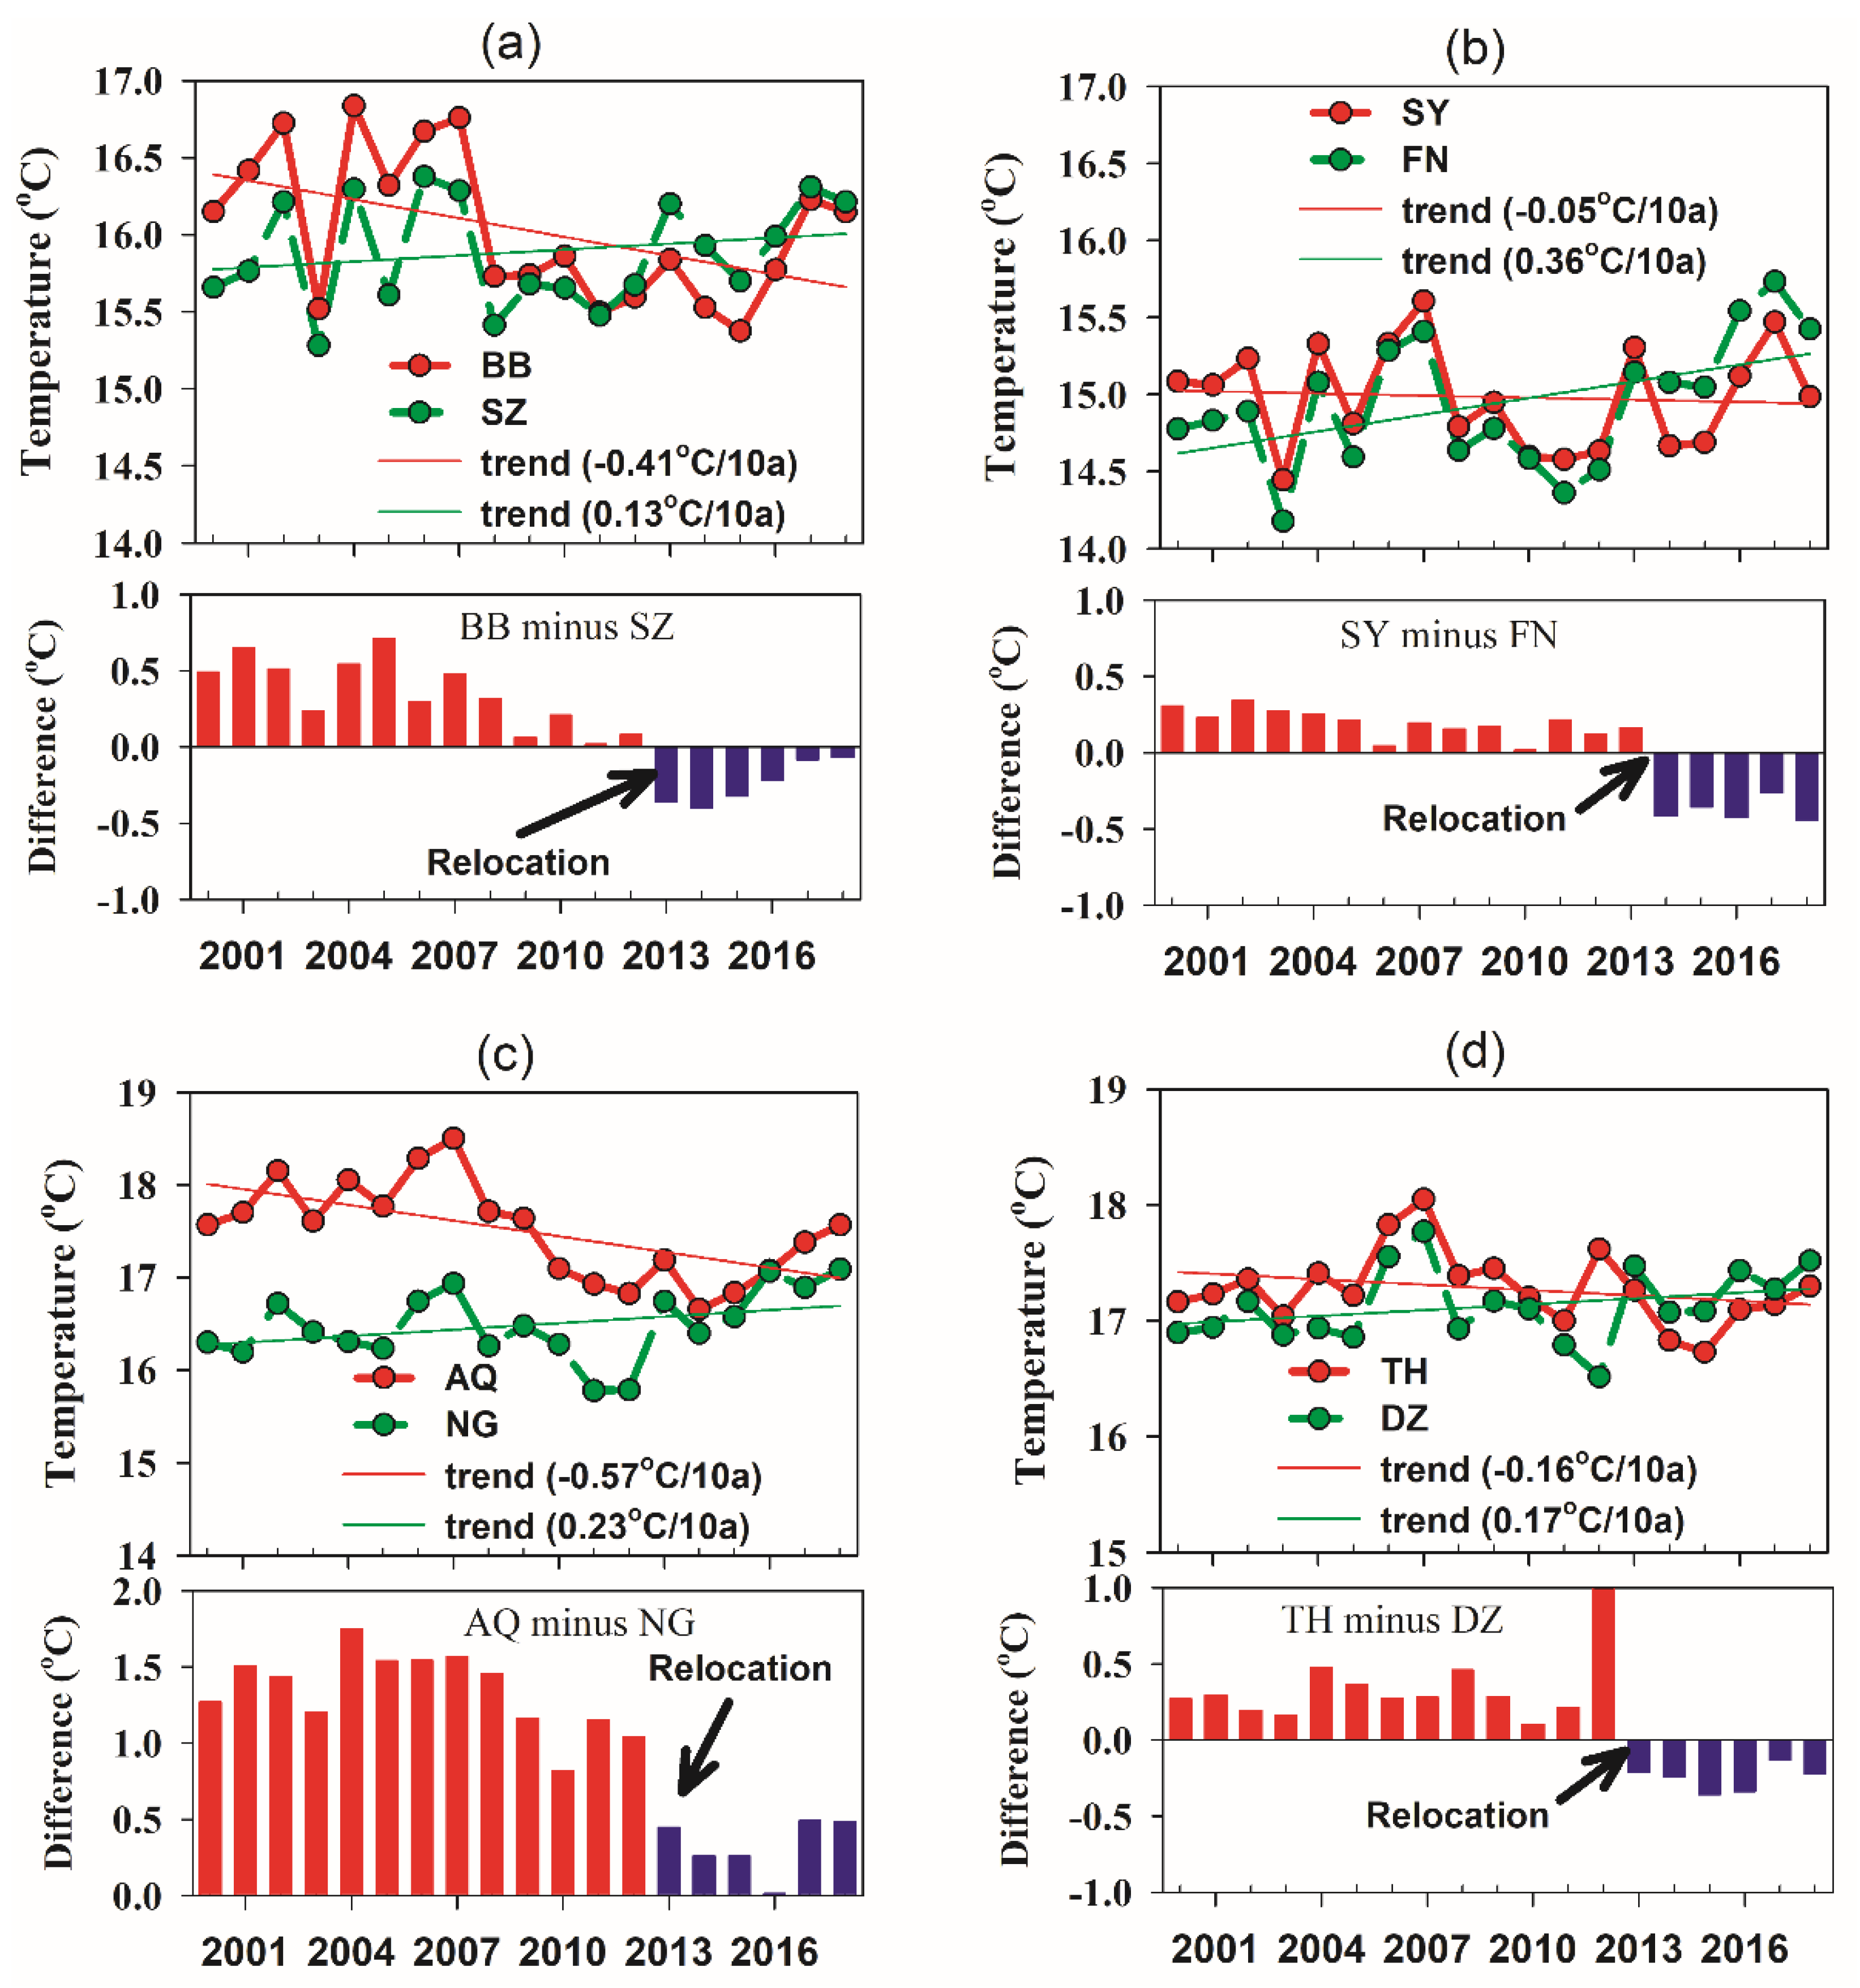
3.3. Impact of the Relocation of Meteorological Stations on the Observational Environment

The observational environment around the stations improved with the relocation of the meteorological stations. The PBA in the buffer zone decreased overall after relocation, with an average reduction of 56.8% compared with the older stations (Figure 8). However, there were differences in the change of PBA in the buffer zone between different stations. For example, the PBA of Anqing Station decreased from 54.7% to 0.3% (Figure 8a), the PBA of Sheyang Station changed from 27.8% to 18.9% (Figure 8f), but the PBA of Taihu Station increased slightly from 6.4% to 7.6% after relocation (Figure 8g). Unlike the stations in large cities, stations such as Sheyang and Taihu were in small urban areas and had short distances for their relocations, they were also closer to the urban center after relocation. The improvement at these stations was relatively small and the relationship between the relative position of the station and the built-up area changed marginally.
The built-up area and anthropogenic heat environment around the stations improved and their linear changes were consistent after relocation (Figure 9). However, the difference in the PBA in the buffer zone between the stations was relatively significant, whereas the changes in the AHF were consistent. The PBA after relocation averaged 43.2% of that of the old station, with a minimum of 0.5% and a maximum of 114.1%. For comparison, the average AHF of the old station was 57.0%, the minimum was 41.5% and the maximum was 76.5%. The AHF was mainly affected by a combination of many urban-driven factors.
To illustrate the reliability of the impact of station relocation on the observational environment around stations, the Suzhou station, Ningguo station and Dongzhi station that were belong to urban station, suburban station and rural station, respectively, were selected as the reference stations named non-relocated stations because they were not relocated during the study period. Compared with Figure 9, the time series of PBA and AHF at these three reference stations exhibited continuously increasing and the changes of the increasing during the study period were much smaller than those at the relocated stations (Figure 9). During 2010 to 2015, the PBA and AHF at the relocated stations decreased about 43.2% and 57.0%, respectively, while the PBA and AHF increased about 44.8% and 48.0%, respectively at the reference stations. Compared with Figure 9 and Figure 10, we found that the curves of PBA and AHF at the reference stations were closer to the curves at the relocation stations before relocated. These results indicate that the impact of station relocation on the observational environment was obvious. To investigate the impact of improving the anthropogenic heat environment on the meteorological observational data before and after relocation, we selected the daily mean temperature and relative humidity data (old station minus new station) forbased on the geographical representation of the stations and the corresponding year of relocation. That is, Bozhou, Bengbu and Anqing stations are located in the northern plains, middle hills and southern mountainous area of the YRD, respectively.
Figure 11 shows that the average temperature difference at Anqing Station was 0.78 °C, with the maximum value in October (1.08 °C) and the minimum in March (0.45 °C). The average temperature difference in autumn was significant and the difference in other seasons was uniformly distributed. The average temperature difference at Bengbu Station was just 0.5 °C and the differences were extremely low in July, August and September, with an average value of only 0.26 °C. After the relocation of Bozhou Station, the daily mean temperature difference was 0.76 °C, with the minimum (0.06 °C) in February. However, the overall seasonal difference at Bozhou Station was small. The daily mean temperature differences between the three groups of stations on most days were between 0 and 1.5 °C. There were 22 days at Anqing, 63 days at Bengbu and 45 days at Bozhou stations when the difference in the daily mean temperature between the new and old stations was ≤0 °C. By contrast, there were 30 days at Anqing, 16 days at Bengbu and 57 days at Bozhou stations when the difference was >1.5 °C.
The humidity at the three groups of stations increased after relocation and the average difference was −5.9%. The average humidity difference at Anqing Station was −5.1% and was relatively large in the first half of the year. The difference in February was 0.6%; this was the only month in which the difference was >0 among the three groups of stations, showing a relatively rare phenomenon of a reduction in humidity after relocation. The humidity at Bengbu Station increased slightly, with an average difference of −3.7%, and the difference between seasons was small. Bozhou Station had the largest increase in humidity, with an average difference of −9.0%. The average difference in spring was −11.9%, including May (−13.6%), which was the month with the lowest humidity among the three groups of stations. Compared with the daily mean temperature, the distribution of extreme days of relative humidity varied significantly among stations.
In general, the observational environment for most stations was improved as a result of the reduction in the built-up area after relocation and the AHF around the stations was significantly reduced. Observational data was significantly weakened by the urban heat island (high temperature) and urban dry island (low humidity) effects. That is, the daily mean temperature of the new station decreased relative to the old station, whereas the relative humidity increased. The improvement effect of station relocation on the meteorological observational environment was affected by many factors, including the distance between the old and new stations, the form of urban expansion and the local geographical and climatic background conditions. This led to the large difference in the effect of relocation on improving the meteorological observational environment in different regions.

4. Discussion

The findings reported here provide credible evidence that it is important to accurately evaluate the impact of urbanization on the observational environment to improve the quality and representativeness of meteorological observational data. Most previous studies have only discussed the impact of a few factors—such as the impact of rapid urban sprawl on land use types, building heights and sky openness factors—around the station. It is not known how urbanization affects the anthropogenic heat environment around a station, leading to uncertainties in the impact of urban sprawl on observations of temperature [30,34]. For example, the surrounding stations are often selected as climate reference stations to eliminate the effects of climate change, but the significant differences in the anthropogenic heat environment around the chosen stations and urban stations are not taken into account [30,35]. Many studies ignored the impact of anthropogenic heat on meteorological observations when selecting reference observation data [34,36,37]. Existing research on the influence of the AHF on meteorological elements has often paid more attention to the large-scale and high-level accumulation of the AHF and the effect of horizontal convection on the radiation at surrounding stations [38,39,40,41,42]. Our findings show that more attention should be paid to the effects of the local micro-scale anthropogenic heat environment around meteorological stations on the meteorological observational data.
Relocated stations often still do not meet the basic requirements of the meteorological observational environment, which leads to multiple relocations and affects the homogeneity of the observational data. Most previous studies have only shown that indicators such as the urban heat island effect and the built-up area around the station have been improved by relocation, with increases in the area of water bodies and vegetation, and there have been few in-depth analyses of the critical factors affecting improvements in the observational environment after relocation [43,44,45,46], especially for anthropogenic heat environment.
The relocation of stations is a complex project and needs to be coordinated to solve the contradictions between the representativeness of the meteorological observations and urban planning, economic development and the protection of farm and forest lands [47]. By comparing meteorological observational data before and after relocation, we have shown that changes in the observational environment will affect observational data, and even the inhomogeneity of its time series [2,3,4,5,6,7,8,9,10,11,12,13,14,15,16,17,18,19,20,21,22,23,24,25,26,27,28,29,30,31,32,33,34,35,36,37,38,39,40,41,42,43,44,45,46,47]. For instance, we selected four non-relocation stations (SZ and FN in the northern YRD; DZ and NG in the southern YRD), which can represent their background climate conditions, to match the four relocated stations (BB and SY in the northern YRD; AQ and TH in the southern YRD) during 2000–2018. These eight stations were divided in to four groups under similar climate zones, and their time series of annual temperatures and their differences were shown in Figure 12. During 2000–2018, generally, annual temperatures at all non-relocation stations exhibited increasing trends (0.13~0.36 °C/10a), while decreasing trends (−0.57~−0.05 °C/10a) for all relocated stations (Figure 12). Their annual temperature differences for each group showed sudden decreases when station-relocation occurred (Figure 12), corresponding well to the changes in AHF and PBA (Figure 9). In contrast, through the mutation detection of the meteorological data of the relocated stations and the reference stations after relocations, the meteorological data of the relocated station was generally consistent with the trend of the data of all stations in the entire research area in same period (Figure 12), which shows that the stations after the relocation still had good regional representatives that can be used to analyze the situation of the entire study area.
Therefore, the relocation of stations can reduce the impact of the urban heat island and dry island effects on meteorological observations, leading to observational data more accurately represents the local meteorological conditions. Our research evaluated the effect of the relocation of meteorological stations on improvements in the anthropogenic heat environment around the station and the impact on temperature observations, which showed clear seasonal differences [17,19,25], and can also explain discontinuities of time series of observations from the relocated stations with respect to the reference stations. Thus, it is the strong evidence that changes in the AHF affect meteorological elements [48,49,50,51].
Our work provides a scientific reference for the development of future station relocation plans. Follow-up work will further classify relocation into various types according to the built-up area and the AHF level around the station. For example, light detection and ranging (LIDAR) allows for extracting really accurate 3D data on urbanization in the study areas, with great advantages in a very dynamic environment with fast changes related to rapid urban sprawl, especially for obtaining the accurate the classification of LULC [52]. Therefore, LIDAR techniques should be applied for investigating the impacts of urbanization on observational environmental of meteorological stations in the future. Additionally, relevant numerical models will be established to optimize the rationality of the layout of the stations based on the morphology of the urban sprawl, the local background climate conditions and the station location. This is essential to resolve the contradictions between urban sprawl and the representation of meteorological observations.

5. Conclusions

We comprehensively investigated the impact of rapid urban sprawl on the observational environment around meteorological stations in the YRD during the time period 2000–2018 using remote sensing and GIS technology. We focused on the effects of the changes on both the built-up area and the AHF.
Rapid changes in urban sprawl can lead to significant changes in both the land use/land cover and the AHF around meteorological stations. A positive correlation was found between the PBA and the AHF and this correlation was in the order urban stations > suburban stations > rural stations. The impact of the AHF on the local observational environment around meteorological stations showed a clear spatiotemporal variability. The level of urbanization around some meteorological stations has increased significantly with the rapid development of urbanization in the YRD, leading to a continuous increase in the AHF. For instance, the spatial average AHF of all the meteorological stations in the YRD increased from a value of 5.45 W m−2 in 2000 to 14.74 W m−2 in 2018. The AHF around the meteorological stations within large cities was higher than that at meteorological stations outside large cities, although the differences in the AHF among these stations gradually decreased with the development of urbanization in the YRD.
Some meteorological stations need to be relocated to cope with the adverse effects induced by urbanization. After relocation, both the PBA and AHF around the new stations decreased significantly, weakening the urban heat island and urban dry island effects in the meteorological observations and substantially improving the observational environment, which had a huge difference from the stations without relocation. As a result, the observed daily mean temperature (relative humidity) decreased (increased) around the new stations after relocation. The improvement in the observational environment resulting from the relocation of the stations is closely related to the distance between the new station and the city, the rate of urban sprawl and the background conditions of the local geography and climate. As a consequence, the improvement in the observational environment resulting from relocation of the stations clearly varied in different regions of the YRD, all of them can contextualize in a more general trend in the whole YRD region, but also have own uniqueness from the stations without relocation.
Many developing counties are undergoing similar rapid urbanization to China. The findings reported here are important in understanding the changes in the AHF induced by the effects of urbanization on the observational environment around meteorological stations in other regions of China. Our findings provide scientific insights for the selection and construction of networks of meteorological stations and thus are helpful in scientifically evaluating and correcting the impact of rapid urban sprawl on meteorological observations.

Author Contributions

Conceptualization, Y.Y.; methodology, Y.Z. and Y.Y.; software, Y.Z.; validation, G.N. and Y.Y.; formal analysis, Y.Z., G.N. S.C., and Y.Y.; writing—original draft preparation, Y.Z. and G.N; writing—review and editing, G.N., Y.Z. and Y.Y.; visualization, Y.Z. and S.C.; supervision, Y.Y.; funding acquisition, Y.Y. All authors have read and agreed to the published version of the manuscript.

Funding

This study was jointly supported by the National Key Research and Development Program of China (2018YFC1506502), the NSFC-DFG (42061134009), open funding of Guangdong Key Laboratory of Ocean Remote Sensing (2017B030301005-LORS2001), and open funding of the State Key Laboratory of Loess and Quaternary Geology (SKLLQG2010).

Institutional Review Board Statement

“Not applicable” for studies not involving human.

Data Availability Statement

Urban impervious surface area datasets (https://zenodo.org/record/4034161#.YJleSofitPZ (accessed on 10 April 2021)) were used to retrieve built-up area, nighttime light satellite datasets (http://ngdc.noaa.gov/eog/dmsp/downloadV4composites.html (accessed on 10 April 2021)) were used to retrieve anthropogenic heat flux (AHF), surface meteorological observations were collected from the China Meteorological Data Service Center (http://data.cma.cn/en(accessed on 10 April 2021)).

Conflicts of Interest

The authors declare no conflict of interest.

References

  1. Peterson, T.C. Examination of Potential Biases in Air Temperature Caused by Poor Station Locations. Bull. Am. Meteorol. Soc. 2006, 87, 1073–1080. [Google Scholar] [CrossRef]
  2. Ren, G.; Li, J.; Ren, Y.; Chu, Z.; Zhang, A.; Zhou, Y.; Zhang, L.; Zhang, Y.; Bian, T. An Integrated Procedure to Determine a Reference Station Network for Evaluating and Adjusting Urban Bias in Surface Air Temperature Data. J. Appl. Meteor. Climatol. 2015, 54, 1248–1266. [Google Scholar] [CrossRef]
  3. Li, Y.-B.; Shi, T.; Yang, Y.-J.; Wu, B.-W.; Wang, L.-B.; Shi, C.-E.; Guo, J.-X.; Ji, C.-L.; Wen, H.-Y. Satellite-Based Investigation and Evaluation of the Observational Environment of Meteorological Stations in Anhui Province, China. Pure Appl. Geophys. PAGEOPH 2014, 172, 1735–1749. [Google Scholar] [CrossRef]
  4. Ren, G.; Ding, Y.; Tang, G. An overview of mainland China temperature change research. J. Meteorol. Res. 2017, 31, 3–16. [Google Scholar] [CrossRef]
  5. Stewart, I.D.; Oke, T.R. Local Climate Zones for Urban Temperature Studies. Bull. Am. Meteorol. Soc. 2012, 93, 1879–1900. [Google Scholar] [CrossRef]
  6. Shi, T.; Huang, Y.; Wang, H.; Shi, C.E.; Yang, Y.J. Influence of Urbanization on the Thermal Environment of Meteorological Stations: Satellite-observational Evidence. Adv. Clim. Chang. Res. 2015, 1, 7–15. [Google Scholar] [CrossRef]
  7. Yang, Y.-J.; Wu, B.-W.; Shi, C.-E.; Zhang, J.-H.; Li, Y.-B.; Tang, W.-A.; Wen, H.-Y.; Zhang, H.-Q.; Shi, T. Impacts of Urbanization and Station-relocation on Surface Air Temperature Series in Anhui Province, China. Pure Appl. Geophys. PAGEOPH 2012, 170, 1969–1983. [Google Scholar] [CrossRef]
  8. Mahmood, R.; Foster, S.A.; Logan, D. The GeoProfile metadata, exposure of instruments, and measurement bias in climatic record revisited. Int. J. Clim. 2006, 26, 1091–1124. [Google Scholar] [CrossRef]
  9. Davey, C.A.; Pielke Sr, R.A. Microclimate exposures of surface-based weather stations: Implication for the assessment of long-term temperature trends. Bull. Am. Meteorol. Soc. 2005, 86, 497–503. [Google Scholar]
  10. Li, Q.; Liu, X.; Zhang, H. Detecting and Adjusting on Temporal Inhomogeneities in Chinese Mean Surface Air Temper-ature Datasets. Adv. Atmos. Sci. 2004, 21, 260–268. [Google Scholar] [CrossRef]
  11. Karl, T.R.; Williams, J.C.N.; Young, P.J.; Wendland, W.M. A Model to Estimate the Time of Observation Bias Associated with Monthly Mean Maximum, Minimum and Mean Temperatures for the United States. J. Clim. Appl. Meteorol. 1986, 25, 145–160. [Google Scholar] [CrossRef] [Green Version]
  12. Ren, Y.; Ren, G. A Remote-Sensing Method of Selecting Reference Stations for Evaluating Urbanization Effect on Surface Air Temperature Trends. J. Clim. 2011, 24, 3179–3189. [Google Scholar] [CrossRef] [Green Version]
  13. Van Den Hoek, J.; Smith, A.C.; Hurni, K.; Saksena, S.; Fox, J. Shedding New Light on Mountainous Forest Growth: A Cross-Scale Evaluation of the Effects of Topographic Illumination Correction on 25 Years of Forest Cover Change across Nepal. Remote Sens. 2021, 13, 2131. [Google Scholar] [CrossRef]
  14. Ghayour, L.; Neshat, A.; Paryani, S.; Shahabi, H.; Shirzadi, A.; Chen, W.; Al-Ansari, N.; Geertsema, M.; Pourmehdi Amiri, M.; Gholamnia, M.; et al. Performance Evaluation of Sentinel-2 and Landsat 8 OLI Data for Land Cover/Use Classification Using a Comparison between Machine Learning Algorithms. Remote Sens. 2021, 13, 1349. [Google Scholar] [CrossRef]
  15. Malinowski, R.; Lewiński, S.; Rybicki, M.; Gromny, E.; Jenerowicz, M.; Krupiński, M.; Nowakowski, A.; Wojtkowski, C.; Krupiński, M.; Krätzschmar, E.; et al. Automated Production of a Land Cover/Use Map of Europe Based on Sentinel-2 Imagery. Remote Sens. 2020, 12, 3523. [Google Scholar] [CrossRef]
  16. Li, Q.; Yang, S.; Xu, W.; Wang, X.L.; Jones, P.; Parker, D.; Zhou, L.; Feng, Y.; Gao, Y. China experiencing the recent warming hiatus. Geophys. Res. Lett. 2015, 42, 889–898. [Google Scholar] [CrossRef]
  17. Yang, Y.; Zhang, M.; Li, Q.; Chen, B.; Gao, Z.; Ning, G.; Liu, C.; Li, Y.; Luo, M. Modulations of surface thermal environment and agricultural activity on intraseasonal variations of summer diurnal temperature range in the Yangtze River Delta of China. Sci. Total Environ. 2020, 736, 139445. [Google Scholar] [CrossRef]
  18. O’Neill, R.V.; Hunsaker, C.T.; Jones, K.B.; Riitters, K.H.; Wickham, J.D.; Schwartz, P.M.; Goodman, I.A.; Jackson, B.L.; Baillargeon, W.S. Monitoring Environmental Quality at the Landscape Scale. Bioscience 1997, 47, 513–519. [Google Scholar] [CrossRef] [Green Version]
  19. Chen, B.; Dong, L.; Liu, X.; Shi, G.Y.; Chen, L.; Nakajima, T.; Habib, A. Exploring the possible effect of anthropogenic heat release due to global energy consumption upon global climate: A climate model study. Int. J. Clim. 2016, 36, 4790–4796. [Google Scholar] [CrossRef]
  20. Chen, B.; Dong, L.; Shi, G.; Li, L.-J.; Chen, L.-F. Anthropogenic Heat Release: Estimation of Global Distribution and Possible Climate Effect. J. Meteorol. Soc. Jpn. 2014, 92A, 157–165. [Google Scholar] [CrossRef] [Green Version]
  21. Chen, B.; Shi, G.Y. Estimation of the distribution of global anthropogenic heat flux. Atmos. Ocean. Sci. Lett. 2012, 5, 108–112. [Google Scholar]
  22. Chen, B.; Shi, G.; Wang, B.; Zhao, J.; Tan, S. Estimation of the anthropogenic heat release distribution in China from 1992 to 2009. Acta Meteorol. Sin. 2012, 26, 507–515. [Google Scholar] [CrossRef]
  23. Chen, B.; Zhao, J.-Q.; Shi, G.-Y. Reply to the Comments of F. Fujibe on Anthropogenic Heat Release: Estimation of Global Distribution and Possible Climate Effect. J. Meteorol. Soc. Jpn. 2015, 93, 505–508. [Google Scholar] [CrossRef] [Green Version]
  24. Luo, M.; Lau, N. Increasing Heat Stress in Urban Areas of Eastern China: Acceleration by Urbanization. Geophys. Res. Lett. 2018, 45, 13060–13069. [Google Scholar] [CrossRef]
  25. Luo, M.; Lau, N. Urban Expansion and Drying Climate in an Urban Agglomeration of East China. Geophys. Res. Lett. 2019, 46, 6868–6877. [Google Scholar] [CrossRef]
  26. Chen, G.W.; Wang, D.Y.; Wang, Q.; Li, Y.G.; Wang, X.M.; Hang, J.; Gao, P.; Ou, C.Y.; Wang, K. The influence of aspect ratios and thermal storage on urban thermal environment in street canyon models by scaled outdoor measurement. Sci. Total Environ. 2020, 726, 138–147. [Google Scholar] [CrossRef]
  27. Yang, X.; Leung, L.R.; Zhao, N.; Zhao, C.; Qian, Y.; Hu, K.; Liu, X.; Chen, B. Contribution of urbanization to the increase of extreme heat events in an urban agglomeration in east China. Geophys. Res. Lett. 2017, 44, 6940–6950. [Google Scholar] [CrossRef]
  28. Yang, X.; Ye, T.; Zhao, N.; Chen, Q.; Yue, W.; Qi, J.; Zeng, B.; Jia, P. Population Mapping with Multi sensor Remote Sensing Images and Point-Of-Interest Data. Remote Sens. 2019, 11, 574. [Google Scholar] [CrossRef] [Green Version]
  29. Yang, Y.J.; Gao, Z.; Shi, T.; Wang, H.; Li, Y.; Zhang, N.; Zhang, H.; Huang, Y. Assessment of Urban Surface Thermal Environment using MODIS with Population-weighted Method: A Case Study. J. Spat. Sci. 2019, 64, 287–300. [Google Scholar] [CrossRef]
  30. Wang, C.G.; Wei, X.L.; Yan, J.D.; Jin, L.J. Grade evaluation of detection environment of meteorological stations in Beijing. J. Appl. Meteor. Sci. 2019, 30, 117–128. [Google Scholar]
  31. Chen, S.H.; Li, L.; Jiang, H.F.; Ju, W.J.; Zhang, M.Y.; Liu, D.Y.; Yang, Y.J. Impact of Observational Environment Change on Air Temperature Based on High-Spatial-Resolution Satellite Remote Sensing Data. Acta Opt. Sin. 2020, 40, 1028001. [Google Scholar] [CrossRef]
  32. Balsa-Barreiro, J.; Li, Y.; Morales, A.; Pentland, A. Globalization and the shifting centers of gravity of world’s human dynamics: Implications for sustainability. J. Clean. Prod. 2019, 239, 1–17. [Google Scholar] [CrossRef]
  33. Kuang, W.; Zhang, S.; Li, X.; Lu, D. A 30-meter resolution dataset of impervious surface area and green space fractions of China’s cities, 2000–2018 (Version v4.0). Earth Syst. Sci. Data Discuss. 2020, 107, 1–23. [Google Scholar]
  34. Shou, Y.X.; Zhang, D.L. Recent advances in understanding urban heat island effects with some future prospects. Acta Meteorol. Sin. 2012, 70, 338–353. [Google Scholar]
  35. Zhou, X.Q.; Li, Y.J.; Li, X.Y.; Wang, Y.F. Analysis of the Three Modes Based on the Historical Observation Data from Relocation Meteorological Station. Chin. Agric. Sci. Bull. 2015, 31, 223–228. [Google Scholar]
  36. Liu, N.W.; Wan, Z.H.; Ma, Y.J. Numerical study on meteorological field of boundary layer in the city group of middle Liaoning. Sci. Meteorol. Sin. 2008, 28, 558–562. [Google Scholar]
  37. Ren, X.; Wang, Y.W.; Zhang, Z.; Yang, Y.C.; Hu, C.; Kang, H.Q. Simulation studies for Lake Taihu effect on surrounding cities thermal environment. Acta Meteorol. Sin. 2017, 75, 645–660. [Google Scholar]
  38. Wang, J.; Xue, C.; Huang, S.; Wang, D.; Pan, L.; Cheng, L. Sensitivity Test of Impact of Urbanization and Anthropogenic Heat on Meteorological Elements in Xi’an. J. Arid Meteorol. 2015, 33, 434–443. [Google Scholar]
  39. Liu, P.; Li, L.P.; Liao, J.B.; Guo, X.M.; Zhang, Y.R. A study of the effect of anthropogenic heat on meteorological factors in the summer of Shanghai City. J. Lanzhou Univ. Nat. Sci. 2019, 55, 267–273. [Google Scholar]
  40. Niu, Q.; Nie, C.; Lin, F.; Li, L.; Ji, L. Model study of relationship between local temperature and artificial heat release. Sci. China Ser. E Technol. Sci. 2012, 55, 821–830. [Google Scholar] [CrossRef]
  41. Qiao, Z.; Tian, G.J. Dynamic monitoring of the footprint and capacity for urban heat island in Beijing between 2001 and 2012 based on MODIS. J. Remote Sens. 2015, 19, 476–484. [Google Scholar]
  42. Liu, Y.H.; Luan, Q.Z.; Quan, W.J.; Zhang, S. Research on Heat Environment of Beijing-Tianjin-Tangshan Urban Group Based on Multisource Satellite Data. Ecol. Environ. Sci. 2015, 24, 1150–1158. [Google Scholar]
  43. Yan, Z.; Li, Z.; Li, Q.; Jones, P. Effects of site change and urbanisation in the Beijing temperature series 1977–2006. Int. J. Clim. 2009, 30, 1226–1234. [Google Scholar] [CrossRef]
  44. Li, Z.; Yan, Z. Application of multiple analysis of series for homogenization (MASH) to Beijing daily temperature series 1960–2006. Adv. Atmos. Sci. 2010, 27, 777–787. [Google Scholar] [CrossRef]
  45. Cao, L.J.; Yan, Z.W. Progress in research on homogenization of climate data. Adv. Clim. Chang. Res. 2012, 3, 59–67. [Google Scholar]
  46. Yang, S.; Li, Q.X. Improvement in homogeneity analysis method and update of China precipitation data. Prog. Inquisitiones Mutat. Clim. 2014, 10, 276–281. [Google Scholar]
  47. Zhang, G.H.; Guan, Y.H.; Guo, Y.L. Discussion on current situation of meteorological observational environment and its protection measurements. J. Meteorol. Environ. 2012, 28, 65–70. [Google Scholar]
  48. Yan, L.; Office, A.M. Analysis of the Main Meteorological Factors Differences in Meteorological Stations Migrating and In-fluence on Weather Forecasting Service. Meteorol. Environ. Sci. 2017, 40, 138–143. [Google Scholar]
  49. Li, Y.J.; Liang, G.J.; Yang, S.; Lu, B.; Zhang, R.X.; Song, X.J. Comparative Analysis of Synchronously Observed Temperature Measurements before and after Station Move. Meteorol. Sci. Technol. 2010, 38, 599–604. [Google Scholar]
  50. Zong, L.; Liu, S.; Yang, Y.; Ren, G.; Yu, M.; Zhang, Y.; Li, Y. Synergistic Influence of Local Climate Zones and Wind Speeds on the Urban Heat Island and Heat Waves in the Megacity of Beijing, China. Front. Earth Sci. 2021, 9, 3786. [Google Scholar] [CrossRef]
  51. Shi, T.; Huang, Y.; Sun, D.; Lu, G.; Yang, Y. A New Method for Correcting Urbanization-Induced Bias in Surface Air Temperature Observations: Insights from Comparative Site-Relocation Data. Front. Environ. Sci. 2021, 9, 5418. [Google Scholar] [CrossRef]
  52. Txomin, H.; Luis, A.R.; Jorge, A.R. Land-Use Mapping of Valencia City Area from Aerial Images and LiDAR Data. In Proceedings of the GEOProcessing 2012: The Fourth International Conference on Advanced Geographic Information Systems, Applications, and Services, Valencia, Spain, 30 January–4 February 2012; pp. 232–237. [Google Scholar]
Figure 1. Map of the YRD showing land use, the classification of meteorological stations, the relocated stations (black) and reference stations (white) (initials of the station names are given above the stations). The LULC maps in 2016 were from the MODIS MCD12Q1 product at a 0.5 km × 0.5 km resolution.
Remotesensing 13 02624 g001
Figure 2. (a) Maps of the change in the extent of built-up areas in the YRD from 2000 to 2018. Annual change and line graphs of the PBA in the buffer zone within a 5-km radius centered on the meteorological stations of the four provincial capital cities of (b) Hefei (HF), (c) Nanjing (NJ), (d) Xujiahui (XJH) and (e) Hangzhou (HZ).
Remotesensing 13 02624 g002
Figure 3. (a) The ratio of PBA in 2005, 2010, 2015 and 2018 to that in 2000. (b) the PBA in the year 2000.
Remotesensing 13 02624 g003
Figure 4. Maps of the AHF in the YRD from 2000 to 2018. (a) 2000, (b) 2005, (c) 2010, (d) 2015 and (e) 2018. (f) The average AHFs in a 5-km buffer zone around 76 stations in different years.
Remotesensing 13 02624 g004
Figure 5. Scatter diagrams and graphs of the relationship between different levels of AHF and the PBA in a 5 km radius buffer zone around the meteorological stations in different years: (a) 2000, (b) 2005, (c) 2010, (d) 2015 and (e) 2018.
Remotesensing 13 02624 g005
Figure 6. Scatter plots and linear plots of the relationship between the average AHF and the PBA in a 5-km radius buffer zone around the meteorological stations.
Remotesensing 13 02624 g006
Figure 7. Average of the relative multiples of the AHF at three different types of station in a 5 km radius buffer zone around the meteorological stations (comparative analysis every five years).
Remotesensing 13 02624 g007
Figure 8. Maps showing the 5 km radius buffer zone around the old and new stations and the level of the built-up area in the surrounding environment for (a) Anqing (AQ), (b) Bengbu (BB), (c) Bozhou (BZ), (d) Huai’an (HA), (e) Pinghu (PH), (f) Sheyang (SY) and (g) Taihu (TH) stations in Figure 1.
Remotesensing 13 02624 g008
Figure 9. Linear graph of the changes in (a) the PBA and (b) the average AHF in the 5 km radius buffer zone around the old and new stations. The solid (dotted) line after 2010 represents the surrounding environment of the new (old) station after relocation.
Remotesensing 13 02624 g009
Figure 10. Linear graph of the changes in (a) the PBA and (b) the average AHF in the 5 km radius buffer zone around the reference stations: Suzhou (SZ), Ningguo (NG) and Dongzhi (DZ) in Figure 1.
Remotesensing 13 02624 g010
Figure 11. Monthly difference in the daily mean temperature (left—hand panels) and relative humidity (right—hand panels) between the new and old stations (old station data minus new station). (a,b) Anqing (AQ), (c,d) Bengbu (BB) and (e,f) Bozhou (BZ) stations.
Remotesensing 13 02624 g011
Figure 12. Time series of annual temperatures and their differences for four group stations in the YRD during 2000–2018. (a) BB and SZ, (b) SY and FN in the northern YRD; (c) AQ and NG, (d) TH and DZ in the southern YRD.
Remotesensing 13 02624 g012
Publisher’s Note: MDPI stays neutral with regard to jurisdictional claims in published maps and institutional affiliations.

