
Spatially Modeling the Synergistic Impacts of Global Warming and Sea-Level Rise on Coral Reefs in the South China Sea

 ,
,
Abstract
:
1. Introduction
2. Materials and Methods
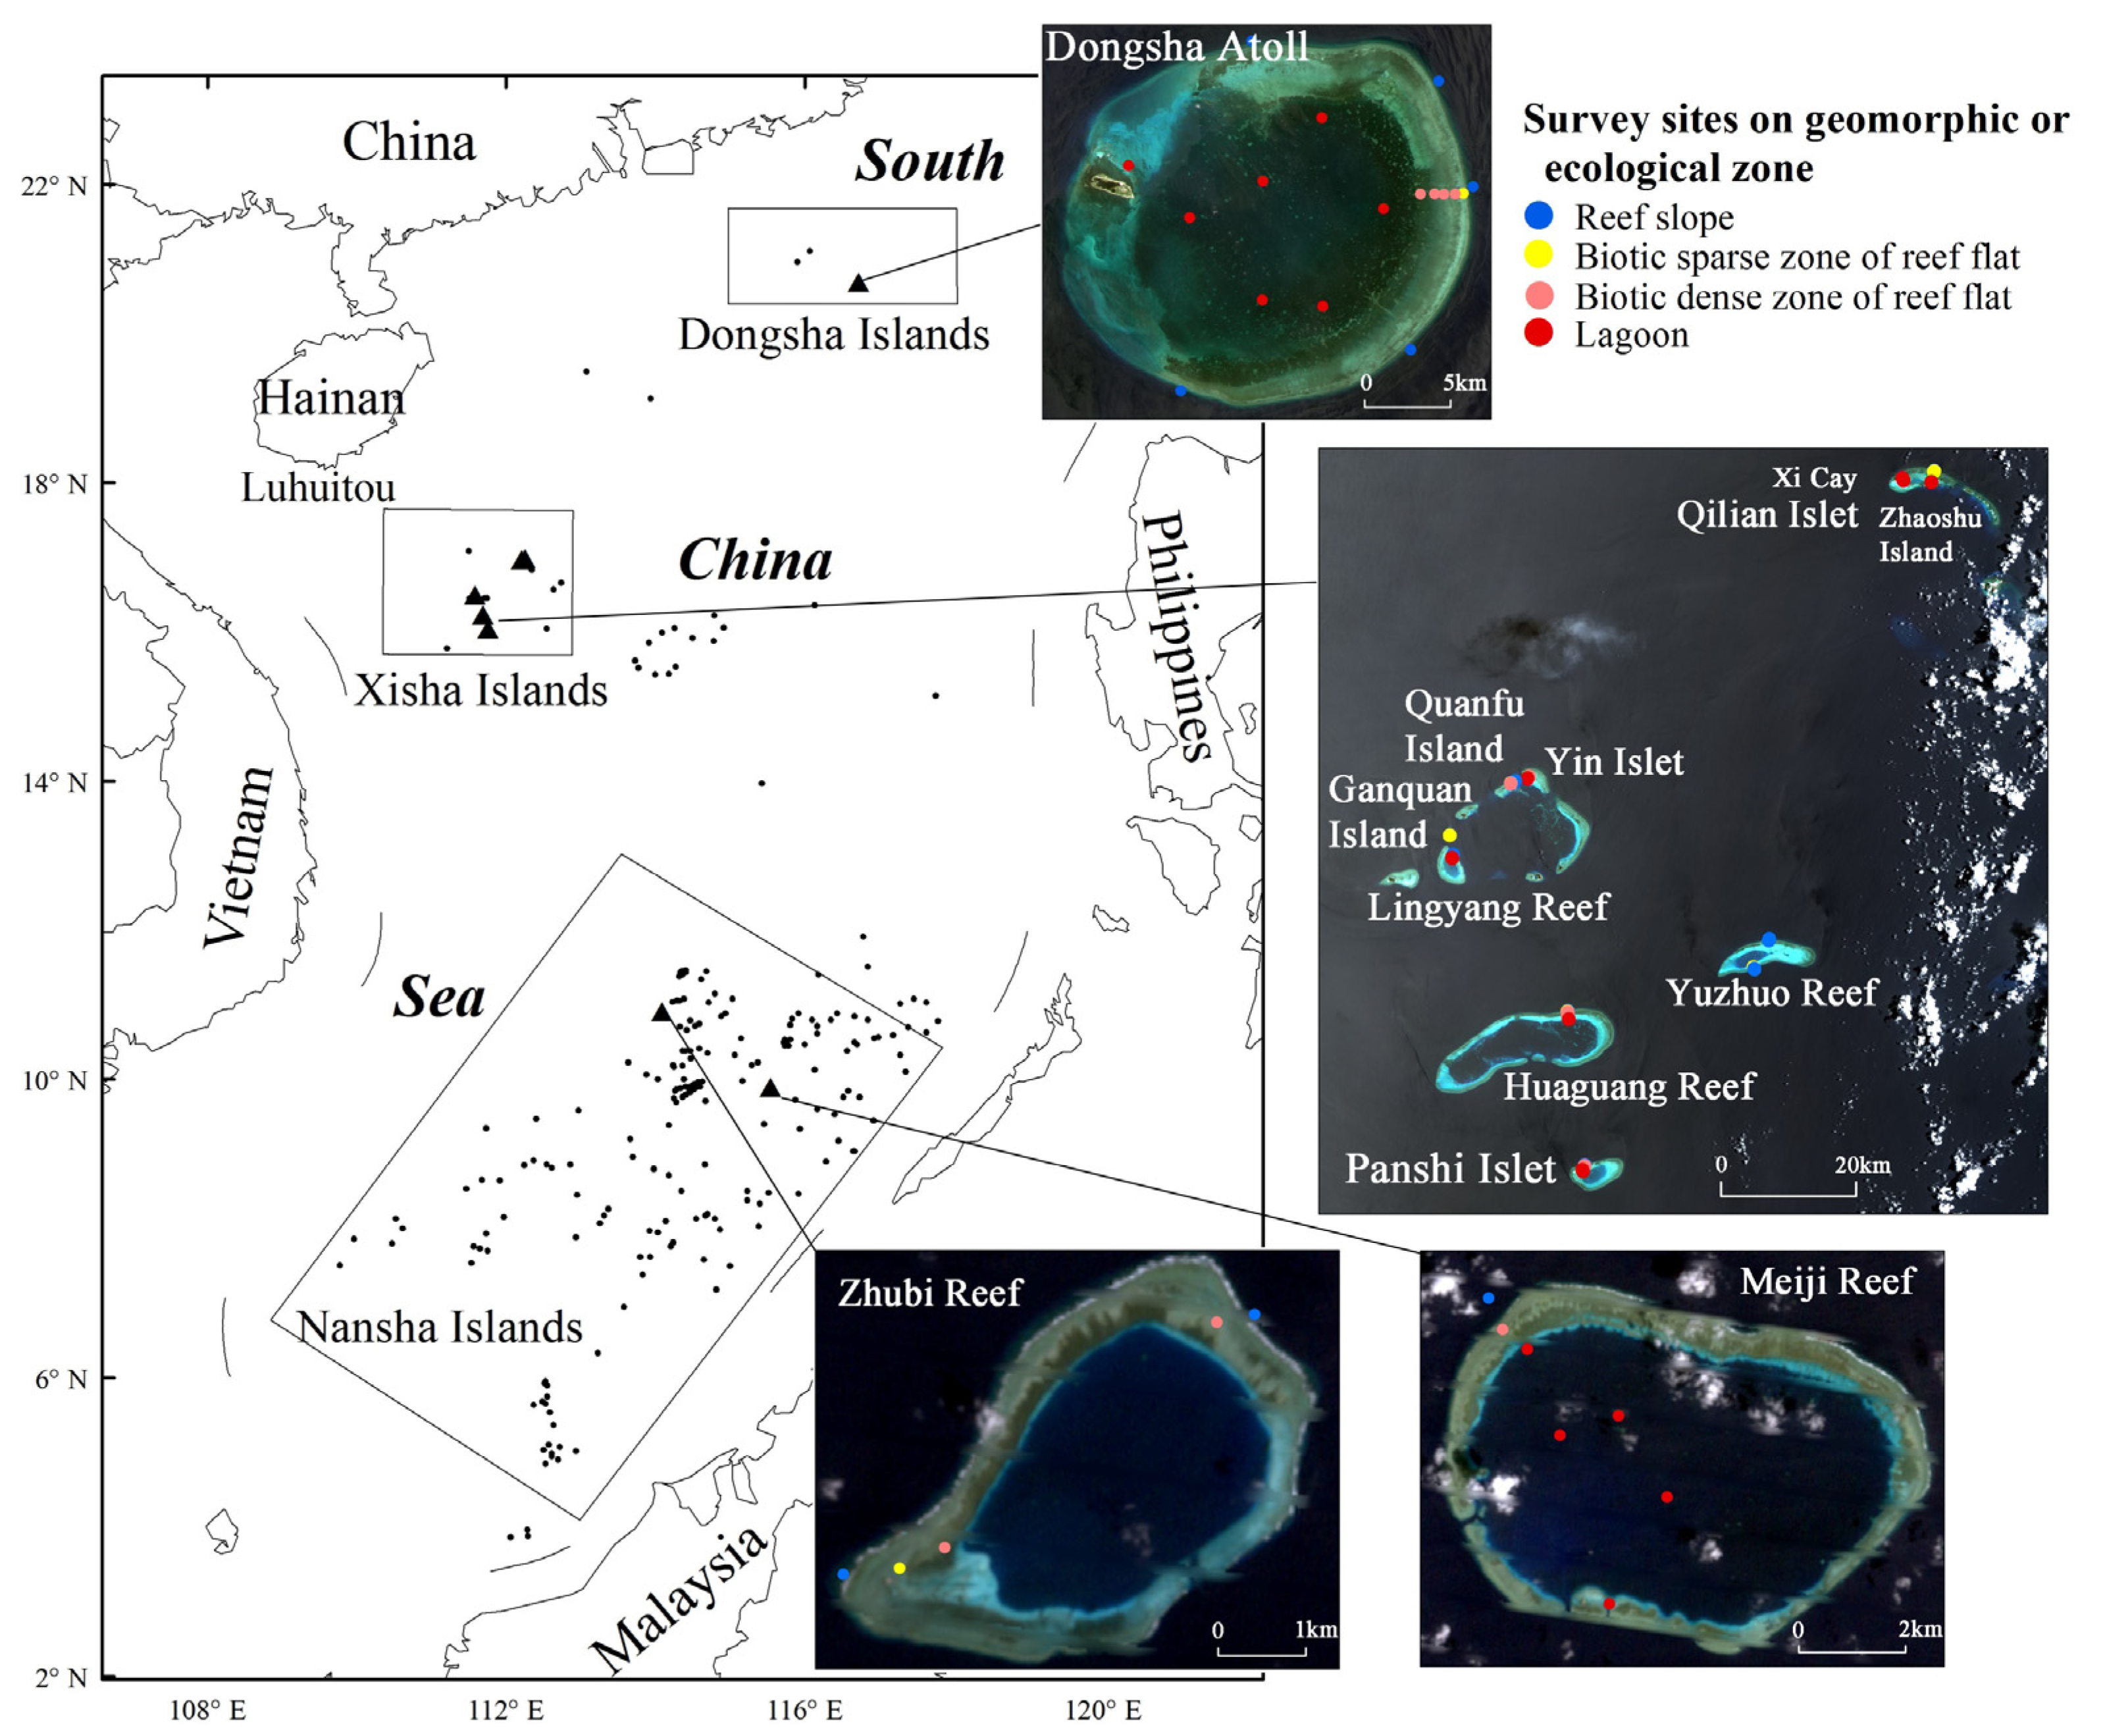
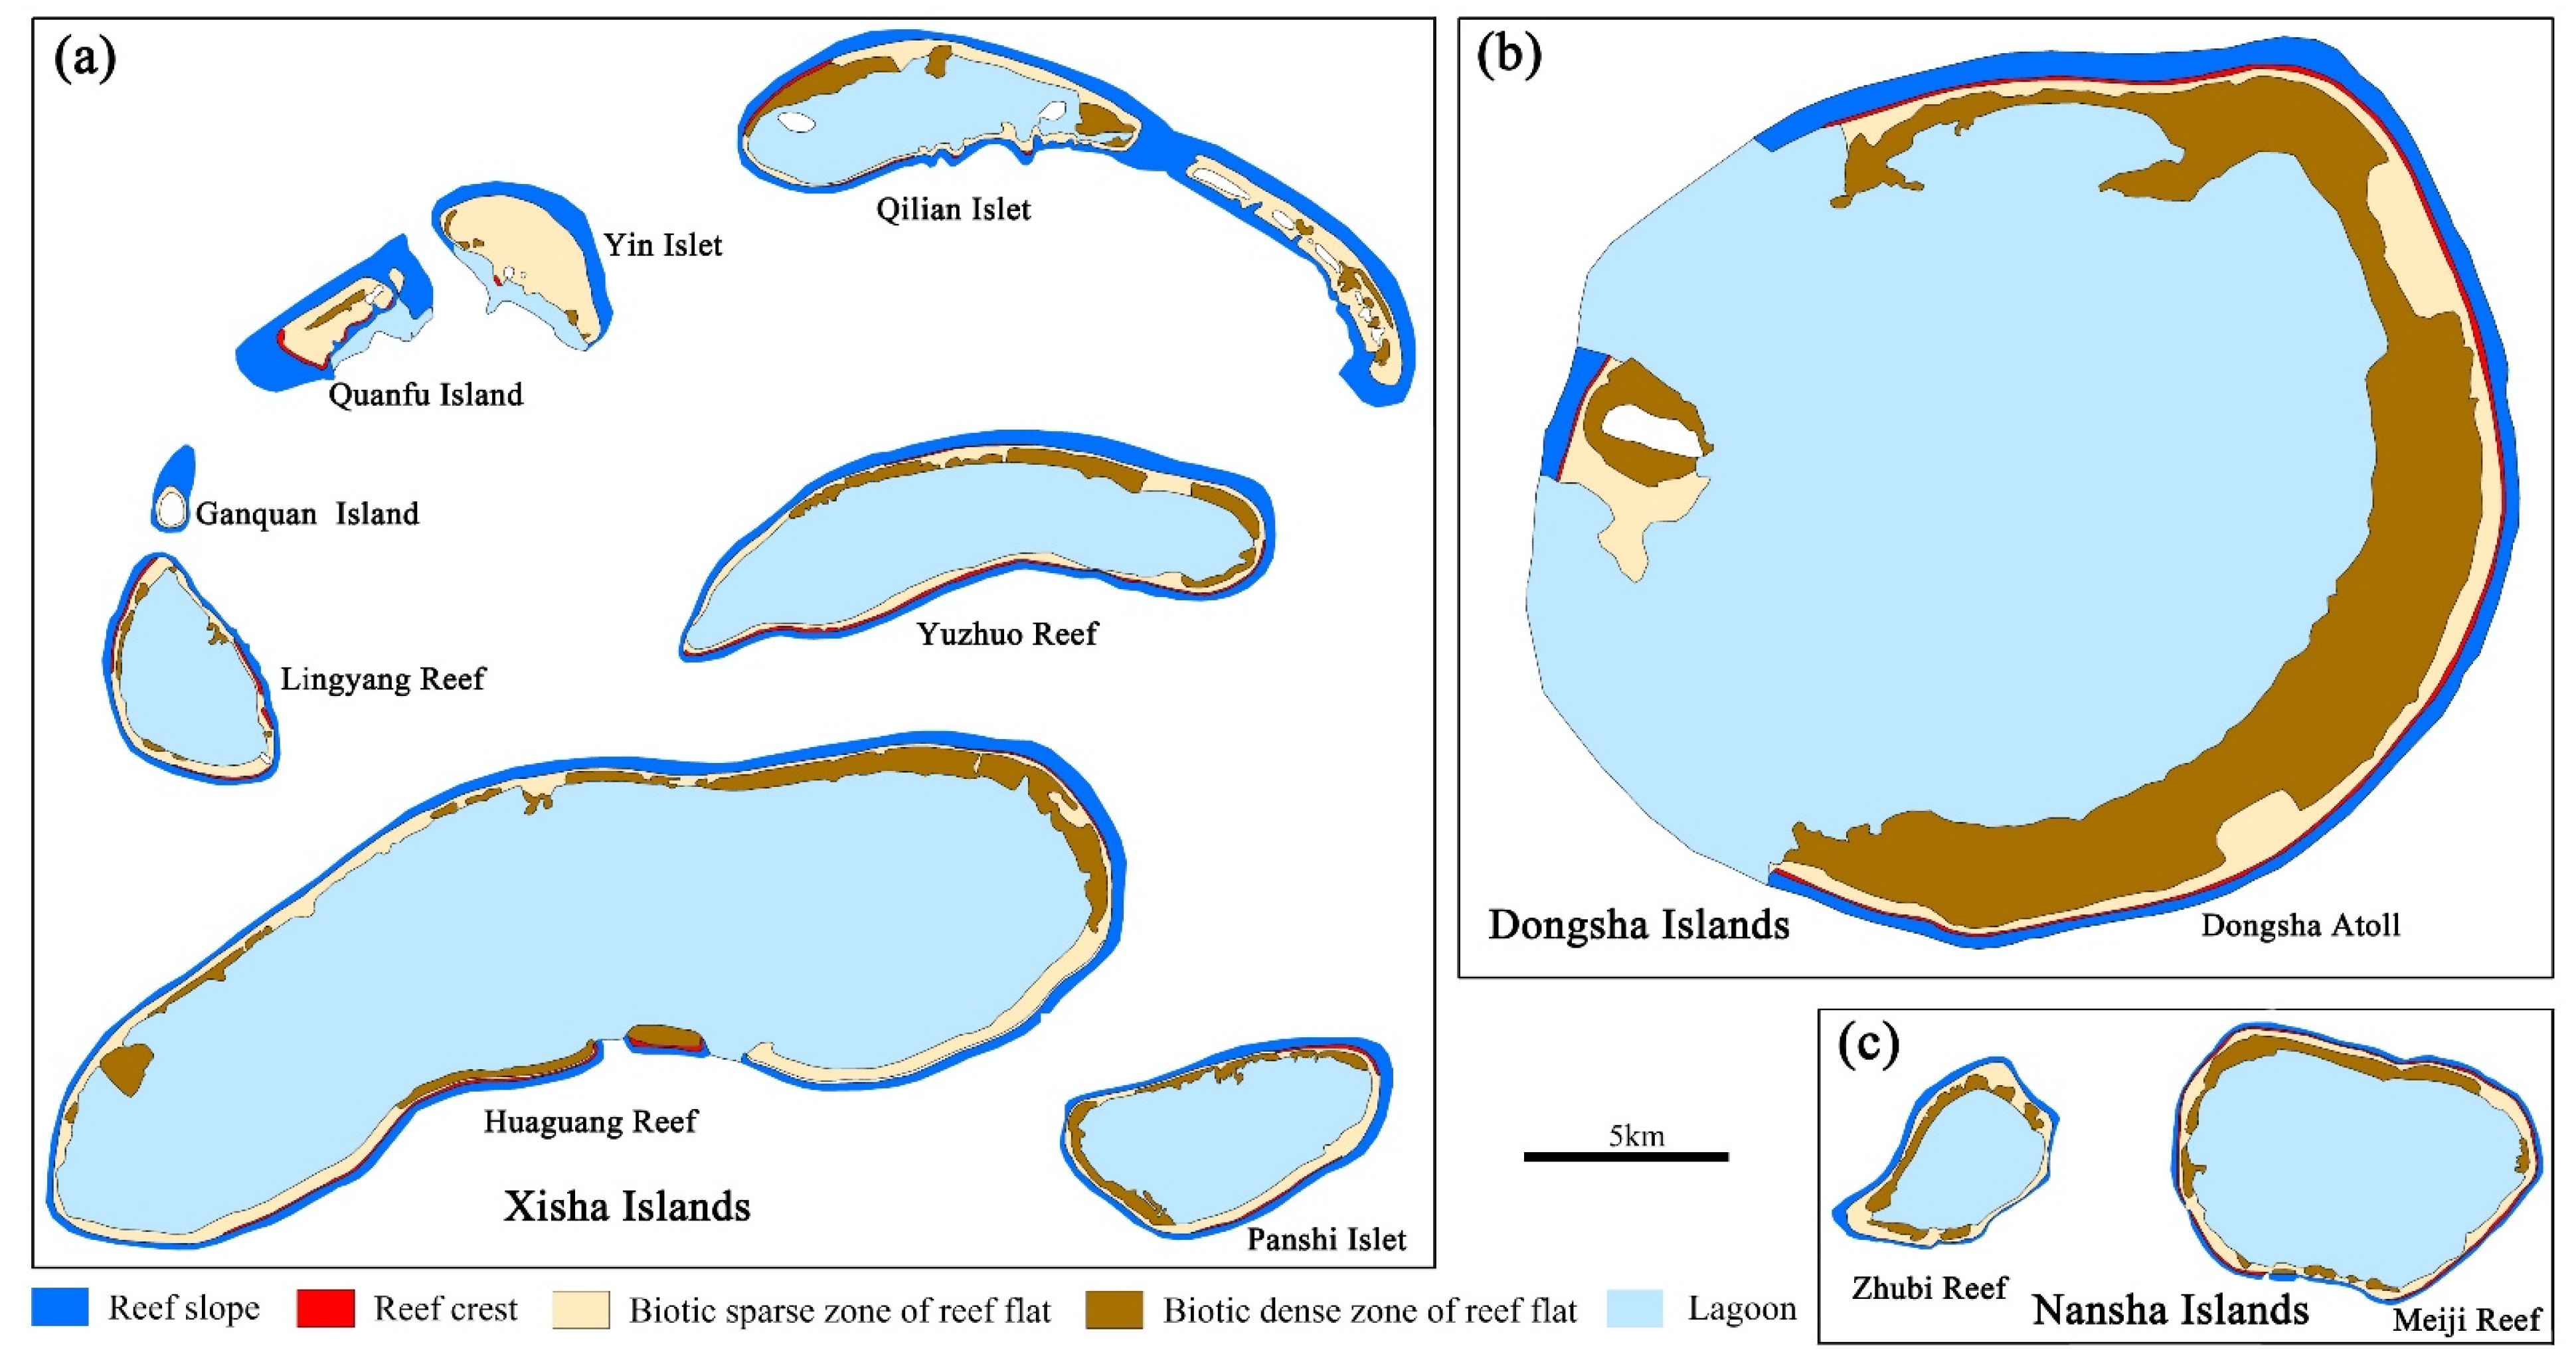
2.1. Study Area
2.2. Field Survey and Data Extraction
2.3. Modelling Reef Response to Global Warming and Sea-Level Rise Scenarios from 2014 to 2100
2.3.1. Climate Model and Thermal Stress Calculation
2.3.2. Sea-Level Rise Scenarios
2.3.3. Parameterization of Reef Accretion
2.3.4. Simulation Model Construction and Implementation
3. Results
3.1. Sites of Geomorphic or Ecological Zones in Simulation
3.2. Accretion Rate of Geomorphic or Ecological Zones
3.3. Reef Responses to Global Warming
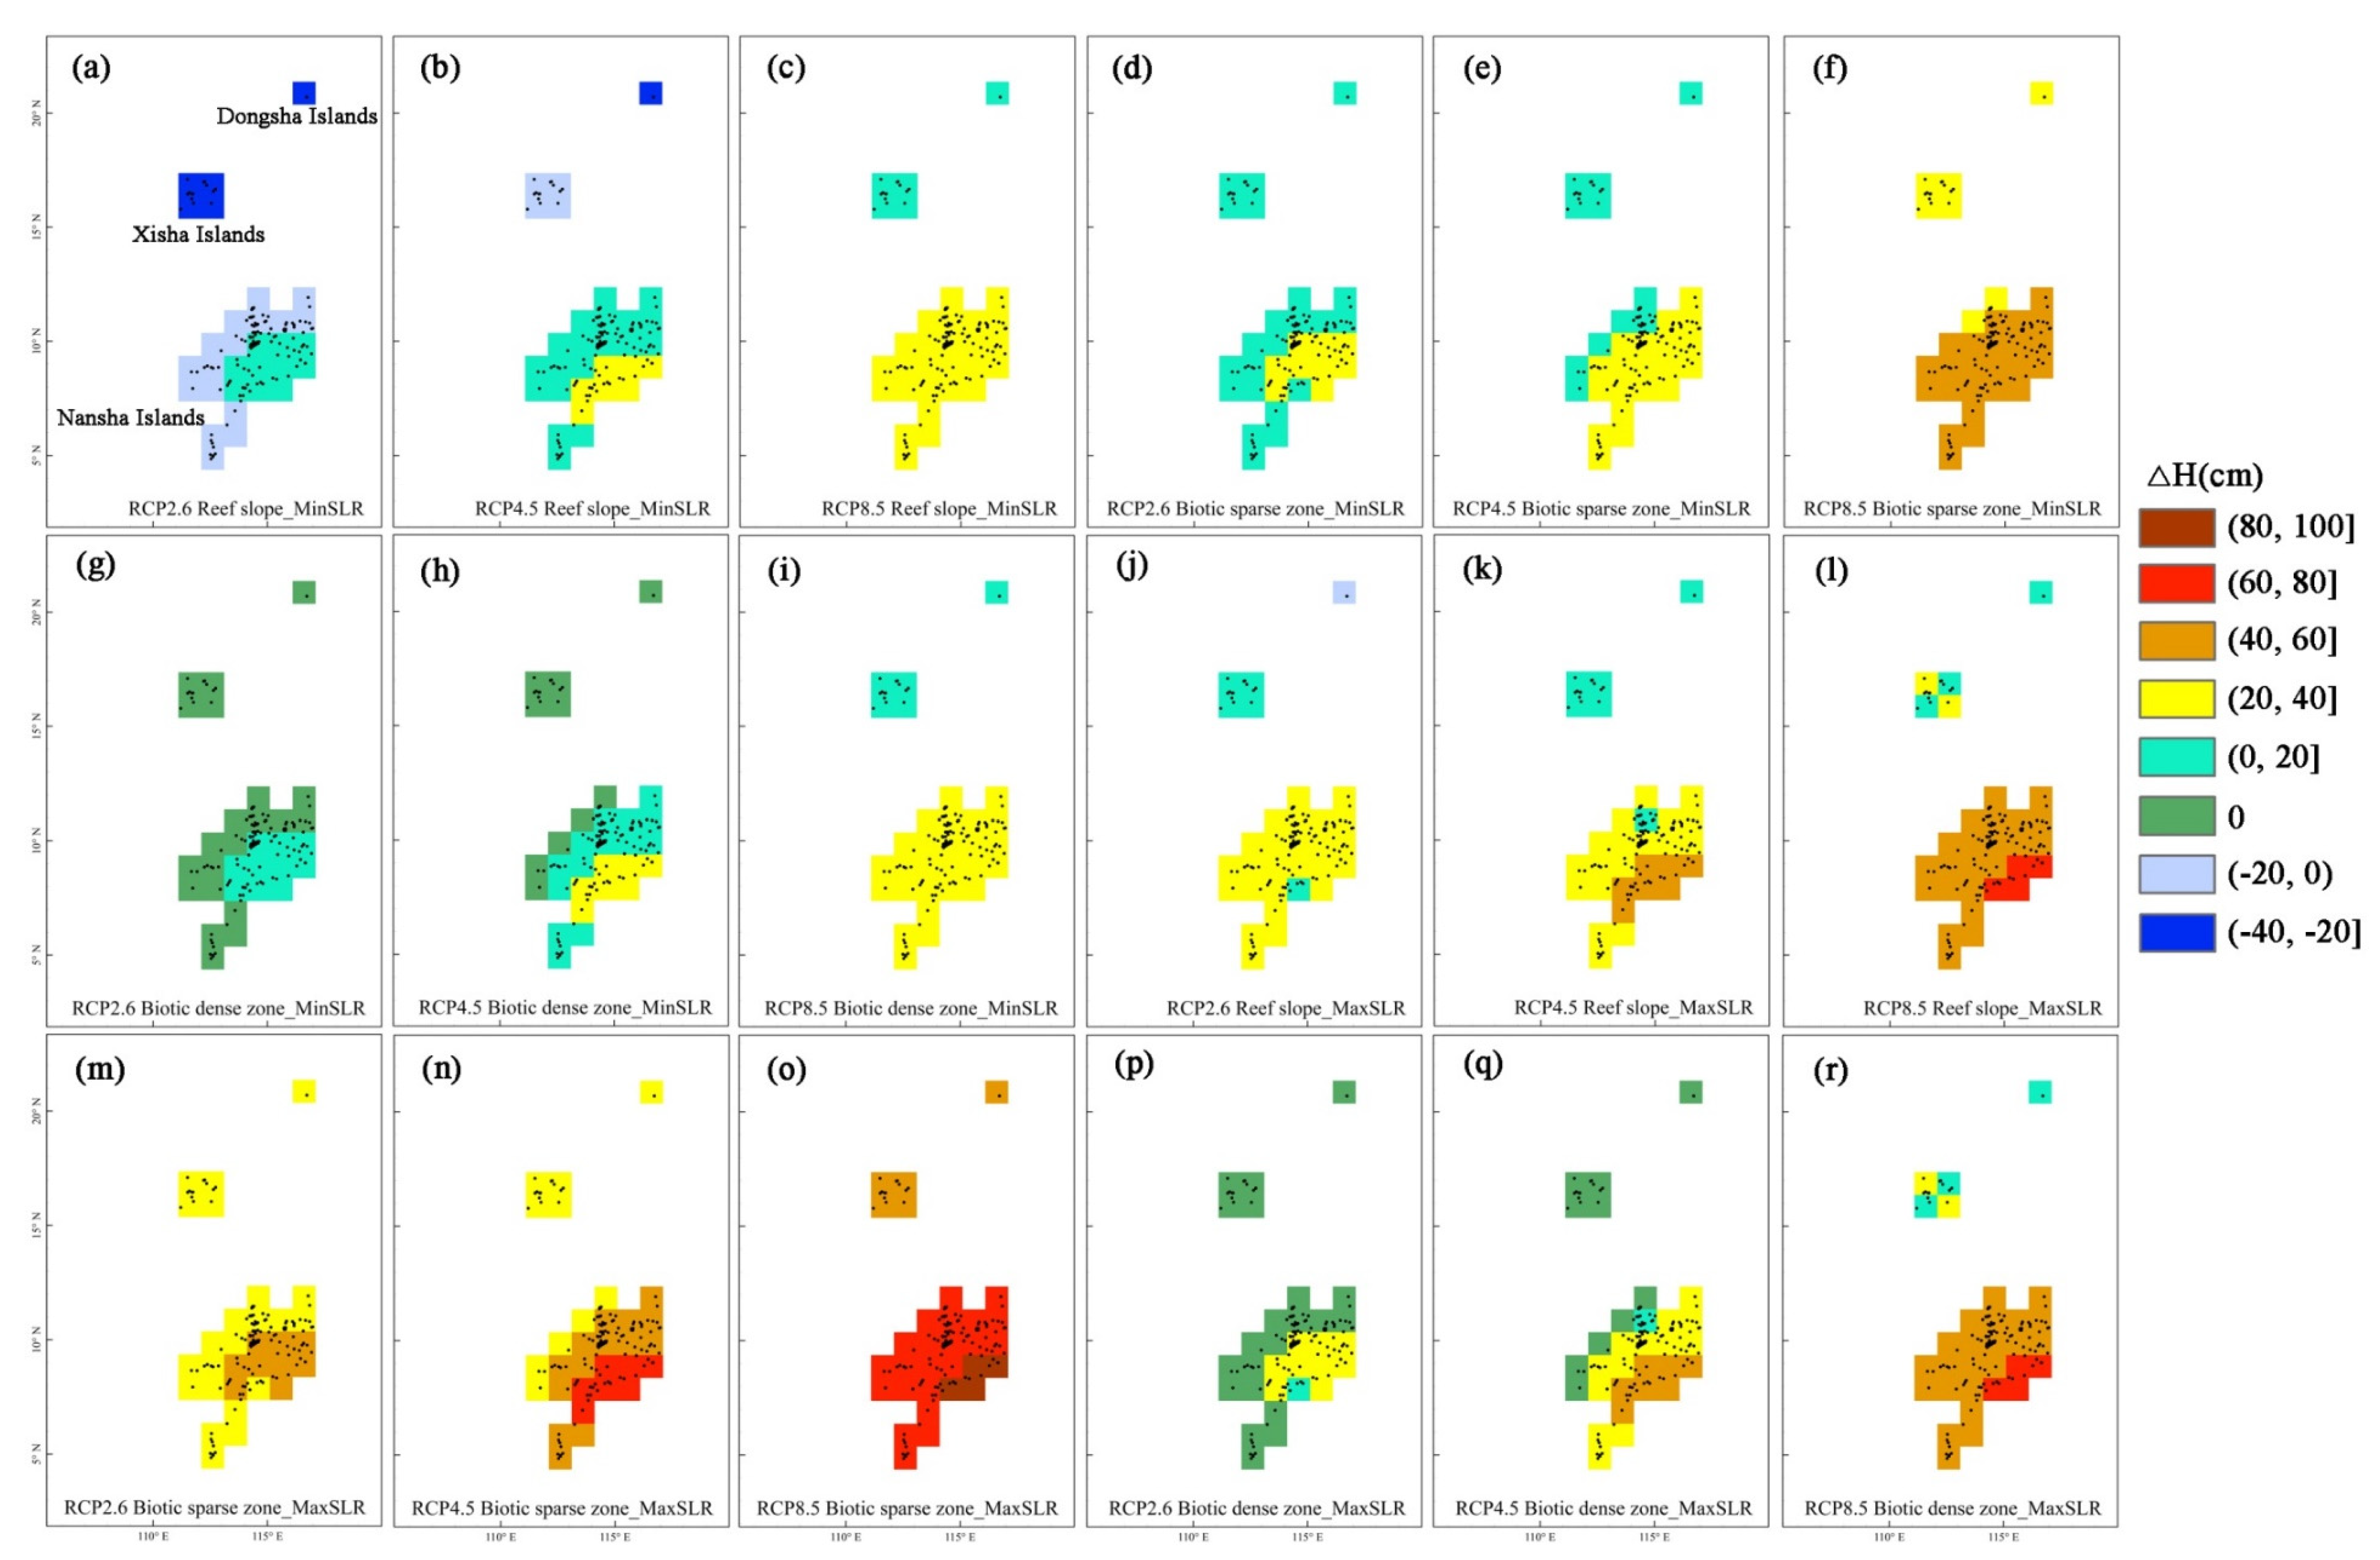
3.4. Reef Responses to Global Warming and Sea-Level Rise
4. Discussions
4.1. Computed Parameters Versus Published Data
4.2. Isolating the Impacts of Global Warming and Sea-Level Rise
4.3. Synergistic Impacts of Global Warming and Sea-Level Rise
4.4. Data Limitations
5. Conclusions
Author Contributions
Funding
Data Availability Statement
Acknowledgments
Conflicts of Interest
References
- Stocker, T.F.; Qin, D.; Plattner, G.K.; Alexander, L.V.; Allen, S.K.; Bindoff, N.L.; Bréon, F.M.; Church, J.A.; Cubasch, U.; Emori, S. IPCC, 2013: Technical Summary. In Climate Change 2013: The Physical Science Basis; Intergovernmental Panel on Climate Change, Ed.; Cambridge University: New York, NY, USA, 2013; pp. 533–535. [Google Scholar]
- Van Hooidonk, R.; Maynard, J.A.; Planes, S. Temporary refugia for coral reefs in a warming world. Nat. Clim. Chang. 2013, 3, 508–511. [Google Scholar] [CrossRef]
- Hughes, T.P.; Kerry, J.T.; Alvarez-Noriega, M.; Alvarez-Romero, J.G.; Anderson, K.D.; Baird, A.H.; Babcock, R.C.; Beger, M.; Bellwood, D.R.; Berkelmans, R. Global warming and recurrent mass bleaching of corals. Nature 2017, 543, 373. [Google Scholar] [CrossRef] [PubMed]
- Sheppard, C.; Sheppard, A.; Mogg, A.; Bayley, D.; Dempsey, A.; Roche, R.; Turner, J.; Purkis, S. Coral bleaching and mortality in the Chagos Archipelago. Atoll Res. Bull. 2017, 613, 1–26. [Google Scholar] [CrossRef]
- Yan, H.; Shi, Q.; Yu, K.; Tao, S.; Yang, H.; Liu, Y.; Zhang, H.; Zhao, M. Regional coral growth responses to seawater warming in the South China Sea. Sci. Total Environ. 2019, 670, 595–605. [Google Scholar] [CrossRef]
- Perry, C.T.; Morgan, K.M. Post-bleaching coral community change on southern Maldivian reefs: Is there potential for rapid recovery? Coral Reefs 2017, 36, 1189–1194. [Google Scholar] [CrossRef]
- Hooidonk, R.V.; Huber, M. Quantifying the quality of coral bleaching predictions. Coral Reefs 2009, 28, 579–587. [Google Scholar] [CrossRef]
- Logan, C.A.; Dunne, J.P.; Eakin, C.M.; Donner, S.D. Incorporating adaptive responses into future projections of coral bleaching. Glob. Chang. Biol. 2014, 20, 125–139. [Google Scholar] [CrossRef] [PubMed]
- Meissner, K.J.; Lippmann, T.; Gupta, A.S. Large-scale stress factors affecting coral reefs: Open ocean sea surface temperature and surface seawater aragonite saturation over the next 400 years. Coral Reefs 2012, 31, 309–319. [Google Scholar] [CrossRef]
- Van Hooidonk, R.; Maynard, J.; Tamelander, J.; Gove, J.; Ahmadia, G.; Raymundo, L.; Williams, G.; Heron, S.F.; Planes, S. Local-scale projections of coral reef futures and implications of the Paris Agreement. Sci. Rep. 2016, 6, 39666. [Google Scholar] [CrossRef]
- Storlazzi, C.D.; Elias, E.P.L.; Berkowitz, P. Many atolls may be uninhabitable within decades due to climate change. Sci. Rep. 2015, 5, 14546. [Google Scholar] [CrossRef] [PubMed] [Green Version]
- Hamylton, S.M.; Leon, J.X.; Saunders, M.I.; Woodroffe, C.D. Simulating reef response to sea-level rise at Lizard Island: A geospatial approach. Geomorphology 2014, 222, 151–161. [Google Scholar] [CrossRef] [Green Version]
- Scopélitis, J.; Andréfouët, S.; Phinn, S.; Done, T.; Chabanet, P. Coral colonisation of a shallow reef flat in response to rising sea level: Quantification from 35 years of remote sensing data at Heron Island, Australia. Coral Reefs 2011, 30, 951–965. [Google Scholar] [CrossRef]
- Sheppard, C.; Dixon, D.J.; Gourlay, M.; Sheppard, A.; Payet, R. Coral mortality increases wave energy reaching shores protected by reef flats: Examples from the Seychelles. Estuar. Coast. Shelf Sci. 2005, 64, 223–234. [Google Scholar] [CrossRef]
- Storlazzi, C.D.; Elias, E.; Field, M.E.; Presto, M.K. Numerical modeling of the impact of sea-level rise on fringing coral reef hydrodynamics and sediment transport. Coral Reefs 2011, 30, 83–96. [Google Scholar] [CrossRef] [Green Version]
- Kench, P.S.; Ford, M.R.; Owen, S.D. Patterns of island change and persistence offer alternate adaptation pathways for atoll nations. Nat. Commun. 2018, 9, 605. [Google Scholar] [CrossRef] [PubMed] [Green Version]
- Webster, J.M.; Clague, D.A.; Riker-Coleman, K.; Gallup, C.; Braga, J.C.; Potts, D.; Moore, J.G.; Winterer, E.L.; Paull, C.K. Drowning of the −150 m reef off Hawaii: A casualty of global meltwater pulse 1A? Geology 2004, 32, 249–252. [Google Scholar] [CrossRef]
- Woodroffe, C.D.; Webster, J.M. Coral reefs and sea-level change. Mar. Geol. 2014, 352, 248–267. [Google Scholar] [CrossRef]
- Perry, C.T.; Murphy, G.N.; Graham, N.A.J.; Wilson, S.K.; Januchowskihartley, F.A.; East, H.K. Remote coral reefs can sustain high growth potential and may match future sea-level trends. Sci. Rep. 2015, 5, 18289. [Google Scholar] [CrossRef] [PubMed]
- Perry, C.T.; Alvarezfilip, L.; Graham, N.A.J.; Mumby, P.J.; Wilson, S.K.; Kench, P.S.; Manzello, D.P.; Morgan, K.M.; Slangen, A.B.A.; Thomson, D.P. Loss of coral reef growth capacity to track future increases in sea level. Nature 2018, 558, 396–400. [Google Scholar] [CrossRef] [PubMed]
- Done, T. Corals: Environmental controls on growth. In Encyclopedia of Earth Sciences; Hopley, D., Ed.; Springer: Dordrecht, The Netherlands, 2011; pp. 281–293. [Google Scholar]
- Shi, Q.; Zhao, M.; Zhang, Q.; Yu, K.; Chen, T.; Li, S.; Wang, H. Estimate of carbonate production by scleractinian corals at Luhuitou fringing reef, Sanya, China. Chin. Sci. Bull. 2009, 54, 696–705. [Google Scholar] [CrossRef]
- Smith, S.V.; Kinsey, D.W. Calcium carbonate production, coral reef growth, and sea level change. Science 1976, 194, 937–939. [Google Scholar] [CrossRef] [PubMed]
- Vecsei, A. A new estimate of global reefal carbonate production including the fore-reefs. Glob. Planet. Chang. 2004, 43, 1–18. [Google Scholar] [CrossRef]
- Huang, C.; Qiao, F. Sea level rise projection in the South China Sea from CMIP5 models. Acta Oceanol. Sin. 2015, 34, 31–41. [Google Scholar] [CrossRef]
- Zuo, X.; Su, F.; Wu, W.; Chen, Z.; Shi, W. Spatial and temporal variability of thermal stress to China’s coral reefs in South China Sea. Chin. Geogr Sci. 2015, 25, 159–173. [Google Scholar] [CrossRef]
- Wu, Z.; Wang, D.; Tu, Z. The analysis on the reason of hermatypic coral degradation in Xisha. Acta Oceanol. Sin. 2011, 33, 140–146. [Google Scholar]
- Zhang, Z.; Shao, K.; Yang, Z. Evaluation of the Xisha coral reef ecosystem carrying capacity. Mar. Environ. Sci. 2018, 37, 487–492. (In Chinese) [Google Scholar]
- Chen, T.; Roff, G.; McCook, L.; Zhao, J.; Li, S. Recolonization of marginal coral reef flats in response to recent sea-level rise. J. Geophys. Res. Oceans 2018, 123, 7618–7628. [Google Scholar] [CrossRef]
- Dai, C.F.; Fan, T.Y.; Wu, C.S. Coral fauna of Tungsha Tao (Pratas Islands). Acta Oceanogr. Taiwanica 1995, 34, 1–16. [Google Scholar]
- Morton, B.; Blackmore, G. South China Sea. Mar. Pollut. Bull. 2001, 42, 1236–1263. [Google Scholar] [CrossRef]
- McManus, J.W. The Sprately Islands: A marine park? Ambio 1994, 23, 181–186. [Google Scholar]
- Tkachenko, K.S.; Soong, K. Dongsha atoll: A potential thermal refuge for reef-building corals in the South China Sea. Mar. Environ. Res. 2017, 127, 112–125. [Google Scholar] [CrossRef] [PubMed]
- Decarlo, T.M.; Cohen, A.L.; Wong, G.T.F. Community production modulates coral reef pH and the sensitivity of ecosystem calcification to ocean acidification. J. Geophys. Res. Oceans 2017, 122, 745–761. [Google Scholar] [CrossRef]
- Zhao, M.X.; Yu, K.F.; Shi, Q. Coral communities of the remote atoll reefs in the Nansha Islands, southern South China Sea. Environ. Monit. Assess. 2013, 185, 7381–7382. [Google Scholar] [CrossRef] [PubMed] [Green Version]
- Zuo, X.; Su, F.; Zhao, H.; Zhang, J.; Wang, Q.; Wu, D. Regional hard coral distribution within geomorphic and reef flat ecological zones determined by satellite imagery of the Xisha Islands, South China Sea. Chin. J. Oceanol. Limnol. 2017, 35, 501–514. [Google Scholar] [CrossRef]
- Zuo, X.; Su, F.; Zhao, H.; Fang, Y.; Yang, J. Development of a geomorphic classification scheme for coral reefs in the South China Sea based on high-resolution satellite images. Prog. Geogr. 2018, 37, 1463–1472. (In Chinese) [Google Scholar]
- Gong, J.; Zhu, G.; Yang, J.; Zuo, X.; Shi, W. A Study on the object-oriented model for geomorphic unit extraction of coral reefs in the South China Sea. J. Geo-Inf. Sci. 2014, 16, 997–1004. (In Chinese) [Google Scholar]
- Pante, E. Temporal Variation in a Bahamian Patch Reef Community: The Decline of Rainbow Gardens Reef; College of Charleston: Charleston, SC, USA, 2005. [Google Scholar]
- Veron, J. Corals of the World; Australian Institute of Marine Science (AIMS): Townsville, Australia, 2000. [Google Scholar]
- Congalton, R.G. Accuracy assessment and validation of remotely sensed and other spatial information. Int. J. Wildland Fire 2001, 10, 321–328. [Google Scholar] [CrossRef] [Green Version]
- Chun, L.; Jones, B.; Blanchon, P. Lagoon-shelf sediment exchange by storms; Evidence from foraminiferal assemblages, east coast of Grand Cayman, British West Indies. J. Sediment. Res. A 1997, 67, 17–25. [Google Scholar]
- Fujita, K.; Osawa, Y.; Kayanne, H.; Ide, Y.; Yamano, H. Distribution and sediment production of large benthic foraminifers on reef flats of the Majuro Atoll, Marshall Islands. Coral Reefs 2009, 28, 29–45. [Google Scholar] [CrossRef]
- Taylor, K.E.; Stouffer, R.J.; Meehl, G.A. An overview of CMIP5 and the experiment design. Bull. Am. Meteorol. Soc. 2011, 93, 485–498. [Google Scholar] [CrossRef] [Green Version]
- Kumar, S.; Merwade, V.; Kinter, J.L.; Niyogi, D. Evaluation of temperature and precipitation trends and long-term persistence in CMIP5 twentieth-century climate simulations. J. Clim. 2013, 26, 4168–4185. [Google Scholar]
- Huang, C.; Qiao, F.; Song, Y.; Li, X. The simulation and forecast of SST in the South China Sea by CMIP5 models. Acta Oceanol. Sin. 2014, 36, 38–47. (In Chinese) [Google Scholar]
- Reynolds, R.W.; Rayner, N.A.; Smith, T.M.; Stokes, D.C.; Wang, W. An improved in situ and satellite SST analysis for climate. J. Clim. 1987, 15, 1609–1625. [Google Scholar] [CrossRef]
- Hooidonk, R.V.; Huber, M. Effects of modeled tropical sea surface temperature variability on coral reef bleaching predictions. Coral Reefs 2012, 31, 121–131. [Google Scholar] [CrossRef]
- Church, J.; Clark, P.; Cazenave, A.; Gregory, J.; Jevrejeva, S.; Levermann, A. Sea Level Change. In Climate Change 2013: The Physical Science Basis; Intergovernmental Panel on Climate Change, Ed.; Cambridge University: New York, NY, USA, 2013; pp. 1137–1216. [Google Scholar]
- Church, J.A.; White, N.J.; Coleman, R.; Lambeck, K.; Mitrovica, J.X. Estimates of the regional distribution of sea level rise over the 1950–2000 period. J. Clim. 2004, 17, 2609–2625. [Google Scholar] [CrossRef]
- Beckley, B.D.; Zelensky, N.P.; Holmes, S.A.; Lemoine, F.G.; Brown, S.T. Assessment of the Jason-2 extension to the TOPEX/Poseidon, Jason-1 sea-surface height time series for global mean sea level monitoring. Mar. Geod. 2010, 33, 447–471. [Google Scholar] [CrossRef]
- Yin, J.; Griffies, S.M.; Stouffer, R.J. Spatial variability of sea level rise in twenty-first century projections. J. Clim. 2010, 23, 4585–4607. [Google Scholar] [CrossRef]
- Yin, J. Century to multi-century sea level rise projections from CMIP5 models. Geophys. Res. Lett. 2012, 39, L17709. [Google Scholar] [CrossRef]
- Peng, D.; Palanisamy, H.; Cazenave, A.; Meyssignac, B. Interannual sea level variations in the South China Sea Over 1950–2009. Mar. Geod. 2013, 36, 164–182. [Google Scholar] [CrossRef]
- Leon, J.X.; Woodroffe, C.D. Morphological characterisation of reef types in Torres Strait and an assessment of their carbonate production. Mar. Geol. 2013, 338, 64–75. [Google Scholar] [CrossRef] [Green Version]
- Perry, C.T.; Kench, P.S.; Murphy, G.N.; Smithers, S.G.; Steneck, R.S.; Mumby, P.J. Estimating rates of biologically driven coral reef framework production and erosion: A new census-based carbonate budget methodology and applications to the reefs of Bonaire. Coral Reefs 2012, 31, 853–868. [Google Scholar] [CrossRef]
- Hart, D.E.; Kench, P.S. Carbonate production of an emergent reef platform, Warraber Island, Torres Strait, Australia. Coral Reefs 2007, 26, 53–68. [Google Scholar] [CrossRef]
- Kinsey, D.W.; Hopley, D. The significance of coral reefs as global carbon sinks—Response to greenhouse. Palaeogeogr. Palaeoclimatol. Palaeoecol. 1991, 89, 363–377. [Google Scholar] [CrossRef]
- Kinsey, D.W.; Davies, P.J. Coral reef growth—A model based on morphological and metabolic studies. Aust. J. Mar. Sci. 1975, 7, 397–403. [Google Scholar]
- Grossman, E.E.; Fletcher, C.H. Holocene reef development where wave energy reduces accommodation space, Kailua Bay, Windward Oahu, Hawaii, U.S.A. J. Sediment. Res. 2004, 74, 49–63. [Google Scholar] [CrossRef] [Green Version]
- Edinger, E.N.; Limmon, G.V.; Jompa, J.; Widjatmoko, W.; Heikoop, J.M.; Risk, M.J. Normal coral growth rates on dying reefs: Are coral growth rates good indicators of reef health? Mar. Pollut. Bull. 2000, 40, 404–425. [Google Scholar] [CrossRef]
- Li, S.; Yu, K.F.; Chen, T.R.; Shi, Q.; Zhang, H.L. Assessment of coral bleaching using symbiotic zooxanthellae density and satellite remote sensing data in the Nansha Islands, South China Sea. Chin. Sci. Bull. 2011, 56, 1031–1037. [Google Scholar] [CrossRef] [Green Version]
- Saunders, M.I.; Albert, S.; Roelfsema, C.M.; Leon, J.X.; Woodroffe, C.D.; Phinn, S.R.; Mumby, P.J. Tectonic subsidence provides insight into possible coral reef futures under rapid sea-level rise. Coral Reefs 2016, 35, 155–167. [Google Scholar] [CrossRef]
- Van Woesik, R.; Golbuu, Y.; Roff, G. Keep up or drown: Adjustment of western Pacific coral reefs to sea-level rise in the 21st century. R. Soc. Open Sci. 2015, 2, 150181. [Google Scholar] [CrossRef] [Green Version]
- Davies, P.J.; Montaggioni, L.F. Reef Growth and Sea-level Change: The Environmental Signature. In Proceedings of the 5th International Coral Reef Congress, Tahiti, French Polynesia, 27 May–1 June 1985; pp. 477–515. [Google Scholar]
- Bridge, T.C.; Hoey, A.S.; Campbell, S.J.; Muttaqin, E.; Rudi, E.; Fadli, N.; Baird, A.H. Depth-dependent mortality of reef corals following a severe bleaching event: Implications for thermal refuges and population recovery. F1000Research 2013, 2, 187. [Google Scholar] [CrossRef]
- Sheppard, C.R.C. Coral decline and weather patterns over 20 year in the Chagos archipelago, central Indian Ocean. Ambio 1999, 28, 472–478. [Google Scholar]
- Shen, J.; Yang, H.; Wang, Y.; Fu, F.; Zhao, N. Coral community dynamics and shallow-water carbonate deposition of the reef-flat around Yongxing Island, the Xisha Islands. Sci. China Earth Sci. 2013, 56, 1471–1486. [Google Scholar] [CrossRef]
- Mclean, R.; Kench, P. Destruction or persistence of coral atoll islands in the face of 20th and 21st century sea-level rise. Wiley Interdiscip. Rev. Clim. Chang. 2015, 6, 445–463. [Google Scholar] [CrossRef]
- Siegle, E.; Costa, M.B. Nearshore wave power increase on reef-shaped coasts due to sea-level rise. Earths. Future 2017, 5, 1054–1065. [Google Scholar] [CrossRef]
- Shi, X.; Yu, K.F.; Chen, T. Progress in researches on sea-level changes in South China Sea Since mid-Holocene. Mar. Geol. Quat. Geol. 2007, 27, 121–132. [Google Scholar]
- Zhao, J.X.; Yu, K.F. Millennial-, century- and decadal-scale oscillations of Holocene sea-level recorded in a coral reef in the northern South China Sea. In XVII Inqua Congress; Pergamon Press: New York, NY, USA, 2007; pp. 167–168. [Google Scholar]
- Yu, K. Coral reefs in the South China Sea: Their response to and records on past environmental changes. Sci. China Earth Sci. 2012, 55, 1217–1229. [Google Scholar] [CrossRef]
- Brown, B.E. Coral Reefs of the Andaman Sea—An Integrated Perspective. In Oceanography and Marine Biology; Gibson, R.N., Atkinson, R.J.A., Gordon, J.D.M., Eds.; CRC Press: Boca Raton, FL, USA, 2007; Volume 45, pp. 173–194. [Google Scholar]
- Guest, J.R.; Baird, A.H.; Maynard, J.A.; Muttaqin, E.; Edwards, A.J.; Campbell, S.J.; Yewdall, K.; Affendi, Y.A.; Chou, L.M.; Matz, M.V. Contrasting patterns of coral bleaching susceptibility in 2010 suggest an adaptive response to thermal stress. PLoS ONE 2012, 7, e33353. [Google Scholar] [CrossRef]
- Bento, R.; Hoey, A.S.; Bauman, A.G.; Feary, D.A.; Burt, J.A. The implications of recurrent disturbances within the world’s hottest coral reef. Mar. Pollut. Bull. 2016, 105, 466–472. [Google Scholar] [CrossRef]
- Wall, M. Large-amplitude internal waves benefit corals during thermal stress. Proc. R. Soc. B 2014, 282, 20140650. [Google Scholar] [CrossRef] [PubMed] [Green Version]
- Schmidt, G.M.; Wall, M.; Taylor, M.; Jantzen, C.; Richter, C. Large-amplitude internal waves sustain coral health during thermal stress. Coral Reefs 2016, 35, 869–881. [Google Scholar] [CrossRef] [Green Version]
- Kayanne, H.; Harii, S.; Ide, Y.; Akimoto, F. Recovery of coral populations after the 1998 bleaching on Shiraho Reef, in the southern Ryukus, NW Pacific. Mar. Ecol. Prog. Ser. 2002, 239, 93–103. [Google Scholar] [CrossRef] [Green Version]
- van Woesik, R.; Sakai, K.; Ganase, A.; Loya, Y. Revisiting the winners and losers a decade after coral bleaching. Mar. Ecol. Prog. Ser. 2011, 434, 67–76. [Google Scholar] [CrossRef] [Green Version]
- Brown, B.E.; Dunne, R.P.; Somerfield, P.J.; Edwards, A.J.; Naeije, M.C. Long-term impacts of rising sea temperature and sea level on shallow water coral communities over a ~40 year period. Sci. Rep. 2019, 9, 8826. [Google Scholar] [CrossRef]
- Perry, C.T.; Morgan, K.M. Bleaching drives collapse in reef carbonate budgets and reef growth potential on southern Maldives reefs. Sci. Rep. 2017, 7, 40581. [Google Scholar] [CrossRef] [Green Version]


| Remote Sensing Interpretation | ||||||
|---|---|---|---|---|---|---|
| Reef Slope | Biotic Sparse Zone of Reef Flat | Biotic Dense Zone of Reef Flat | Lagoon | Total Sites | User’s Accuracy | |
| Reef slope | 16 | 0 | 0 | 0 | 16 | 100% |
| Biotic sparse zone of reef flat | 0 | 7 | 1 | 0 | 8 | 87.5% |
| Biotic dense zone of reef flat | 0 | 2 | 9 | 0 | 11 | 81.8% |
| Lagoon | 0 | 0 | 0 | 19 | 19 | 100% |
| Total sites | 16 | 9 | 10 | 19 | 54 | - |
| Producer’s accuracy | 100% | 77.8% | 90% | 100% | - | - |
| Reef/Geomorphic | Xisha Islands | Dongsha Islands | Nansha Islands |
|---|---|---|---|
| Reef slope | 16 | 10 | 3 |
| Biotic sparse zone of reef flat | 8 | 1 | 2 |
| Biotic dense zone of reef flat | 11 | 6 | 5 |
| Total | 35 | 17 | 10 |
| Reef Slope | Biotic Sparse Zone of Reef Flat | Biotic Dense Zone of Reef Flat | |||||||
|---|---|---|---|---|---|---|---|---|---|
| Xisha | Dongsha | Nansha | Xisha | Dongsha | Nansha | Xisha | Dongsha | Nansha | |
| Live coral cover | 30.34 ± 14.86 | 51.36 ± 12.16 | 21.11 ± 25.76 | 7.62 ± 7.75 | 6.0 ± 0.0 | 4.24 ± 0.2 | 44.36±24.06 | 24.83±5.56 | 31.84±19.16 |
| Coral production (kg/m2/year) | 10.11±5.44 | 12.09±3.39 | 5.99±7.36 | 1.35±1.71 | 1.92±0.00 | 0.9±0.05 | 9.26±1.58 | 7.43±2.17 | 6.9 ± 4.43 |
| Dominant coral genus and % contribution to total coralcarbonate production | Montipora (74.2%) Pocillopora (6.8%) Acropora (5.8%) | Acropora (41.7%) Montipora (25.5%) Pocillopora (9.3%) | Montipora (50.4%) Acropora (21.7%) Porites (13.2%) Pocillopora (9.0%) | Acropora (50.5%) Montipora (29.9%) | Stylophora (87.9%) Acropora (10.6%) | Psammocora (42.4%) Porites (15.2%) Pocillopora (12.7%) | Montipora (90.5%) | Stylophora (63.4%) Acropora (22.9%) Porites (13.0%) | Montipora (62.4%) Heliopora (20.3%) |
| Coralline algal production (kg/m2/year) | 1.57 ± 2.14 | 1.41 ± 0.52 | 0.98 ± 0.66 | 0.36 ± 0.78 | 1.59 ± 0.00 | 0.06 ± 0.03 | 3.32 ± 2.63 | 0.09 ± 0.17 | 0.96 ± 0.62 |
| Gross biological carbonate production (kg/m2/year) | 11.68 ± 6.10 | 13.50 ± 3.91 | 6.97 ± 6.87 | 1.71 ± 1.63 | 3.51 ± 0.00 | 0.96 ± 0.02 | 12.58 ± 4.57 | 7.52 ± 2.15 | 7.87 ± 4.34 |
| Net biological carbonate production (kg/m2/year) | 8.76 ± 4.57 | 10.13± 2.93 | 5.22± 5.15 | 1.28 ± 1.22 | 2.63 ± 0.00 | 0.72± 0.01 | 9.44 ± 3.43 | 5.64± 1.61 | 5.91 ± 3.25 |
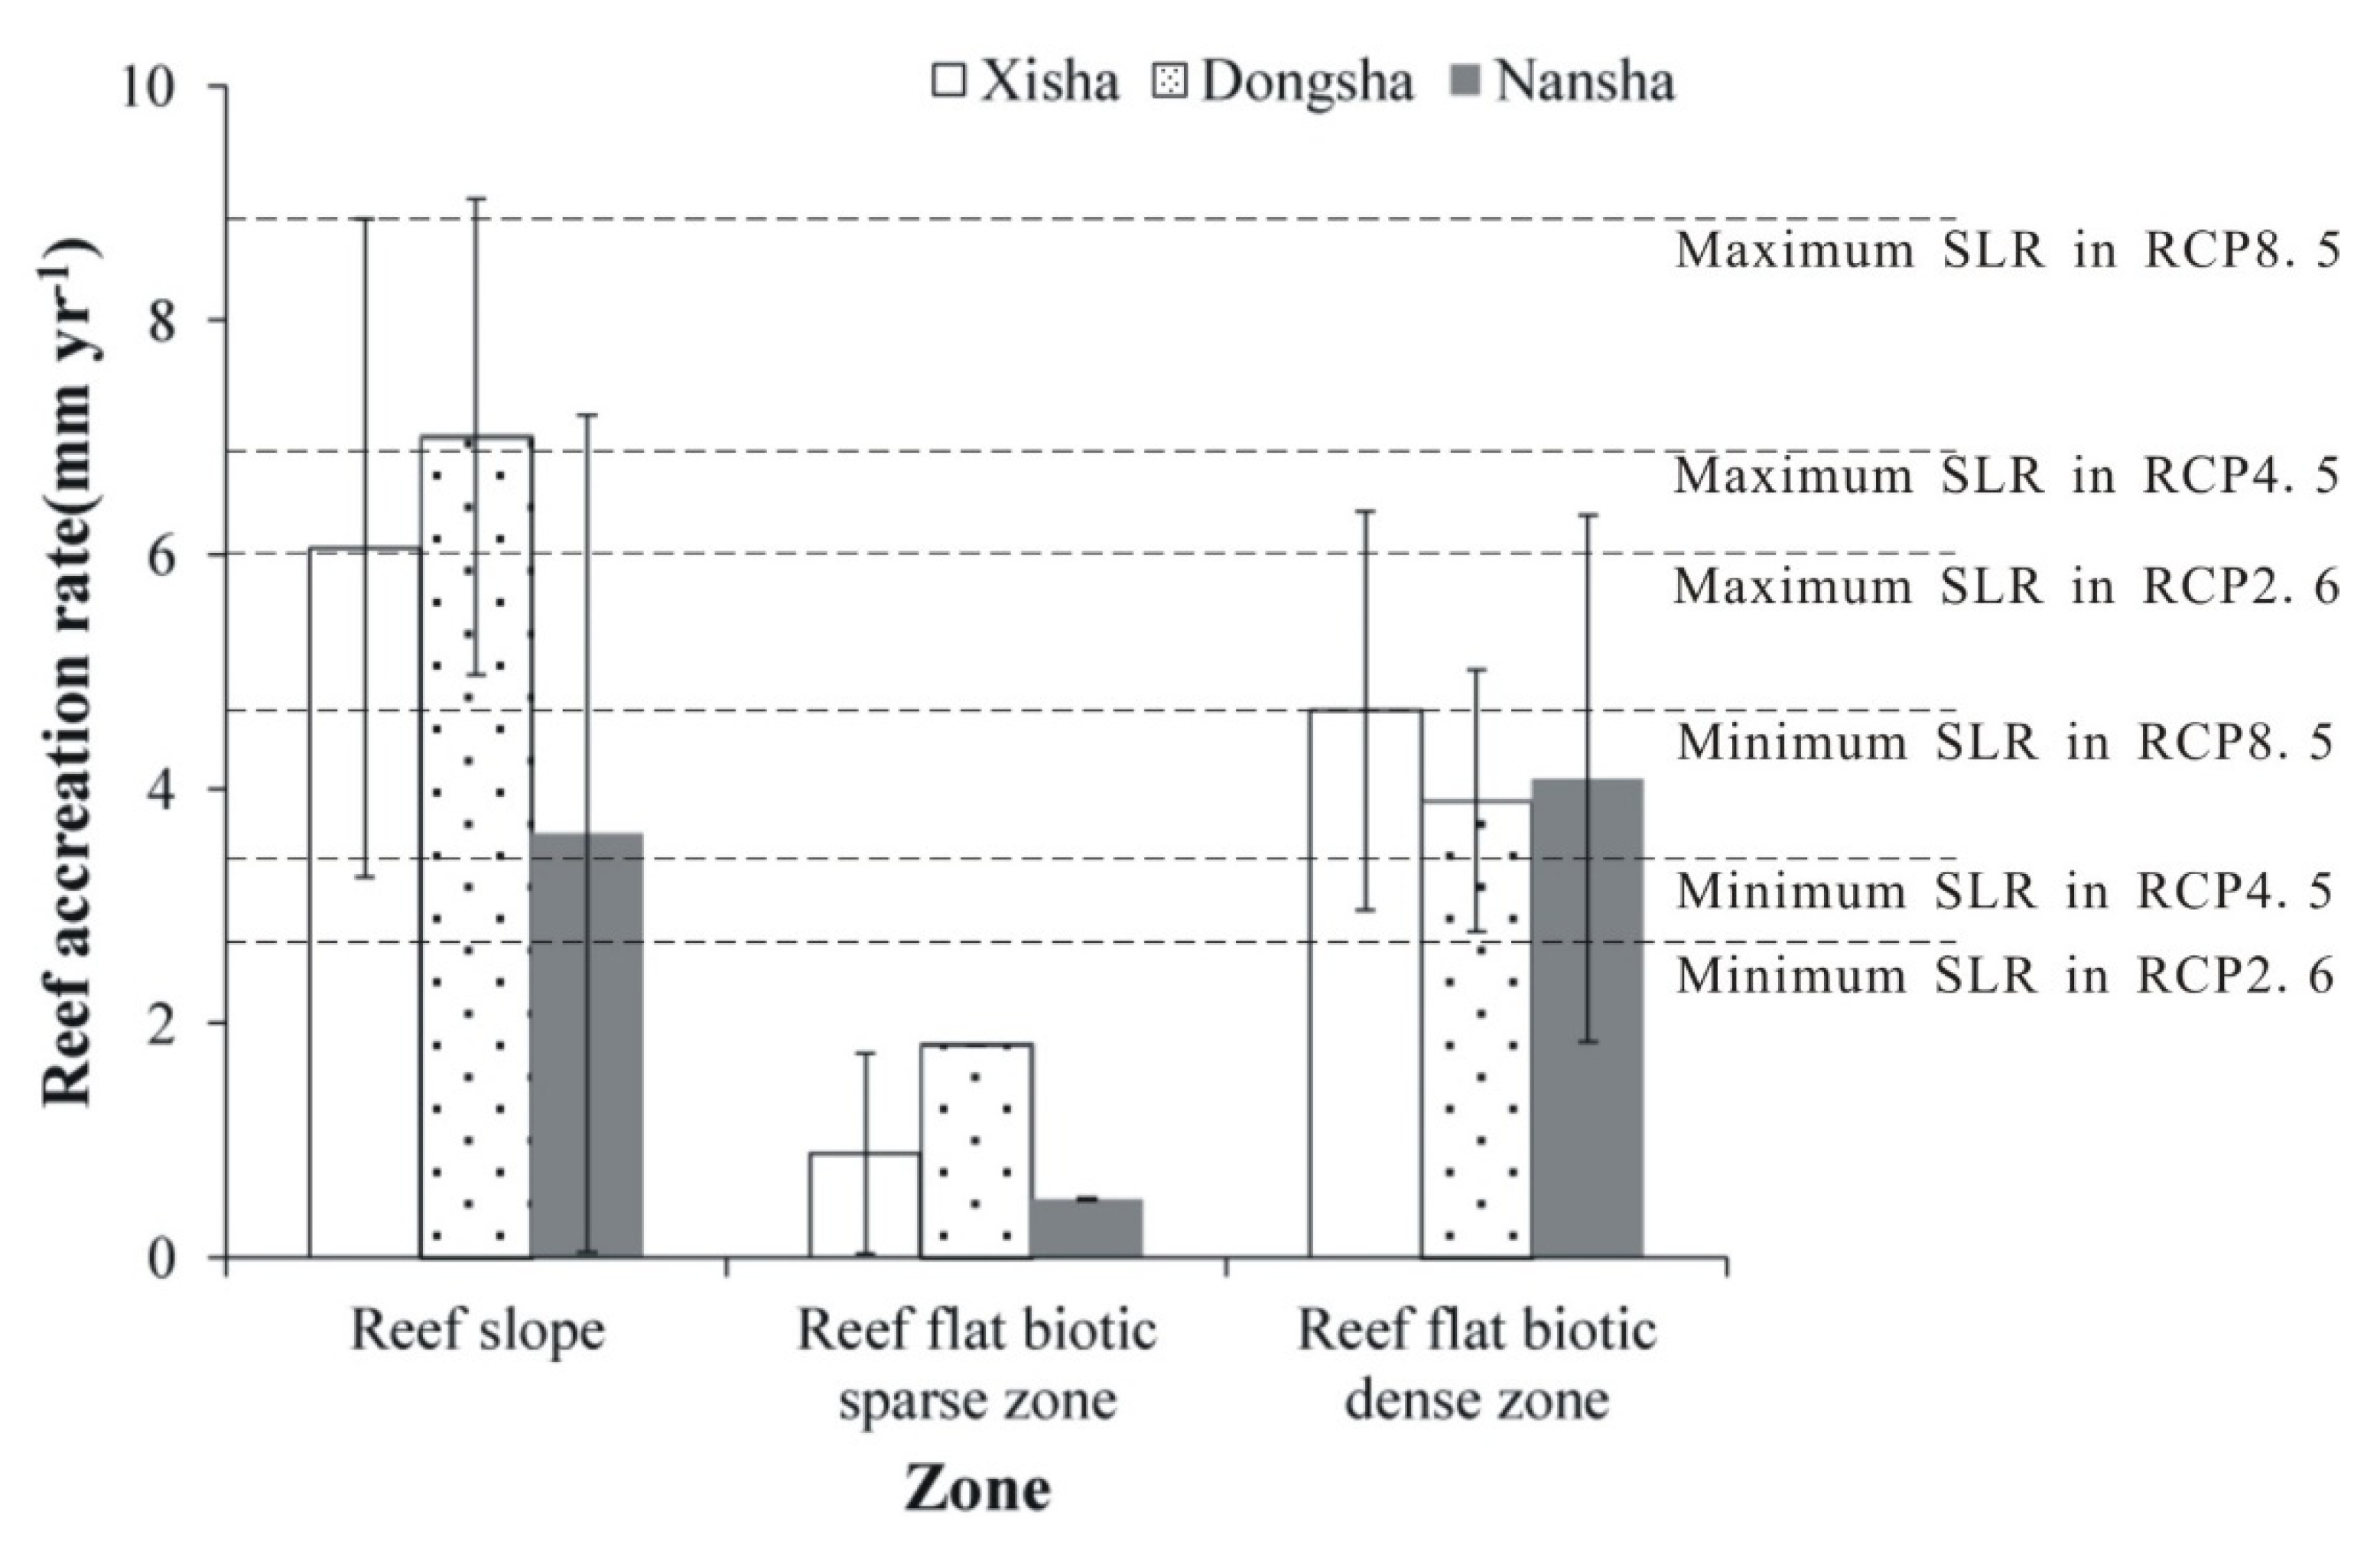
| Reef accretion rates(mm year−1) | 6.06 ± 2.81 | 7.01± 2.03 | 3.62 ±3.57 | 0.89 ± 0.85 | 1.82 ± 0.00 | 0.50 ± 0.01 | 4.67 ± 1.70 | 3.90 ± 1.12 | 4.09 ± 2.25 |
Publisher’s Note: MDPI stays neutral with regard to jurisdictional claims in published maps and institutional affiliations. |
© 2021 by the authors. Licensee MDPI, Basel, Switzerland. This article is an open access article distributed under the terms and conditions of the Creative Commons Attribution (CC BY) license (https://creativecommons.org/licenses/by/4.0/).
Share and Cite
Zuo, X.; Su, F.; Yu, K.; Wang, Y.; Wang, Q.; Wu, H. Spatially Modeling the Synergistic Impacts of Global Warming and Sea-Level Rise on Coral Reefs in the South China Sea. Remote Sens. 2021, 13, 2626. https://0-doi-org.brum.beds.ac.uk/10.3390/rs13132626
Zuo X, Su F, Yu K, Wang Y, Wang Q, Wu H. Spatially Modeling the Synergistic Impacts of Global Warming and Sea-Level Rise on Coral Reefs in the South China Sea. Remote Sensing. 2021; 13(13):2626. https://0-doi-org.brum.beds.ac.uk/10.3390/rs13132626
Chicago/Turabian StyleZuo, Xiuling, Fenzhen Su, Kefu Yu, Yinghui Wang, Qi Wang, and Huisheng Wu. 2021. "Spatially Modeling the Synergistic Impacts of Global Warming and Sea-Level Rise on Coral Reefs in the South China Sea" Remote Sensing 13, no. 13: 2626. https://0-doi-org.brum.beds.ac.uk/10.3390/rs13132626