
Underwater Survey for Oil and Gas Industry: A Review of Close Range Optical Methods


1
LIS UMR 7020, Aix-Marseille Université, CNRS, Université De Toulon, 13397 Marseille, France
2
3D Optical Metrology (3DOM) Unit, Bruno Kessler Foundation (FBK), Via Sommarive 18, 38123 Trento, Italy
*
Author to whom correspondence should be addressed.
Remote Sens. 2021, 13(14), 2789; https://0-doi-org.brum.beds.ac.uk/10.3390/rs13142789
Submission received: 20 May 2021
/
Revised: 2 July 2021
/
Accepted: 8 July 2021
/
Published: 15 July 2021
(This article belongs to the Special Issue Remote Sensing for Underwater Photogrammetry)
Abstract
:In both the industrial and scientific fields, the need for very high-resolution cartographic data is constantly increasing. With the aging of offshore subsea assets, it is very important to plan and maintain the longevity of structures, equipment, and systems. Inspection, maintenance, and repair (IMR) of subsea structures are key components of an overall integrity management system that aims to reduce the risk of failure and extend the life of installations. The acquisition of very detailed data during the inspection phase is a technological challenge, especially since offshore installations are sometimes deployed in extreme conditions (e.g., depth, hydrodynamics, visibility). After a review of high resolution mapping techniques for underwater environment, this article will focus on optical sensors that can satisfy the requirements of the offshore industry by assessing their relevance and degree of maturity. These requirements concern the resolution and accuracy but also cost, ease of implementation, and qualification. With the evolution of embedded computing resources, in-vehicle optical survey solutions are becoming increasingly important in the landscape of large-scale mapping solutions and more and more off-the-shelf systems are now available. The issues raised in this review are mainly related to the qualification of the results produced by optical systems and their limitations to cover all the needs expressed by the oil and gas industry field. Interesting qualification works of these solutions are presented in this paper as well as the use of online processing tools such as visual odometry or VSLAM to guide the data acquisition and pre-qualified survey. Finally, it seems interesting to combine acoustic and optical technologies in order to extend the field of application of these methods to low visibility conditions, which remains one of the main limiting factors in the generalization of the use of optical sensors in high resolution underwater cartography applications.
1. Introduction
Aerial and submarine cartography; the great gap. While the first map of the world is Babylonian and dated around 600 B.C. [1], it was only in 1853 that the first true bathymetric map, that of the North Atlantic, was presented by Matthew Fontaine Maury, director of the Naval Observatory in Washington, DC, USA [2]. Although the technological means have evolved, this difference between land and underwater cartography still persists today. While the surface area of our oceans represents 71 percent of the world’s surface, less than 18 percent of the world’s ocean floor has been mapped with echo-sounder [3] and, just three years ago, only 6 percent by modern methods and sensors [4]. At the same time, the use of remote sensing today makes it possible to access an almost complete topographical representation of the earth’s surface with a spatial resolution of only a few meters [5]. Why is there such a gap in the data collection of these two environments? This is due in particular to their different physical properties which, for air, allow good propagation of electromagnetic waves and therefore the use of remote sensing and optical observation techniques. On the other hand, these waves are very quickly absorbed by water and only acoustic waves allow long-distance propagation in an underwater environment, whereas they have only a short propagation range in air [6].
Bathymetry is indispensable to ensure the safety of navigation by providing accurate and up-to-date maps. It is an essential tool for the management of coastal zones and their structures, as well as for environmental monitoring and protection. Topographic data are basic information for many fields of oceanography, for tidal modelling, global ocean circulation, and regional or local current modelling. These data are also vital for geological and geophysical studies and have direct applications to mining and petroleum research. It is the same for hydrological studies, such as upwelling of cold bottom waters, with particular interest to fisheries area localisation. Mapping may also concern larger-scale areas, particularly for the installation of structures on the seabed such as cables, pipelines, platforms, or offshore wind turbines. While a very small portion of the ocean surface is currently mapped, this mapping must be repeated at time intervals consistent with the evolution of the environment, particularly with respect to the climate change we are observing. In this context, in June 2016 at the Forum for Future Ocean Floor Mapping in Monaco, Mr. Yohei Sasakawa, Chairman of The Nippon Foundation (Tokyo, Japan), Japan’s largest private foundation with a long history of supporting key maritime issues, used his conference address to announce a plan to map the entire ocean floor by 2030. This will be done in partnership with the General Bathymetric Chart of the Oceans (GEBCO), which The Nippon Foundation (Tokyo, Japan) has supported for many years. GEBCO is a joint project of the International Hydrographic Organization (IHO) and the Intergovernmental Oceanographic Commission (IOC) of [7]. Since this announcement, and two years after the start of an international effort to produce a complete map by 2030, the data available to produce the definitive map of the world’s ocean floor have more than doubled. Indeed, thanks to the efforts of the Nippon Foundation-GEBCO Seabed 2030 Project, coverage of the global ocean floor has increased from 6 percent to 18 percent in 2019 [4,8].
Underwater cartography represents the field of hydrography, defined by the IHO, as follows: “Hydrography is the branch of applied sciences which deals with the measurement and description of the physical features of oceans, seas, coastal areas, lakes and rivers, as well as with the prediction of their change over time, for the primary purpose of safety of navigation and in support of all other marine activities, including economic development, security and defense, scientific research, and environmental protection” [9]. In order to guarantee the quality of hydrographic surveys and a certain homogeneity between data providers, the IHO published the first edition of S-44 entitled “Accuracy Standards Recommended for Hydrographic Surveys” as early as 1968. Currently, the sixth edition of S-44 is designed to “provide a set of standards for hydrographic surveys primarily used to compile navigational charts essential for the safety of navigation, knowledge and the protection of the marine environment” [10]. This publication provides a set of minimum specifications for five survey orders (detailed in Figure 1), depending on the type of area and their level of hazard for navigation. This table give minimum requirements in term of depth horizontal and vertical uncertainty (THU and TVU) and the feature search and detection level requirement for each category of survey. The sixth edition of the S-44 published in March 2020 completes the previous edition which was the normative reference for hydrographic surveys for more than 10 years. This new edition presents two major evolutions. The first is the addition of a new survey category called Exclusive Order whose use is to be limited to areas with exceptional conditions and specific requirements. Their use is intended to be restricted to shallow water areas (harbors, berthing areas, and critical areas of fairways as channels) where there is an exceptional and optimal use of water column and where specific critical areas with minimum underkeel clearance and bottom characteristics are potentially hazardous to vessels. Based on this specification, in Table 1 the concept of bathymetric coverage rate replaces the previous notion of maximum line spacing. The second major evolution is the introduction of the concept of a “Specification Matrix” which can be considered as a reference for specifying dedicated surveys in fields of application other than those of the initial use of the S-44 (i.e., the safety of navigation). This matrix can therefore be used for the specification and classification of surveys in various fields including geophysics, oil and gas, dredging, and geotechnics. This concept marks a desire to extend the use of this standard and to provide a common framework for the tasking and evaluation of general hydrographic surveys.
In many different applications, data collection for underwater mapping, monitoring or inspection is achieved with methods primarily developed for hydrographic purposes. Given these considerations, this article proposes to set the high-resolution survey in the context of underwater infrastructure inspection and in relation to hydrographic standards. After a brief definition and classification of the different mapping scales according to the size of the area to be covered, the resolution and precision required, and the sensors used, a review of the particular constraints of underwater optical prospection is presented. In this paper, the focus is on high-resolution survey in oil and gas industrial applications which are rarely described in the literature compared to other applications, such as underwater biology or archaeology [11,12,13,14,15]. In the third section of this article, the survey requirements during the life cycle of offshore installations and a review of available optical survey solutions are detailed. One of the strong motivations for investigating the needs in this specific field is that tools and methods developed in the offshore oil and gas industry are generally declined in other sectors where subsea installations are used such as, for example, offshore wind and tidal turbines or other structures of interest for other scientific and research activities. Given the complexity and cost of the equipment used for the installation of subsea structures in the oil and gas sector, the inspection requirements are very high. In addition, the mapping and inspection tools and methods used in this sector of activity are at least partially adapted to subsea installations in the renewable energy sectors (offshore wind turbines, tidal turbines) or for the deployment of scientific observatories (https://www.km3net.org/ (accessed on 9 July 2021)), which reinforces the interest in focusing on these requirements. A review of the systems available on the market and their level of qualification is given, followed by a discussion of the maturity of these survey solutions with respect to the requirements of industrial applications and the precautions to be taken in their implementation.
2. Survey Categories, Specifications and Tools
2.1. Levels of Survey Scale
In this article, four levels of survey scale are described, albeit without using the term “scale” in its strict sense (i.e., the ratio between the length measured on a map or a photo and its equivalent in the field). This definition, in the context of this article, is used for a synthesis of the cartography needs and the proper tools deployed while referring to the IHO S-44 standards. The relative notion of scale is simply used to differentiate the type of survey according to the size of the areas to be covered, their coverage rate, and the expected level of resolution.
- Very small-scale surveys are mainly intended to cover the deep ocean depths, beyond 200 m, for a general knowledge of their topography and coastal areas where an exhaustive survey is not necessary, for example for reconnaissance surveys. In the case of general deep-sea hydrography, order 2 IHO may apply. In the coastal zone, it will be order 1b above 200 m depth. Very small-scale surveys can also be used to feed bathymetric data grids such as GEBCO (https://www.gebco.net/ (accessed on 9 July 2021)) or EMODnet (https://emodnet.eu/en/ (accessed on 9 July 2021)) [16]. The spatial resolution for GEBCO 2014 is 30 s arc, for GEBCO 2020 it is 15 s arc and for the European data portal EMODnet 1/8 min arc.
- The medium-scale survey includes coastal and reconnaissance surveys or deep surveys requiring a greater density of probes than the very small-scale survey. These surveys may require complete coverage and resolution in accordance with the specifications of order 1a IHO. These surveys are carried out either by airborne instruments in shallow water or with acoustic sensors whose characteristics depend on the requirements and the depth.
- Large-scale surveys provide higher resolution maps for areas of interest for navigation, environmental monitoring, protection of submerged cultural heritage, or installation of industrial infrastructures. The mapped areas are usually in the order of one square kilometer to a few dozen square kilometers. These surveys generally meet the special order specifications of the IHO S-44 [10] or IMCA S003 Guidelines standard [17]. They are usually carried out with high-frequency acoustic sensors, possibly coupled with underwater visual inspection.
- Very large-scale surveys are generally carried out to meet the need for one-off inspections of small areas of interest identified in previous surveys or to monitor the temporal evolution of sites. These surveys cover areas ranging from a few square meters to a few hundred square meters. The fields of application are varied, ranging from industrial metrology requiring measurement accuracies of the order of a millimeter to the cartography of a whole archaeological site for its three-dimensional digitization. The interest of these very large-scale methods is to generate full 3D models (i.e., to reconstruct the scene including areas not visible from above such as overhangs). We can thus use preferably the term of cartography, more relevant than that of mapping according to [18]. Tools such as close-range photogrammetry can be used to reconstruct complex habitats hosting erect species such as corals.
2.2. Why Is There Such a Difference between Aerial and Underwater Mapping
Cartography in air is essentially conducted using electromagnetic waves. Due to their limited propagation underwater, acoustic waves are generally preferred for subsea mapping.
The visible spectrum is almost not attenuated by the atmosphere, whereas in water red light (λ = 650 nm) is absorbed from the first few meters below the surface and blue light (λ = 450 nm) can penetrate up to a little more than a hundred meters (https://oceanexplorer.noaa.gov/explorations/04deepscope/background/deeplight/deeplight.html (accessed on 9 July 2021)). Only 1% of visible light reaches 100 m and less than 0.1% penetrates up to 200 m.
Attenuation of visible light in water is due to two phenomena, absorption, which is related to the interaction of photons with water molecules, and diffusion, which brings together all the phenomena includes refraction and reflection caused by particles suspended in the water column or changes in the water physical properties (e.g., temperature, salinity).
Optical systems equipped with their own light source adopt those wave lengths of the visible spectrum that are the least attenuated in water. For example, blue-green laser light is commonly used in Underwater lidar systems since, at this wavelength, both absorption and scattering are minimized [19,20].
In addition to these absorption phenomena, the sensitivity of optical systems to the turbidity of water is related to the presence of natural or anthropogenic particles whose nature and size will have a selective impact on the spectrum of radiation observed. The measurement capacity of the optical systems used will therefore be highly dependent on a combination of geographical, temporal, and climatic factors that will require a high degree of flexibility in their deployment.
On the other hand, acoustic waves are absorbed much faster in air than in water at the same frequency. For example, at 10 kHZ, after 800 m the attenuation is total in air (at 15 °C and 50% humidity), while in water the same wave will propagate beyond 10 km. In water, the attenuation of acoustic waves is mainly due to:
- Propagation losses due to geometric divergence. The emitted energy is distributed over an area that is increasingly larger as one moves away from the source;
- Absorption losses, mainly due to damping, which is highly dependent on the frequency of the wave and the characteristics of the environment (e.g., temperature, pressure, salinity).
Thus, waves of the order of 10 kHz can travel more than 10 km while waves of 500 kHz will be limited to a few hundred meters. Furthermore, the variations in velocity over the water column will cause changes in the trajectory of the acoustic wave by refraction. The heterogeneity in temperature and salinity of the water column, its stratification especially close to the surface, changes according to geographical locations, seasons, and both short-term climatic and hydrodynamic events. It requires, then, a precise measurement of the velocity profiles before using acoustic measurement tools. The velocity of the acoustic wave in seawater has a value close to 1500 m·s−1 (generally between 1450 m·s−1 and 1550 m·s−1, depending on pressure, salinity and temperature). In air, the speed of sound is 340 m·s−1 under standard conditions of temperature and pressure. The air bubbles, which might be caused by near-surface hydrodynamics such as, for example, propeller’s cavitation, represent local barriers to the propagation of acoustic waves. Special attention should therefore be paid when integrating such acoustic sensor on surface vessels.
The properties described above motivate the use of acoustic systems over long distances, including deep seabed (up to 10,000 m) from the water surface. However, the resolution of this type of sensor is highly dependent on the frequency band used, a parameter which also conditions the maximum achievable range. Indeed, the higher the frequency of the signals transmitted or received by the antennas, the more directive these antennas are (i.e., the angle of the emission or reception beam is narrow) the shorter the range will be.
Acoustic systems can thus achieve resolutions ranging from several hundred meters to a few centimeters, depending on the frequencies used and the distances involved. Acoustic systems can only be submerged since the change of medium from water to air acts as a total barrier to the propagation of the acoustic wave.
Optical systems can be used from satellites to underwater vehicles to reach the deepest depths. The propagation of electromagnetic waves in the visible spectrum both in the atmosphere and in the first tens of meters underwater allows for a wide range of applications. These include underwater mapping applications using satellites for bathymetry in coastal and clear waters [21] and airborne laser measurement applications combining infrared and green wavelengths to measure both the distance from sensor to water surface and the distance from sensor to seabed [21]. However, these techniques are generally limited to 50 m of penetration, which is the maximum range of underwater optical survey systems [22]. It is therefore not possible to map the entire ocean floor from the surface with these techniques. In order to map deeper sites it is then necessary to embark the sensors on underwater vehicles. The conditioning of optical sensors in watertight enclosures can be carried out but requires rigorous optical calibration due to the change of media between the external environment (i.e., water), the separating material, and the medium in which the sensor is conditioned (usually air). The change of medium and thus of refractive index will therefore have an impact on the trajectory of light rays, which is governed by Snell–Descartes’ law. For example, the index of air is close to 1, that of water is around 1.333, and it is up to 1.343 for sea water. The index of optical glass usually employed for underwater ports is 1.54.
For example, in the case of cameras enclosed in waterproof housings, depending on the geometry of the porthole and the type of materials used the consequences of these changes in index may be reductions in field angle, pincushion or barrel distortions, and chromatic aberrations (the refractive index of a medium is a function of wavelength). In order to limit these phenomena, the use of spherical portholes (or domes) is generally preferred for use with wide angle lenses.
While spherical portholes eliminate the need for complex correction systems such as the Ivanoff–Rebikoff [23], they still introduce other optical aberrations (e.g., field curvature) which degrade, to some extent, the image quality [24,25].
These portholes have the disadvantage of their fragility and their exposure to scratches as well as the relative complexity of realization, especially for high pressures, and require a good centering between the optical lens and the dome. It will therefore be necessary to keep quality lenses with a fixed focal length and internal focusing without moving the optical center. Some details on the characterization of the hemispherical dome are given in [25].
In addition to the optical constraints on the propagation of light rays in the aquatic environment, due to the movements of the water surface (caustic), the distribution of light underwater is often heterogeneous. There are also a number of operational constraints that limit the implementation capabilities of optical survey systems in an underwater environment. Coastal areas, especially in very shallow waters, with a submarine relief sometimes very rugged or of variable nature and subject to significant hydrodynamics, are often difficult to access and their accurate surveys are a real challenge. While measurements using surface vessels are time-consuming, as the coverage of imaging systems is directly related to depth, airborne or satellite equipment is often limited by water turbidity or surface conditions in the case of strong hydrodynamics. Underwater interventions are generally reserved for surveying of areas of limited extension. Moving away from the coast, although visibility conditions generally improve, satellite and airborne optical sensors reach their limit with increasing depth. Offshore, robotic underwater vehicles (or sometimes divers) are employed for high-resolution cartography.
In the case of underwater survey, using embedded sensors the mechanical constraints linked to the ambient pressure require the right dimensioning of the enclosures in which the sensors will be packaged. Different materials can be used like aluminum, stainless steel, or titanium depending on the desired intervention pressure. The ratio between the size of the enclosure, the thickness of the material, and therefore the apparent weight in the water is of prime importance as the capacity of the underwater vehicle to carry sensors is often limited by the weight.
Another limitation is the transmission of data over long distances underwater. Sometimes several kilometers of cable separate the sensor from the surface acquisition or control station. The entire data stream must therefore be transmitted over these long distances without loss and with limited latency for real-time control. The interface connectors to the waterproof enclosures are critical points both in terms of waterproofing and in guaranteeing the bandwidth of the data links.
Some systems have the ability to process data directly in the waterproof enclosures, onboard subsea vehicles. These on-board processing stations must be designed with a constant concern for optimization between computing power, electrical power consumption, size, weight, volume, and heat dissipation.
It can be easily argued that the collection of data at great depths, using underwater vehicles, requires advanced and expensive technical means.
2.3. Underwater Optical Survey Solutions, a Panel of Technologies
Optical survey solutions can be classified according to several criteria, including their active or passive nature. In the first case, the measurement is carried out by combining the emission of a signal in the medium and its analysis at reception. Passive sensors are based on the analysis of waves received from other sources, external or independent in the calculation of the measurement itself. Due to constraints already detailed in Section 2.2, it is therefore necessary to use light sources, in continuous or strobe mode, synchronized to the shooting. Unless the source of light and the camera are not relatively calibrated, such as in a triangulation-based device, the system is still considered “passive”.
Among the active sensors, we can mention techniques based on the measurement of time of flight (i.e., the time elapsed between the emission of the signal, its reflection from the object surface and its reception by the sensor). The other technique commonly used in underwater active sensors is the triangulation technique where the direction of the signal reflected by the object is measured by knowing the precise transmitter–receiver geometry.
More detailed technical descriptions and working principles of active optical sensors in air can be found in Blais [26] and Luhmann et al. [27].
Previous studies have already been carried out over the last 20 years to describe existing technical solutions for underwater optical imaging and to report on their performance and developments. In 2001, Jaffe et al. [28] reviewed the development of optical systems, mainly active, for underwater mapping such as Range gated imaging systems [29] and synchronous scanning systems (e.g., the Laser Line Scan (LLS)) [30].
Kocak et al., in 2005 [31] and in 2008 [32] described advances in underwater imaging, namely image formation and image processing methods. This included a review of extended range techniques based on time discrimination/range-gated methods; on spatial discrimination/laser line scan (LLS) methods; on imaging using structured lighting; on scattered light rejection using modulation/demodulation techniques; on polarization discrimination; and on multiple perspective image construction.
In 2008, Caimi et al. [33] wrote a complementary study in which they provide a summary of recently reported research in the area of underwater optics and vision and briefly covered advances in image formation and image processing methods; extended range imaging techniques; imaging using spatial coherency (e.g., holography); and multiple-dimensional image acquisition and image processing.
In 2011, Bonin et al. [34] presented an extensive survey of components, techniques, and methods used to build underwater vision systems, with a special focus on the use of polarized light to overcome the undesired scatter present in images.
In 2013, Bianco et al. [35] compared the performance of sensors based on structured light and passive stereo for 3D reconstruction for short-range applications.
In 2015, Massot-Campos and Oliver-Codina [36] published a survey on optical sensors and methods for 3D reconstruction. They proposed a classification according to the measurement method and included a quantitative comparison of the performance criteria.
Recently, in 2019, Castillon et al. [37] review the performances of several underwater 3D scanners, from both research and commercial domains.
This article presents a simple description of the different technologies or survey methods without going into detail. Table 2 provides the main characteristics, scale levels, and standards for each of these methods. A distinction is made between sensors deployed above the water surface and sensors deployed underwater.
2.3.1. Remote Sensing—Satellite Mapping and Bathymetry
Satellite-Derived Bathymetry (SDB) has the advantage of covering large areas of shallow water that are remote and difficult to access [40]. It provides bathymetric information in unmapped or partially mapped areas at a lower cost, assuming that the water is clear. The concept dates back to the 1970s and research is continuing to gradually integrate this type of data into the nautical chart production chain. In contrast to other survey methods, it requires no mobilization of persons or equipment [41,42].
SDB is a technique based on the empirical, semi-analytical, or analytical modeling of light transmission through the atmosphere and the water column by the Radiative Transfer Model (RTM). This approach allows one to get better than 1 m vertical accuracy [40] but needs either known in situ information of the bathymetry for empirical modelling or precise atmospheric correction for analytical modelling. In [40], a photogrammetric approach through water is proposed to achieve the same level of accuracy as the two SDB techniques described in [41,42].
Products have already been developed on these bases such as EOMAP (https://www.eomap.com/ (accessed on 9 July 2021)) which is a service provider in the field of aquatic environment mapping using SDB [43].
Multispectral and hyperspectral imaging sensors can be deployed from satellites, airplanes, and unmanned aerial systems (UAS) to assess the spectral signature of benthic feature on the seafloor, thus allowing habitat mapping from seagrass to coral reefs [44].
2.3.2. Aerial Survey, Sensors Embedded in a Flying Vehicle: Airplane, Helicopter or UAS
The most widely used method for mapping coastal areas from an aircraft is undoubtedly the bathymetric lidar (Light Detection and Ranging) which is called ALB (Airborne Lidar Bathymetry).
Lidar systems are active systems based on ToF measurement technique. The 3D mapping is based on the measurement of the propagation time of short laser pulses between emission and reception after interaction with the surface of the measured structures. In order to map the seabed, in coastal areas, two different wavelengths are emitted, one red or mostly near infrared (NIR) and the second one in the visible blue-green band (often λ = 532 nm). The NIR(λ = 1064 nm) laser is reflected from the sea surface, while the green laser penetrates the water column and is reflected from the sea floor. These systems allow mapping coastal areas in a short period of time, with high point-density and decimetric accuracy. The overflight is generally carried out at an altitude of 300 m. The penetration of the blue-green laser (λ = 532 nm) makes it possible to reach a depth of 50 m in good visibility conditions. Along the coastline, the land and sea areas can be mapped simultaneously. The continuity of mapping between the land and sea areas avoids the gap that is sometimes observed due to the use of different technologies or in referencing data to a common datum.
Currently, most ALB systems used in hydrography can reach the specifications of the S-44 IHO (https://iho.int/ (accessed on 9 July 2021)) standard [10].
Aerial photogrammetry or two-media photogrammetry, described over 70 years ago [45] to more expensive solutions such as airborne lidar or acoustic sensors from survey vessels for very shallow water bathymetry. This technique is applicable up to a depth of ten meters in clear water, enabling topological, bathymetric and underwater imaging information to be obtained, which is important for coastal management.
As already describe in Section 2.2, areas along the shoreline are particularly complex for surveys from naval units. In addition, the coverage of MBES-type sensors (Multibeam Echosounders) is very limited at shallow depths, at only 4 to 5 times the water depth.
The coastal zone is however subject to the effect of waves and tides and is the scene of erosion or accretion phenomena. Added to this are anthropic pressures, hence the need for regular and precise monitoring.
However, underwater surveys based on aerial images are impacted by refraction phenomena at the air-water interface and in the water column. These effects are all the more difficult to address as the water surface is rarely static.
A purely mathematical approach to photogrammetry through the water surface has been formulated by many authors [46,47,48,49,50,51].
However, it is still difficult to compensate precisely for the effect of refraction at the water interface, as this interface is constantly changing its orientation in relation to the camera.
An approach using a recent machine learning procedure that can recover depth on the derived dense point clouds, and then corrects the refraction effect on the original imaging dataset, exploiting image transformation and resampling techniques is proposed in [52].
The results presented on four sites in Greece and Cyprus achieved the IHO specifications under ideal weather conditions.
2.3.3. Submerged Sensors
Underwater Laser Line Scanner—A Spatial Discrimination Method
As described in [11], generally submersed optical active systems make use of coherent light (laser) for a better light propagation, suitable for long range acquisition [53], and for the capability to make beams highly collimated, although triangulation based systems using fringe projection techniques have been developed such as those presented in Bräuer-Burchardt et al. [54], Bruno et al. [55], and Zhang et al. [56].
These laser scanner systems, whether triangulation or ToF, scan the entire scene to completely reconstruct its 3D structure. They can be coupled with other sensors such as video cameras with associated lighting to apply a colorimetric texture to the resulting model. Scanning can be carried out either in station mode, i.e., the scanner is placed on a tripod and a 2-axis actuator (Pan and Tilt). This Pan and Tilt system ensures coverage of the laser beam in all directions. Increasing the number of surveying positions and merging the point clouds it is possible to cover the entire scene. Spherical targets can be placed on the seabed to facilitate the merging of point clouds and increase alignment accuracy (https://www.subseauk.com/documents/presentations/adam%20lowry%20(3d%20at%20depth)%20-%20taking%20lidar%20subsea.pdf (accessed on 9 July 2021)). This method is used particularly in industrial metrology applications. The model is generated in a relative datum which can then be georeferenced using external data or ground control points.
Site mapping can also be performed by fixing the laser scanner system on a mobile, ROV, or AUV underwater vehicle. In this case it is the movement of the vehicle that provides coverage of the scene. The point cloud is then produced by associating the positioning information from the vehicle’s positioning system with each single point cloud. It is therefore necessary to control the accuracy of the positioning system in order to ensure the accuracy of the resulting 3D model.
Close Range Photogrammetry
As mentioned in Section 2.2, underwater photogrammetry generally requires images to be taken from underwater sensors at short distances from the scene. We can thus associate the term close range photogrammetry, which according to some definitions (KB Atkinson) is used for distances less than 100 m or 300 feet [57].
Already in the 1970s we see a growing interest in the use of underwater photogrammetry. In [57] we find already a description of the main principles governing underwater photogrammetry (underwater camera and optics, multi-media photogrammetry, underwater lighting).
The proximity of the camera to the scene will require the generation of a large number of images to complete the survey.
Structure from Motion (SfM) is an image-based technique, which estimates image orientation (motion) and 3D coordinates of image points (structure) with or without self-calibration automatically and simultaneously on the principle of triangulation. The relative positions of the camera and the 3D geometry of the object are then determined automatically without the need for a priori positioning information or the manual setting of ground control points. To achieve this, processing is based on a highly redundant, iterative bundle adjustment procedure, based on a database of features automatically extracted from a set of multiple overlapping images [58,59]. The scene can thus be reconstructed in 3D within a scale factor, which can be set either by imposing a distance constraint on a known object (e.g., scale bar, standard object) or by using external navigation sensors providing an absolute position of the sensor.
Current photogrammetric techniques using stereo camera systems make it possible to achieve very high levels of accuracy, as presented in Section 3.3.2.
It is important to state that accurate scaling does not mean accurate surveying. For example, a scaling process using scale bars installed on the site provides constraints that are precise but scattered throughout the area. With this method, it is difficult to limit the drift of the 3D model except by multiplying the number of scale bars and, therefore, the operational work while increasing the impact on the site. Indirect methods, on the other hand, allow the scale constraints to be multiplied throughout the survey area, following prior calibration (for example by using a pair of stereo cameras). This calibration can be carried out on site, and the results can then be accurate in respect of this calibration. However, this does not solve the drifts that can then be observed due to the uncompensated systematic errors that we do not take into account in the standard perspective model used, mechanical instability, the variability of physical parameters such as water pressure, salinity, temperature, etc.
However, it is important to mention that close range photogrammetry in underwater environments is subject to multiple constraints including particle scattering in the water column, random refraction of sunlight on the non-uniform water surface, and rapid absorption of sunlight requiring adapted lighting. Artificial lighting must be uniform over the images to ensure robust feature detection in the images and matching. The integration of systems based on this technology for surveys in extreme environments can be more complex than simply loading a camera onto an underwater vehicle (Section 2.2). Indeed, remote camera control and data pre-processing require high-tech equipment. In order to deal with these constraints, industrial solutions have been developed and are presented in this article (Section 3.3.2).
3. Survey in Oil and Gas Industry
3.1. A Chain of Successive Phases Requiring the Support of Geomatics
As defined in Section 2, the industry uses both medium and large-scale surveys for its subsea, lake, or river facilities. The offshore oil and gas industry requires many survey and mapping throughout the life cycle of an oil and gas field (Figure 1).
Due to the reduction of oil resources in easily accessible areas (onshore or in shallow waters), deep oil fields have been developing since the 1960s. There are many deep offshore fields, beyond 200 m depth, mainly in areas such as the Arctic, the North Atlantic Ocean, North Sea, East and West Africa, the Gulf of Mexico, South America, India, South-East Asia, and Australia.
Generally, due to the increased complexity of deep-water operations, survey requirements and specifications are more stringent the greater the depth.
As described throughout the life cycle of the assets, the need for mapping and inspections is significant, recurring with very different levels of scale and accuracy requirements.
The Table 3 provides an overview of all the survey activities required in the subsea industry. Survey scale, specifications, and the applicable optical survey solutions are also provided. Each phase will be detailed in the following sections.
3.1.1. Exploration Phase
During the exploration phase, a general geomorphology map of the area is required to identify the sites of interest where drilling will be carried out. Large-scale mapping supports drilling activities including hazard assessment, Environmental Impact Assessment (EIA), and Environmental Baseline Study (EBS). Ultra-deep fields are mainly located in the Gulf of Mexico or off the coast of West Africa and have been developing since the 2000s. Today they reach depths between 1500 and 2000 m. These deep zones, which until now have been little considered and therefore little studied, are now attracting interest and the concern for the preservation of deep habitats is being felt in exploration and exploitation projects. Although there are no international regulations, deep offshore environmental impact assessments have become more widespread in the last ten years or so. The rules for mapping and monitoring these environments depend on each country but some operators are trying to adopt a set of best practices to limit their liability in areas where there are few rules in place [61].
A description of the technical methods used in three deep-sea environmental studies off of Angola, Nigeria, and Congo can be found in [62].
EBS is typically performed using a multibeam echo sounder, side-scan sonar, and video transects coupled with sediment sampling (e.g., box corer (https://en.wikipedia.org/wiki/Box_corer (accessed on 9 July 2021))). 3D reconstruction is not mandatory but could be used in the future for habitats of special interest requiring increased monitoring.
Optical survey is limited here to video transects from towed sledges or ROVs or now even AUVs.
3.1.2. Appraisal Phase
During the evaluation phase and the preparation of the development phase, it is necessary to carry out a high-resolution “Seabed survey” to determine its topology. This cartography allows engineers to identify potential geological constraints to the design of the field.
It is also necessary to carry out a “Debris survey” and “Route survey”, which consists of detecting any obstacles, man-made or natural hazards, that could hinder the installation of the structures on the bottom, their connection, and affect their life span. Please refer to International Association of Oil and Gas Producers (IOGP) guidelines [60] for more information.
On some installations, particularly in shallow water, an unexploded ordnance (UXO) survey is required to ensure that the area is cleared prior to any installation. This survey requires a very high level of resolution. Because of the extent of the areas to be covered, acoustic devices are preferred, coupled with magnetic sensors to discriminate the nature of the objects. Bathymetric surveys should be carried out with full coverage and sub-metric resolution. Side scan sonar images give information about morphological features, obstacles, and differences in bottom material. This surveys shall be carried out with a resolution better than 0.5 m. Magnetometers or gradiometers have to be selected with high sensitivity, better than 0.1 gamma.
3.1.3. Development Phase
During the development phase, survey and mapping are mandatory to assist and monitor operations. During pipe-laying activities, a pre-lay survey is carried out along the pipeline or cable route just prior to installation. In shallow water and close to the landing area the pre-lay survey can be supplemented by a UXO survey.
A high-resolution bathymetry mapping is then required to establish existing seabed bathymetry and existing pipe/cable positions. An optical survey or visual inspection is necessary to identify potential hazards or obstructions before the laying/trenching of pipelines or cables. This survey should allow to further investigate previously found debris [63].
During the installation of pipes and their connections, unexpected events can cause damage to the structures. In this case, it is necessary to map the consequences of these events at very high resolution for decision support in the continuation of operations.
Once the assets are deployed on the seabed, there remains one essential step which is the tie-in operation. This step consists in connecting elements such as well head, manifolds, or Pipeline End Termination (PLET) (http://www.oilfieldwiki.com/wiki/Subsea_Structures_and_Equipment/ (accessed on 15 March 2021)) (Figure 2) using rigid spools and jumpers that ensure seamless fluid flow from one subsea asset to another and, finally, to processing and storage facilities.
Spool and jumpers must ensure a tight connection and allow, despite their rigidity, the expansion due to the pressure and temperature of the fluid transported without altering the integrity of the connection. More details about spool metrology survey are given in Section 3.1.6.
Immediately after the complete installation of the various structures and pipelines on the bottom and their connection, an as-laid survey is carried out to verify compliance with the specifications and the condition of the structures. An as-built survey is carried out after flooding, pressure test of the pipelines, and just before commissioning. Typically, an as-laid survey is mandatory to provide the following information [65]:
- integrity of the coating;
- integrity, functioning and Eastings, Northings of all Cathodic Protection (CP) anodes;
- evidence of any anomaly such as damage to coating, anodes, obstructions or obstacles within the corridor;
- attitude, orientation, position and depth of any specific feature such as Subsea Distribution Unit;
- (SDU), In-Line Tee (ILT), Flowline End Terminations (FLET), manifold, suction anchors, etc. (http://www.oil-gasportal.com/subsea-technology-and-equipments/ (accessed on 9 July 2021)) (https://oilstates.com/offshore/ (accessed on 9 July 2021));
- continuous Eastings, Northings, and depth of the sealine;
- relative position of sealine to seabed, identification of buried sections, free-spans; accurate identification, visual inspection and metrology of free spans (Kilometric Point (KP), length, max height, profile). This inspection is repeated once remedial work has been carried out.
As oil fields are developed deeper and deeper and further from the coast, pipelines are subject to ever-increasing pressures and temperatures. Under these conditions, pipelines create a high compressing load that can be released by buckling (in the horizontal or vertical plane). The stress exerted on the pipeline retained by the ground on the seabed can be significant and can affect the life duration of the pipeline. For global lateral buckling, the failure modes of local buckling, strain capacity, and fatigue damages need to be checked.
In those conditions, internal or external Out-Of-Straightness (OOS) survey of offshore pipelines is sometimes required during installation and operation. The purpose of external OOS is the acquisition of data including positioning and visual data [66]:
- pipeline configuration i.e., X-, Y- and Z. coordinates of the pipelines, generally referred to the Top Off Pipe (TOP) or Bottom of Pipe (BOP);
- undisturbed sea bottom coordinates along and transversal to the pipeline route;
- anodes status and anticorrosion and concrete coating status along the pipeline route.
Typical requirements for an out-of-straightness survey are:
- To be able to detect a deviation (X, Y and Z) from initial route of +/−10 cm over 100 m length;
- repeatability of absolute position better than +/−2 m.
3.1.4. Production Phase
Integrity management of subsea structures is not only an increasingly important concern with the development of new fields, but also due to the considerable number of facilities that are now aging and which must be assessed for their life expectancy and possibly their extension. Today, integrity management is taken into account from the design of the offshore field and in the planning of projects. The integrity management and inspection plan is increasingly based on a risk assessment of a facility to fail, referred to as Risk Based Inspection (RBI). This can assist by indicating the priority and required frequency of inspection activities, which balances risk reduction against inspection costs. Subsea inspection, maintenance, and repair (IMR) are key components within an overall integrity management system [67]. The periodicity of inspections is then based on the degree of confidence in the stability of the state of these installations (i.e., to find the installation in a state similar to the previous inspection). Subsea IMR survey concerns all equipment installed on the seabed:
- wellhead and tree;
- flowlines/pipelines;
- risers;
- umbilicals, power cable, flying leads;
- high-Integrity Pressure Protection System (HIPPS);
- control and monitoring system;
- subsea processing equipment;
- subsea manifolds/structures, foundation.
IMR activities also include anchor line inspections and monitoring. IMR survey will be more detailed in Section 3.1.7.
3.1.5. Decommissioning Phase
Decommissioning is the process by which options for the physical removal and disposal of structures at the end of their working life are assessed. A plan of action is formulated by the operator, approved by the government, and then implemented. The overall timescale for this is several years, as it needs to take into account many diverse factors and involves many organizations.
In order to prepare the decommissioning operations, it is first necessary to carry out a site survey to check the state of the installations and to provide necessary measurements to establish the tools and procedures required for the disconnection and salvage operations. These surveys are all the more important as on oil fields there is sometimes a lack of information and equipment may have evolved, no longer complying with the initial installation documents.
After salvage operation, once the equipment has been removed from the bottom, further mapping will be required to verify the absence of bottom residues and the ecological status of the area.
All these steps employ the various means seen previously, as dimensional control, debris survey, and environmental study.
3.1.6. Spool Metrology Is Still a Challenge
Spool metrology is one of the most complex and critical survey operations during the construction of oil fields. The objective of a subsea metrology survey is to determine accurately the relative horizontal and vertical distance between subsea assets, as well as their relative heading and attitude [68,69]. Table 4 gives typical tolerances extracted from IMCA specifications [68]:
- Horizontal position and depth of the hubs;
- Hub-to-hub slant and horizontal distances (also called baseline);
- Hub-to-hub relative heading and attitude;
- Spool azimuth (i.e., the bearing of the spool from the hub) and angle of approach (difference between the spool azimuth and hub headings); seabed profile along the structure route.
The most commonly used techniques for subsea metrology until 10 years ago was long baseline (LBL) acoustics and diver taut wire. The latter one remains a method used, but only at shallow depths and over short distances generally less than 30 m, due to its low accuracy. Metrology by LBL remains the most commonly used allowing measurements over long distances. However, it requires the installation of additional sensors directly above the structures to perform attitude measurements (heading, roll, pitch). Each acoustic metrology typically takes 12 to 18 h of costly and specialized vessel time. Thus, the survey industry is a driver of innovation to put forward new methods which can reduce vessel time and the operational costs associated with spool metrology. Today, several alternative techniques are used such as digital taut wire, photogrammetry, Inertial Navigation Systems (INSs), Simultaneous Localization and Mapping (SLAM) solutions and, laser scanning. More information about those techniques can be found in [27,68,70,71,72].
3.1.7. IMR Surveys in Detail
Inspections may further involve internal inspections referred to as In-line inspection (ILI) with an intelligent pig, especially for pipelines or external inspections [74] (Figure 3).
ILI’s pig travels through the pipeline driven by the flow or fluid or may be towed by a vehicle or a cable. Different tools can be combined in a pig train:
- Magnetic sensors: Magnetic Flux Leakage (MFL). A MFL-pig measures changes in wall thickness from the inside of a pipeline made of a ferro-magnetic material;
- Ultrasound technology: Ultrasound technology (UT) is used as a pigging tool to measure the absolute thickness of the wall;
- Laser-Optical Inspection Tool: The laser-optical instrument provides an image of the inside wall of pipelines. Defects are thus identified in relation to their distance from the end of the pipeline (Kilometric Point) and can be measured in width, length and depth with an accuracy of 0.5 mm. This equipment can only be used in pipelines carrying transparent fluids and whose walls are clean of any residues;
- Geopig is a pig that measures the global curvature based upon gyro-technology. A geopig can measure the global curvature with a high accuracy.
External verification of structures is usually carried out with visual inspections and/or optical surveys. Some of the purposes of external inspection are:
- To assess the state of the cathodic protection (CP) and corrosion of equipment;
- Inspection of pipe coating structures for damage or cracks. If there has been an impact by falling an object, or handling equipment or dragging an anchor, fishing, etc.;
- Pipeline upheaval or lateral buckling, or other displacements. This type of inspection falls within the scope of the OOS survey described above;
- Inspection of flanges, hubs, condition of structures to which pipelines are connected that could indicate overstressing of pipes;
- Leak detection.
Most of the time, external surveys are performed at different levels of visual inspection depending on the level of detail required (Table 5). These surveys are usually carried out using remotely operated vehicles (ROV), although they may be carried out by divers to a certain depth depending on local legislation and/or practices (e.g., in northern Europe, typical limits are around 200 m).
About the sensors conventionally used for IMR activities, some of which can be embarked on these vehicles ROVs, AUVs, SHVs, we can refer to the following documents [75] and DNV-RP-F116 Appendix E [74]. It can simply be noted that the need to obtain visual information is essential in an IMR external survey and is usually carried out by a set of cameras that provide full visibility of the structure (e.g., pipelines). Sensors, which are now mostly acoustic, generate a topological representation of the pipe in order to measure any anomalies. As described later in this article, the optical surveying solutions available today allow a three-dimensional representation of the pipelines with a photo-realistic texture at very high resolution. These solutions are now available to be integrated into IMR inspection vehicles.
In case the visibility conditions are too bad to ensure an optical survey, the alternative solutions are very high frequency (0.5 to up to 2 MHz) acoustic cameras or scanners which can be integrated on the same vehicles.
During the life cycle of oil installations, whether for construction, IMR or field extension purposes, it is sometimes necessary to perform high-precision dimensional controls in order to design adaptive parts such as clamps, brackets, etc.
These high-precision measurements are a real challenge due to the lack of reliable tools, which can be used in difficult conditions or in deep water. The expected accuracy is in the order of 1/1000 or even less.
In that case, laser scanning or close-range photogrammetry are the most relevant tools to guaranty this level of requirements. Between the different type of IMR inspections, those concerning chain inspections deserve special mention since they require specific vectors to automate the survey. Mooring systems are particularly sensitive elements in offshore installations since they are subject to greatest deteriorating forces, particularly at the seabed touchdown (thrash zone) and at the vessel interface. Permanent mooring systems are designed for a defined service life, taking into account an estimate of wear and corrosion. Periodic inspections of the mooring systems are therefore intended to ensure that the installations are performing as estimated. These inspections are compared with the data from the initial inspection carried out immediately after installation.
A set of guidelines are proposed by the American Petroleum Institute (API) including API RP 2I (API, 2008) “In-Service Inspection of Mooring Hardware for Floating Structures” (https://www.api.org/news-policy-and-issues/hurricane-information/gulf-practices (accessed on 9 July 2021)) which provides useful guidance on inspection and retirement criteria. Class Societies also provide very useful guidance (e.g., American Bureau of Shipping (ABS), 2009, 2011 (https://ww2.eagle.org/en/rules-and-resources/rules-and-guides.html (accessed on 9 July 2021)); BV Note NR 493, 2015 (https://marine-offshore.bureauveritas.com/nr493-classification-mooring-systems-permanent-and-mobile-offshore-units (accessed on 9 July 2021)); DNV-OS-E301 Position mooring, 2013 (https://rules.dnvgl.com/docs/pdf/dnvgl/os/2015-07/DNVGL-OS-E301.pdf (accessed on 9 July 2021))) [76,77]. Chain inspections consist of a GVI (Table 5) of the entire chain, followed by a CVI inspection on items requiring more detail or items of major interest or anomalies. A dimensioning of the links or connecting parts can then be carried out using different tools according to the needs and conditions.
Chain inspections are generally carried out using ROVs even though stand-alone systems, deployed along the chain, have been designed and tested. To date, these systems are complex to implement and their routing near the landing area or interface with the surface support is limited. Near the surface, in the splash/turret interface area, the use of mechanical compasses by divers is often preferred, although the dynamics of the chains in this area make diving operations dangerous. The typical tools used on ROVs are direct measurement ones such as mechanical calipers. However, they may be distorted during deployment and therefore need to be recalibrated between successive measurements. There are also simple tools such as the “Go/No-go” tool or the angle fork, which are indirect measuring devices which require a long and sometimes delicate handling with ROVs in the case of chain movements [78].
In the last ten years or so, optical measuring systems have appeared such as the optical caliper system offered by the company Welaptega Marine Ltd., (Halifax, Canada), or photogrammetric tools like ORUS3D provided by COMEX SA company, (Marseille, France), which allows for contactless measurement. In all cases, cleaning operations have to be performed prior to inspection.
3.2. New Technologies to Support Close Range Surveys
3.2.1. Towards Autonomous Underwater Vehicles
In the case of IMR surveys, the proximity of the vehicle to the sea floor and to the structures to be inspected is necessary to collect high-resolution data and perform visual inspections. It should be noted that pipeline inspections account for a large proportion of inspections during “as laid”/“as built” studies or other IMR activities.
ROVs used in inspection operations can range from small light vehicles called Observation Class, often limited to visual inspections, to Work Class ROVs, which can then carry a multitude of the larger, heavier sensors [79]. For more information about inspection ROVs see [80,81].
Always with a view to improving efficiency and optimizing inspection costs, autonomous or semi-autonomous vehicles are attracting more and more interest in the IMR market.
Although the use of fully autonomous equipment for the inspection of pipelines is not yet widespread, some systems have already been tested for qualification (Figure 4). The Hugin and Munin systems from Kongsberg, for example, have been evaluated at several sites between 2011 and 2016 [82]. Chevron and Total under their Subsea Technology Collaboration have been developing technologies to enable pipeline inspection using an Autonomous Underwater Vehicle (AUV) with Oceaneering company. Some trials have been performed in 2017, as described in [83].
At the same time, the development of specific ROVs for the optimization of pipeline inspection is continuing. In particular, the Surveyor Interceptor is an innovative survey ROV system developed in close cooperation with MMT Sweden, Kystdesign, and Reach Subsea [84].
The level of technical maturity and qualification of autonomous vehicles, the regulations in force, and the conservative nature of the offshore industry are all elements that are currently evolving but do not yet allow the use of fully autonomous devices for IMR inspections of subsea assets [75].
However, many developments have made it possible to improve the equipment and inspection methods in order to increase the safety of operations by reducing the risk of human error and to reduce operating costs.
In particular, ROVs’ piloting aids nowadays benefit from automatisms such as auto heading, depth, speed, or even station keeping, and automatic way point tracking [85].
Hybrid vehicles seem to be good alternatives for a gradual move towards autonomy. They can embark their energy, be used in conventional supervised ROV mode, and also deployed autonomously for one-off operations. This category includes so-called resident vehicles or Seabed-Hosted Vehicles (SHVs) (i.e., they are deployed from a base installed directly on the seabed, close to submarine installations) [86]. It can then operate around that base to perform a variety of IRM tasks. Many oil companies and operators have taken a keen interest in these solutions, which reduce the use of expensive surface support vessels (between 100,000 and 300,000 dollars per day). Among these new machines are the following (Figure 5):
The Hydrone-R developed by SAIPEM SonSub is a vehicle that can stay 12 months under water and can perform inspection interventions in autonomous mode within a radius of 10 km around its base [87]. Freedom ROV is an Oceaneering vehicle that can be operated for 6 months in water depths up to 6000 m [88]. I-Tech 7 and Subsea 7 have developed the AIV autonomous inspection system capable of performing unmanned inspections of pipelines, umbilicals, risers, and subsea structures [86]. The OneSubsea and SAAB uROV program on the Sabertooth vehicle is another advanced solution for the IMR of the future [89].

3.2.2. Moving to Optical Survey Solutions
By looking at all of the mapping needs throughout the life cycle of offshore installations, it is clear that the need for digital archives and very large-scale, high-precision dimensional surveys accompanied by very high-resolution video or photographic renderings are part of the standards required by oil companies and field operators.
Faced with these needs, operators acquire asset management systems that gather all the information that can be collected throughout the life cycle of the field. At the same time, the oil and gas industry is still a driver of innovation in subsea technologies and sensors. For more than ten years, multiple underwater optical survey solutions have been developed and gradually qualified to replace traditional sensors in many mapping and inspection activities. The most important of these are laser scanning and close-range photogrammetry.
As underwater inspection vehicles are becoming more and more autonomous, the need for mapping, localization and reconnaissance are also becoming essential development areas for future inspections. Optical surveys and Visual Simultaneous Localization and Mapping (VSLAM) solutions are essential elements in the short and medium term prospects for equipping new mapping vehicles. For large-scale surveys and structural inspections, it is necessary to guarantee 100% coverage.
However, due to the proximity between the vehicle and the scene, the reduced vision of the operator through the narrow field of view of the cameras (in the case of ROVs), sometimes reduced visibility conditions, the homogeneity of the scene or the absence of recognizable points, ensuring an exhaustive survey can become a real challenge.
Obtaining real-time information on the coverage but also the quality of the acquired data is crucial in offshore activities where the daily cost of operational means is very high. This is why the challenge is not only to produce 3D models, even in real time, but to be able to ensure with a set of indicators that these data are of a level of quality in line with the requirements of the final result. The post-processing of laser scanning and close-range photogrammetry data is time consuming. Waiting to assess the quality of the obtained results is not always possible.
Real-time SLAM or VSLAM solutions for ROV guidance or for coupling to the navigation systems of autonomous vehicles are proving to be increasingly useful in the context of both the search for autonomy in inspection systems and the need for high-precision digital archives. As described in Section 3.1.4, IMR surveys are the basis for asset monitoring and constitute the digital archives of the facilities. The requirements for accuracy and precision are increasingly high, often up to the order of 1/1000 in dimensional control.
The mapping and inspection requirements, methods, and procedures described here, in relation to offshore oil and gas installations, can be applied to the offshore, wind or tidal power generation industry.
Even if the operational means are not of the same order of magnitude as those used in the oil and gas industry, the civil engineering industry is moving more and more towards digital archiving and digital monitoring of structures, referred to as BIM (Building Information Model).
The use of digital tools and BIM has revolutionized the planning and construction phase of structures. It provides architects and construction workers with the information they need to collaborate more effectively between planning and construction. Beyond the construction phase, BIM allows for Smart Maintenance of structures and an enrichment of knowledge on the behavior of structures.
3.3. A Growing Off-the-Shelf Product Offering
3.3.1. Some Archives from the Late 1970s
Already at the end of the 1970s photogrammetry was being used for underwater inspections by saturation divers on oil and gas platforms.
Hunting surveys, a British company specialized in aerial photography, first became involved in underwater photogrammetry in 1977 to measure the damage to a platform in the North East of the Shetlands. A hole appeared at a depth of 100 m requiring the installation of a repair plate, which had to be prefabricated to fit the hole to minimize the diving time.
Three companies, Hunting surveys (London, England), Underwater Marine Equipment Limited (Alton, England), and Camera Alive Limited (Aberdeen, Scotland) formed an association in September 1980 to provide a complete underwater measurement package. They integrated two UMEL cameras based on the Hassenblad 70 mm format to provide an equipment which could be operated by divers or fixed on a submarine (Figure 6).
Back at those times, the use of photogrammetry was already seen as a way to save time in underwater inspection operations, to reduce the intervention time of divers and, thus, to reduce the cost of offshore operations.
3.3.2. Close Range Photogrammetry, Turnkey Solutions
In the last ten years, several companies have launched themselves into the realization of integrated photogrammetry systems, installed on remotely operated vehicles or that can be used by divers. These 3D reconstruction systems can be either based on the only principle of photogrammetry or on the fusion of data from several complementary sensors. Among the development of these solutions, we can cite the French project ROV3D, later called ORUS3D®, as marking a real turning point in the integrated solutions of underwater photogrammetry.
This project, approved by the competitiveness cluster “Pole Mer PACA”, in 2010, was partially funded for a three-year period in the scope of the Fond Unique Interministériel (FUI).
The consortium consists of a university research laboratory, LSIS (Unité Mixte de Recherche CNRS 7296), and two industrial partners, Compagnie Maritime d’Expertise (COMEX) and SETP. COMEX specializes in high-tech underwater operations, and SETP in dimensional control using optical systems [90]. The prototype, finalized in 2014, has made it possible to carry out high-resolution surveys with millimeter accuracy without any physical markers being installed or deposited on the seabed or structures.
The main ROV 3D/ORUS3D® approach is built on synchronized acquisition of high- and low-resolution images by video cameras forming a trifocal system.
The system comprises an Inertial Motion Unit and 3 cameras synchronized. The use of the three cameras allows one to adjust the stereo baseline according to the proximity of the object. This principle should limit the triangulation error and increase the image overlap for closer targets. Particular attention is paid to lighting with a specially designed lens for balanced illumination across images and a light intensity live adjustment.
As mentioned in [91], coupling IMU and stereo vision allows one to limit the number of images to be processed compared to pure image processing, increases performance in the case of poor visibility [93], and offers real-time processing and better accuracy than 1/1000 or the system from MCS Oil which is also integrated on ROV and can reach an accuracy of 1 mm on an distance of 1 m [94].
3.3.3. Subsea Laser Scanning Solutions
3D reconstruction systems using laser technology are well described in Massot Campos and Oliver-Codina [36]. A description of the main suppliers of standard solutions is presented with an analysis of the advantages and disadvantages of the different technologies. Whether ToF systems such as the SL3 system from 3D at Depth or triangulation-based sensors such as 2G Robotics and Savante, line laser scanners can be deployed either on a fix mode, in multiple stationary locations, or in motion on ROV or AUV vehicles equipped with an INS navigation system for motion compensation. In addition to these solutions we can cite the SeaVision® system from Kraken Robotics which uses a Tri-Color laser system to produce color images and integrates an INS to compensate for platform movements (http://krakenrobotics.com/wp-content/uploads/2017/11/Kraken-SeaVision-Brochure-17.11.27.pdf (accessed on 9 July 2021)).
CATHYX also offers a range of imaging solutions that can be integrated on ROV or AUV. The SCOUT or PATHFINDER systems are fully integrated systems consisting of a linear laser scanner synchronized with still images and video systems. This allows the 3D laser information to be coupled with the video images to apply a photorealistic texture. Photogrammetric processing of the acquired images can also be performed in post-processing (https://cathxocean.com/pathfinder/ (accessed on 9 July 2021)).
3.3.4. What about the System Qualification
As more and more photogrammetry solutions and processing tools appear on the market, it is sometimes difficult to differentiate between systems that are actually designed to provide metrological results (Table 6). It is thus difficult to obtain reliable and certified data to guarantee accurate restitution. This is the difference between “simple” 3D reconstruction solutions and metrology systems applicable in the challenging oil and gas industry, such as in dimensional inspection or coil metrology operations.
In order to meet this need for qualification, companies that provide 3D reconstruction solutions have to design processes to validate the performance of their systems. For example, COMEX SA started in 2019 a qualification process for the ORUS3D® solution with Bureau Veritas Marine (https://group.bureauveritas.com/ (accessed on 9 July 2021)) to certify two applications, chain link measurement (performed on 55 cm long chain links) and spool metrology (Figure 8).
In the first case, a comparison between survey performed with COMEX ORUS3D® system and a calibrated vernier caliper according to BUREAU VERITAS NR-493-DT-R03-E (http://erules.veristar.com/dy/data/bv/pdf/493-NR_2015-12.pdf (accessed on 9 July 2021)) demonstrated an accuracy of 0.36 mm (http://www.comex.fr/orus-3d (accessed on 9 July 2021)).
However, how one should transfer the results of a qualification process obtained in controlled conditions to the real operational environment is still an open issue.
For the spool metrology qualification, a high accuracy underwater 3D reference test-field was set up in a test pool. The test-field consists of 200 optical targets placed over a length of 30 m and measured with a multi-triangulation technique using a laser tracker and an industrial total station (estimated accuracy of reference 3D coordinates <1 mm).
The optimization of the calibration algorithms, the integration of temperature and pressure values for image rectification, the integration of data from an on-board Attitude and Heading Reference System (AHRS) in the bundle adjustment have made it possible to achieve an accuracy of better than 1 cm at 30 m distance with a single path [69,73].
ROVCO, (Briston, England), in their web page and description of the SUBSLAM X2 system, provide comparative results between a dry dock survey with a Leica P40 laser scanner (in air) and a survey after filling the hold with their photogrammetry system. The accuracy of the announced point-to-point measurement is sub-millimeter over a distance of 1 m (0.67 mm/m). The accuracy of the 3D point cloud in real time is announced to be 16 mm [93]. Table 6 provides a summary of the main solutions available on the market and their key specifications.
4. Discussion: Are Underwater Optical Survey Solutions a Mature Technology for the Industry?
Optical surveying offers precision and resolution performance unrivaled with acoustic systems in very large scale surveying. For these applications, close range photogrammetry appears to be a simple solution when compared to other acoustic or laser systems. The latter techniques, for dynamic surveys, require the acquisition of positioning data and the three-dimensional reconstruction is constructed at least partially on the basis of this information as detailed in Section 2.3.3.
Even if the overlap between the laser or acoustic signals can be used to improve the quality of the pose estimation, the accuracy of the surveys made by these methods is generally linked to the accuracy of the sensor chain required to compute the transducer pose (i.e., acoustic positioning, attitude unit or inertial motion, pressure sensor, etc.). This includes both the accuracy of each of the sensors individually and the accuracy of the lever arm measurements between the sensors and the scanning system. The integration of such equipment on underwater vehicles is therefore complex and requires mobilization time. The photogrammetric survey requires only a few sensors, e.g., one or two cameras (in case of a stereo pair). As detailed in the Section 2.3.3, the 3D model thus obtained is subject to a global transformation to be representative of reality. First, a scaling factor has to be applied generally using or ground control points, scale bars, or a stereo camera. Therefore, the use of a stereoscopic system, which does not require the deployment of targets or equipment on site, generally saves mobilization time. The resulting 3D model is referenced in a local reference frame and can be georeferenced using navigation data (external source) or ground control points of known coordinates in the global reference system. It is then important to specify that the accuracy to which we pay attention in the large scale-survey is the local accuracy, at the scale of the 3D reconstruction itself and not the accuracy of the localization in the global reference frame. In the case of photogrammetry, the accuracy of the 3D model obtained is mainly related to the quality of the images. This notion of quality can be linked to the image properties (exposure, contrast, sharpness), environment properties (presence of particles, visibility), and scene properties (texture heterogeneity, moving objects). All of these properties will condition the automatic feature extraction efficiency (number and robustness of key points) and the quality of image orientation. Other parameters will affect the accuracy of the reconstruction as camera calibration or scaling method. Nevertheless, georeferencing data is used to allow the inspection site to be found between different survey sessions, and metric accuracy is usually sufficient. Only vertical, azimuth, and depth references are often relevant and can be solved by using sensors directly coupled to the cameras. This weak constraint on the absolute positioning allows an easy integration of photogrammetric survey systems on underwater vehicles compared to the other techniques. There is no need for numerous electrical connections and inter-sensor lever arm measurements.
Beneath the apparent simplicity of photogrammetric processing, linked in particular to the numerous software programs available for an automated process, 3D reconstruction using this technique requires many precautions for a metrological application (Section 2.2 and Section 2.3).
As noted earlier in the IMR inspection requirements, large-scale surveys of complex underwater structures present a technological challenge both in terms of the operational aspects and the very architecture and qualification of the inspection systems themselves.
The areas of intervention can be difficult to access and sometimes very deep, but operationally the most delicate situations in terms of inspection remain the shallow areas subject to the strong influence of waves and currents. The implementation of remotely operated vehicles in these conditions to move between jacket legs without damaging structures or sensors requires efficient, real-time, and reliable feedback for the pilot of the vehicle. The constraints of daily costs for the implementation of remotely operated equipment and the immobilization of surface vessels requires a guarantee of exhaustiveness of the surveys carried out, the optimization of the time of occupation of the equipment and, of course, a quality control in real time (or very slightly delayed, i.e., a few hours). The typical example of spool metrology on the critical path of the construction of the offshore site requires the delivery of qualified results in less than 48 h, including the survey. In order for optical survey solutions to meet these requirements, it is necessary to optimize the data processing chains to achieve processing times compatible with the need for rapid on-site rendering.
One of the main challenges of 3D underwater surveys is to guarantee their precision, accuracy, and resolution. It is therefore essential to define quality indicators on the data acquired at the same time as the survey in order to guarantee an acquisition that can be used in accordance with the required specifications. This online quality control is a major requirement in the industry.
One of the interests of regular digitization of structures is their temporal follow-up. Thus the variations between two surveys must be discriminated from the potential errors observable at the end of the processing of these multiple surveys.
The quantification of errors in resolution, accuracy, and precision must therefore be carried out for the environmental and operational conditions encountered during the survey. Indeed, these errors may be dependent on visibility, image scale, good mechanical alignment of the sensors, pressure and temperature, velocity of sensor movements during measurements, etc.
Finally, the qualification of the data sets and the provision of metadata of quality estimation will allow one to combine and aggregate several data sets from different sources either for the constitution of a 3D model of a large area or for a temporal comparison, whose acquisition could be carried out following several campaigns and with different equipment and methods.
This approach can be fully compared with that used by hydrographic services, according to the S-44 standard [95] for the operation of bathymetric surveys from multiple sources (organisations, companies, equipment, methods, etc.). We can also cite the bathymetric databases such as GEBCO (https://www.gebco.net/ (accessed on 9 July 2021)) or the European Marine Observation and Data Network (EMODnet) (https://www.emodnet.eu/en (accessed on 9 July 2021)), which are the result of the aggregation of surveys that can be very heterogeneous [8].
The oil and gas industry, but also the civil engineering construction and monitoring fields are gradually moving towards optical survey solutions for three-dimensional cartography and digital archiving. In any case the industry requires high-level standards in terms of measurement tool qualification, reliability, and robustness of the equipment used, but also in terms of performance and always with the objective of limiting operating costs. Considering the wide range of solutions available on the market, it is important to identify the necessary criteria for the selection of the right tool for the surveys to be carried out.
- Acquisition criteria: according to the size of the areas to be covered, the visibility conditions, the complexity and structure of the elements to be surveyed. The right settings have to be set as field of view, coverage rate and vehicle speed, minimum and maximum distance from the sensor to the scene, and the tolerance of the variation of this distance during the survey etc. The systems should be able to adjust these parameters during the survey according to the environmental conditions. Depending on the structures or the seabed texture, and particularly its homogeneity, the system has to extract features in any condition which requires high resolution sensors and an adaptation of the survey method (distance to the bottom, speed of displacement). The presence of moving objects may affect the survey. For example, the presence of algae or marine growth which can need a cleaning of the structures before scanning.
- Restitution criteria: Resolution, accuracy, and reliability are critical factors constraining the choice of sensors. Methods of calibrations as well as the tools for scaling or referencing the 3D reconstruction model in a fixed reference frame. The completeness of the survey and quality control require real-time indicators. Particular attention must then be paid to the reliability of these indicators to guarantee the quality of the result to be produced.
- Implementation criteria: Maximum depth of intervention, the mass and size of the system will determine the type of vector and therefore the vehicle to be used to carry out the survey. Energy consumption may also be a key criterion in the case of deployment on small remotely operated vehicles with an on-board power source, or on autonomous vehicles. Ease and speed of mobilization on standards vectors and mechanical and electrical interface are also constraints to be taken into consideration when preparing operations.
Finally, it should be noted that it is generally interesting to link the survey of a site or an object to the knowledge that one has on this site and on the objectives of the survey: for which need, dedicated to which experts etc. This knowledge will guide the whole process of survey (i.e., acquisition, processing, and restitution). It is therefore essential to maintain the link between this knowledge and the survey data. This process can be handled in a more or less automated way depending on the usual methods of each application.
Geographic Information Systems are adapting to new data sources from lidar or photogrammetry technologies, generating large volumes of point clouds or 3D models, such as the ESRI suite (https://www.esri.com/en-us/home (accessed on 9 July 2021)). Some tools have been developed specifically for underwater archaeological excavation applications, e.g., Site Recorder (http://www.3hconsulting.com/ProductsRecorderMain.html (accessed on 9 July 2021)) [96]. The Oil and Gas sector also employs information systems for asset management. For example Coabis is a tool that is widely used in IMR (http://www.coabis.com/index.html (accessed on 9 July 2021)) or Abyssal 3D and Augmented Reality technology (https://abyssal.eu (accessed on 9 July 2021)).
5. Conclusions
Optical underwater surveying methods cover many fields of application and can be used at very different scales, from satellite to very large scale surveys. It is in the last case that optical systems stand out from other techniques, especially acoustic ones, due to their level of resolution and accuracy. Passive systems such as photogrammetry can be implemented relatively easily but, behind this high degree of accessibility, the problem of qualification of the results must be taken seriously and requires a certain number of precautions in the choice of sensors, their integration for underwater applications, and their calibration. Due to the low coverage linked to a narrow field of view, the guarantee of both exhaustive coverage and usable acquisition to reach the expected specifications inevitably requires real-time processing algorithms. These tools allow one to guide the survey and to obtain quality indicators at the level of image capture as well as in their exploitation to produce a faithful reconstruction of the scene. Visual odometry and Visual Simultaneous Localization and Mapping (VSLAM) techniques are rapidly expanding fields, especially due to the increase in on-board computing capacities over the over the past decade. Hybridization with additional sensors such as inertial, pressure, or altitude sensors makes the result of localization and mapping more reliable and robust during non-contact surveys. Due to diffusion and absorption phenomena in the water column, optical sensors quickly lose efficiency over distance. It then seems interesting to combine acoustic and optical technologies in order to extend the field of application of these methods to low visibility conditions. A review of these methods is proposed in [97] and still leaves good prospects for future work especially in data fusion and extrinsic calibration of both types of sensors.
Author Contributions
All the authors contributed equally to this wok. All the authors substantially contributed to the study conception and design, as well as the acquisition and interpretation of the data and drafting the manuscript. All authors have read and agreed to the published version of the manuscript.
Funding
This work has been partially supported by The Direction Generale de l’Armement (DGA) of France within the framework of the CAPRICA project.
Conflicts of Interest
The authors declare no conflict of interest.
Abbreviations
The following abbreviations are used in this manuscript:
| ABS | American Bureau of Shipping |
| ALB | Airborne Lidar Bathymetry |
| AHRS | Attitude and Heading Reference System |
| AIV | Automotive Intelligent Vehicle |
| API | American Petroleum Institute |
| AUV | Autonomous Underwater Vehicle |
| BIM | Building Information Model |
| BOP | Bottom of Pipe |
| CMOS | Complementary Metal-Oxide-Semiconductor |
| CP | Cathodic Protection |
| CVI | Close Visual Inspection |
| DTM | Digital Terrain Model |
| EBS | Environmental Baseline Study |
| EIA | Environmental Impact Assessment |
| EMODnet | European Marine Observation and Data Network |
| FLET | FlowLine End Terminations |
| GCP | Ground Control Points |
| GEBCO | General Bathymetric Chart of the Oceans |
| GNSS | Global Navigation Satellite System |
| GVI | General Visual Inspection |
| GVI XTD | Extended Visual Pipeline survey |
| HIPPS | high-Integrity Pressure Protection System |
| HPS | High Precision Survey |
| IOGP | International Association of Oil and Gas Producers |
| IHO | International Hydrographic Organization |
| ILI | In-Line Inspection |
| IMCA | International Marine Contractors Association |
| IMR | Inspection, Maintenance and Repair |
| IMU | Inertial Measurement Unit |
| INS | Inertial Navigation Systems |
| IOC | Intergovernmental Oceanographic Commission |
| LBL | long baseline |
| LIDAR | Light Detection and Ranging |
| LLS | Laser Line Scan |
| MBES | Multibeam Echosounders |
| MFL | Magnetic Flux Leakage |
| NDT | Non-Destructive Testing |
| OOS | Out-Of-Straightness |
| PLET | PipeLine End Termination |
| PRC | Photo Realistic 3D Cloud |
| RBI | Risk Based Inspection |
| ROV | Remotely Operated Vehicle |
| RTM | Radiative Transfer Model |
| SDB | Satellite-Derived bathymetry |
| SHV | Seabed-Hosted Vehicles |
| SfM | Structure from Motion |
| SLAM | Simultaneous Localization and Mapping |
| SONAR | Sound Navigation and Ranging |
| ToF | Time of Fly |
| TOP | Top Off Pipe |
| THU | Total Horizontal Uncertainty, i.e., the XY value |
| TVU | Total Vertical Uncertainty, i.e., the Z/height value |
| UAS | Unmanned aerial system |
| UMEL | Underwater Marine Equipment Limited |
| UNESCO | United Nations Educational, Scientific and Cultural Organization |
| USBL | Ultra Short Base Line |
| UT | Ultrasound technology |
| UXO | Unexploded Ordnance Surveys |
| VSLAM | Visual Simultaneous Localization and Mapping |
References
- Delnero, P. A Land with No Borders: A New Interpretation of the Babylonian “Map of the World”. J. Anc. Near East. Hist. 2017, 4, 19–37. [Google Scholar] [CrossRef]
- Maury, M.; Lieut, L.L.D. Explanations and sailing directions to accompany the wind and current charts U. S. Navy. 7th Edition, Philadelphia: E. C. & J. Biddle, 1855. J. Frankl. Inst. 1840, 30, 420. [Google Scholar] [CrossRef]
- Mayer, L.; Jakobsson, M.; Allen, G.; Dorschel, B.; Falconer, R.; Ferrini, V.; Lamarche, G.; Snaith, H.; Weatherall, P. The Nippon Foundation—GEBCO Seabed 2030 Project: The Quest to See the World’s Oceans Completely Mapped by 2030. Geosciences 2018, 8, 63. [Google Scholar] [CrossRef] [Green Version]
- International Project to Chart the World’s Ocean Floor Announces Doubling of Data Available for Definitive Global Map. Library Catalog. Available online: www.gebco.net (accessed on 9 July 2021).
- Fu, W.; Ma, J.; Chen, P.; Chen, F. Remote Sensing Satellites for Digital Earth. In Manual of Digital Earth; Guo, H., Goodchild, M.F., Annoni, A., Eds.; Springer: Singapore, 2020; pp. 55–123. [Google Scholar] [CrossRef] [Green Version]
- Lurton, X. An Introduction to Underwater Acoustics. Principles and Applications, 2nd ed.; Geophysical Sciences; Springer: Berlin/Heidelberg, Germany, 2010. [Google Scholar]
- Tani, S. Understanding Oceans. The UNESCO Courrier 2017. Agenda 2030: Challenges for Us All. Available online: https://en.unesco.org/news/agenda-2030-challenges-us-all (accessed on 15 July 2021).
- Wölfl, A.C.; Snaith, H.; Amirebrahimi, S.; Devey, C.W.; Dorschel, B.; Ferrini, V.; Huvenne, V.A.I.; Jakobsson, M.; Jencks, J.; Johnston, G.; et al. Seafloor Mapping–The Challenge of a Truly Global Ocean Bathymetry. Front. Mar. Sci. 2019, 6, 283. [Google Scholar] [CrossRef]
- International Hydrographic Organisation. Manual on Hydrography (C-13), 1st ed.; May 2005 (Corrections to February2011); Report; International Hydrographic Bureau: Monaco, Monaco, 2011. [Google Scholar]
- International Hydrographic Organisation. IHO Standards for Hydrographic Surveys, 6th ed.; International Hydrographic Bureau: Monaco, Monaco, 2020. [Google Scholar]
- Menna, F.; Agrafiotis, P.; Georgopoulos, A. State of the art and applications in archaeological underwater 3D recording and mapping. J. Cult. Herit. 2018, 33, 231–248. [Google Scholar] [CrossRef]
- Green, J. Encyclopedia of Underwater Archaeology: Underwater Archaeology History and Methodology. Int. J. Naut. Archaeol. 2009, 38, 214–215. [Google Scholar] [CrossRef]
- Leon, J.X.; Roelfsema, C.M.; Saunders, M.I.; Phinn, S.R. Measuring coral reef terrain roughness using ‘Structure-from-Motion’ close-range photogrammetry. Geomorphology 2015, 242, 21–28. [Google Scholar] [CrossRef]
- Guo, T.; Capra, A.; Troyer, M.; Gruen, A.; Brooks, A.J.; Hench, J.L.; Schmitt, R.J.; Holbrook, S.J.; Dubbini, M. Accuracy assessment of underwater photogrammetric three dimensional modelling for coral reefs. ISPRS Int. Arch. Photogramm. Remote Sens. Spat. Inf. Sci. 2016, XLI-B5, 821–828. [Google Scholar] [CrossRef] [Green Version]
- Nocerino, E.; Neyer, F.; Gruen, A.; Troyer, M.; Menna, F.; Brooks, A.; Capra, A.; Castagnetti, C.; Rossi, P. Comparison of diver-operated underwater photogrammetric systems for coral reef monitoring. ISPRS-Int. Arch. Photogramm. Remote Sens. Spat. Inf. Sci. 2019, XLII-2/W10, 143–150. [Google Scholar] [CrossRef] [Green Version]
- Schmitt, T.; Weatherall, P. GEBCO and EMODnet Bathymetry Hands in Hands. In Proceedings of the AGU Fall Meeting, San Francisco, CA, USA, 15–19 December 2014; Volume 1. [Google Scholar]
- Makar, A. Positioning of Sounding Vessel in IHO S-44 Requirements. Eur. J. Navig. 2007, 5, 17–20. [Google Scholar]
- Lapaine, M. Mapping in Cartography. Proc. ICA 2019, 2, 1–3. [Google Scholar] [CrossRef]
- Dong, L.; Li, N.; Xie, X.; Bao, C.; Li, X.; Li, D. A Fast Analysis Method for Blue-Green Laser Transmission through the Sea Surface. Sensors 2020, 20, 1758. [Google Scholar] [CrossRef] [Green Version]
- Chen, Y.; Hu, X.; Wang, D.; Chen, H.; Zhan, C.; Ren, H. Researches on underwater transmission characteristics of blue-green laser. In Proceedings of the OCEANS 2014-TAIPEI, Taipei, Taiwan, 7–10 April 2014; pp. 1–5. [Google Scholar] [CrossRef]
- Saylam, K.; Hupp, J.; Averett, A.; Gutelius, W.; Gelhar, B. Airborne lidar bathymetry: Assessing quality assurance and quality control methods with Leica Chiroptera examples. Int. J. Remote Sens. 2018, 39, 2518–2542. [Google Scholar] [CrossRef]
- Schechner, Y.; Karpel, N. Attenuating natural flicker patterns. In Proceedings of the Oceans’04. MTTS/IEEE Techno-Ocean’04, Kobe, Japan, 9–12 November 2004; Volume 3, pp. 1262–1268. [Google Scholar] [CrossRef]
- Rebikoff, D. History of underwater photography. Mus. Monum. 1972, 13, 193–203. [Google Scholar]
- Slater, D. Afocal viewport optics for underwater imaging. In Current Developments in Lens Design and Optical Engineering XV; Johnson, R.B., Mahajan, V.N., Thibault, S., Eds.; International Society for Optics and Photonics, SPIE: Bellingham, WA, USA, 2014; Volume 9192, pp. 129–141. [Google Scholar] [CrossRef]
- Menna, F.; Nocerino, E.; Fassi, F.; Remondino, F. Geometric and Optic Characterization of a Hemispherical Dome Port for Underwater Photogrammetry. Sensors 2016, 16, 48. [Google Scholar] [CrossRef] [Green Version]
- Blais, F. Review of 20 years of range sensor development. J. Electronic Imaging 2004, 13, 231–243. [Google Scholar] [CrossRef]
- Luhmann, T.; Robson, S.; Kyle, S.; Boehm, J. Close-Range Photogrammetry and 3D Imaging; De Gruyter: Berlin, Germany; Boston, MA, USA, 2013. [Google Scholar] [CrossRef]
- Jaffe, J.; Moore, K.; McLean, J.; Strand, M. Underwater Optical Imaging: Status and Prospects. Oceanography 2001, 14, 64–75. [Google Scholar] [CrossRef] [Green Version]
- Mariani, P.; Quincoces, I.; Haugholt, K.; Chardard, Y.; Visser, A.; Yates, C.; Piccinno, G.; Reali, G.; Risholm, P.; Thielemann, J. Range-gated imaging system for underwater monitoring in ocean environment. Sustainability 2018, 11, 162. [Google Scholar] [CrossRef] [Green Version]
- Caimi, F.M.; Dalgleish, F.R. Performance considerations for continuous-wave and pulsed laser line scan (LLS) imaging systems. J. Eur. Opt. Soc. Rapid Publ. 2010, 5. [Google Scholar] [CrossRef] [Green Version]
- Kocak, D.; Caimi, F. The Current Art of Underwater Imaging-With a Glimpse of the Past and Vision of the Future. Mar. Technol. Soc. J. 2005, 39, 5–26. [Google Scholar] [CrossRef]
- Kocak, D.M.; Dalgleish, F.R.; Caimi, F.M.; Schechner, Y.Y. A Focus on Recent Developments and Trends in Underwater Imaging. Mar. Technol. Soc. J. 2008, 42, 52–67. [Google Scholar] [CrossRef]
- Caimi, F.M.; Kocak, D.M.; Dalgleish, F.; Watson, J. Underwater imaging and optics: Recent advances. In Proceedings of the OCEANS 2008, Quebec City, QC, Canada, 15–18 September 2008; pp. 1–9. [Google Scholar] [CrossRef]
- Bonin, F.; Burguera, A.; Oliver, G. Imaging systems for advanced underwater vehicles. J. Mar. Res. 2011, 8, 23. [Google Scholar]
- Bianco, G.; Gallo, A.; Bruno, F.; Muzzupappa, M. A Comparative Analysis between Active and Passive Techniques for Underwater 3D Reconstruction of Close-Range Objects. Sensors 2013, 13, 11007–11031. [Google Scholar] [CrossRef] [PubMed]
- Massot-Campos, M.; Oliver-Codina, G. Optical Sensors and Methods for Underwater 3D Reconstruction. Sensors 2015, 15, 31525–31557. [Google Scholar] [CrossRef] [PubMed] [Green Version]
- Castillón, M.; Palomer, A.; Forest, J.; Ridao, P. State of the Art of Underwater Active Optical 3D Scanners. Sensors 2019, 19, 5161. [Google Scholar] [CrossRef] [PubMed] [Green Version]
- Piel, S.; Populus, J. Review of Standards and Protocols for Seabed Habitat Mapping; Technical Report Remote Sensing Techniques 1–5; MESH: Peterborough, UK, 2007. [Google Scholar]
- Mandlburger, G.; Pfennigbauer, M.; Schwarz, R.; Flöry, S.; Nussbaumer, L. Concept and Performance Evaluation of a Novel UAV-Borne Topo-Bathymetric LiDAR Sensor. Remote Sens. 2020, 12, 986. [Google Scholar] [CrossRef] [Green Version]
- Hodul, M.; Bird, S.; Knudby, A.; Chenier, R. Satellite derived photogrammetric bathymetry. ISPRS J. Photogramm. Remote Sens. 2018, 142, 268–277. [Google Scholar] [CrossRef]
- Mavraeidopoulos, A.K.; Pallikaris, A.; Oikonomou, E. Satellite Derived Bathymetry (SDB) and Safety of navigation. Int. Hydrogr. Rev. 2017, 14. Available online: https://journals.lib.unb.ca/index.php/ihr/article/view/26290 (accessed on 9 July 2021).
- Ashphaq, M.; Srivastava, P.K.; Mitra, D. Review of near-shore satellite derived bathymetry: Classification and account of five decades of coastal bathymetry research. J. Ocean Eng. Sci. 2021. [Google Scholar] [CrossRef]
- Wettle, M. Satellite-Derived Bathymetry in Hydrographic Surveys. 2019. Available online: https://iho.int/uploads/user/Inter-Regional%20Coordination/RHC/SWPHC/SWPHC16/SWPHC16-16.2-EOMAP.pdf (accessed on 15 July 2021).
- Dierssen, H.M. Overview of hyperspectral remote sensing for mapping marine benthic habitats from airborne and underwater sensors. In Imaging Spectrometry XVIII.; International Society for Optics and Photonics: Bellingham, WA, USA, 2013; Volume 8870, p. 88700L. Available online: https://www.spiedigitallibrary.org/conference-proceedings-of-spie/8870/1/Overview-of-hyperspectral-remote-sensing-for-mapping-marine-benthic-habitats/10.1117/12.2026529.short (accessed on 9 July 2021).
- Rinner, D.I.K. Problems of Two-Medium Photogrammetry. Photogramm. Eng. 1948, 35, 275–282. [Google Scholar]
- Agrafiotis, P.; Georgopoulos, A. Camera Constant in the Case of Two Media Photogrammetry. ISPRS Int. Arch. Photogramm. Remote Sens. Spat. Inf. Sci. 2015, XL-5/W5, 1–6. [Google Scholar] [CrossRef] [Green Version]
- Shan, J. Relative orientation for two-media photogrammetry. Photogramm. Rec. 2006, 14, 993–999. [Google Scholar] [CrossRef]
- Kotowski, R. Phototriangulation in multi-media photogrammetry. Int. Arch. Photogramm. Remote Sens. 1988, 27, 324–334. [Google Scholar]
- Fryer, J.G.; Kniest, H.T. Errors in depth determination caused by waves in through-water photogrammetry. Photogramm. Rec. 1985, 11, 745–753. [Google Scholar] [CrossRef]
- Shmutter, B.; Bonfiglioli, L. Orientation problem in two-medium photogrammetry. Photogramm. Eng. 1967, 33, 1421–1428. [Google Scholar]
- Tewinkel, G.C. Water Depths from Aerial Photographs. Photogramm. Eng. 1963, 29, 1037–1042. [Google Scholar]
- Agrafiotis, P.; Karantzalos, K.; Georgopoulos, A.; Skarlatos, D. Correcting Image Refraction: Towards Accurate Aerial Image-Based Bathymetry Mapping in Shallow Waters. Remote Sens. 2020, 12, 322. [Google Scholar] [CrossRef] [Green Version]
- Jaffe, J.S. Computer modeling and the design of optimal underwater imaging systems. IEEE J. Ocean. Eng. 1990, 15, 101–111. [Google Scholar] [CrossRef]
- Bräuer-Burchardt, C.; Heinze, M.; Schmidt, I.; Kühmstedt, P.; Notni, G. Underwater 3D Surface Measurement Using Fringe Projection Based Scanning Devices. Sensors 2015, 16, 13. [Google Scholar] [CrossRef] [PubMed]
- Bruno, F.; Bianco, G.; Muzzupappa, M.; Barone, S.; Razionale, A.V. Experimentation of structured light and stereo vision for underwater 3D reconstruction. ISPRS J. Photogramm. Remote Sens. 2011, 66, 508–518. [Google Scholar] [CrossRef]
- Zhang, Q.; Wang, Q.; Hou, Z.; Liu, Y.; Su, X. Three-dimensional shape measurement for an underwater object based on two-dimensional grating pattern projection. Opt. Laser Technol. 2011, 43, 801–805. [Google Scholar] [CrossRef]
- Karara, H.M. Handbook of Non-Topographic Photogrammetry; American Society of Photogrammetry: Bethesda, MD, USA, 1979. [Google Scholar]
- Westoby, M.; Brasington, J.; Glasser, N.; Hambrey, M.; Reynolds, J. ‘Structure-from-Motion’ photogrammetry: A low-cost, effective tool for geoscience applications. Geomorphology 2012, 179, 300–314. [Google Scholar] [CrossRef] [Green Version]
- Snavely, N.; Seitz, S.; Szeliski, R. Modeling the World from Internet Photo Collections. Int. J. Comput. Vis. 2008, 80, 189–210. [Google Scholar] [CrossRef] [Green Version]
- International Association of Oil and Gas Producers. Guidelines for the Conduct of Offshore Drilling Hazard Site Surveys; Technical Report 373-18-1; International Association of Oil and Gas Producers: London, UK, 2017. [Google Scholar]
- Cordes, E.E.; Jones, D.O.B.; Schlacher, T.A.; Amon, D.J.; Bernardino, A.F.; Brooke, S.; Carney, R.; DeLeo, D.M.; Dunlop, K.M.; Escobar-Briones, E.G.; et al. Environmental Impacts of the Deep-Water Oil and Gas Industry: A Review to Guide Management Strategies. Front. Environ. Sci. 2016, 4. [Google Scholar] [CrossRef]
- Sutton, C.; Mine, J.; Canovas, S. Environmental Baseline Surveys in Deep Waters: The Lessons Learnt Offshore West Africa. SPE-86775-MS. In Proceedings of the SPE International Conference on Health, Safety, and Environment in Oil and Gas Exploration and Production, Calgary, AB, Canada, 29–31 March 2004; p. 13. [Google Scholar] [CrossRef]
- Berry, M. Data Processing, GIS & Reporting. 2017. Available online: https://www.ths.org.uk/documents/ths.org.uk/downloads/hydrofest_presentation7_2017.pdf (accessed on 15 July 2021).
- Bai, Y.; Bai, Q. Subsea Engineering Handbook; Gulf Professional Pub: Burlington, NJ, USA, 2010; OCLC:ocn682920021. [Google Scholar]
- Schoellkopf, J. Review of methods for pipe walking and lateral/upheaval buckling detection Subsea inspection, maintenance and repair. In Proceedings of the Rio Pipeline Conference and Exposition 2010, Rio de Janeiro, Brazil, 13–16 September 2010; p. 5. [Google Scholar]
- Bruschi, R.; Vitali, L.; Spinazzè, M.; Bartolini, L.M.; Marchionni, L.; Crea, C.; Vichi, R.; Battistini, A. Out-of-Straightness Survey As An Engineering Tool for Integrity Management Of Offshore Pipelines Subjected to In-Service-Buckling. In Proceedings of the Rio Pipeline Conference and Exposition 2013, Rio de Janeiro, Brazil, 24–26 September 2013; p. 16. [Google Scholar]
- ABS. Subsea Inspection, Maintenance and Repair Advisory. In Technical Report TX 02/19 19016; American Bureau of Shipping: Houston, TX, USA, 2019. [Google Scholar]
- IMCA, International Marine Contractors Association. Guidance on Subsea Metrology; IMCA S 019; IMCA: London, UK, 2017. [Google Scholar]
- Menna, F.; Nocerino, E.; Nawaf, M.M.; Seinturier, J.; Torresani, A.; Drap, P.; Remondino, F.; Chemisky, B. Towards Real-Time Underwater Photogrammetry for Subsea Metrology Applications. In Proceedings of the OCEANS 2019-Marseille Reporter: OCEANS 2019-Marseille, Marseille, France, 17–20 June 2019; pp. 1–10. [Google Scholar] [CrossRef]
- Jørgensen, M.J.; Poulsen, N.K.; Larsen, M.B. Enhanced Subsea Acoustically Aided Inertial Navigation. Ph.D. Thesis, University of Denmark, Lyngby, Denmark, 2016. [Google Scholar]
- Bakare, A. Subsea Field Development: A Critical Review of Metrology Methods and Achievable Accuracies in Spool Tie-In Operations. Master’s Thesis, Subsea Engineering, The University of Aberdeen, Aberdeen, UK, 2013. [Google Scholar]
- Tomczak, A. Modern methods of underwater positioning applied in subsea mining. Górnictwo i Geoinz˙ynieria 2011, 35, 381–394. [Google Scholar]
- Menna, F.; Torresani, A.; Nocerino, E.; Nawaf, M.M.; Seinturier, J.; Remondino, F.; Drap, P.; Chemisky, B. Evaluation of vision-based localization and mapping techniques in a subsea metrology scenario. ISPRS Int. Arch. Photogramm. Remote Sens. Spat. Inf. Sci. 2019, XLII-2/W10, 127–134. [Google Scholar] [CrossRef] [Green Version]
- Det Norske Veritas AS. DNV-RP-F116 Integrity Management of Submarine Pipeline Systems. In Technical Report DNV-RP-F116; Det Norske Veritas AS: Bærum, Norway, 2015. [Google Scholar]
- Mai, C.; Pedersen, S.; Hansen, L.; Jepsen, K.L.; Yang, Z. Subsea infrastructure inspection: A review study. In Proceedings of the 2016 IEEE International Conference on Underwater System Technology: Theory and Applications (USYS), Penang, Malaysia, 13–14 December 2016; pp. 71–76. [Google Scholar] [CrossRef]
- Gordon, R.B. Considerations for mooring life extension. In The Society of Naval Architects and Marine Engineers; The Society of Naval Architects and Marine Engineers: Houston, TX, USA, 2015; p. 9. [Google Scholar]
- Gordon, R.B.; Brown, M.G.; Allen, E.M. Mooring Integrity Management: A State-of-the-Art Review. In Proceedings of the Offshore Technology Conference, Houston, TX, USA, 5–8 May 2014. [Google Scholar] [CrossRef]
- Health ans Safety Executive. Remote Operated Vehicle (ROV) Inspection of Long Term Mooring Systems for Floating Offshore Installations; HSE Book RR1091; Health ans Safety Executive: Merseyside, UK, 2017. [Google Scholar]
- IMCA, International Marine Contractors Association. Code of Practice for the Safe & Efficient Operation of Remotely Operated Vehicles; Technical Report IMCA R 004 Rev. 3; IMCA, International Marine Contractors Association: London, UK, 2014. [Google Scholar]
- Capocci, R.; Dooly, G.; Omerdic´, E.; Coleman, J.; Newe, T.; Toal, D. Inspection-Class Remotely Operated Vehicles—A Review. J. Mar. Sci. Eng. 2017, 5, 13. [Google Scholar] [CrossRef]
- Ledezma, F.D.; Amer, A.; Abdellatif, F.; Outa, A.; Trigui, H.; Patel, S.; Binyahib, R. A Market Survey of Offshore Underwater Robotic Inspection Technologies for the Oil and Gas Industry. In SPE Saudi Arabia Section Annual Technical Symposium and Exhibition; Society of Petroleum Engineers: Al-Khobar, Saudi Arabia, 2015. [Google Scholar] [CrossRef]
- Hagen, P.E. Pipeline Inspection with AUV: Operational Experience and Lessons Learned. Oceanology International; Kongsberg Maritime AS: London, UK, 2016; p. 39. [Google Scholar]
- Ling, D. AUV Pipeline Inspection; Society for Underwater Technology: London, UK, 2017. [Google Scholar]
- Oskarsson, O. Surveyor Interceptor Precision at Speed; Hydrographic Society, MMT: Oxon, UK, 2017. [Google Scholar]
- Schjølberg, I.; Utne, I.B. Towards autonomy in ROV operations. IFAC-PapersOnLine 2015, 48, 183–188. [Google Scholar] [CrossRef]
- Society for Underwater Technology. Resident Underwater Vehicles; Society for Underwater Technology: London, UK, 2018; Volume 12, pp. 26–49. [Google Scholar]
- Saipem. Sonsub Hydrone-R Launched in Water: The First Dive of Saipem’s Underwater Intervention Drone Has Made a Splash; Saipem: Milan, Italy, 2019. [Google Scholar]
- Leather, A.; Gayathiry, H. An Autonomous Underwater Vehicle Using Remote Piloting Technology via 4G Internet. 2019. Available online: https://www.sut.org/wp-content/uploads/2018/06/Aaron-Leather-v2-AUT-Freedom-Rev3-Final-Submission-draft-2-21.10.2019.pdf (accessed on 15 July 2021).
- Sevinc, D. uROV: A Digitally Enabled Platform for the Future of IMR. Soc. Underw. Technol. 2018. Available online: https://www.sut.org/wp-content/uploads/2018/05/014-uROV-A-Digitally-enabled-platform-for-the-future-of-IMR-D-Sevinc-One-Subsea.pdf (accessed on 9 July 2021).
- Drap, P.; Seinturier, J.; Hijazi, B.; Merad, D.; Boi, J.M.; Chemisky, B.; Seguin, E.; Long, L. The ROV 3D Project: Deep-Sea Underwater Survey Using Photogrammetry: Applications for Underwater Archaeology. J. Comput. Cult. Herit. 2015, 8, 1–24. [Google Scholar] [CrossRef]
- ZUPT. Visual Inertial Subsea 3D Reconstruction for Subsea Model Generation and Real-Time Positioning. 2018. Available online: https://www.zupt.com/wp-content/uploads/3D-Recon-Presentation.pdf (accessed on 15 July 2021).
- ORUS 3D Photogramétrie Sous-Marine-COMEX SA. 2020. Available online: https://comex.fr/orus-3d (accessed on 9 July 2021).
- SubSLAM–Live 3D Vision. 2020. Library Catalog. Available online: www.rovco.com (accessed on 9 July 2021).
- Selim, A. Photo Realistic 3D Cloud of Points (PRC). 2016. Available online: http://www.mcsoil.com/wp-content/uploads/2017/12/MCS-Photo-Realistic-Cloud-of-Points-Presentation.pdf (accessed on 15 July 2021).
- International Hydrographic Organisation. IHO Standards for Hydrographic Surveys, 5th ed.; International Hydrographic Bureau: Monaco, Monaco, 2008. [Google Scholar]
- Bartoli, D.; Capulli, M.; Holt, P. Creating a GIS for the Underwater Research Project “Anaxum”: The Stella 1 Shipwreck. CEUR Workshop Proc. 2012, 948, E1–E9. [Google Scholar]
- Ferreira, F.; Machado, D.; Ferri, G.; Dugelay, S.; Potter, J. Underwater optical and acoustic imaging: A time for fusion? A brief overview of the state-of-the-art. In Proceedings of the OCEANS 2016 MTS/IEEE Monterey, Monterey, CA, USA, 19–23 September 2016; pp. 1–6. [Google Scholar] [CrossRef]
Figure 1.
Geomatics support during upstream oil and gas life cycle [60].
Figure 1.
Geomatics support during upstream oil and gas life cycle [60].

Figure 2.
Typical subsea structures and interconnections [64].
Figure 2.
Typical subsea structures and interconnections [64].

Figure 3.
In-line Inspection tool from T.D. Williamson (https://www.tdwilliamson.com/solutionspipeline-integrity/in-line-inspection (accessed on 9 July 2021)).
Figure 3.
In-line Inspection tool from T.D. Williamson (https://www.tdwilliamson.com/solutionspipeline-integrity/in-line-inspection (accessed on 9 July 2021)).

Figure 4.
Pipeline inspection vehicles: (a) MMT-Reach Subsea SROV [84]; (b) Kongsberg HUGIN AUV; and (c) Kongsberg MUNIN AUV [82].

Figure 6.
Some illustration of Photogrammetric survey equipment proposed by the association of Hunting surveys, Underwater Marine Equipment Limited, and Camera Alive Limited (a) and (b) operate by a saturation diver in North Sea and Congo; (c) Integration on a submersible (Courtesy of John Turner, Camera Alive Limited).

Figure 7.
(a) COMEX SA ORUS3D® system [92]; (b) ROVCO Subslam X2 [93]; and (c) ZUPT 3D Recon Solution [91].

Figure 8.
ORUS3D® Spool metrology qualification (http://www.comex.fr/orus-3d/ (accessed on 9 July 2021)). (a) A panoramic view of the pool transect; (b) 3D mesh with superimposed coordinate reference system; and (c) RMSE results.
Figure 8.
ORUS3D® Spool metrology qualification (http://www.comex.fr/orus-3d/ (accessed on 9 July 2021)). (a) A panoramic view of the pool transect; (b) 3D mesh with superimposed coordinate reference system; and (c) RMSE results.


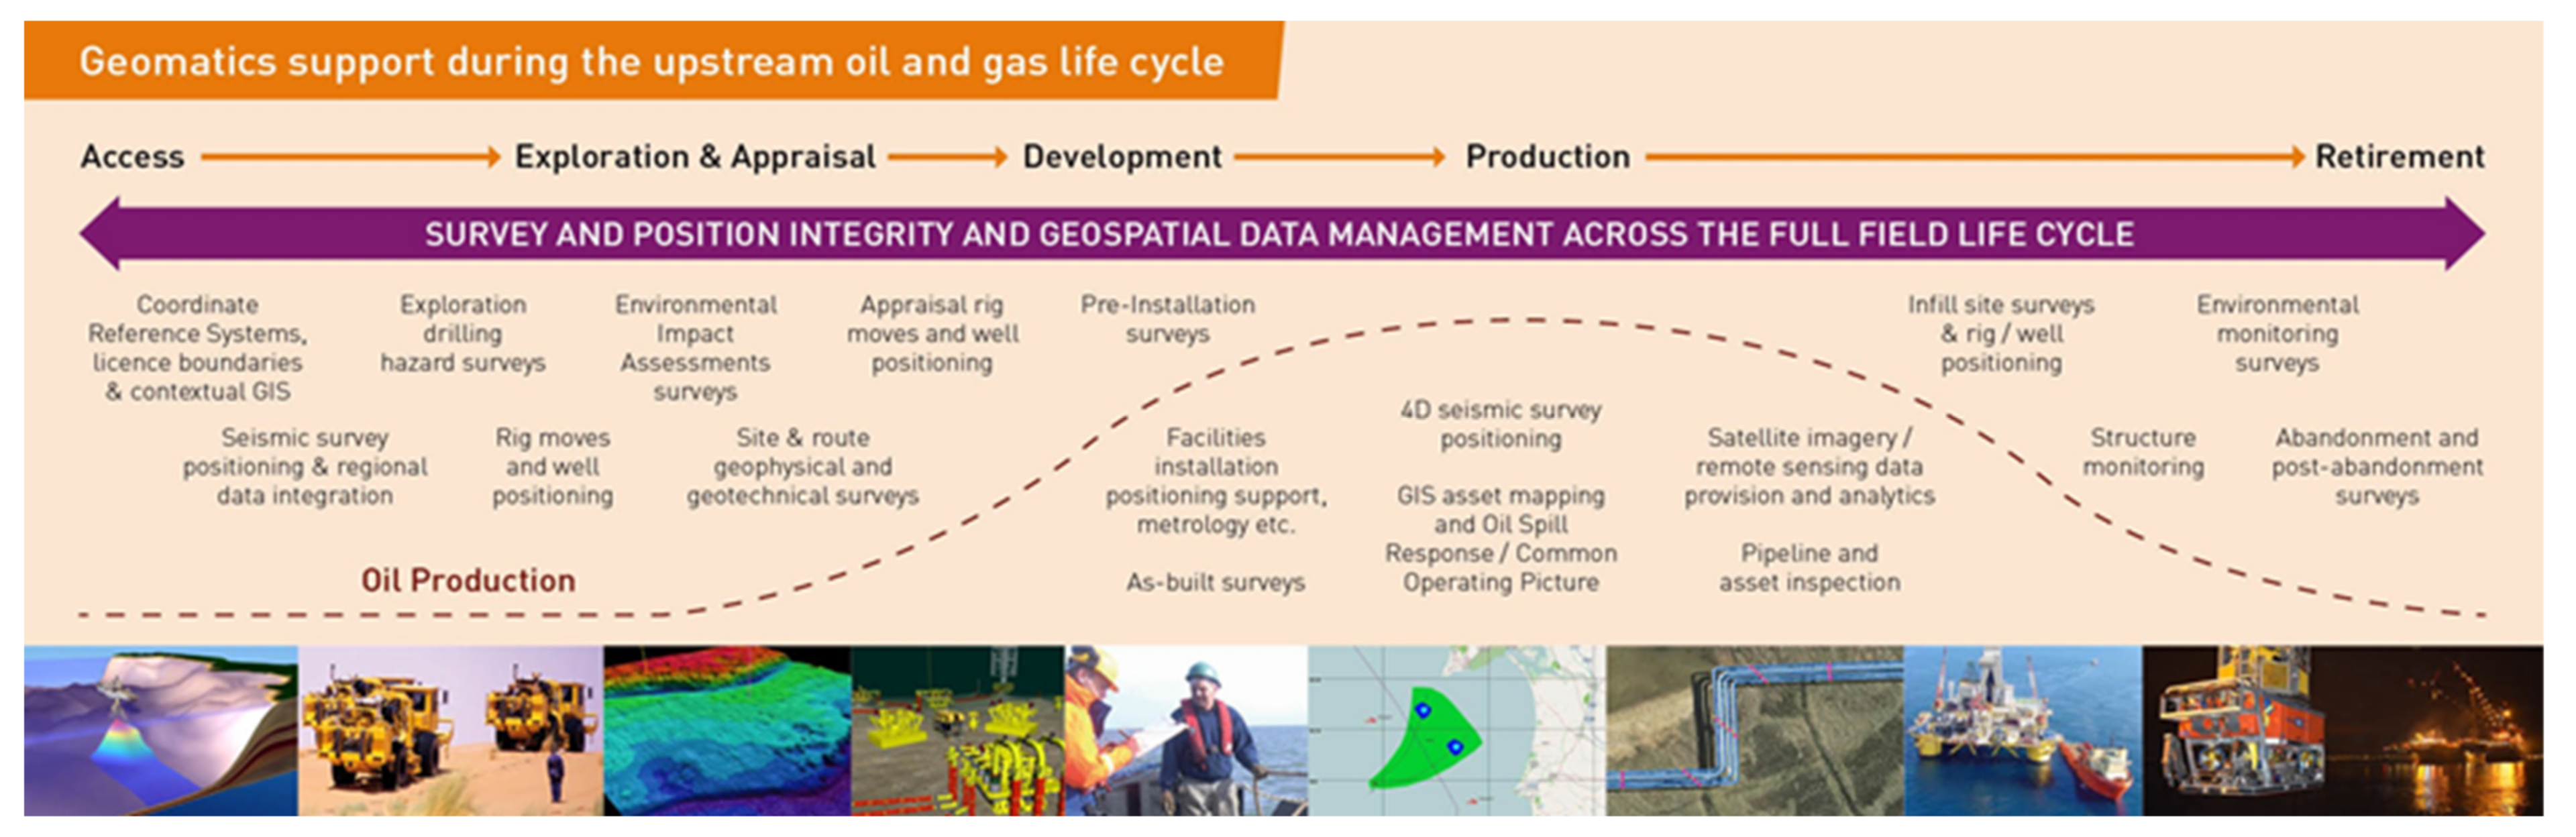
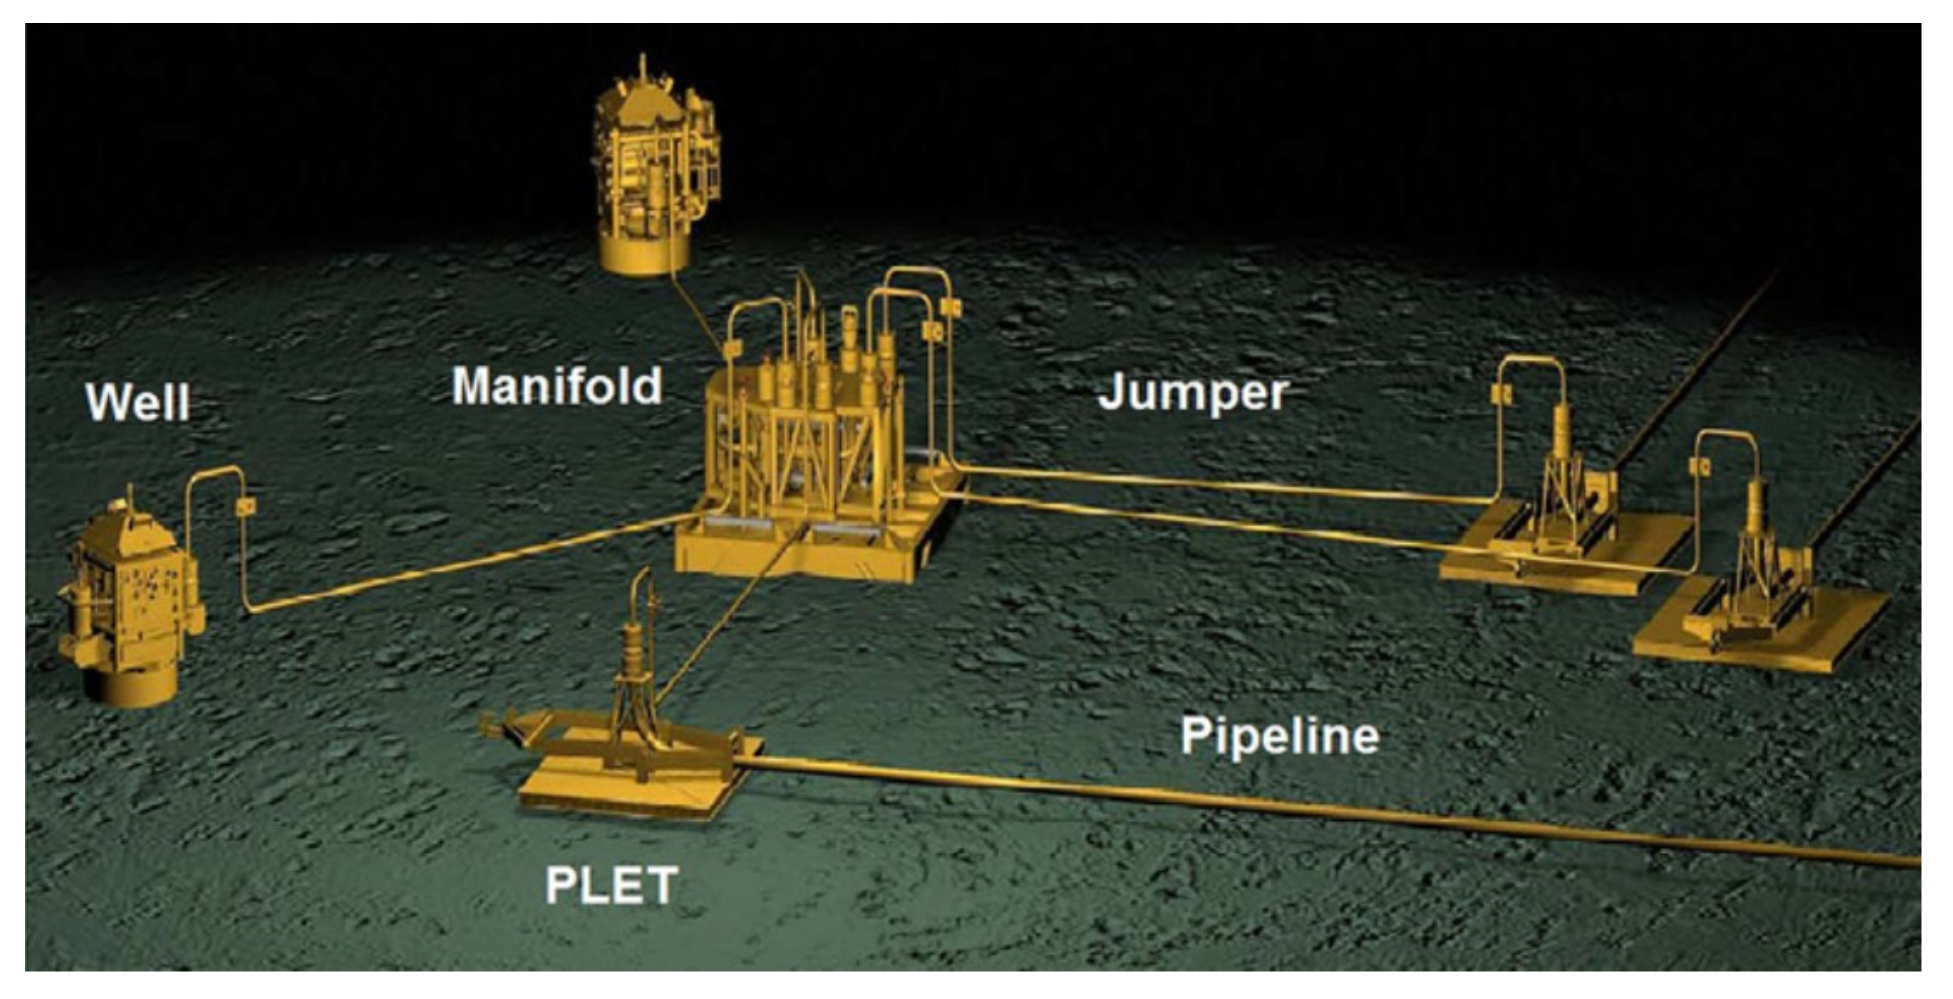
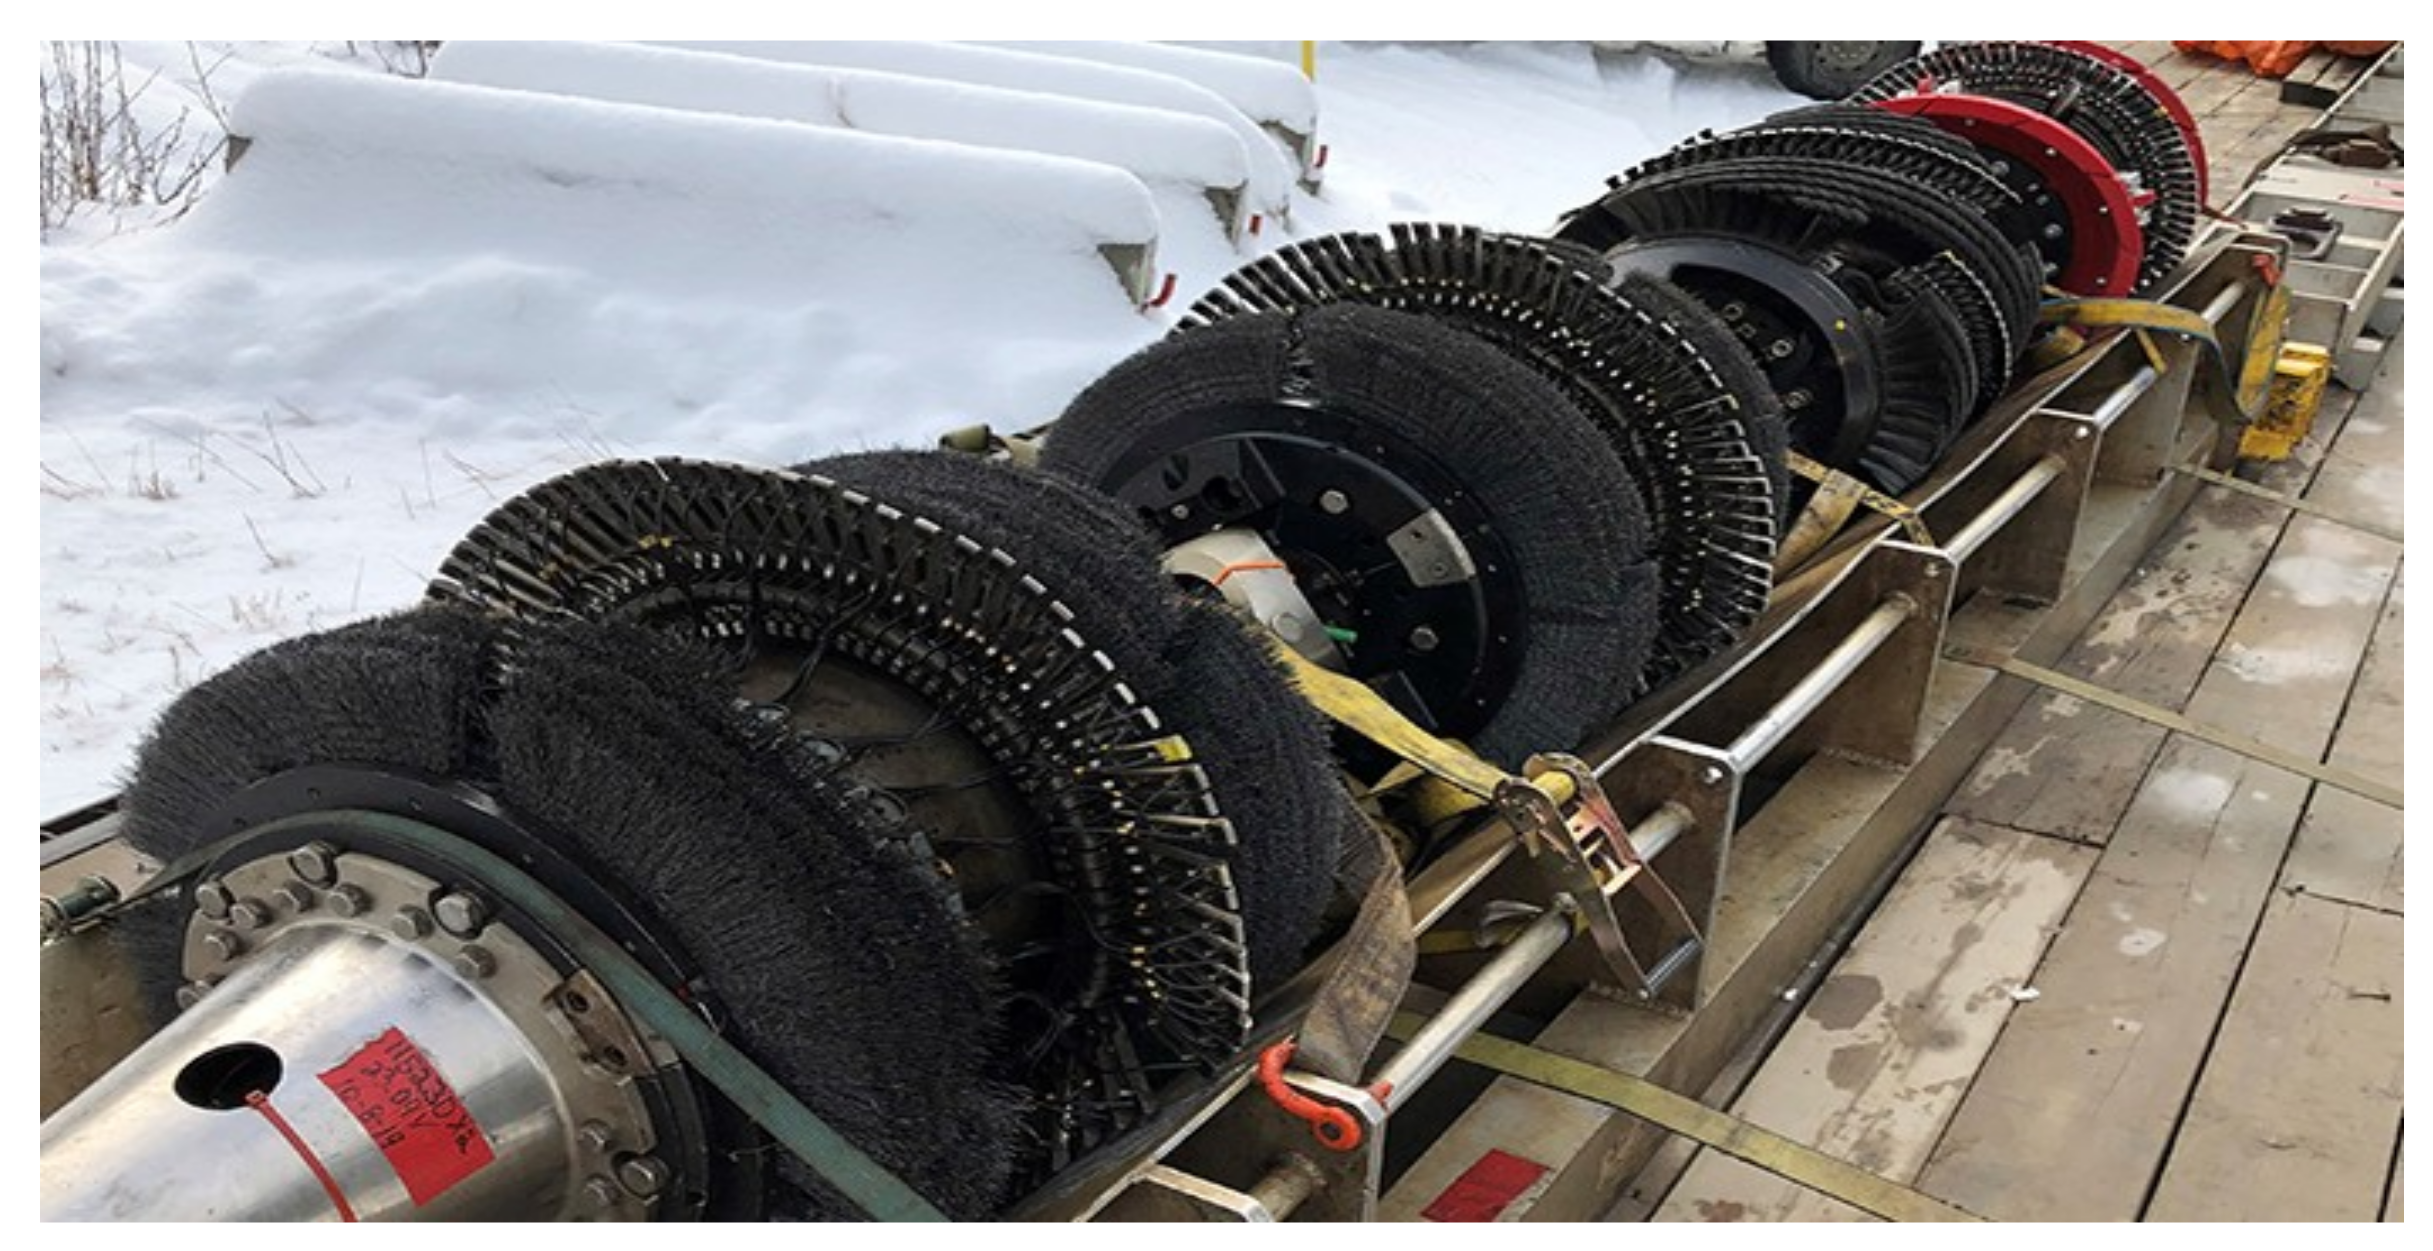
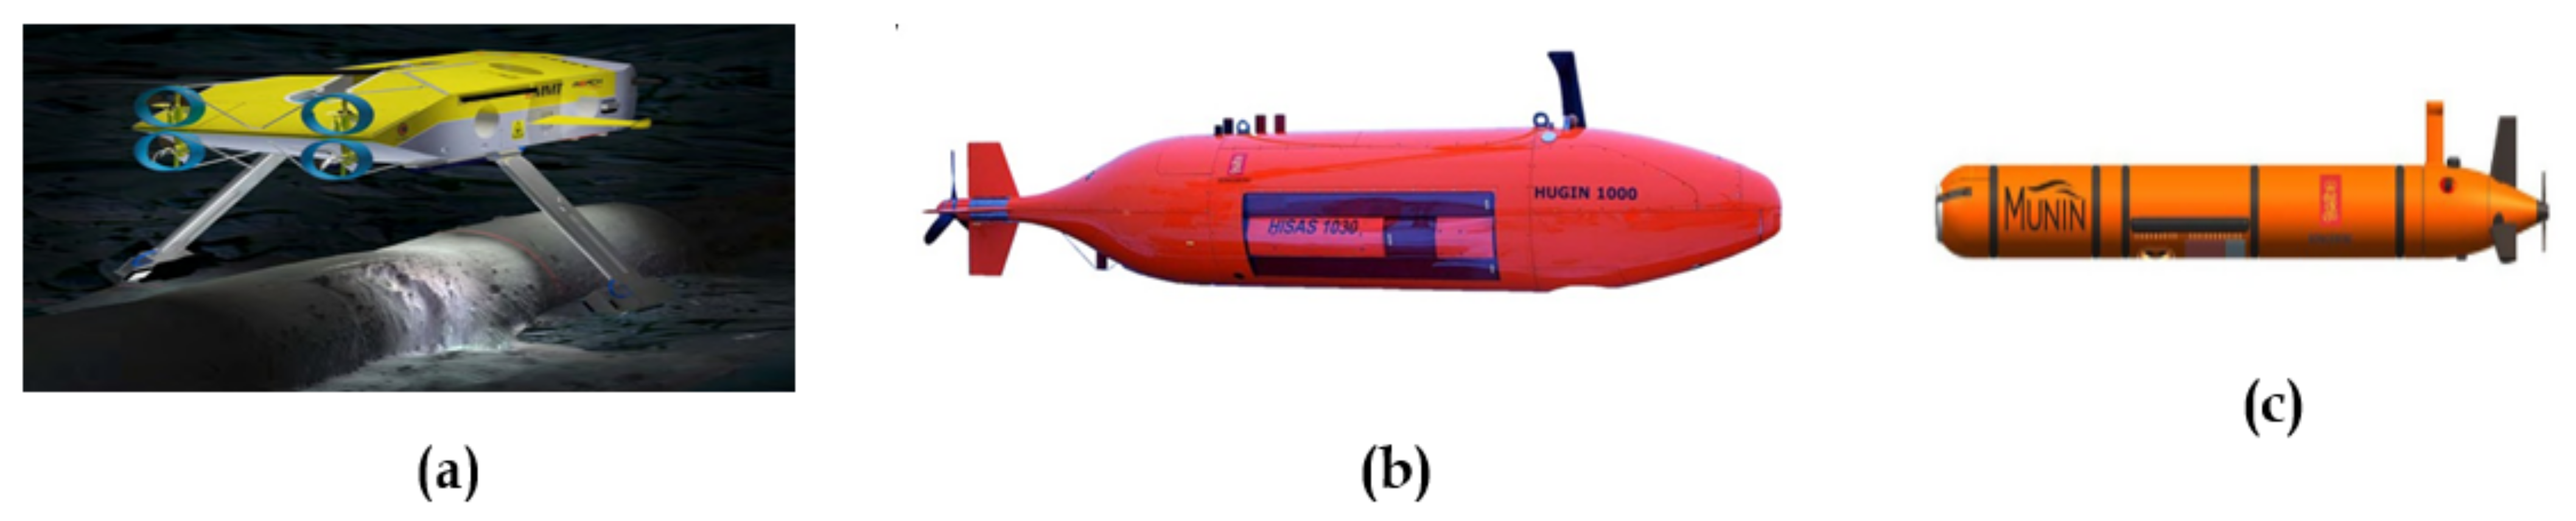
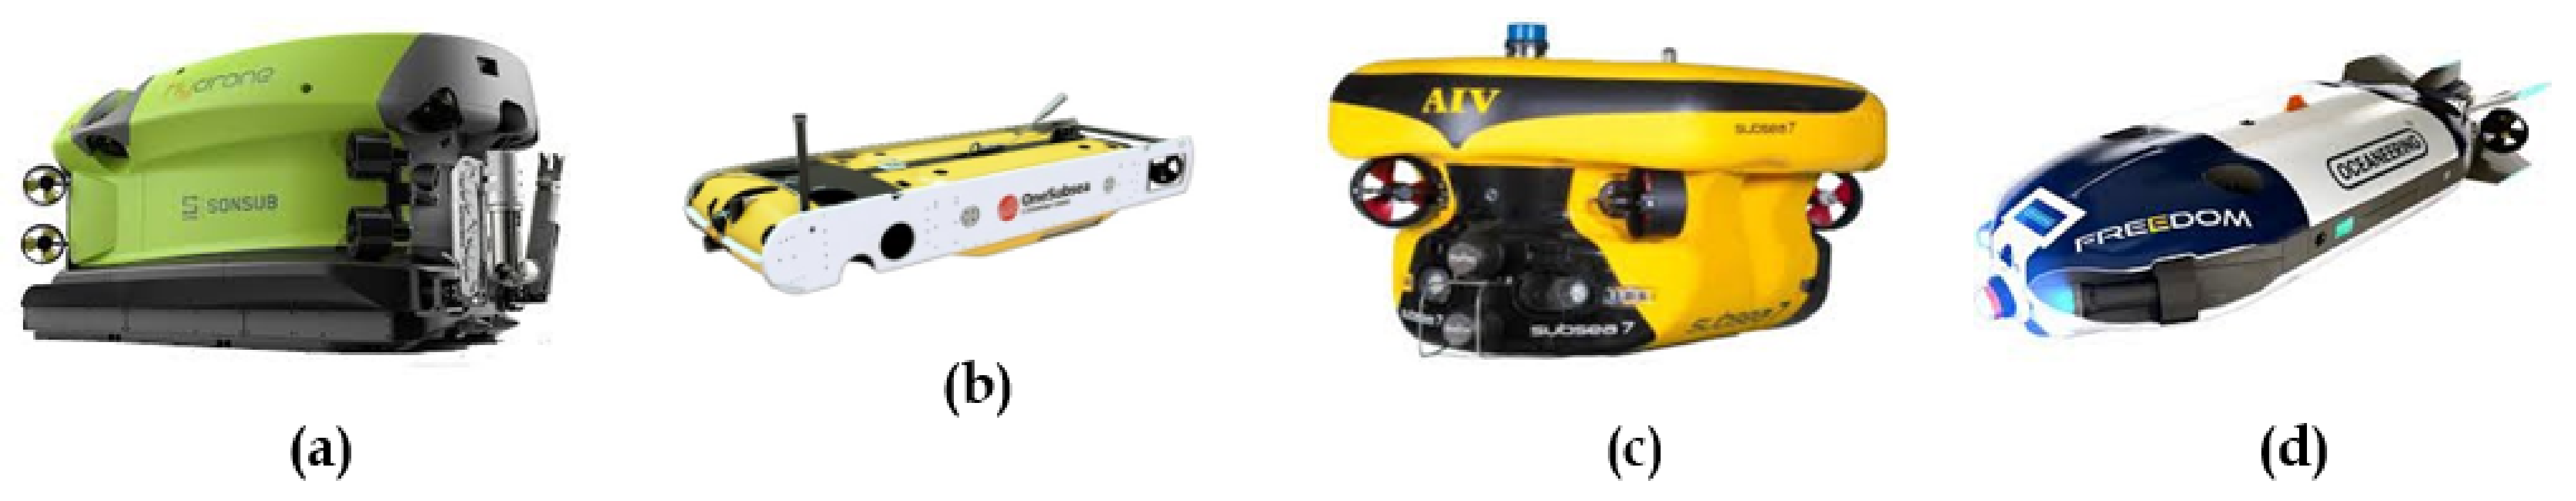
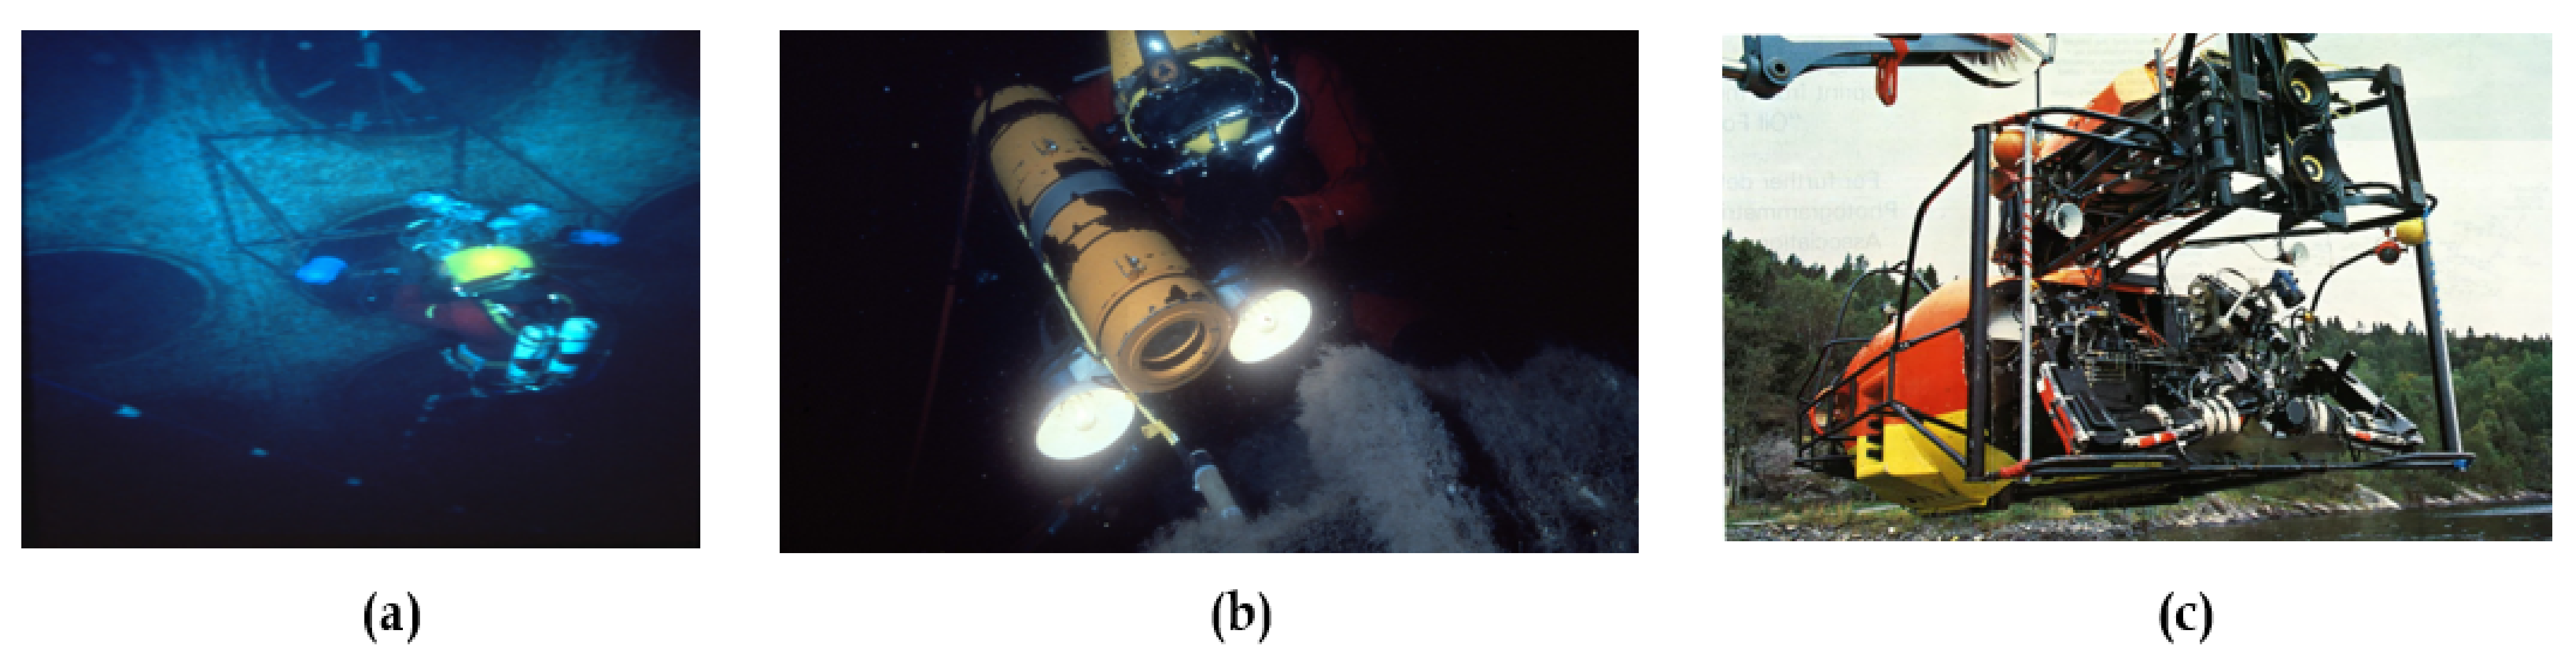
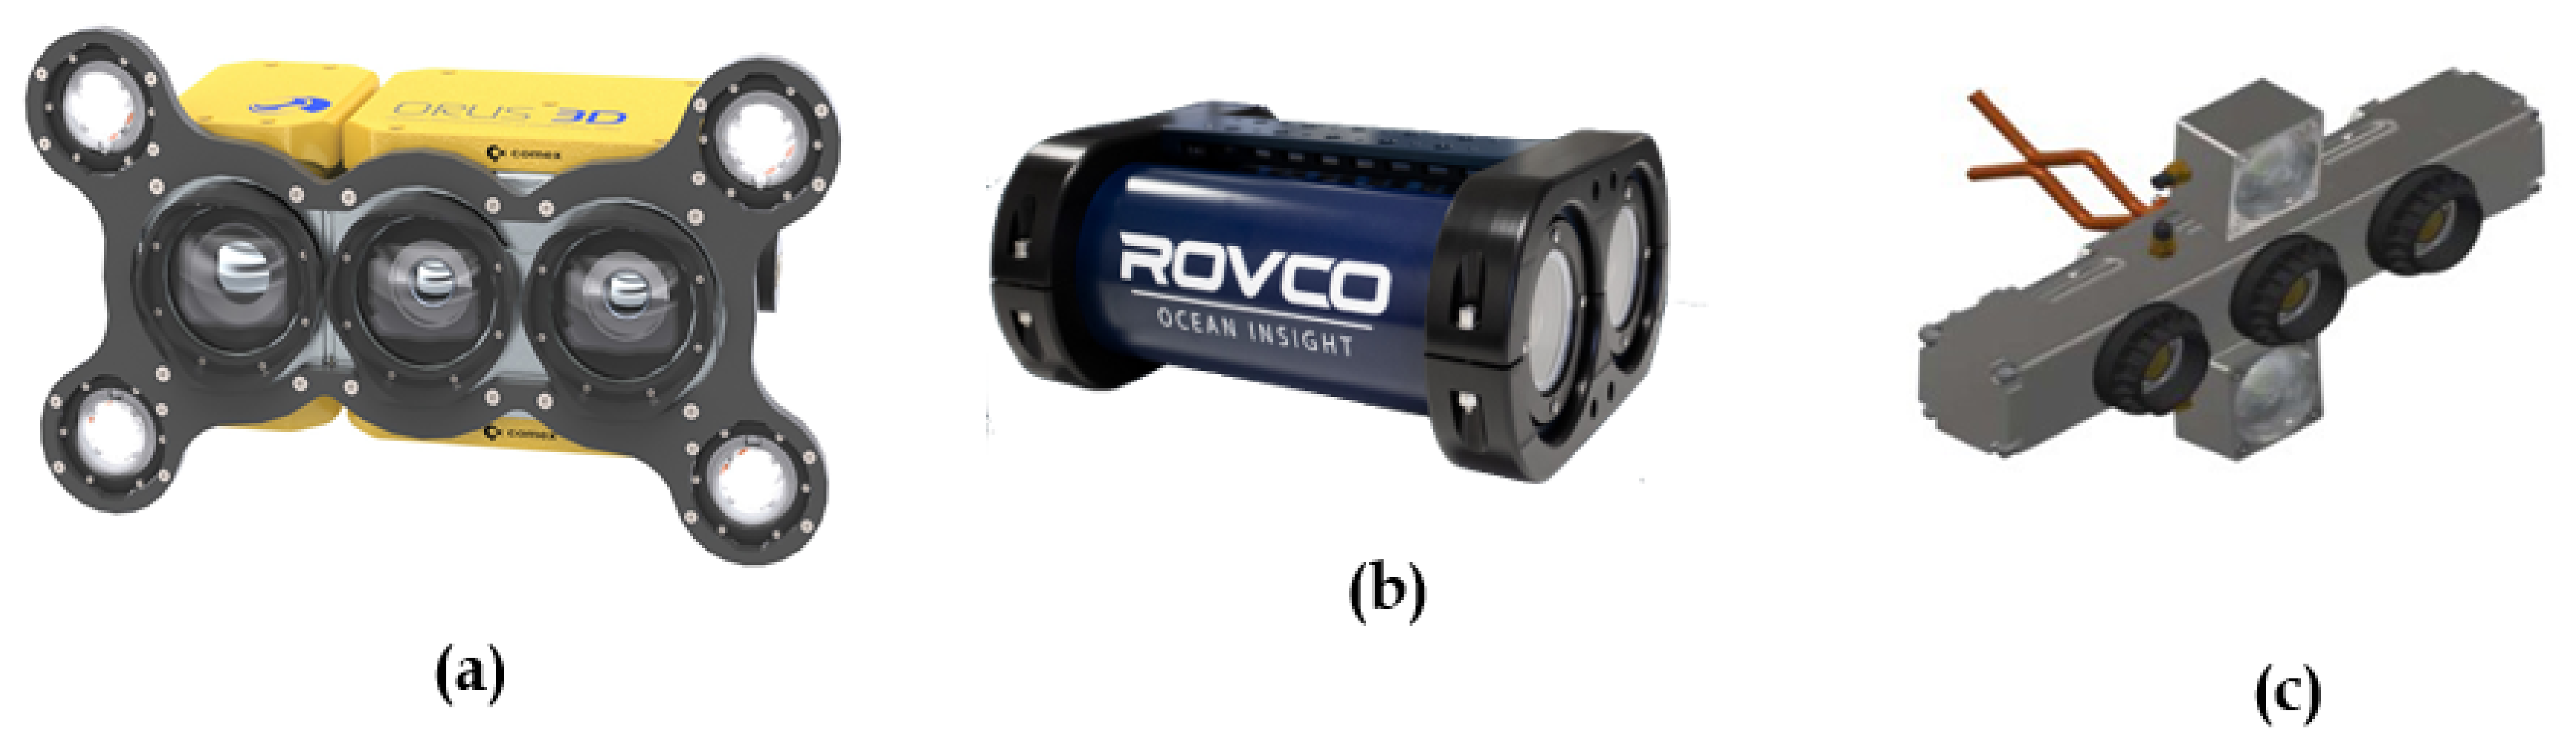
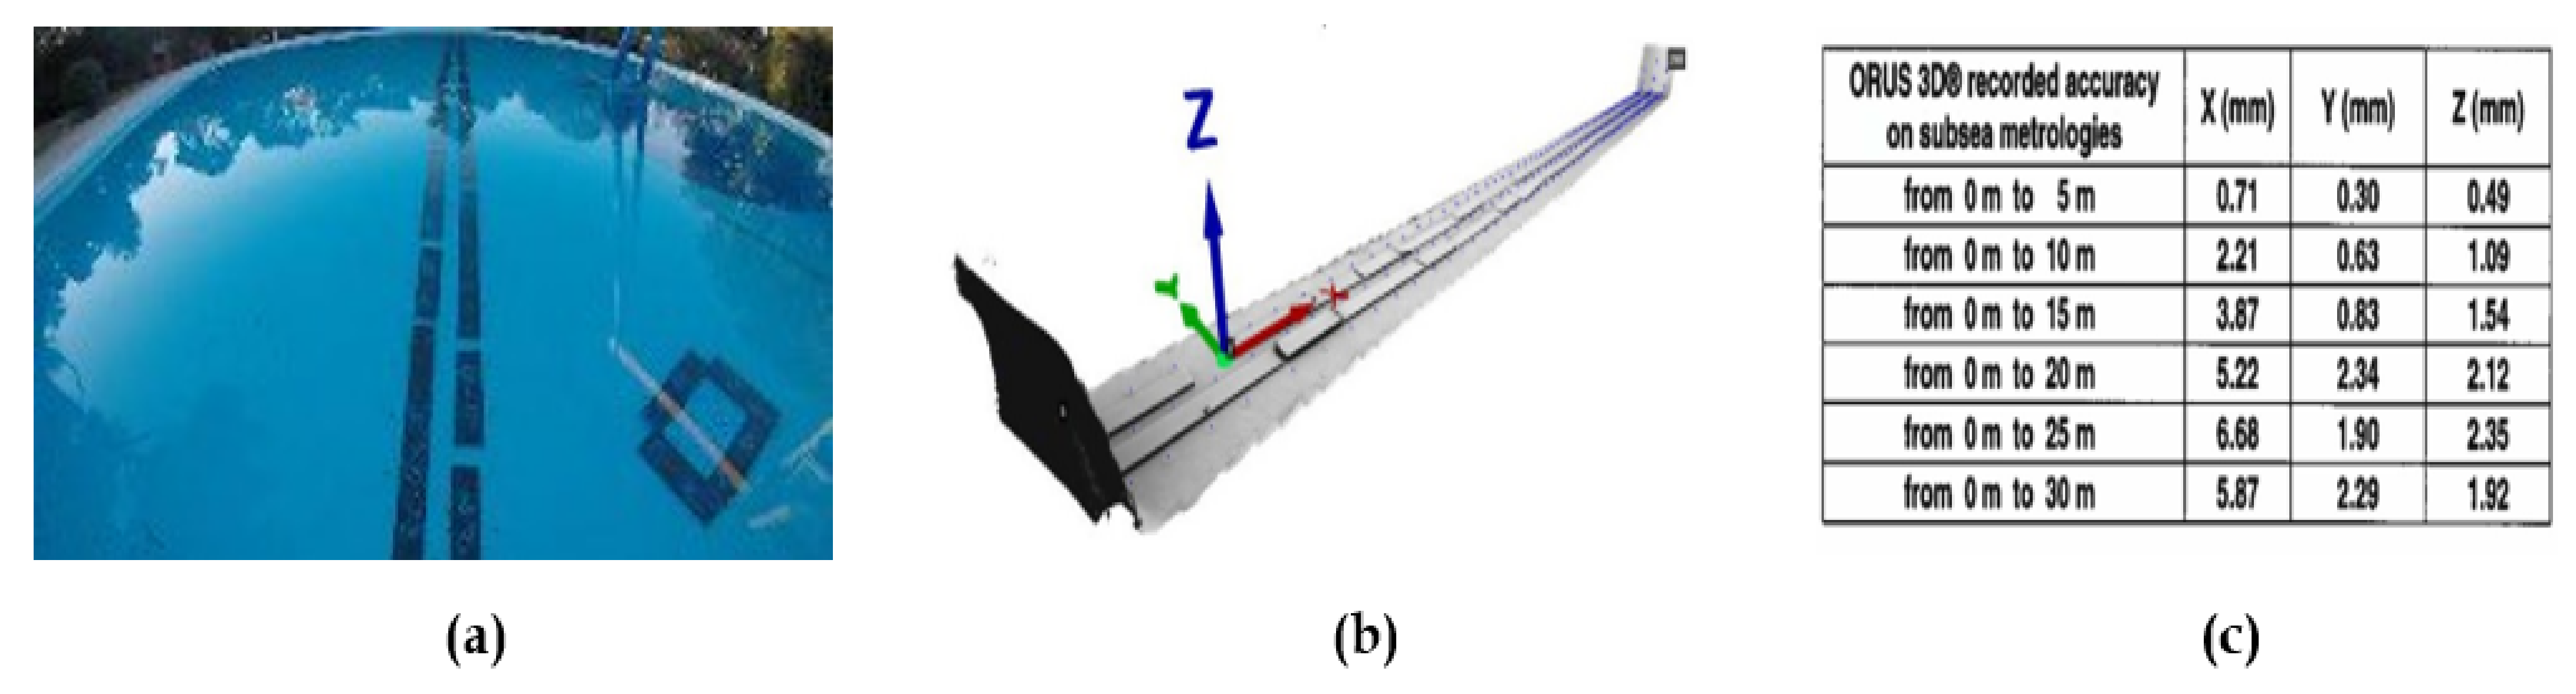
Table 1.
Minimum bathymetry standards for safety of navigation hydrographic surveys (To be read in conjunction with the full text). Extracted from the sixth edition of IHO S-44 [10].
Table 1.
Minimum bathymetry standards for safety of navigation hydrographic surveys (To be read in conjunction with the full text). Extracted from the sixth edition of IHO S-44 [10].
| IHO Reference | Criteria | Order 2 | Order 1b | Order 1a | Special Order | Exclusive Order |
|---|---|---|---|---|---|---|
| Chapter 1 | Area description (Generally) | Areas where a general description of the sea floor is consider adequate. | Areas where underkeel clearance is not considered to be an issue for the type of surface shipping expected to transit the area. | Areas where underkeel clearance is considered not to be critical but features of concern to surface shipping may exist | Areas where underkeel clearance is critical | Areas where there is strict minimum underkeel clearance and maneuverability criteria |
| Chapter 2.6 | Depth THU [m] + [% of Depth] | 20 m + 10% of depth | 5 m + 5% of depth | 5 m + 5% of depth | 2 m | 1 m |
| Chapter 2.6 Chapter 3.2 Chapter 3.2.3 | Depth TVU (a)[m] and (b) | a = 1.0 m b = 0.023 | a = 0.5 m b = 0.013 | a = 0.5 m b = 0.013 | a = 0.25 m b = 0.0075 | a = 0.15 m b = 0.0075 |
| Chapter 3.3 | Feature Detection [m] or [% of Depth] | Not specified | Not specified | Cubic features >2 m, in depth down to 40 m; 10% of depth beyond 40 m | Cubic features >1 m | Cubic features >0.5 m |
| Chapter 3.4 | Feature Search [%] | Recommended but not Required | Recommended but Not Required | 100% | 100% | 200% |
| Chapter 3.5 | Bathymetric Coverage [%] | 5% | 5% | 0% | 100% | 200% |
| Method | Description | Sampling Scale | Coverage (km2·h−1) | Resolution Horizontal (m) | Distance from Object | Technology | Comments | Scale Category | Ref to IHO S-44 Standard | |||
|---|---|---|---|---|---|---|---|---|---|---|---|---|
| Very Small | Medium | Large | Very Large | |||||||||
| Satellite sensors | Satellite derived bathymetry: Multispectral-Photogrammetry | 1:100,000 to 1:30,000 | >1000 | 1000 to 10 | Alt Approx 200 km | Optic | Depending of technology and environmental conditions: sea surface, water turbidity | X | 2 to 1b | |||
| Airborne sensors | Airborne LiDAR Bathymetry (ALB) Aerial two media photogrammetry | 1:30,000 to 1:5000 | >10 | 10 to 1 | Alt Approx 300 m | Optic | Depending of Technology and environmental conditions: sea surface, water turbidity | X | X | 2 to 1a | ||
| Airborne sensors | Unmanned Aerial Vehicle (UAV) Borne bathymetry LiDAR | 1:10,000 to 1:1000 | <10 | <0.1 | Alt 50–150 m | Optic | Depending of Technology and environmental conditions: sea surface, water turbidity | X | X | 2 to 1a | ||
| Hydrograph acoustic sensors | Low frequency echosounder: single and multibeam, low frequency side scan sonar | 1:10,000 to 1:1000 | 5 to 100 | 100 to 1 | 100 m to 10,000 m | Acoustic | Large footprint due to large beam width | X | X | 2 to 1a | ||
| High resolution acoustic sensors | High resolution echosounder or side scan sonar, deployed from the sea surface in shallow water or embedded on underwater vehicle in deep water | 1:1000 to 1:100 | 1 to 5 | 10 to 0.01 | ×100 m | Acoustic | Angular resolution, directly function of the depth or range | X | X | 1a to special order | ||
| Visual inspection video camera | Underwater video camera | 1:100 to 1:10 | 1:100 to 1:10 | 0.1 to 0.001 | <10 m | Optic | X | X | NA | |||
| Underwater laser scanner | Ultra high resolution 3D modeling | 1:10 | <0.5 | 0.1 to 0.005 | <5 m | Optic | X | <special order | ||||
| Close range photogrammetry | Ultra high resolution 3D modeling | 1:10 | <0.5 | 0.01 to 0.001 | <5 m | Optic | X | <special order | ||||
Table 3.
An overview of optical survey solutions applicable to industry’s seabed mapping needs (Digital Terrain Model (DTM) and measurements requirements).
Table 3.
An overview of optical survey solutions applicable to industry’s seabed mapping needs (Digital Terrain Model (DTM) and measurements requirements).
| Type of Survey | Usual Methods | Resolution Spec. | Accuracy Spec. (°) | Optical Survey Solution |
|---|---|---|---|---|
| O and G Exploration—A general geomorphology map of the area is required to identify the sites of interest where drilling will be carried out. | ||||
| EBS | MBES and SSS Video transects | 1 to 10 m | 1 to 10 m | 3D reconstruction is not mandatory but Laser scanning or photogrammetry on specific area of interest for habitat monitoring could be useful |
| O and G Appraisal—It requires high-resolution “seabed survey” to determine its topology and identify potential geological constraints to the design of the field. It also includes “Debris” and “Route” surveys to detect any man-made or natural obstacle. UXO surveys can be also required. | ||||
| Seabed survey | MBES and SSS and Video survey | 0.50 m | 0.1 m | 3D reconstruction is not mandatory. Laser scanning or photogrammetry for object recognition could be useful |
| O and G Development—It includes a pre-lay survey along the pipeline or cable route prior to the installation. The deployment operation is monitored and possible damages are surveyed. The tie-in operation consists in connecting all the elements of the field. After the installation and before commissioning, an as-laid survey is carried out to verify compliance with the specifications. | ||||
| Pre-lay survey | MBES and SSS and Video survey | 0.1 to 0.5 m | 0.1 m | 3D reconstruction is not mandatory but Laser scanning or photogrammetry or object recognition could be useful |
| UXO survey | MBES-SSS-Gradiometer | 0.1 m | 0.01 to 0.1 m | 3D reconstruction is not mandatory. Laser scanning or photogrammetry for object recognition could be useful |
| Spool and jumpers metrology | Acoustic LBL-Inertial-taut wire-Photogrammetry | 0.001 to 0.01 m | 0.05 to 0.15 m/0.5 to 1° | Laser scanning coupled to an accurate Navigation system-Close range photogrammetry using reference or non-contact markers (suitable calibration procedure) |
| As laid/As built surveys | MBES on a ROV; Pipetracker; INS-DVL positioning system | 0.1 m | 0.01 to 0.1 m | Laser scanning-Close range photogrammetry |
| Out of Straightness (OOS) survey | MBES on a ROV; INS-DVL positioning system | 0.01 m | +/−0.1 m over 100 m-Precision better than 2 m | Laser scanning coupled to an accurate navigation system-Close range photogrammetry and fiducial markers |
| O and G Production—Inspection, maintenance, and repair (IMR) are key components of integrity management system. IMR surveys concern all the equipment installed on the seabed and are planned on the base of a risk assessment (risk based inspection, RBI). In-line, i.e., internal, and external verifications are scheduled. | ||||
| IMR-Dimensional Control | Video inspection | 0.001 m | 1/1000 relative to measured distance | Close range photogrammetry—High resolution laser scanning |
| O and G Decommissioning—It is prepared with an on-sire survey to check the state of the installations and establish tools and procedures for the disconnection and salvage operations. After removal of the structures from the bottom, a survey is realised to verify the absence of residues and assess the ecological status of the area. | ||||
| IMR-Dimensional Control | Video inspection | 0.001 m | 1/1000 relative to measured distance | Close range photogrammetry—High resolution laser scanning |
Table 4.
Typical metrology tolerances (IMCA, 2017 [68]).
Table 4.
Typical metrology tolerances (IMCA, 2017 [68]).
| Relative Distance (mm) | Relative Angle (Degrees) | ||||
|---|---|---|---|---|---|
| X | Y | Z | Roll | Pitch | Heading |
| 50 to 150 | 0.5 to 1.0 | ||||
Table 5.
Inspection categories, from DNV [74].
Table 5.
Inspection categories, from DNV [74].
| Method | Tools | Description |
|---|---|---|
| GVI | ROV or divers. | General Visual Inspection. External condition threats to the pipeline including coating/insulation damage, anode condition, leaks etc. |
| GVI XTD | Workclass ROV; 3-view digital video (left/center/right), digital camera, seabed transverse profiles (such as side scan or multi-beam sonar), CP (gradient and stab) and Pipe Tracker (depth of burial). | Extended Visual Pipeline survey giving detailed span profiles and depth of burial. Higher degree of precision with respect to positioning pertaining to the pipeline KP system. |
| CVI | Diver or workclass ROV | Close Visual Inspection. After cleaning step. The Establish a detailed inspection of an area of specific interest. |
| HPS | Workclass pipeline ROV, in conjunction with high accuracy calibrated positional equipment. | High Precision Survey. Determine the absolute position and relative year to year lateral movement of the pipeline on the seabed. |
| ILI | In-Line Inspection tool. | In-Line Inspection. Intelligent pigging of the pipeline. Utilizing various non-destructive testing (NDT) methods to measure continuous end to end pipeline wall thickness loss or pipeline anomalies/defects. |
| Monitoring | Following up of e.g., corrosion probes, impressed current system, process parameters, fluid composition, chemical injection, and monitoring of loads/stresses/strains/displacements or vibrations. | |
| Testing | System or function testing of equipment or control system. |
Table 6.
A panel of subsea photogrammetry commercial solutions.
| Company Name | Product | Method | Range (m) | Max Depth Rate (m) | Resolution (mm) | Accuracy | Real Time Processing | Applications, Track Record & Qualification g |
|---|---|---|---|---|---|---|---|---|
| COMEX SA | ORUS3D | Photogrammetry Trifocal sensor | 0.5–3 | 6000 | 0.1 | 1/1000 | Yes-embedded | IMR, DIMCON, Spool metrology, OOS, Pipe inspection, Mooring line Inspection-BV Marine certification |
| ZUPT | 3D RECON | Photogrammetry Stereo and Inertial & IMU | N.A. | N.A. | N.A. | 1/1000 | Yes-embedded | IMR, DIMCON, Under Hull Positioning, Augmented Reality, Spool metrology, Pipe inspection, Mooring line inspection |
| ROVCO | SubSLAM X2 | Photogrammetry Stereo | N.A. | 1000 | N.A. | 0.7/1000 | Yes-embedded | IMR, DIMCON, Spool metrology, Pipe inspection, Mooring line inspection |
| MCS Oil | Photo Realistic 3D Cloud (PRC) | Photogrammetry Stereo | N.A. | 1000 | N.A. | 1/1000 | No | IMR-Pipeline Reassessment and Life extension, Spool metrology, OOS, Pipe inspection, Mooring line inspection, Umbilical inspection, Subsea decommissioning survey, Mathematical volume Analysis for As-Laid As-Built and Pre Post trenching |
Publisher’s Note: MDPI stays neutral with regard to jurisdictional claims in published maps and institutional affiliations. |
© 2021 by the authors. Licensee MDPI, Basel, Switzerland. This article is an open access article distributed under the terms and conditions of the Creative Commons Attribution (CC BY) license (https://creativecommons.org/licenses/by/4.0/).
Share and Cite
MDPI and ACS Style
Chemisky, B.; Menna, F.; Nocerino, E.; Drap, P. Underwater Survey for Oil and Gas Industry: A Review of Close Range Optical Methods. Remote Sens. 2021, 13, 2789. https://0-doi-org.brum.beds.ac.uk/10.3390/rs13142789
AMA Style
Chemisky B, Menna F, Nocerino E, Drap P. Underwater Survey for Oil and Gas Industry: A Review of Close Range Optical Methods. Remote Sensing. 2021; 13(14):2789. https://0-doi-org.brum.beds.ac.uk/10.3390/rs13142789
Chicago/Turabian StyleChemisky, Bertrand, Fabio Menna, Erica Nocerino, and Pierre Drap. 2021. "Underwater Survey for Oil and Gas Industry: A Review of Close Range Optical Methods" Remote Sensing 13, no. 14: 2789. https://0-doi-org.brum.beds.ac.uk/10.3390/rs13142789
Note that from the first issue of 2016, this journal uses article numbers instead of page numbers. See further details here.