Article

Building Multi-Feature Fusion Refined Network for Building Extraction from High-Resolution Remote Sensing Images

1
School of Geosciences, Yangtze University, Wuhan 430100, China
2
Beijing Key Laboratory of Urban Spatial Information Engineering, Beijing 100045, China
3
Hunan Provincial Key Laboratory of Geo-Information Engineering in Surveying, Mapping and Remote Sensing, Hunan University of Science and Technology, Xiangtan 411201, China
4
Aerospace Information Research Institute, Chinese Academy of Sciences, Beijing 100094, China
5
Key Laboratory of Earth Observation of Hainan Province, Sanya 572029, China
*
Author to whom correspondence should be addressed.
Remote Sens. 2021, 13(14), 2794; https://0-doi-org.brum.beds.ac.uk/10.3390/rs13142794
Submission received: 24 May 2021 / Revised: 7 July 2021 / Accepted: 14 July 2021 / Published: 16 July 2021
(This article belongs to the Special Issue Techniques and Applications of UAV-Based Photogrammetric 3D Mapping)

Abstract

:
Deep learning approaches have been widely used in building automatic extraction tasks and have made great progress in recent years. However, the missing detection and wrong detection causing by spectrum confusion is still a great challenge. The existing fully convolutional networks (FCNs) cannot effectively distinguish whether the feature differences are from one building or the building and its adjacent non-building objects. In order to overcome the limitations, a building multi-feature fusion refined network (BMFR-Net) was presented in this paper to extract buildings accurately and completely. BMFR-Net is based on an encoding and decoding structure, mainly consisting of two parts: the continuous atrous convolution pyramid (CACP) module and the multiscale output fusion constraint (MOFC) structure. The CACP module is positioned at the end of the contracting path and it effectively minimizes the loss of effective information in multiscale feature extraction and fusion by using parallel continuous small-scale atrous convolution. To improve the ability to aggregate semantic information from the context, the MOFC structure performs predictive output at each stage of the expanding path and integrates the results into the network. Furthermore, the multilevel joint weighted loss function effectively updates parameters well away from the output layer, enhancing the learning capacity of the network for low-level abstract features. The experimental results demonstrate that the proposed BMFR-Net outperforms the other five state-of-the-art approaches in both visual interpretation and quantitative evaluation.

Graphical Abstract

1. Introduction

The building is one of the most important artificial objects. Accurately and automatically extracting buildings from high-resolution remote sensing images is of great significance in many aspects, such as urban planning, map data updating, emergency response, etc. [1,2,3]. In recent years, with the rapid development of sensor technology and unmanned aerial vehicle (UAV) technology, many high-resolution remote sensing images have been produced widely. The high-resolution remote sensing images can provide more fine detail features, increasing the challenge of building extraction. On the one hand, the diverse roof materials of buildings are represented in detail, leading to undetected building results. On the other hand, the similar difference between a building and its adjacent non-building objects results in some wrong detection. These difficulties are the primary factor influencing the building results that can be used in realistic applications. As a result, accurately and automatically extracting buildings from high-resolution remote sensing images is a challenging but crucial task [4].
Currently, the conventional method of feature extraction based on artificial design has gradually given way to the neural network method based on deep learning technology for extracting buildings from VHR images. The traditional extraction methods mainly use the subjective experience to design and extract typical building features in remote sensing images [5,6] and then combine with some ways of image processing and analysis to improve the accuracy of building extraction [7,8]. However, their performance is still severely limited by the capability of feature representation. Therefore, using the neural network to automatically extract high and low dimension image features and identify them at the pixel level is one of the most famous building extraction approaches.
With the development of computer vision technology based on deep learning, the convolutional neural networks (CNNs) are gradually applied to remote sensing image classification [9,10,11] or ground object detection [12,13]. Long et al. [14] first designed the fully convolutional network (FCN) in 2015, using the convolution layer to replace the fully connected layer of the CNNs. It has an end-to-end pixel-level recognition capability and makes the semantic segmentation process easier to complete. Since then, the emphasis of research on building extraction from remote sensing images using deep learning technologies has shifted from CNNs to FCN [15,16,17,18]. In the optimization research of the building extraction method based on FCN, in order to improve the accuracy and integrity of building detection, the work mainly focuses on three aspects. The first is model improvement, which mainly focuses on optimizing the internal structure of an existing classic network to increase the performance of the model [19,20]. The second is data improvement, which consists of establishing a high-quality and high-precision sample set, increasing sample data in the study field, and realizing sample data improvement by fusing multisource data like DSM [21,22]. The third is classifier synthesis, which introduces the conditional random field and attention mechanism to improve classification accuracy [23,24]. While the encoding and decoding structure in FCN can realize an end-to-end network structure, the original image information lost during the encoding phase is difficult to recover during the decoding phase, resulting in the fuzzy edges of building extraction results, a loss of building details, and building details a reduction in extraction accuracy. As a result, the improvement of FCN models (Supplementary Materials) primarily focuses on two types: improving the internal structure of FCN to make full use of multiscale features and optimizing the upsampling stage of FCN.
In the category of improving the internal structure of FCN, many researchers enhance the network performance by enhancing the multiscale feature extraction fusion ability of the model. Researchers realized the detection of objects of various scales in the early days by constructing the inception structure [25]. However, since it uses the common convolution operation, multiple branch convolution can result in a lot of extra calculations. Zhao et al. [26] introduced a pyramid pooling module (PPM) to achieve multiscale feature fusion. They first used the multiscale pooling operation to get the pooling results of various sizes, then channel reduction and upsampling were made, and the feature maps were finally concatenated. Yu [27] et al. proposed atrous convolution by padding zero in the adjacent weights of the ordinary convolution kernel and expanding the size of the equivalent convolution kernel. The dilation rate is defined as the gap between two adjacent effective weights. Chen et al. [28] first proposed the atrous spatial pyramid pooling (ASPP) module in DeepLabv2 based on the idea of atrous convolution. The ASPP module captures the features of different scale objects by parallel multiple atrous convolutions with different dilation rates and realizes the fusion by connecting them. Subsequently, the PPM and ASPP module are widely used in building extraction tasks [29,30,31]. However, the aforementioned multiscale feature extraction fusion methods generally use large-scale dilation rates and pooling windows to acquire a large range of image information, which typically results in the loss of effective information and decreases the completeness of buildings with variable spectral characteristics. The buildings extracted by MAP-Net [31] and BRRNet [32] cannot obtain a complete detection result under the condition of building with complex spectral characteristics, as shown in the first image in Figure 1.
In terms of the category of optimizing the upsampling stage of FCN, they provide more semantic information of a multiscale context for the upsampling stage, allowing it to recover part of the semantic information and improve the segmentation accuracy. SegNet [33] records the location information of max values in the MaxPooling operation by using the pooling indices structure and recovers it in the upsampling stage, which improves the segmentation accuracy. By fusing low-level detail information in the encoding stage with high-level semantic information in the decoding stage, Ronneberger et al. [34] proposed a U-Net network model based on the FCN structure, which enhanced the accuracy of building extraction. Since then, multiple building extraction networks based on U-Net have been created, such as ResUNet-a [35], MA-FCN [36], and U-Net-Modified [37]. Nonetheless, these networks that improve the upsampling stage usually only predict via the last layer of the network. It fails to use feature information from other levels fully. For example, multiscale semantic information from the context, including color and edge from high-level and low-level output results, cannot be aggregated. Thus, buildings with similar spectral characteristics to nearby ground objects cannot be detected accurately. Although the MA-FCN outputs at each level of the expanding path and fuses multiple output results at the end of network, the large-scale upsampling operation is not precise enough, which will integrate too much invalid information and reduce the network performance. Moreover, the existing FCNs always have a large number of parameters and a deep structure. Suppose the network is constrained only by the results of the last layer. In that case, the update range of the parameters faring away from the output layer will be significantly attenuated due to the distance, thereby weakening the semantic information of the abstract features and reducing the performance of the network. As the second image in Figure 1 shows, the spectral characteristics of a building and its adjacent ground objects are similar. The existing methods cannot effectively distinguish them and get a false detection.
Given the issues mentioned above, this paper proposes a building multi-feature fusion refined network (BMFR-Net). It takes U-Net as the main backbone, mainly including the continuous atrous convolution pyramid (CACP) module and multiscale output fusion constraint (MOFC) structure. The CACP module takes the end feature maps of the contracting path as input and realizes multiscale feature extraction and fusion by parallel continuous small scale atrous convolution, then feeds the fusion results into the subsequent expanding path. In the expansion path, the MOFC structure enhances the ability of the network to aggregate multiscale semantic information from the context by integrating the multilevel output results into the network. It constructs the multilevel joint loss constraint to update the network parameters effectively. Finally, the accurate and complete extraction of buildings is realized at the end of the network.
The main contributions of this paper include the following aspects:
(1)
The BMFR-Net is proposed to extract buildings from high-resolution remote sensing images accurately and completely. Experimental results on the Massachusetts Building Dataset [12] and WHU Building Dataset [38] shows that the BMFR-Net outperforms the other five state-of-the-art (SOTA) methods in both visual interpretation and quantitative evaluations
(2)
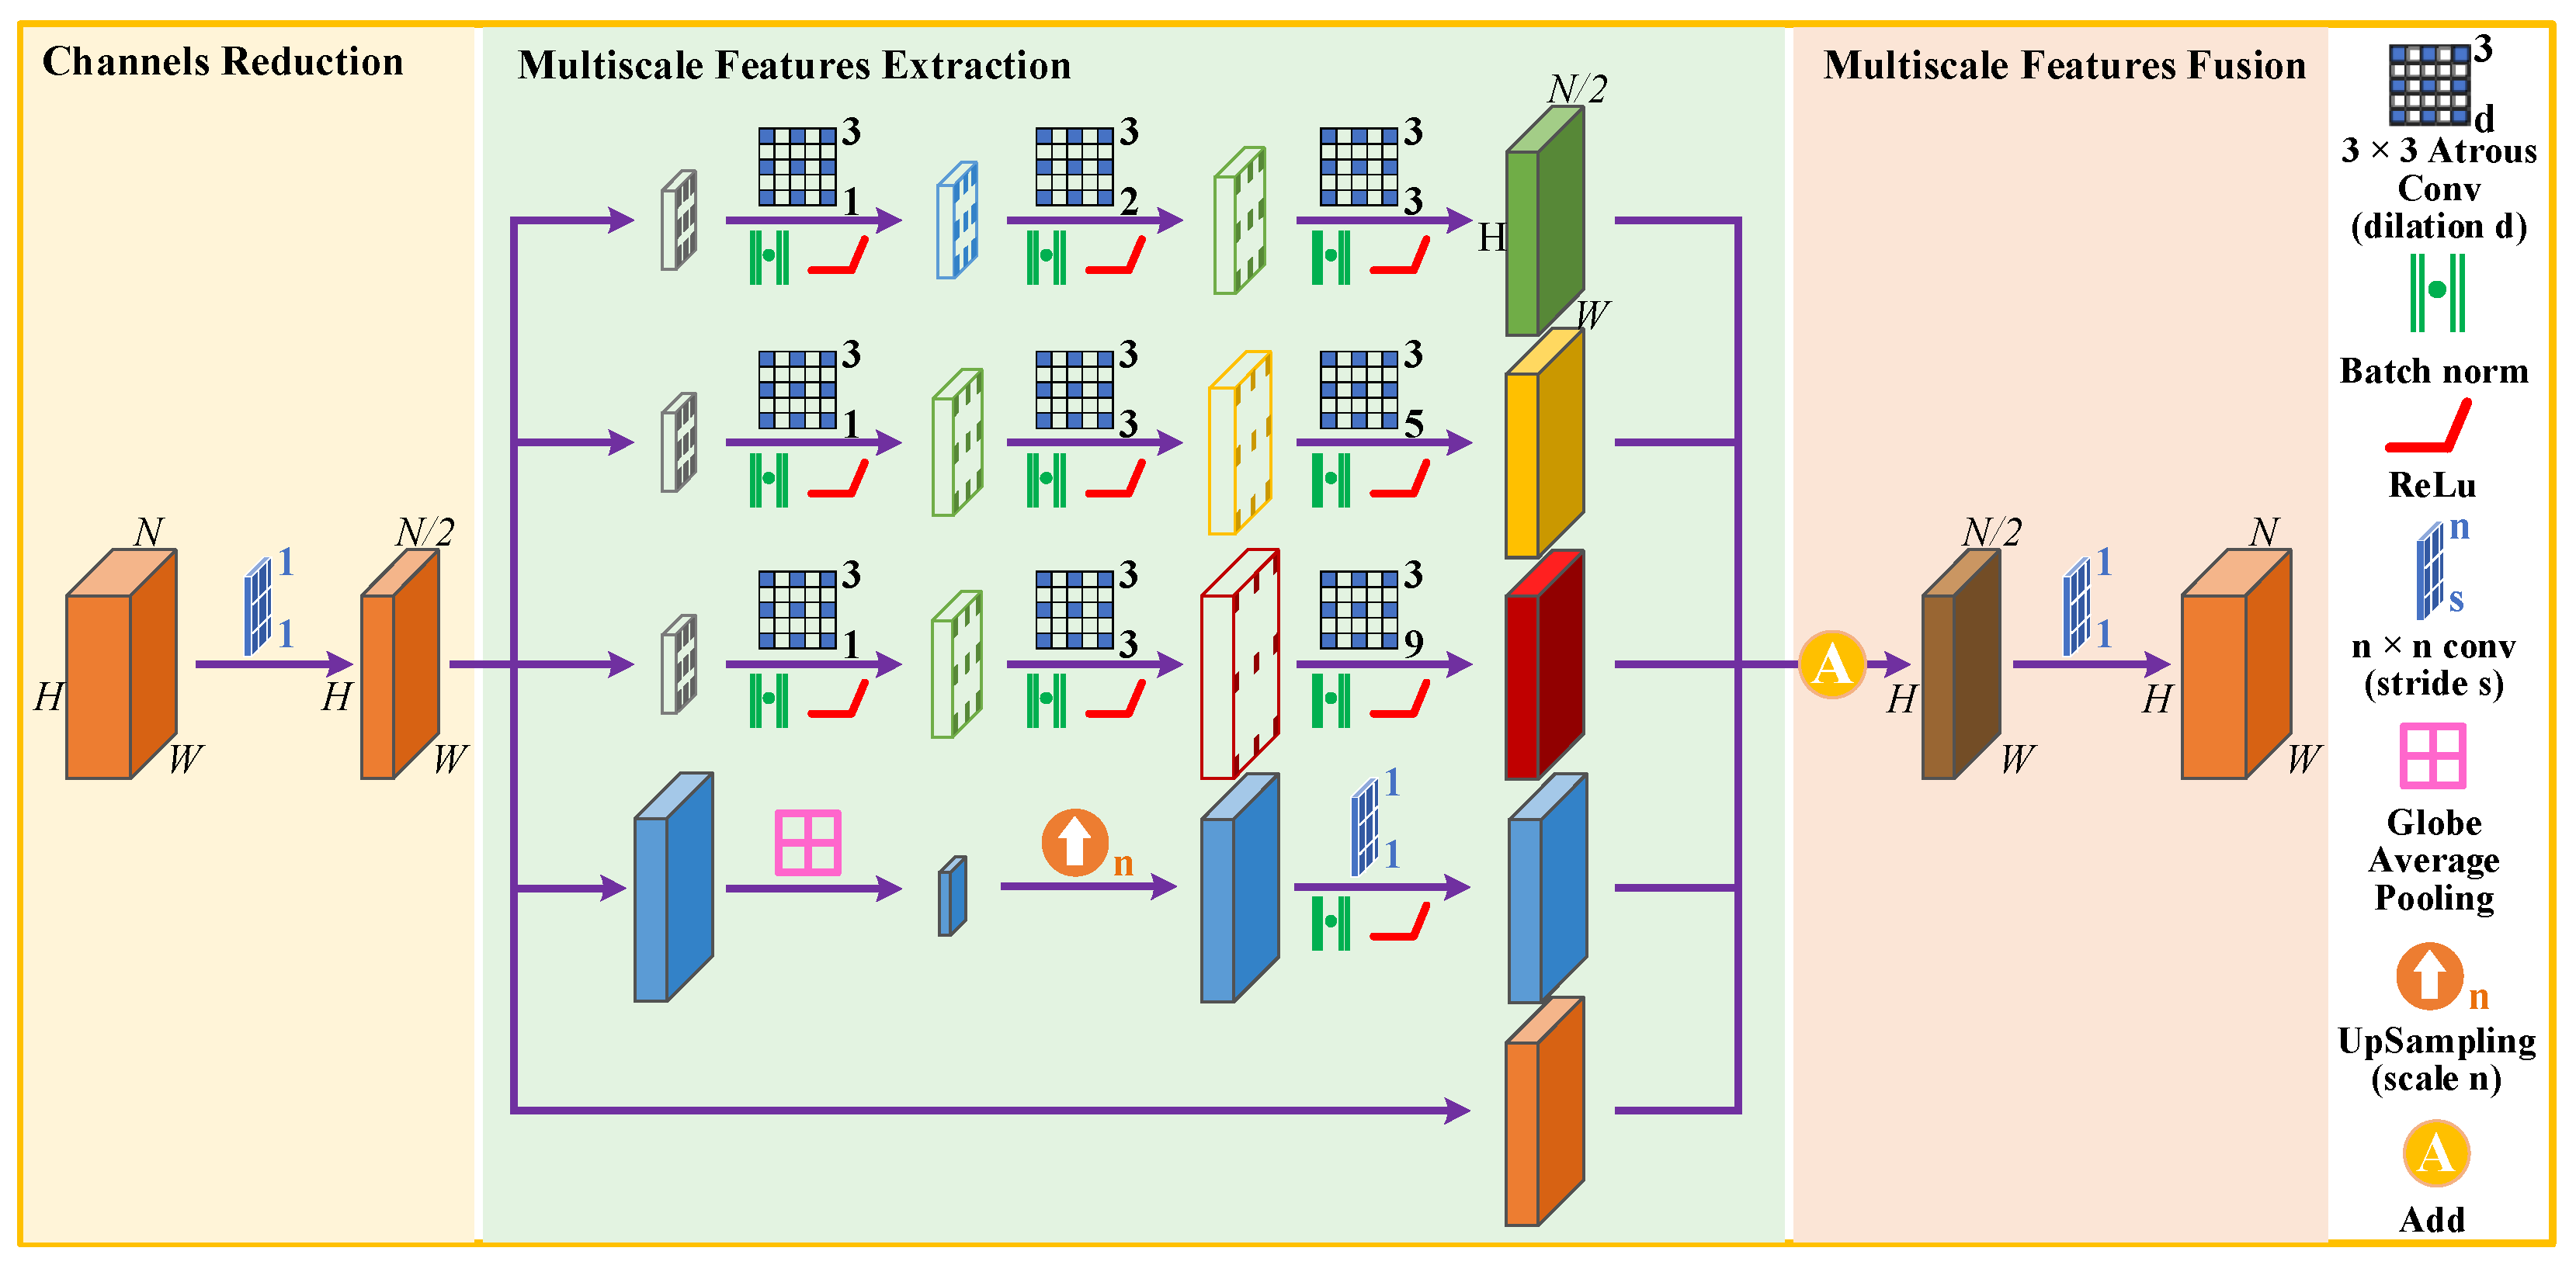
This paper designed a new multiscale feature extraction and fusion module named CACP. By paralleling the continuous small-scale atrous convolution in line with HDC constraints for multiscale feature extraction at the end of the contracting path, which can reduce the loss of effective information and enhance the continuity between local information.
(3)
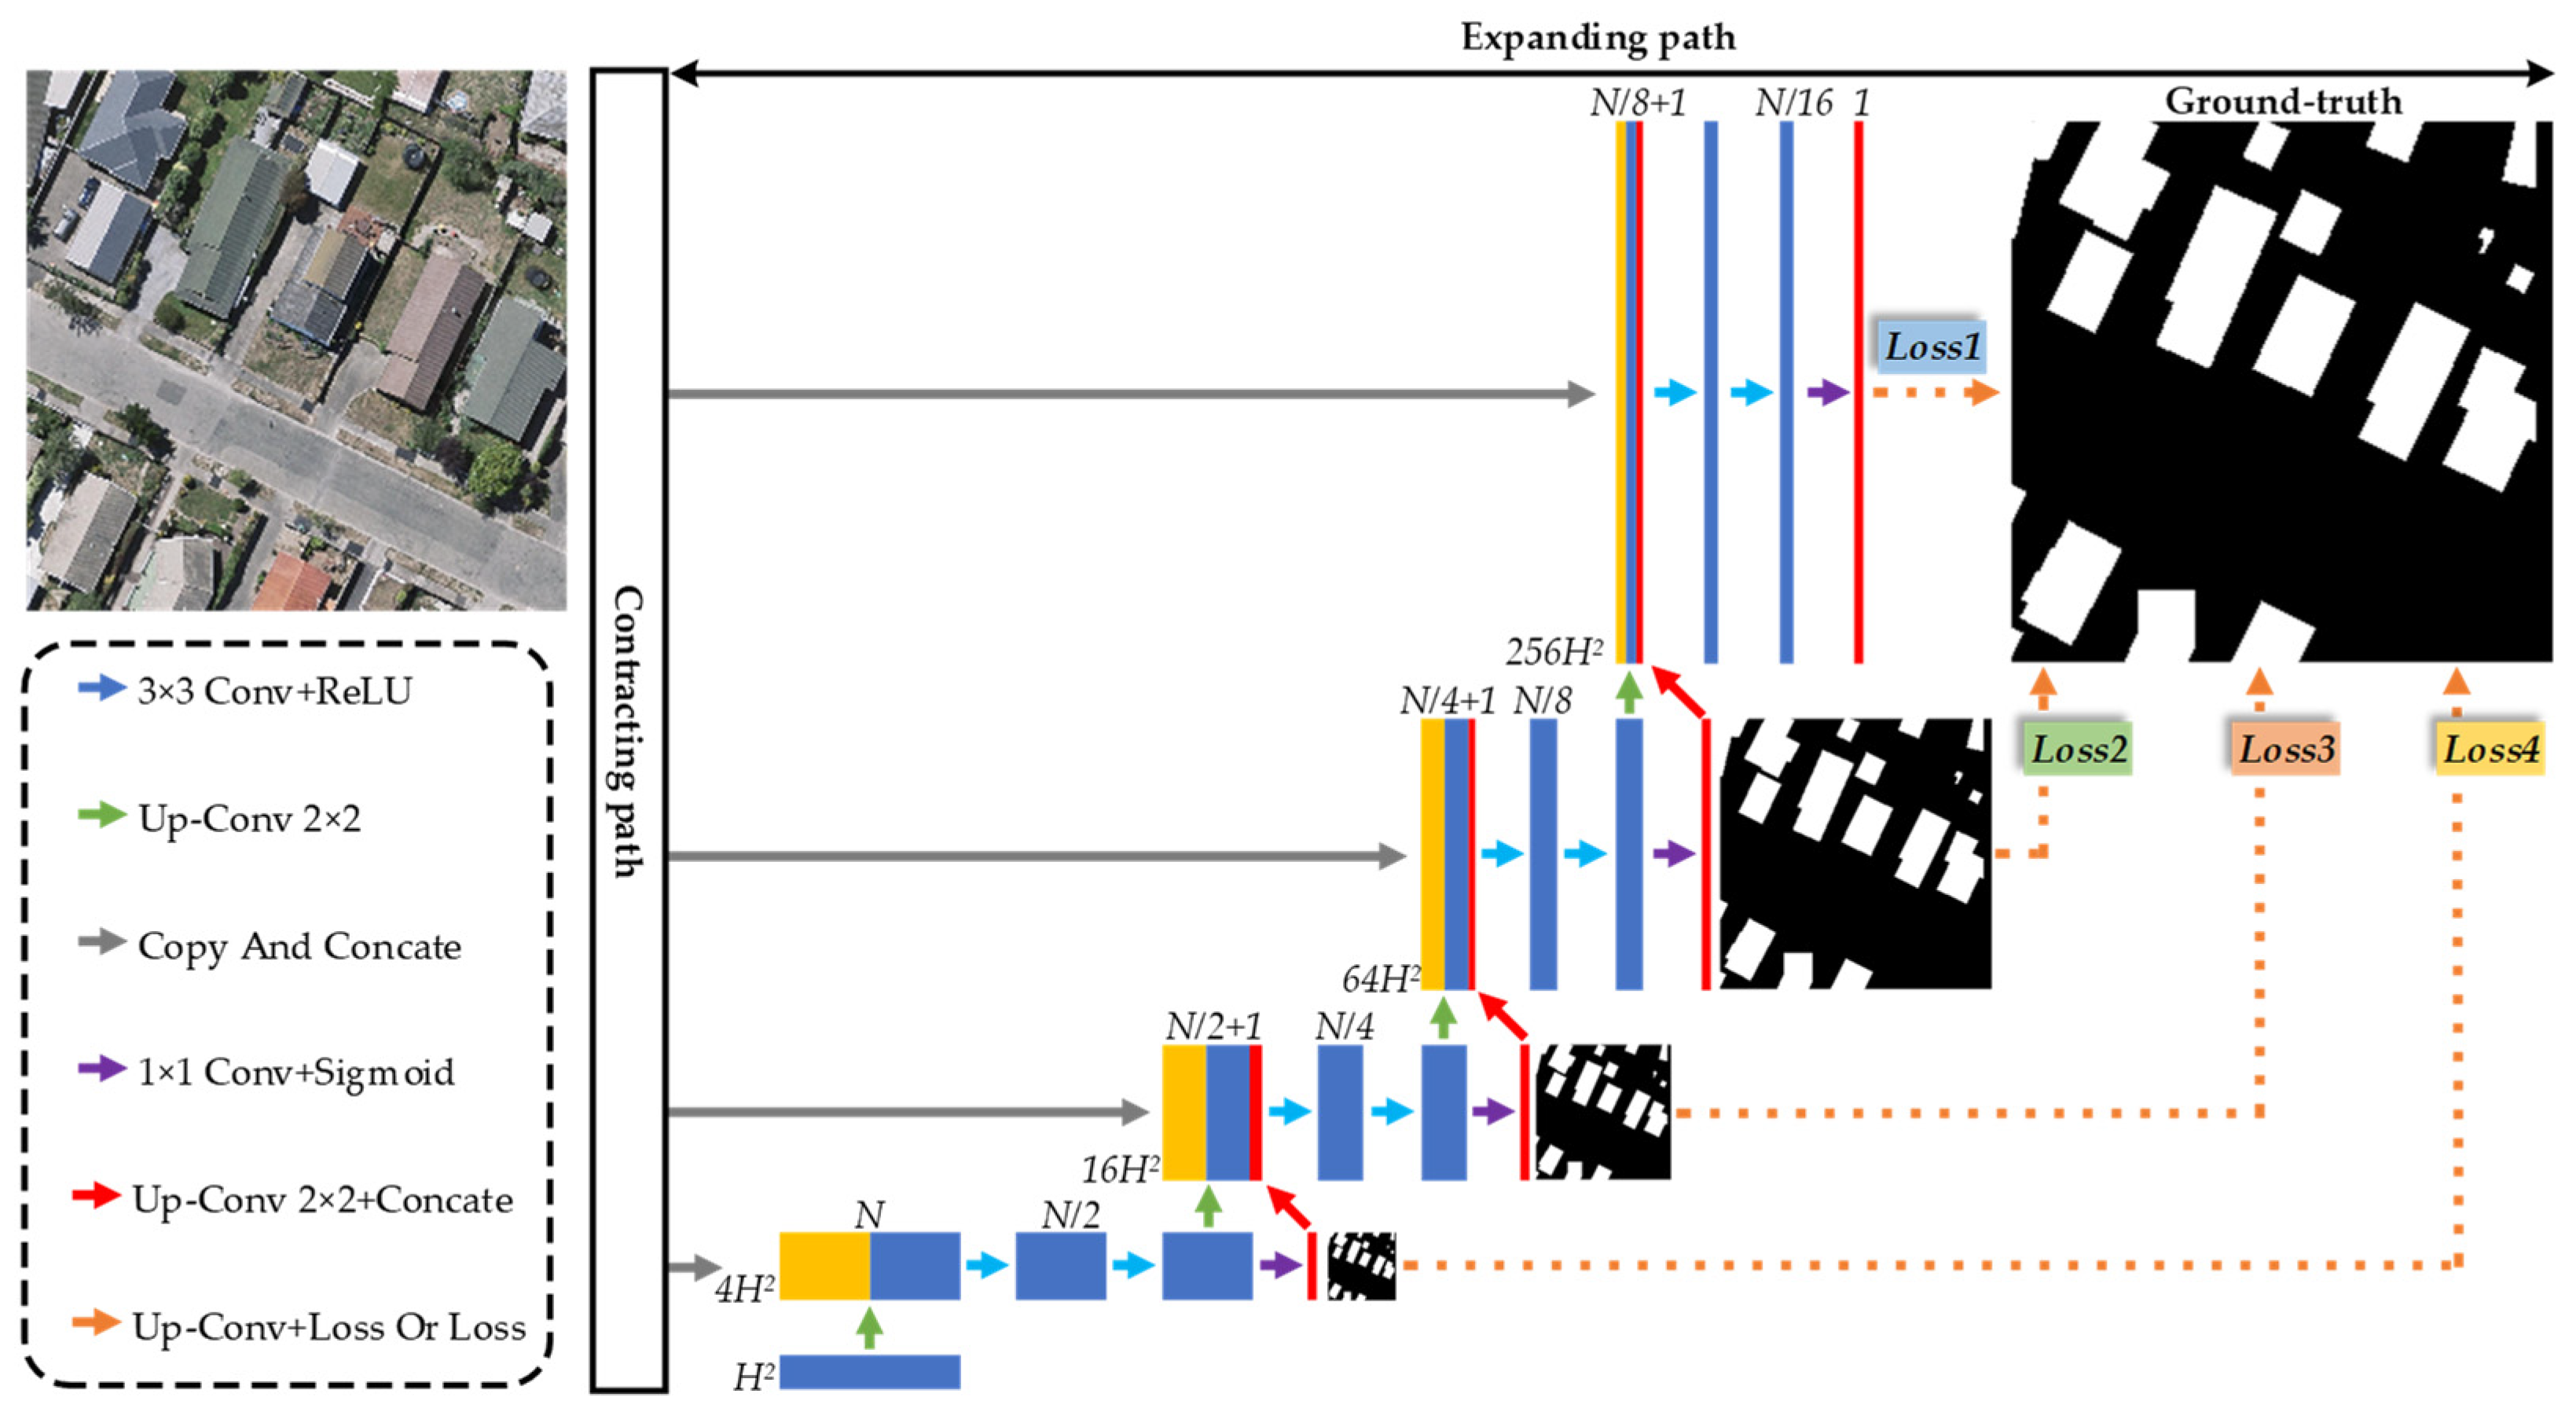
The MOFC structure is explored in this paper, which can enhance the ability of the network to aggregate multiscale semantic information from the context by integrating each layer output results into the expanding path. In addition, we use the multilevel output results to construct the multilevel joint weighted loss function and determine the best combination of weights to effectively update network parameters.
The rest of this paper is arranged as follows. In Section 2, the BMFR-Net is introduced in detail. The experimental conditions, results, and analysis are given in Section 3. The influence of each module or structure on the network performance is discussed in Section 4. Finally, Section 5 concludes the whole paper.

2. Methodology

This section mainly describes the method proposed in this paper. Firstly, we overview the overall framework of BMFR-Net in Section 2.1. Then, the CACP module and the MOFC structure in BMFR-Net are described in detail in Section 2.2 and Section 2.3. Finally, in Section 2.4, the multilevel joint weighted loss function is introduced.

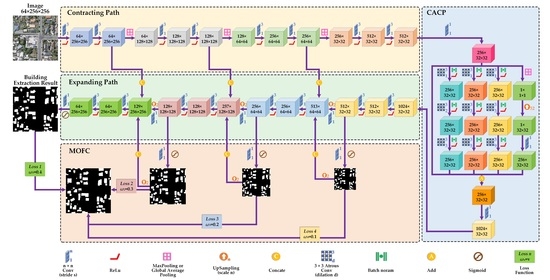
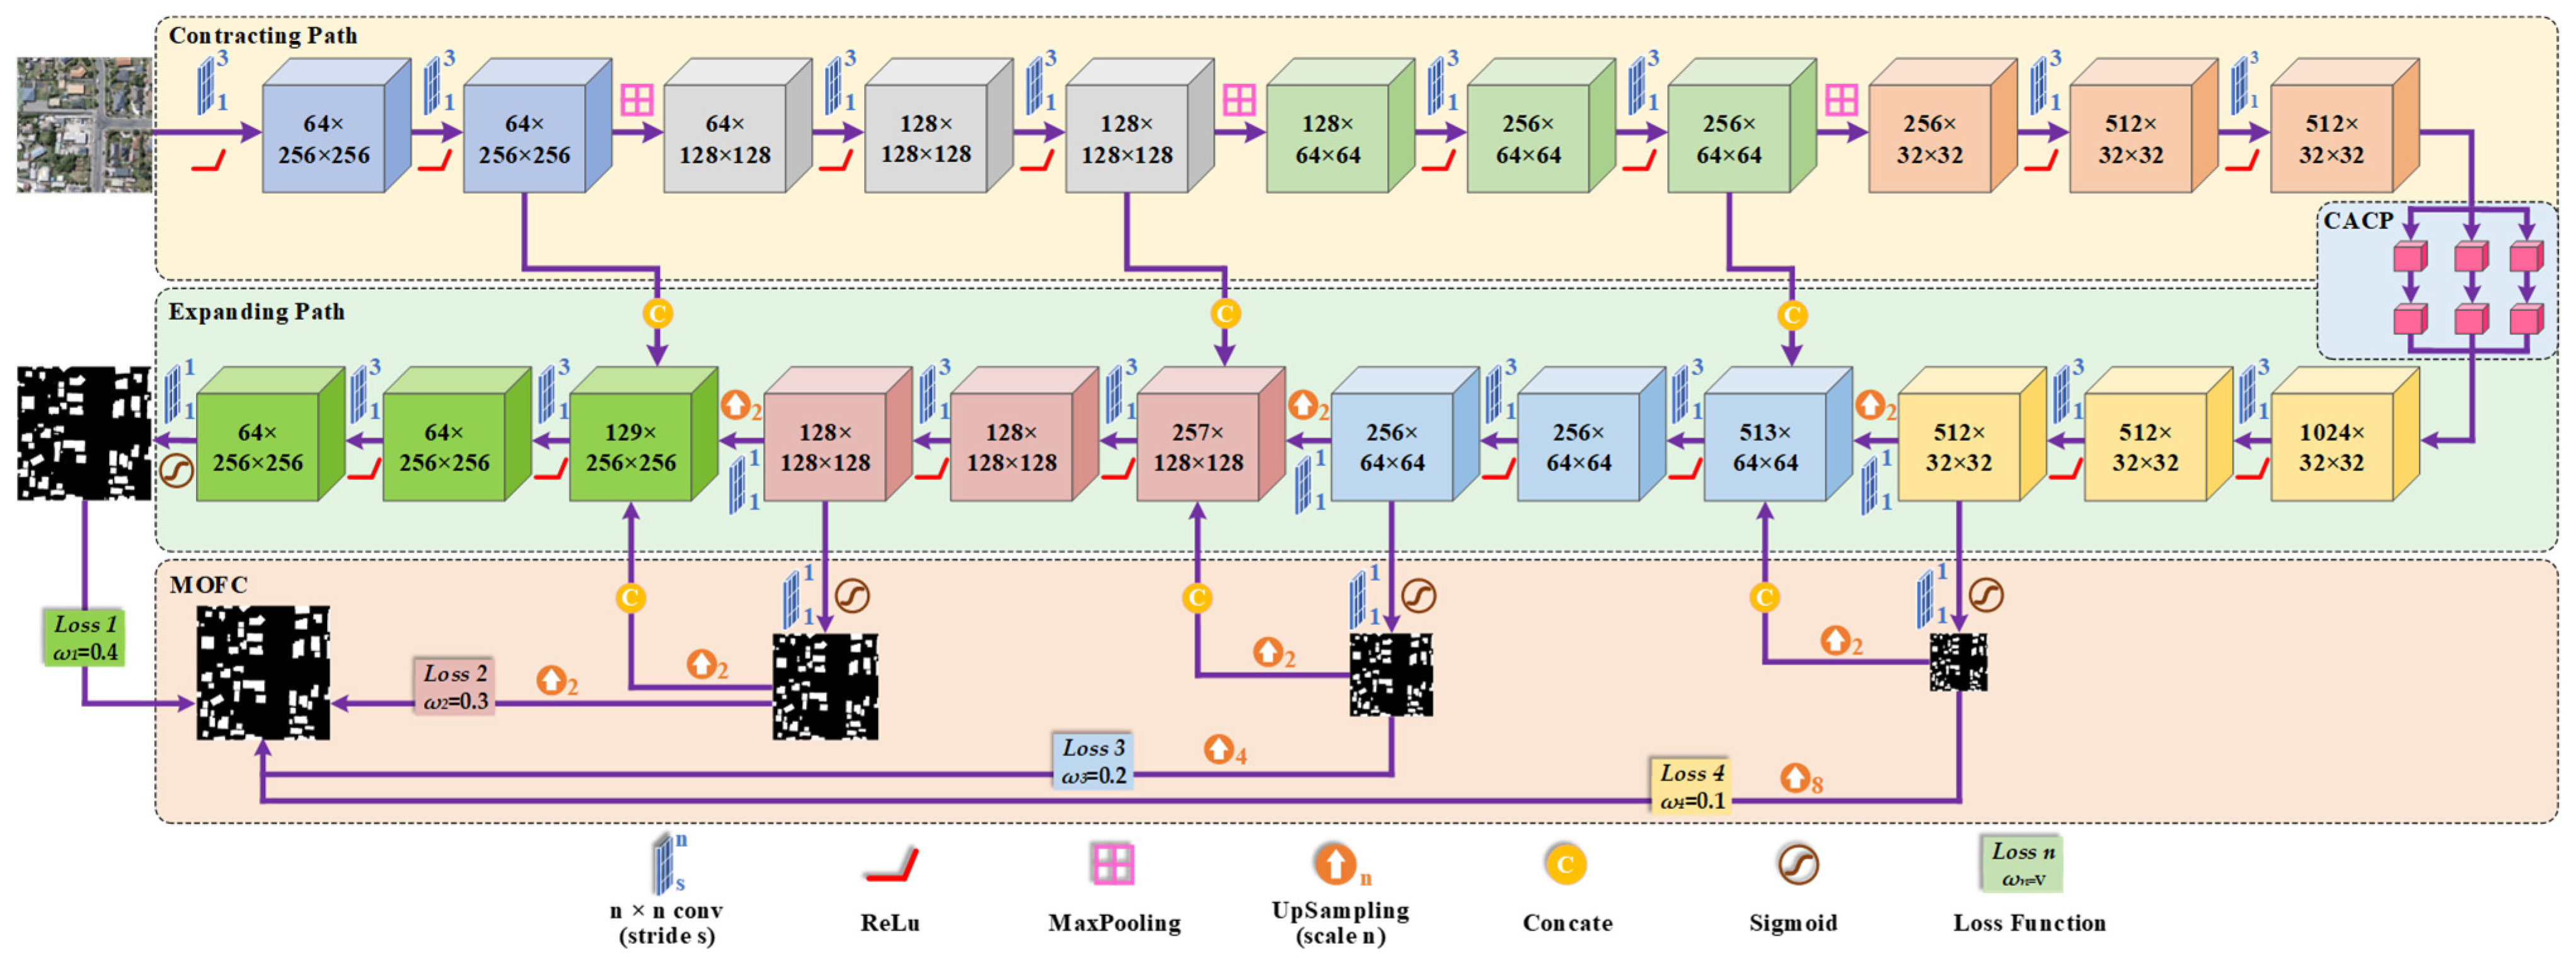
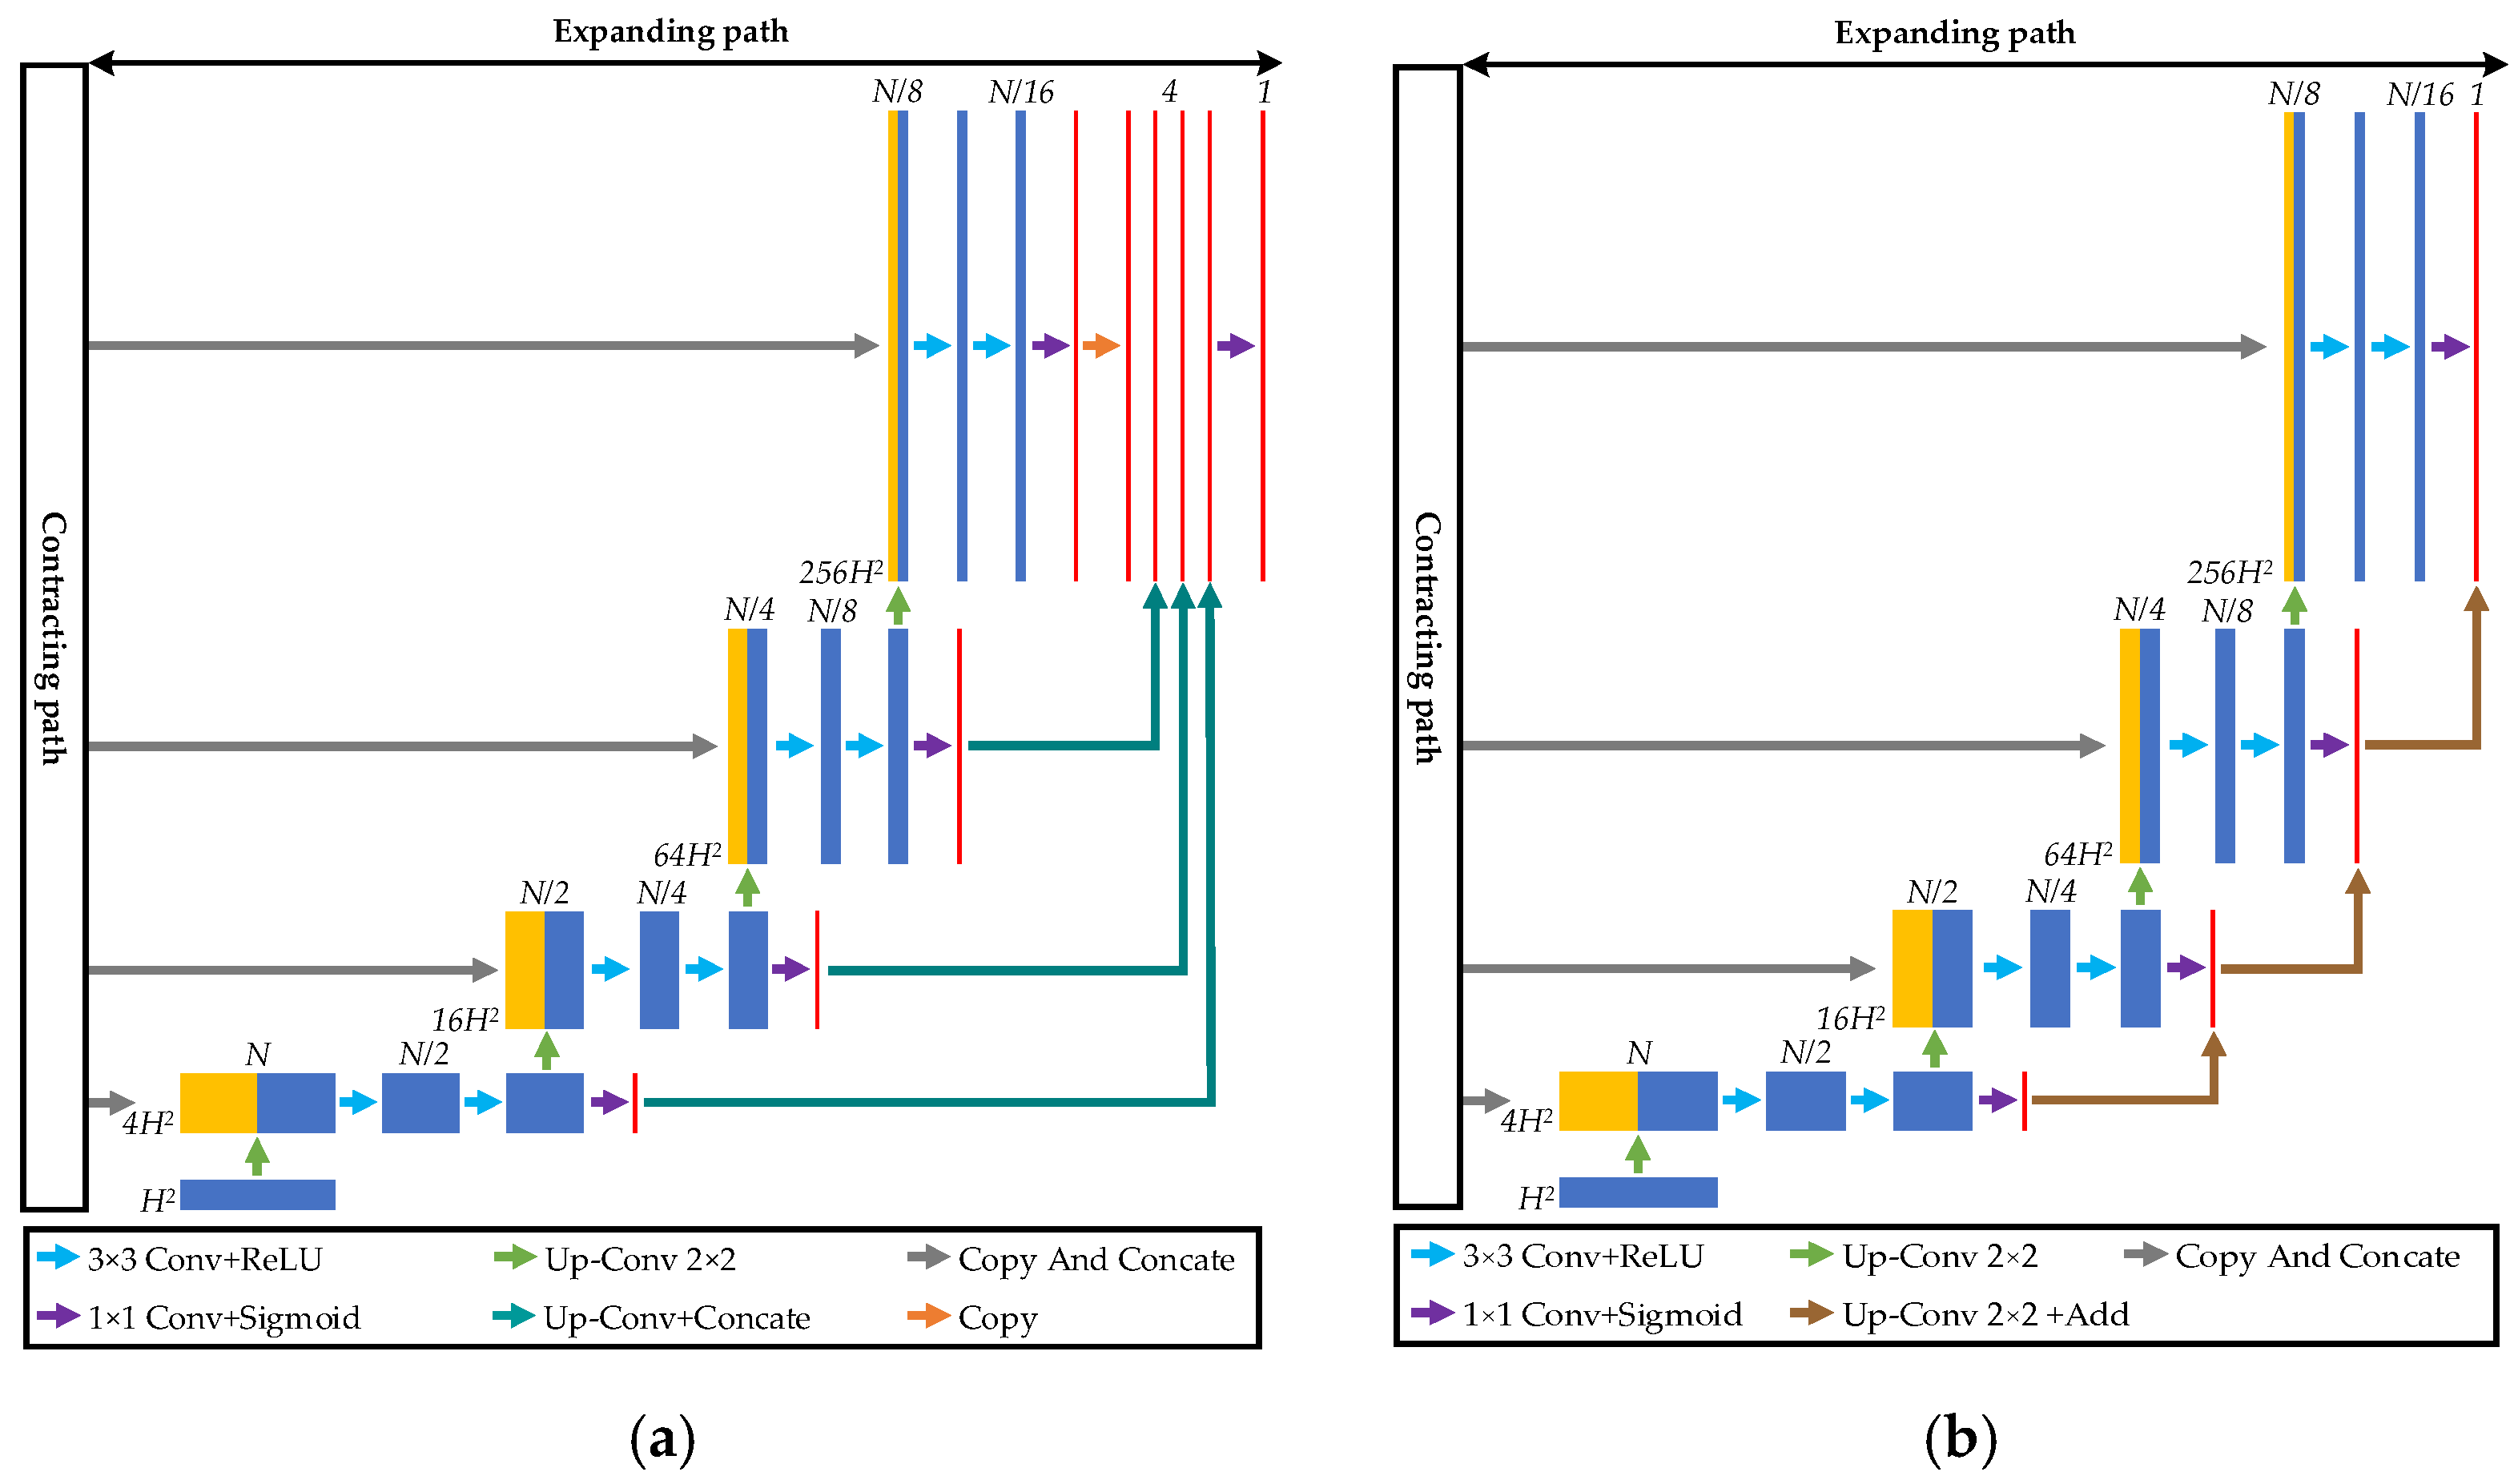
2.1. Overall Framework

To better address the problem of missing detection and incorrect detection of buildings extracted from high-resolution remote sensing images due to spectrum uncertainty, we proposed an end-to-end deep learning neural network named BMFR-Net, as shown in Figure 2.
The BMFR-Net mainly comprises the CACP module and the MOFC structure and uses the U-Net as the main backbone after the last stage is removed. At the end of the contracting path, the CACP module is fused. It can effectively reduce the loss of effective information in multiscale feature extraction and fusion by parallel continuous small-scale atrous convolution. Then the MOFC structure outputs at each level of the expanding path. It reversely integrates the output results into the network to enhance the ability to aggregate multiscale semantic information from the context. Besides, the MOFC structure realizes the joint constraints on the network by combining the multilevel loss functions. It can effectively update the network parameters in the contracting path in BMFR-Net, which are located far away from the output layer and enhance the learning capacity of the network for shallow features.

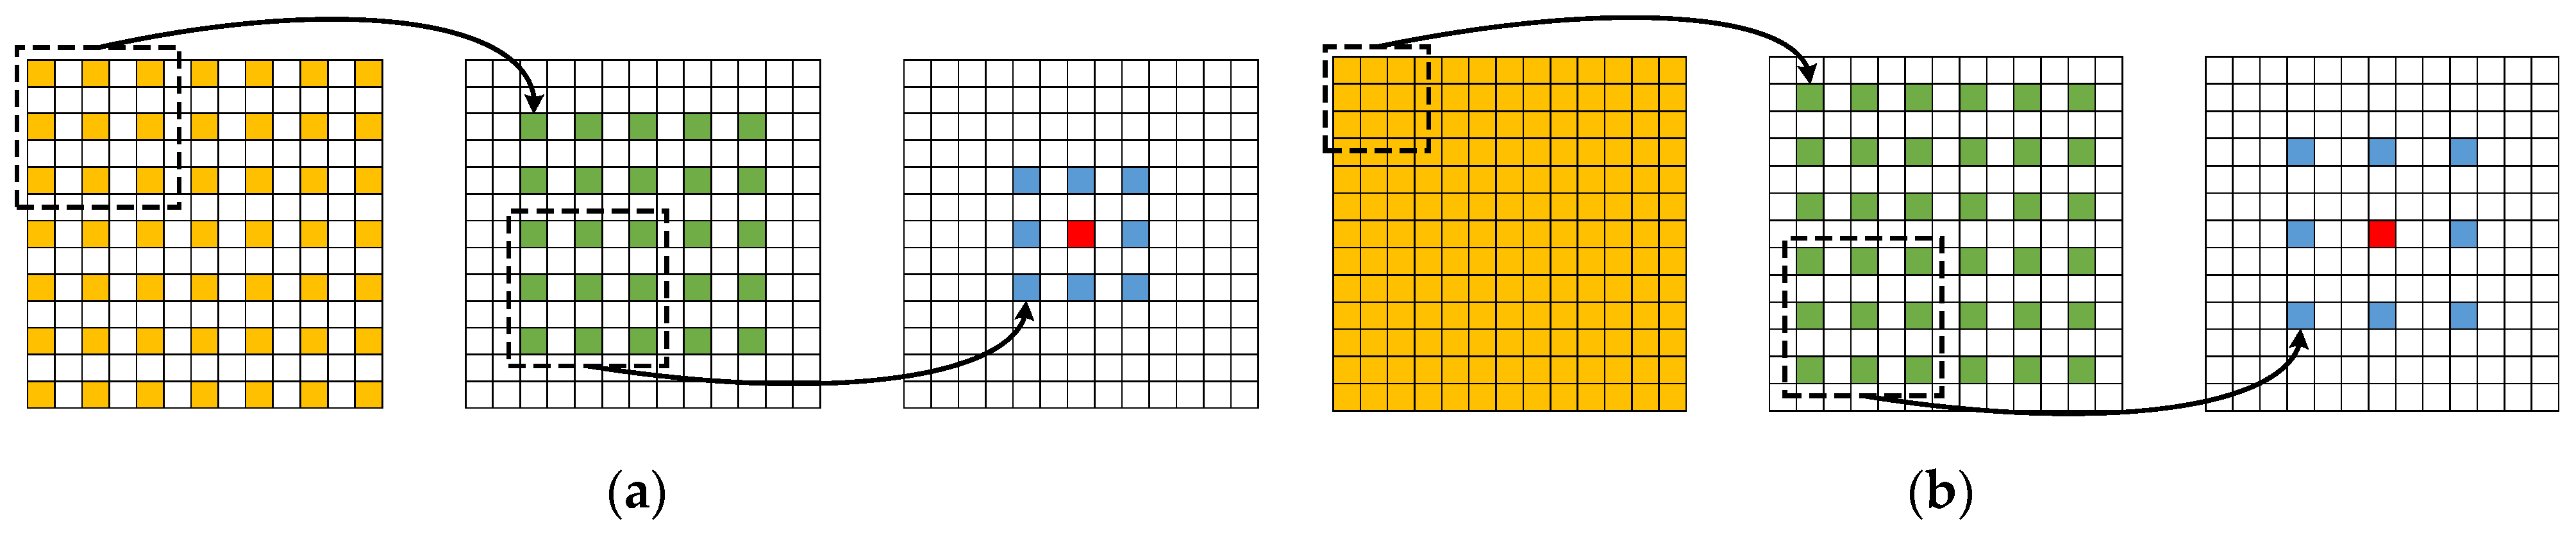
2.2. Continuous Atrous Convolution Pyramid Module

To alleviate the information loss in the multiscale feature extraction process, we proposed the CACP module in this section. Buildings are often densely spaced in high-resolution remote sensing images of urban scenes, as is well recognized, and the size difference is obvious. Therefore, it is necessary to obtain multiscale features to extract different scale buildings completely. We propose CACP, a new multiscale feature extraction and fusion module inspired by hybrid dilated convolution (HDC) [39], as shown in Figure 3.
As shown in Figure 4, the CACP module is made up of three small blocks: feature map channel reduction, multiscale feature extraction, and multiscale feature fusion. To begin, in the block of feature map channel reduction, the input channel number of the feature map is reduced by half to reduce the calculation amount. Following that, the reduced feature maps are fed into the multiscale feature extraction block, which extracts multiscale features through five parallel branches. The first three branches are continuous small-scale atrous convolution branches. In this paper, the dilation rates of the three branches are (1,2,3), (1,3,5), and (1,3,9). The gridding phenomenon is alleviated and local information such as texture and geometry loss is effectively minimized by placing HDC constraints on the dilation rate of continuous atrous convolution. The fourth is the global average pooling branch, which is used to obtain image-level features. The fifth branch is designed as a residual [40] branch to integrate the original information and facilitate the error backpropagation to the shallow network. Besides, the batch normalization and ReLu activation functions are performed after the atrous convolution process. Finally, the extracted features are fused by pixel addition in the multiscale features fusion block and the channel number of the feature map is restored to its target number.
In comparison to the ASPP module, the CACP module replaces the single-layer large-scale atrous convolution in the ASPP module with continuous small-scale atrous convolution. The CACP module can enhance the relevance of local information such as texture and geometry and slow down the loss of high-level semantic information that helps target extraction in the atrous convolution process to improve the completeness of buildings with variable spectral characteristics. The CACP module can also be easily incorporated into other networks to enhance multiscale feature extraction and fusion.

2.3. Multiscale Output Fusion Constraint Structure

This section designs a multiscale output fusion constraint structure in order to increase the ability to aggregate multiscale semantic information from the context and reduce the difficulty of updating parameters in the contracting path in BMFR-Net, which are located far away from the output layer. At present, the U-Net and other networks for building extraction from remote sensing images usually only generate results at the last layer. The network is insufficient to aggregate multiscale semantic information from the context since these frameworks fail to make full use of feature information from other levels. Additionally, most of the existing networks usually have more deep layers. Due to single-level network constraints, it is difficult to efficiently change parameters far away from the output layer. As a consequence, the precision of the building extraction results is insufficient for practical applications.
Inspired by FPN [41], the MOFC structure is designed to solve the above problems, and its structure is shown in Figure 5. In this paper, we took U-Net as the main backbone. Firstly, the MOFC structure uses a convolution layer with kernel size 1 × 1 and the sigmoid activation function for prediction production at the end of each level of the expanding path, as shown by the purple arrow in Figure 5. Next, the predicted results except the last level are upsampled twice. Then, as shown by the red arrow in Figure 5, the upsampling feature map is connected with the feature map of the adjacent level that has the skip connection. Moreover, except for the last level, the output results are upsampled to the size of the input image and evaluated with the ground truth to construct the multilevel joint weighted loss function, as shown in the orange arrow in Figure 5. In the end, the building extraction result is generated at the end of the network.
Since the MOFC integrates the predicted results of different levels in the expanding path into the network and constructs a multilevel loss function to constrain the network jointly, the proposed network with the MOFC structure can obtain the unique high-level semantic information about buildings and low-level semantic information such as color and edge from high-level and low-level output results, respectively, to provide more multiscale semantic information from the context for the upsampling process. Furthermore, it can more efficiently update parameters in the contracting path that is far away from the output layer than the current network, extracting buildings with identical spectral features to be accurate.

2.4. Multilevel Joint Weighted Loss Function

The loss function was used to calculate the difference between expected and actual outcomes and it is extremely significant in neural network training. Building extraction is a two-class semantic segmentation task in which loss functions such as binary cross entropy loss (BCE loss) [42] and dice loss [43] are widely used. The basic expressions of BCE loss and dice loss are shown in Equations (1) and (2):
l BCE = 1 N i = 1 N ( g i × log p i + ( 1 g i ) × log ( 1 p i ) )
l Dice = 1 2 × i = 1 N ( g i × p i ) i = 1 N g i + i = 1 N p i
where l BCE is BCE loss, l Dice is dice loss, N denotes the total number of pixels in the image, and g i denotes whether the ith pixel in the ground truth belongs to a building. If it belongs to a building, g i = 1, otherwise g i = 0 . p i denotes the probability that the ith pixel in the predicted result is a building.
Since BMFR-Net adopts a multiscale output fusion constraint structure, it has predicted results at every level of the expanding path, so it is necessary to weight all loss functions of predicted results to obtain the final loss function. The loss BMFR Net is expressed in Equation (3):
loss BMFR Net = n = 1 4 ω n C n
where C n denotes the nth output restriction (loss function) in BMFR-Net from the end of the network to the beginning of extending path. For example, C 1 represents the output constraint at the end of the network, C 4 represents the output constraint at the beginning of the expanding path. ω n denotes the weight value of the nth output constraint.

3. Experiments and Results
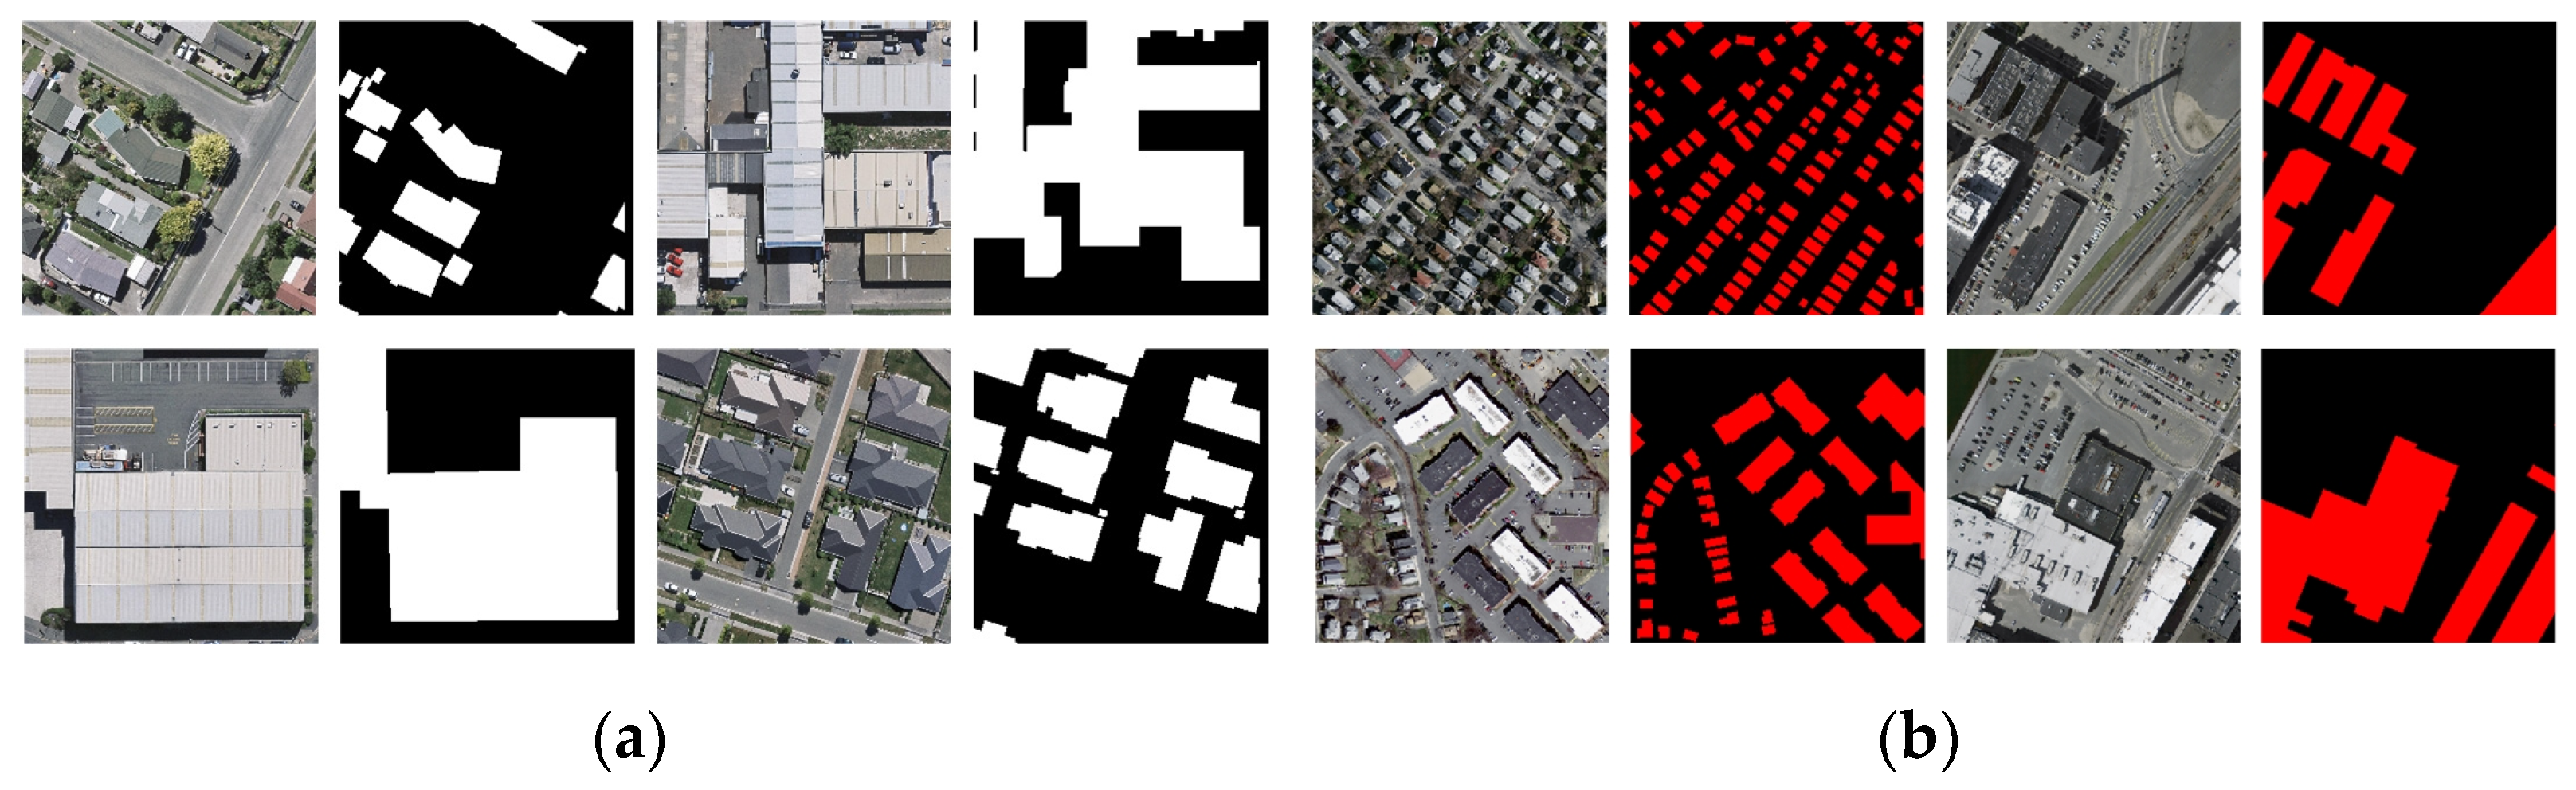
In this section, the experimental evaluation of the effectiveness of the proposed BMFR-Net is presented and compared with the other five SOTA methods. Section 3.1 illustrates the open-source data set used in the experiment. Section 3.2 describes the parameter setting details and environment conditions of the experiment. Section 3.3 presents the evaluation metrics. Section 3.4.1 shows the comparative experiment results with analysis.

3.1. Dataset

  • WHU Building Dataset
The aerial imagery dataset of the WHU Building Dataset was published by Ji et al. [38] in 2018. The entire aerial image data set covers an area of about 450 km2 in Christchurch, New Zealand. The dataset contains 8189 images with 0.3 m spatial resolution, all of which are 512 pixels × 512 pixels. The dataset was divided into the training set, validation set, and test set. Due to the limited GPU memory, it is difficult to achieve direct training of such a large range of images, so we resized all the images to 256 pixels × 256 pixels. Finally, the training set contained 18,944 images, the validation set contained 4144 images, and the test set contained 9664 images. The partially cropped images and the corresponding building labels are shown in Figure 6a.
2.
Massachusetts Building Dataset
The Massachusetts Building Dataset was open-sourced by Mnih [12] in 2013, which contains a total of 155 aerial images and building label images of the Boston area. The spatial resolution of the images is 1 m and the size of each image is 1500 pixels × 1500 pixels. The dataset was divided into three parts: the training set contained 137 images, the validation set contained four images, and the test set contained ten images. Due to the limitation of GPU memory, we also trimmed all images to 256 pixels × 256 pixels. We cropped the original image in the form of a sliding window, starting from the top left corner, from left to right, and then from top to bottom. The remaining part less than 256 was expanded to 256 × 256. Some incomplete images were eliminated and the final training set included 4392 images, the validation set included 144 images, and the test set included 360 images. The partially cropped images and the corresponding building labels are shown in Figure 6b.

3.2. Experiment Settings

All of the experiments in this paper were performed on the workstation running a 64-bit version of Windows 10. The workstation is equipped with Intel(R) Core (TM) i7-9700 K CPU @ 3.60 GHz, 32 GB memory, and a GPU of NVIDIA GeForce RTX 2080 Ti with an 11 GB RAM. All the networks were implemented on TensorFlow1.14 [44] and Keras 2.2.4 [45].
The image with a size of 256 pixels × 256 pixels was the input for all networks. The ‘the_normal’ distribution initialization method was chosen to initialize the parameters of the convolution kernel during the network training stage. In addition, Adam [46] was used as the model optimizer, with a learning rate of 0.0001 and a mini-batch size of 6. All networks used dice loss as the loss function. Due to the difference in image data quantity, resolution, and label accuracy, the network was trained with 200 epochs for the Massachusetts Building Dataset and 50 epochs for the WHU Building Dataset.

3.3. Evaluation Metrics

In order to evaluate the performance of the network proposed in this paper accurately, we selected five evaluation metrics commonly used in semantic segmentation tasks to evaluate the experimental results, including ‘overall accuracy (OA)‘, ‘Precision‘, ‘Recall, ’F1-Score’, and ‘intersection over union (IoU)‘. The OA refers to the ratio of all pixels correctly classified to all pixels participating in the evaluation calculation and its calculation formula shows in Equation (4). The precision refers to the proportion of pixels classified as positive categories in all pixels classified as positive categories, as shown in Equation (5). The recall refers to the proportion of pixels correctly classified as positive categories in all pixels of positive categories, as shown in Equation (6). The F1-Score is the harmonic mean of precision and recall, which is a comprehensive evaluation index, as shown in Equation (7). The IoU is the intersection ratio of all predicted positive class pixels and real positive class pixels over their union, as shown in Equation (8):
OA = TP + TN TP + TN + FP + FN
P = TP TP + FP
R = TP TP + FN
F 1 Score = 2 × P × R P + R
IoU = TP TP + FP + FN
where TP (true-positive) is the number of correctly identified building pixels; FP (false positive) is the number of wrongly classified background pixels; FN (false negative) is the number of improperly classified building pixels; TN (true-negative) is the number of correctly classified background pixels.
We employed the object-based evaluation approach [47] in addition to the pixel-based evaluation method to evaluate network performance. Object-based evaluation is based on a single building area: if the ratio of a single extracted result and the ground-truth intersection region to the ground-truth is 0, (0, 0.6), and [0.6, 1.0], it will be recorded as FP, FN, and TP, respectively.

3.4. Comparisons and Analysis

Several comparative experiments were carried out on the selected dataset to evaluate the effectiveness of the BMFR-Net proposed in this paper. First, we tested the performance of BMFR-Net under different loss functions. Then, BMFR-Net is compared with the other five SOTA methods in accuracy and training efficiency.

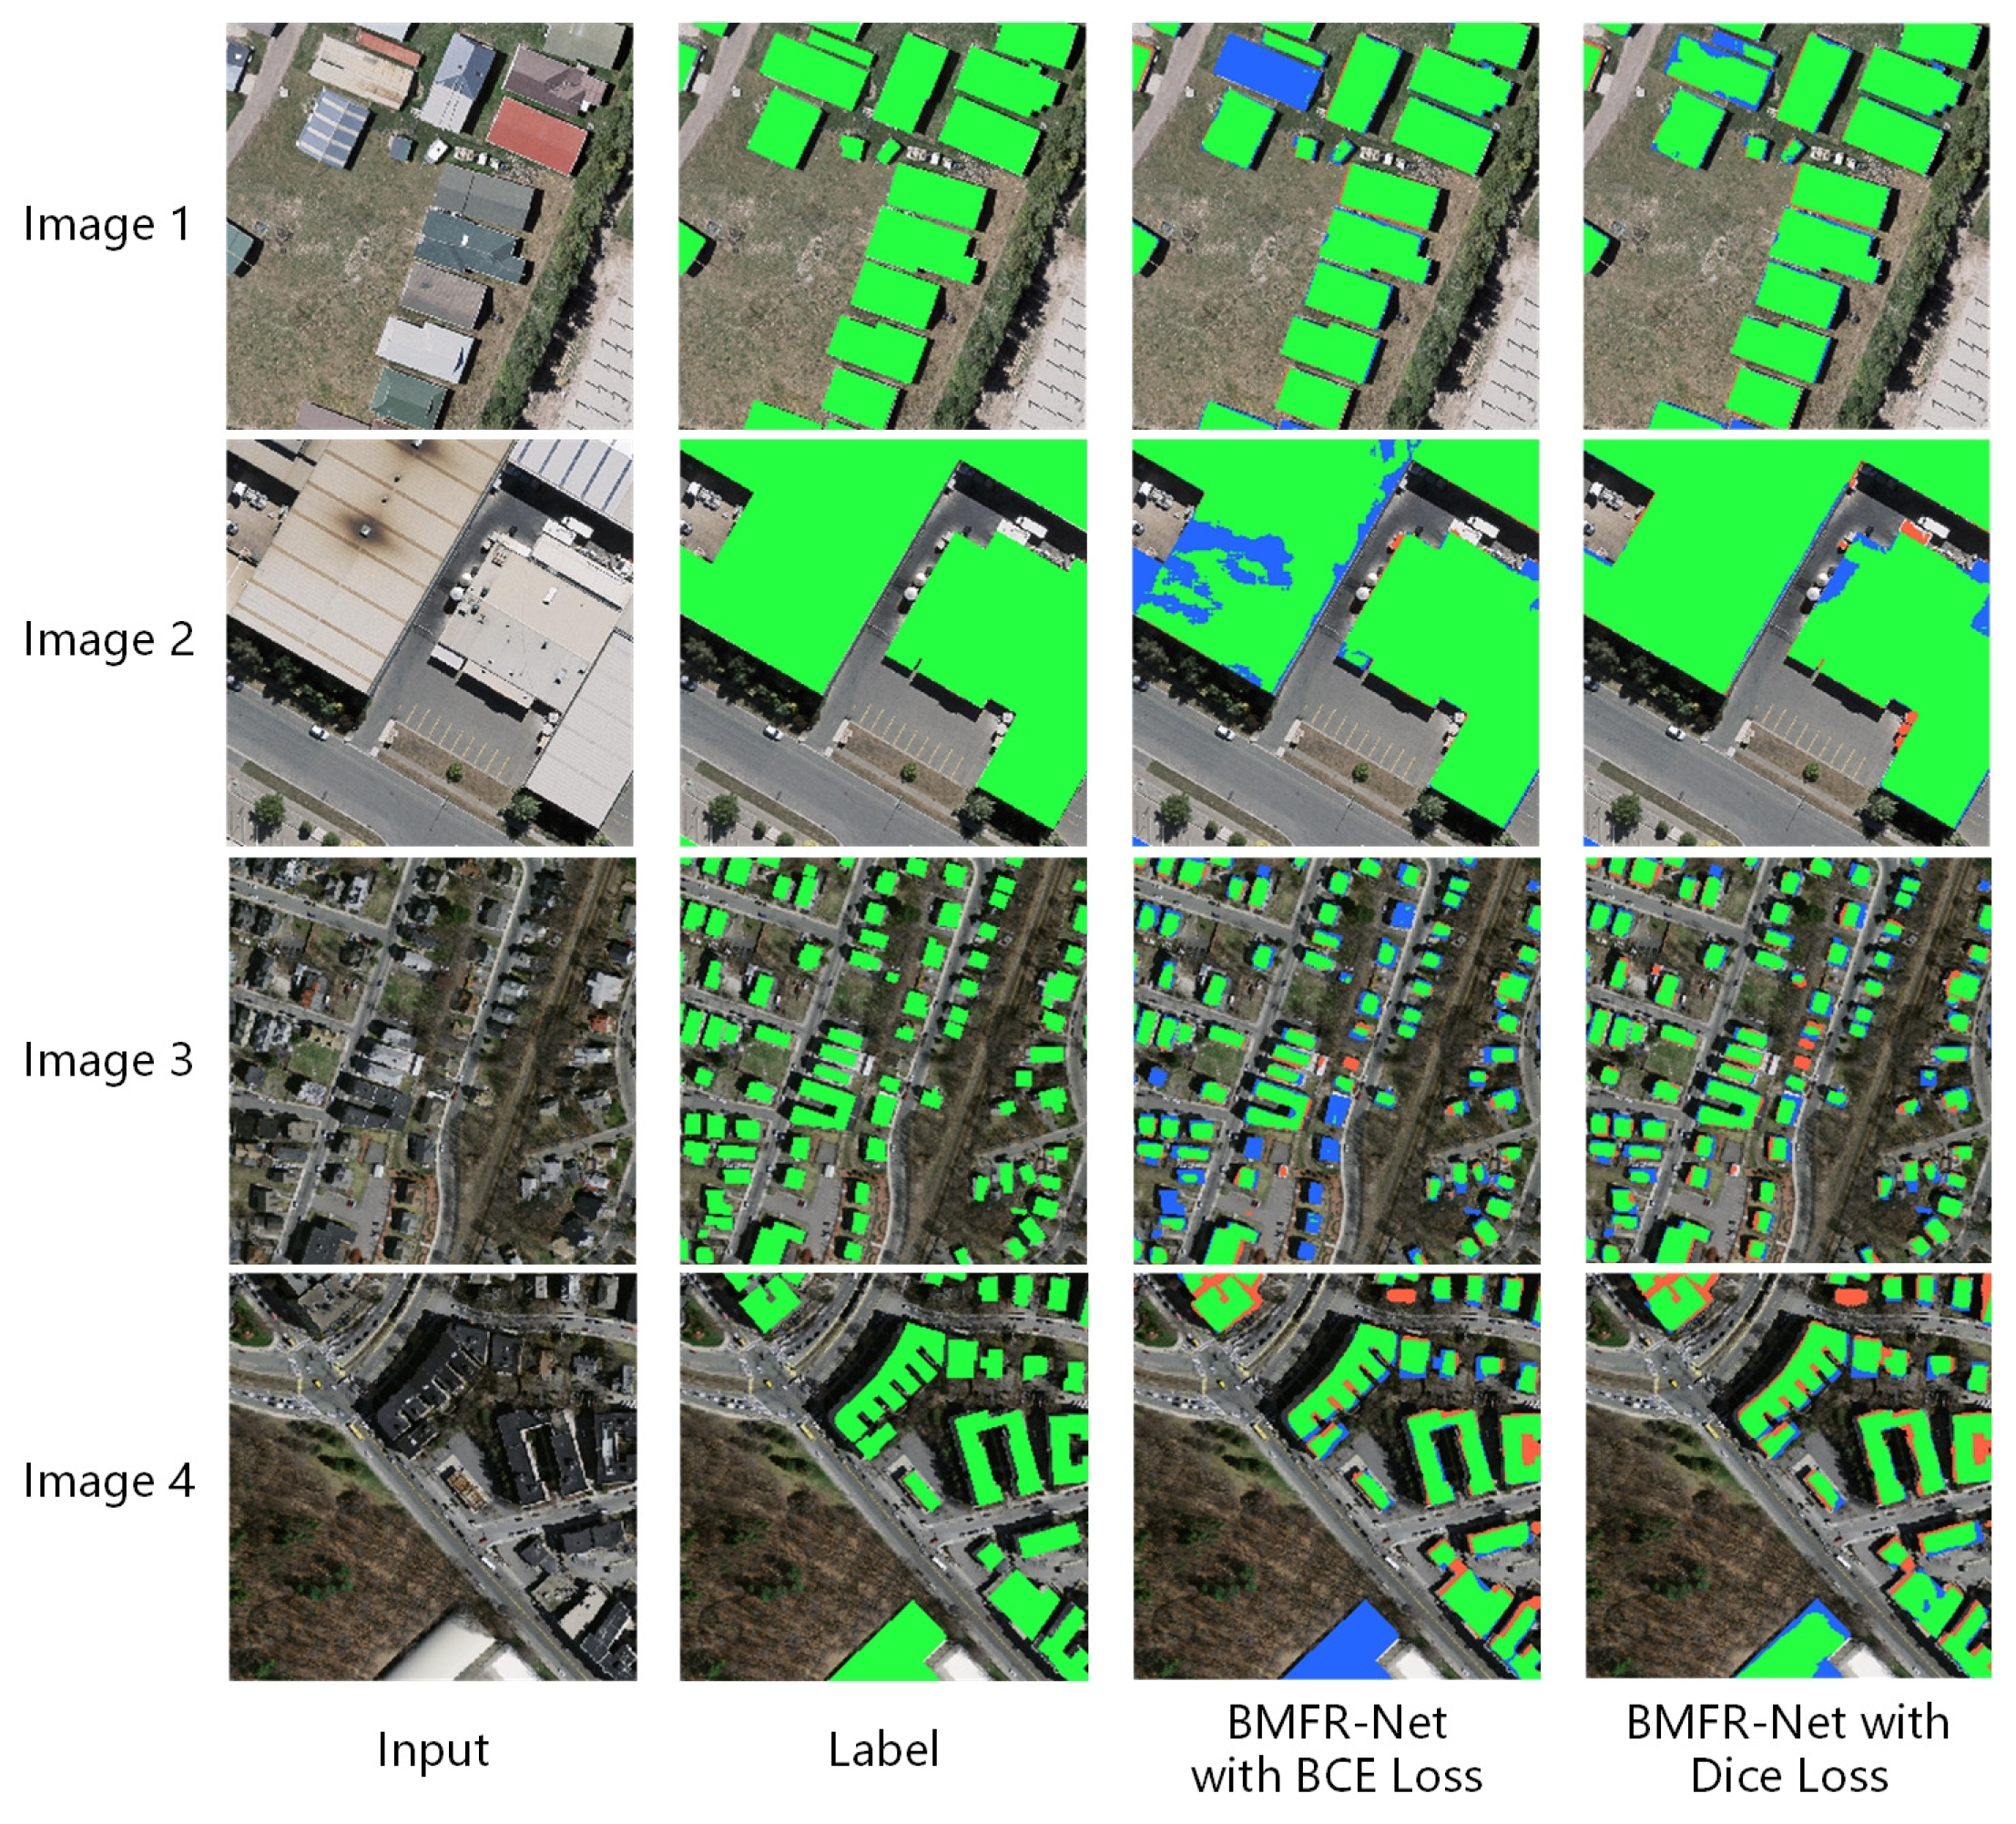
3.4.1. Comparative Experiments of Different Loss Functions

We used the BCE loss and dice loss to train BMFR-Net, respectively, to verify the influence of different loss functions on the performance of BMFR-Net and the effectiveness of dice loss. The experimental details were given in Section 3.2. The experimental results and some building extraction results are shown in Table 1 and Figure 7.
According to the above results, the BMFR-Net improves the pixel-based IoU and F1-Score by 0.47% and 0.26% and 0.9% and 0.6% on the two separate datasets when using dice loss, respectively. Additionally the integrity of building results was improved. Additionally, from the perspective of object-based, the recall of building results on the Massachusetts Building Dataset was significantly enhanced by 7.65% after using the dice loss function. That is because dice loss can solve the problem caused by the data imbalance between the number of background pixels and the number of building pixels and avoid falling into the local optimum. Unlike BCE loss, which treats all pixels equally, dice loss prioritizes the foreground detail. The ground truth usually has only two kinds of values in the binary classification task: 0 and 1. Only the foreground (building) pixels can be activated during the dice coefficient calculation using dice loss, while the background pixels are cleared. Thus, dice loss is adopted as the loss function of BMFR-Net.

3.4.2. Comparative Experiments with SOTA Methods

We compared BMFR-Net to the other five SOTA approaches, including U-Net [34], SegNet [33], DeepLabV3+ [48], MAP-Net [31], and BRRNet [32], to further assess the efficacy of the introduced network in this paper. We chose U-Net as one of the comparison methods since BMFR-Net uses U-Net as its main backbone. The SegNet was selected as the comparison method since it has the same encoding and decoding structure as U-Net and has a unique MaxPooling indices structure. Besides, the DeepLabV3+ is the latest structure of the DeepLab series network, which has a codec structure and includes an improved Xception structure and an ASPP module. Considering that the residual structure and atrous convolution have a profound impact on the development of neural networks, we selected BRRNet, a building extraction network based on U-Net and the integrating residual structure and atrous convolution. Moreover, we also used MAP-Net as a comparison method, which is an advanced network for building extraction.
To ensure the fairness of the comparative experiment, we reduced the number of parameters of SegNet and DeeplabV3+, which are used for multiclass segmentation of natural images. The last encoding and first decoding stage of SegNet was removed and the number of repetitions with the middle flow in the DeepLabV3+ was changed to the same eight times as the original Xception.
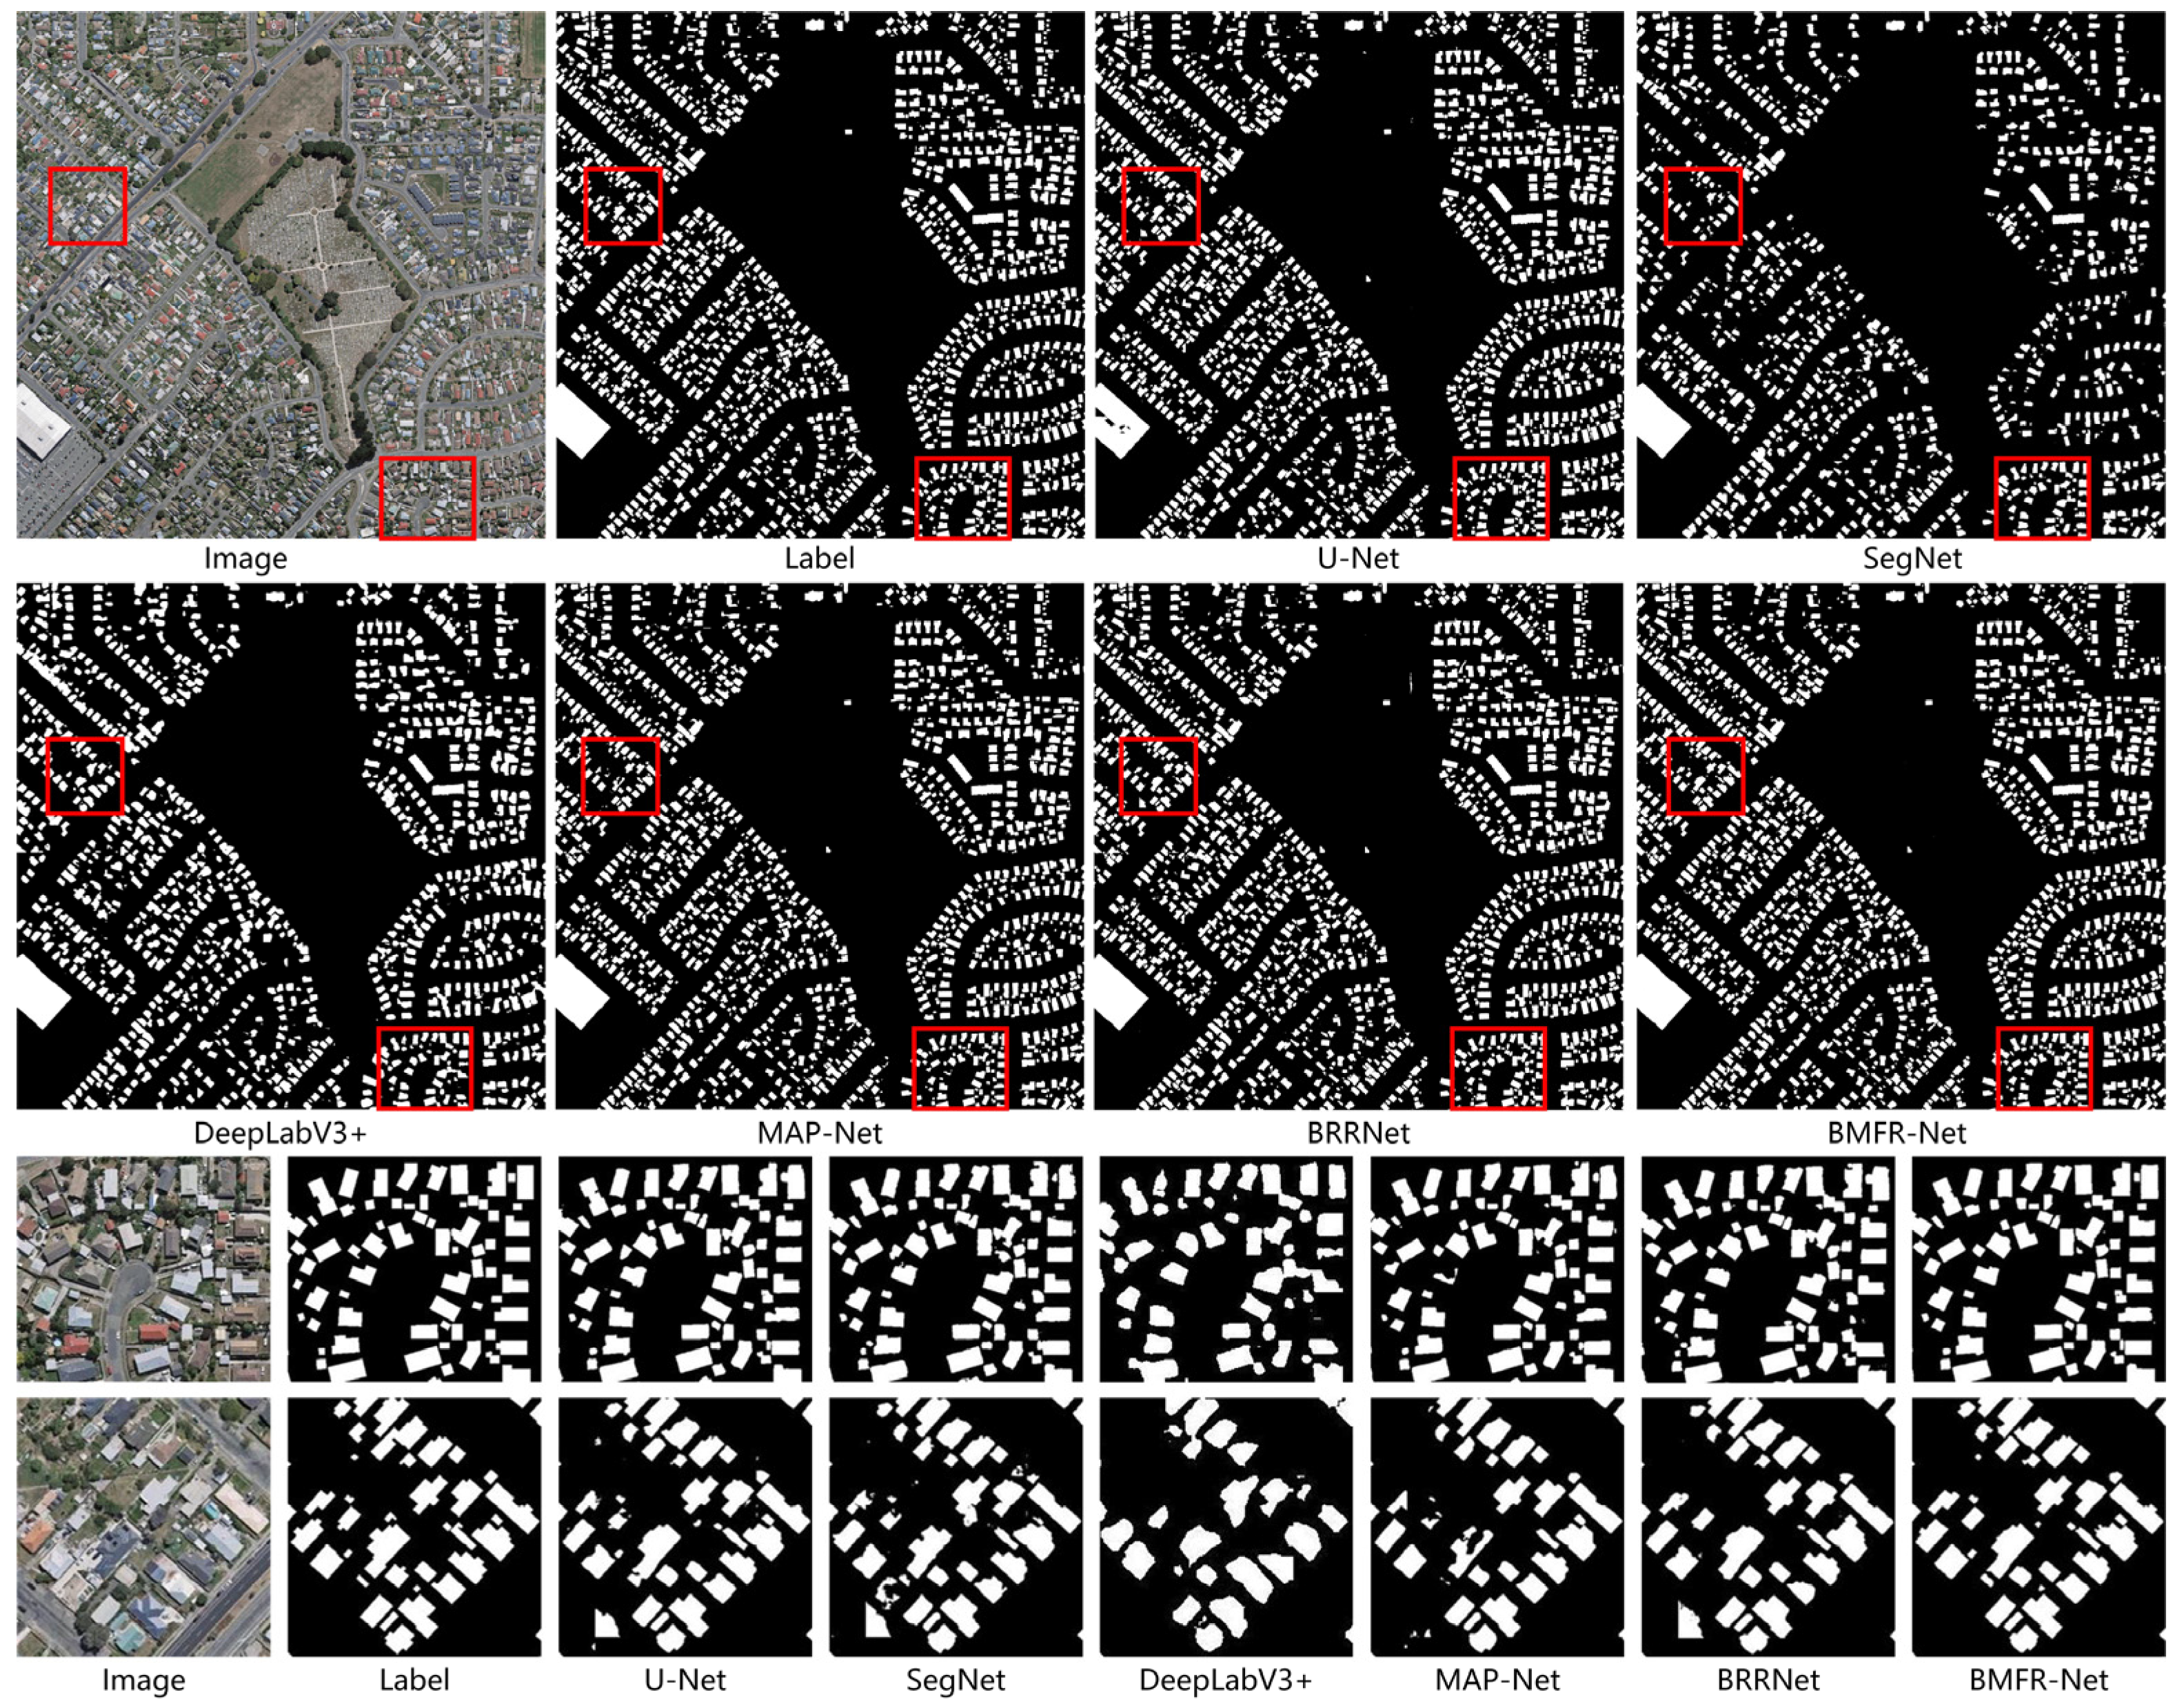
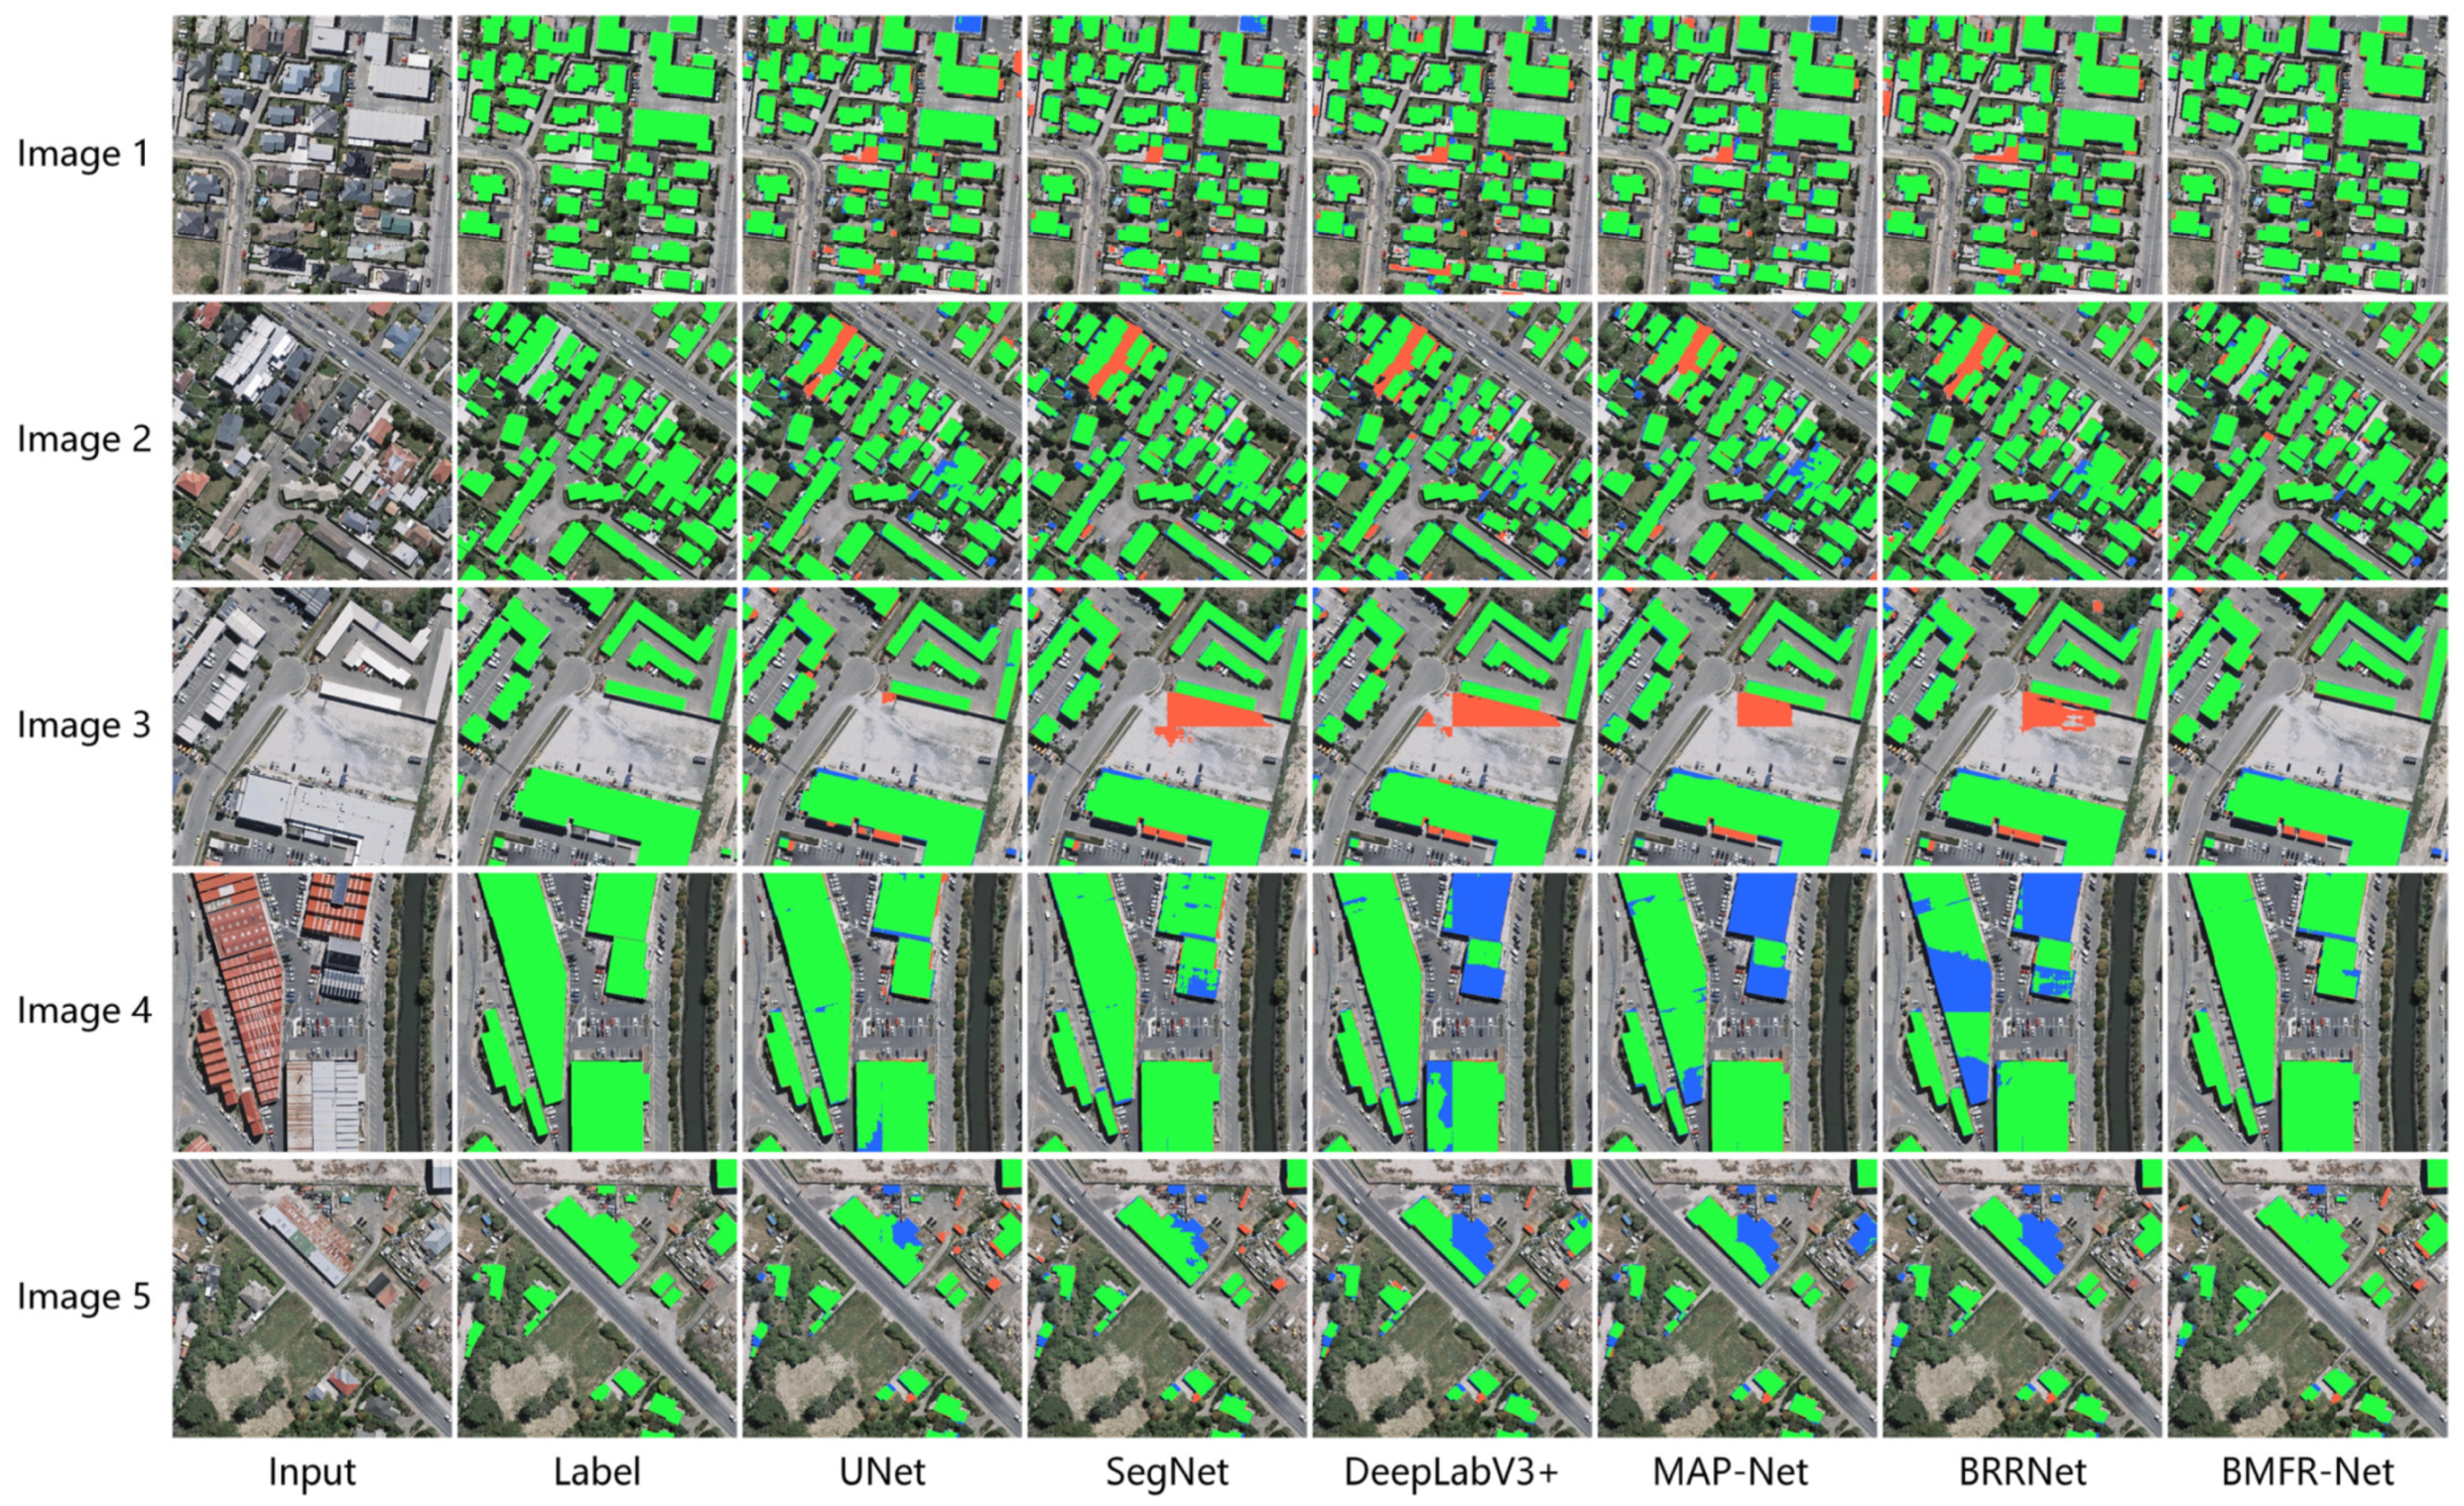
  • The comparative experiments on the WHU Building Dataset
The quantitative evaluation results of building extraction on the WHU Building Dataset are shown in Table 2. Our proposed BMFR-Net got higher scores in all evaluation metrics than other methods. As compared to BRRNet, the second-best performance, BMFR-Net, was 3.13% and 1.14% higher in pixel-based and object-based IoU, respectively, and 1.78% and 1.03% higher in the pixel-based and object-based F1-score, respectively.
Extensive area building extraction examples by different methods are shown in Figure 8 and Figure 9. According to the typical building extraction results are shown in Figure 10, we can see that the BMFR-Net results are the most accurate and complete with the fewest FP and FN. When the spectral characteristics of a building and its adjacent ground objects are similar, as shown in images 1, 2, and 3 in Figure 10, other approaches cannot distinguish effectively. In contrast, BMFR-Net obtains accurate building extraction results by fusing the MOFC structure in the expanding path. On the one hand, the MOFC structure in BMFR-Net enhances the network of the ability to aggregate multiscale semantic information from the context and provides more effective information for the discrimination of pixels at each level. On the other hand, the MOFC structure realizes effective updating of parameters in the contracting path in BMFR-Net, which are located far away from the output layer, making the semantic information contained in the low-level abstract features richer and more accurate.
Furthermore, as shown in Figure 10, images 4 and 5, other methods cannot recognize a building roof with complex structures and inconsistent textures and materials as one entity, resulting in several undetected holes and deficiencies in the results, whereas BMFR-Net extracted the building entirely. That is because the U-Net and SegNet are not equipped with multiscale feature aggregation modules at the end of the contracting path. Therefore, they can only extract some scattered texture and geometry information, resulting in the lack of continuity between the information. In addition, the DeepLabV3+, MAP-Net, and BRRNet all adopt a large-scale dilation rate or pooling window, which discards too much building feature information and breaks texture and geometry information continuity. In contrast, the CACP module in BMFR-Net can integrate multiscale features and enhance the continuity of local information such as texture and geometry in the feature map, making it easier to extract a complete building.
2.
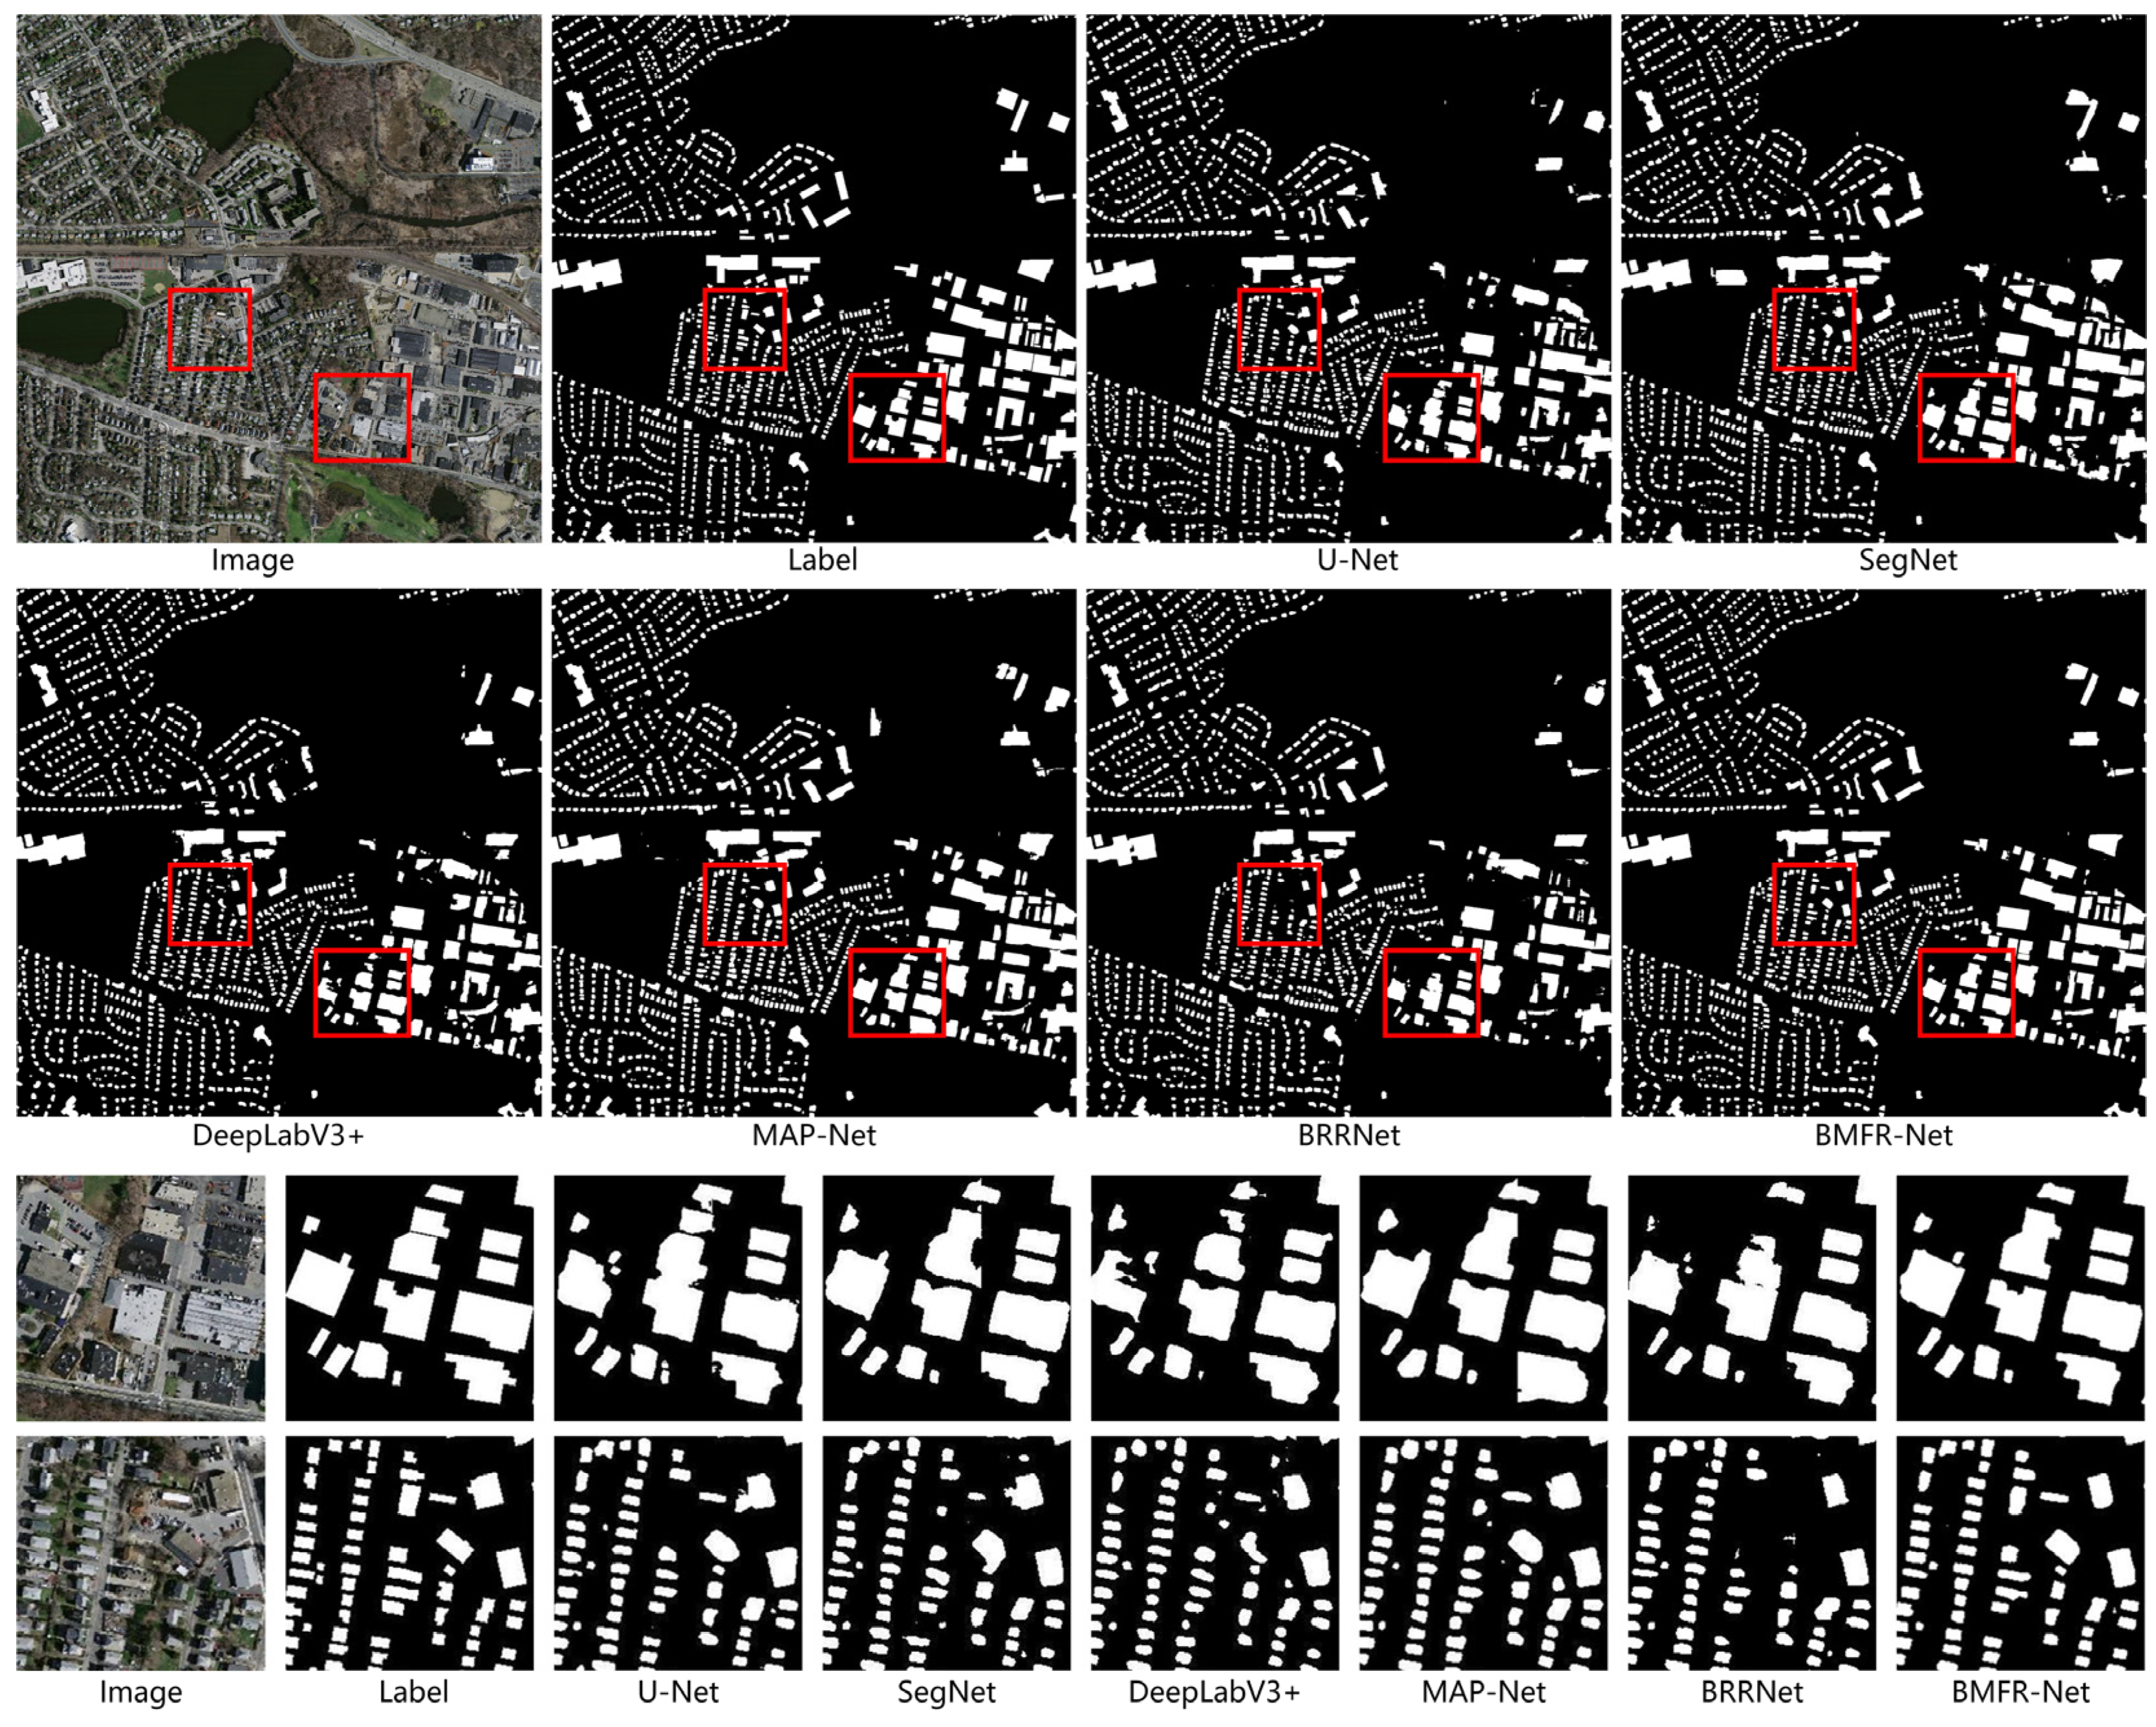
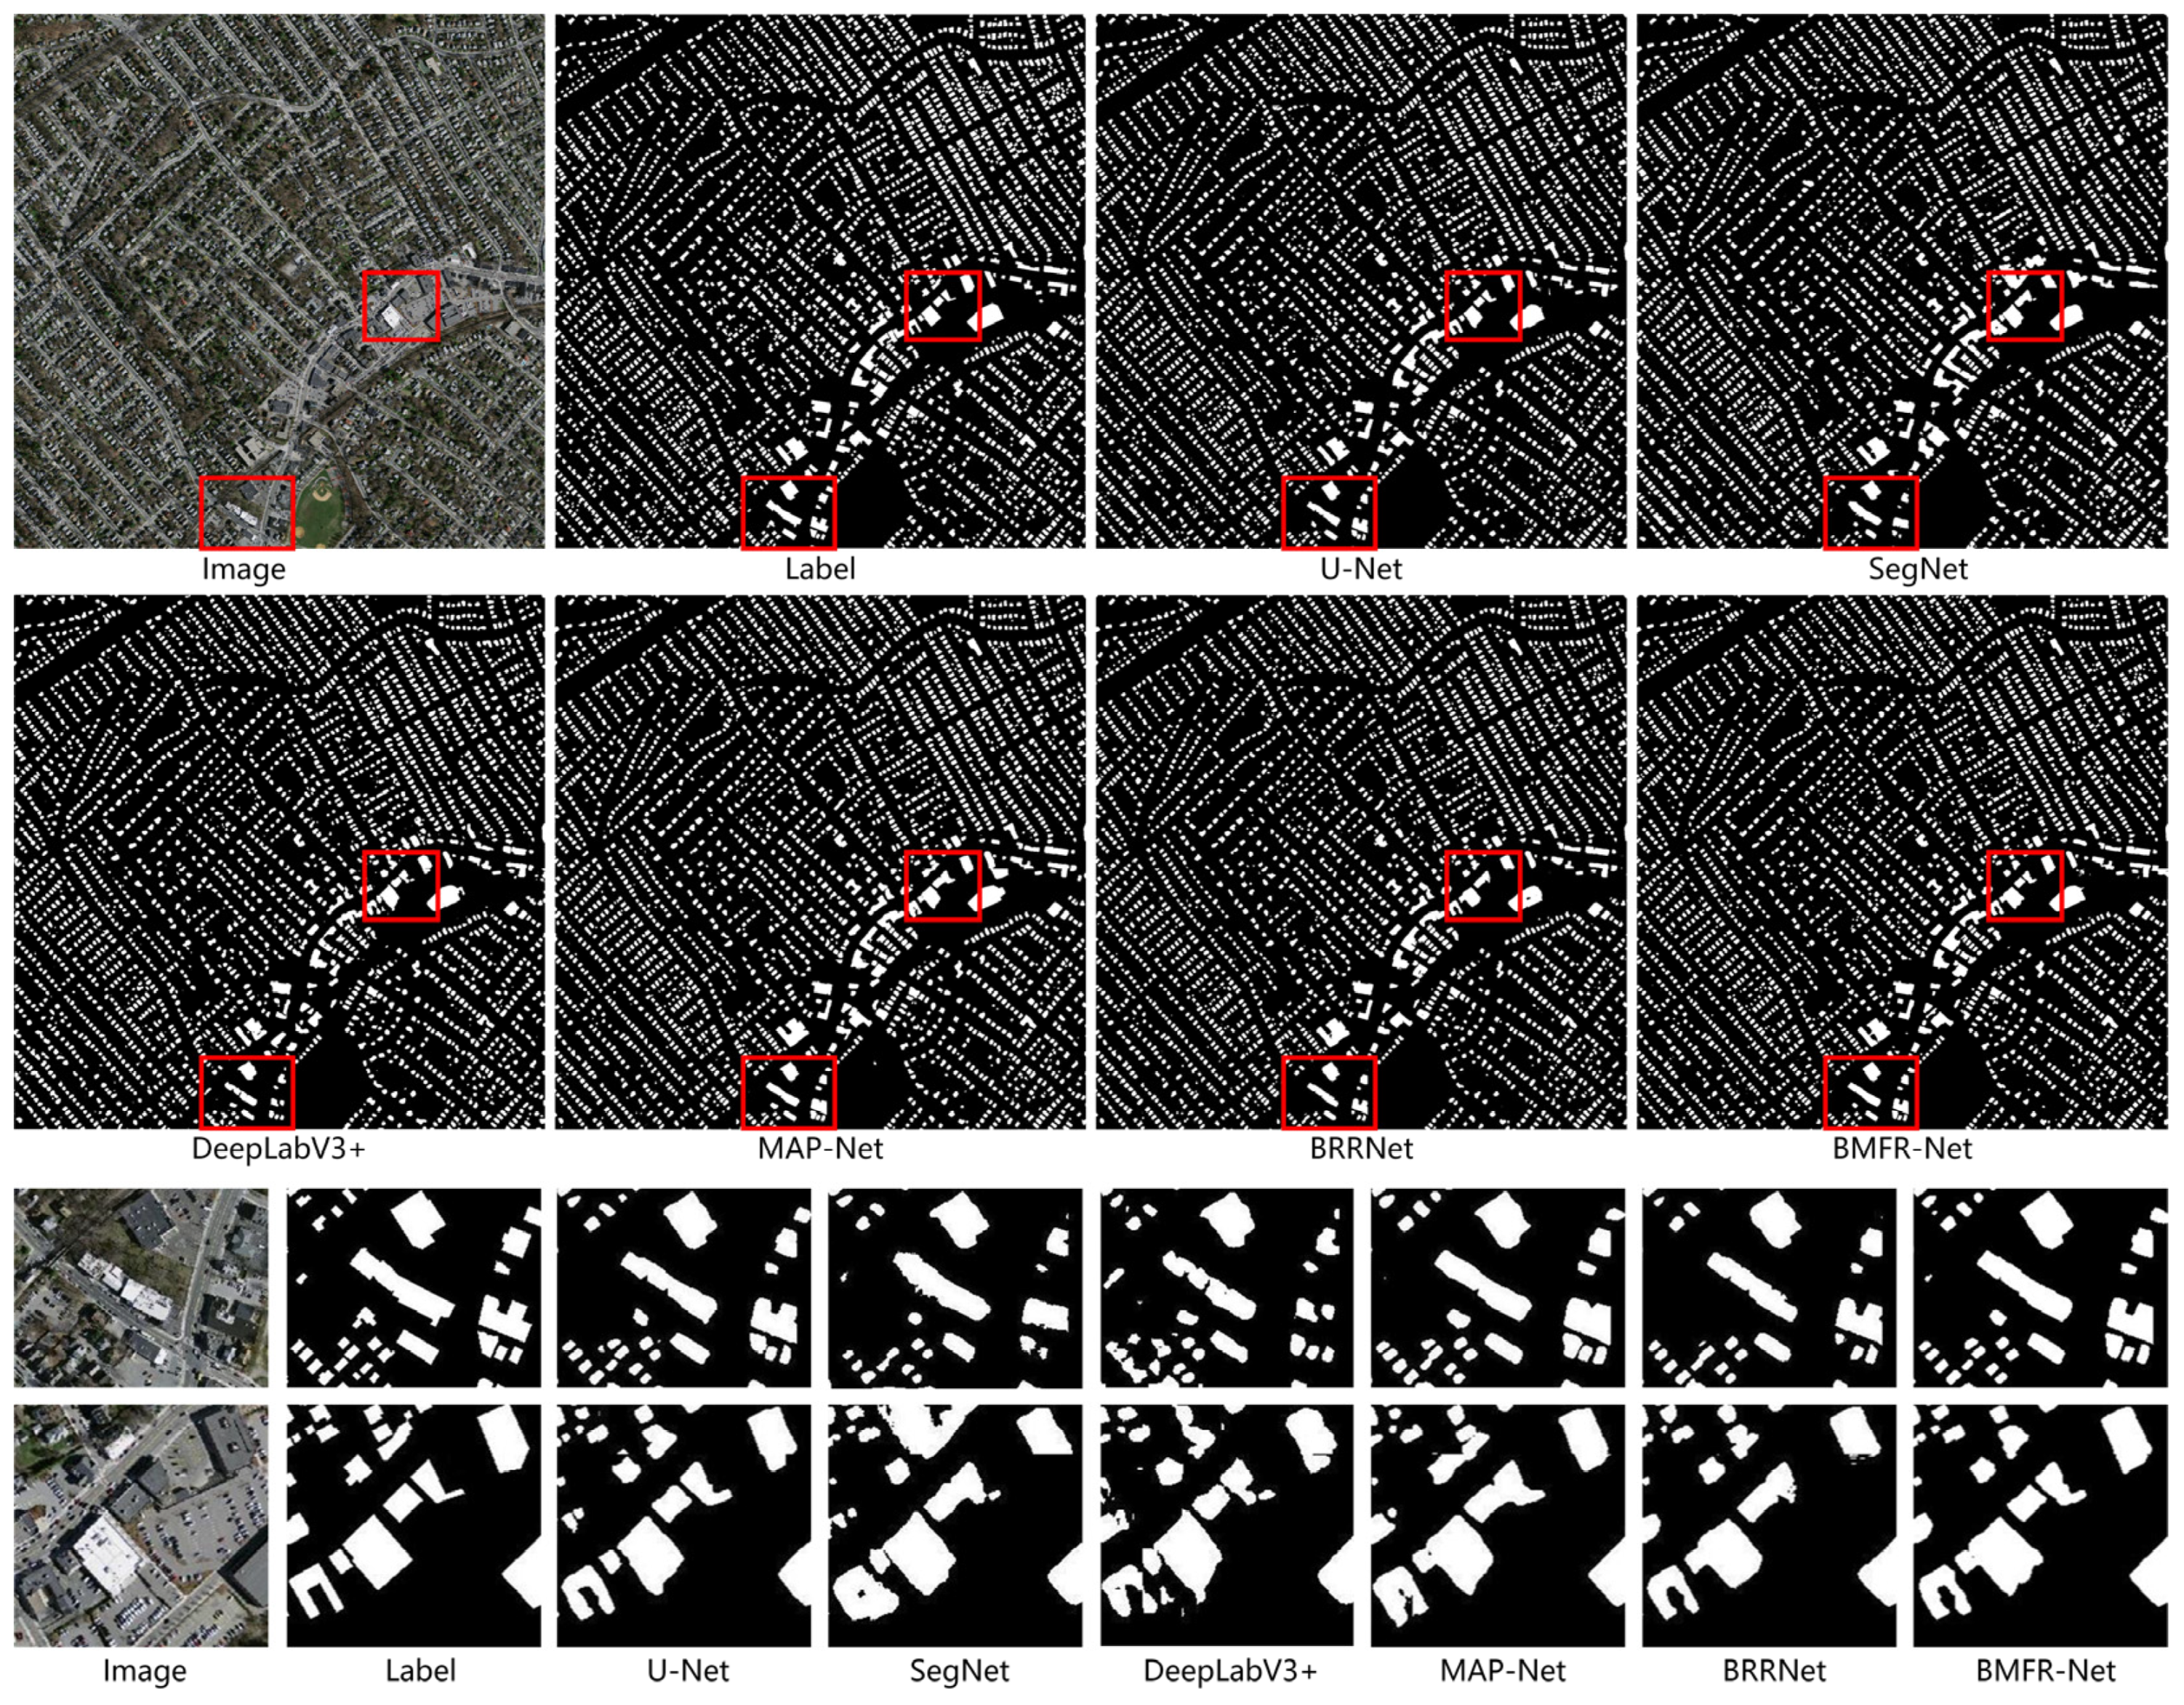
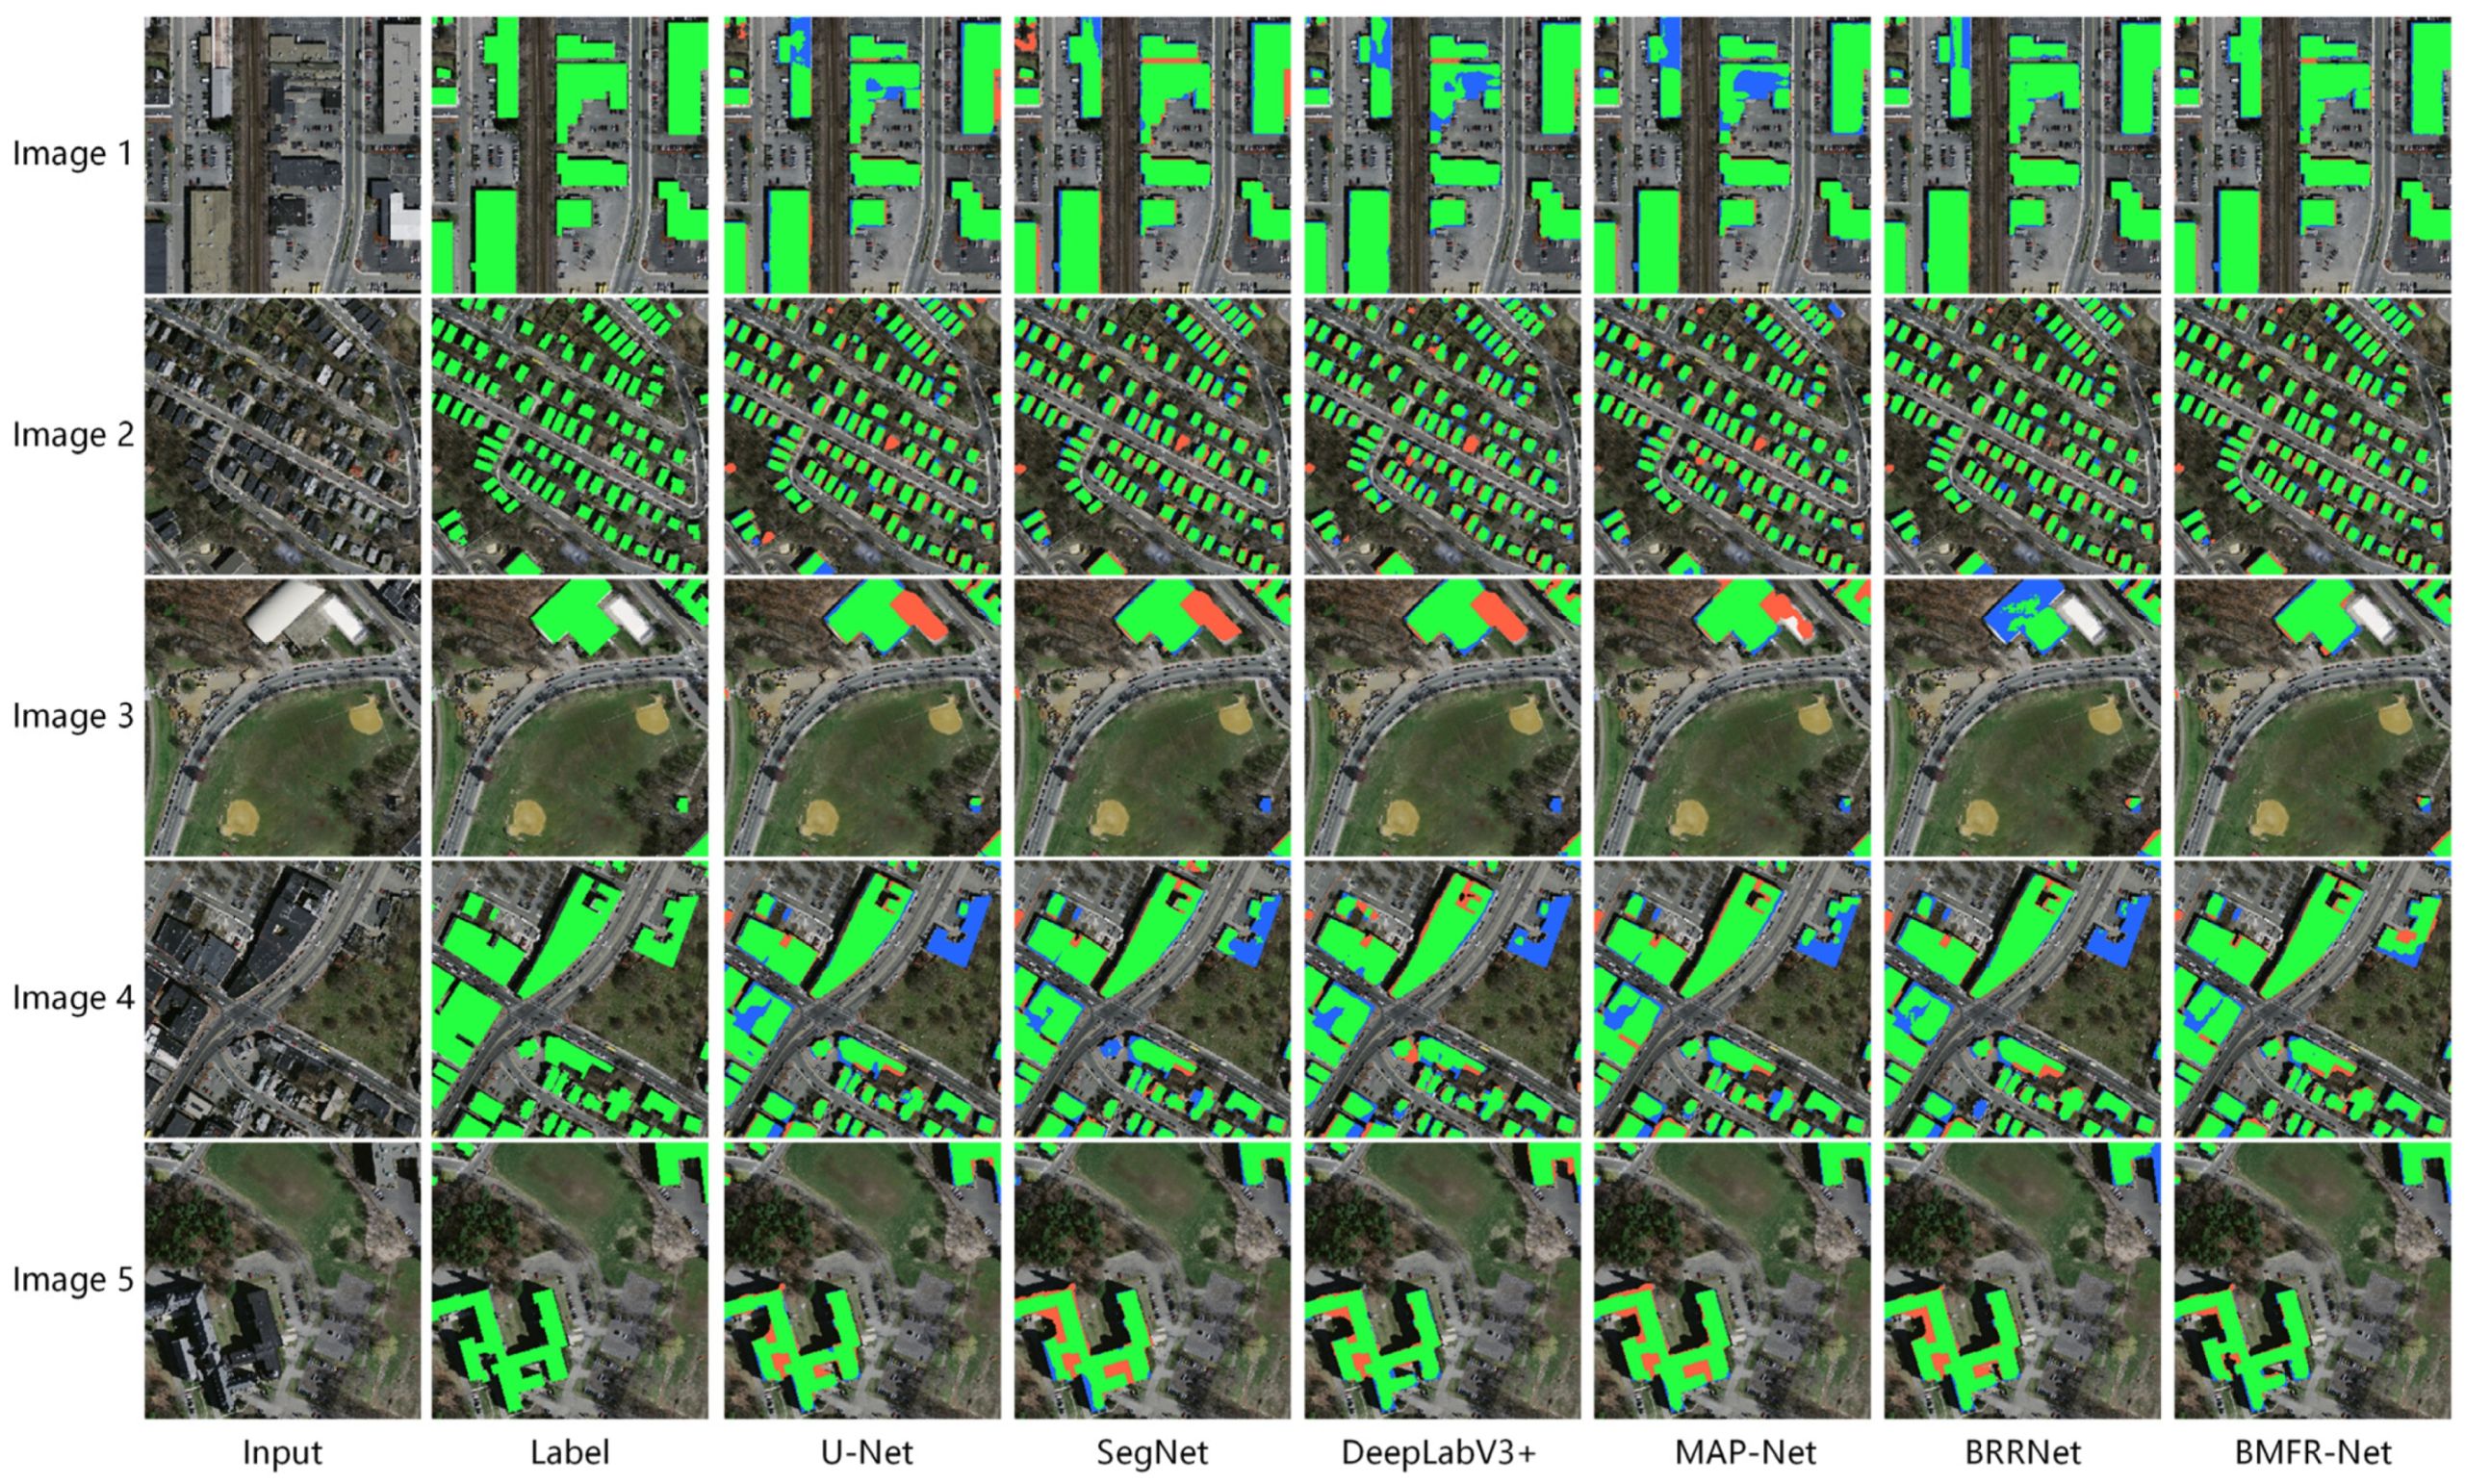
The comparative experiments on the Massachusetts Building Dataset
The quantitative evaluation results on the Massachusetts Building Dataset are shown in Table 3. Since the image resolution is lower and the building scenes are more complex in the Massachusetts Building Dataset than in the WHU Building Dataset, the quantitative assessment results were lower overall. Nevertheless, BMFR-Net still had the best performance in all evaluation metrics. Compared with MAP-Net, BMFR-Net was 1.17% and 0.78% higher in the pixel-based IoU and F1-score, respectively. In terms of the object-based evaluation, U-Net and SegNet performed better among the five SOTA methods. This is due to the fact that while U-Net can efficiently detect buildings, the integrity of the building is insufficient. In contrast, SegNet can entirely extract buildings but has a high rate of false alarms. Compared with U-Net, BMFR-Net was 0.17% and 0.34% higher in the object-based IoU and F1-score, respectively.
Extensive area building extraction examples by different methods are shown in Figure 11 and Figure 12. Some typical detailed building extraction results are shown in Figure 13. Visually, compared with other methods, BMFR-Net had the best global extraction results. For those buildings with simple structures and single spectral characteristics, all methods can effectively extract them. However, for non-building objects with similar spectrums with buildings, such as images 2, 3, and 4 in Figure 13, these background objects are easily wrongly divided into buildings or a part of buildings is missing in the five comparison methods. BMFR-Net aggregated more semantic information from the context in the expanding path through the MOFC structure and obtained accurate building extraction results. In addition, as shown in images 1 and 5 in Figure 13, in the results of buildings with complex structures or variable spectral characteristics, the other five methods had more errors or omissions. However,, BMFR-Net uses the CACP module to fuse multiscale features and obtains rich information, effectively reducing the interference caused by shadows and inconsistent textures. As a result, its extracted building results were closer to the true results.
The results of the above experiments show that BMFR-Net outperformed the competition on two separate datasets, demonstrating that BMFR-Net is capable of extracting buildings from high-resolution remote sensing images of complex scenes. Following that, we will analyze the causes of the above results in detail. U-Net with the skip connection structure can integrate partial low-level features into the expanding path and improve its extraction accuracy. However, due to the poor ability of multiscale feature extraction and fusion, the building extraction result is not complete enough. SegNet can avoid the loss of partial effective information by using the MaxPooling indices structure. At the same time, it does not take into account multiscale feature extraction and fusion. It eliminates the skip connection structure, resulting in difficulty synthesizing the rich detail information in the low-level feature and the abstract semantic information in the high-level feature. As a consequence, the extraction results have the problems of a false alarm and missing alarm. DeepLabV3+ and MAP-Net enhance the ability of multiscale feature extraction and fusion by fusing the ASPP module and PSP module, respectively. However, they use large-scale dilation rates or pooling windows to obtain more global information, making the detection of large buildings with variable spectral characteristics incomplete. BRRNet uses atrous convolution and a residual structure to achieve multiscale feature extraction and fusion. Then the residual refinement module is used to optimize the extraction results at the end of the network. However, its ability to aggregate multiscale semantic information from the context is insufficient, making it difficult to distinguish buildings with similar spectral features from nearby objects. In addition, all these approaches only produce one output at the end of the network. The BMFR-Net realizes multiscale feature extraction and fusion by combining the CACP module at the end of the contracting path, minimizing high-level semantic information such as texture and geometry loss. Then, the MOFC structure is constructed in the expanding path of BMFR-Net. By integrating the output result of each level into the network and combining the multilevel loss functions, the MOFC structure provides more multiscale semantic information from the context for the upsampling stage and makes the parameters in the contracting path layers to be efficiently modified. Therefore, BMFR-Net can effectively distinguish feature differences between buildings with variable texture materials or non-building with similar spectrums, and it can obtain more accurate and complete building extraction results.

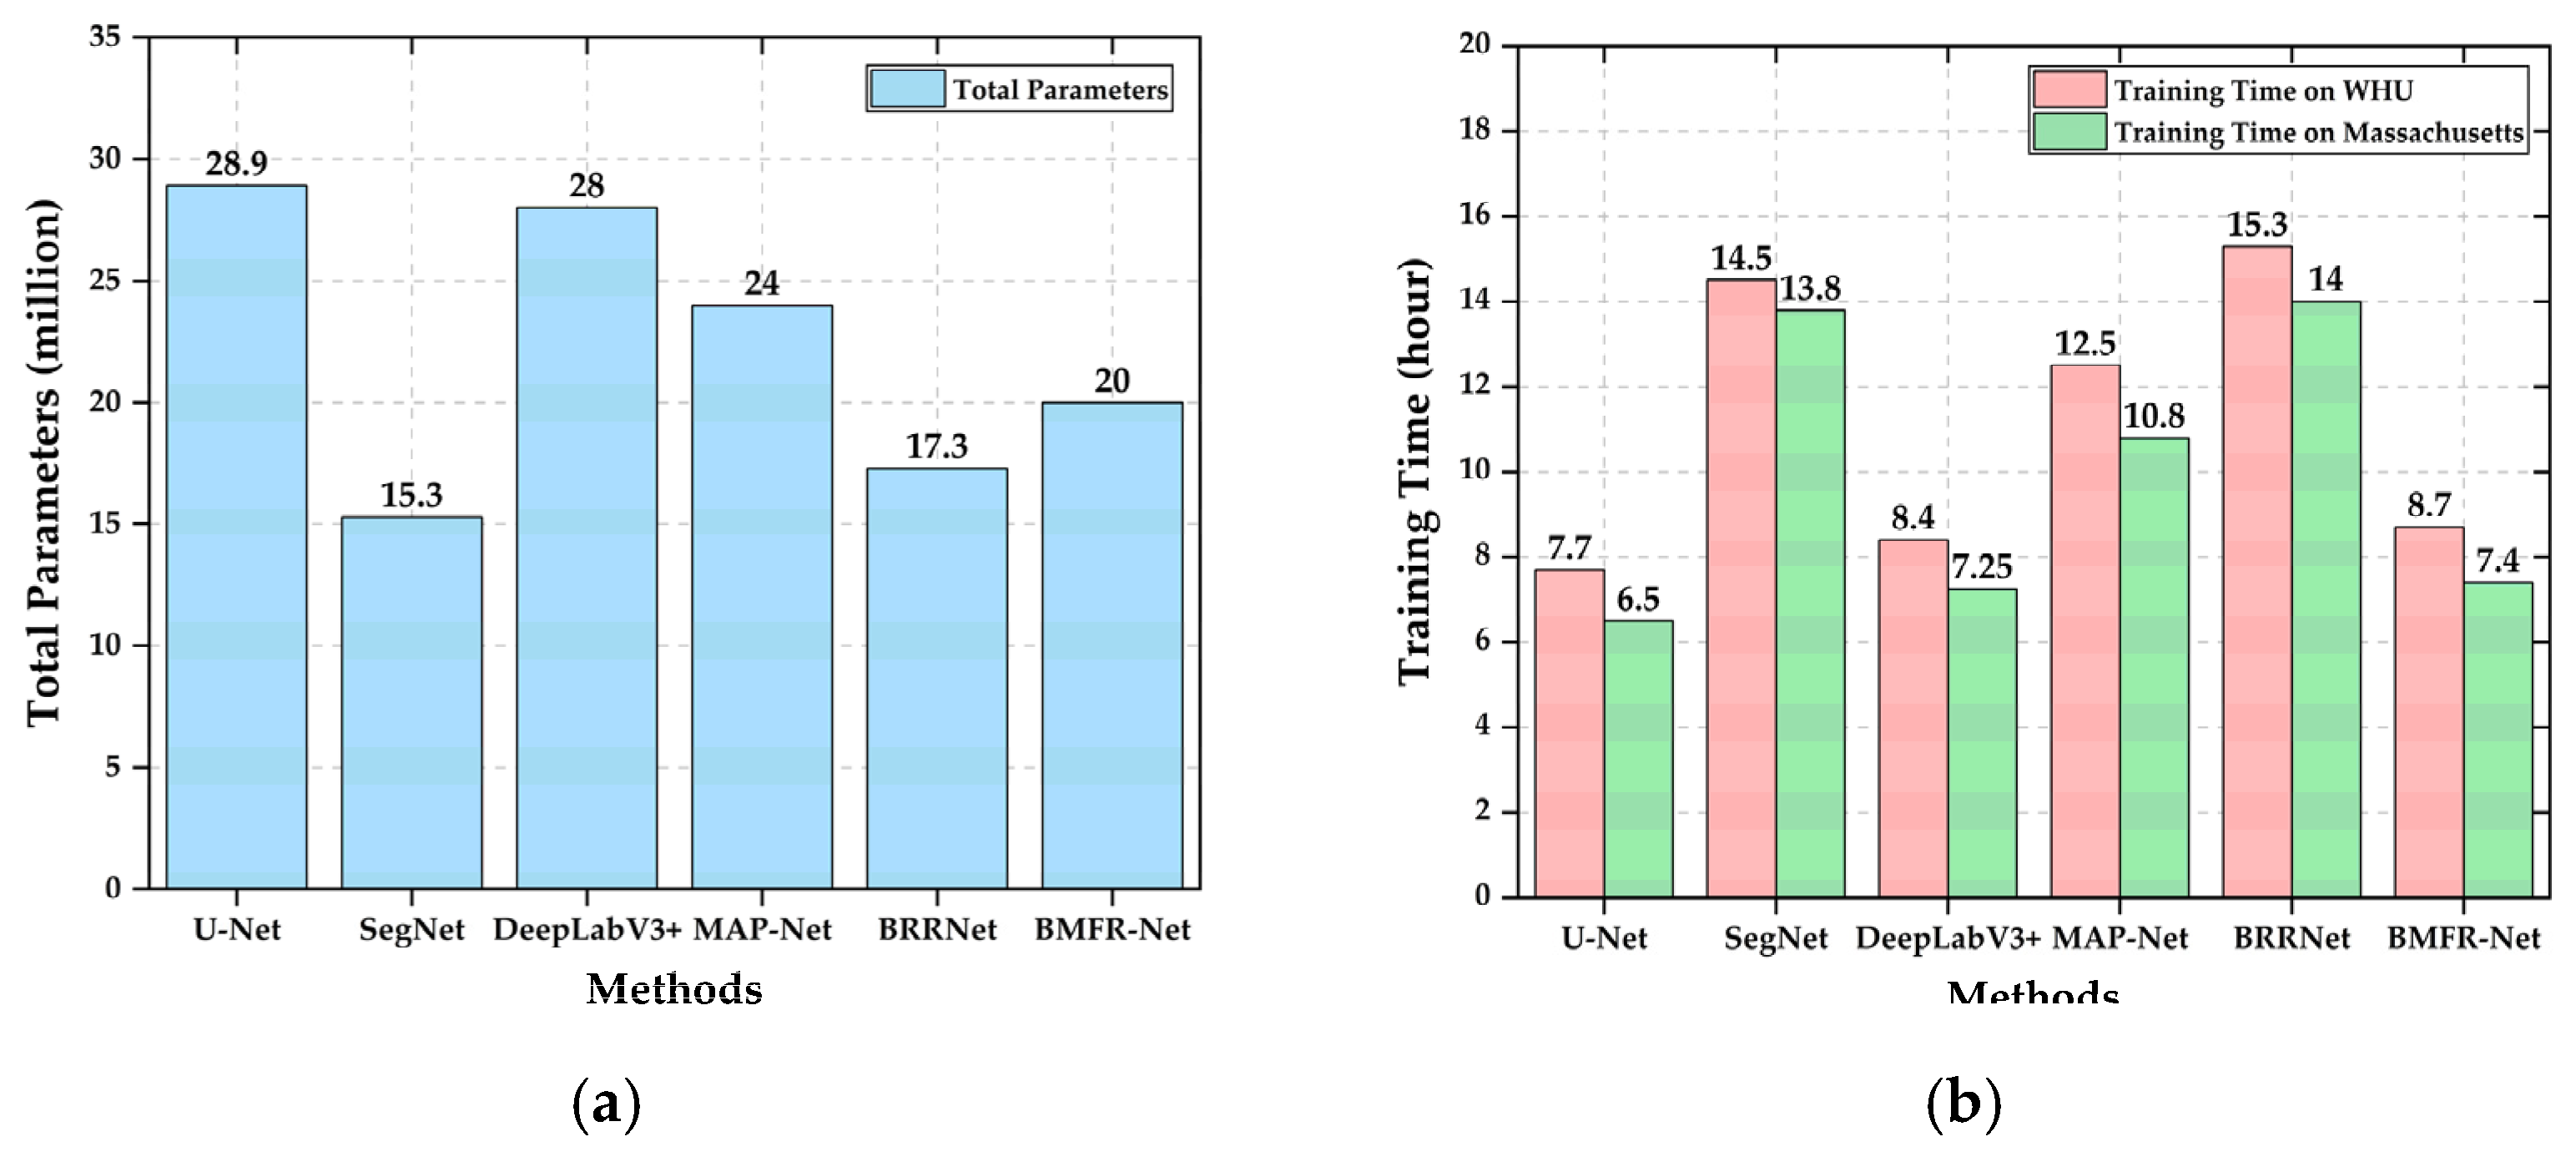
3.4.3. Comparison of Parameters and the Training Time of Different Methods

In general, as network parameters are increased, more memory is consumed during the training and prediction process. Besides, the training time is also one of the primary metrics in the assessment model. So, we compared the total parameters and training time of BMFR-Net and the five SOTA methods. The comparison results are as shown in Figure 14.
As shown in Figure 14a, the SegNet with the last encoding and first decoding stages removed had the least parameters. Although BMFR-Net had around 5 million more parameters than SegNet and the total amount of parameters reached 20 million, it still ranked in the middle of the five SOTA methods. As shown in Figure 14b, U-Net had the shortest training time for its simple network structure. Since BMFR-Net has a more powerful CACP module and a new MOFC structure, it took slightly longer to train than U-Net. Compared to SegNet with the fewest parameters, the training time on the WHU Building Dataset and the Massachusetts Building Dataset for BMFR-Net was about 6 h less on average under the same conditions, due to the sophisticated MaxPooling indices structure. Compared with DeepLabV3+, which had the second least training time, BMFR-Net had fewer parameters and better building extraction results. According to the above analysis, we could find that the BMFR-Net proposed in this paper had a more balanced efficiency performance. Even though the BMFR-Net had more parameters, it took less time to complete training under the same conditions and produced better building extraction performance.

4. Discussion

In this section, we used ablation studies to discuss the effect of the CACP module, the MOFC structure, and the multilevel weighted combination on the performance of the network. The ablation studies in this section were divided into three parts: (a) investigating the impact of the CACP module on the performance of the network; (b) verifying the correctness and effectiveness of MOFC structure; (c) exploring the influence of weight combination changes of multilevel joint weight loss function on the performance of the network. The experimental data was the WHU Building Dataset described in Section 3.1. Unless otherwise stated, all experimental conditions were consistent with Section 3.2.

4.1. Ablation Experiments of Multiscale Feature Extraction and the Fusion Module

We took U-Net as the main backbone and conducted four groups of comparative experiments to verify the effectiveness of the CACP module (as shown in Figure 4). The first group is the original U-Net. In the second group of experiments, we integrated the ASPP module into the end of the contracting path and the dilation rate of the convolution branch was set as 1, 12, and 18. In the third group of experiments, we used two groups of small-scale continuous atrous convolution with dilation rates of (1,2,3) and (1,3,5) to substitute the atrous convolution with the large-scale dilation rate in the ASPP module. The convolution layer with a kernel size of 1×1 branch in the ASPP module was replaced with the residual branch. In the last group of experiments, we first eliminated the last level of U-Net, then integrated the CACP module into the end of the U-Net contracting path. The dilation rate of the three groups of continuous atrous convolution in the CACP module was set as (1,2,3), (1,3,5), and (1,3,9) in turn. The multiscale features fusion was finally realized by adding each pixel. The experimental results and some building extraction results are shown in Table 4 and Figure 15.
According to the results listed in Table 4 and Figure 15:
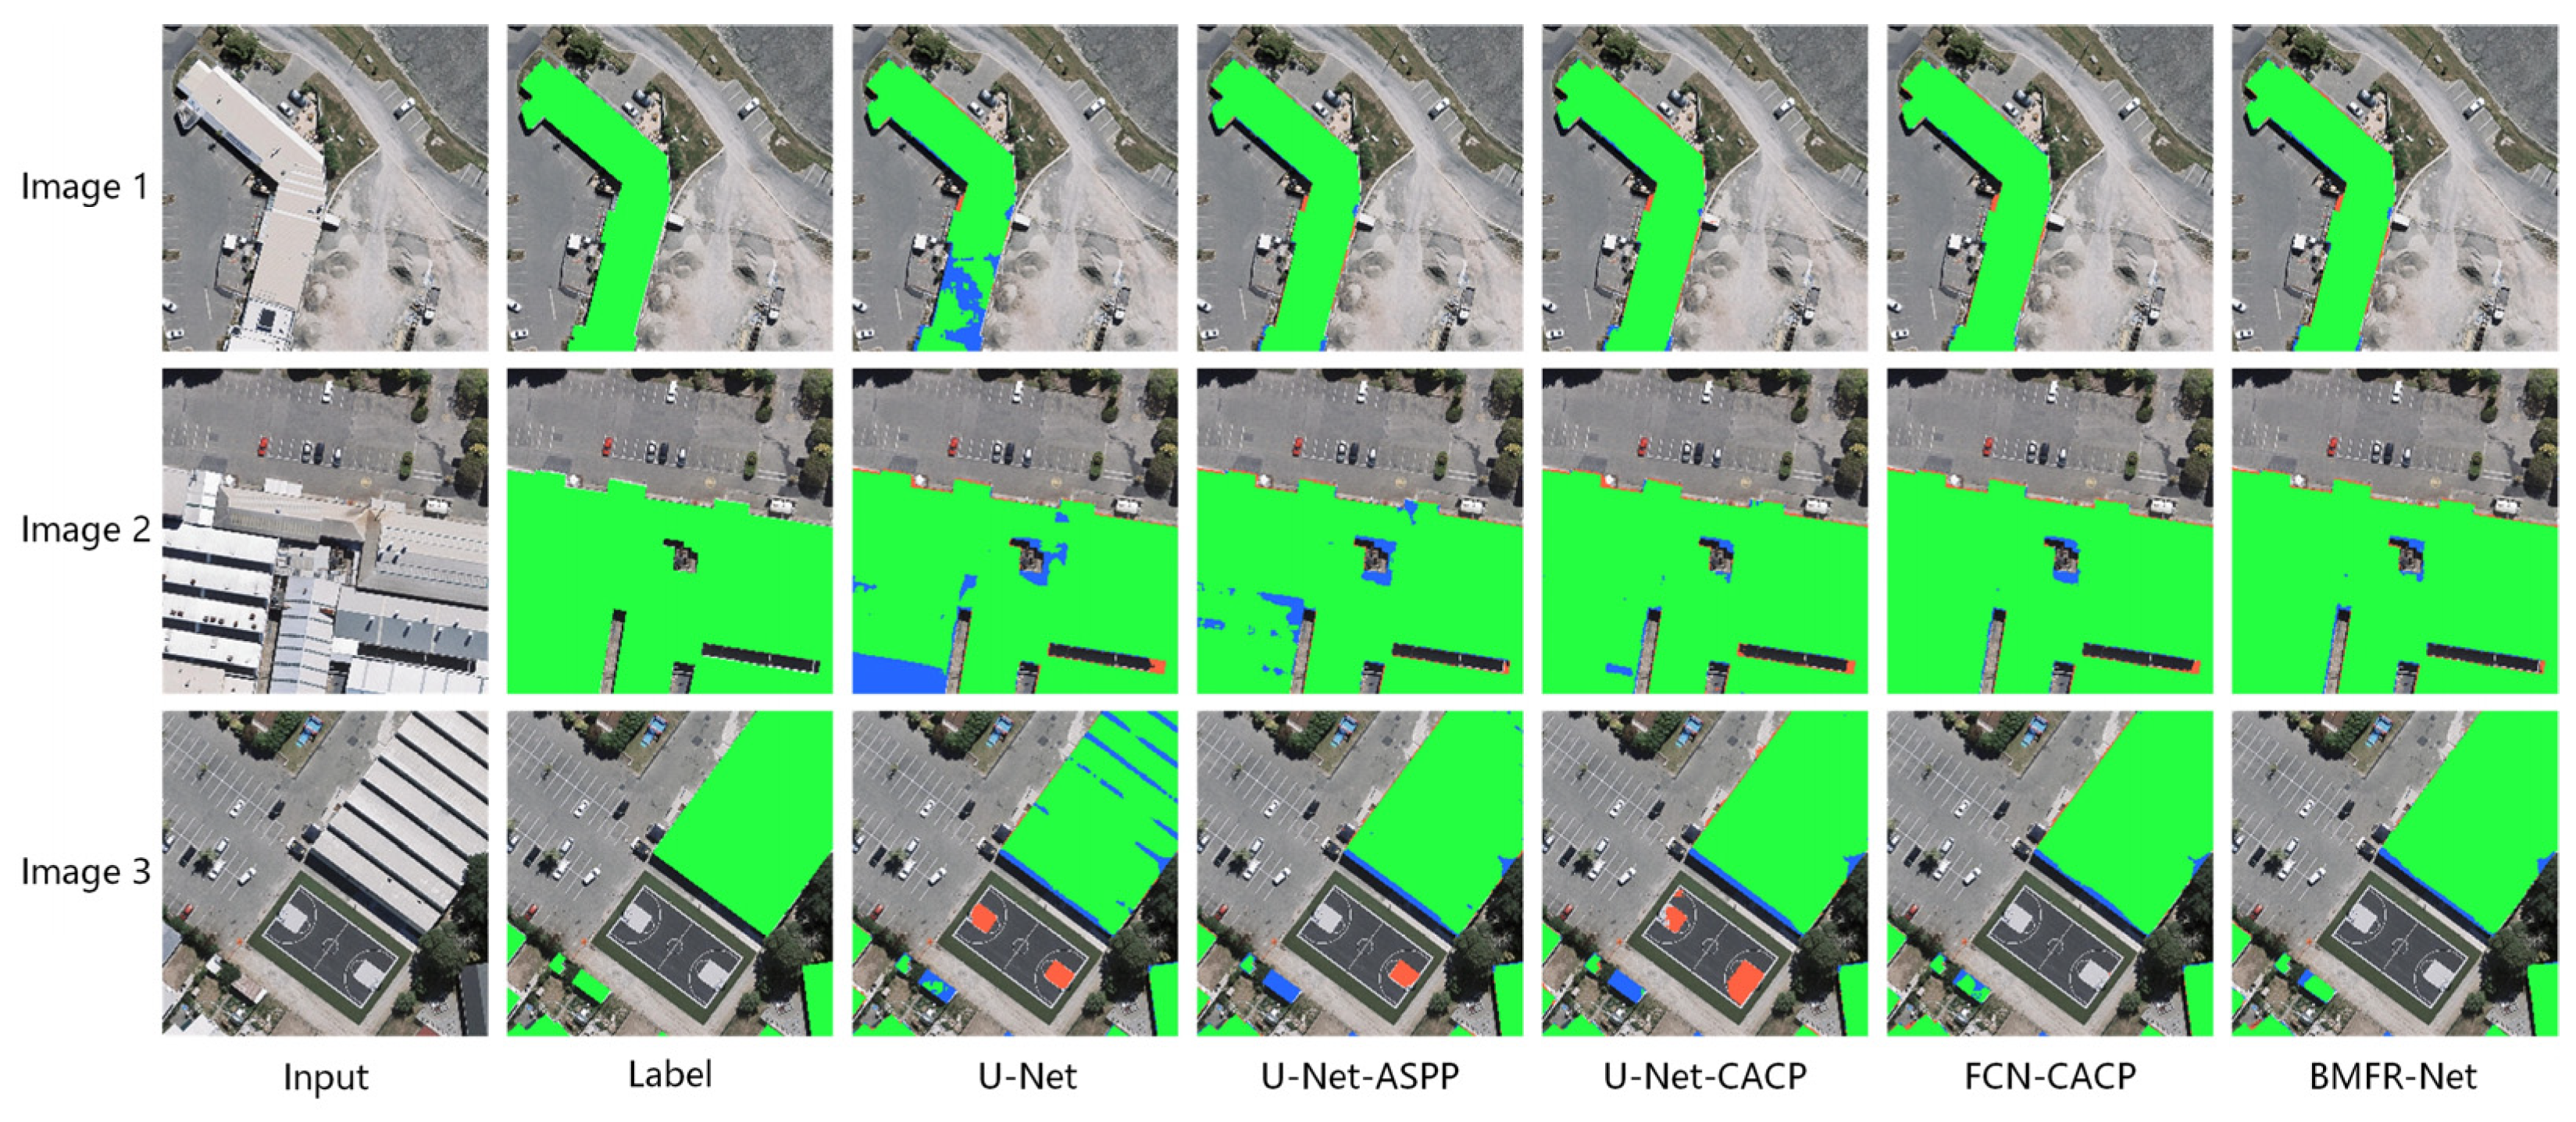
  • Compared with the other four networks, the evaluation metrics of the original U-Net were improved by adding the multiscale feature extraction and fusion module, demonstrating the efficacy of the multiscale feature extraction and fusion module.
  • By comparing the experimental results of U-Net-CACP and U-Net-ASPP, the pixel-based IoU and F1-Score of the network were improved by 0.53% and 0.3%, respectively, after replacing the ASPP module with the CACP module. Since the CACP module utilized the continuous small-scale atrous convolution in line with HDC constraints, it effectively slowed down the loss of high-level semantic information unique to buildings and enhanced the consistency of local information such as texture and geometry. Thus, the accuracy and recall of building extraction were improved.
  • In contrast with the first three networks, the FCN-CACP had the best performance in the quantitative evaluation results, with the pixel-based and object-based F1-score reaching the highest of 93.84% and 89.93%, respectively. As shown in Figure 15, FCN-CACP had the highest accuracy and contained the fewest holes and defects. By removing the last stage of U-Net, FCN-CACP retained the scale of the input CACP module function feature at 32 × 32. Consequently, it will reduce the calculation, minimize information loss of small-scale buildings and make multiscale feature extraction easier. Except for pixel-based recall, FCN-CACP had lower evaluation metrics than BMFR-Net because the addition of the MOFC structure to the BMFR-Net enhanced network performance.

4.2. Ablation Experiments of Multiscale Output Fusion Constraint

In order to validate the efficacy of the MOFC structure (as shown in Figure 5), two other kinds of multiscale output fusion constraint structures, MA-FCN [36] (as shown in Figure 16a) and MOFC_Add (as shown in Figure 16b), were introduced for comparison and analysis. MA-FCN and MOFC_Add are constructed differently in terms of how the output results are combined. In the processes of MA-FCN, we showed the production at each level of the expanding path to get the predicted results and upsampled the results to the resolution of the original image except for the last level. Then the four predicted results were fused by connecting at the end of the expanding path to obtain the final building extraction results. In the processes of MOFC_Add, we got the predicted results in the same way as MA-FCN. Then, starting from the first level of the expanding path, the first predicted result was upsampled twice and fused pixel by pixel with the second predicted outcome. The other results were upsampled in the same way until the last level. In the end, the building extraction results were generated at the end of the network. Based on U-Net, MOFC, MA-FCN, and MOFC_Add structures were constructed, respectively. In the ablation experiment, they were compared with the original U-Net. The experimental results and some building extraction results are shown in Table 5 and Figure 17.
According to the results listed in Table 5 and Figure 17:
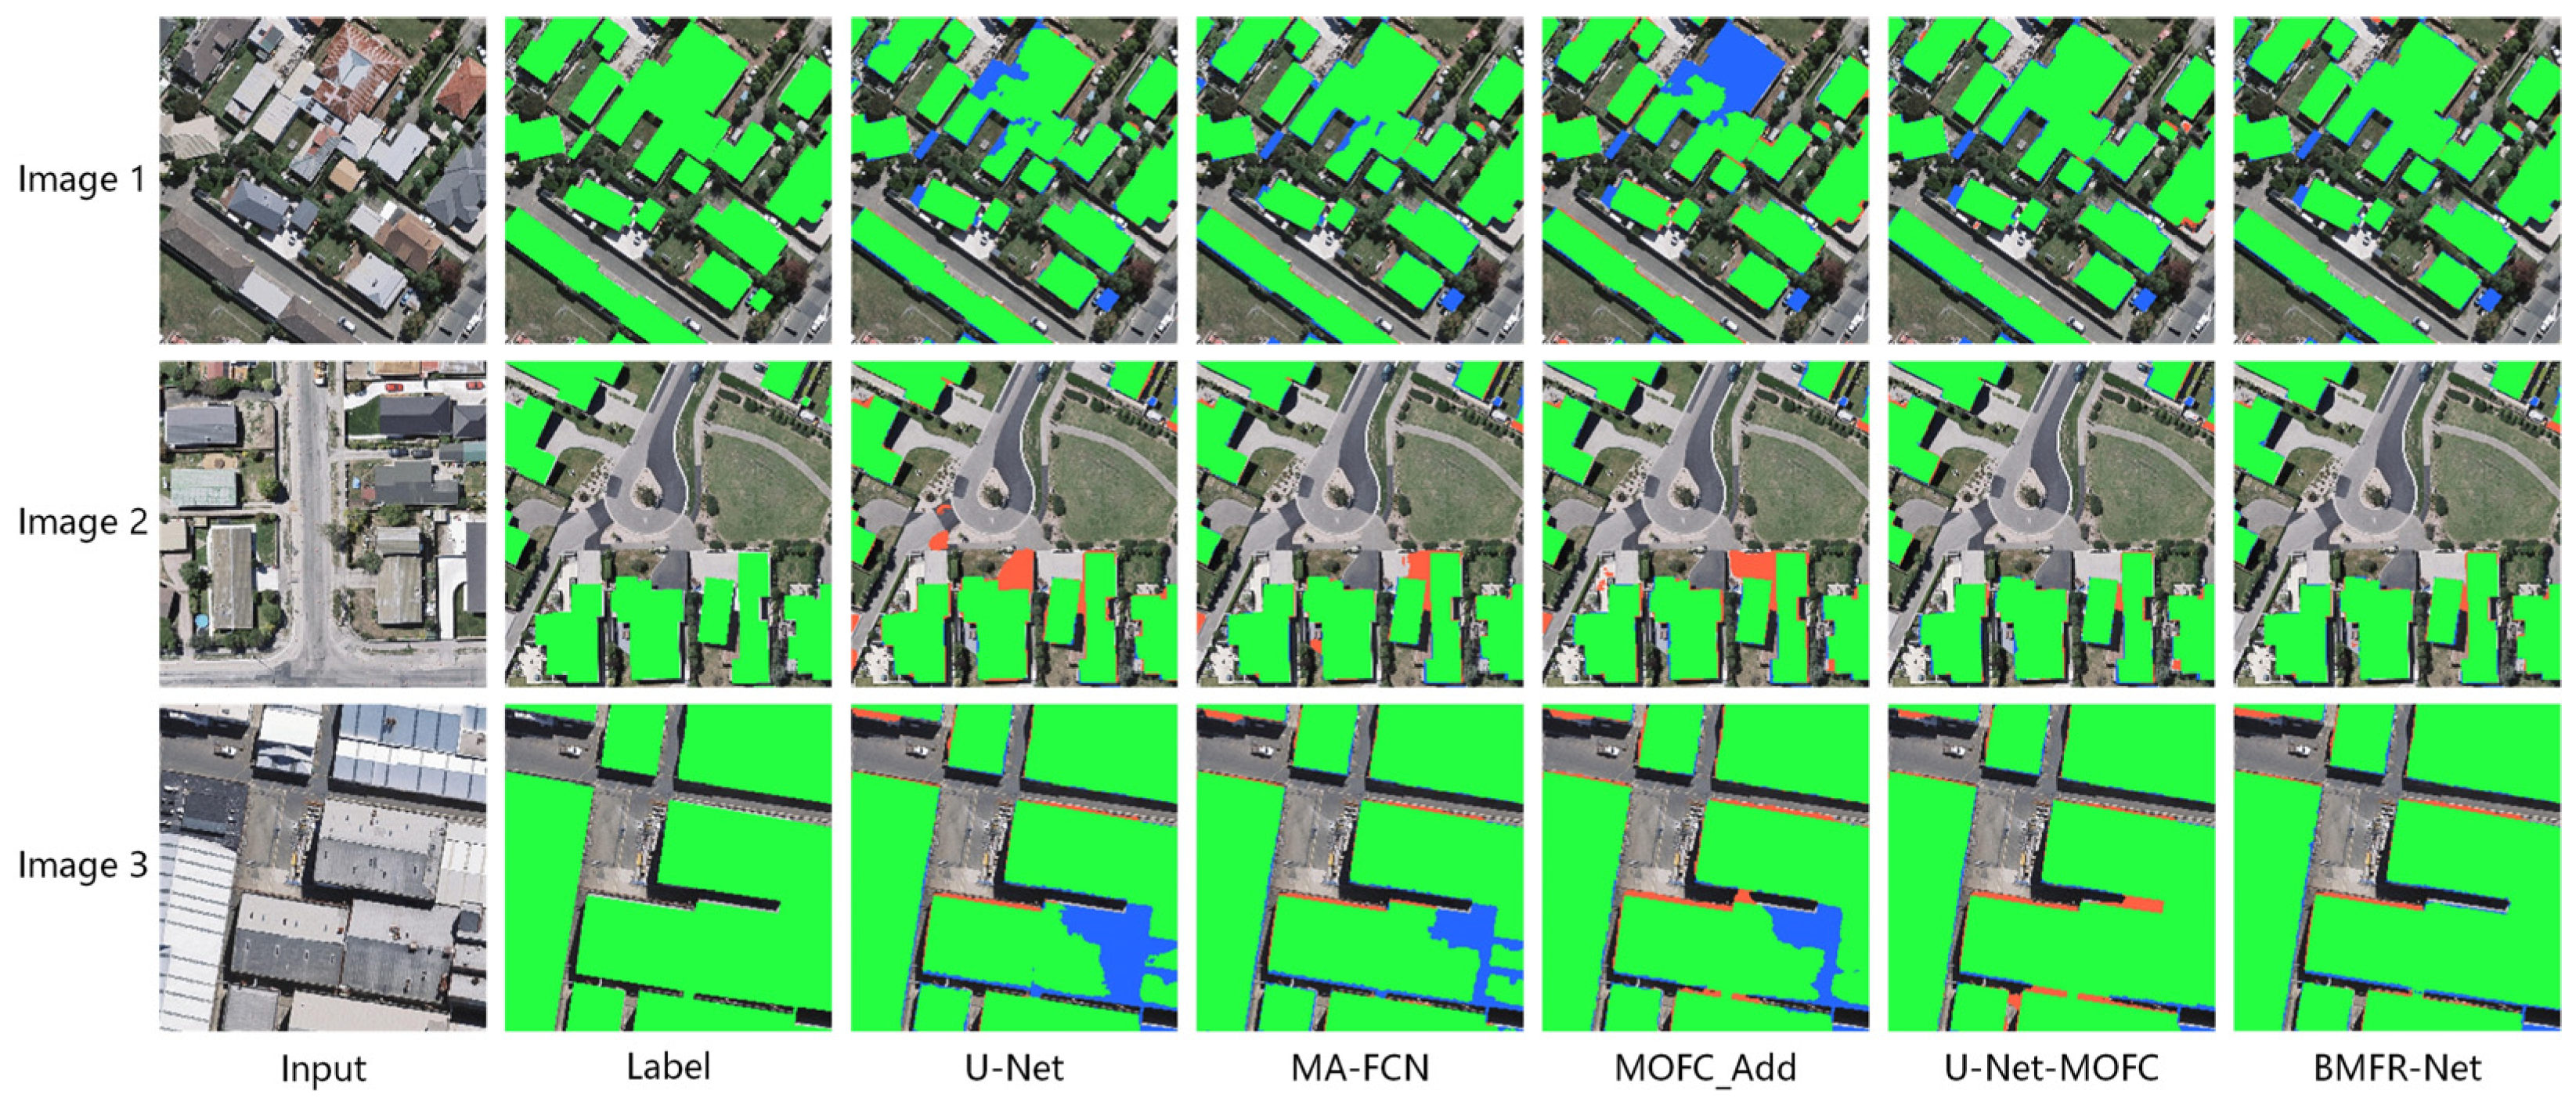
  • Compared with the original U-Net, the evaluation metrics of U-Net-MOFC and MA-FCN were significantly improved, especially the pixel-based IoU and F1-score of U-Net-MOFC that increased by 2.94% and 1.68%, respectively. In contrast, most of the evaluation metrics of MOFC_Add were reduced. It indicates that the MOFC structure was better at aggregating multiscale meaning semantic information than the others.
  • The MA-FCN performed better in pixel-based and object-based evaluation indexes than the original U-Net, but the network performance was still not as good as U-Net-MOFC. At each step of the expanding path, MA-FCN will improve the use of feature information. However, the upsampling scale was too large, resulting in a loss of effective information and a decrease in network performance. MOFC_Add had a higher recall but a lower precision, which was a significant difference. Aside from that, global performance was the worst. This is because MOFC_Add did not actively add results, making it challenging to synthesize the semantic information from different levels.
  • The second-best overall performer was U-Net-MOFC. The MOFC structure enhanced the ability to aggregate multiscale semantic information frsom the context of the network by fusing the output results of each level into the network. Furthermore, multilevel joint constraints will effectively update parameters in the contracting path layer, improving the object-based IoU and F1-score from the original U-Net by 1.28% and 1.24%, respectively. In terms of buildings with complex architectures or variable spectral characteristics in Figure 17, U-Net-MOFC can achieve more complete extraction outcomes. The highest score of F1-score belonged to BMFR-Net. After removing the last level of U-Net-MOFC and adding the CACP module, F1 increased by 0.59%.

4.3. Ablation Experiments of the Weighted Combination of the Multilevel Joint Constraint

To check the efficacy of the multilevel joint constraint and investigate the impact of the weight combination change of loss function on the performance of BMFR-Net, we used a principal component analysis to determine five different weight combinations for comparative experiments. The weight of loss function from the end level of BMFR-Net to the beginning level of the expanding path was marked as ω 1 ,   ω 2 ,   ω 3 ,   ω 4 and we ensured the sum of them was 1. The ablation experiment results of the five groups with different weight combinations are shown in Table 6 and Figure 18.
According to the results listed in Table 6 and Figure 18:
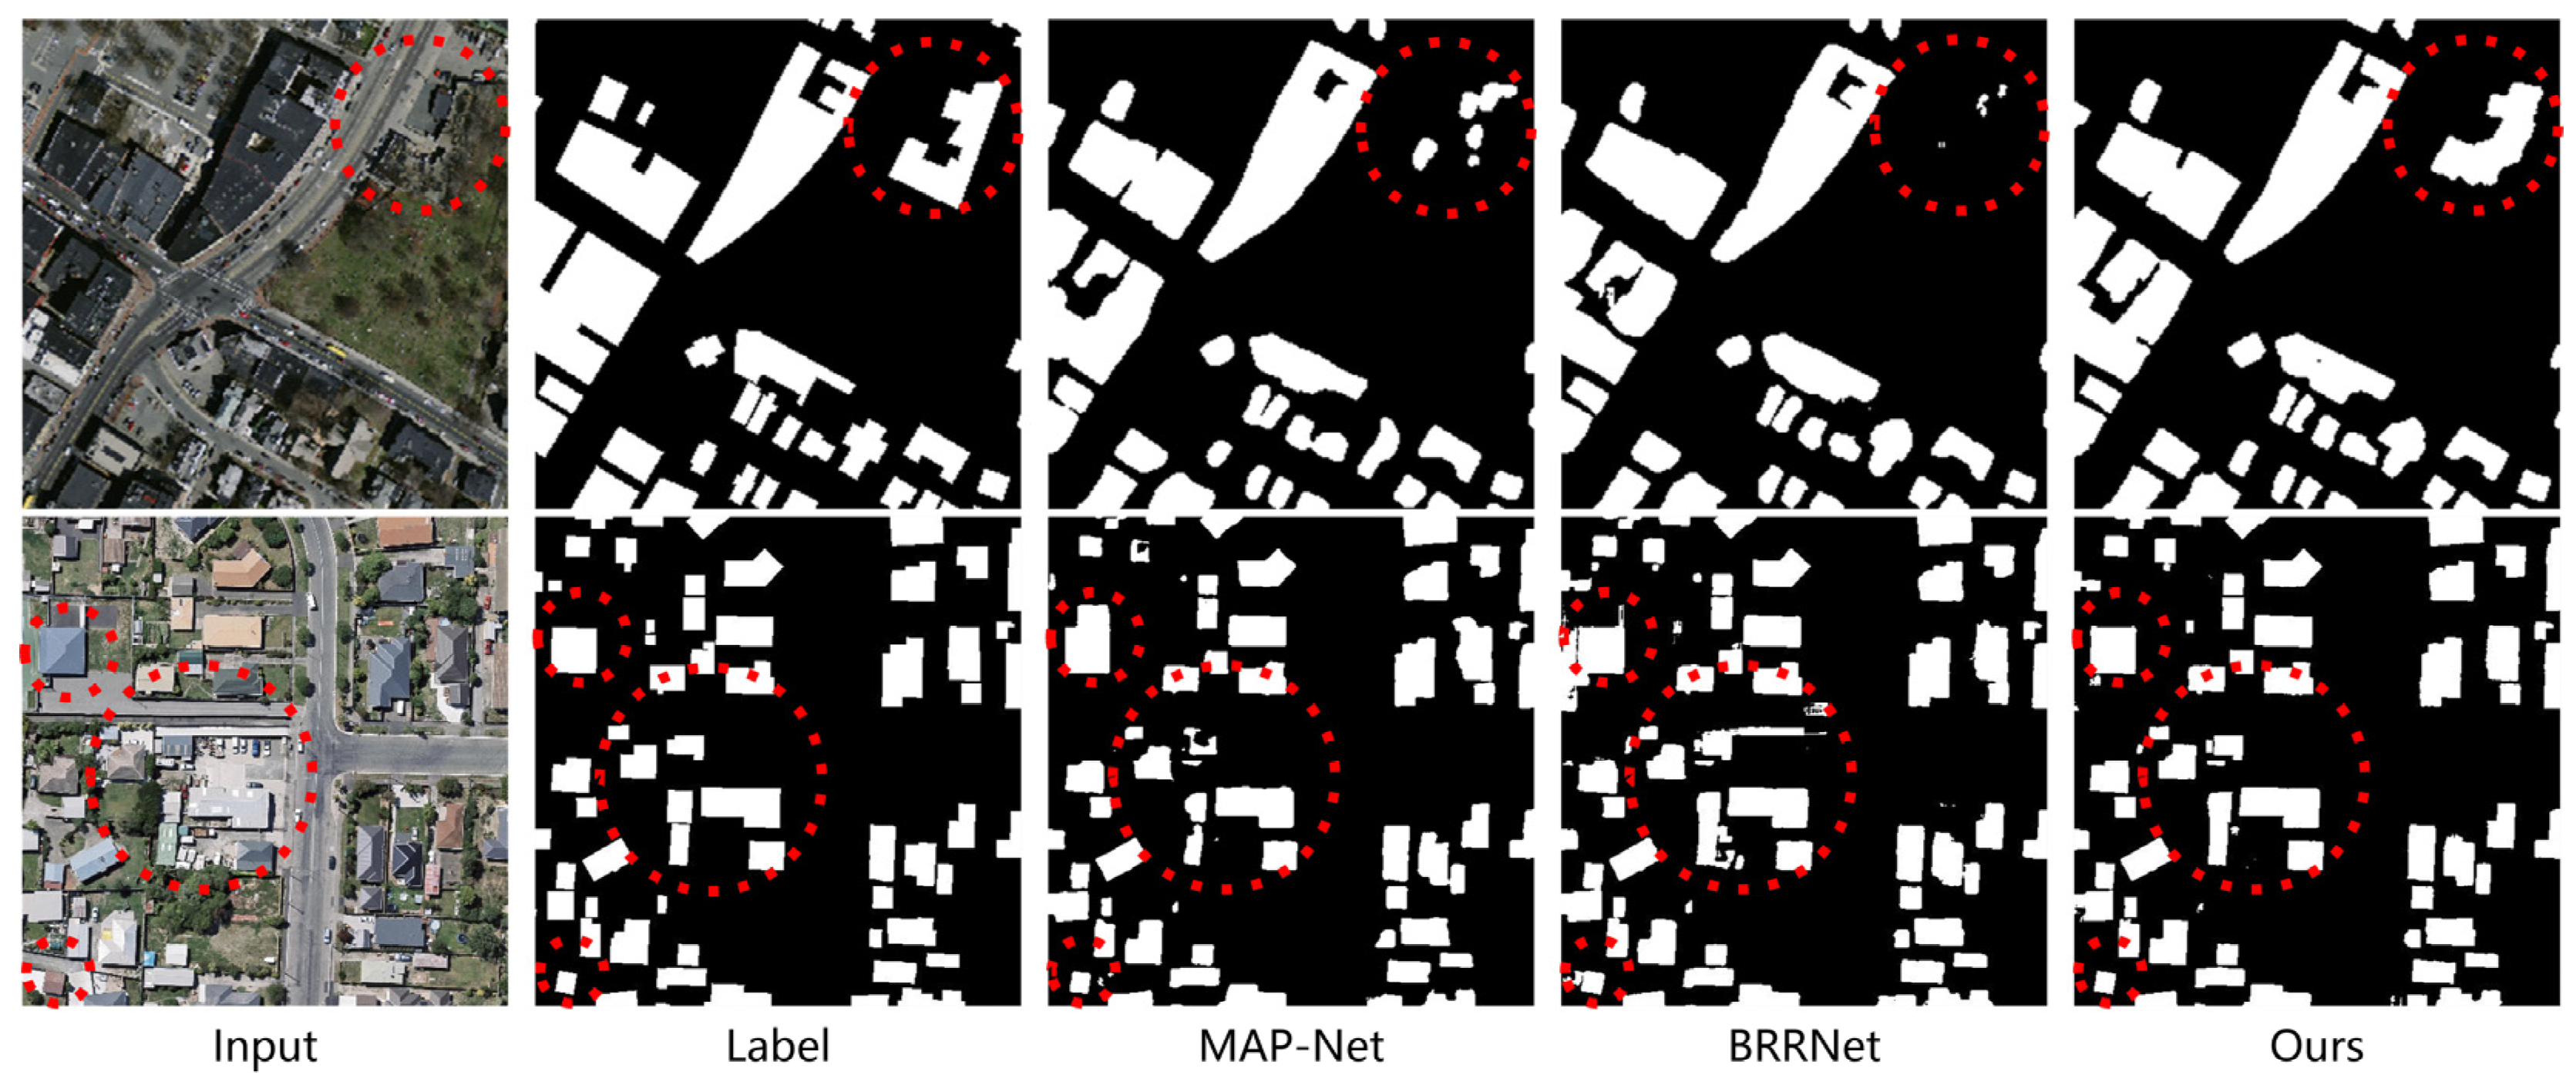
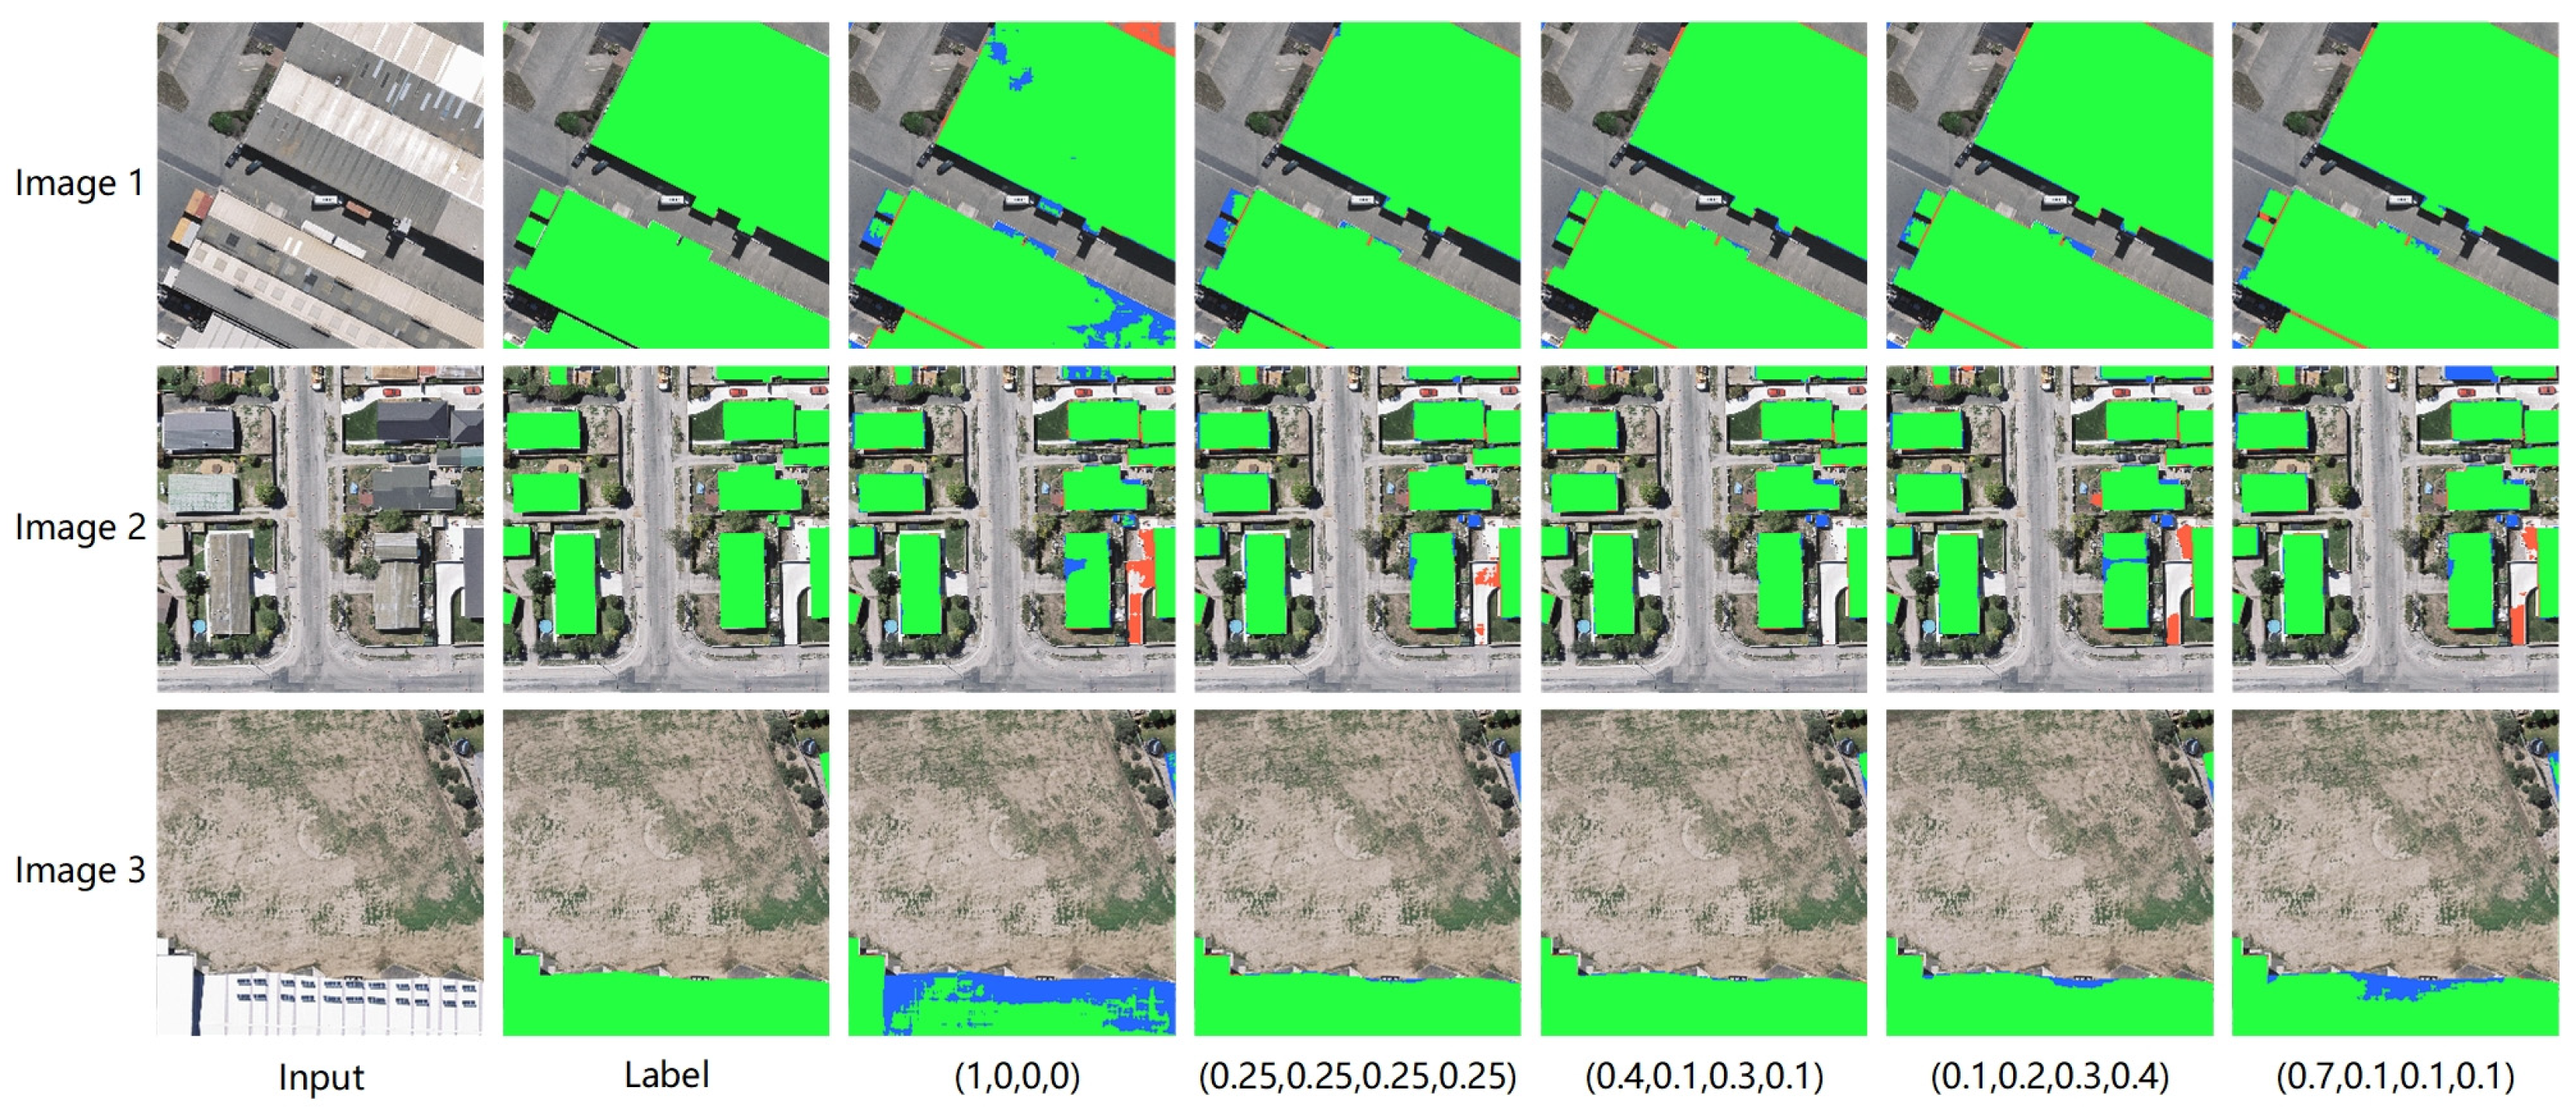
  • The global extraction effect of (1,0,0,0) was the worst. It had a poor pixel-based recall of 93.71% but a high pixel-based precision of 94.56%. The explanation for this is that BMFR-Net has deep layers and it is difficult to effectively update the parameters in the contracting path in BMFR-Net, which are located far away from the output layer due to the single level loss constraint. As a result, the ability of the network to learn local information such as the color and edge from low-level features is harmed and the recall of building extraction results is reduced. As shown in image 1 in Figure 18, the BMFR-Net buildings with the weight combination of (1,0,0,0) were missing, while the buildings extracted by the BMFR-Net with multilevel joint constraints were more complete.
  • By contrast, the pixel-based and object-based F1-score of (0.4,0.3,0.2,0.1) was the highest, reaching 94.23% and 89.30%, respectively. From the bottom to the top of the BMFR-Net expanding path, the resolution and global meaning semantic information of the feature maps gradually increased and were enriched. The loss function became increasingly influential in updating the parameters as it progressed from the low-level to high-level. Therefore, the weight combination of (0.4,0.3,0.2,0.1) was best for balancing the requirement of primary and secondary constraints in the network, and the building extraction effect was better. As shown in images 2 and 3 in Figure 18, the accuracy and integrity of building extraction results in (0.4,0.3,0.2,0.1) were higher than others.
  • Comparing the results of (0.4,0.3,0.2,0.1) with (0.7,0.1,0.1,0.1), it is clear that when ω 1 is enlarged, the overall performance of the network will decrease. Although the last level loss function is the primary constraint of the network, an unrestricted increase in its weight and a decrease in the weight of other levels would cause the network parameters to overfit the key constraints. Therefore, the parameters in the contracting path layers can not be effectively updated, limiting the accuracy of building extraction.

5. Conclusions

In this paper, we designed an improved full convolutional network named BMFR-Net to address the issue of incomplete and incorrect identification in extraction results caused by buildings with variable texture materials and foreign objects with the same spectrum. The main backbone of BMFR-Net is U-Net, where the last level has been removed. BMFR-Net mainly includes the CACP module and the MOFC structure. By performing parallel small-scale atrous convolution operations in accordance with HDC constraints, the CACP module effectively slowed down the loss of adequate information in the process of multiscale function extraction. The MOFC structure integrated the multiscale output results into the network to strengthen the ability to aggregate the semantic information from the context and it employed the multilevel joint weighted loss function to update the parameters in the contracting path in BMFR-Net, which were located far away from the output layer effectively. Both of them collaborated to increase building extraction precision. The pixel-based and object-based F1-score of BMFR-Net on the WHU Building Dataset and Massachusetts Building Dataset reached 94.36% and 90.12% and 85.14% and 84.14%, respectively. Compared with the other five SOTA approaches, BMFR-Net outperformed them all in both visual interpretation and quantitative evaluation. The extracted buildings were more accurate and complete. In addition, we experimentally validated the effectiveness of the multilevel joint weighted dice loss function, which could on average improve the pixel-based F1-score and IoU by about 0.4% and 0.67% of the model, respectively. Additionally, the precision and recall were better balanced. Furthermore, the ablation studies confirmed the effectiveness of the CACP module and the MOFC structure efficacy and clarified the relationship between different weight coefficients and network performance.
Although the proposed network performed well on two public datasets, there were still some shortcomings. First of all, the number of network parameters was still rather high, at 20.0 million, which necessitates additional memory and training time, reducing deployment efficiency. Furthermore, the BMFR-Net and other existing models rely too much on the training and learning of a massive amount of manual label data, resulting in a significant rise in network training costs. In the future, we will improve BMFR-Net and create a lightweight semi-supervised building extraction neural network to improve computational efficiency and reduce the dependence on manual label data.

Supplementary Materials

Codes and models that support this study are available at the GitHub link: https://github.com/RanKoala/BMFR-Net.

Author Contributions

S.R., Y.Y. and X.G. conceived and conducted the experiments and performed the data analysis. G.Z. assisted in collating experiment data. S.L. and P.W. revised the manuscript. S.R. wrote the article. All authors have read and agreed to the published version of the manuscript.

Funding

This research is supported by Open Fund of Key Laboratory of National Geographic Census and Monitoring, Ministry of Natural Resources Open Fund (No. 2020NGCM07); Open Fund of National Engineering Laboratory for Digital Construction and Evaluation Technology of Urban Rail Transit(No.2021ZH02); Open Fund of Hunan Provincial Key Laboratory of Geo-Information Engineering in Surveying, Mapping and Remote Sensing, Hunan University of Science and Technology (No.E22133); Open Fund of Beijing Key Laboratory of Urban Spatial Information Engineering (No.20210205); the Open Research Fund of Key Laboratory of Earth Observation of Hainan Province (No.2020LDE001); the National Natural Science Foundation of China (No. 41872129).

Institutional Review Board Statement

Not applicable.

Informed Consent Statement

Not applicable.

Data Availability Statement

The WHU Building Dataset from http://gpcv.whu.edu.cn/data/building_dataset.html, (accessed on 15 July 2021). The Massachusetts Building Dataset from https://www.cs.toronto.edu/~vmnih/data/, (accessed on 15 July 2021).

Acknowledgments

We would like to thank the anonymous reviewers for their constructive and valuable suggestions on the earlier drafts of this manuscript.

Conflicts of Interest

The authors declare no conflict of interest.

References

  1. Shrestha, S.; Vanneschi, L. Improved Fully Convolutional Network with Conditional Random Fields for Building Extraction. Remote Sens. 2018, 10, 1135. [Google Scholar] [CrossRef] [Green Version]
  2. Huang, X.; Zhang, L. Morphological Building/Shadow Index for Building Extraction From High-Resolution Imagery Over Urban Areas. IEEE J. Sel. Top. Appl. Earth Obs. Remote Sens. 2012, 5, 161–172. [Google Scholar] [CrossRef]
  3. Huang, X.; Zhang, L. A Multidirectional and Multiscale Morphological Index for Automatic Building Extraction from Multispectral GeoEye-1 Imagery. Photogramm. Eng. Remote Sens. 2011, 77, 721–732. [Google Scholar] [CrossRef]
  4. Li, W.; He, C.; Fang, J.; Zheng, J.; Fu, H.; Yu, L. Semantic Segmentation-Based Building Footprint Extraction Using Very High-Resolution Satellite Images and Multi-Source GIS Data. Remote Sens. 2019, 11, 403. [Google Scholar] [CrossRef] [Green Version]
  5. Jung, C.R.; Schramm, R. Rectangle Detection based on a Windowed Hough Transform. In Proceedings of the 17th Brazilian Symposium on Computer Graphics & Image Processing, Curitiba, Brazil, 17–20 October 2004; pp. 113–120. [Google Scholar]
  6. Sirmacek, B.; Unsalan, C. Urban-Area and Building Detection Using SIFT Keypoints and Graph Theory. IEEE Trans. Geosci. Remote Sens. 2009, 47, 1156–1167. [Google Scholar]
  7. Gao, X.; Wang, M.; Yang, Y.; Li, G. Building Extraction From RGB VHR Images Using Shifted Shadow Algorithm. IEEE Access. 2018, 6, 22034–22045. [Google Scholar] [CrossRef]
  8. Inglada, J. Automatic recognition of man-made objects in high resolution optical remote sensing images by SVM classification of geometric image features. ISPRS J. Photogramm. Remote Sens. 2007, 62, 236–248. [Google Scholar] [CrossRef]
  9. Boulila, W.; Sellami, M.; Driss, M.; Al-Sarem, M.; Ghaleb, F.A. RS-DCNN: A novel distributed convolutional-neural-networks based-approach for big remote-sensing image classification. Comput. Electron. Agric. 2021, 182, 106014. [Google Scholar] [CrossRef]
  10. Han, W.; Feng, R.; Wang, L.; Cheng, Y. A semi-supervised generative framework with deep learning features for high-resolution remote sensing image scene classification. ISPRS J. Photogramm. Remote Sens. 2018, 145, 23–43. [Google Scholar] [CrossRef]
  11. Ma, A.; Wan, Y.; Zhong, Y.; Wang, J.; Zhang, L. SceneNet: Remote sensing scene classification deep learning network using multi-objective neural evolution architecture search. ISPRS J. Photogramm. Remote Sens. 2021, 172, 171–188. [Google Scholar] [CrossRef]
  12. Mnih, V. Machine Learning for Aerial Image Labeling. Ph.D. Thesis, University of Toronto, Toronto, ON, Canada, 2013. [Google Scholar]
  13. Saito, S.; Yamashita, T.; Aoki, Y. Multiple Object Extraction from Aerial Imagery with Convolutional Neural Networks. J. Imaging Sci. Technol. 2016, 60, 10402.10401–10402.10409. [Google Scholar] [CrossRef]
  14. Long, J.; Shelhamer, E.; Darrell, T. Fully convolutional networks for semantic segmentation. In Proceedings of the 2015 IEEE Conference on Computer Vision and Pattern Recognition (CVPR), Boston, MA, USA, 7–12 June 2015; pp. 3431–3440. [Google Scholar]
  15. Liu, W.; Yang, M.; Xie, M.; Guo, Z.; Li, E.; Zhang, L.; Pei, T.; Wang, D. Accurate Building Extraction from Fused DSM and UAV Images Using a Chain Fully Convolutional Neural Network. Remote Sens. 2019, 11, 2912. [Google Scholar] [CrossRef] [Green Version]
  16. Maggiori, E.; Tarabalka, Y.; Charpiat, G.; Alliez, P. Convolutional Neural Networks for Large-Scale Remote-Sensing Image Classification. IEEE Trans. Geosci. Remote Sens. 2017, 55, 645–657. [Google Scholar] [CrossRef] [Green Version]
  17. Marmanis, D.; Wegner, J.D.; Galliani, S.; Schindler, K.; Datcu, M.; Stilla, U. Semantic Segmentation of Aerial Images with an Ensemble of CNSS. In Proceedings of the ISPRS Annals of the Photogrammetry, Remote Sensing and Spatial Information Sciences, Prague, Czech Republic, 12–19 July 2016; pp. 473–480. [Google Scholar]
  18. Alshehhi, R.; Marpu, P.R.; Woon, W.L.; Mura, M.D. Simultaneous extraction of roads and buildings in remote sensing imagery with convolutional neural networks. ISPRS J. Photogramm. Remote Sens. 2017, 130, 139–149. [Google Scholar] [CrossRef]
  19. Yu, Y.; Ren, Y.; Guan, H.; Li, D.; Yu, C.; Jin, S.; Wang, L. Capsule Feature Pyramid Network for Building Footprint Extraction From High-Resolution Aerial Imagery. IEEE Geosci. Remote Sens. Lett. 2021, 18, 895–899. [Google Scholar] [CrossRef]
  20. Hui, J.; Du, M.; Ye, X.; Qin, Q.; Sui, J. Effective Building Extraction From High-Resolution Remote Sensing Images With Multitask Driven Deep Neural Network. IEEE Geosci. Remote Sens. Lett. 2019, 16, 786–790. [Google Scholar] [CrossRef]
  21. Bittner, K.; Adam, F.; Cui, S.; Körner, M.; Reinartz, P. Building Footprint Extraction From VHR Remote Sensing Images Combined With Normalized DSMs Using Fused Fully Convolutional Networks. IEEE J. Sel. Top. Appl. Earth Obs. Remote Sens. 2018, 11, 2615–2629. [Google Scholar] [CrossRef] [Green Version]
  22. Huang, J.; Zhang, X.; Xin, Q.; Sun, Y.; Zhang, P. Automatic building extraction from high-resolution aerial images and LiDAR data using gated residual refinement network. ISPRS J. Photogramm. Remote Sens. 2019, 151, 91–105. [Google Scholar] [CrossRef]
  23. Hu, Q.; Zhen, L.; Mao, Y.; Zhou, X.; Zhou, G. Automated building extraction using satellite remote sensing imagery. Autom. Constr. 2021, 123, 103509. [Google Scholar] [CrossRef]
  24. Zhu, Q.; Li, Z.; Zhang, Y.; Guan, Q. Building Extraction from High Spatial Resolution Remote Sensing Images via Multiscale-Aware and Segmentation-Prior Conditional Random Fields. Remote Sens. 2020, 12, 3983. [Google Scholar] [CrossRef]
  25. Szegedy, C.; Liu, W.; Jia, Y.; Sermanet, P.; Reed, S.; Anguelov, D.; Erhan, D.; Vanhoucke, V.; Rabinovich, A. Going deeper with convolutions. In Proceedings of the 2015 IEEE Conference on Computer Vision and Pattern Recognition (CVPR), Boston, MA, USA, 7–12 June 2015; pp. 1–9. [Google Scholar]
  26. Zhao, H.; Shi, J.; Qi, X.; Wang, X.; Jia, J. Pyramid Scene Parsing Network. In Proceedings of the 2017 IEEE Conference on Computer Vision and Pattern Recognition (CVPR), Honolulu, HI, USA, 21–26 July 2017; pp. 6230–6239. [Google Scholar]
  27. Yu, F.; Koltun, V. Multi-Scale Context Aggregation by Dilated Convolutions. arXiv 2015, arXiv:1511.07122. [Google Scholar]
  28. Chen, L.C.; Papandreou, G.; Kokkinos, I.; Murphy, K.; Yuille, A.L. DeepLab: Semantic Image Segmentation with Deep Convolutional Nets, Atrous Convolution, and Fully Connected CRFs. IEEE Trans. Pattern Anal. Mach. Intell. 2018, 40, 834–848. [Google Scholar] [CrossRef]
  29. Deng, W.; Shi, Q.; Li, J. Attention-Gate-Based Encoder–Decoder Network for Automatical Building Extraction. IEEE J. Sel. Top. Appl. Earth Obs. Remote Sens. 2021, 14, 2611–2620. [Google Scholar] [CrossRef]
  30. Liu, W.; Xu, J.; Guo, Z.; Li, E.; Liu, W. Building Footprint Extraction From Unmanned Aerial Vehicle Images Via PRU-Net: Application to Change Detection. IEEE J. Sel. Top. Appl. Earth Obs. Remote Sens. 2021, 14, 2236–2248. [Google Scholar] [CrossRef]
  31. Zhu, Q.; Liao, C.; Hu, H.; Mei, X.; Li, H. MAP-Net: Multiple Attending Path Neural Network for Building Footprint Extraction From Remote Sensed Imagery. IEEE Trans. Geosci. Remote Sens. 2021, 59, 6169–6181. [Google Scholar] [CrossRef]
  32. Shao, Z.; Tang, P.; Wang, Z.; Saleem, N.; Sommai, C. BRRNet: A Fully Convolutional Neural Network for Automatic Building Extraction From High-Resolution Remote Sensing Images. Remote Sens. 2020, 12, 1050. [Google Scholar] [CrossRef] [Green Version]
  33. Badrinarayanan, V.; Kendall, A.; Cipolla, R. SegNet: A Deep Convolutional Encoder-Decoder Architecture for Image Segmentation. IEEE Trans. Pattern Anal. Mach. Intell. 2017, 39, 2481–2495. [Google Scholar] [CrossRef]
  34. Ronneberger, O.; Fischer, P.; Brox, T. U-Net: Convolutional Networks for Biomedical Image Segmentation. In Proceedings of the International Conference on Medical Image Computing and Computer-Assisted Intervention, Munich, Germany, 5–9 October 2015; pp. 234–241. [Google Scholar]
  35. Diakogiannis, F.I.; Waldner, F.; Caccetta, P.; Wu, C. ResUNet-a: A deep learning framework for semantic segmentation of remotely sensed data. ISPRS J. Photogramm. Remote Sens. 2020, 162, 94–114. [Google Scholar] [CrossRef] [Green Version]
  36. Wei, S.; Ji, S.; Lu, M. Toward Automatic Building Footprint Delineation From Aerial Images Using CNN and Regularization. IEEE Trans. Geosci. Remote Sens. 2020, 58, 2178–2189. [Google Scholar] [CrossRef]
  37. Hosseinpoor, H.; Samadzadegan, F. Convolutional Neural Network for Building Extraction from High-Resolution Remote Sensing Images. In Proceedings of the 2020 International Conference on Machine Vision and Image Processing (MVIP), Tehran, Iran, 18–20 February 2020; pp. 1–5. [Google Scholar]
  38. Ji, S.; Wei, S.; Lu, M. Fully Convolutional Networks for Multisource Building Extraction From an Open Aerial and Satellite Imagery Data Set. IEEE Trans. Geosci. Remote Sens. 2018, 57, 574–586. [Google Scholar] [CrossRef]
  39. Wang, P.; Chen, P.; Yuan, Y.; Liu, D.; Huang, Z.; Hou, X.; Cottrell, G. Understanding Convolution for Semantic Segmentation. In Proceedings of the 2018 IEEE Winter Conference on Applications of Computer Vision (WACV), Lake Tahoe, NV, USA, 12–15 March 2018; pp. 1451–1460. [Google Scholar]
  40. He, K.; Zhang, X.; Ren, S.; Jian, S. Deep Residual Learning for Image Recognition. In Proceedings of the 2016 IEEE Conference on Computer Vision and Pattern Recognition (CVPR), Las Vegas, NV, USA, 27–30 June 2016; pp. 770–778. [Google Scholar]
  41. Lin, T.Y.; Dollar, P.; Girshick, R.; He, K.; Hariharan, B.; Belongie, S. Feature Pyramid Networks for Object Detection. In Proceedings of the 2017 IEEE Conference on Computer Vision and Pattern Recognition (CVPR), Honolulu, HI, USA, 21–26 July 2017; pp. 936–944. [Google Scholar]
  42. Boer, P.T.D.; Kroese, D.P.; Mannor, S.; Rubinstein, R.Y. A Tutorial on the Cross-Entropy Method. Ann. Oper. Res. 2005, 134, 19–67. [Google Scholar] [CrossRef]
  43. Milletari, F.; Navab, N.; Ahmadi, S.A. V-Net: Fully Convolutional Neural Networks for Volumetric Medical Image Segmentation. In Proceedings of the 2016 Fourth International Conference on 3D Vision (3DV), Stanford, CA, USA, 25–28 October 2016; pp. 565–571. [Google Scholar]
  44. Google. TensorFlow 1.14. Available online: https://tensorflow.google.cn/ (accessed on 15 July 2021).
  45. Chollet, F. Keras 2.2.4. Available online: https://keras.io/ (accessed on 15 July 2021).
  46. Kingma, D.; Ba, J. Adam: A Method for Stochastic Optimization. arXiv 2014, arXiv:1412.6980. [Google Scholar]
  47. Ok, A.O.; Senaras, C.; Yuksel, B. Automated Detection of Arbitrarily Shaped Buildings in Complex Environments From Monocular VHR Optical Satellite Imagery. IEEE Trans. Geosci. Remote Sens. 2013, 51, 1701–1717. [Google Scholar] [CrossRef]
  48. Chen, L.-C.; Zhu, Y.; Papandreou, G.; Schroff, F.; Adam, H. Encoder-Decoder with Atrous Separable Convolution for Semantic Image Segmentation. In Proceedings of the European Conference on Computer Vision (ECCV), Munich, Germany, 8–14 September 2018; pp. 833–851. [Google Scholar]
Figure 1. Typical building extraction results by some existing methods in the spectrum confusion area.
Remotesensing 13 02794 g001
Figure 2. The overall structure of the proposed building multi-feature fusion refined network (BMFR-Net). The upper part is the contraction path, the middle part is the expanding path, the bottom part is the MOFC structure, and the right part is the CACP module.
Remotesensing 13 02794 g002
Figure 3. Illustration of the HDC. All the atrous convolution layers with a kernel size of 3 × 3: (a) from left to right, continuous atrous convolution with the dilation rate of 2, the red pixel can only get information from the input feature map in a checkerboard fashion, and most of the information is lost; (b) from left to right, continuous atrous convolution with the dilation rates of 1, 2, and 3, respectively, the receptive field of the red pixel covers the whole input feature map without any holes or edge loss.
Remotesensing 13 02794 g003
Figure 4. The architecture of the continuous atrous convolution pyramid (CACP) module.
Remotesensing 13 02794 g004
Figure 5. The architecture of the multiscale output fusion constraint (MOFC) structure.
Remotesensing 13 02794 g005
Figure 6. Two aerial datasets image and corresponding building label images: (a) the white area in the label map of WHU Building Dataset represents the building; (b) the red area in the label map of Massachusetts Building Dataset represents buildings.
Remotesensing 13 02794 g006
Figure 7. Typical building extraction results of BMFR-Net with different loss functions. Images 1 and 2 belong to the WHU Building Dataset and images 3 and 4 belong to the Massachusetts Building Dataset. In the graph, green represents TP, red represents FP, and blue represents FN.
Remotesensing 13 02794 g007
Figure 8. Extensive area building extraction results by different methods on the WHU Buildings Dataset. The bottom column represents the corresponding partial details.
Remotesensing 13 02794 g008
Figure 9. Extensive area building extraction results by different methods on the WHU Buildings Dataset. The bottom column represents the corresponding partial details.
Remotesensing 13 02794 g009
Figure 10. Typical building extraction results by different methods on WHU Buildings Dataset. In the graph, green represents TP, red represents FP, and blue represents FN.
Remotesensing 13 02794 g010
Figure 11. Extensive area building extraction results by different methods on the Massachusetts Building Dataset. The bottom column represents the corresponding partial details.
Remotesensing 13 02794 g011
Figure 12. Extensive area building extraction results by different methods on the Massachusetts Building Dataset. The bottom column represents the corresponding partial details.
Remotesensing 13 02794 g012
Figure 13. Typical building extraction results by different methods on Massachusetts Building Dataset. In the graph, green represents TP, red represents FP, and blue represents FN.
Remotesensing 13 02794 g013
Figure 14. Comparison chart of different methods: (a) comparison chart of total parameters; (b) comparison chart of training time.
Remotesensing 13 02794 g014
Figure 15. Typical building extraction results of U-Net with different multiscale feature extractions and fusion modules. In the graph, green represents TP, red represents FP, and blue represents FN.
Remotesensing 13 02794 g015
Figure 16. Two other kinds of multiscale output fusion constraint structures: (a) structure diagram of MA-FCN; (b) structure diagram of MOFC_Add.
Remotesensing 13 02794 g016
Figure 17. Typical building extraction results of U-Net with different multiscale output fusion constraint structures. In the graph, green represents TP, red represents FP, and blue represents FN.
Remotesensing 13 02794 g017
Figure 18. Typical building extraction results of BMFR-Net with different weight combinations of the multilevel joint constraint. In the graph, green represents TP, red represents FP, and blue represents FN.
Remotesensing 13 02794 g018
Table 1. Quantitative evaluation (%) of BMFR-Net with different loss functions. The best metric value is highlighted in bold and underline.
DatasetsBCE LossDice LossPixel-Based Performance ParameterObject-Based Performance Parameter
OAPrecisionRecallIoUF1-ScorePrecisionRecallIoUF1-Score
WHU
Building Dataset
98.6893.9394.2788.8594.1091.3889.6486.5690.01
98.7494.3194.4289.3294.3691.6789.6186.6890.12
Massachusetts
Building Dataset
94.3886.9282.2973.2284.5488.1272.1367.6578.28
94.4685.3984.8974.1285.1490.4979.7875.5684.14
Table 2. Quantitative evaluation (%) of several SOTA methods on the WHU Building Dataset. The best metric value is highlighted in bold and underline.
MethodsPixel-Based Performance ParameterObject-Based Performance Parameter
OAPrecisionRecallIoUF1-ScorePrecisionRecallIoUF1-Score
U-Net [34]98.2090.2594.0085.3492.0990.0188.6085.4688.85
SegNet [33]98.0389.4393.3684.0891.3588.9888.3484.3888.13
DeepLabV3+ [48]98.2891.8092.8485.7392.3289.2287.4483.8487.74
MAP-Net [31]98.1091.3091.6184.2691.4688.8388.6884.0488.10
BRRNet [32]98.3391.5293.6886.1992.5890.3188.8685.5489.09
BMFR-Net (ours)98.7494.3194.4289.3294.3691.6789.6186.6890.12
Table 3. Quantitative evaluation (%) of several SOTA methods on the Massachusetts Building Dataset. The best metric value is highlighted in bold and underline.
MethodsPixel-Based Performance ParameterObject-Based Performance Parameter
OAPrecisionRecallIoUF1-ScorePrecisionRecallIoUF1-Score
U-Net [34]94.0185.3382.0671.9183.6689.4480.1075.3983.80
SegNet [33]93.6681.4285.6071.6183.4688.6880.2975.2183.70
DeepLabV3+ [48]93.3981.6283.3970.2182.5088.3077.6472.4281.93
MAP-Net [31]94.1884.7284.0072.9584.3688.2878.5773.3682.35
BRRNet [32]94.1285.0383.1772.5584.0986.8677.2871.4580.95
BMFR-Net (ours)94.4685.3984.8974.1285.1490.4979.7875.5684.14
Table 4. Quantitative evaluation (%) of U-Net with different multiscale feature extractions and fusion modules. The best metric value is highlighted in bold and underline.
MethodsPixel-Based Performance ParameterObject-Based Performance Parameter
OAPrecisionRecallIoUF1-ScorePrecisionRecallIoUF1-Score
U-Net98.2090.2594.0085.3492.0990.0188.6085.4688.85
U-Net-ASPP98.5493.4093.7087.6293.4090.7889.4685.8589.59
U-Net-CACP98.6093.5493.8788.1593.7090.8089.3386.1489.56
FCN-CACP98.6293.0594.6588.3993.8491.2989.5586.5689.93
BMFR-Net98.7494.3194.4289.3294.3691.6789.6186.6890.12
Table 5. Quantitative evaluation (%) of U-Net with different multiscale output fusion constraint structures. The best metric value is highlighted in bold and underline.
MethodsPixel-Based Performance ParameterObject-Based Performance Parameter
OAPrecisionRecallIoUF1-ScorePrecisionRecallIoUF1-Score
U-Net98.2090.2594.0085.3492.0990.0188.6085.4688.85
MA-FCN98.3491.2494.1486.3392.6690.8489.3086.2589.60
MOFC_Add98.0888.3995.3184.7091.7289.2288.7485.3188.52
U-Net-MOFC98.6193.4194.1488.2893.7791.0090.0586.7490.09
BMFR-Net98.7494.3194.4289.3294.3691.6789.6186.6890.12
Table 6. Quantitative evaluation (%) of BMFR-Net with different weight combinations of the multilevel joint constraint. The best metric value is highlighted in bold and underline.
( ω 1 ,   ω 2 ,   ω 3 ,   ω 4 ) Pixel-Based Performance ParameterObject-Based Performance Parameter
OAPrecisionRecallIoUF1-ScorePrecisionRecallIoUF1-Score
(1,0,0,0)98.7094.5693.7188.9294.1390.5288.3885.3488.92
(0.25,0.25,0.25,0.25)98.7394.6293.9189.1594.2690.9989.7486.2489.84
(0.4,0.3,0.2,0.1)98.7494.3194.4289.3294.3691.6789.6186.6890.12
(0.1,0.2,0.3,0.4) 98.7193.9994.4289.0494.2091.2789.5686.5789.92
(0.7,0.1,0.1,0.1) 98.7294.2294.2589.1094.2390.4589.1485.9389.30
Publisher’s Note: MDPI stays neutral with regard to jurisdictional claims in published maps and institutional affiliations.

