
A Climatological Assessment of Intense Desert Dust Episodes over the Broader Mediterranean Basin Based on Satellite Data

 ,
,
Abstract
:1. Introduction
2. Data and Methodology
2.1. MODIS Aqua
2.2. OMI Aura
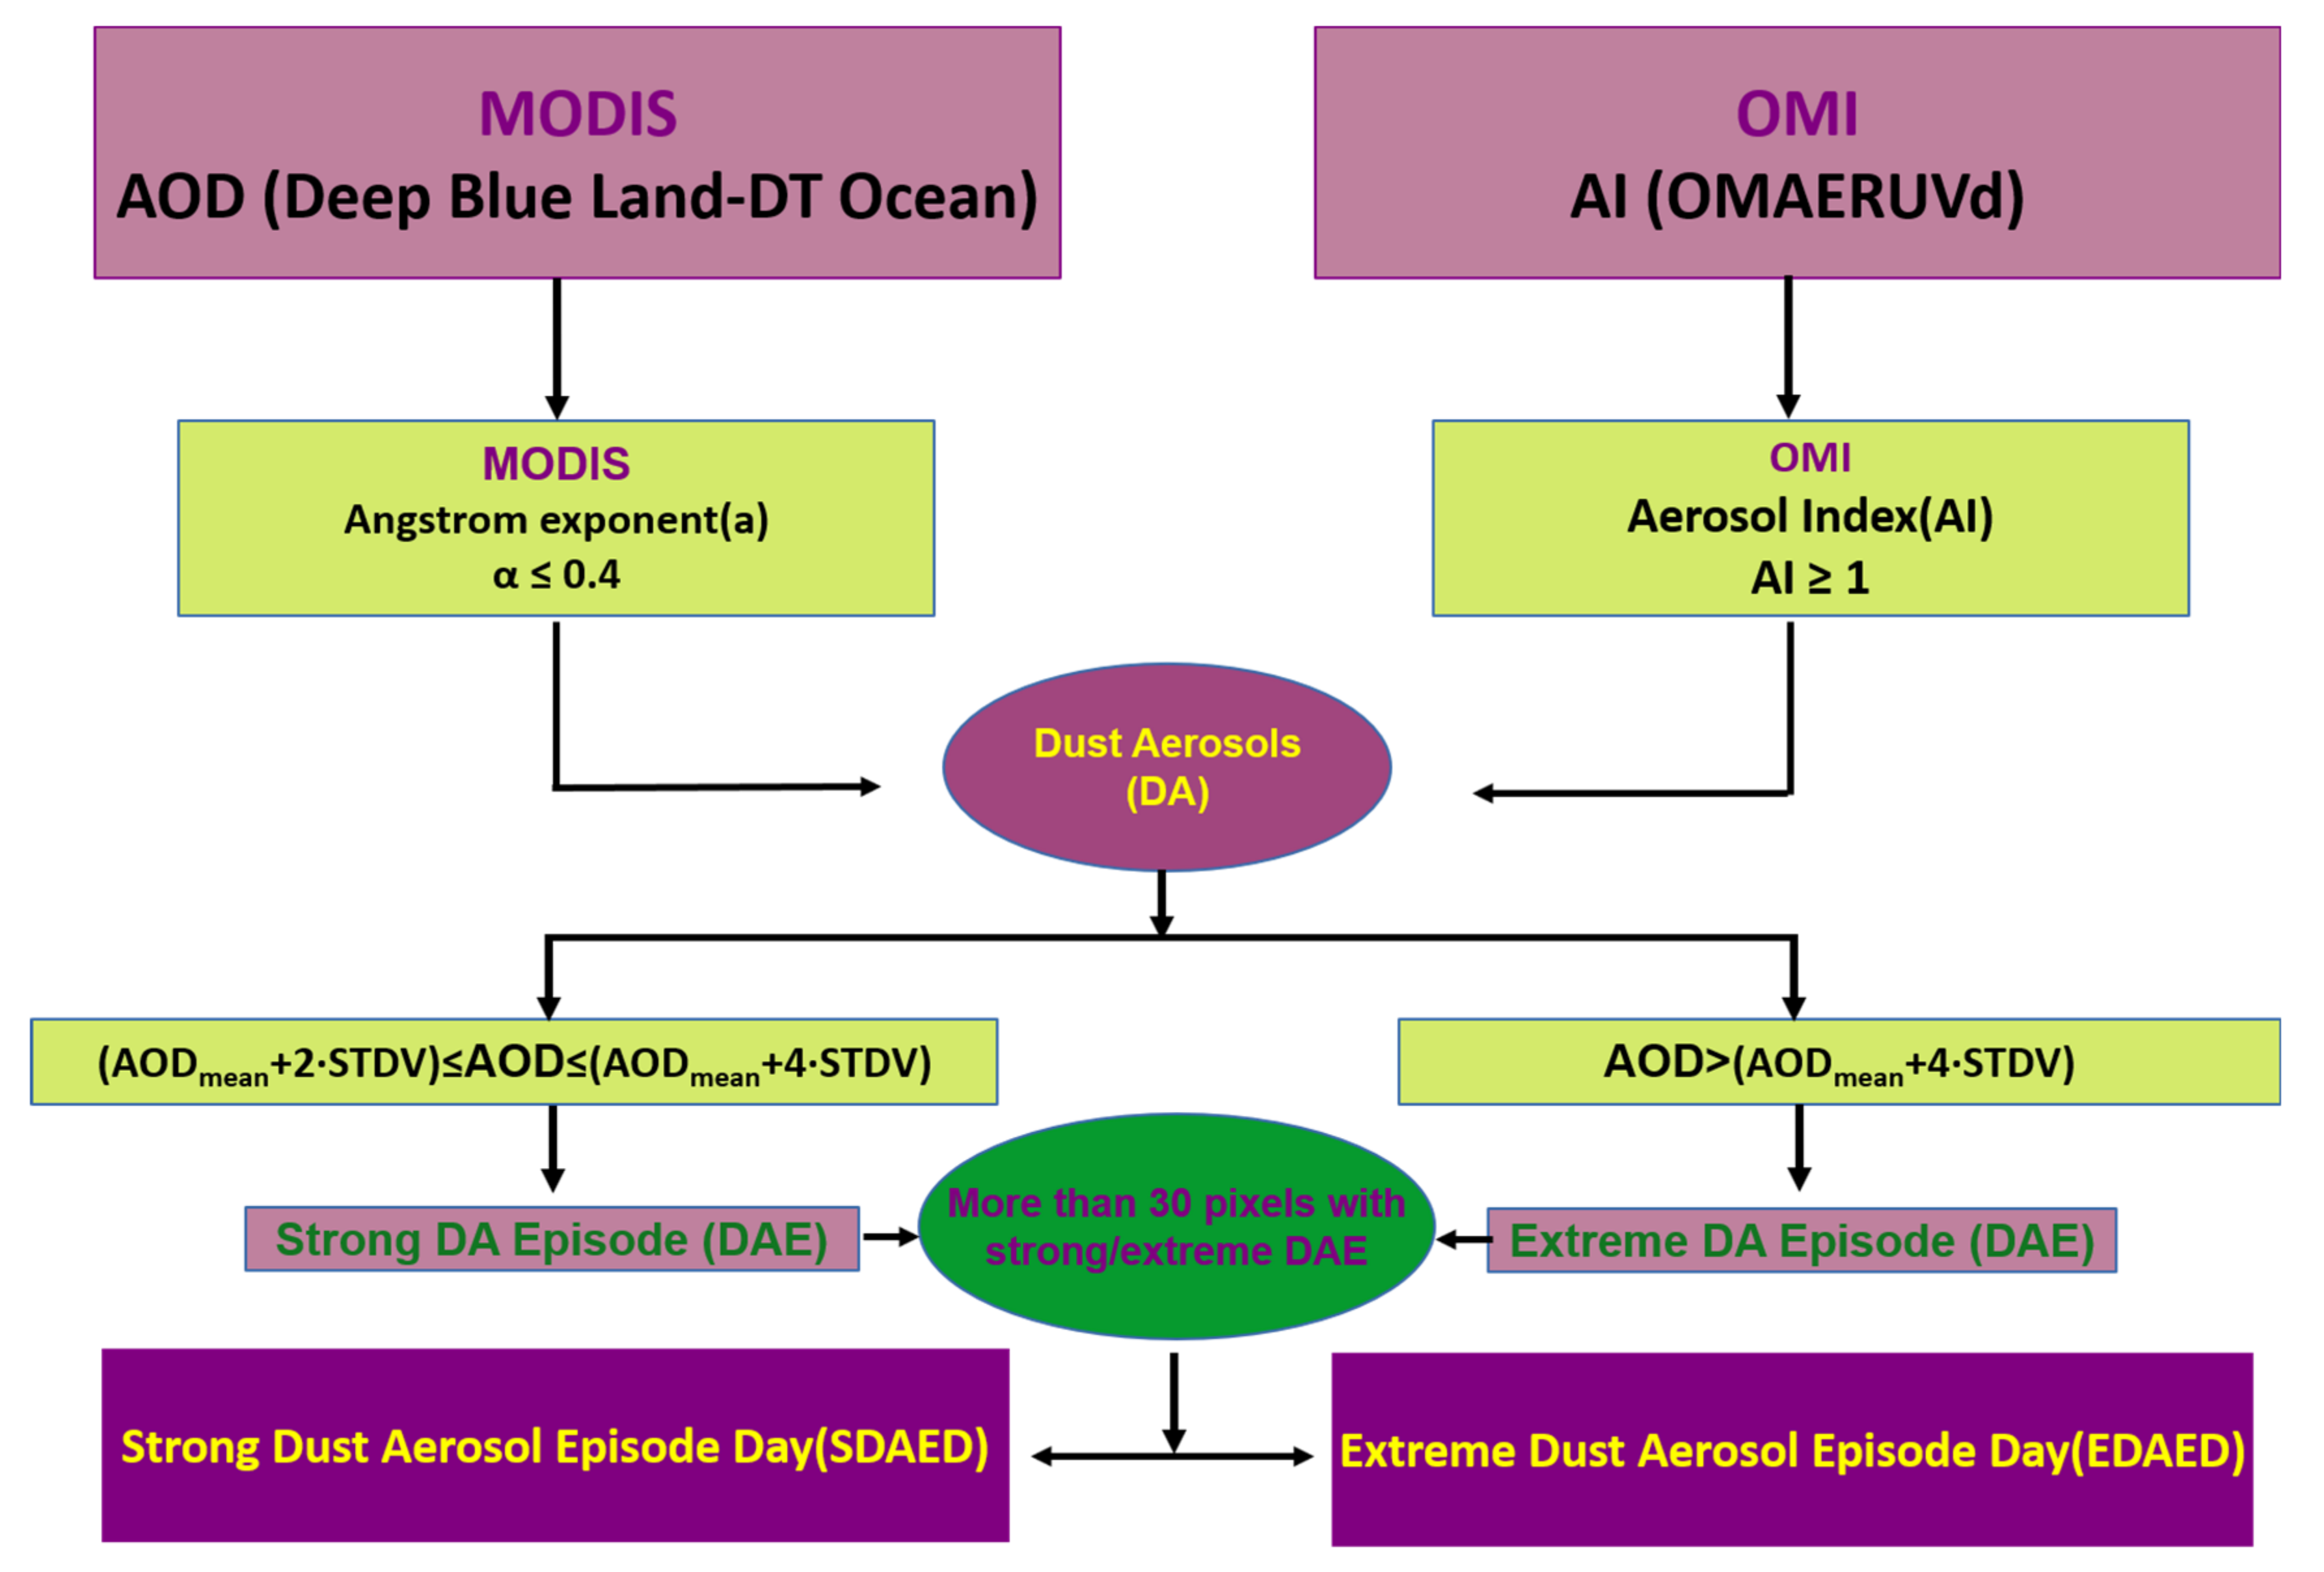
2.3. The Algorithm
3. Results and Discussion
3.1. Climatology of DAED
3.2. DAECs Climatology
4. Summary and Conclusions
- According to the algorithm results, 166 DAEDs took place over the broader Mediterranean Basin from 2005 to 2019. Most of them (116 DAEDs) were strong, occurring mainly in spring (47%) and summer (38%). The extreme DAEDs were less frequent (50 DAEDs), usually taking place in spring (56%) and winter (16%).
- During Mediterranean DAEDs, the annual geographical distribution indicates the frequent presence of strong episodes over the western and central MB, especially over continental NW African desert areas (up to 34 DAEDs), and the less frequent occurrence of extreme DAEDs over the central MB (up to 11 DAEDs). Similarly, during either strong or extreme DAEDs, on an annual basis, the dust loadings are strongest off the coasts of Libya and Egypt, more for extreme (DOD values up to 4.9) than for strong (up to 1.7) DAEDs.
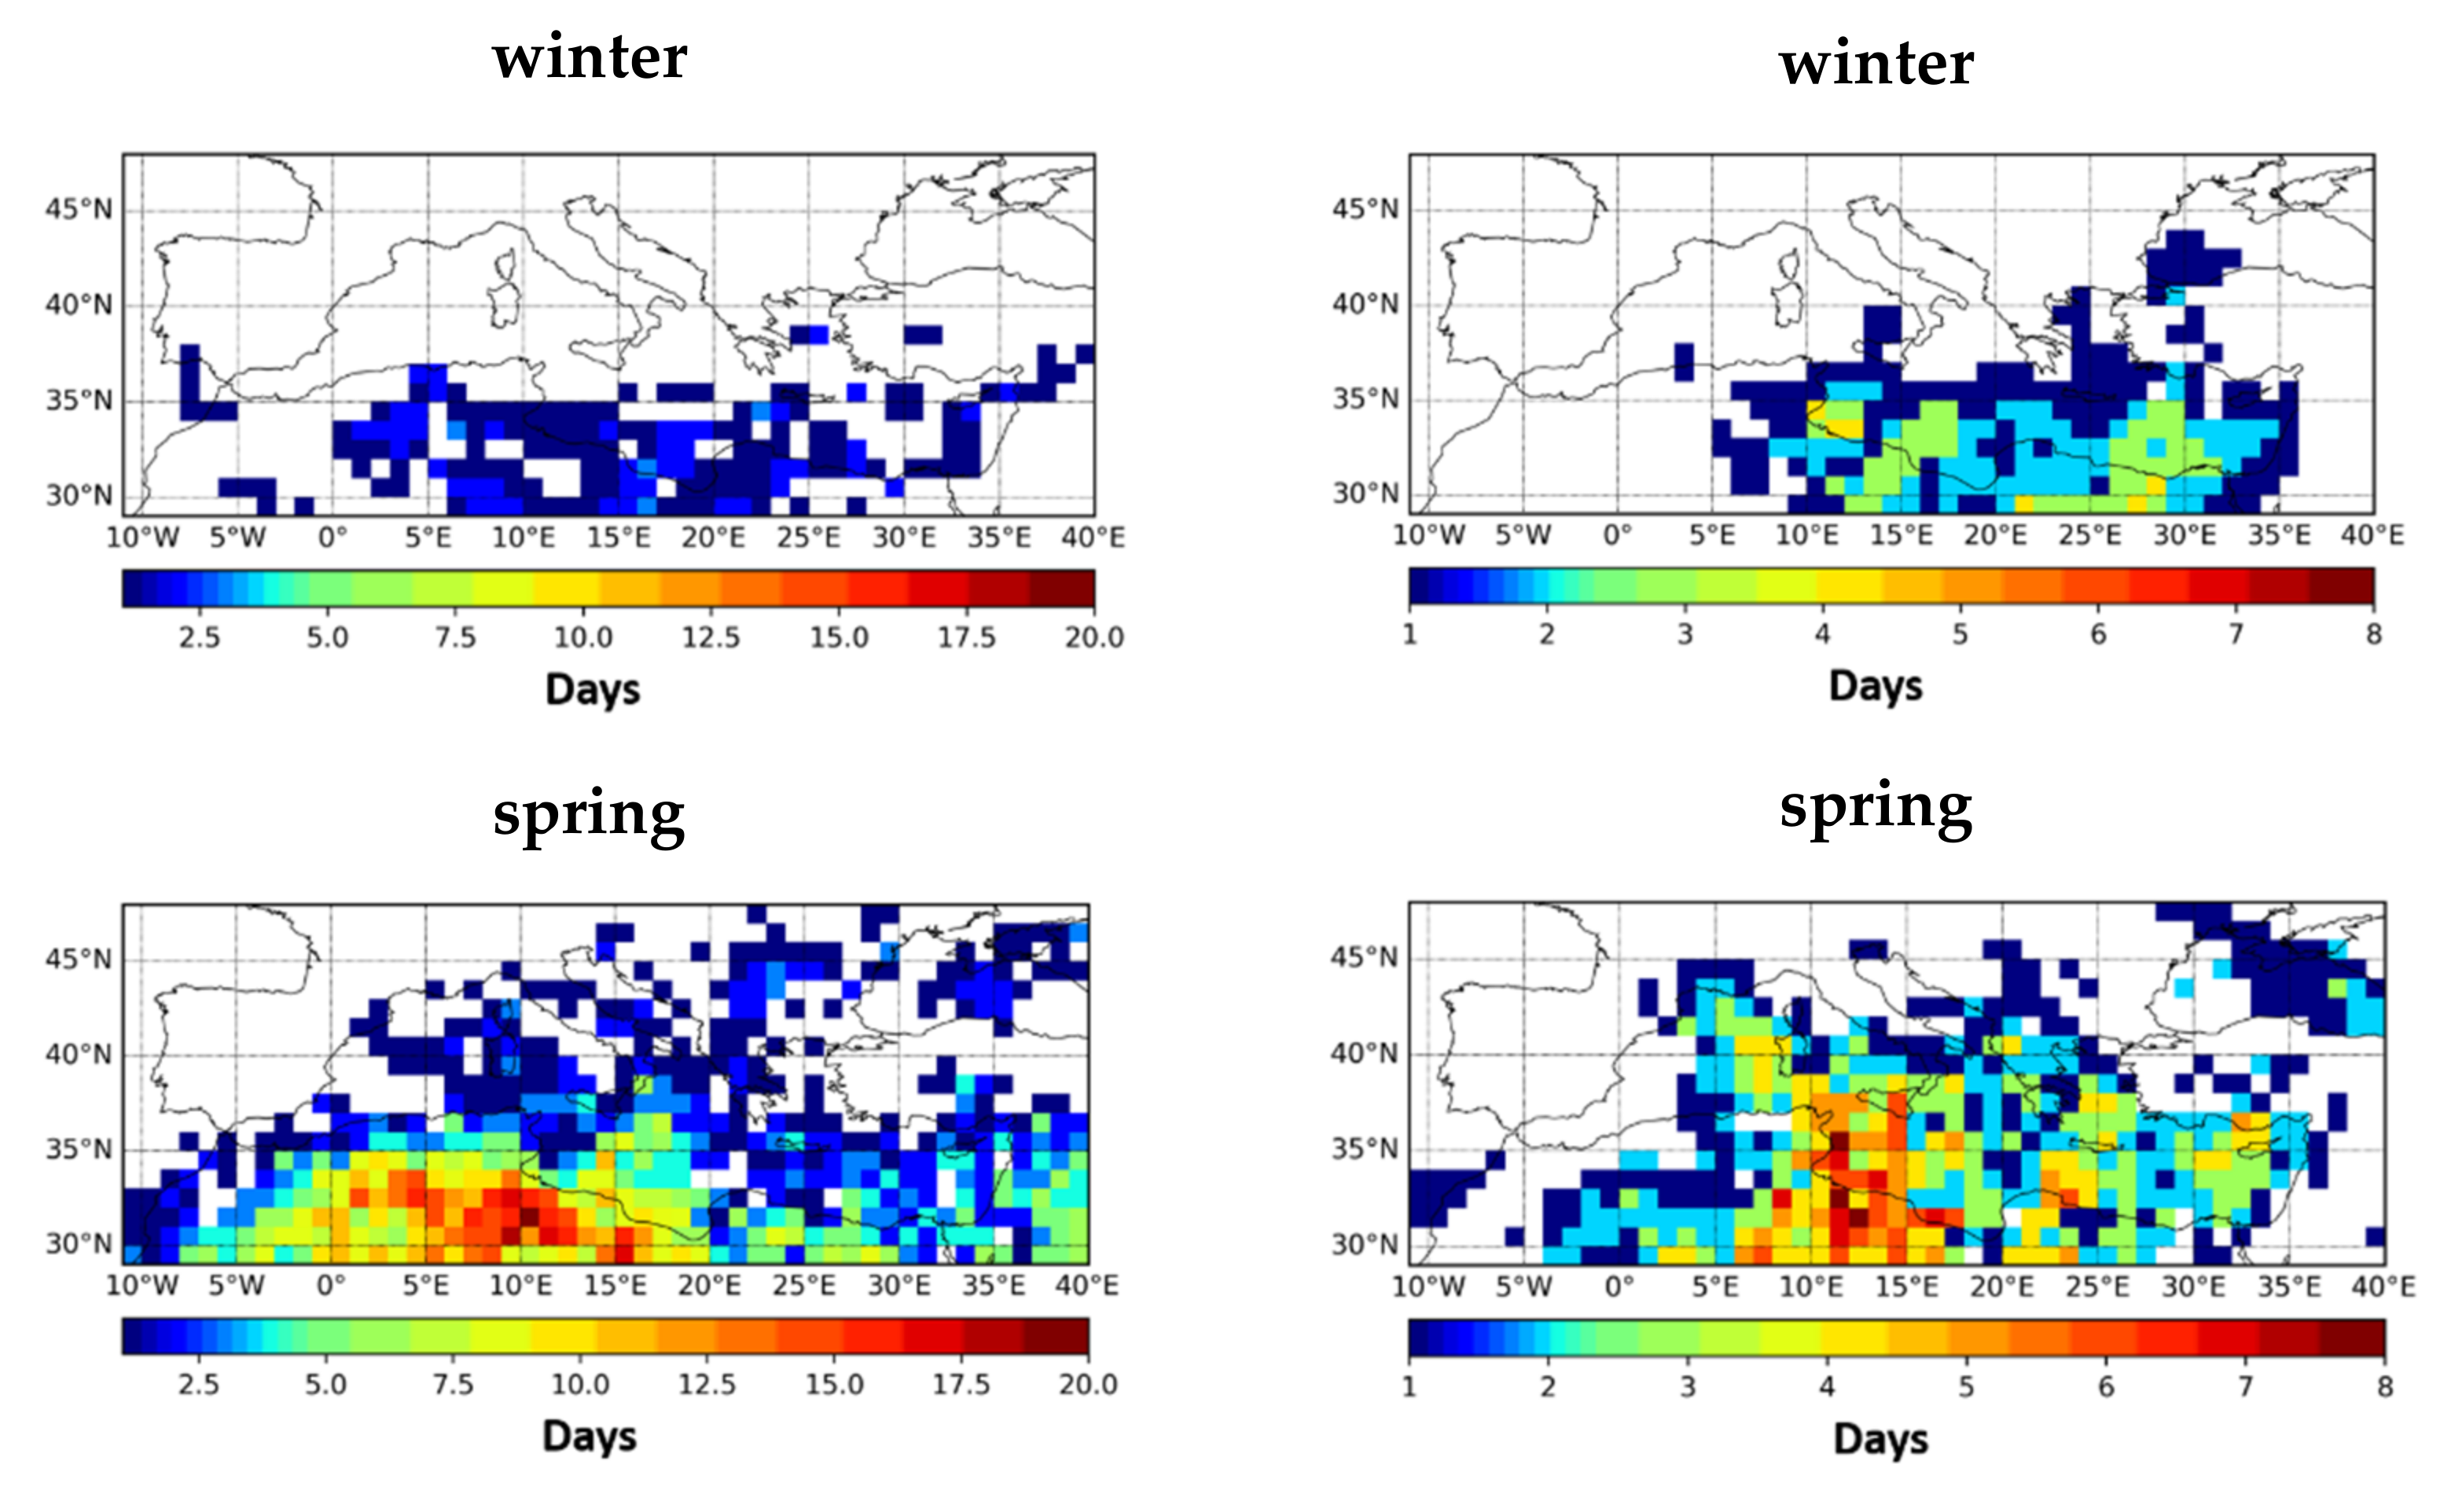
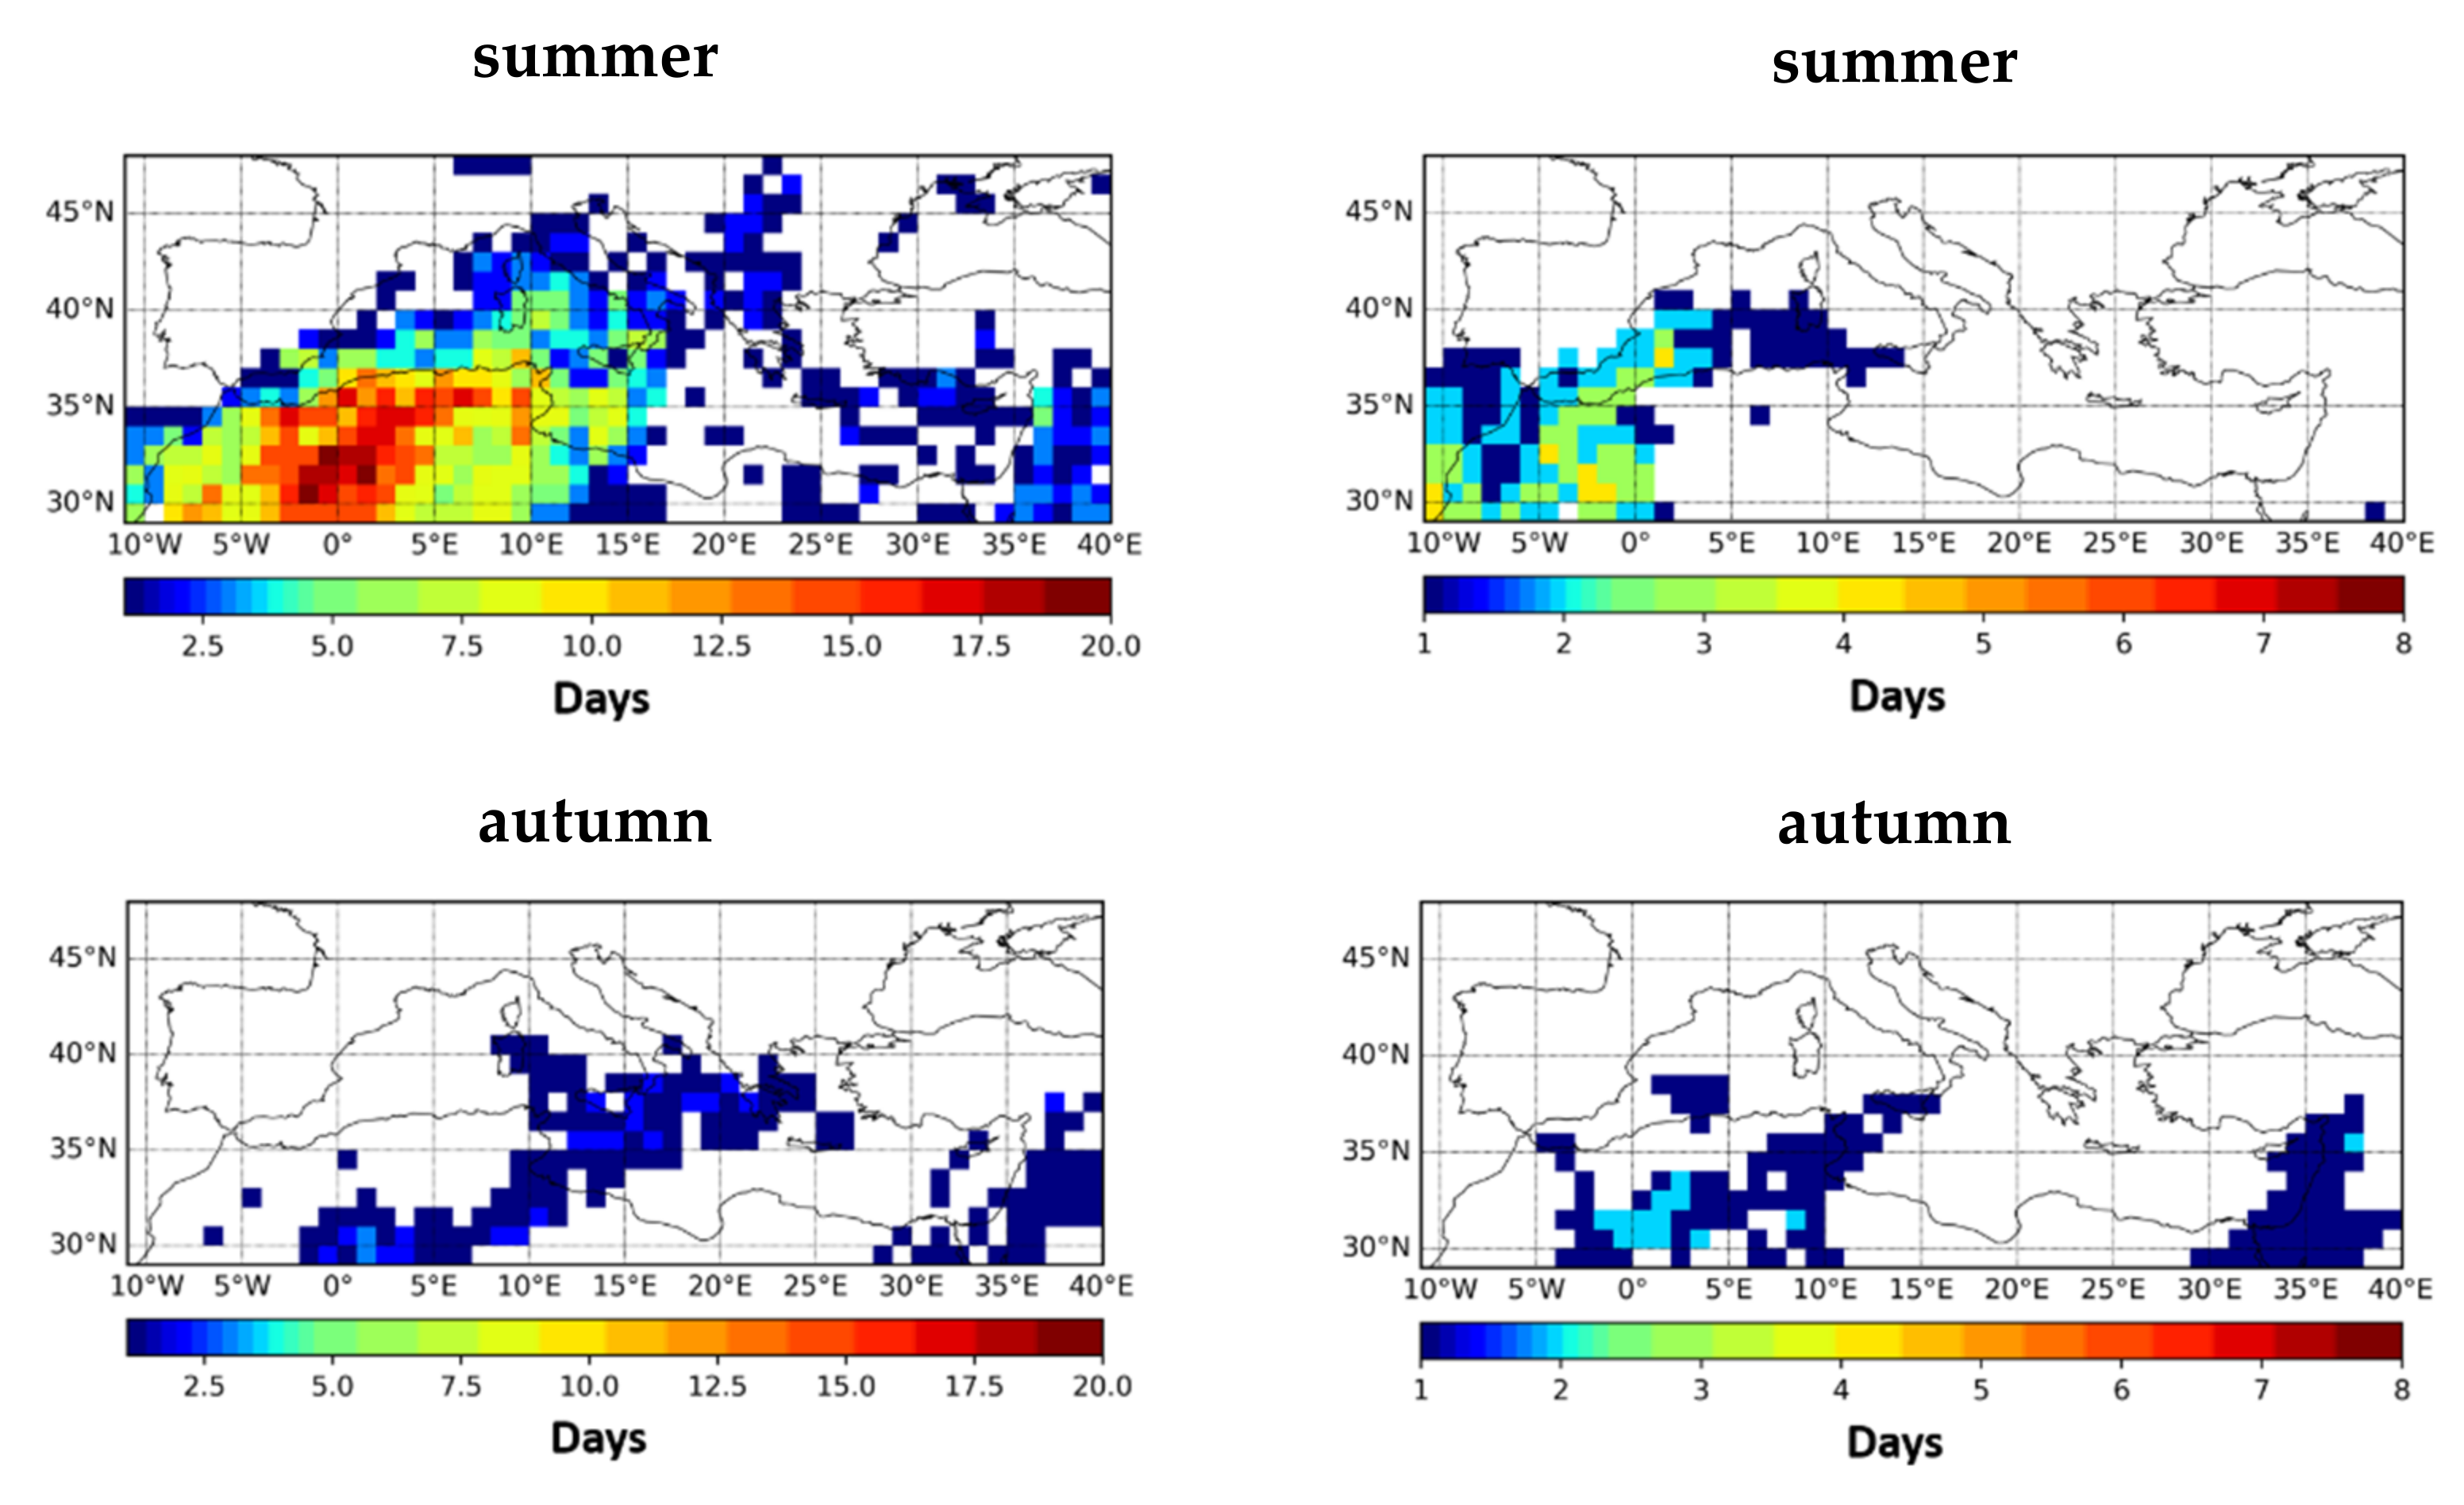
- The geographical distribution of the frequency of DAEDs is characterized by a distinct seasonality, which differs between strong and extreme DAEDs. For strong DAEDs, higher frequencies (up to 20 DAEDs) are observed, always over NW Africa, in spring and summer. On the other hand, for extreme DAEDs, the highest frequencies are found mainly in spring, mostly over the central MB (up to 9 DAEDs) and less over its eastern part (up to 5 DAEDs), and much less in winter (over the southeastern MB) and summer (over the southwestern MB), up to 4 DAEDs.
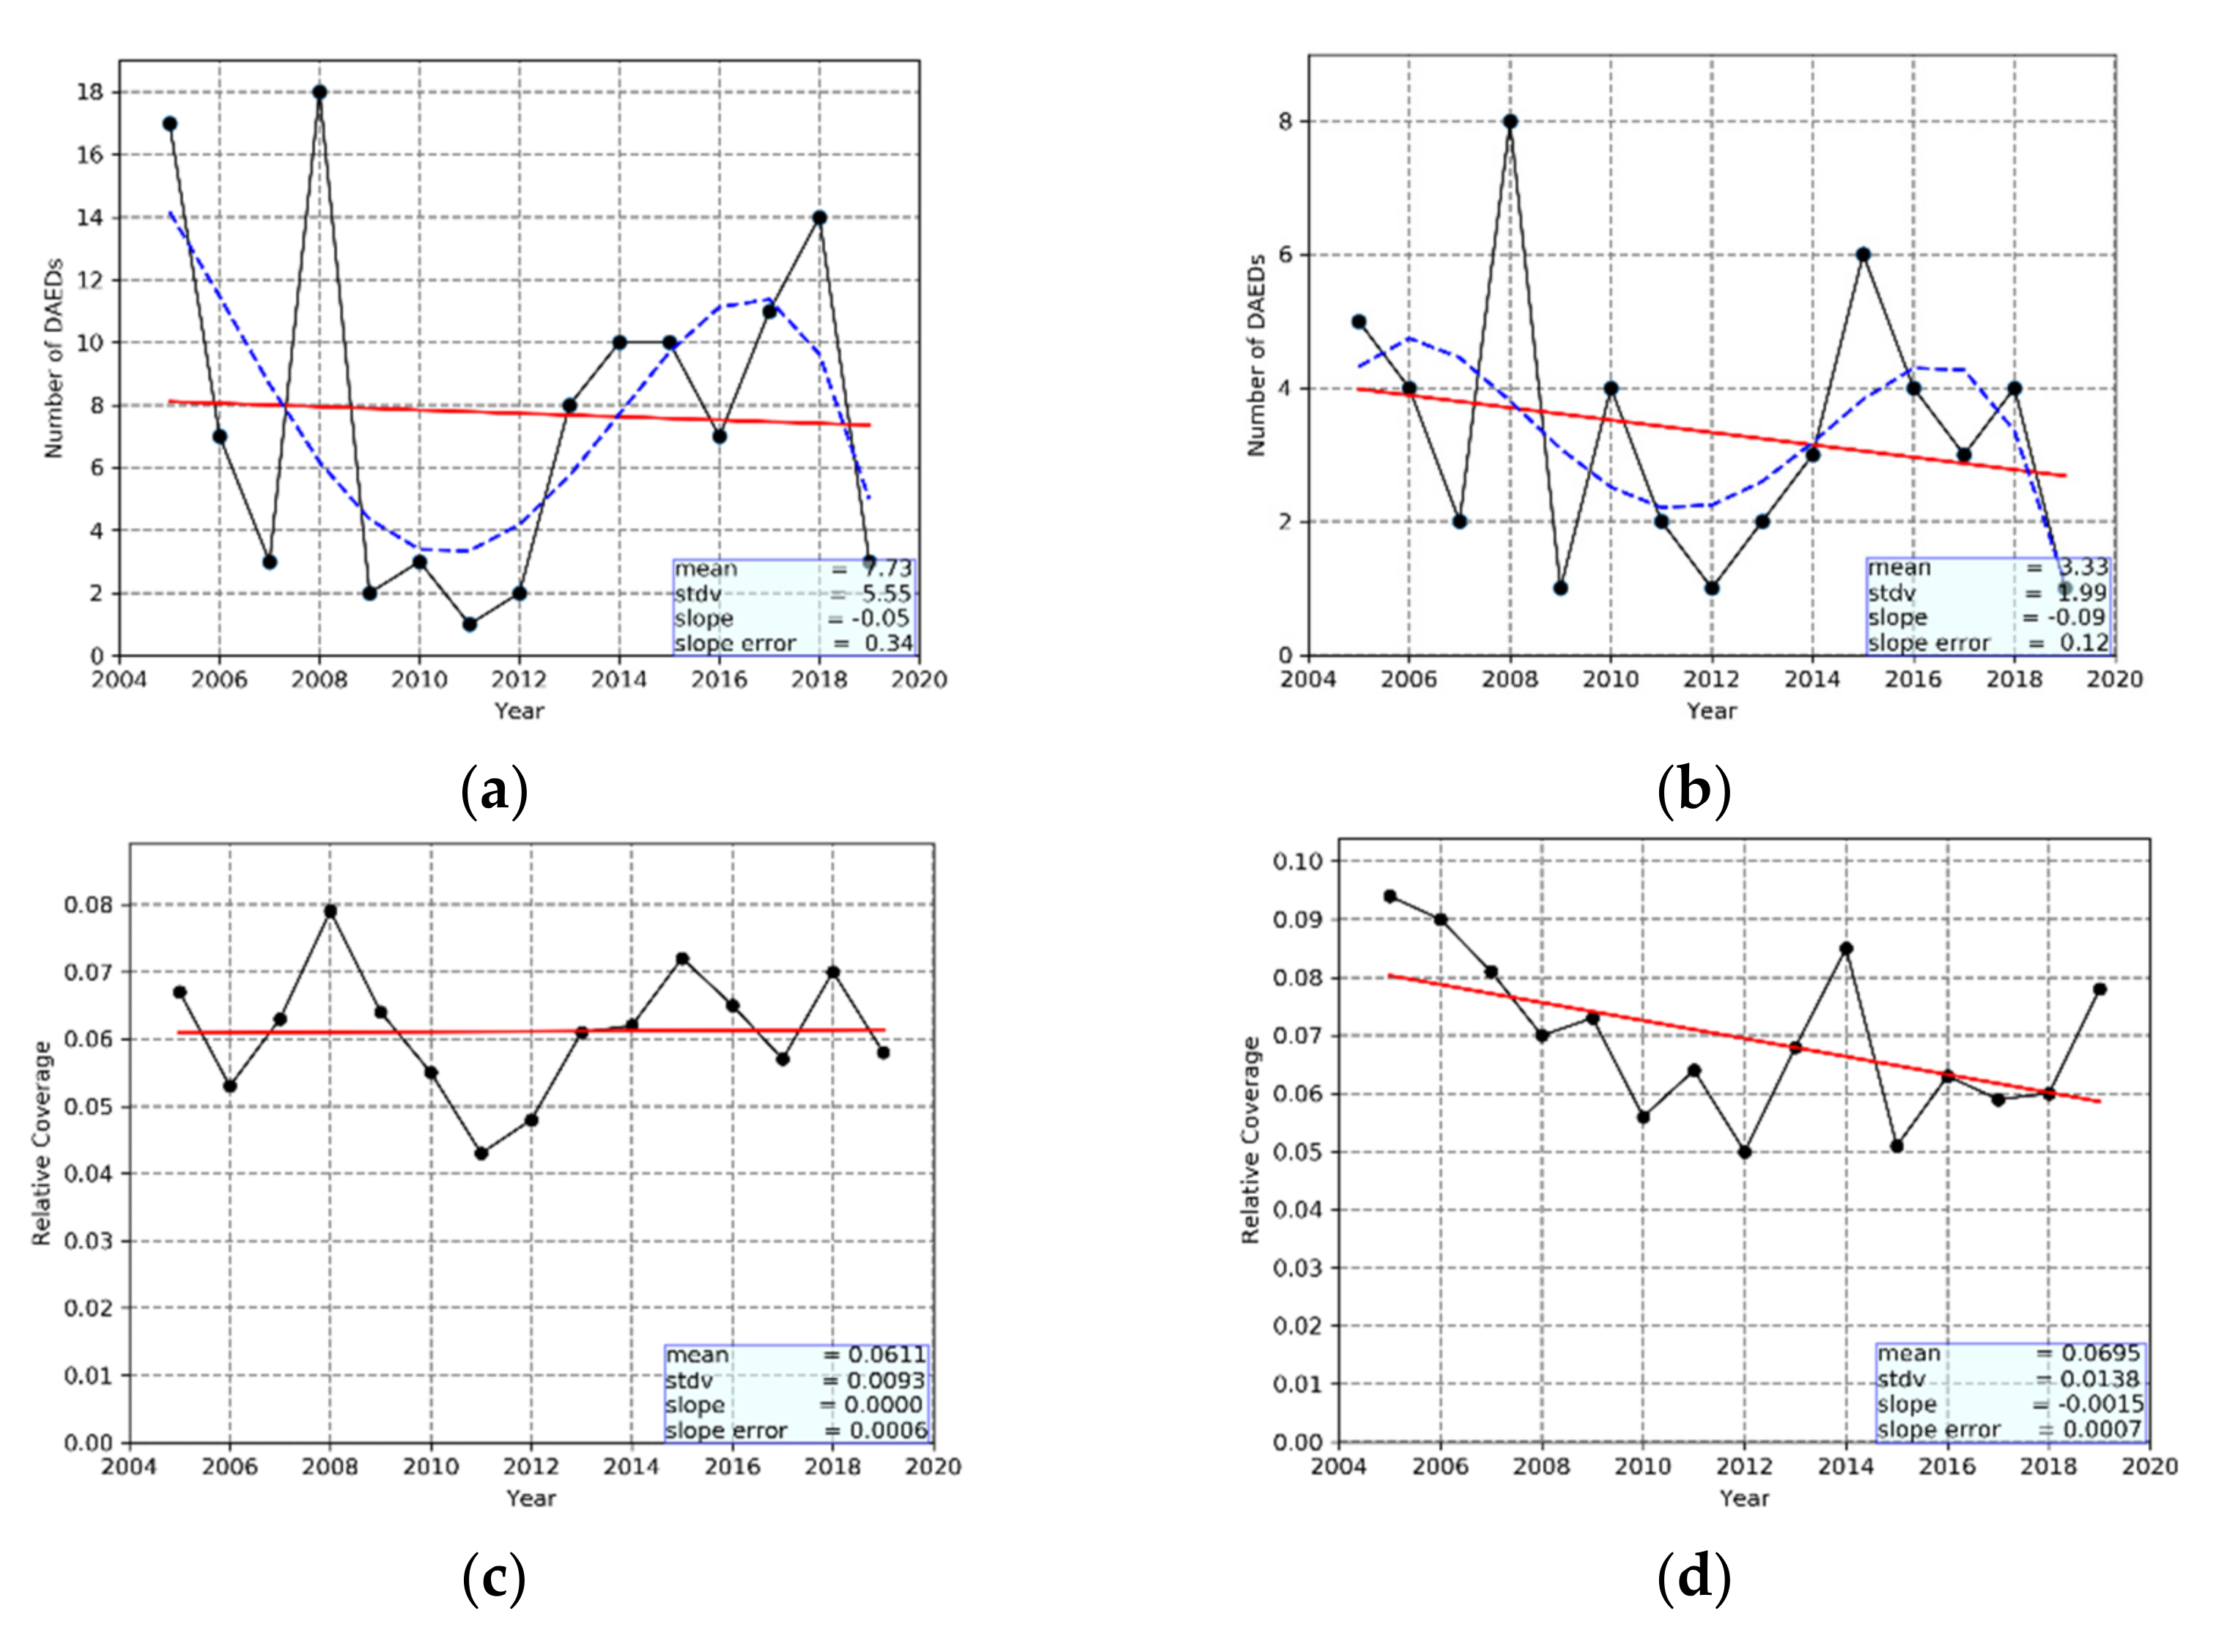
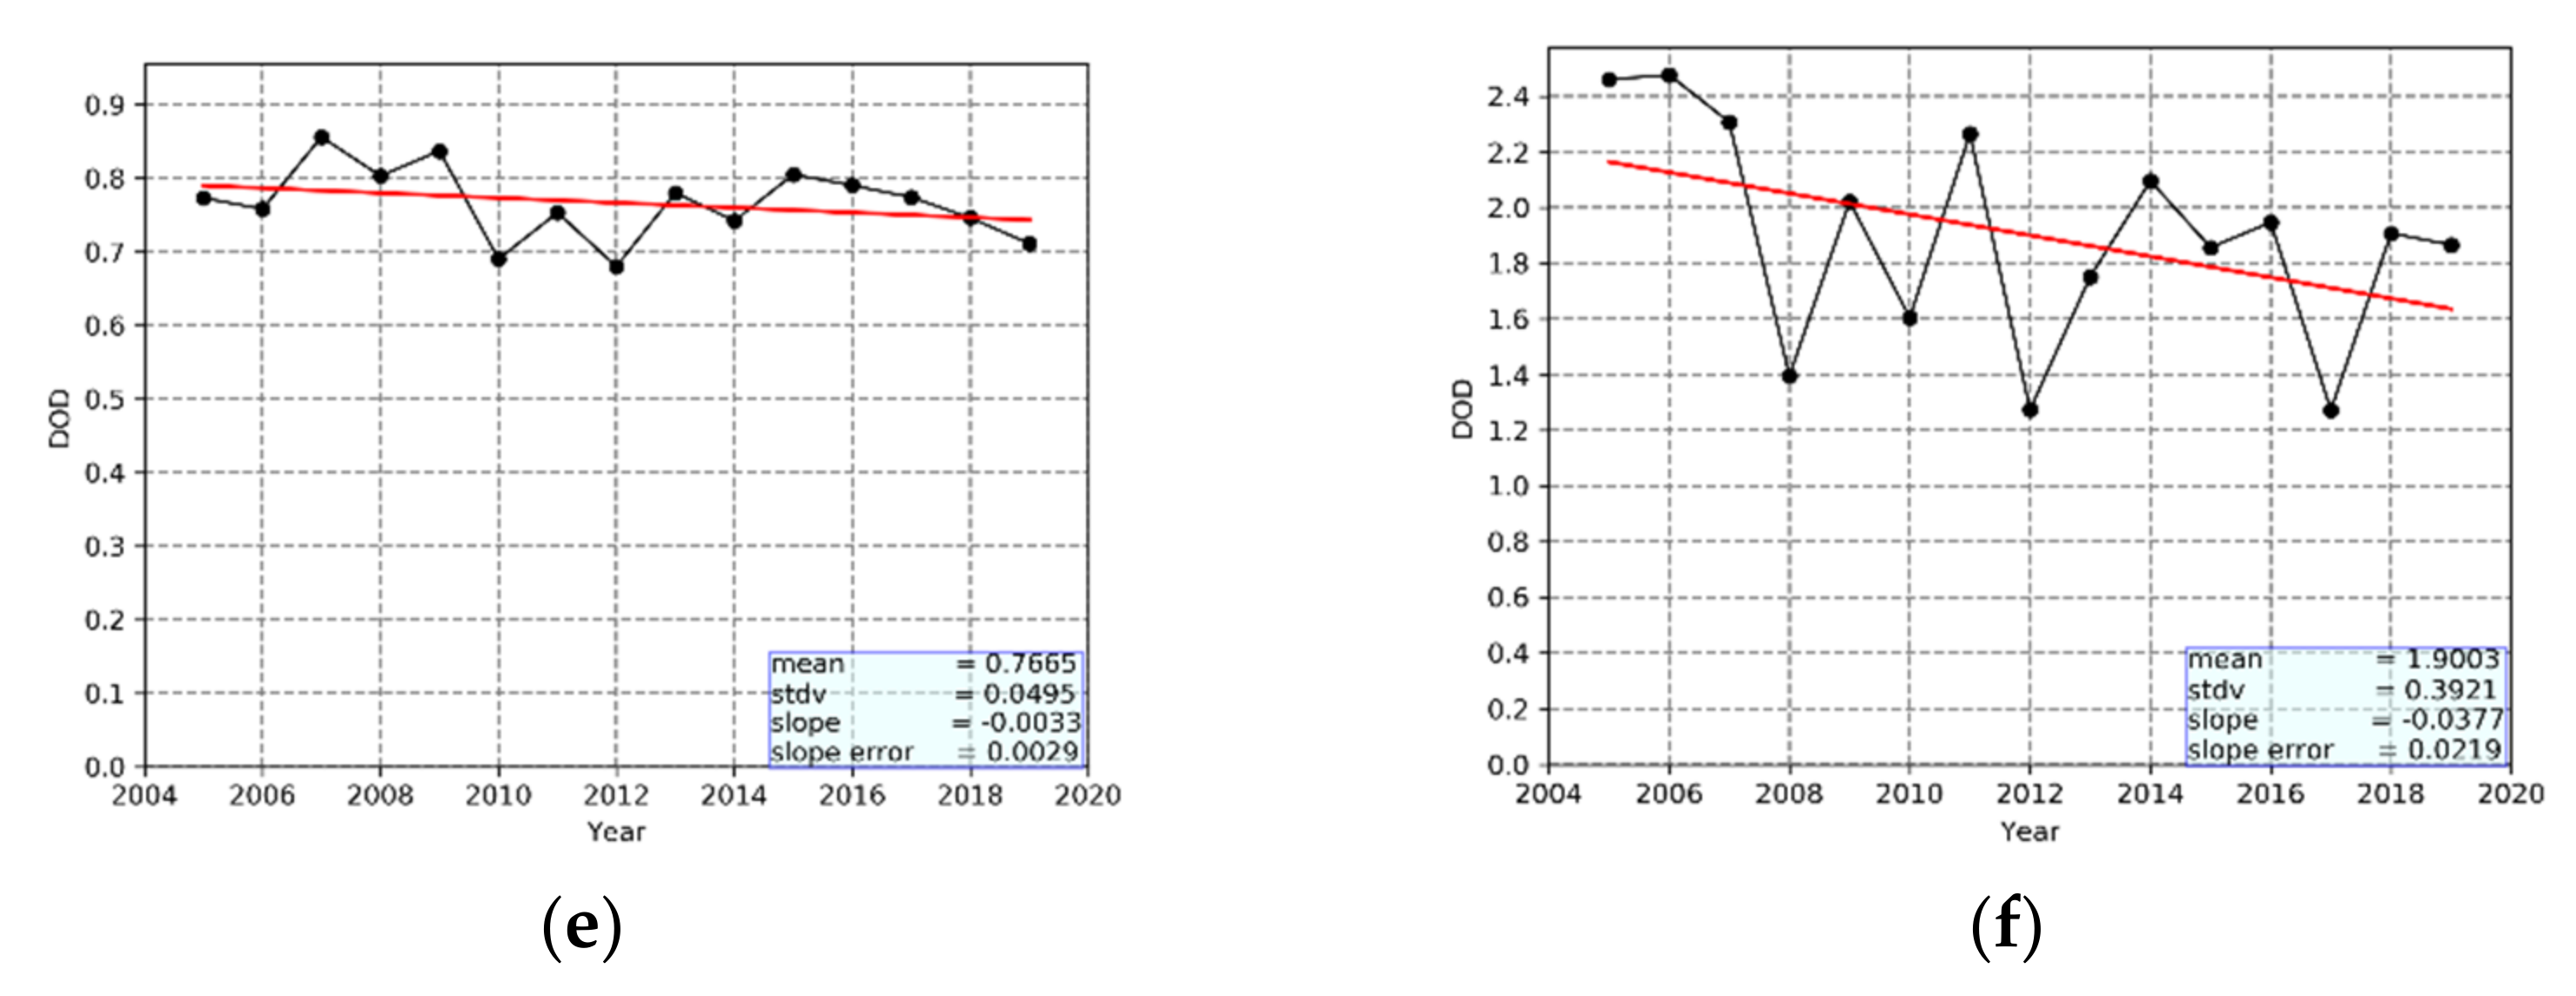
- There is a considerable interannual variability of the characteristics of DAEDs, which is largest for their frequency that varies between 1 and 18 strong DAEDs/year, and between 1 and 8 extreme DAEDs/year. The spatial coverage varies more for extreme DAEDs (ranging from 5.0 to 9.4% of the MB surface area) than for strong DAEDs (4.3–8.0, 7.9%). Moreover, the intensity varies from year to year, more for extreme DAEDs (DOD values between 1.27 and 2.50) than for strong DAECs (0.70–0.86). According to the algorithm results, the frequency, the spatial extent and the intensity of DAEDs have decreased from 2005 to 2019, with the exception of the spatial extent of strong DAEDs. However, according to the slope error values, among these trends, only those for the spatial extent and the intensity of extreme DAEDs are statistically significant, while none of them is statistically significant at the 95% level according to the applied Mann–Kendall test.
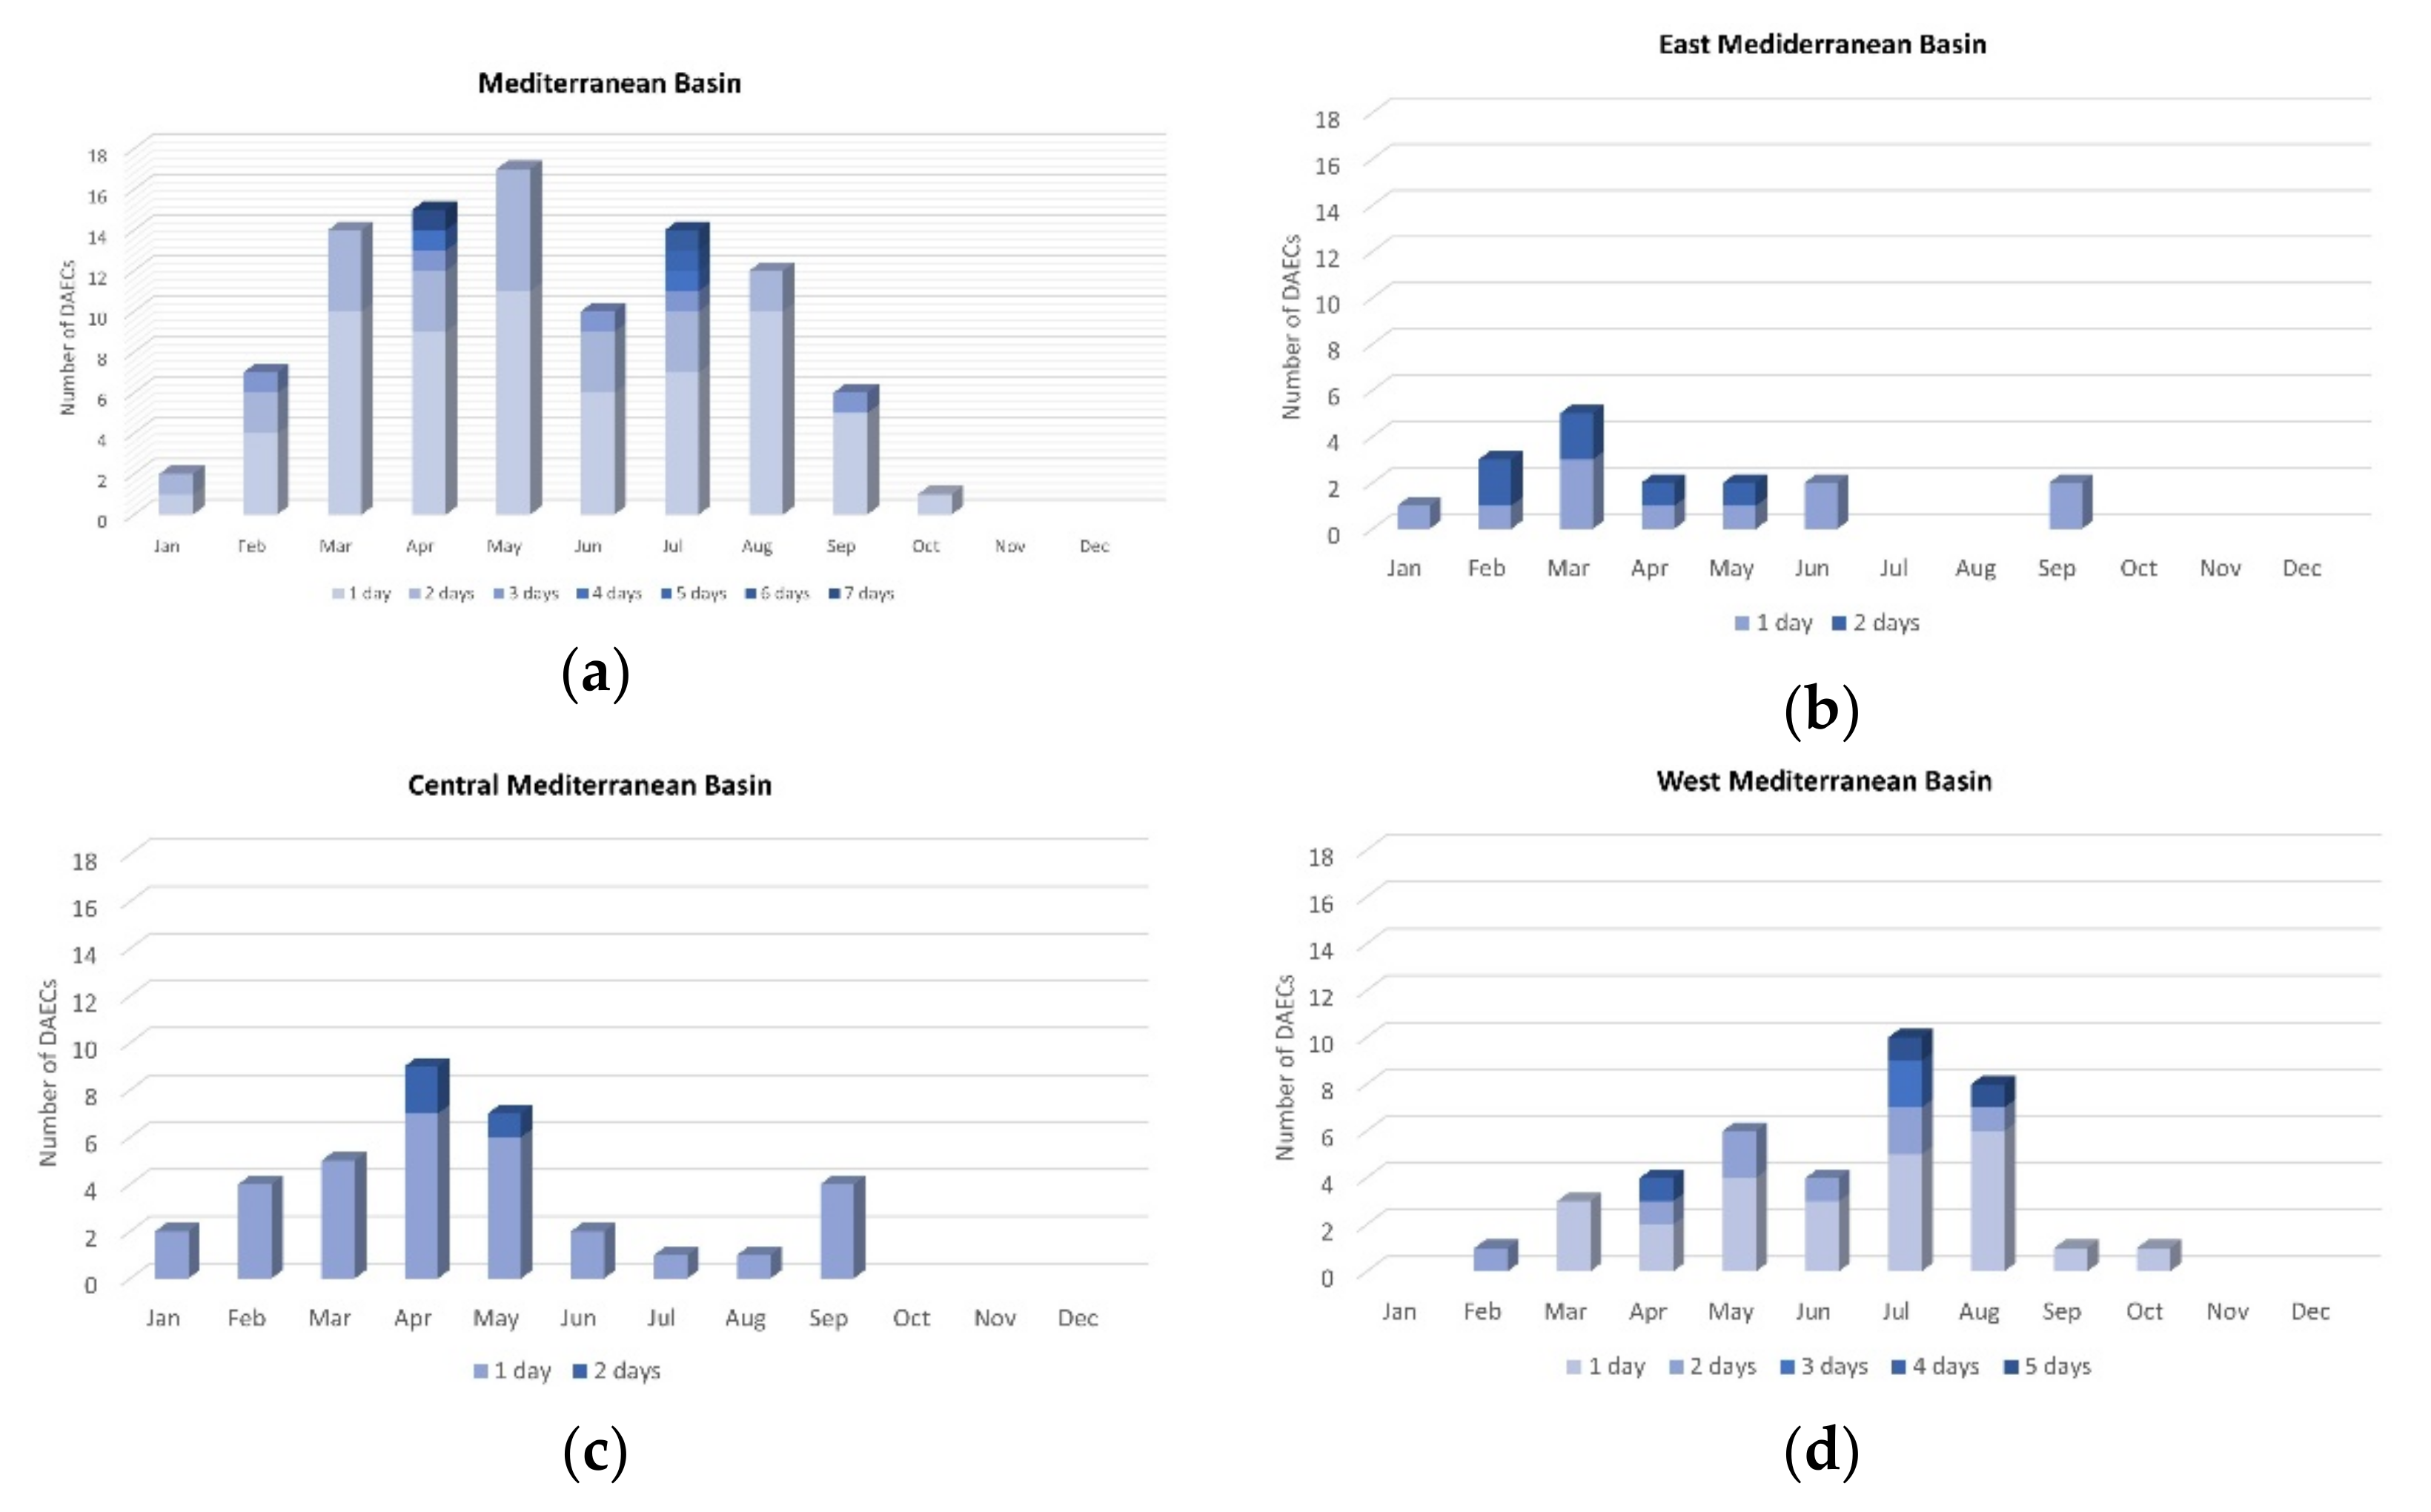
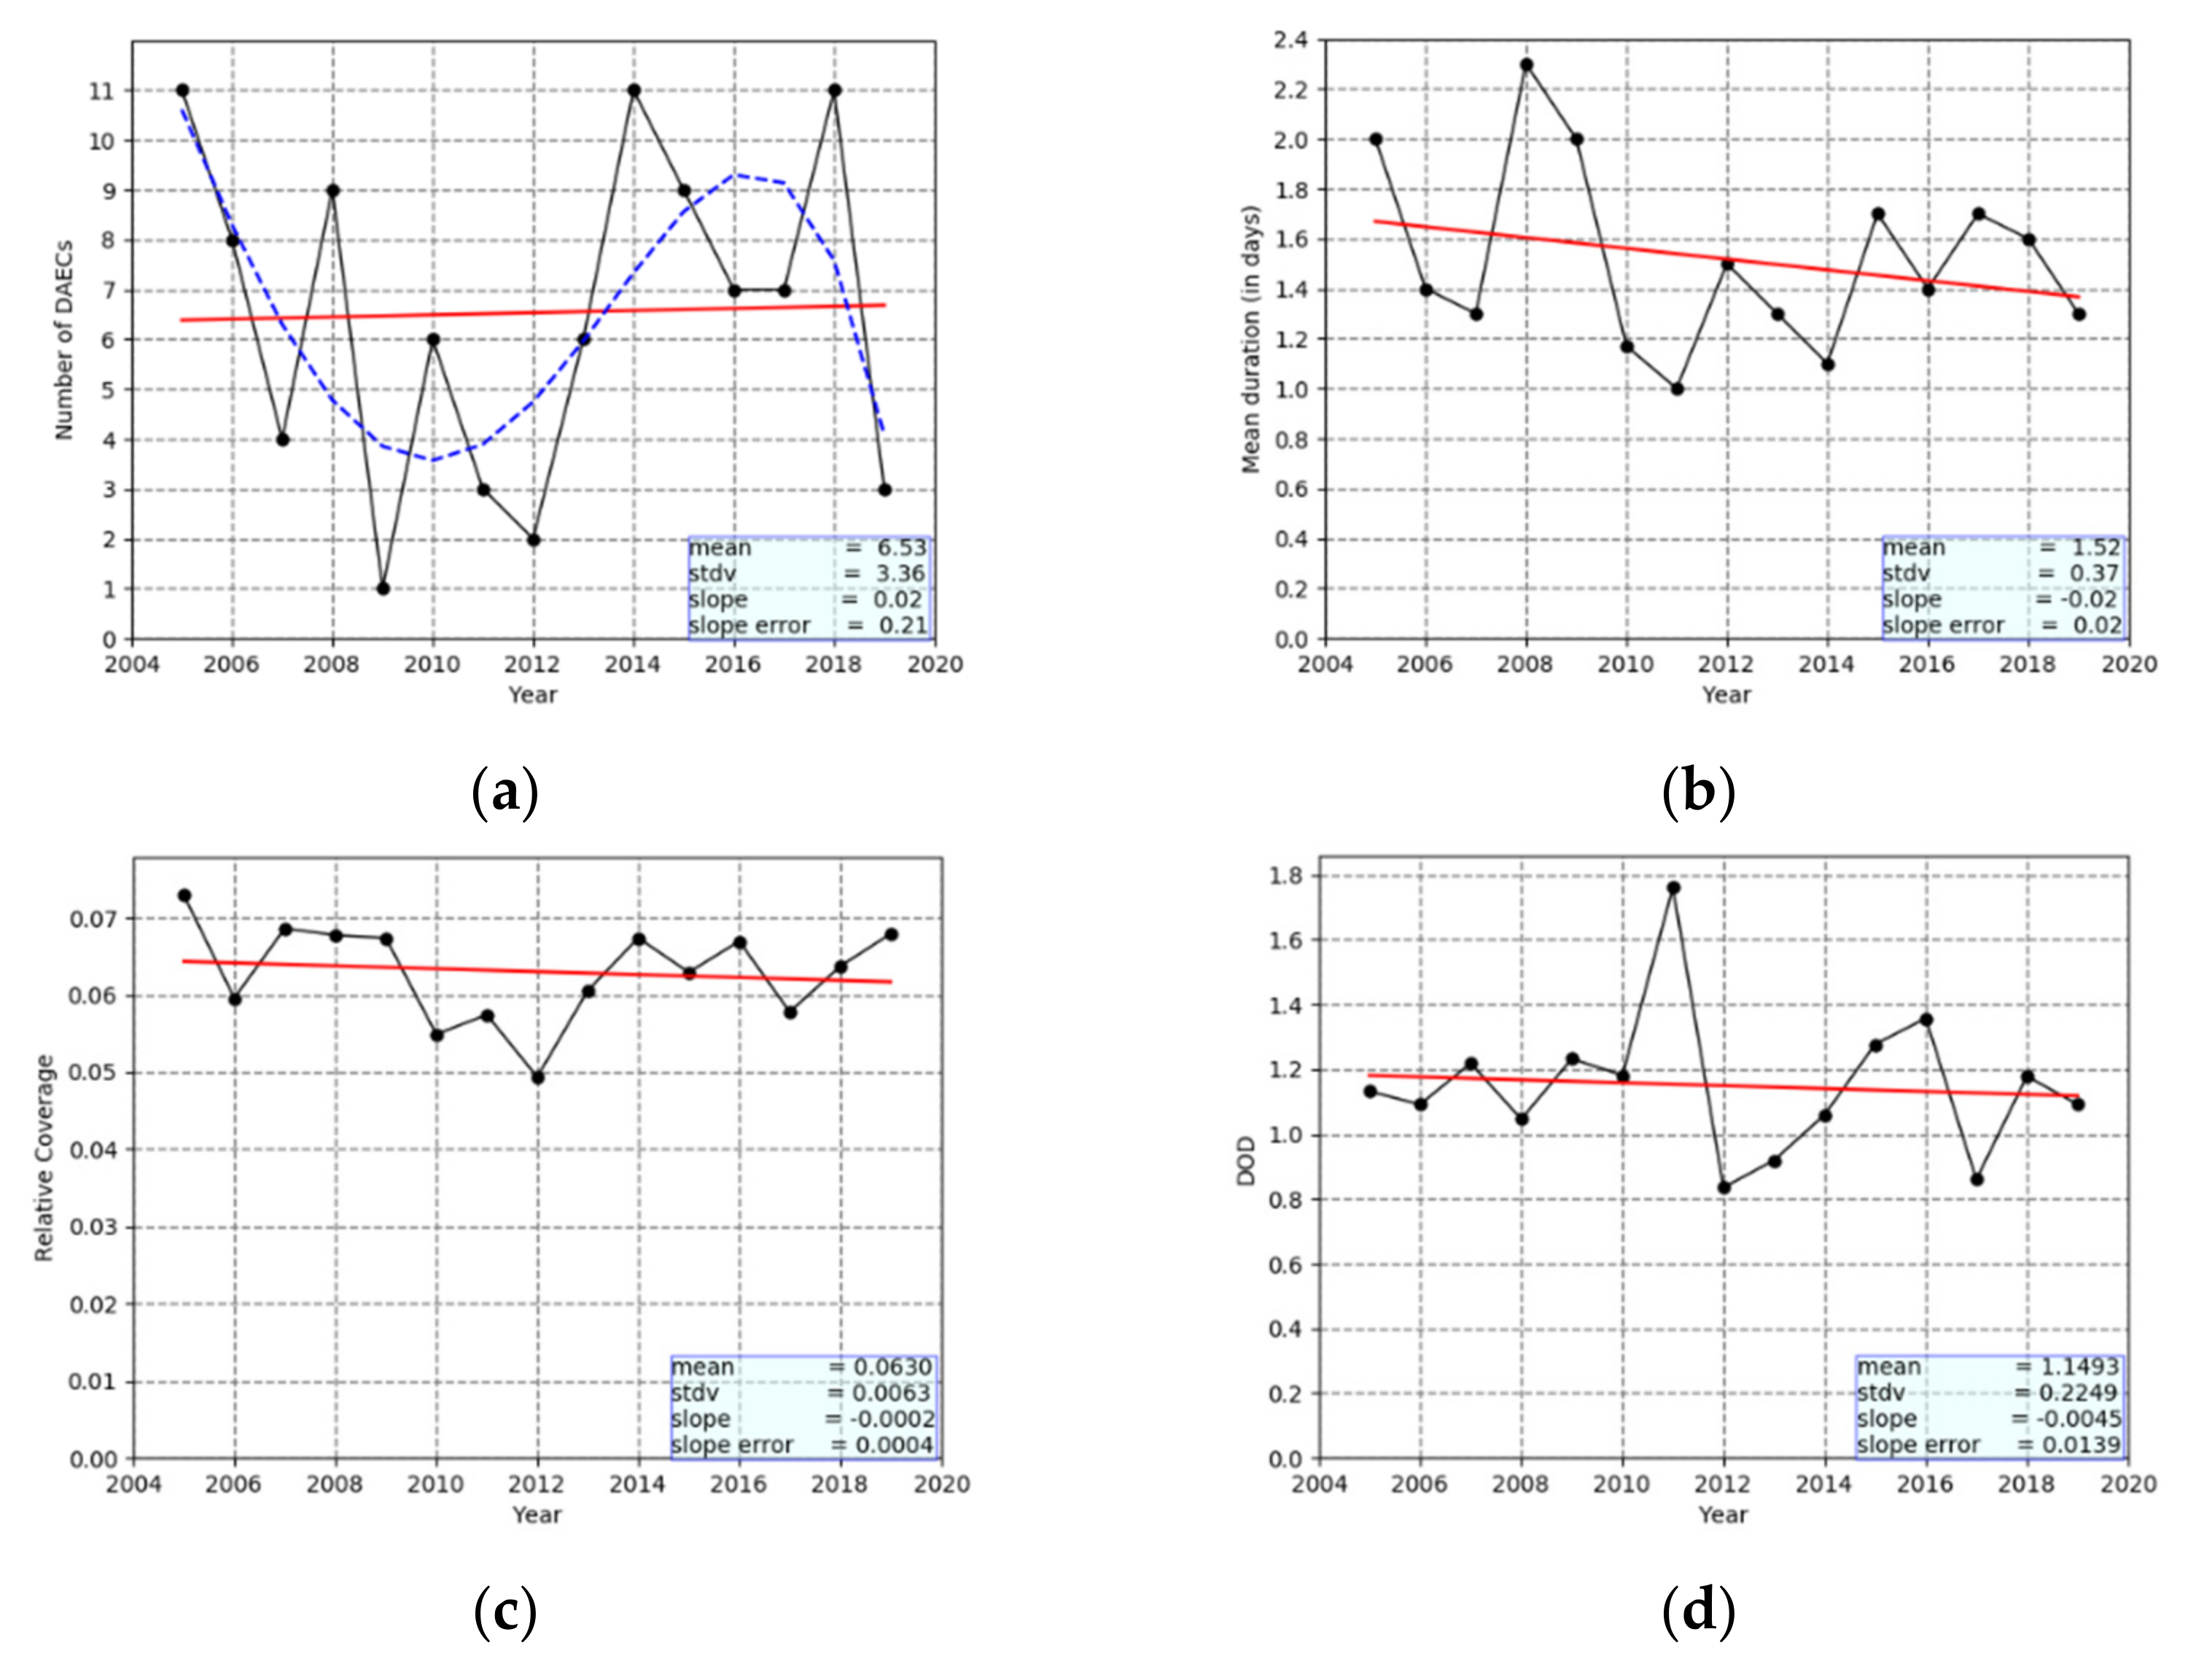
- Overall, 98 DAECs were identified over the Mediterranean Basin during the 15-year period 2005–2019, with a duration ranging from 1 day (65.3%), reaching up to 7 days (1%). The Mediterranean DAECs are marked by a distinct seasonality, most of them (47%) being observed in spring and then some (37%) in summer. Yet, the seasonality varies with longitude, namely between the western, central and eastern MB. In the eastern MB, there is a clear maximum occurrence in late winter–early spring, shifting to late spring in the central MB, and to late summer in the western MB. There is also a longitudinal difference in the frequency of DAECs, with more DAECs occurring in the western and the central MB (38 and 35 DAECs, respectively) and less in the eastern MB (17 DAECs). DAECs are characterized by a significant year to year variability, ranging from 1 to 11 DAECs/year, opposite to weaker interannual variability for their duration, spatial extent and intensity, as well as small and not statistically significant changes.
Supplementary Materials
Author Contributions
Funding
Institutional Review Board Statement
Informed Consent Statement
Data Availability Statement
Acknowledgments
Conflicts of Interest
References
- Kaufman, Y.J.; Tanré, D.; Boucher, O. A satellite view of aerosols in the climate system. Nature 2002, 419, 215–223. [Google Scholar] [CrossRef] [PubMed]
- Sicard, M.; Bertolín, S.; Muñoz, C.; Rodríguez, A.; Rocadenbosch, F.; Comerón, A. Separation of aerosol fine-and coarse-mode radiative properties: Effect on the mineral dust longwave, direct radiative forcing. J. Geophys. Res. Atmos. 2014, 41, 6978–6985. [Google Scholar] [CrossRef] [Green Version]
- Gkikas, A.; Giannaros, T.; Kotroni, V.; Lagouvardos, K. Assessing the radiative impacts of an extreme desert dust outbreak and the potential improvements on short-term weather forecasts: The case of February 2015. Atmos. Res. 2019, 226, 152–170. [Google Scholar] [CrossRef]
- Winckler, G.; Mahowald, N. DICE: Dust impact on climate and environment. Dust 2015, 24, 61. [Google Scholar] [CrossRef] [Green Version]
- Karydis, V.A.; Tsimpidi, A.P.; Bacer, S.; Pozzer, A.; Nenes, A.; Lelieveld, J. Global impact of mineral dust on cloud droplet number concentration. Atmos. Chem. Phys. 2017, 17, 5601–5621. [Google Scholar] [CrossRef] [Green Version]
- Karydis, V.; Kumar, P.; Barahona, D.; Sokolik, I.; Nenes, A. On the effect of dust particles on global cloud condensation nuclei and cloud droplet number. J. Geophys. Res. Atmos. 2011, 116, D23. [Google Scholar] [CrossRef] [Green Version]
- Levin, Z.; Teller, A.; Ganor, E.; Yin, Y. On the interactions of mineral dust, sea-salt particles, and clouds: A measurement and modeling study from the Mediterranean Israeli Dust Experiment campaign. J. Geophys. Res. Atmos. 2005, 110. [Google Scholar] [CrossRef] [Green Version]
- Li, R.; Dong, X.; Guo, J.; Fu, Y.; Zhao, C.; Wang, Y.; Min, Q. The implications of dust ice nuclei effect on cloud top temperature in a complex mesoscale convective system. Sci. Rep. 2017, 7, 13826. [Google Scholar] [CrossRef] [Green Version]
- Prospero, J.M.; Lamb, P.J. African droughts and dust transport to the Caribbean: Climate change implications. Science 2003, 302, 1024–1027. [Google Scholar] [CrossRef]
- Basart, S.; Pérez, C.; Nickovic, S.; Cuevas, E.; Baldasano, J. Development and evaluation of the BSC-DREAM8b dust regional model over Northern Africa, the Mediterranean and the Middle East. Tellus B: Chem. Phys. Meteorol. 2012, 64, 18539. [Google Scholar] [CrossRef] [Green Version]
- Gkikas, A.; Hatzianastassiou, N.; Mihalopoulos, N. Aerosol events in the broader Mediterranean basin based on 7-year (2000–2007) MODIS C005 data. Atmos. Chem. Phys. 2009, 27, 3509–3522. [Google Scholar] [CrossRef]
- Ginoux, P.; Prospero, J.M.; Gill, T.E.; Hsu, N.C.; Zhao, M. Global-scale attribution of anthropogenic and natural dust sources and their emission rates based on MODIS Deep Blue aerosol products. Rev. Geophys. 2012, 50, RG3005. [Google Scholar] [CrossRef]
- Gkikas, A.; Hatzianastassiou, N.; Mihalopoulos, N.; Katsoulis, V.; Kazadzis, S.; Pey, J.; Querol, X.; Torres, O. The regime of intense desert dust episodes in the Mediterranean based on contemporary satellite observations and ground measurements. Atmos. Chem. Phys. 2013, 13, 12135–12154. [Google Scholar] [CrossRef] [Green Version]
- Ludwig, P.; Gavrilov, M.B.; Marković, S.B.; Ujvari, G.; Lehmkuhl, F. Simulated regional dust cycle in the Carpathian Basin and the Adriatic Sea region during the Last Glacial Maximum. Quat. Int. 2021, 581–582, 114–127. [Google Scholar] [CrossRef]
- Wagner, R.; Schepanski, K.; Heinold, B.; Tegen, I. Interannual variability in the Saharan dust source activation—Toward understanding the differences between 2007 and 2008. J. Geophys. Res. Atmos. 2016, 121, 4538–4562. [Google Scholar] [CrossRef] [Green Version]
- Moulin, C.; Lambert, C.E.; Dayan, U.; Masson, V.; Ramonet, M.; Bousquet, P.; Legrand, M.; Balkanski, Y.J.; Guelle, W.; Marticorena, B.; et al. Satellite climatology of African dust transport in the Mediterranean atmosphere. J. Geophys. Res. Atmos. 1998, 103, 13137–13144. [Google Scholar] [CrossRef]
- Rodrıguez, S.; Querol, X.; Alastuey, A.; Kallos, G.; Kakaliagou, O. Saharan dust contributions to PM10 and TSP levels in Southern and Eastern Spain. Atmos. Environ. 2001, 35, 2433–2447. [Google Scholar] [CrossRef]
- Meloni, D.; Di Sarra, A.; Monteleone, F.; Pace, G.; Piacentino, S.; Sferlazzo, D. Seasonal transport patterns of intense Saharan dust events at the Mediterranean island of Lampedusa. Atmos. Res. 2008, 88, 134–148. [Google Scholar] [CrossRef]
- Gavrilov, M.B.; Marković, S.B.; Schaetzl, R.J.; Tošić, I.A.; Zeeden, C.; Obreht, I.; Sipos, G.; Ruman, A.; Putniković, S.; Emunds, K.; et al. Prevailing surface winds in Northern Serbia in the recent and past time periods; modern- and past dust deposition. Aeolian Res. 2018, 31, 117–129. [Google Scholar] [CrossRef] [Green Version]
- Gkikas, A.; Houssos, E.; Lolis, C.; Bartzokas, A.; Mihalopoulos, N.; Hatzianastassiou, N. Atmospheric circulation evolution related to desert-dust episodes over the Mediterranean. Q. J. R. Meteorol. Soc. 2015, 141, 1634–1645. [Google Scholar] [CrossRef]
- Osada, K.; Ura, S.; Kagawa, M.; Mikami, M.; Tanaka, T.Y.; Matoba, S.; Aoki, K.; Shinoda, M.; Kurosaki, Y.; Hayashi, M.; et al. Wet and dry deposition of mineral dust particles in Japan: Factors related to temporal variation and spatial distribution. Atmos. Chem. Phys. 2014, 14, 1107–1121. [Google Scholar] [CrossRef] [Green Version]
- IPCC. Climate Change 2013: The Physical Science Basis. Contribution of Working Group I to the Fifth Assessment Report of the Intergovernmental Panel on Climate Change; Stocker, T.F., Qin, D., Plattner, G.-K., Tignor, M., Allen, S.K., Boschung, J., Nauels, A., Xia, Y., Bex, V., Midgley, P.M., Eds.; Cambridge University Press: Cambridge, UK, 2013; 1535p. [Google Scholar]
- Lionello, P. The Climate of the Mediterranean Region: From the Past to the Future; Elsevier: Amsterdam, The Netherlands, 2012. [Google Scholar]
- Georgoulias, A.K.; Alexandri, G.; Kourtidis, K.A.; Lelieveld, J.; Zanis, P.; Pöschl, U.; Levy, R.; Amiridis, V.; Marinou, E.; Tsikerdekis, A. Spatiotemporal variability and contribution of different aerosol types to the aerosol optical depth over the Eastern Mediterranean. Atmos. Chem. Phys. 2016, 16, 13853–13884. [Google Scholar] [CrossRef] [PubMed] [Green Version]
- Ozdemir, E.; Tuygun, G.T.; Elbir, T. Application of aerosol classification methods based on AERONET version 3 product over eastern Mediterranean and Black Sea. Atmos. Pollut. Res. 2020, 11, 2226–2243. [Google Scholar] [CrossRef]
- Di Sarra, A.; Di Biagio, C.; Meloni, D.; Monteleone, F.; Pace, G.; Pugnaghi, S.; Sferlazzo, D. Shortwave and longwave radiative effects of the intense Saharan dust event of 25–26 March 2010 at Lampedusa (Mediterranean Sea). J. Geophys. Res. Atmos. 2011, 116, D23. [Google Scholar] [CrossRef] [Green Version]
- Schepanski, K.; Mallet, M.; Heinold, B.; Ulrich, M. North African dust transport toward the western Mediterranean basin: Atmospheric controls on dust source activation and transport pathways during June–July 2013. Atmos. Chem. Phys. 2016, 16, 14147–14168. [Google Scholar] [CrossRef] [Green Version]
- Solomos, S.; Kalivitis, N.; Mihalopoulos, N.; Amiridis, V.; Kouvarakis, G.; Gkikas, A.; Binietoglou, I.; Tsekeri, A.; Kazadzis, S.; Kottas, M.; et al. From tropospheric folding to Khamsin and Foehn winds: How atmospheric dynamics advanced a record-breaking dust episode in Crete. Atmosphere 2018, 9, 240. [Google Scholar] [CrossRef] [Green Version]
- Kaskaoutis, D.G.; Dumka, U.C.; Rashki, A.; Psiloglou, B.E.; Gavriil, A.; Mofidi, A.; Petrinoli, K.; Karagiannis, D.; Kambezidis, H.D. Analysis of intense dust storms over the eastern Mediterranean in March 2018: Impact on radiative forcing and Athens air quality. Atmos. Env. 2019, 209, 23–39. [Google Scholar] [CrossRef]
- Toledano, C.; Cachorro, V.; De Frutos, A.; Sorribas, M.; Prats, N.; De la Morena, B. Inventory of African desert dust events over the southwestern Iberian Peninsula in 2000–2005 with an AERONET Cimel Sun photometer. J. Geophys. Res. Atmos. 2007, 112, D21. [Google Scholar] [CrossRef]
- Ganor, E.; Osetinsky, I.; Stupp, A.; Alpert, P. Increasing trend of African dust, over 49 years, in the eastern Mediterranean. J. Geophys. Res. Atmos. 2010, 115, D7. [Google Scholar] [CrossRef] [Green Version]
- Achilleos, S.; Mouzourides, P.; Kalivitis, N.; Katra, I.; Kloog, I.; Kouis, P.; Middleton, N.; Mihalopoulos, N.; Neophytou, M.; Panayiotou, A.; et al. Spatio-temporal variability of desert dust storms in Eastern Mediterranean (Crete, Cyprus, Israel) between 2006 and 2017 using a uniform methodology. Sci. Total Environ. 2020, 714, 136693. [Google Scholar] [CrossRef]
- Pey, J.; Querol, X.; Alastuey, A.; Forastiere, F.; Stafoggia, M. African dust outbreaks over the Mediterranean Basin during 2001–2011: PM 10 concentrations, phenomenology and trends, and its relation with synoptic and mesoscale meteorology. Atmos. Chem. Phys. 2013, 13, 1395–1410. [Google Scholar] [CrossRef] [Green Version]
- Flores, R.M.; Kaya, N.; Eşer, Ö.; Saltan, Ş. The effect of mineral dust transport on PM10 concentrations and physical properties in Istanbul during 2007–2014. Atmos. Res. 2017, 197, 342–355. [Google Scholar] [CrossRef]
- Gkikas, A.; Houssos, E.; Hatzianastassiou, N.; Papadimas, C.; Bartzokas, A. Synoptic conditions favouring the occurrence of aerosol episodes over the broader Mediterranean basin. Q. J. R. Meteorol. Soc. 2012, 138, 932–949. [Google Scholar] [CrossRef]
- Gkikas, A.; Basart, S.; Hatzianastassiou, N.; Marinou, E.; Amiridis, V.; Kazadzis, S.; Pey, J.; Querol, X.; Jorba, O.; Gassó, S.; et al. Mediterranean intense desert dust outbreaks and their vertical structure based on remote sensing data. Atmos. Chem. Phys. 2016, 16, 8609–8642. [Google Scholar] [CrossRef] [Green Version]
- Barnes, W.L.; Xiong, X.; Guenther, B.W.; Salomonson, V. Development, characterization, and performance of the EOS MODIS sensors. In Proceedings of the SPIE 5151, Earth Observing Systems VIII, San Diego, CA, USA, 10 November 2003. [Google Scholar] [CrossRef]
- Salomonson, V.V.; Barnes, W.; Masuoka, E.J. Introduction to MODIS and an Overview of Associated Activities. Earth Sci. Satell. Remote Sens. 2006, 12–32. [Google Scholar] [CrossRef]
- Baddock, M.C.; Bullard, J.E.; Bryant, R.G. Dust source identification using MODIS: A comparison of techniques applied to the Lake Eyre Basin, Australia. Remote Sens. Environ. 2009, 113, 1511–1528. [Google Scholar] [CrossRef] [Green Version]
- Rezaei, M.; Farajzadeh, M.; Mielonen, T.; Ghavidel, Y. Analysis of spatio-temporal dust aerosol frequency over Iran based on satellite dat. Atmos. Pollut. Res. 2019, 10, 508–519. [Google Scholar] [CrossRef]
- Ali, M.A.; Nichol, J.E.; Bilal, M.; Qiu, Z.; Mazhar, U.; Wahiduzzaman, M.; Almazroui, M.; Islam, M.N. Classification of aerosols over Saudi Arabia from 2004–2016. Atmos. Environ. 2020, 24, 1352–2310. [Google Scholar] [CrossRef]
- Voss, K.K.; Evan, A.T. A new satellite-based global climatology of dust aerosol optical depth. J. Appl. Meteorol. Climatol. 2020, 59, 83–102. [Google Scholar] [CrossRef]
- Remer, L.A.; Kaufman, Y.J.; Tanré, D.; Mattoo, S.; Chu, D.A.; Martins, J.V.; Li, R.-R.; Ichoku, C.; Levy, R.C.; Kleidman, R.G.; et al. The MODIS Aerosol Algorithm, Products, and Validation. J. Atmos. Sci. 2005, 62, 947–973. [Google Scholar] [CrossRef] [Green Version]
- Papadimas, C.; Hatzianastassiou, N.; Mihalopoulos, N.; Kanakidou, M.; Katsoulis, B.D.; Vardavas, I. Assessment of the MODIS Collections C005 and C004 aerosol optical depth products over the Mediterranean basin. Atmos. Chem. Phys. 2009, 9, 2987–2999. [Google Scholar] [CrossRef] [Green Version]
- Schutgens, N.; Sayer, A.M.; Heckel, A.; Hsu, C.; Jethva, H.; de Leeuw, G.; Leonard, P.J.T.; Levy, R.C.; Lipponen, A.; Lyapustin, A.; et al. An AeroCom–AeroSat study: Intercomparison of satellite AOD datasets for aerosol model evaluation. Atmos. Chem. Phys. 2020, 20, 12431–12457. [Google Scholar] [CrossRef]
- Hsu, N.C. Changes to Modis Deep Blue Aerosol Products between Collection 6 and Collection 6.1. 2017. Available online: https://atmosphere-imager.gsfc.nasa.gov/sites/default/files/ModAtmo/modis_deep_blue_c61_changes2.pdf (accessed on 27 May 2021).
- Mattoo, S. Aerosol Dark Target (10 km & 3 km) Collection 6.1 Changes. Available online: https://atmosphere-imager.gsfc.nasa.gov/sites/default/files/ModAtmo/C061_Aerosol_Dark_Target_v2.pdf (accessed on 27 May 2021).
- Wang, Y.; Yuan, Q.; Li, T.; Shen, H.; Zheng, L.; Zhang, L. Evaluation and comparison of MODIS Collection 6.1 aerosol optical depth against AERONET over regions in China with multifarious underlying surfaces. Atmos. Environ. 2019, 200, 280–301. [Google Scholar] [CrossRef] [Green Version]
- Gavrouzou, M.; Hatzianastassiou, N.; Gkikas, A.; Korras-Carraca, M.-B.; Mihalopoulos, N. A global climatology of dust aerosols based on satellite data: Spatial, seasonal and inter-annual patterns over the period 2005–2019. Remote Sens. 2021, 13, 359. [Google Scholar] [CrossRef]
- Torres, O.; Ahn, C.; Chen, Z. Improvements to the OMI near-UV aerosol algorithm using A-train CALIOP and AIRS observations. Atmos. Meas. Tech. 2013, 6, 3257–3270. [Google Scholar] [CrossRef] [Green Version]
- Stein Zweers, D.C.; Veefkind, P. OMI/Aura Multi-Wavelength Aerosol Optical Depth and Single Scattering Albedo 1-orbit L2 Swath 13 × 24 km V003; Goddard Earth Sciences Data and Information Services Center (GES DISC): Greenbelt, MD, USA, 2012. [CrossRef]
- Stein Zweers, D.C.; Veefkind, P. OMI/Aura Multiwavelength Aerosol Optical Depth and Single Scattering Albedo L3 1 day Best Pixel in 0.25 Degree × 0.25 Degree V3; NASA Goddard Space Flight Center, Goddard Earth Sciences Data and Information Services Center (GES DISC): Greenbelt, MD, USA, 2012. [CrossRef]
- Stein Zweers, D.C.; Veefkind, P. OMI/Aura Aerosol Product Multi-Wavelength Algorithm Zoomed 1-Orbit L2 Swath 13 × 12 km V003; Goddard Earth Sciences Data and Information Services Center (GES DISC): Greenbelt, MD, USA, 2012. [CrossRef]
- Hovila, J.; Arola, A.; Tamminen, J. OMI/Aura Surface UV Irradiance 1-Orbit L2 Swath 13 × 24 km V003; Goddard Earth Sciences Data and Information Services Center (GES DISC): Greenbelt, MD, USA, 2007. [CrossRef]
- Hovila, J.; Arola, A.; Tamminen, J. OMI/Aura Surface UVB Irradiance and Erythemal Dose Daily L3 Global Gridded 1.0 Degree × 1.0 Degree V3; Goddard Earth Sciences Data and Information Services Center (GES DISC): Greenbelt, MD, USA, 2013. [CrossRef]
- Hovila, J.; Arola, A.; Tamminen, J. OMI/Aura Surface UVB Irradiance and Erythemal Dose Daily L2 Global Gridded 0.25 Degree × 0.25 Degree V3; Goddard Earth Sciences Data and Information Services Center (GES DISC): Greenbelt, MD, USA, 2014. [CrossRef]
- Torres, O.; Tanskanen, A.; Veihelmann, B.; Ahn, C.; Braak, R.; Bhartia, P.K.; Veefkind, P.; Levelt, P. Aerosols and surface UV products from Ozone Monitoring Instrument observations: An overview. J. Geophys. Res. 2007, 112, D24S47. [Google Scholar] [CrossRef] [Green Version]
- Pace, G.; di Sarra, A.; Meloni, D.; Piacentino, S.; and Chamard, P. Aerosol optical properties at Lampedusa (Central Mediterranean). 1. Influence of transport and identification of different aerosol types. Atmos. Chem. Phys. 2006, 6, 697–713. [Google Scholar] [CrossRef] [Green Version]
- Alpert, P.; Ziv, B. The Sharav cyclone: Observations and some theoretical considerations. J. Geophys. Res. Atmos. 1989, 94, 18495–18514. [Google Scholar] [CrossRef] [Green Version]
- Barkan, J.; Alpert, P.; Kutiel, H.; Kishcha, P. Synoptics of dust transportation days from Africa toward Italy and central Europe. J. Geophys. Res. Atmos 2005, 110. [Google Scholar] [CrossRef] [Green Version]
- Hatzianastassiou, N.; Papadimas, C.D.; Lolis, C.J.; Bartzokas, A.; Levizzani, V.; Pnevmatikos, J.D.; Katsoulis, B.D. Spatial and temporal variability of precipitation over the Mediterranean Basin based on 32-year satellite Global Precipitation Climatology Project data, part I: Evaluation and climatological patterns. Int. J. Climatol. 2016, 36, 4741–4754. [Google Scholar] [CrossRef]
- Adler, R.F.; Sapiano, M.R.P.; Huffman, G.J.; Wang, J.-J.; Gu, G.; Bolvin, D.; Chiu, L.; Schneider, U.; Becker, A.; Nelkin, E.; et al. The Global Precipitation Climatology Project (GPCP) Monthly Analysis (New Version 2.3) and a Review of 2017 Global Precipitation. Atmosphere 2018, 9, 138. [Google Scholar] [CrossRef] [PubMed] [Green Version]


| Absolute and Relative Percent Frequencies of DAEDs | Winter | Spring | Summer | Autumn | Annual |
|---|---|---|---|---|---|
| All DAEDs | 15 (9.1%) | 80 (48.2%) | 62 (37.3%) | 9 (5.4%) | 166 |
| Strong DAEDs | 5 (4.3%) | 52 (44.8%) | 54 (46.5%) | 5 (5.4%) | 116 |
| Extreme DAEDs | 10 (20%) | 28 (56%) | 8 (16%) | 4 (8%) | 50 |
Publisher’s Note: MDPI stays neutral with regard to jurisdictional claims in published maps and institutional affiliations. |
© 2021 by the authors. Licensee MDPI, Basel, Switzerland. This article is an open access article distributed under the terms and conditions of the Creative Commons Attribution (CC BY) license (https://creativecommons.org/licenses/by/4.0/).
Share and Cite
Gavrouzou, M.; Hatzianastassiou, N.; Gkikas, A.; Lolis, C.J.; Mihalopoulos, N. A Climatological Assessment of Intense Desert Dust Episodes over the Broader Mediterranean Basin Based on Satellite Data. Remote Sens. 2021, 13, 2895. https://0-doi-org.brum.beds.ac.uk/10.3390/rs13152895
Gavrouzou M, Hatzianastassiou N, Gkikas A, Lolis CJ, Mihalopoulos N. A Climatological Assessment of Intense Desert Dust Episodes over the Broader Mediterranean Basin Based on Satellite Data. Remote Sensing. 2021; 13(15):2895. https://0-doi-org.brum.beds.ac.uk/10.3390/rs13152895
Chicago/Turabian StyleGavrouzou, Maria, Nikolaos Hatzianastassiou, Antonis Gkikas, Christos J. Lolis, and Nikolaos Mihalopoulos. 2021. "A Climatological Assessment of Intense Desert Dust Episodes over the Broader Mediterranean Basin Based on Satellite Data" Remote Sensing 13, no. 15: 2895. https://0-doi-org.brum.beds.ac.uk/10.3390/rs13152895