
Social Network and Bibliometric Analysis of Unmanned Aerial Vehicle Remote Sensing Applications from 2010 to 2021


Abstract
:
1. Introduction
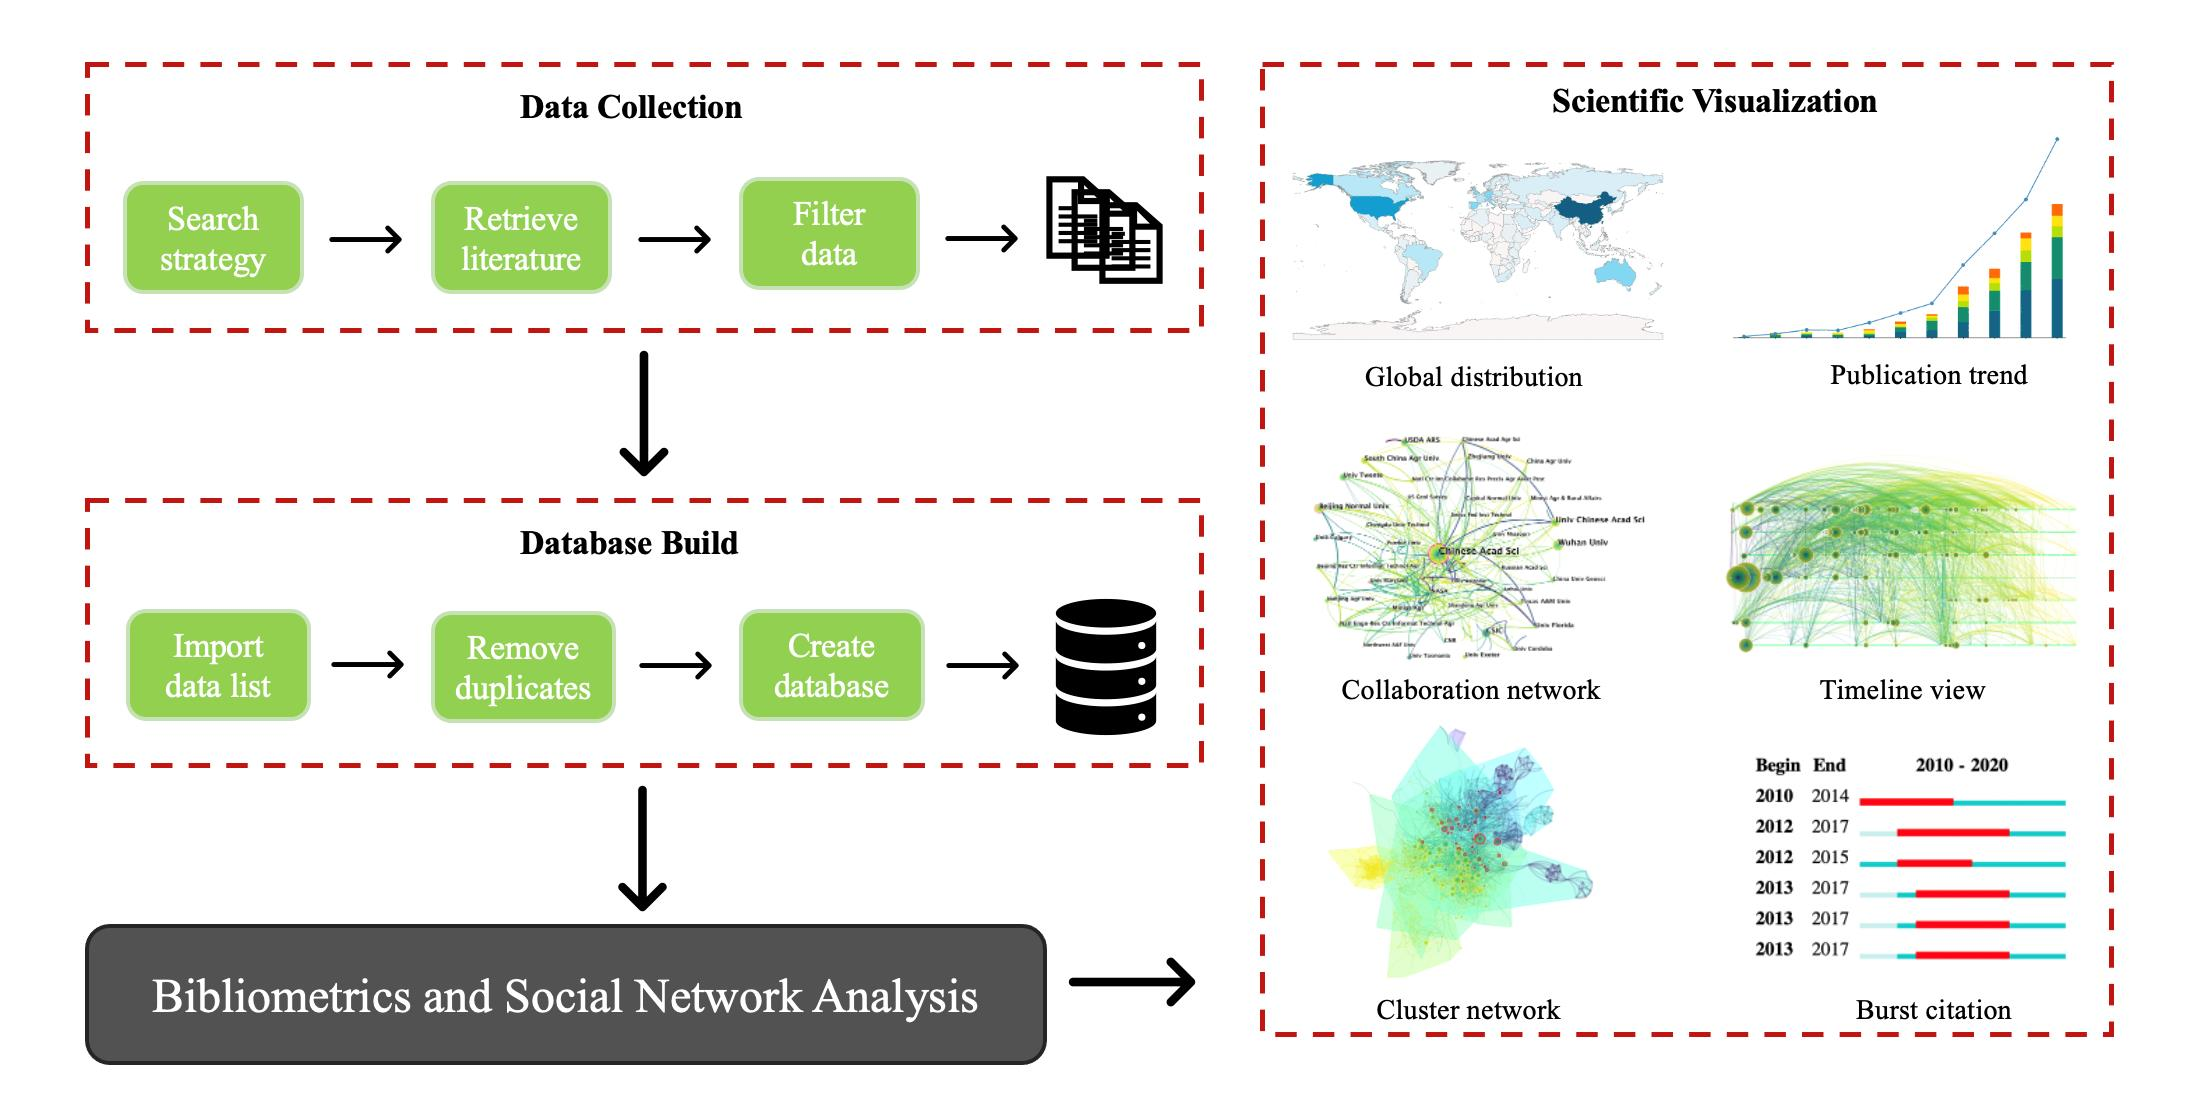
2. Materials and Methods
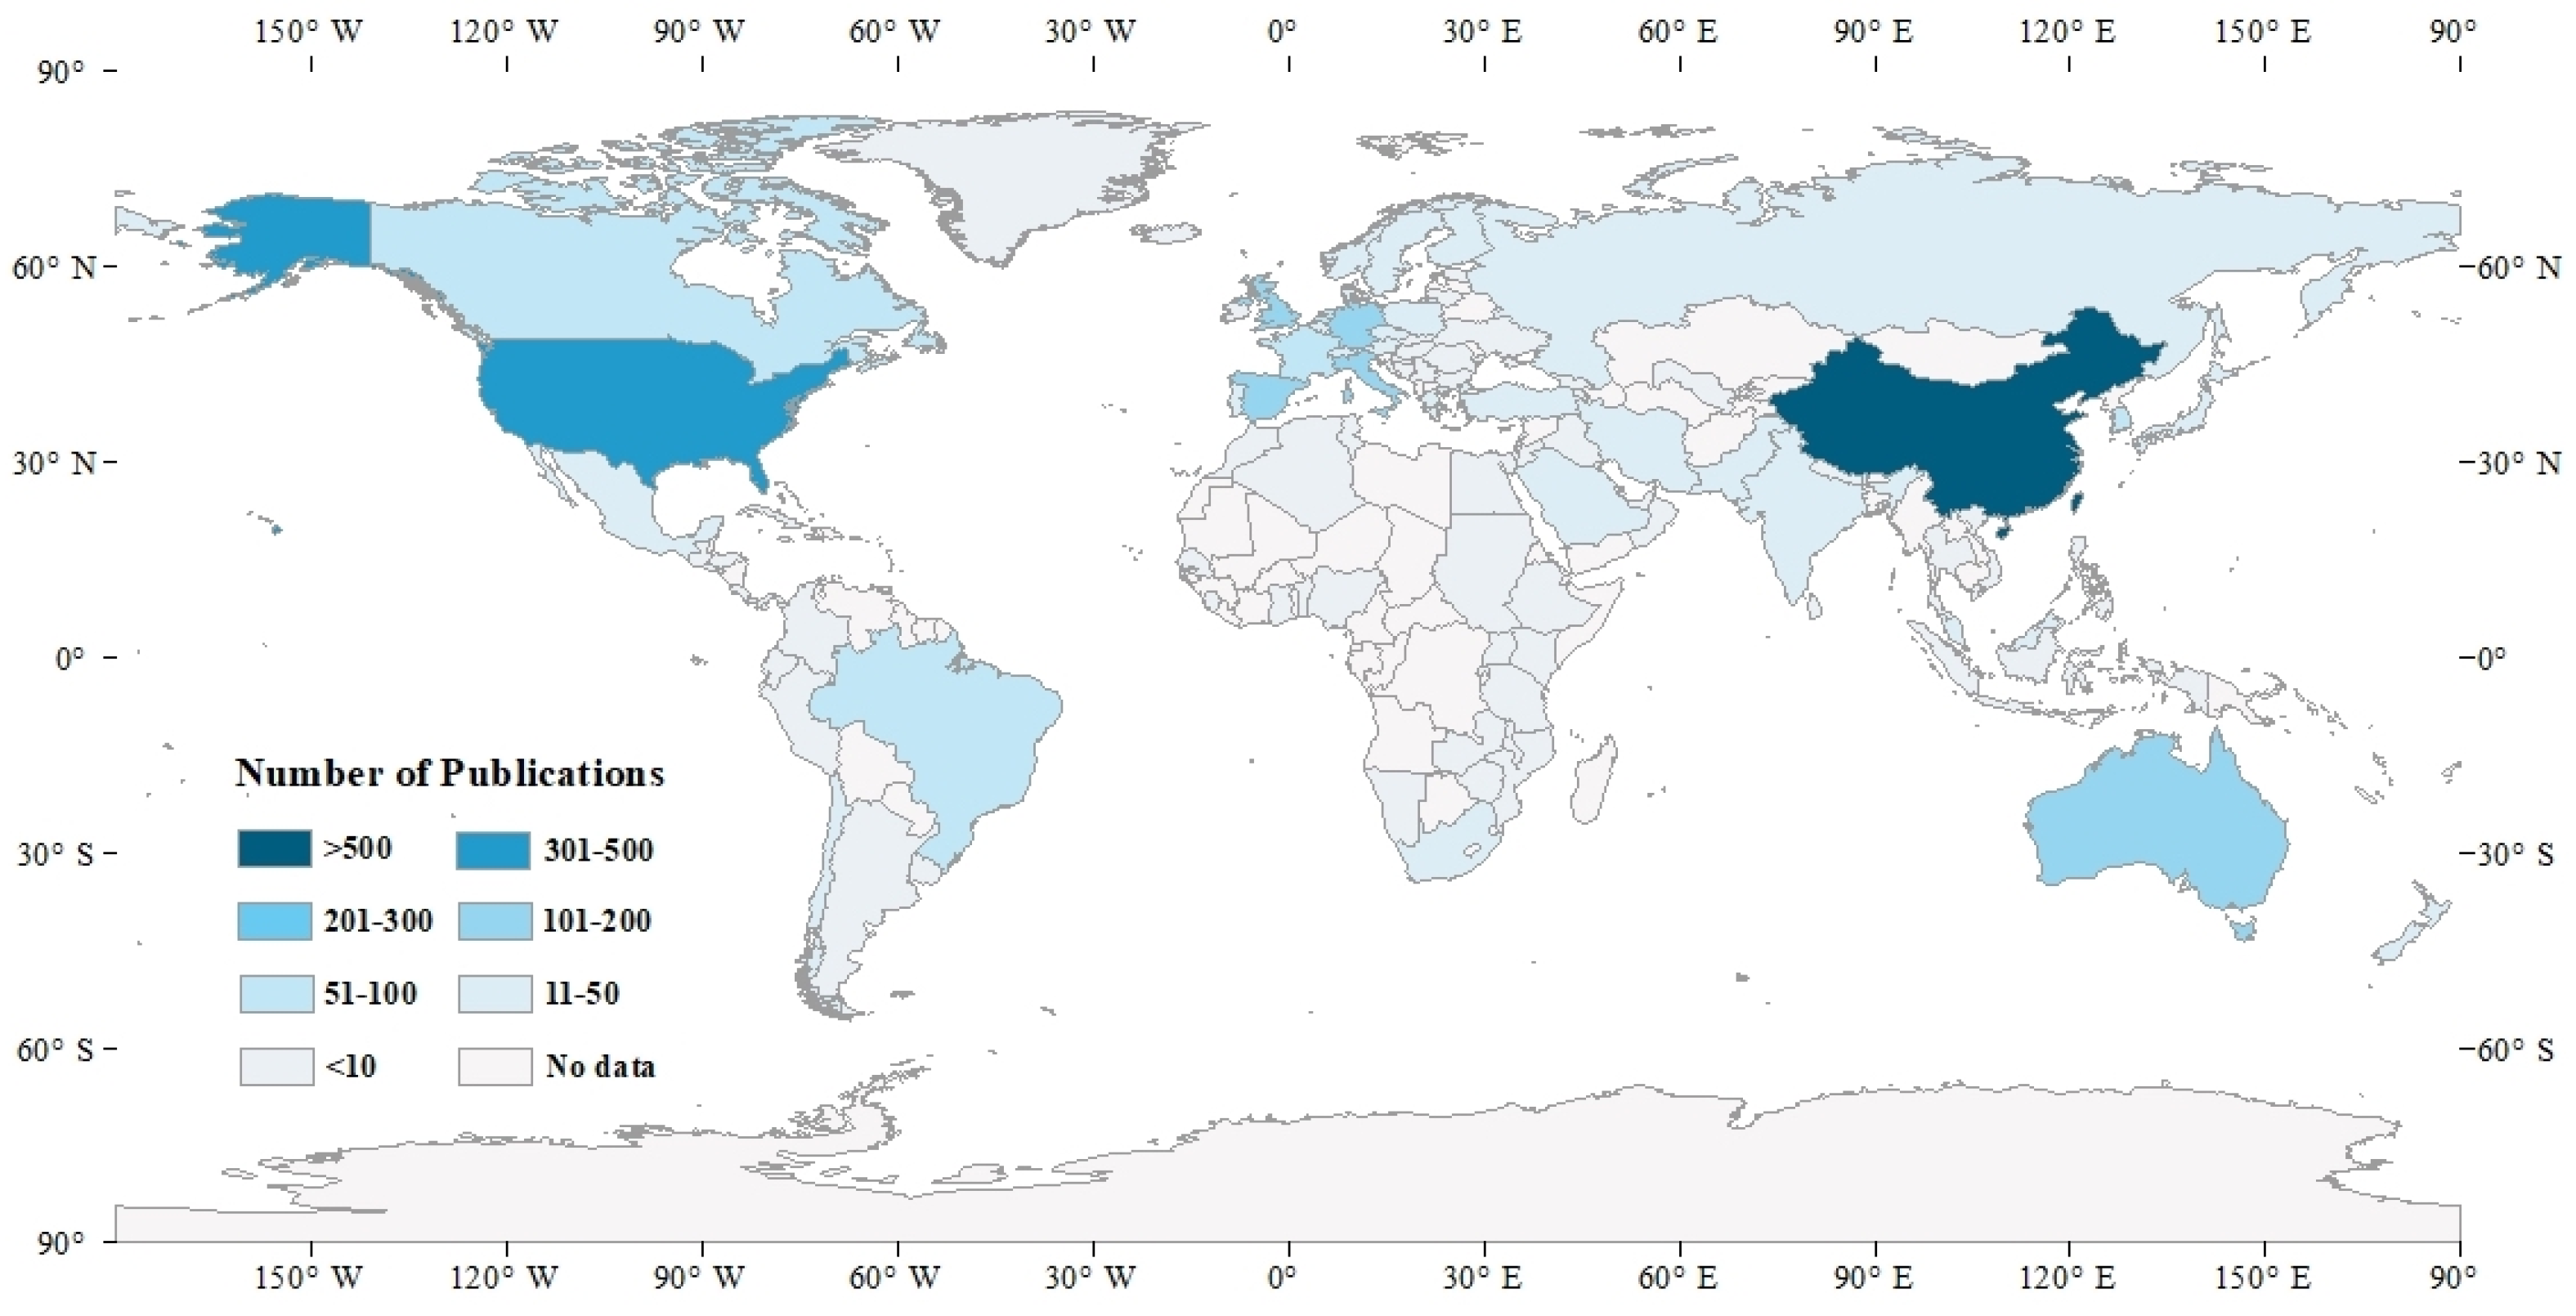
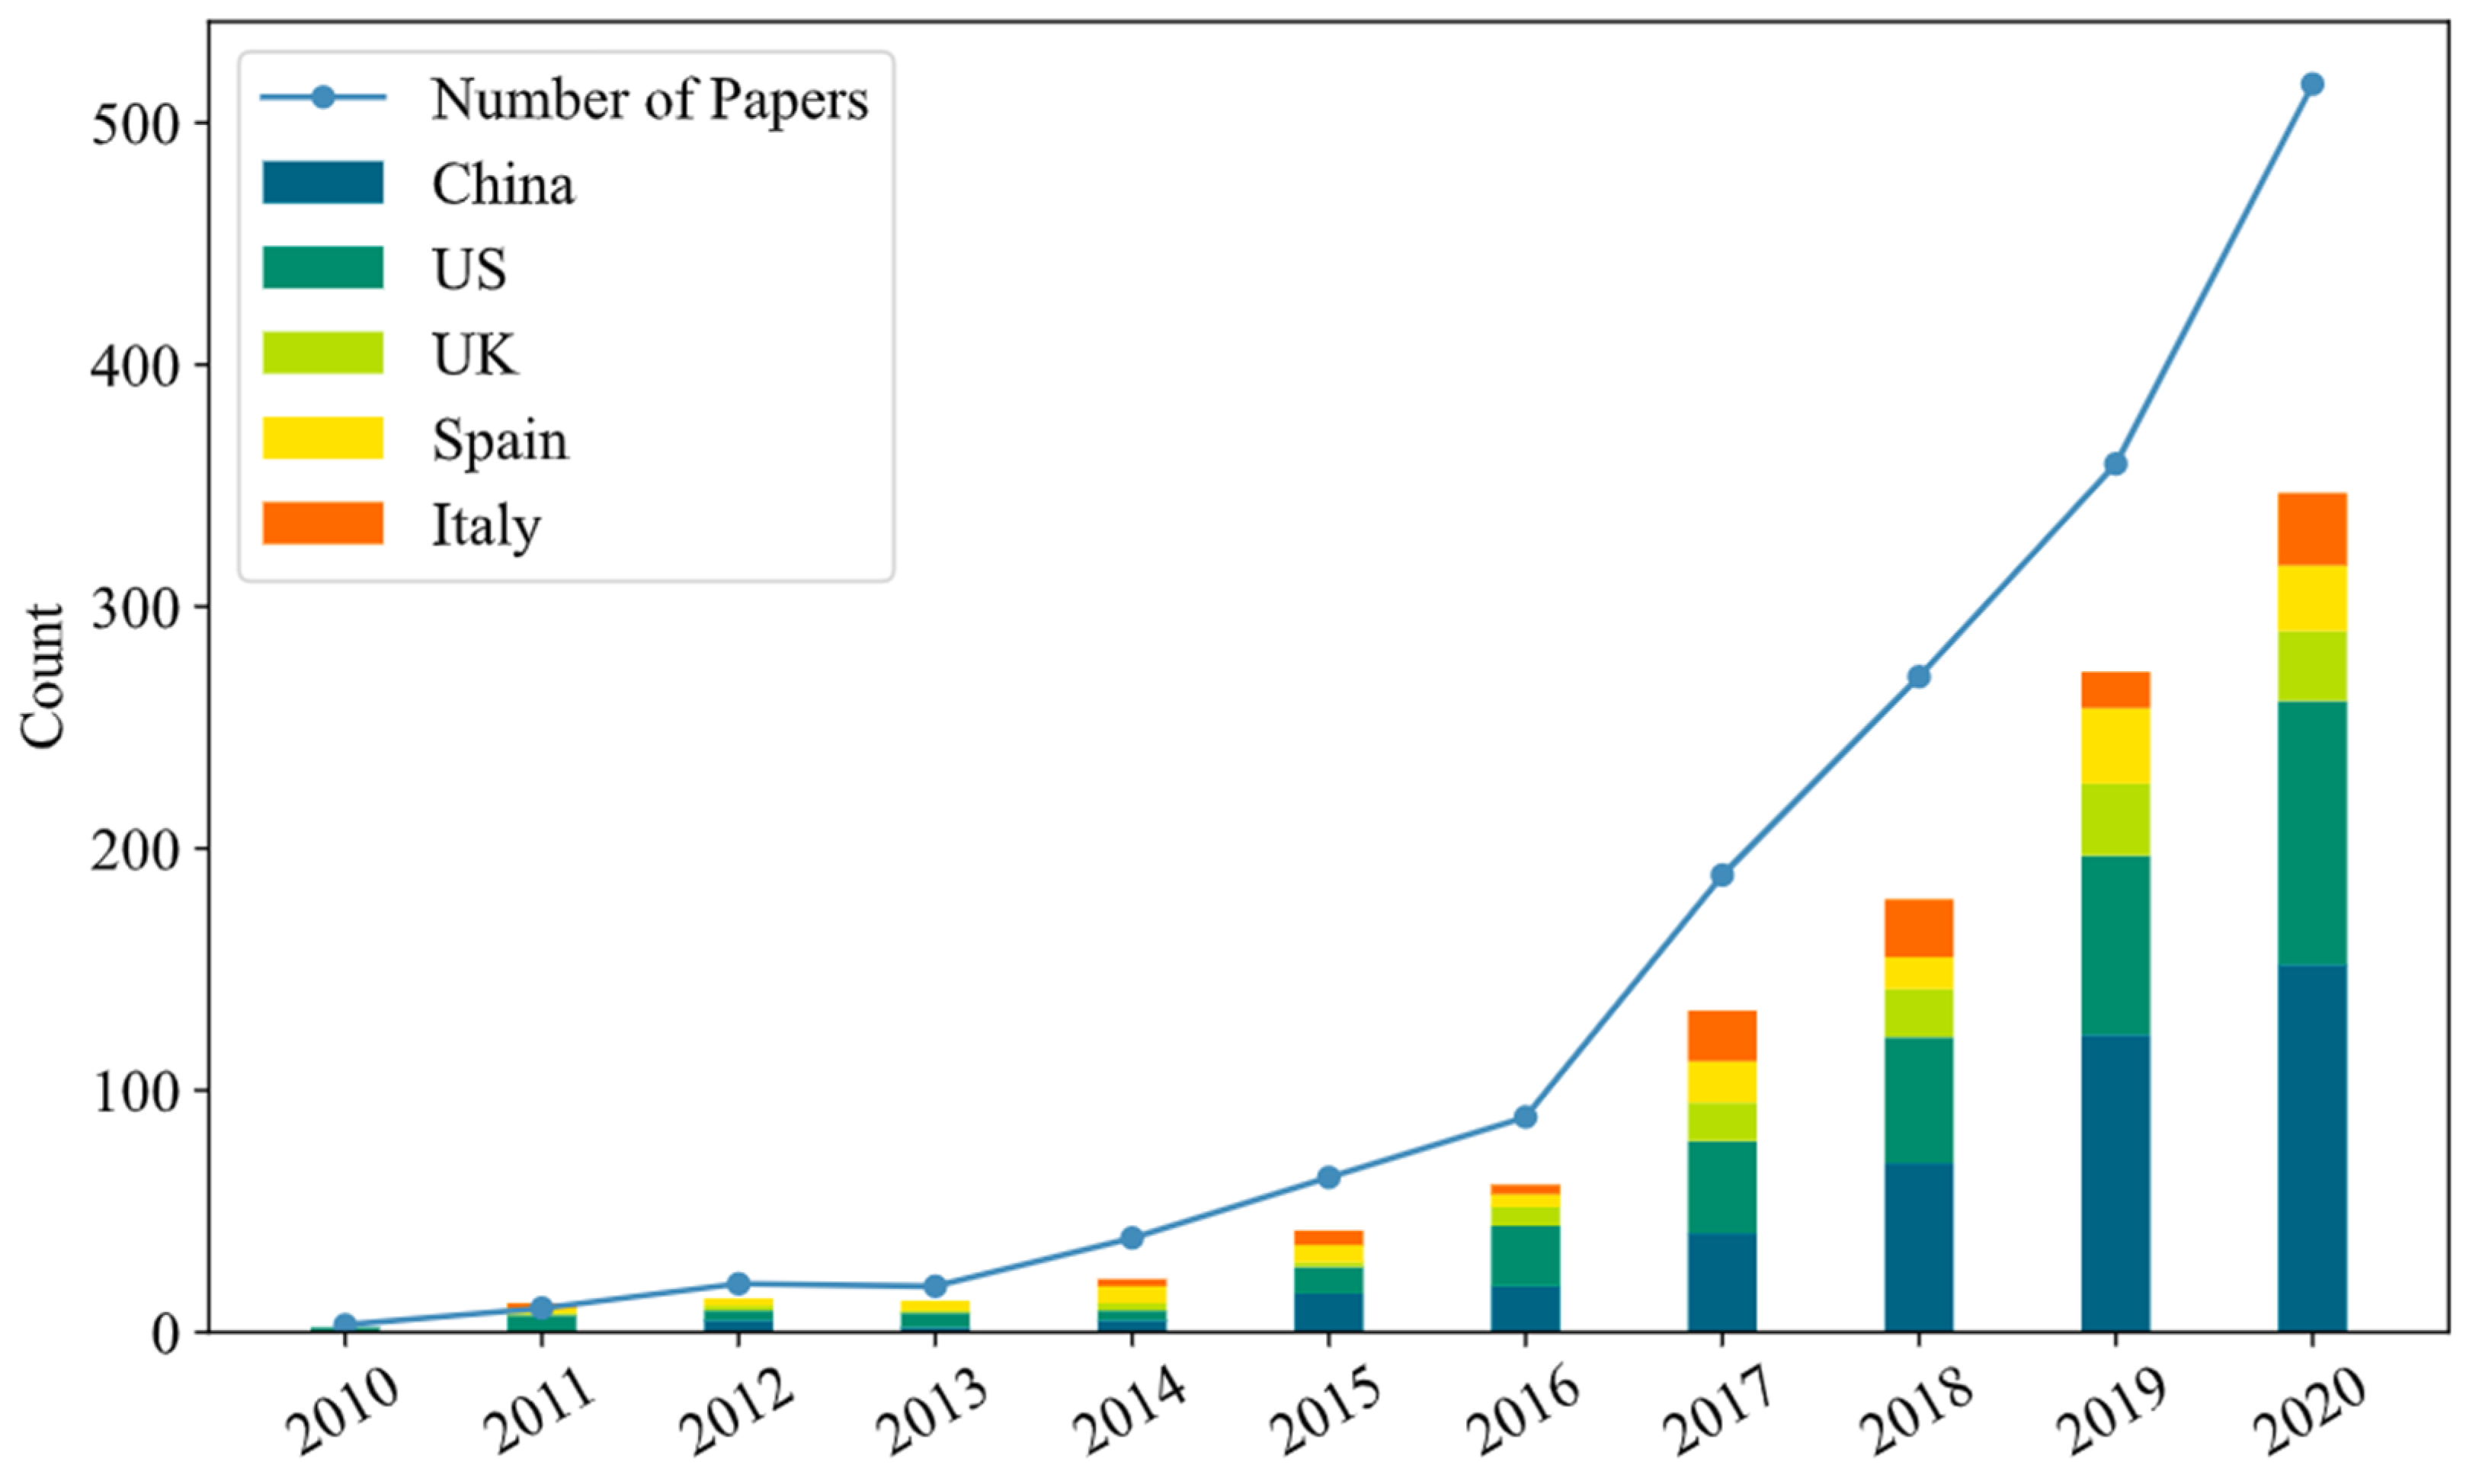
2.1. Publication Outputs
2.2. Correlation Characteristics
2.3. Research Front
3. Results
3.1. Analysis of Publication Outputs
3.2. Analysis of Correlation Characteristic
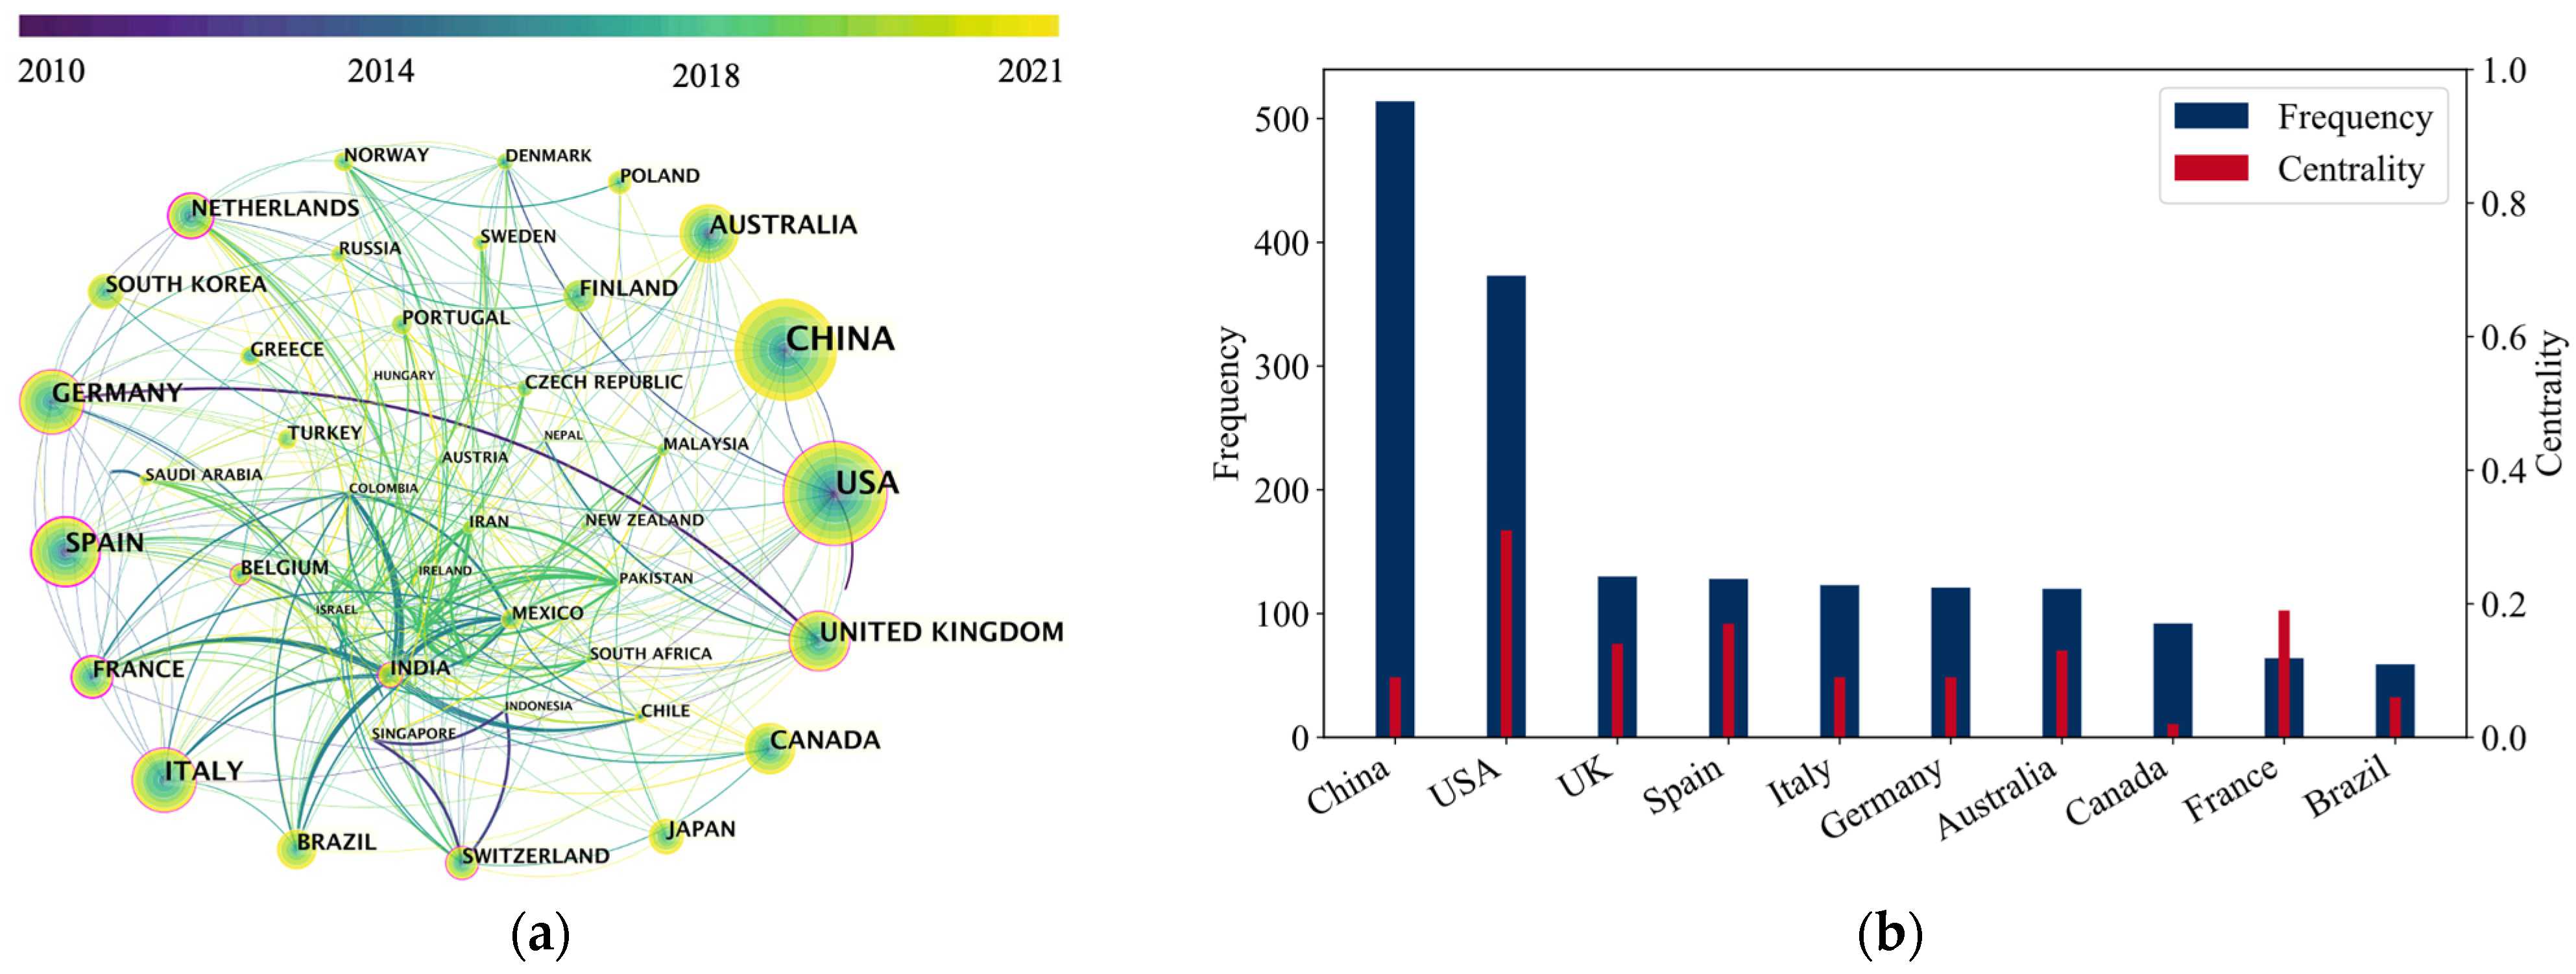
3.2.1. Cooperation Network Analysis
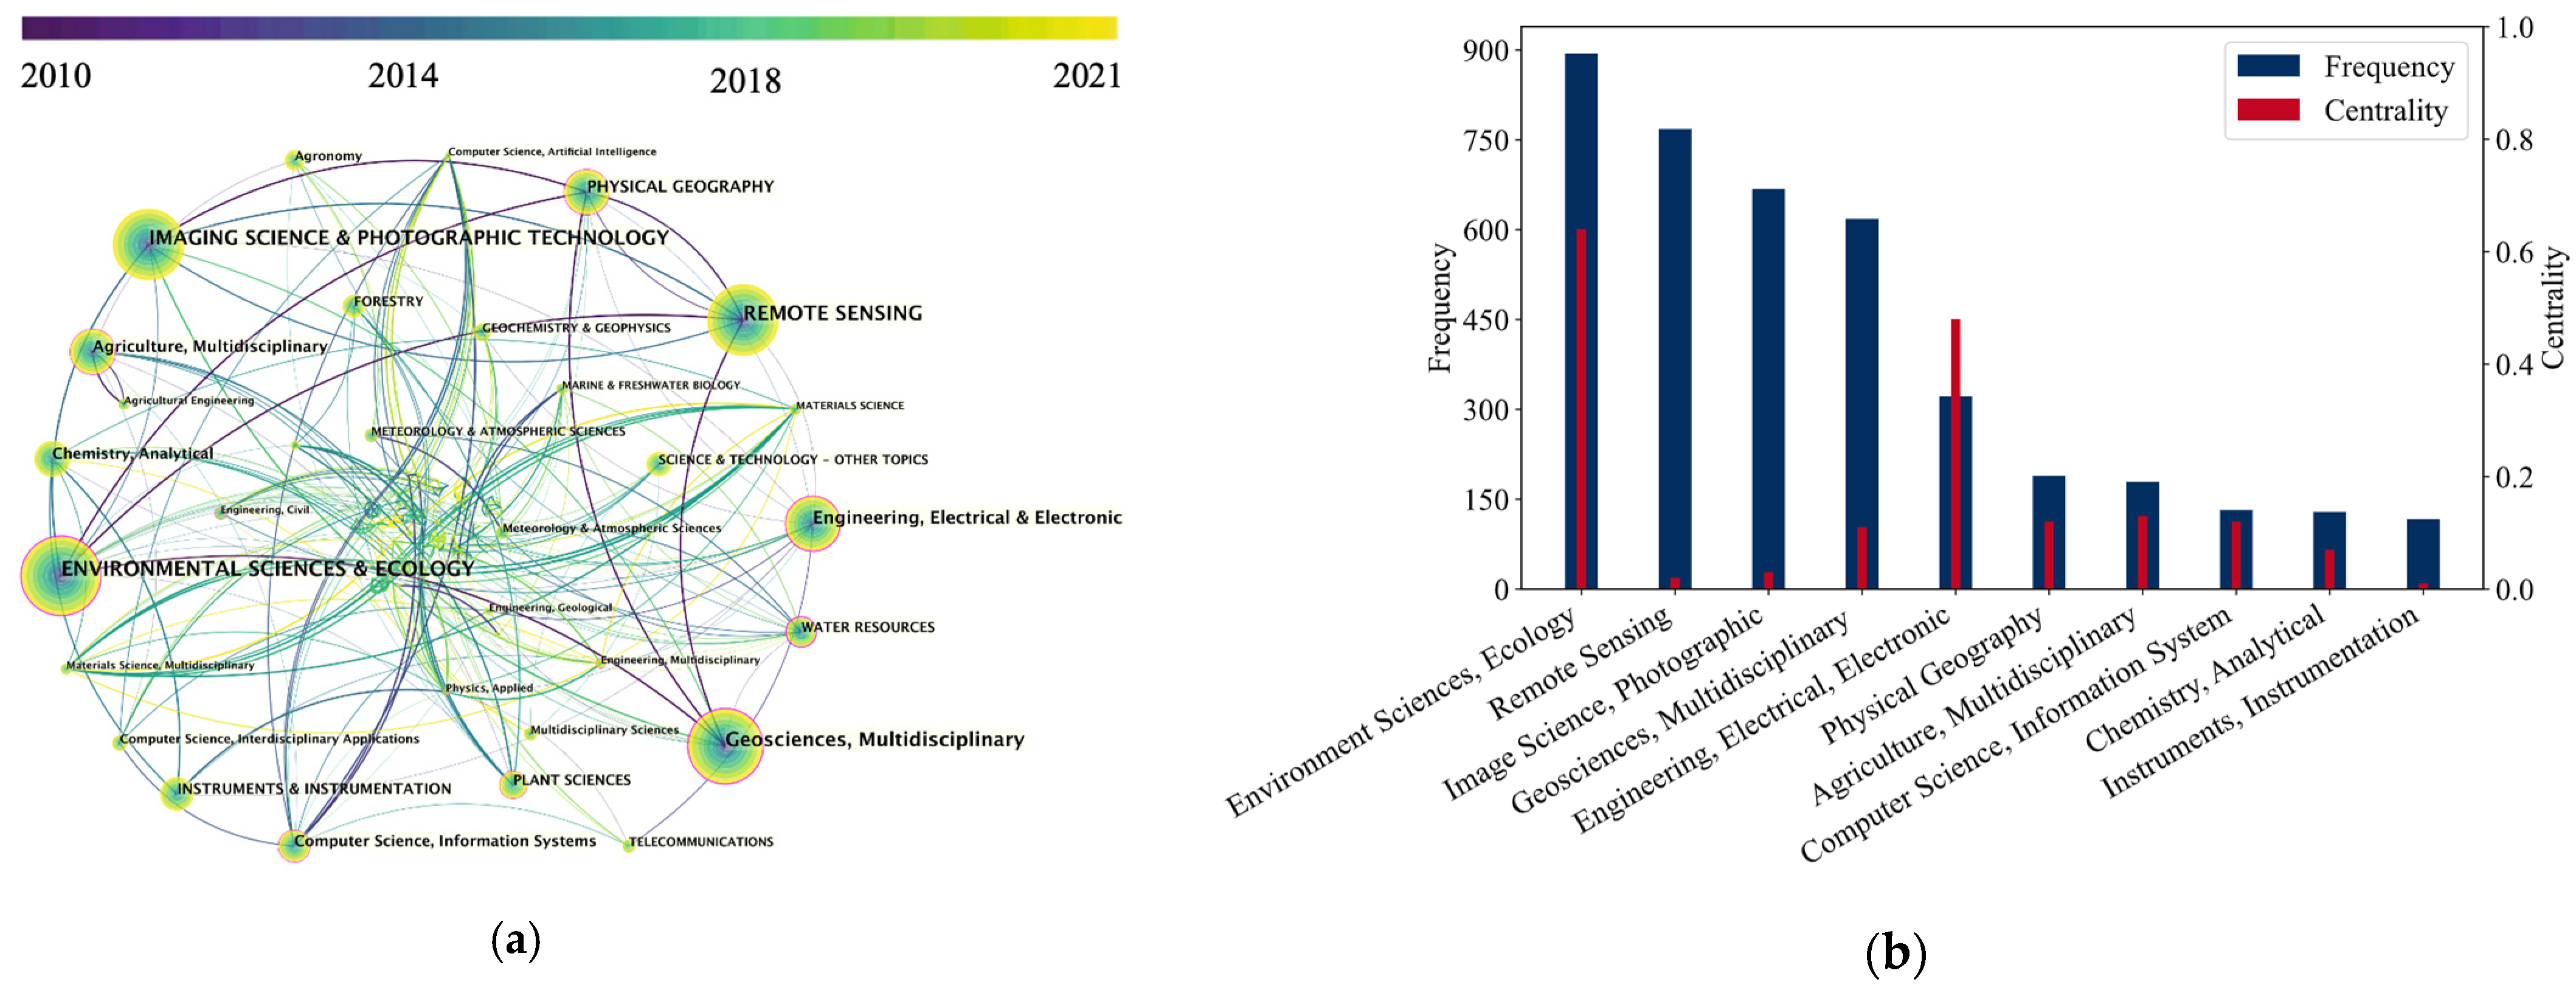
3.2.2. Discipline Interaction Analysis
3.3. Analysis of Research Front
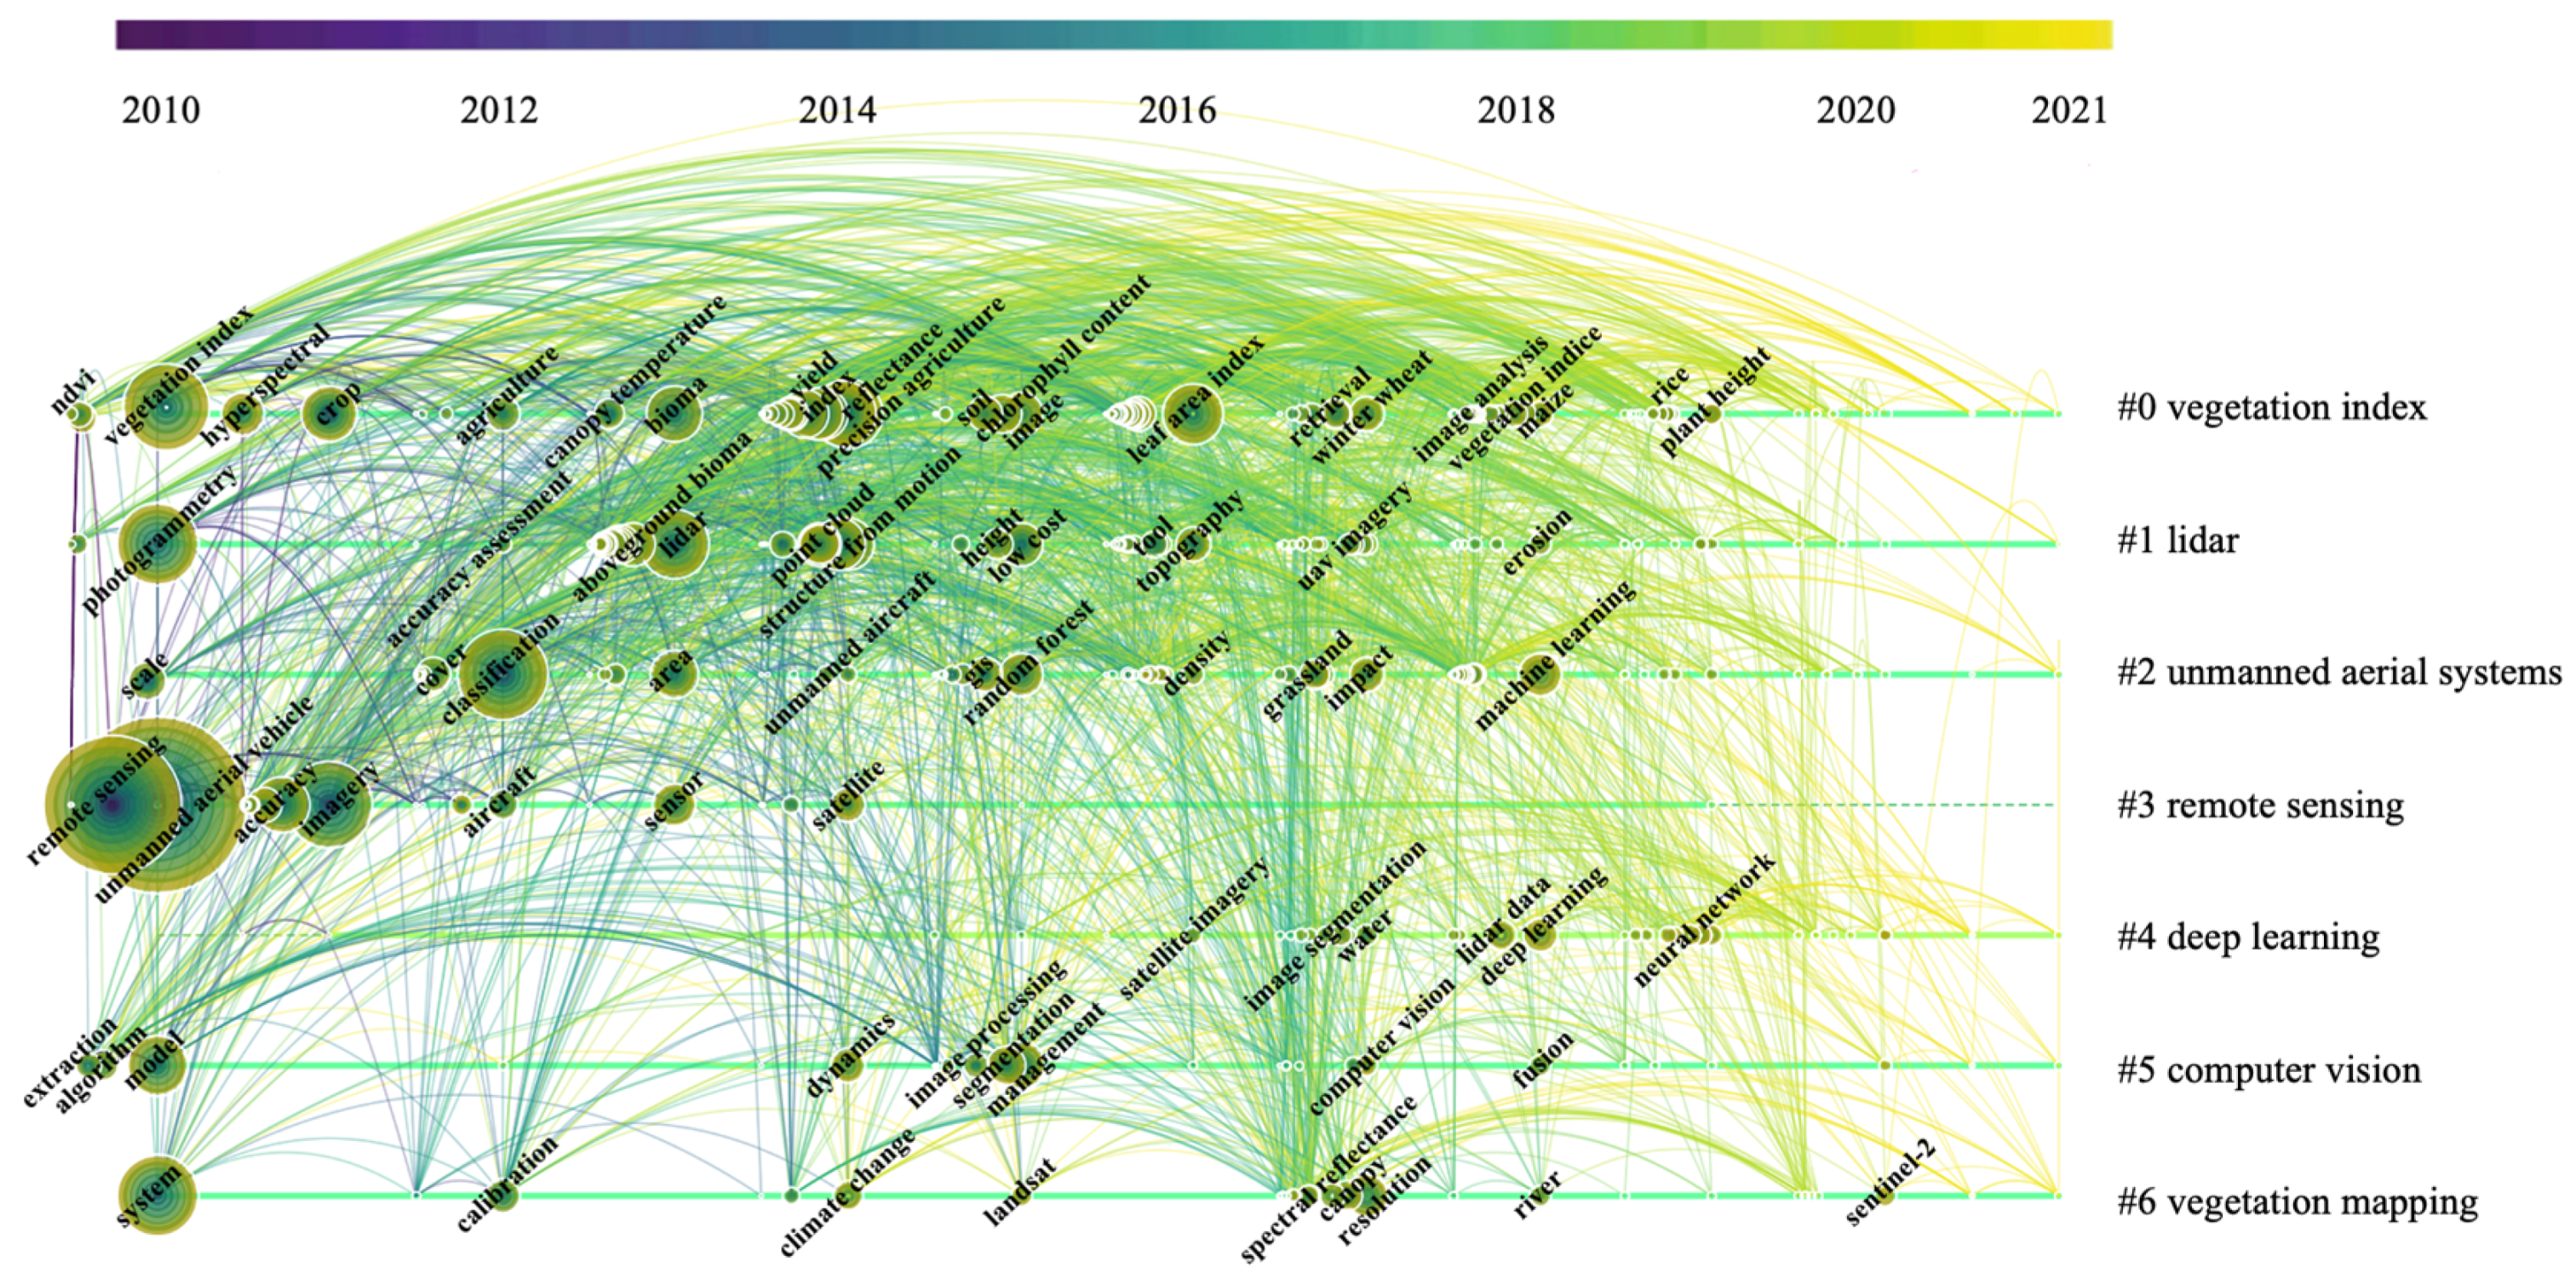
3.3.1. Keyword Analysis
3.3.2. Co-Citation Analysis
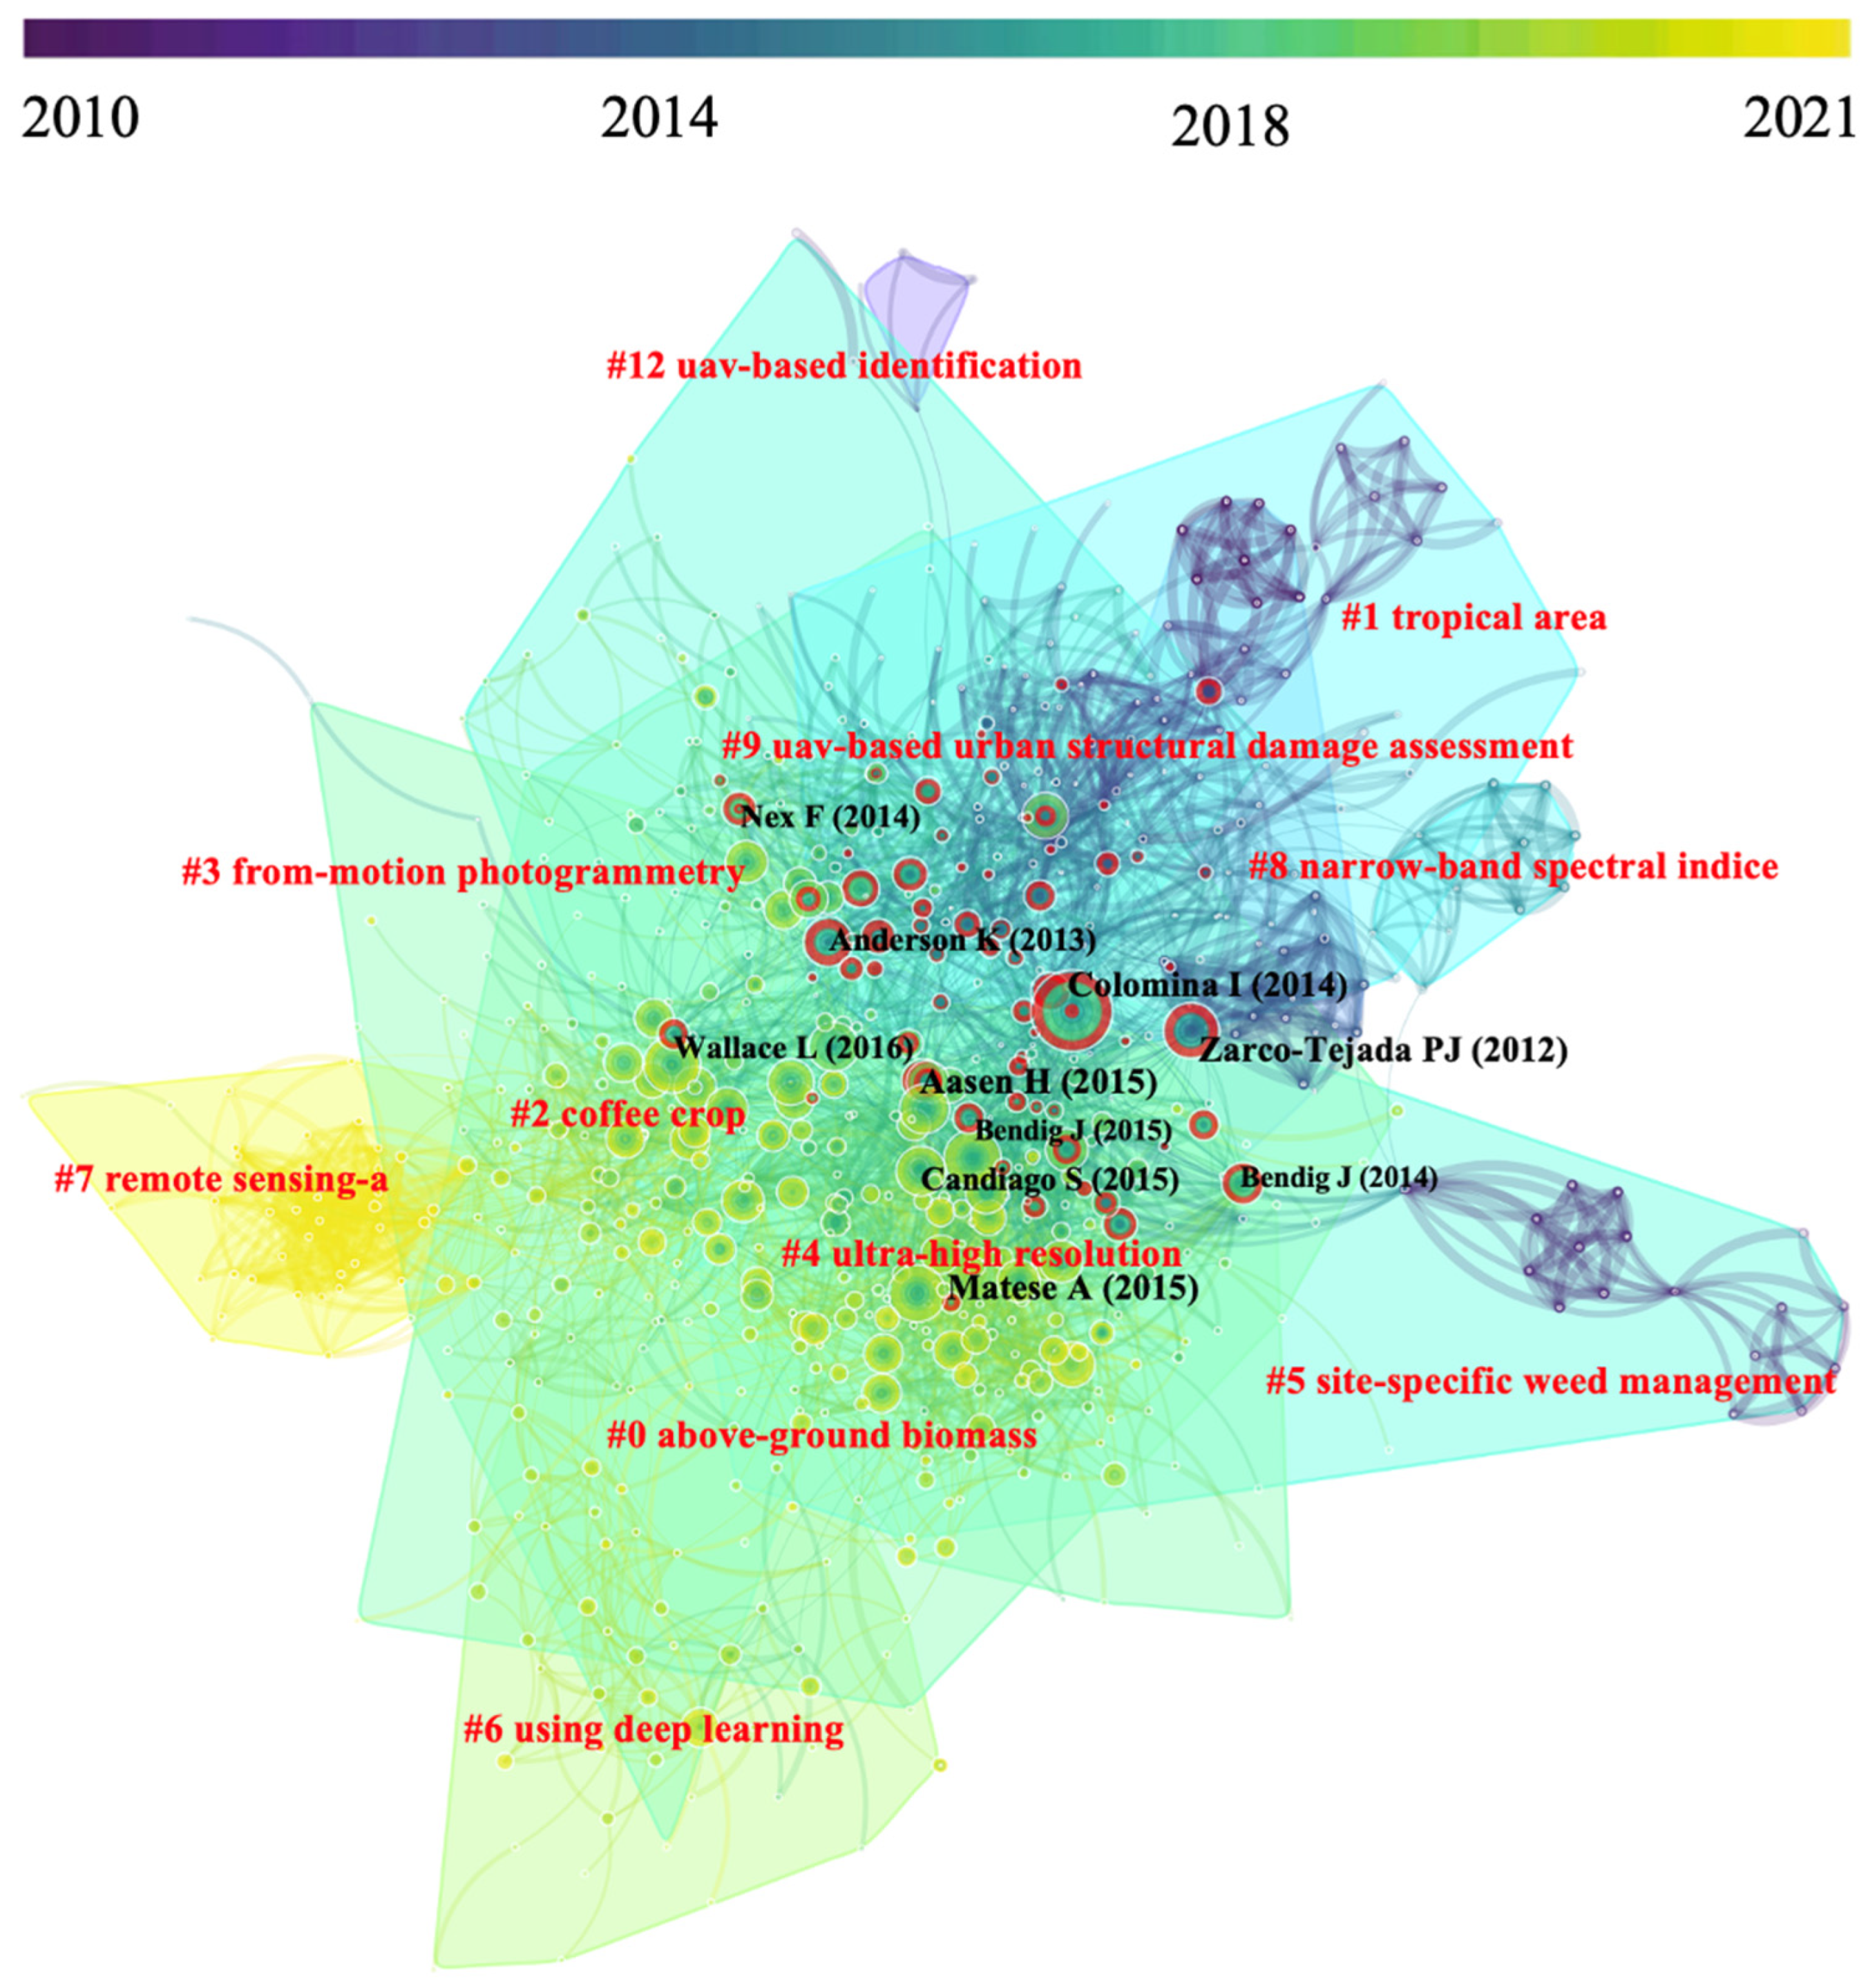
Cluster Analysis
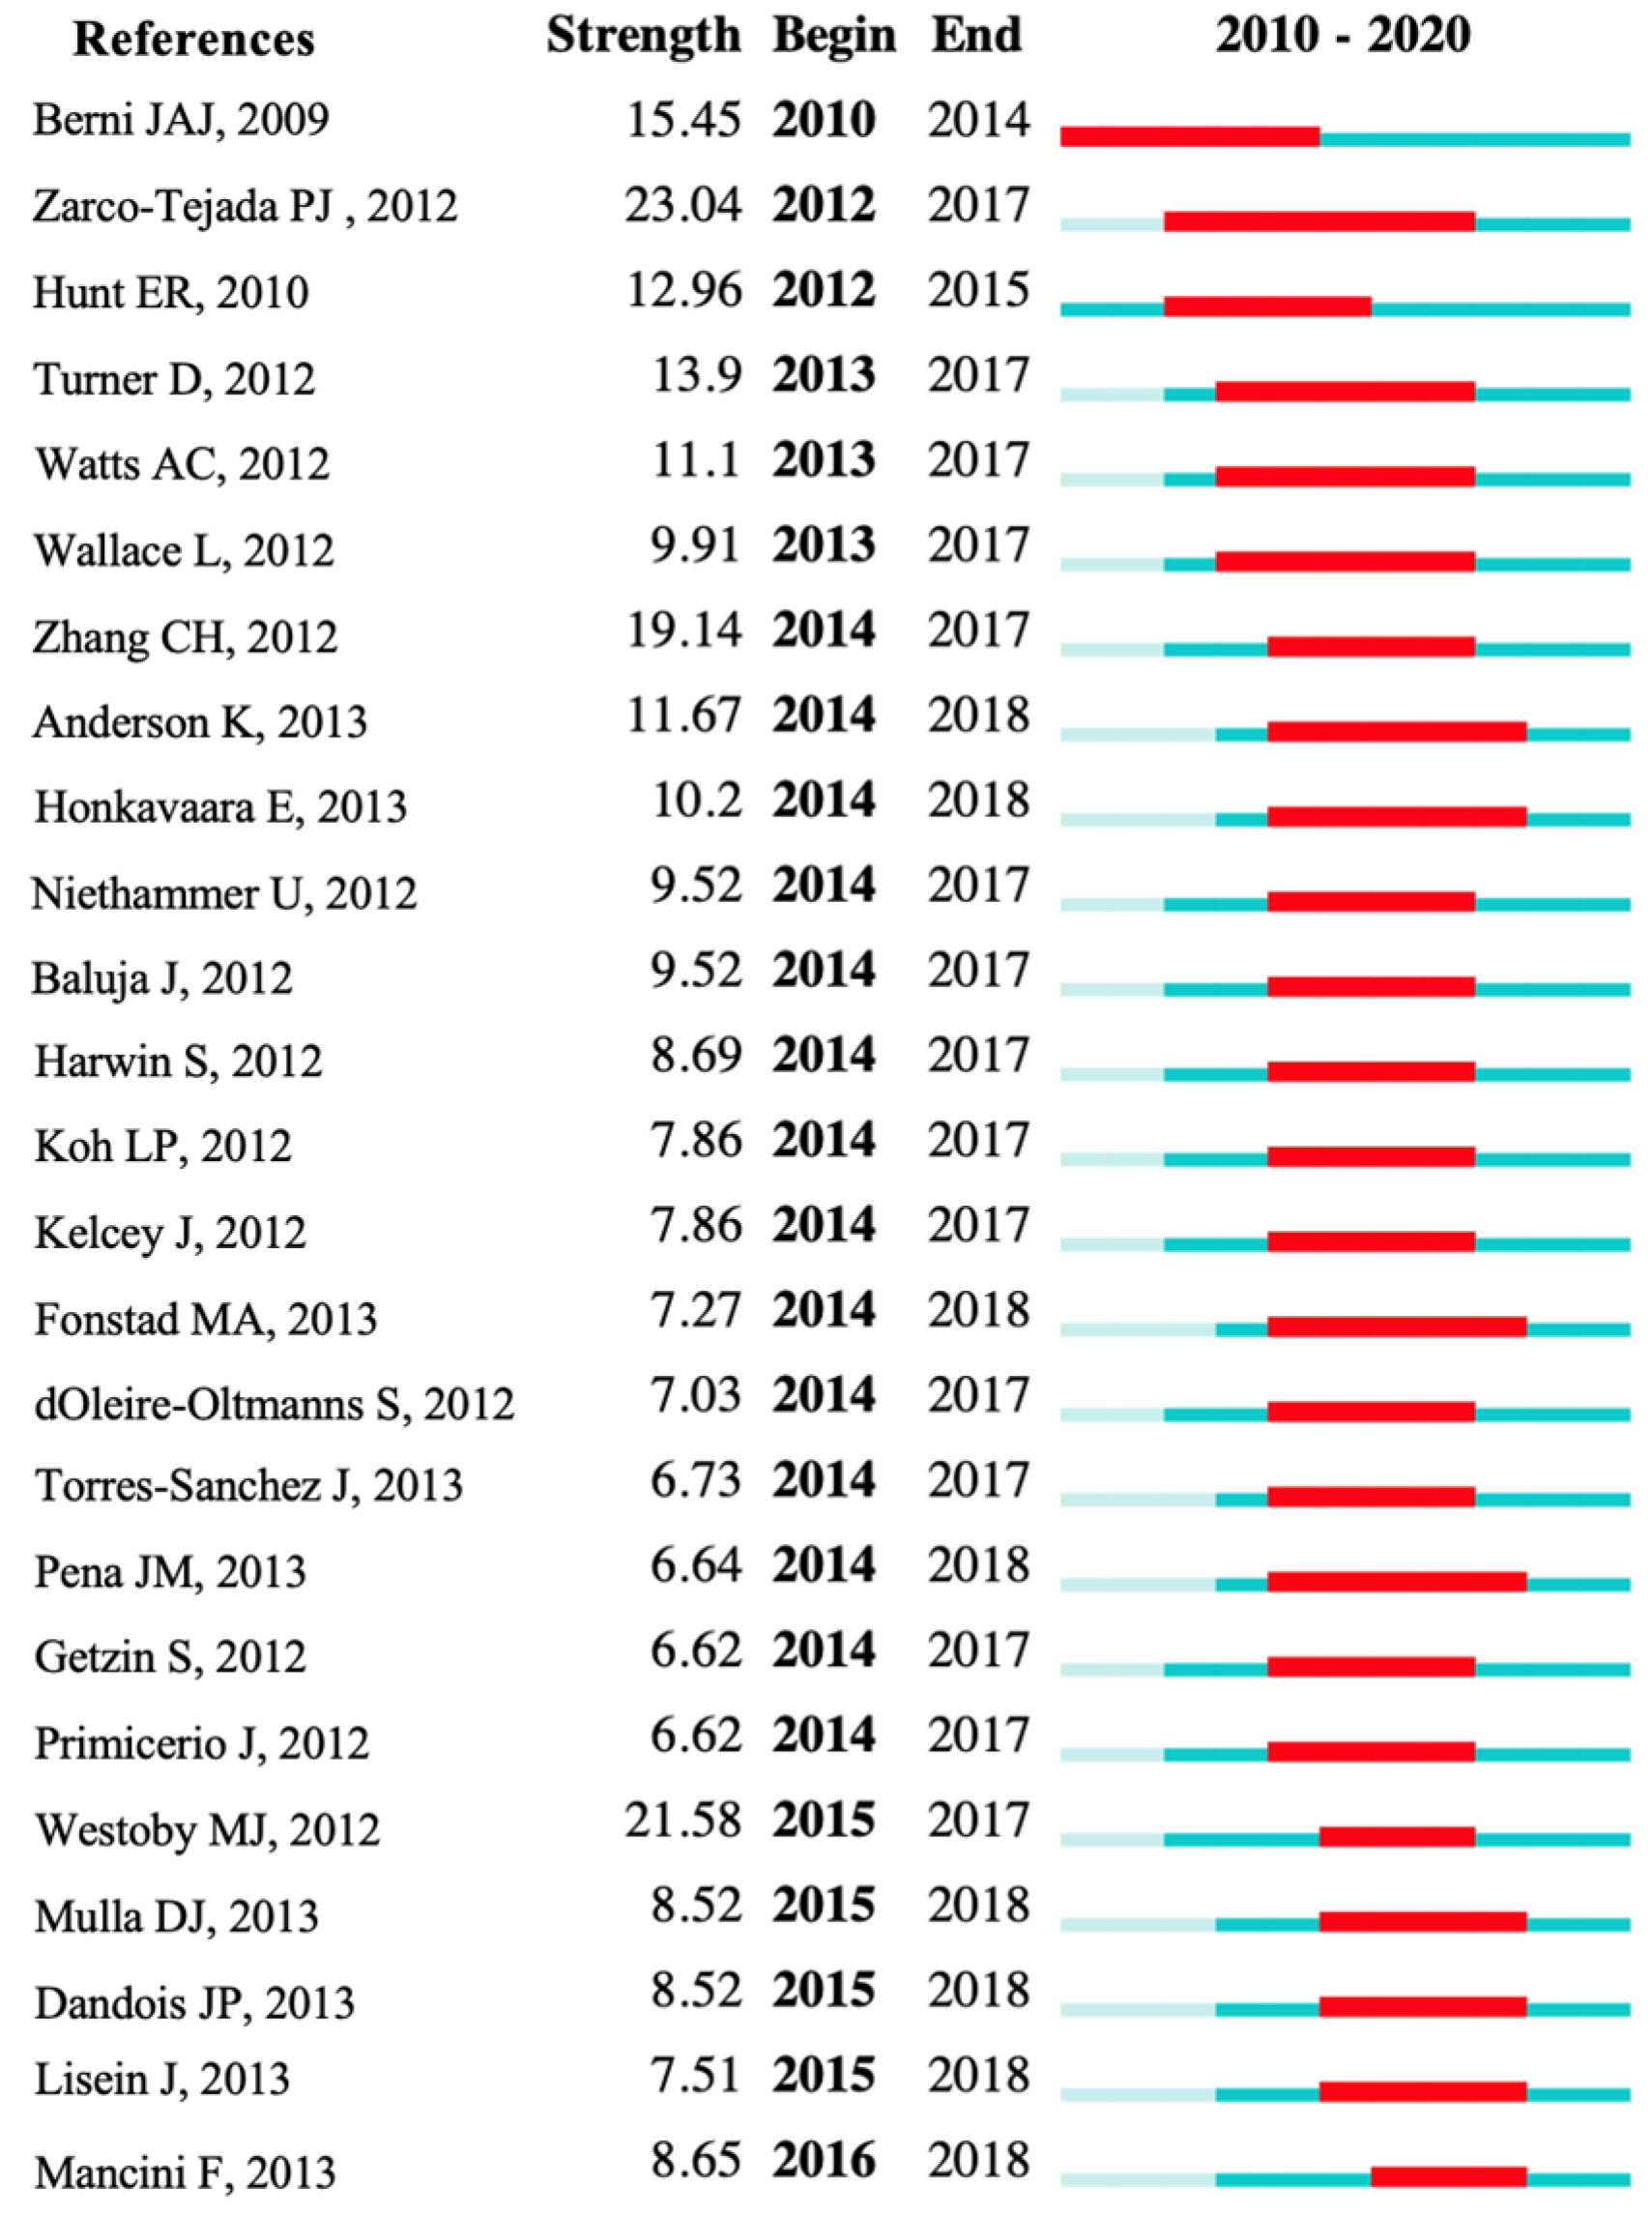
Trend Analysis
4. Discussion
4.1. Current Development of UAV RS Field
4.2. Future Prospects of UAV RS Field
4.3. Limitation of the Study
5. Conclusions
Author Contributions
Funding
Acknowledgments
Conflicts of Interest
References
- Chianucci, F.; Disperati, L.; Guzzi, D.; Bianchini, D.; Nardino, V.; Lastri, C.; Rindinella, A.; Corona, P. Estimation of canopy attributes in beech forests using true colour digital images from a small fixed-wing UAV. Int. J. Appl. Earth Obs. Geoinf. 2016, 47, 60–68. [Google Scholar] [CrossRef] [Green Version]
- Watts, A.C.; Ambrosia, V.G.; Hinkley, E.A. Unmanned Aircraft Systems in Remote Sensing and Scientific Research: Classification and Considerations of Use. Remote Sens. 2012, 4, 1671–1692. [Google Scholar] [CrossRef] [Green Version]
- Floreano, D.; Wood, R.J. Science, technology and the future of small autonomous drones. Nat. Cell Biol. 2015, 521, 460–466. [Google Scholar] [CrossRef] [Green Version]
- Baluja, J.; Diago, M.P.; Balda, P.; Zorer, R.; Meggio, F.; Morales, F.; Tardaguila, J. Assessment of vineyard water status variability by thermal and multispectral imagery using an unmanned aerial vehicle (UAV). Irrig. Sci. 2012, 30, 511–522. [Google Scholar] [CrossRef]
- Feng, Q.; Liu, J.; Gong, J. UAV Remote Sensing for Urban Vegetation Mapping Using Random Forest and Texture Analysis. Remote Sens. 2015, 7, 1074–1094. [Google Scholar] [CrossRef] [Green Version]
- Park, S.; Ryu, D.; Fuentes, S.; Chung, H.; Hernández-Montes, E.; O’Connell, M. Adaptive Estimation of Crop Water Stress in Nectarine and Peach Orchards Using High-Resolution Imagery from an Unmanned Aerial Vehicle (UAV). Remote Sens. 2017, 9, 828. [Google Scholar] [CrossRef] [Green Version]
- He, X.; Yang, X.; Luo, Z.; Guan, T. Application of unmanned aerial vehicle (UAV) thermal infrared remote sensing to identify coal fires in the Huojitu coal mine in Shenmu city, China. Sci. Rep. 2020, 10, 1–13. [Google Scholar] [CrossRef]
- Chen, C. Searching for intellectual turning points: Progressive knowledge domain visualization. Proc. Natl. Acad. Sci. USA 2004, 101, 5303–5310. [Google Scholar] [CrossRef] [Green Version]
- Liu, X. The Evolution of Stakeholders’ Perceptions of Disaster: A Model of Information Flow. J. Am. Soc. Inf. Sci. Technol. 2013, 64, 1852–1863. [Google Scholar] [CrossRef]
- Chen, C.; Dubin, R.; Kim, M.C. Emerging trends and new developments in regenerative medicine: A scientometric update (2000–2014). Expert Opin. Biol. Ther. 2014, 14, 1295–1317. [Google Scholar] [CrossRef] [Green Version]
- Yuzhe, L.; Rongbao, Z.; Jiayuan, X.; Zhijian, Z. Knowledge map analysis of UAV remote sensing research based on citespace. Trop. Geogr. 2019, 39, 309–317. [Google Scholar]
- Hu, K.; Qi, K.L.; Guan, Q.F.; Wu, C.Q.; Yu, J.M.; Qing, Y.X.; Zheng, J.; Wu, H.Y.; Li, X. A Scientometric Visualization Analysis for Night-Time Light Remote Sensing Research from 1991 to 2016. Remote Sens. 2017, 9, 802. [Google Scholar] [CrossRef] [Green Version]
- Chen, C. Science Mapping: A Systematic Review of the Literature. J. Data Inf. Sci. 2017, 2, 1–40. [Google Scholar] [CrossRef] [Green Version]
- Lazega, E.; Wasserman, S.; Faust, K. Social Network Analysis: Methods and Applications. Rev. Française Sociol. 1995, 36, 781. [Google Scholar] [CrossRef]
- Wolfe, A.W. Social Network Analysis: Methods and Applications. Am. Ethnol. 1997, 24, 219–220. [Google Scholar] [CrossRef]
- Chen, C. How to Use CiteSpace. Available online: https://leanpub.com/howtousecitespace (accessed on 23 May 2021).
- Cui, X.; Guo, X.; Wang, Y.; Wang, X.; Zhu, W.; Shi, J.; Lin, C.; Gao, X. Application of remote sensing to water environmental processes under a changing climate. J. Hydrol. 2019, 574, 892–902. [Google Scholar] [CrossRef]
- Li, W.; Zhao, Y. Bibliometric analysis of global environmental assessment research in a 20-year period. Environ. Impact Assess. Rev. 2015, 50, 158–166. [Google Scholar] [CrossRef]
- Coburn, C.A.; Smith, A.M.; Logie, G.S.; Kennedy, P. Radiometric and spectral comparison of inexpensive camera systems used for remote sensing. Int. J. Remote Sens. 2018, 39, 4869–4890. [Google Scholar] [CrossRef]
- Berni, J.A.J.; Zarco-Tejada, P.J.; Suarez, L.; Fereres, E. Thermal and Narrowband Multispectral Remote Sensing for Vegetation Monitoring from an Unmanned Aerial Vehicle. IEEE Trans. Geosci. Remote Sens. 2009, 47, 722–738. [Google Scholar] [CrossRef] [Green Version]
- Adão, T.; Hruška, J.; Pádua, L.; Bessa, J.; Peres, E.; Morais, R.; Sousa, J.J. Hyperspectral imaging: A review on UAV-based sensors, data processing and applications for agriculture and forestry. Remote Sens. 2017, 9, 1110. [Google Scholar] [CrossRef] [Green Version]
- Wang, X.; Sun, H.; Long, Y.; Zheng, L.; Liu, H.; Li, M. Development of Visualization System for Agricultural UAV Crop Growth Information Collection. IFAC PapersOnLine 2018, 51, 631–636. [Google Scholar] [CrossRef]
- Yuan, X.; Shi, J.; Gu, L. A review of deep learning methods for semantic segmentation of remote sensing imagery. Expert Syst. Appl. 2021, 169, 114417. [Google Scholar] [CrossRef]
- Lin, Y.; Hyyppa, J.; Jaakkola, A. Mini-UAV-Borne LIDAR for Fine-Scale Mapping. IEEE Geosci. Remote Sens. Lett. 2011, 8, 426–430. [Google Scholar] [CrossRef]
- Ren, H.; Zhao, Y.; Xiao, W.; Hu, Z. A review of UAV monitoring in mining areas: Current status and future perspectives. Int. J. Coal Sci. Technol. 2019, 6, 320–333. [Google Scholar] [CrossRef] [Green Version]
- Moudrý, V.; Gdulová, K.; Fogl, M.; Klápště, P.; Urban, R.; Komárek, J.; Moudrá, L.; Štroner, M.; Barták, V.; Solský, M. Comparison of leaf-off and leaf-on combined UAV imagery and airborne LiDAR for assessment of a post-mining site terrain and vegetation structure: Prospects for monitoring hazards and restoration success. Appl. Geogr. 2019, 104, 32–41. [Google Scholar] [CrossRef]
- Jaakkola, A.; Hyyppä, J.; Kukko, A.; Yu, X.; Kaartinen, H.; Lehtomäki, M.; Lin, Y. A low-cost multi-sensoral mobile mapping system and its feasibility for tree measurements. ISPRS J. Photogramm. Remote Sens. 2010, 65, 514–522. [Google Scholar] [CrossRef]
- Chu, T.; Starek, M.J.; Brewer, M.J.; Murray, S.C.; Pruter, L.S. Assessing Lodging Severity over an Experimental Maize (Zea mays L.) Field Using UAS Images. Remote Sens. 2017, 9, 923. [Google Scholar] [CrossRef] [Green Version]
- Colomina, I.; Molina, P. Unmanned aerial systems for photogrammetry and remote sensing: A review. ISPRS J. Photogramm. Remote Sens. 2014, 92, 79–97. [Google Scholar] [CrossRef] [Green Version]
- Zahawi, R.A.; Dandois, J.P.; Holl, K.D.; Nadwodny, D.; Reid, J.L.; Ellis, E. Using lightweight unmanned aerial vehicles to monitor tropical forest recovery. Biol. Conserv. 2015, 186, 287–295. [Google Scholar] [CrossRef] [Green Version]
- Fensham, R.J.; Fairfax, R.J. Aerial photography for assessing vegetation change: A review of applications and the relevance of findings for Australian vegetation history. Aust. J. Bot. 2002, 50, 415. [Google Scholar] [CrossRef]
- Duan, S.-B.; Li, Z.-L.; Wu, H.; Tang, B.-H.; Ma, L.; Zhao, E.; Li, C. Inversion of the PROSAIL model to estimate leaf area index of maize, potato, and sunflower fields from unmanned aerial vehicle hyperspectral data. Int. J. Appl. Earth Obs. Geoinf. 2014, 26, 12–20. [Google Scholar] [CrossRef]
- Roth, L.; Aasen, H.; Walter, A.; Liebisch, F. Extracting leaf area index using viewing geometry effects—A new perspective on high-resolution unmanned aerial system photography. ISPRS J. Photogramm. Remote Sens. 2018, 141, 161–175. [Google Scholar] [CrossRef]
- Sanz-Ablanedo, E.; Chandler, J.H.; Rodríguez-Pérez, J.R.; Ordóñez, C. Accuracy of Unmanned Aerial Vehicle (UAV) and SfM Photogrammetry Survey as a Function of the Number and Location of Ground Control Points Used. Remote Sens. 2018, 10, 606. [Google Scholar] [CrossRef] [Green Version]
- Fu, Z.; Jiang, J.; Gao, Y.; Krienke, B.; Wang, M.; Zhong, K.; Cao, Q.; Tian, Y.; Zhu, Y.; Cao, W.; et al. Wheat Growth Monitoring and Yield Estimation based on Multi-Rotor Unmanned Aerial Vehicle. Remote Sens. 2020, 12, 508. [Google Scholar] [CrossRef] [Green Version]
- Canghao, Z.; Zhangping, Y.; Qiaoya, X.; Yangbo, D.; Kunyong, Y.; Jian, L. Study of Effective Height of the Living Bamboo Density Identification based on Unmanned Aerial Vehicle (UAV) Remote Sensing. Remote Sens. Technol. Appl. 2020, 1436–1446. [Google Scholar] [CrossRef]
- Li, Y.; Zhang, Y.; Zhu, Z. Error-Tolerant Deep Learning for Remote Sensing Image Scene Classification. IEEE Trans. Cybern. 2021, 51, 1756–1768. [Google Scholar] [CrossRef]
- Ammour, N.; Alhichri, H.; Bazi, Y.; Ben Jdira, B.; Alajlan, N.; Zuair, M. Deep Learning Approach for Car Detection in UAV Imagery. Remote Sens. 2017, 9, 312. [Google Scholar] [CrossRef] [Green Version]
- Bendig, J.; Yu, K.; Aasen, H.; Bolten, A.; Bennertz, S.; Broscheit, J.; Gnyp, M.L.; Bareth, G. Combining UAV-based plant height from crop surface models, visible, and near infrared vegetation indices for biomass monitoring in barley. Int. J. Appl. Earth Obs. Geoinf. 2015, 39, 79–87. [Google Scholar] [CrossRef]
- Matese, A.; Toscano, P.; Di Gennaro, S.F.; Genesio, L.; Vaccari, F.P.; Primicerio, J.; Belli, C.; Zaldei, A.; Bianconi, R.; Gioli, B. Intercomparison of UAV, Aircraft and Satellite Remote Sensing Platforms for Precision Viticulture. Remote Sens. 2015, 7, 2971–2990. [Google Scholar] [CrossRef] [Green Version]
- Aasen, H.; Burkart, A.; Bolten, A.; Bareth, G. Generating 3D hyperspectral information with lightweight UAV snapshot cameras for vegetation monitoring: From camera calibration to quality assurance. ISPRS J. Photogramm. Remote Sens. 2015, 108, 245–259. [Google Scholar] [CrossRef]
- Wallace, L.; Lucieer, A.; Malenovský, Z.; Turner, D.; Vopěnka, P. Assessment of Forest Structure Using Two UAV Techniques: A Comparison of Airborne Laser Scanning and Structure from Motion (SfM) Point Clouds. Forests 2016, 7, 62. [Google Scholar] [CrossRef] [Green Version]
- Nex, F.; Remondino, F. UAV for 3D mapping applications: A review. Appl. Geomat. 2014, 6, 1–15. [Google Scholar] [CrossRef]
- Zarco-Tejada, P.J.; Gonzalez-Dugo, V.; Jimenez-Berni, J.A. Fluorescence, temperature and narrow-band indices acquired from a UAV platform for water stress detection using a micro-hyperspectral imager and a thermal camera. Remote Sens. Environ. 2012, 117, 322–337. [Google Scholar] [CrossRef]
- Candiago, S.; Remondino, F.; De Giglio, M.; Dubbini, M.; Gattelli, M. Evaluating Multispectral Images and Vegetation Indices for Precision Farming Applications from UAV Images. Remote Sens. 2015, 7, 4026–4047. [Google Scholar] [CrossRef] [Green Version]
- Anderson, K.; Gaston, K.J. Lightweight unmanned aerial vehicles will revolutionize spatial ecology. Front. Ecol. Environ. 2013, 11, 138–146. [Google Scholar] [CrossRef] [Green Version]
- Bendig, J.; Bolten, A.; Bennertz, S.; Broscheit, J.; Eichfuss, S.; Bareth, G. Estimating Biomass of Barley Using Crop Surface Models (CSMs) Derived from UAV-Based RGB Imaging. Remote Sens. 2014, 6, 10395–10412. [Google Scholar] [CrossRef] [Green Version]
- Zhou, X.; Zheng, H.; Xu, X.; He, J.; Ge, X.; Yao, X.; Cheng, T.; Zhu, Y.; Cao, W.; Tian, Y. Predicting grain yield in rice using multi-temporal vegetation indices from UAV-based multispectral and digital imagery. ISPRS J. Photogramm. Remote Sens. 2017, 130, 246–255. [Google Scholar] [CrossRef]
- Pajares, G. Overview and Current Status of Remote Sensing Applications Based on Unmanned Aerial Vehicles (UAVs). Photogramm. Eng. Remote Sens. 2015, 81, 281–330. [Google Scholar] [CrossRef] [Green Version]
- Yu, H.; Wang, J.; Bai, Y.; Yang, W.; Xia, G.-S. Analysis of large-scale UAV images using a multi-scale hierarchical representation. Geo Spat. Inf. Sci. 2018, 21, 33–44. [Google Scholar] [CrossRef] [Green Version]
- Yang, Q.; Shi, L.; Han, J.; Zha, Y.; Zhu, P. Deep convolutional neural networks for rice grain yield estimation at the ripening stage using UAV-based remotely sensed images. Field Crop. Res. 2019, 235, 142–153. [Google Scholar] [CrossRef]
- Xu, C.; Liao, X.; Tan, J.; Ye, H.; Lu, H. Recent Research Progress of Unmanned Aerial Vehicle Regulation Policies and Technologies in Urban Low Altitude. IEEE Access 2020, 8, 74175–74194. [Google Scholar] [CrossRef]
- Cawood, A.J.; Bond, C.; Howell, J.A.; Butler, R.; Totake, Y. LiDAR, UAV or compass-clinometer? Accuracy, coverage and the effects on structural models. J. Struct. Geol. 2017, 98, 67–82. [Google Scholar] [CrossRef]
- Awange, J.; Kiema, J. Unmanned Aircraft Vehicles. Environ. Geoinform. Environ. Sci. Eng. 2019, 265–289. [Google Scholar] [CrossRef]
- Zhang, W.; Wu, J. To Explore the UAV Application in Disaster Prevention and Reduction. Appl. Mech. Mater. 2014, 590, 609–612. [Google Scholar] [CrossRef]
- Du, W.; Chen, F.; Tang, K.; Cheng, L.; Jiao, H. Research on rapid mapping technology in the field of unmanned aerial vehicle (UAV) aerial survey. E3S Web Conf. 2019, 131, 01065. [Google Scholar] [CrossRef]
- Wu, Q.; Xu, J.; Zeng, Y.; Ng, D.W.K.; Al-Dhahir, N.; Schober, R.; Swindlehurst, A.L. A Comprehensive Overview on 5G-and-Beyond Networks with UAVs: From Communications to Sensing and Intelligence. IEEE J. Sel. Areas Commun. 2021, 1. [Google Scholar] [CrossRef]
- Faiçal, B.S.; Freitas, H.; Gomes, P.H.; Mano, L.; Pessin, G.; de Carvalho, A.; Krishnamachari, B.; Ueyama, J. An adaptive approach for UAV-based pesticide spraying in dynamic environments. Comput. Electron. Agric. 2017, 138, 210–223. [Google Scholar] [CrossRef]


| Rank | Institution | Count |
|---|---|---|
| 1 | Chinese Academy of Sciences (CAS) | 94 |
| 2 | Wuhan University (WHU) | 50 |
| 3 | University of Chinese Academy of Sciences (UCAS) | 44 |
| 4 | Consejo Superior de Investigaciones Cientificas (CSIC) | 33 |
| 5 | Beijing Normal University | 27 |
| 6 | United States Department of Agriculture (USDA) Agricultural Research Service (ARS) | 25 |
| 7 | South China Agricultural University | 23 |
| 8 | Zhejiang University | 18 |
| 9 | University of Twente | 18 |
| 10 | University of Florida | 18 |
| Year | Keyword | Count |
|---|---|---|
| 2010 | Vegetation index | 263 |
| Photogrammetry | 183 | |
| System | 163 | |
| 2011 | Imagery | 160 |
| Precision agriculture | 104 | |
| Accuracy | 69 | |
| 2012 | Classification | 205 |
| Lidar | 114 | |
| Reflectance | 100 | |
| 2013 | Bioma | 92 |
| Modal | 113 | |
| Crop | 67 |
| Year | Keyword | Count |
|---|---|---|
| 2014 | Structure from motion | 76 |
| Forest | 69 | |
| Variability | 47 | |
| 2015 | Random forest | 46 |
| Chlorophyll content | 37 | |
| Low cost | 35 | |
| 2016 | Leaf area index | 89 |
| Topography | 28 | |
| Nitrogen | 18 | |
| 2017 | Winter wheat | 33 |
| Resolution | 31 | |
| Canopy | 24 |
| Year | Keyword | Count |
|---|---|---|
| 2018 | Machine learning | 63 |
| Maize | 21 | |
| Multispectral imagery | 8 | |
| 2019 | Impact | 33 |
| Plant height | 12 | |
| Productivity | 8 | |
| 2020 | Deep learning | 40 |
| Neural network | 16 | |
| Damage detection | 16 | |
| 2021 | Feature extraction | 8 |
| Change detection | 5 | |
| Rainfall | 4 |
| Title | Author | Journal | Year | Frequency |
|---|---|---|---|---|
| Unmanned aerial systems for photogrammetry and remote sensing: A review [29] | Colomina I | ISPRS Journal of Photogrammetry and Remote Sensing | 2014 | 155 |
| Combining UAV-based plant height from crop surface models, visible, and near infrared vegetation indices for biomass monitoring in barley [39] | Bendig J | International Journal of Applied Earth Observation and Geoinformation | 2015 | 82 |
| Intercomparison of UAV, Aircraft and Satellite Remote Sensing Platforms for Precision Viticulture [40] | Matese A | Remote Sensing | 2015 | 78 |
| Generating 3D hyperspectral information with lightweight UAV snapshot cameras for vegetation monitoring: From camera calibration to quality assurance [41] | Aasen H | ISPRS Journal of Photogrammetry and Remote Sensing | 2015 | 68 |
| Assessment of Forest Structure Using Two UAV Techniques: A Comparison of Airborne Laser Scanning and Structure from Motion (SfM) Point Clouds [42] | Wallace L | Forests | 2016 | 66 |
| UAV for 3D mapping applications: a review [43] | Nex F | Applied Geomatics | 2014 | 59 |
| Fluorescence, temperature and narrow-band indices acquired from a UAV platform for water stress detection using a micro-hyperspectral imager and a thermal camera [44] | Zarco-Tejada PJ | Remote Sensing of Environment | 2012 | 59 |
| Evaluating Multispectral Images and Vegetation Indices for Precision Farming Applications from UAV Images [45] | Candiago S | Remote Sensing | 2015 | 57 |
| Lightweight unmanned aerial vehicles will revolutionize spatial ecology [46] | Anderson K | Frontiers in Ecology and the Evironment | 2013 | 56 |
| Estimating Biomass of Barley Using Crop Surface Models (CSMs) Derived from UAV-Based RGB Imaging [47] | Bendig J | Remote Sensing | 2014 | 55 |
Publisher’s Note: MDPI stays neutral with regard to jurisdictional claims in published maps and institutional affiliations. |
© 2021 by the authors. Licensee MDPI, Basel, Switzerland. This article is an open access article distributed under the terms and conditions of the Creative Commons Attribution (CC BY) license (https://creativecommons.org/licenses/by/4.0/).
Share and Cite
Wang, J.; Wang, S.; Zou, D.; Chen, H.; Zhong, R.; Li, H.; Zhou, W.; Yan, K. Social Network and Bibliometric Analysis of Unmanned Aerial Vehicle Remote Sensing Applications from 2010 to 2021. Remote Sens. 2021, 13, 2912. https://0-doi-org.brum.beds.ac.uk/10.3390/rs13152912
Wang J, Wang S, Zou D, Chen H, Zhong R, Li H, Zhou W, Yan K. Social Network and Bibliometric Analysis of Unmanned Aerial Vehicle Remote Sensing Applications from 2010 to 2021. Remote Sensing. 2021; 13(15):2912. https://0-doi-org.brum.beds.ac.uk/10.3390/rs13152912
Chicago/Turabian StyleWang, Jingrui, Shuqing Wang, Dongxiao Zou, Huimin Chen, Run Zhong, Hanliang Li, Wei Zhou, and Kai Yan. 2021. "Social Network and Bibliometric Analysis of Unmanned Aerial Vehicle Remote Sensing Applications from 2010 to 2021" Remote Sensing 13, no. 15: 2912. https://0-doi-org.brum.beds.ac.uk/10.3390/rs13152912