
Optimization of Rocky Desertification Classification Model Based on Vegetation Type and Seasonal Characteristic


1
School of Forestry, Nanjing Forestry University, Nanjing 210037, China
2
School of Smart Agricultural, Suzhou Polytechnic Institute of Agriculture, Suzhou 215008, China
3
School of Computer Science and Technology, Soochow University, Suzhou 215301, China
*
Author to whom correspondence should be addressed.
Remote Sens. 2021, 13(15), 2935; https://0-doi-org.brum.beds.ac.uk/10.3390/rs13152935
Submission received: 2 June 2021
/
Revised: 15 July 2021
/
Accepted: 21 July 2021
/
Published: 26 July 2021
(This article belongs to the Special Issue Advances of Remote Sensing in the Analysis of the Spatial and Temporal Variability of Land Surface)
Abstract
:Building a high-precision, stable, and universal automatic extraction model of the rocky desertification information is the premise for exploring the spatiotemporal evolution of rocky desertification. Taking Guizhou province as the research area and based on MODIS and continuous forest inventory data in China, we used a machine learning algorithm to build a rocky desertification model with bedrock exposure rate, temperature difference, humidity, and other characteristic factors and considered improving the model accuracy from the spatial and temporal dimensions. The results showed the following: (1) The supervised classification method was used to build a rocky desertification model, and the logical model, RF model, and SVM model were constructed separately. The accuracies of the models were 73.8%, 78.2%, and 80.6%, respectively, and the kappa coefficients were 0.61, 0.672, and 0.707, respectively. SVM performed the best. (2) Vegetation types and vegetation seasonal phases are closely related to rocky desertification. After combining them, the model accuracy and kappa coefficient improved to 91.1% and 0.861. (3) The spatial distribution characteristics of rocky desertification in Guizhou are obvious, showing a pattern of being heavy in the west, light in the east, heavy in the south, and light in the north. Rocky desertification has continuously increased from 2001 to 2019. In conclusion, combining the vertical spatial structure of vegetation and the differences in seasonal phase is an effective method to improve the modeling accuracy of rocky desertification, and the SVM model has the highest rocky desertification classification accuracy. The research results provide data support for exploring the spatiotemporal evolution pattern of rocky desertification in Guizhou.
1. Introduction
Karst rocky desertification is a major global ecological and environmental problem, threatening the sustainable development of human society [1]. It is a process of land degradation under the background of fragile karst geology and a humid or semihumid climate in tropical and subtropical regions [2,3] and is a special type of land desertification. Under the joint actions of the natural environment and human activities [4,5,6,7,8], soil and water losses occur, land productivity decreases, and soil erosion is severe, resulting in large exposed areas of basement rock, showing landscape characteristics similar to desertification [5,6,7].
The karst area in Southwest China is located in the center of the karst area in Eastern Asia, which is one of the most widely distributed and developed karst landforms in the world [8,9,10,11]. Karst rocky desertification is the primary ecological and environmental problem in the karst mountainous area of Southwest China, which restricts the sustainable development of the social economy. It is one of the main causes of poverty in Southwest China and seriously threatens the living environment of local residents [4,12]. Guizhou is located in the southwest continuous karst concentration area and is becoming a main karst research area in China. The monitoring and control of rocky desertification and the determination of its impact on the ecological environment in Guizhou are the hot topics in current research [13,14].
The development of remote sensing technology has enabled the large-scale monitoring of vegetation cover and rocky desertification, which has led to advances in ecological environment monitoring in karst areas [3,15,16,17,18]. Improvements in the precision of automatic mapping with remote sensing technology are important for finding the feature factors that can effectively express karst rocky desertification. Albedo is an effective rock apparent factor. Wei et al. [19] used Landsat 8 to construct a feature space model of albedo and NDVI, MSAVI, and TGSI and compared their extraction accuracies. The results showed that the overall classification accuracy of the three models was more than 80%, which indicated that the three feature space models are feasible for extracting desertification information from the Mongolian Plateau. The normalized difference rock index (NDRI) is also a suitable factor for expressing karst rocky desertification. For example, the NDRI was used to improve the bedrock exposure index of a system to determine the types and spatial distribution of karst rocky desertification [20]. Mokhtar et al. [21] found a close relationship between evapotranspiration index and NDVI and the evapotranspiration index can reflect the growth of vegetation. Deng et al. [22] retrieved the land surface temperature (LST) of a karst mountain area using Landsat 8 and discussed the relationship between LST and the LUCC and NDVI of different land use types. The results showed that there were significant differences in the LST of different land use types, with the highest being recorded for construction land and the lowest being recorded for forests. The spatial distribution of NDVI and LST showed an opposite pattern. Zhang et al. [23] found that KRD were primarily associated with the land use, gravel content, and slope gradient in a typical karst plateau (Houzhai River Basin). Li et al. [24] found that there is a positive correlation coefficient between the KRD index and slope in the karst area, especially where the slope degree is greater than 18°, the trend toward strong rocky desertification is apparent. In this study, after referring to the relevant literature, we conducted a correlation analysis between the rocky desertification grade and the factor set of the samples to find the most effective characteristic factors to express karst rocky desertification.
Supervised classification is one of the effective methods used to extract rocky desertification from remote sensing images. Mixed pixel decomposition is one of the key technologies of supervised classification. The binary classification pixel is a common method used to solve mixed pixel decomposition, which is stable and scientific. Su et al. [25] studied the relationship between the NDVI value and vegetation coverage in Guangxi using a binary pixel model with a TM image and extracted and classified rocky desertification information based on decision tree theory. The overall classification was more than 85%. You et al. [26] proposed a local adaptive multiendmember spectral hybrid analysis algorithm to extract subpixel rocky desertification information from medium-resolution images. The results showed that it is accurate and reliable in estimating rocky desertification information. Zhao et al. [27] established the calculation model of vegetation coverage in Guangxi with MODIS EVI data using a pixel dichotomy model and analyzed the spatiotemporal dynamics process and characteristics of rocky desertification from 2004 to 2014. Zhang et al. [28] used Landsat-8 Operational Land Imager (OLI) images to construct a novel karst rocky desertification index (KRDI) as an indicator of rocky desertification based on greenness, humidity, and brightness. They found that combining spectral information with spatiotemporal information is a promising method for extracting information on karst rocky desertification. Qi et al. [29] used ALOS images, the dichotomous pixel model (DPM), and spectral hybrid analysis (SMA) methods to improve the accuracy of rocky desertification estimation in Southwest China up to 80.5%.
In summary, several problems remain in terms of the data sources and special environment of natural geography: (1) The above methods are more limited to small and medium-sized areas such as rocky desertification pilot areas and county areas, and there are few studies on large-scale macro provinces. (2) Due to the difficulty of sample collection, there are not enough samples for modeling or model validation. In most studies, samples have usually been collected and validation was performed by visual interpretation. (3) Most scholars used the analytic hierarchy process (AHP) and the underground detector method for weight analysis and accumulation to enable quantitative remote sensing monitoring of rocky desertification by extracting the vegetation coverage, bedrock bare rate, elevation, land use, and other related data. The model constructions have been simple and the robustness or accuracy of the models has been insufficient.
In this study, we presented an improved method to give accurate mapping of the rocky desertification in Guzhou province, China by considering the vegetation type and seasonal characteristic of the vegetation index. Multiresource data, including surface reflectance, land surface temperature (LST), normalized vegetation index and enhanced vegetation index (NDVI/EVI), transpiration land cover types, and so on, were used as the driven variables, while China’s National Forest continuous inventory data were used as the ground truth to predict rocky desertification. Three data-driven models, including the logistic regression model, random forest (RF) model, and support vector machine (SVM) model, were developed and tested. Furthermore, the temporal and spatial patterns of rocky desertification in Guizhou province were analyzed, which provided a scientific reference for the making of ecological management planning of the study area [30,31].
2. Data and Material
2.1. Research Area
China’s karst landform is one of the largest karst regions in the world [11,32,33,34]. Guizhou is one of the provinces with the most developed karst landforms in China, where karst carbonate rocks are widely distributed and cover a large area [35]. Guizhou (24°37′–29°13′ N, 103°36′–109° E) is adjacent to Sichuan and Chongqing in the north, Hunan in the east, Guangxi in the south, and Yunnan in the west, with a length of 595 km from east to west and 509 km from north to south, with a total area of 176,200 km2 [36]. The terrain is the highest in the west, low in the east, and slightly lower in the middle, inclining to the north, east, and south. The highest altitude is 2900 m, the lowest is 137 m, and the average is about 1100 m. It is located in the Yangtze River and Pearl River basins. The climate is mild and humid, belonging to the subtropical humid monsoon category. Guizhou has high terrain, large internal differentiation, and deep river cutting. There are four basic types of landforms in Guizhou: plateaus, mountains, hills, and basins. The largest landform is mountains, followed by hills, together accounting for 92.5% [37]. There are mainly red, yellow, yellow-brown, and lime soil in Guizhou. The annual average temperature in Guizhou is between −1 and 25 °C, with the coldest being between −1 and 6 °C in January and with the hottest being between 22 and 25 °C in July. The annual sunshine hours ranges between 900 and 2600 h, and the sunshine rate is only 30%. The sunshine duration and radiation intensity are relatively low in China. The annual precipitation in Guizhou is between 500 and 2500 mm, where Xingyi has the most precipitation and Bijie has the least. There are more than 150 cloudy days and 270 frost-free days; the annual relative humidity is more than 70% in Guizhou [35,38]. The province is rich in vegetation types, including the subtropical evergreen broad-leaved forest, near-tropical valley monsoon rain forest, tropical evergreen broad-leaved forest, cold temperate subalpine coniferous forest, and warm coniferous forest [38]. The total thickness of carbonate is about 17,000 m, of which the pure carbonate is about 62%, accounting for more than 70% of the total thickness of sedimentary rocks in Guizhou [39].
2.2. Data
2.2.1. Image Data
Considering the terrain and climate characteristics of Guizhou, remote sensing images with high time resolution were selected as the data source to avoid the influence of cloud and fog and to supply the missing parts. High-time-resolution images are helpful for effectively extracting the information regarding rocky desertification [40,41]. The moderate resolution imaging spectroradiometer (MODIS) is one of the main sensors on Terra and Aqua satellites. It is an important instrument for observing global biological and physical processes in the Earth observation system (EOS) program of the United States [12,42]. NASA HTTPS://www.nasa.gov/ (accessed on 18 January 2021) provides a variety of land product data, which can be effectively used for rocky desertification mapping and dynamic change monitoring [43]. The MODIS data used in this study were as follows: MOD09A1: surface reflectance; MOD11A1: surface temperature and radiation rate (LST); MOD13Q1: normalized vegetation index and enhanced vegetation index (NDVI/EVI); MOD16A2: transpiration product data; MOD43A3: surface albedo (AD); and MCD12Q1: IGBP global land cover data. In this study, all the driven factors of rocky desertification classification were resampled into 250 m. The above product data were integrated in the Google Earth engine (GEE) platform [44,45]. GEE can quickly and effectively analyze geospatial data and provides interactive computing at the global scale, greatly improving the efficiency of data image processing. In this study, the MODIS datasets (46 images per year, 8-day composite product) in 2001, 2005, 2010, 2015, and 2019 were employed to calculate the desertification factors, such as surface reflectance, albedo, vegetation indices, evapotranspiration, and land cover type. In addition, the digital elevation model (DEM) was extracted from the geospatial cloud http://www.gscloud.cn/ (accessed on 18 January 2021) and resampled to the same spatial resolution as the MODIS product data. The administrative division map was obtained from the data center of Resources and Environment Science, Chinese Academy of Sciences HTTPS://www.resdc.cn/ (accessed on 10 January 2021)
2.2.2. Ground Survey Data
The China’s National Forest Continuous Inventory data (NFCI) were from the Chinese Ministry of Forestry. The NFCI database in China is constructed based on 5-year inventory periods, resulting in some of the data not being timely when reports are issued [46,47,48]. The NFCI of Guizhou surveyed in 2010 were used in this study. The sample size was 0.067 hm2 (25.8 m × 25.8 m) and the sample spacing was 4 km × 8 km, for a total of 5500 sample points. The sample survey included information fields such as vegetation coverage, dominant tree species, stock volume, and rocky desertification level.
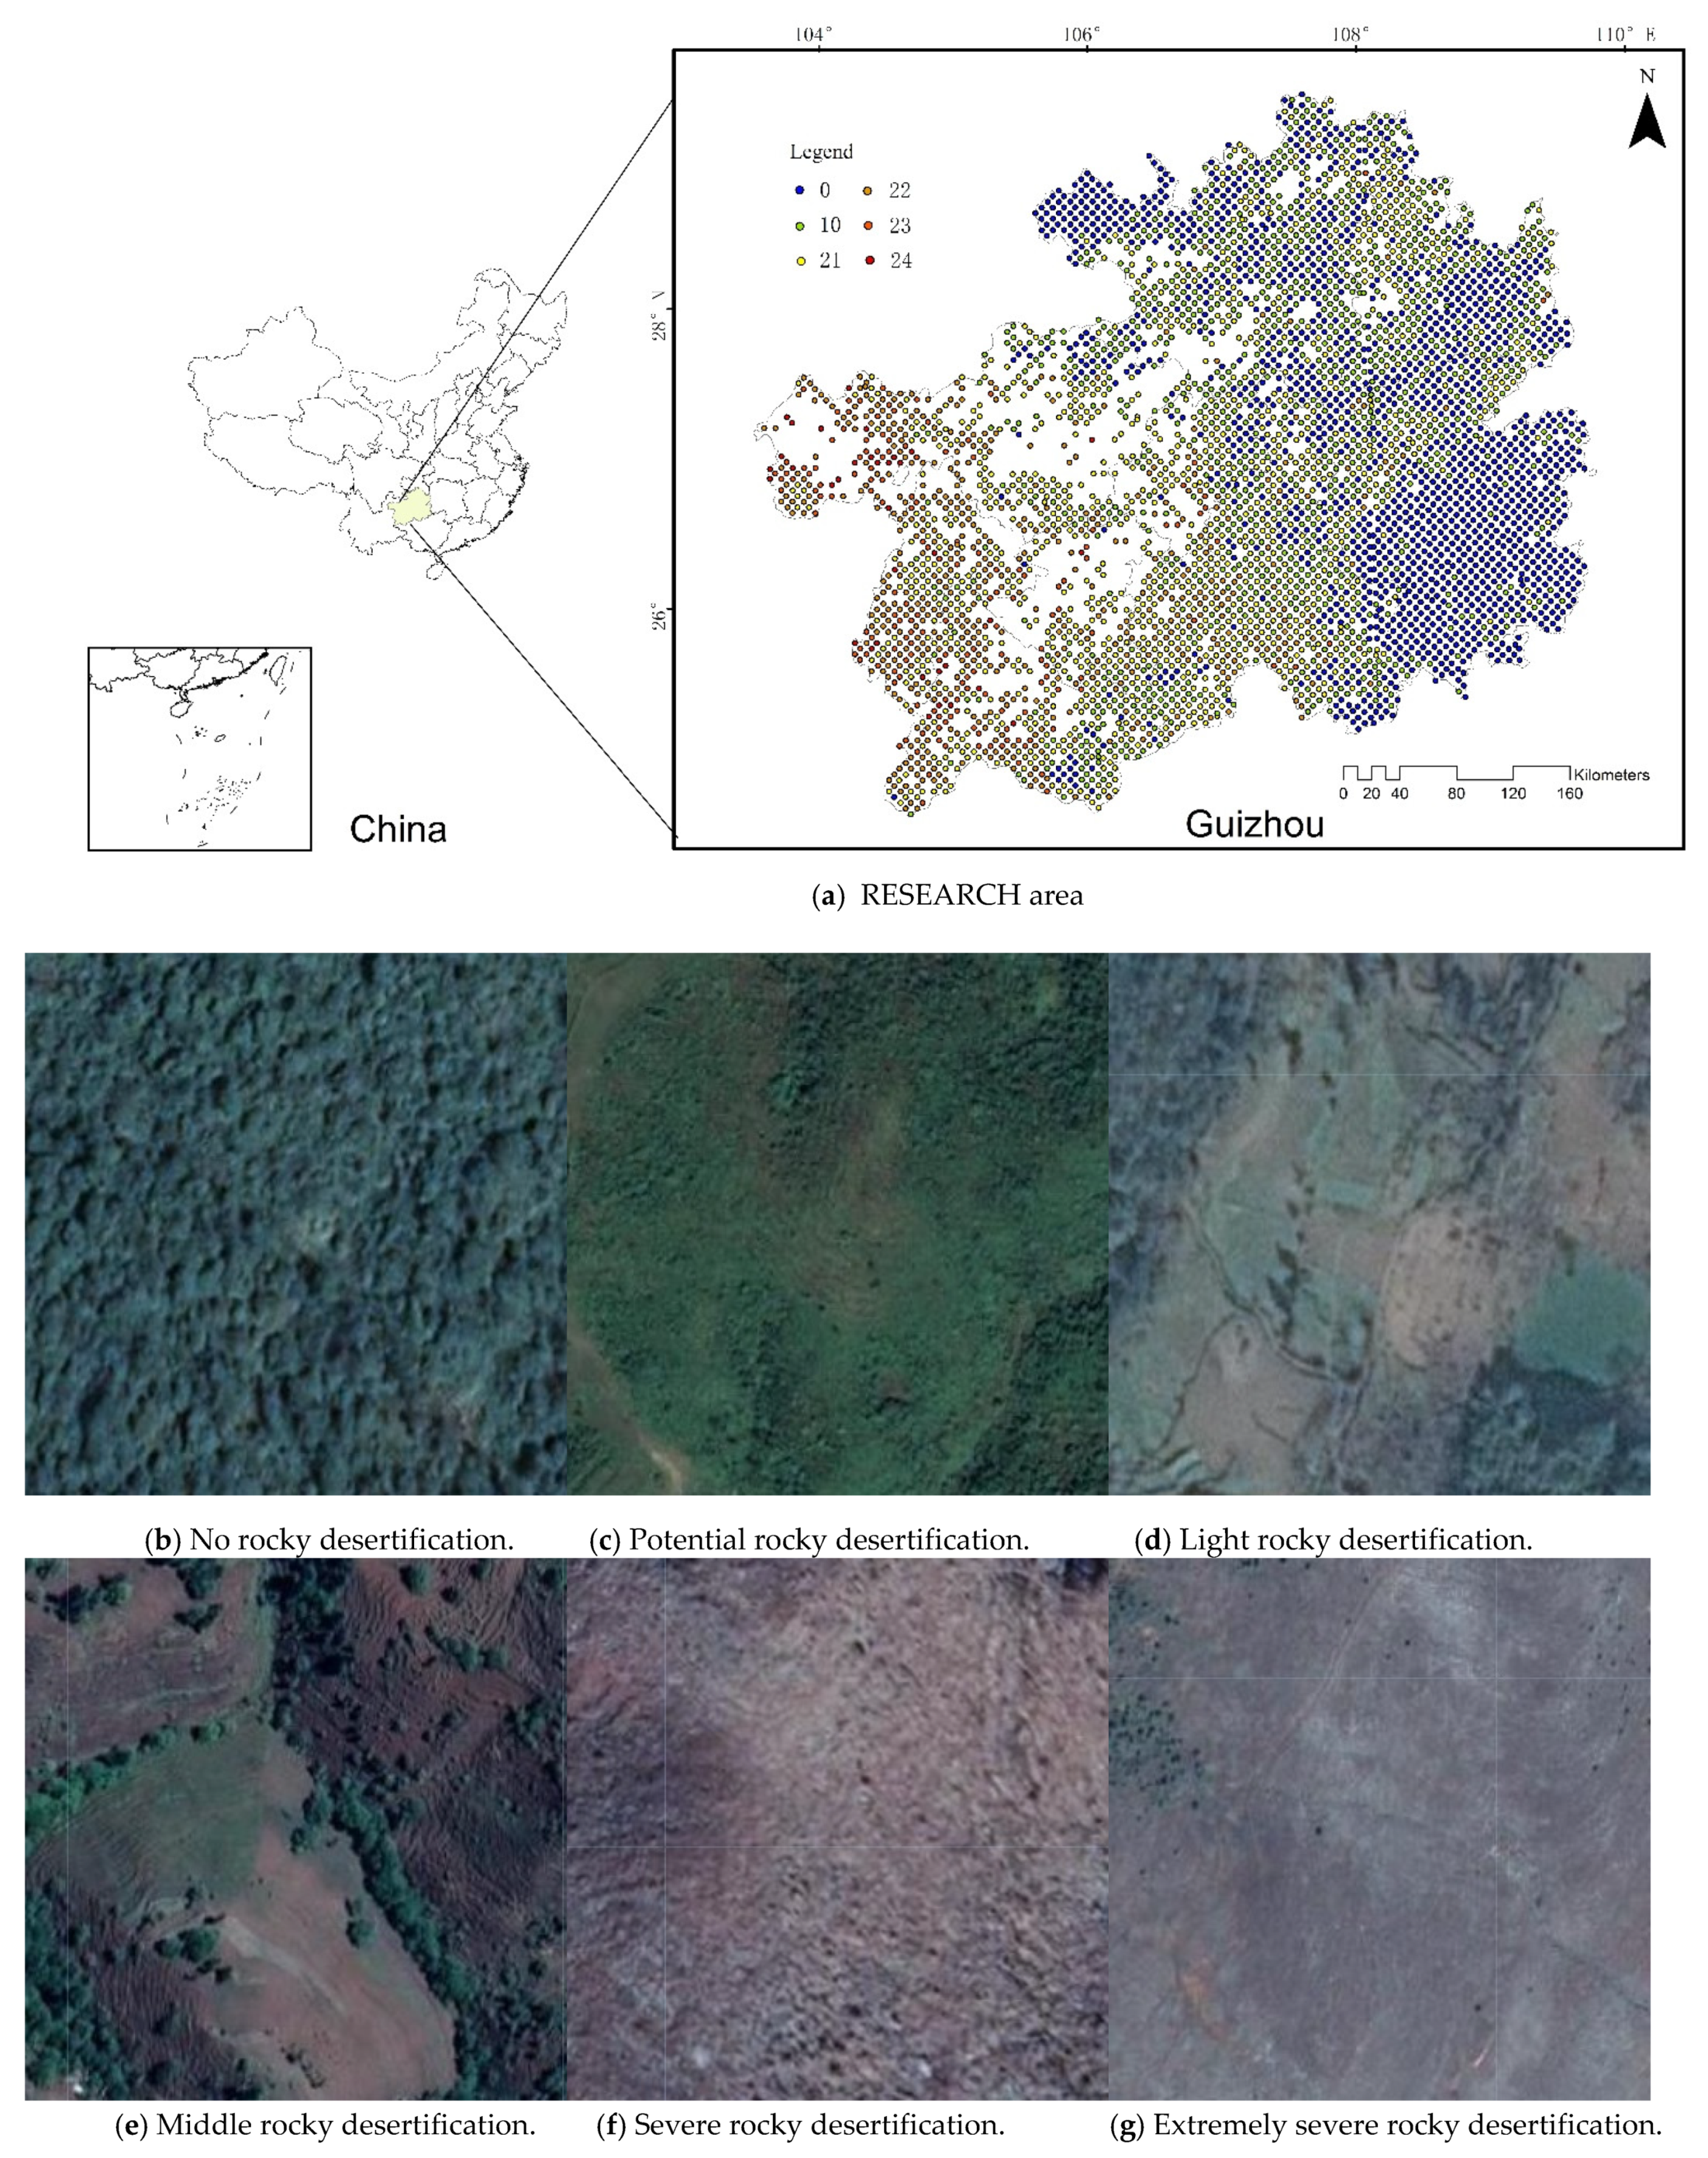
According to the NFCI provision, rocky desertification is defined as the disturbance of karst by human activities and economic development in humid and subhumid areas of tropical and subtropical regions. In the natural background, rocky desertification prevents surface planting. Eventually, it causes severe soil erosion, large areas of exposed bedrock, and gravel accumulation. The phenomena of land degradation and soil disappearance of the desertified landscape is manifested on the surface. The grade of rocky desertification is divided into six categories according to the assessment standard of rocky desertification degree conducted by the State Forestry Administration [49], coded as 00, 10, 21, 22, 23, or 24, representing no, potential, light, middle, severe, and extremely severe rocky desertification, respectively, in the first class inventory data of national forest resources [50]. Wetlands, farmland, buildings, snow, and water areas are considered non-rocky desertification, which are denoted by 11, 12, 13, 15, and 17, respectively. There were 234 samples in total according to the IGBP global land cover classification system based on MOD12Q1 data (a total of 17 categories). They were labeled as rocky-desertification-free to reduce the misdiagnosis of rocky desertification. The remaining 5266 sample points were used for rocky desertification monitoring model research, as shown in Figure 1.
3. Technical Approach
3.1. Workflow of the Processing Steps
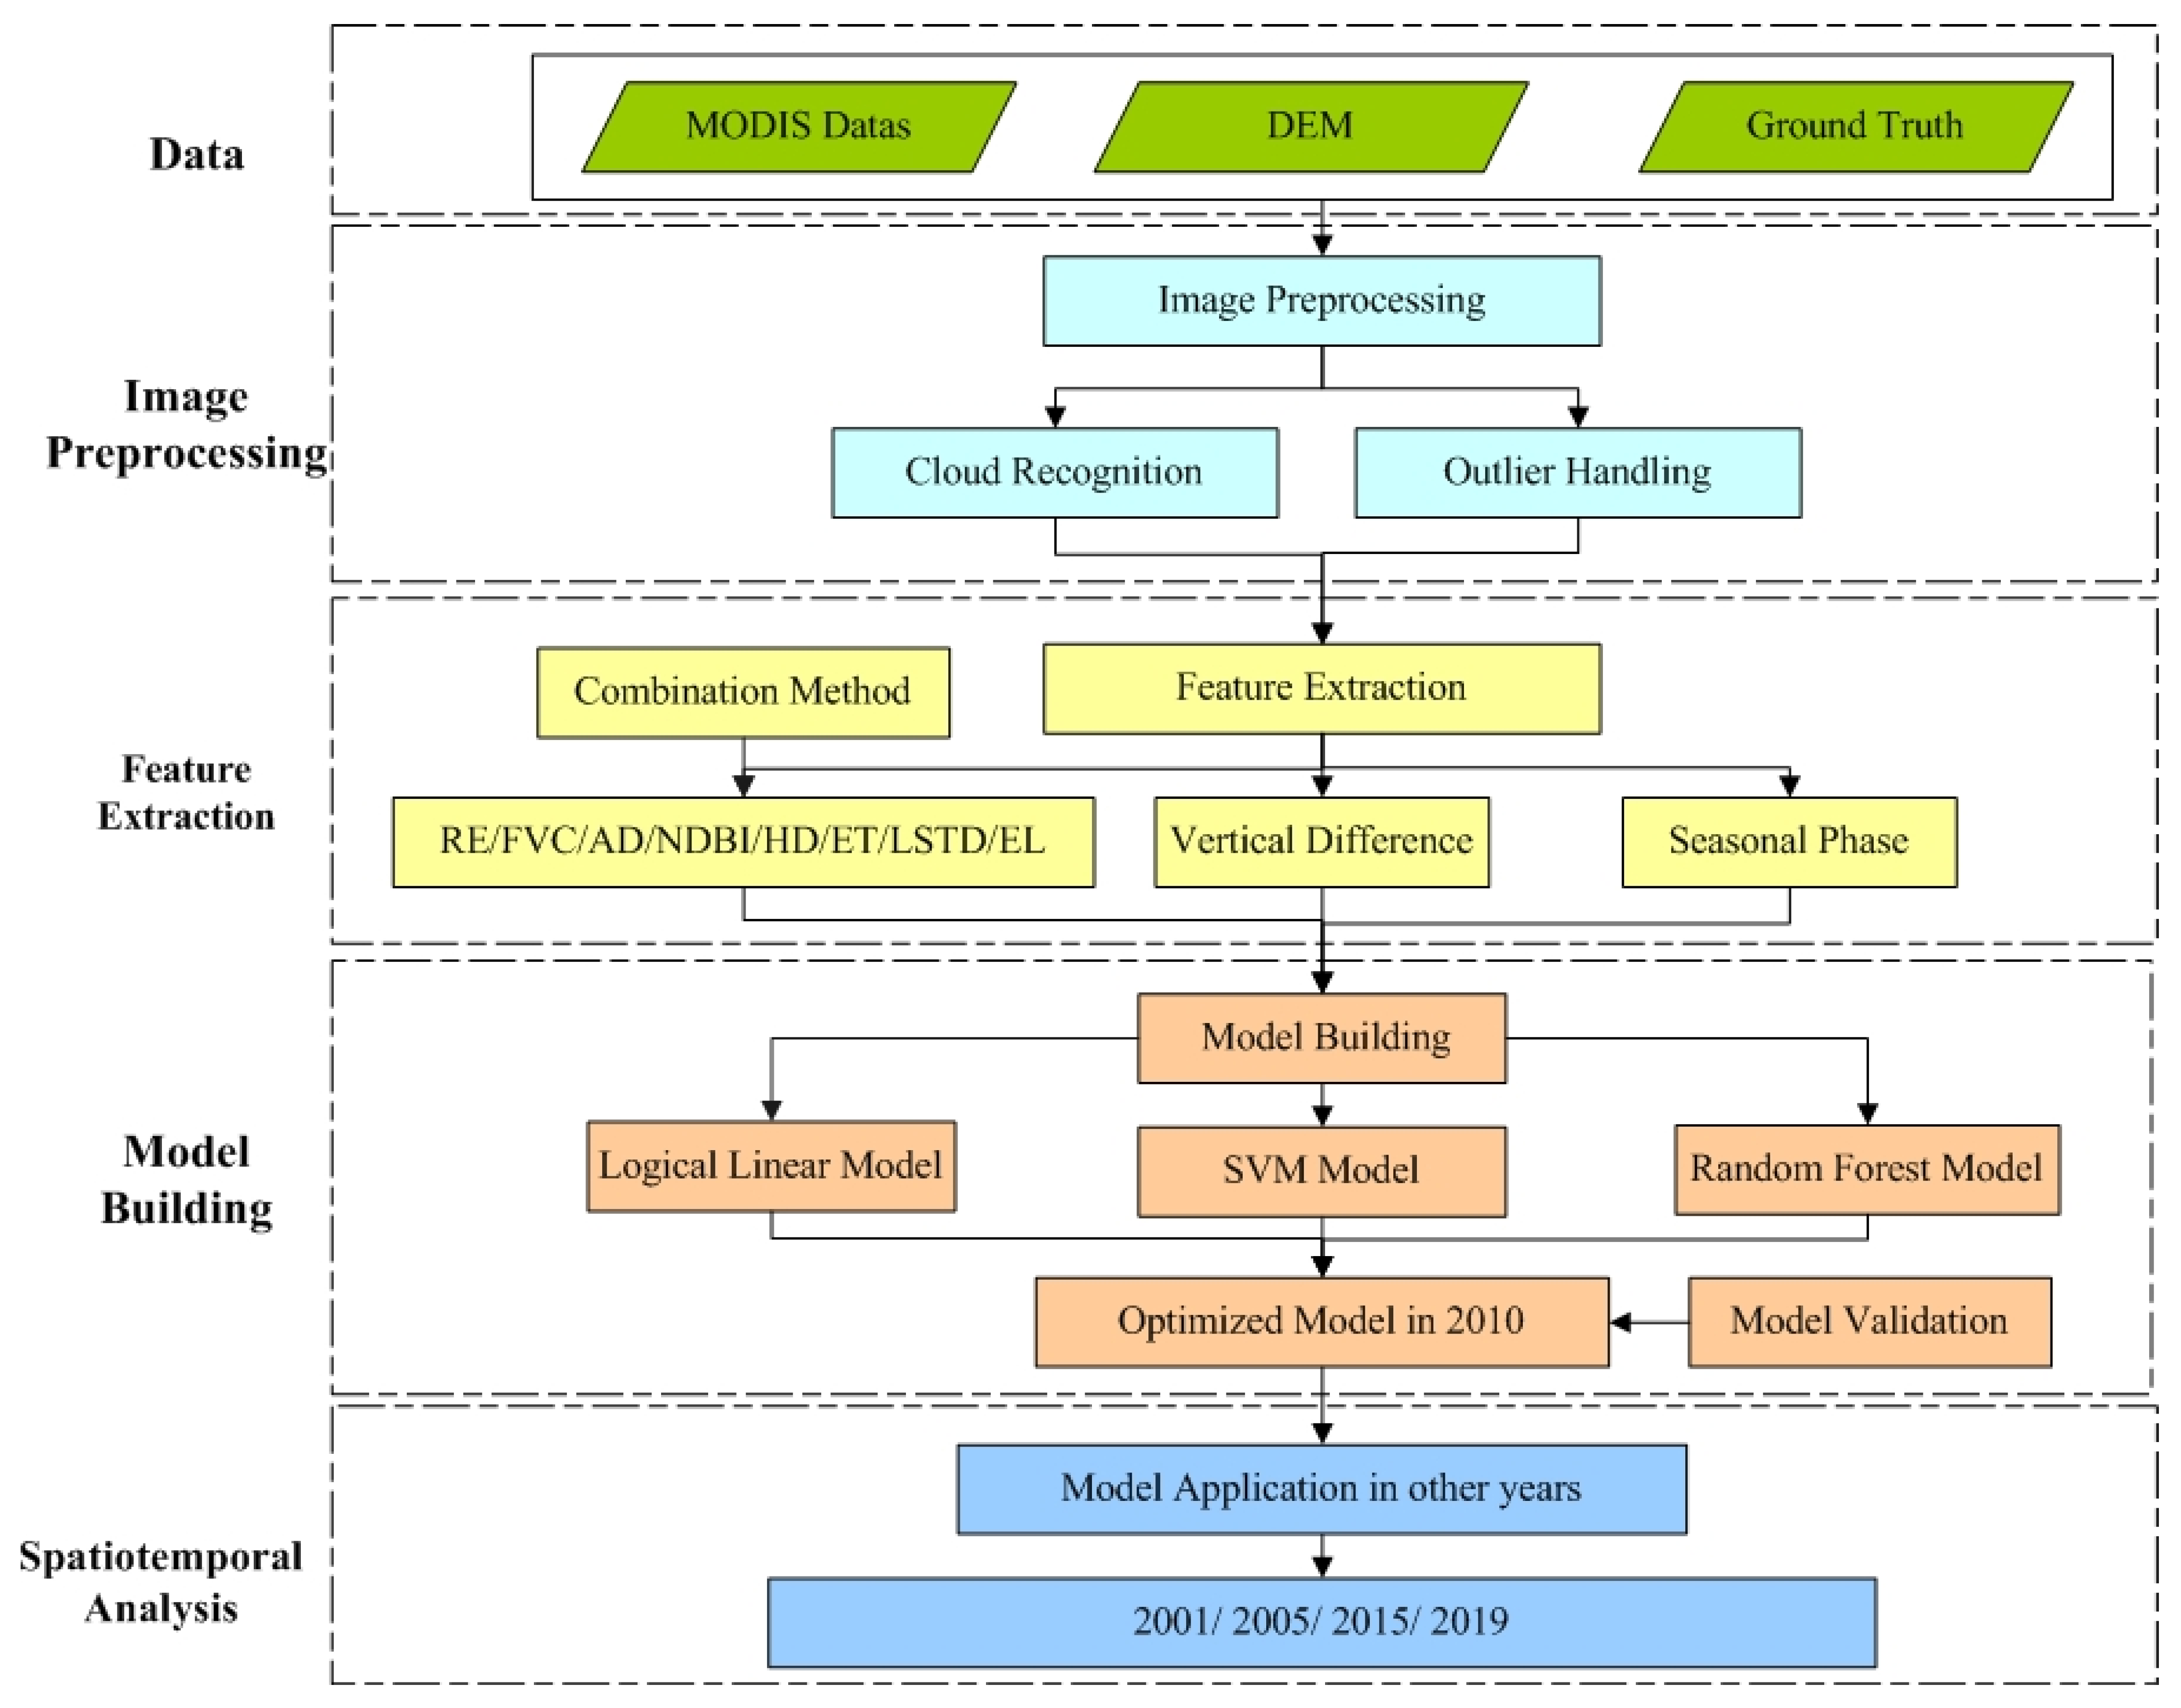
The MODIS imagery data and the NFCI data of Guizhou were used to build the rocky desertification classification model in this study. The data(NFCI) are surveyed every five years, which are 2000, 2005, 2010, and 2015 respectively. Therefore, the MODIS impact selected by us was consistent with the time of the ground survey. The workflow of the processing steps is shown as Figure 2. The main research steps were as follows: (1) image preprocessing including stateQA cloud recognition [7], cloud synthesis, and outlier removal; (2) in addition to VFC, RE, and other common factors, we also attempted to extract temperature difference, humidity, and evapotranspiration factors and to integrate vegetation height type and seasonal phase; (3) the most accurate classification model of rocky desertification was selected by comparing the accuracies of the linear and nonlinear models; and (4) according to the spatial and temporal distribution of rocky desertification in each period, the long-term changes in rocky desertification were analyzed.
3.2. Image Preprocessing
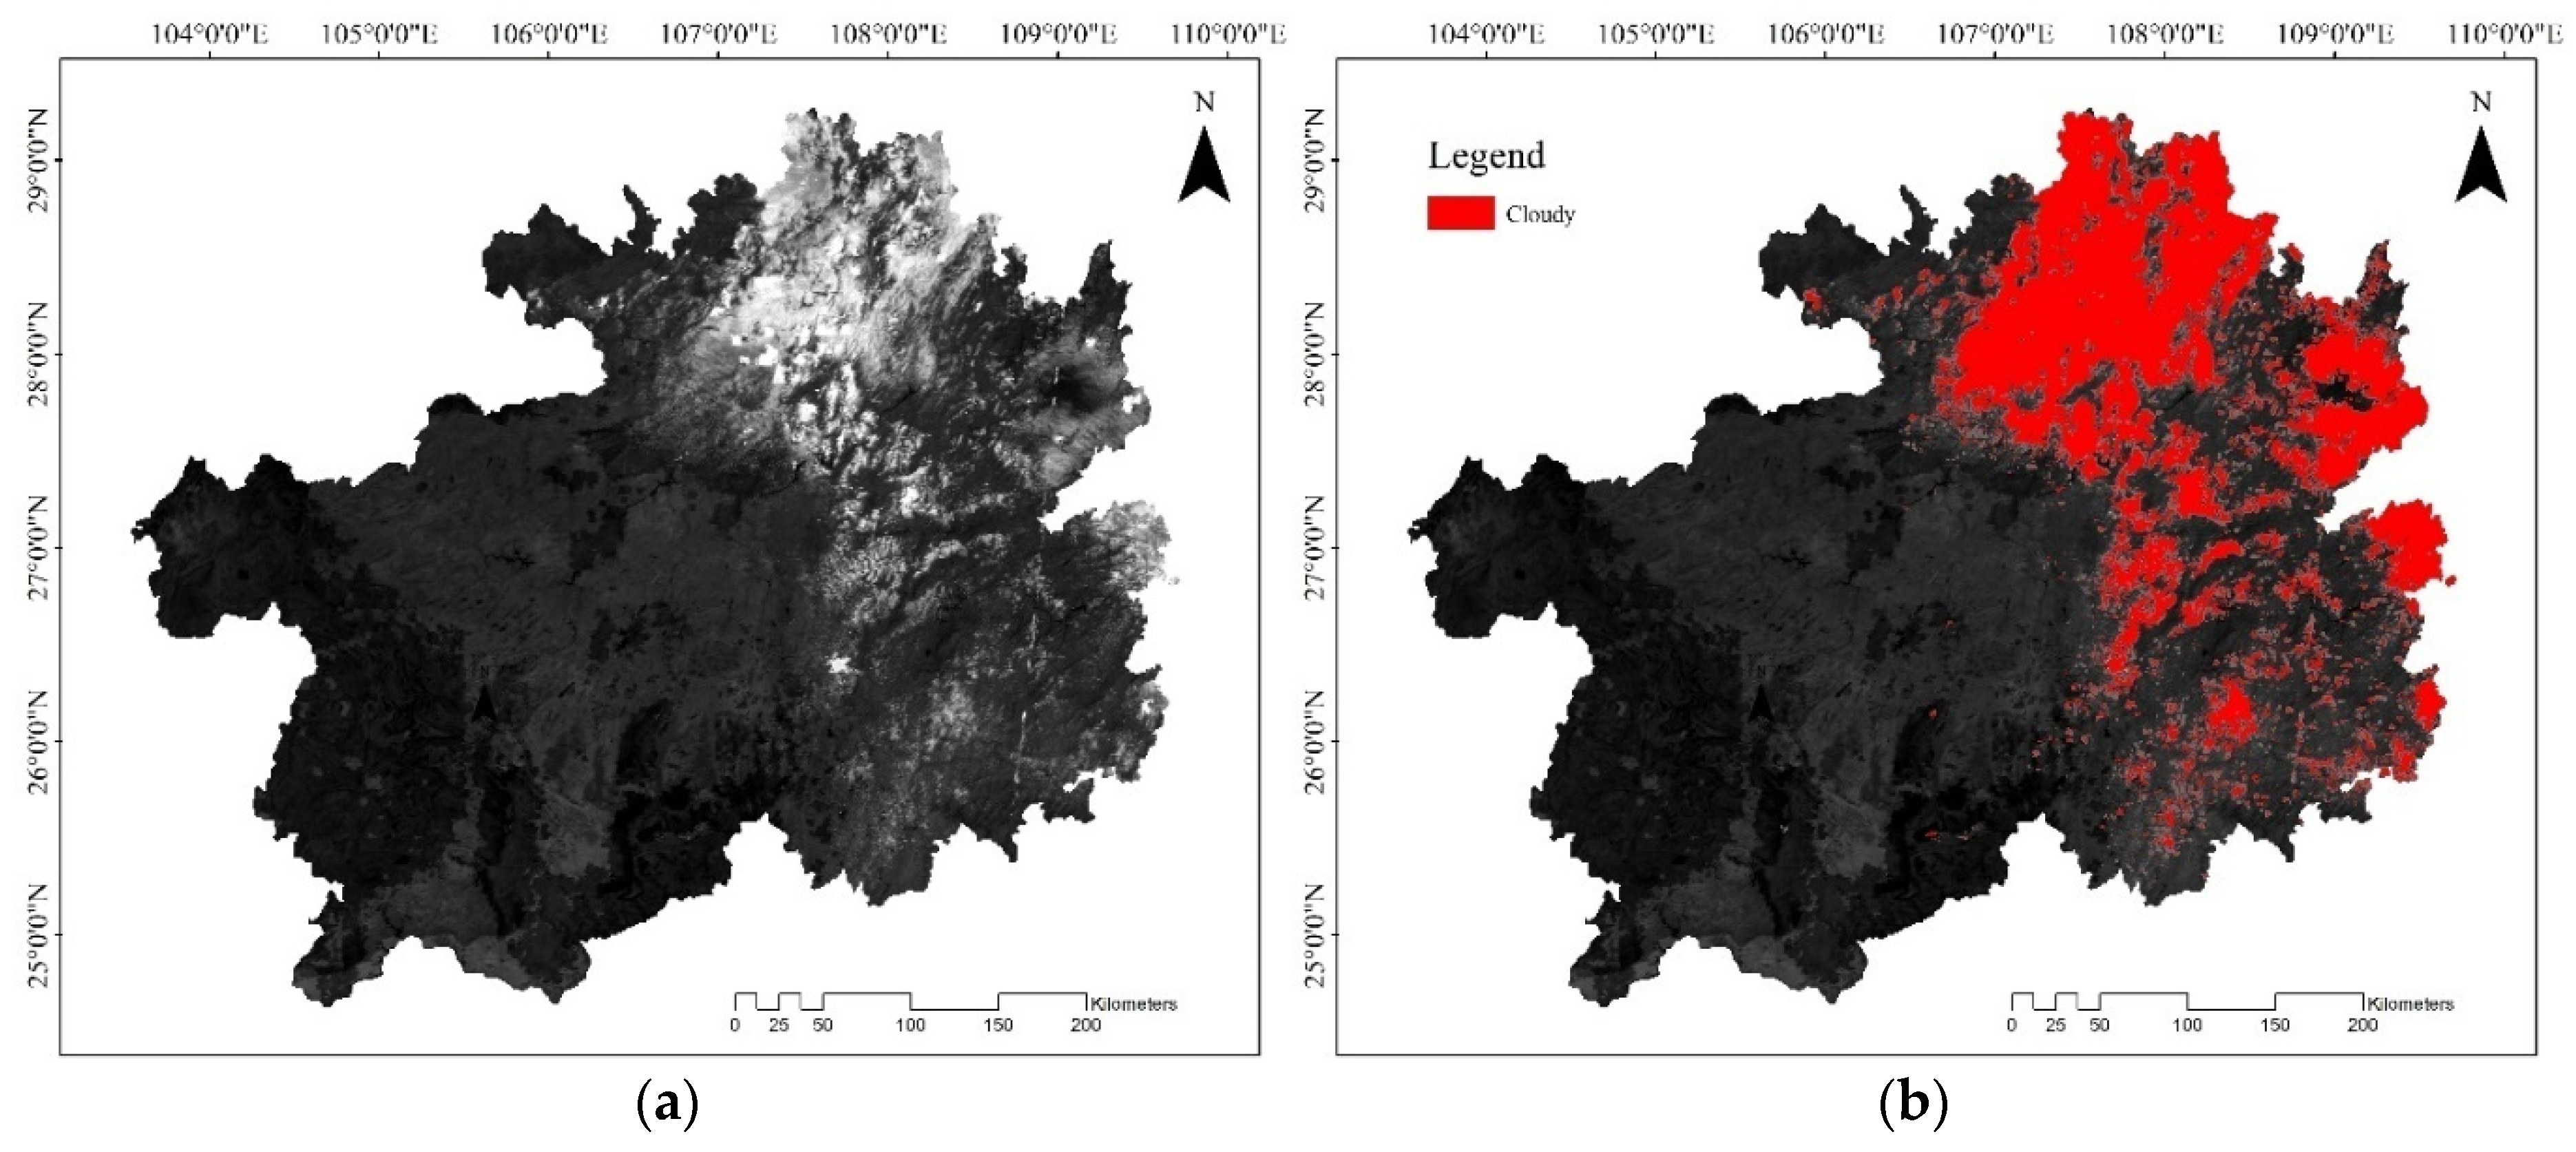
Image preprocessing was divided into two steps: cloud recognition [51] and outlier removal. First, the image quality evaluation information provided by MODIS products was used to identify whether the cloud was interfering with the image pixel. If not, the pixel value was maintained; otherwise, it was marked as a mask. MODIS09A1 data provide a stateQA quality assurance field, which identifies the data quality. It is identified by 16 bit binary numbers, among which the 0–1 bit represents a cloud; the second bit represents the cloud shadow; the 8–9 bit represents a cirrus detected. The five bits of these three parts are all related to clouds, which can be used to identify clouds. Based on bit operation, as long as one of the values of the three parts was not 0, it was identified as a part of the image disturbed by cloud, and then, mask processing was performed. Formula 1 was used to identify clouds in this study, and the cloud recognition effect is shown in Figure 3.
C1 = (0003) & StateQA, C2 = (0004) & StateQA, C3 = (0300) & StateQA
C1||C2||C3 = 1
C1||C2||C3 = 1
In addition to cloud interference, the original image may have some dark pixels or super bright pixels, i.e., outliers or noise points, due to problems due to illumination, sensors, and the shooting angle. In this study, the standard deviation denoising method was used to deal with outliers. The threshold value was the average plus or minus three standard deviations. The pixels beyond this range were considered outliers and the threshold value was used to correct these pixels.
3.3. Rocky Desertification Factors
We extracted Rocky desertification factors such as FVC, RE, NDBI, LSTD, HD, AD, ET, and elevation to build model. These factor indexes were extracted directly or indirectly from MODIS product data, we used 1% as the pixel value without vegetation ) and 99% as the pixel value completely covered by vegetation (), 1% as and 99% as ,which as shown in the Table 1.
Finally, the extracted vegetation coverage, bedrock bare rate, humidity, evapotranspiration, and other factors were synthesized throughout the year. We used three synthesis methods including maximum, mean, and minimum [43]. Assuming that there are n periods of data in a year, as shown in:
where i = 1, 2, 3…, n.
According to the physical meaning and image histogram statistics of each factor, the most accurate synthesis method of the factor was selected, and, finally, the data of each rocky desertification factor were obtained for the follow-up study of rocky desertification modeling.
3.4. Model Construction Method
3.4.1. Logistic Regression Model
Logical regression is a generalized linear regression analysis model, often used in classification problems [57]. The known independent variables are used to predict the value of a discrete dependent variable. In short, it predicts the probability of an event’s occurrence by fitting a logical function. The multiple linear regression model was used to establish the rocky desertification monitoring model in this study, as shown in Equation (9):
where represent the n eigenvalues for each test sample.
The sigmoid function wasused as a regression function for the dichotomous problem. It can map any contiguous value between [0,1]. The larger the number, the closer it approaches to 0; the smaller the number, the closer it approaches to 1. The sigmoid function was used to construct the predictive function. Equation (10) was used to determine which category each test sample belonged to.
3.4.2. Random Forest (RF) Model
Random forest (RF) consists of several decision tree groups. Decision trees are a fully grown and unpruned classification and regression trees are generated by the classification and regression tree (CART) algorithm. The simple majority voting method wasused as the output of the random forest for classification problems [58].
The implementation steps of the random forest algorithm are as follows:
Step 1: Perform Steps 2 and 3 at each loop t = 1, …, T.
Step 2: The training sample set is transformed into a new training sample set through the bagging algorithm.
Step 3: The new classification model H(x) is obtained from the new training sample set.
Output: Strong classifier H(x).
3.4.3. Support Vector Machine (SVM) Model
The main process of SVM is follows: A hyperplane that separates all of the data samples is found in space. It minimizes the distance from all of the data in the sample set to this hyperplane. The support vector machine combines the perceptron and logistic regression classification [55]. The hyperplane equation is shown in Equation (12):
The distance from point to the hyperplane is . The geometric interval between the training sample point and the hyperplane H is , which is the shortest distance between a point and the hyperplane. The logistic regression model was used to analyze the geometric interval:
The larger the γ, the smaller the loss function and the greater the probability that the result is a positive sample. Maximizing the geometric interval from a point to a hyperplane is the classification idea of perceptrons. The inner product in higher dimensions must be found, which is the kernel. There are three main types of kernel functions in common use: the order of the polynomial kernel, the RBF kernel function, and the sigmoid function. RBF was used as the kernel function in this study.
3.4.4. Accuracy Analysis Method
The accuracy of the model was evaluated using the confusion matrix by comparing the errors between the classification results and the actual values. This method mainly calculates and observes four accuracy evaluation factors, which are production accuracy, user accuracy, overall classification accuracy, and Kappa coefficient [59].
1. Production accuracy
Production accuracy represents, for a real feature, the probability that the ground features are correctly classified into this category in the classification results. The calculation formula is as follows:
where represents the production precision of class j and represents the number of samples of the selected real class j.
2. User accuracy
The user accuracy is the possibility that the category the result belongs to agrees with the actual ground surface class. Its calculation formula is as follows:
where represents the user accuracy of class i and represents the total number of samples classified into class in the classification results.
3. Overall classification accuracy
The overall classification accuracy represents the probability that any sample is correctly classified (the classification result is the same as the actual class). The size of is determined by the ratio of the correctly classified samples and the total number of samples. Its calculation is as follows:
where n represents the number of sample categories represents the number of samples of class that are correctly classified is the total number of samples.
4. Kappa coefficient
The above three precision evaluation indexes are all evaluated from different perspectives. The Kappa coefficient uses a discrete multilevel technique to fully account for each value in the matrix. The specific calculation formula is as follows:
where is the number of columns of the confusion military array is the number of samples in row and column , which represents the number of samples correctly classified is the number of samples in the th row is the number of samples in column is the total number of samples to be verified.
5. Quantity Disagreement and Allocation Disagreement
Pontius and Millones [60] proposed two new indicators to evaluate the classification accuracy, quantity disagreement(QD) and allocation disagreement(AD). Warrens [61] shows how the map-level disagreement measures are related to the corresponding category-level disagreement measures. The calculation formula is as follows:
4. Results and Analysis
4.1. Extraction of Rocky Desertification Factors in Guizhou
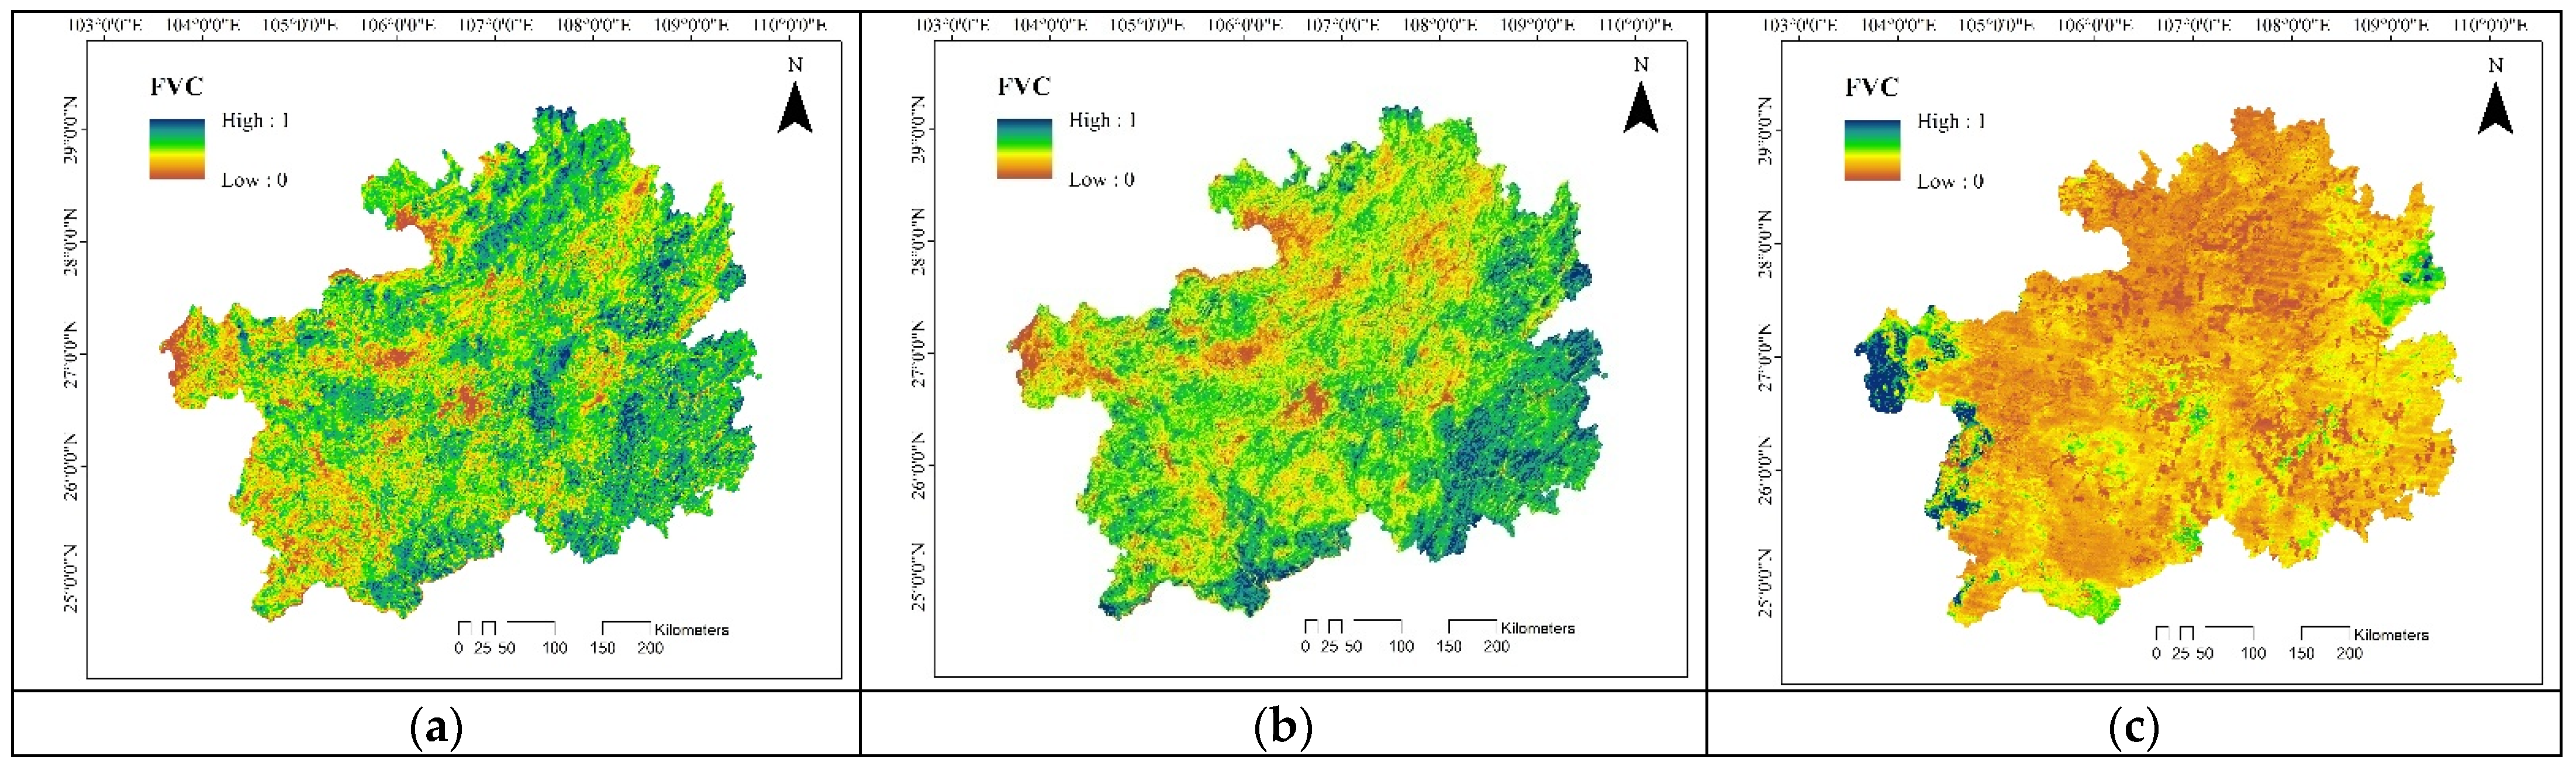
The FVC and RE are two important factors used to express the state of rocky desertification [39,43,62]. The FVC index was calculated using 46 images of MODIS09A1 in 2010, and then three synthesis methods, the maximum value, mean value, and minimum value, were compared to find the best one. The results are shown in Figure 4. Generally, the vegetation coverage shows the obvious differences in different seasons in the same year. The plants grew in summer and the vegetation coverage was larger than in winter. The vegetation growth status was also an important index used to evaluate rocky desertification and the maximum value method of vegetation coverage in a year can reflect the plant growth state well. Therefore, the FVC index was usually synthesized by the maximum value method, which can avoid the false classification of pseudo rocky caused by winter defoliation. The standard deviation of the FVC index images based on the three synthesis methods was calculated and the result showed that the standard deviations based on the maximum, mean, and minimum synthesis methods were 0.553, 0.489, and 0.312, respectively, which indicate that the maximum synthesis method produced the best classification effect.
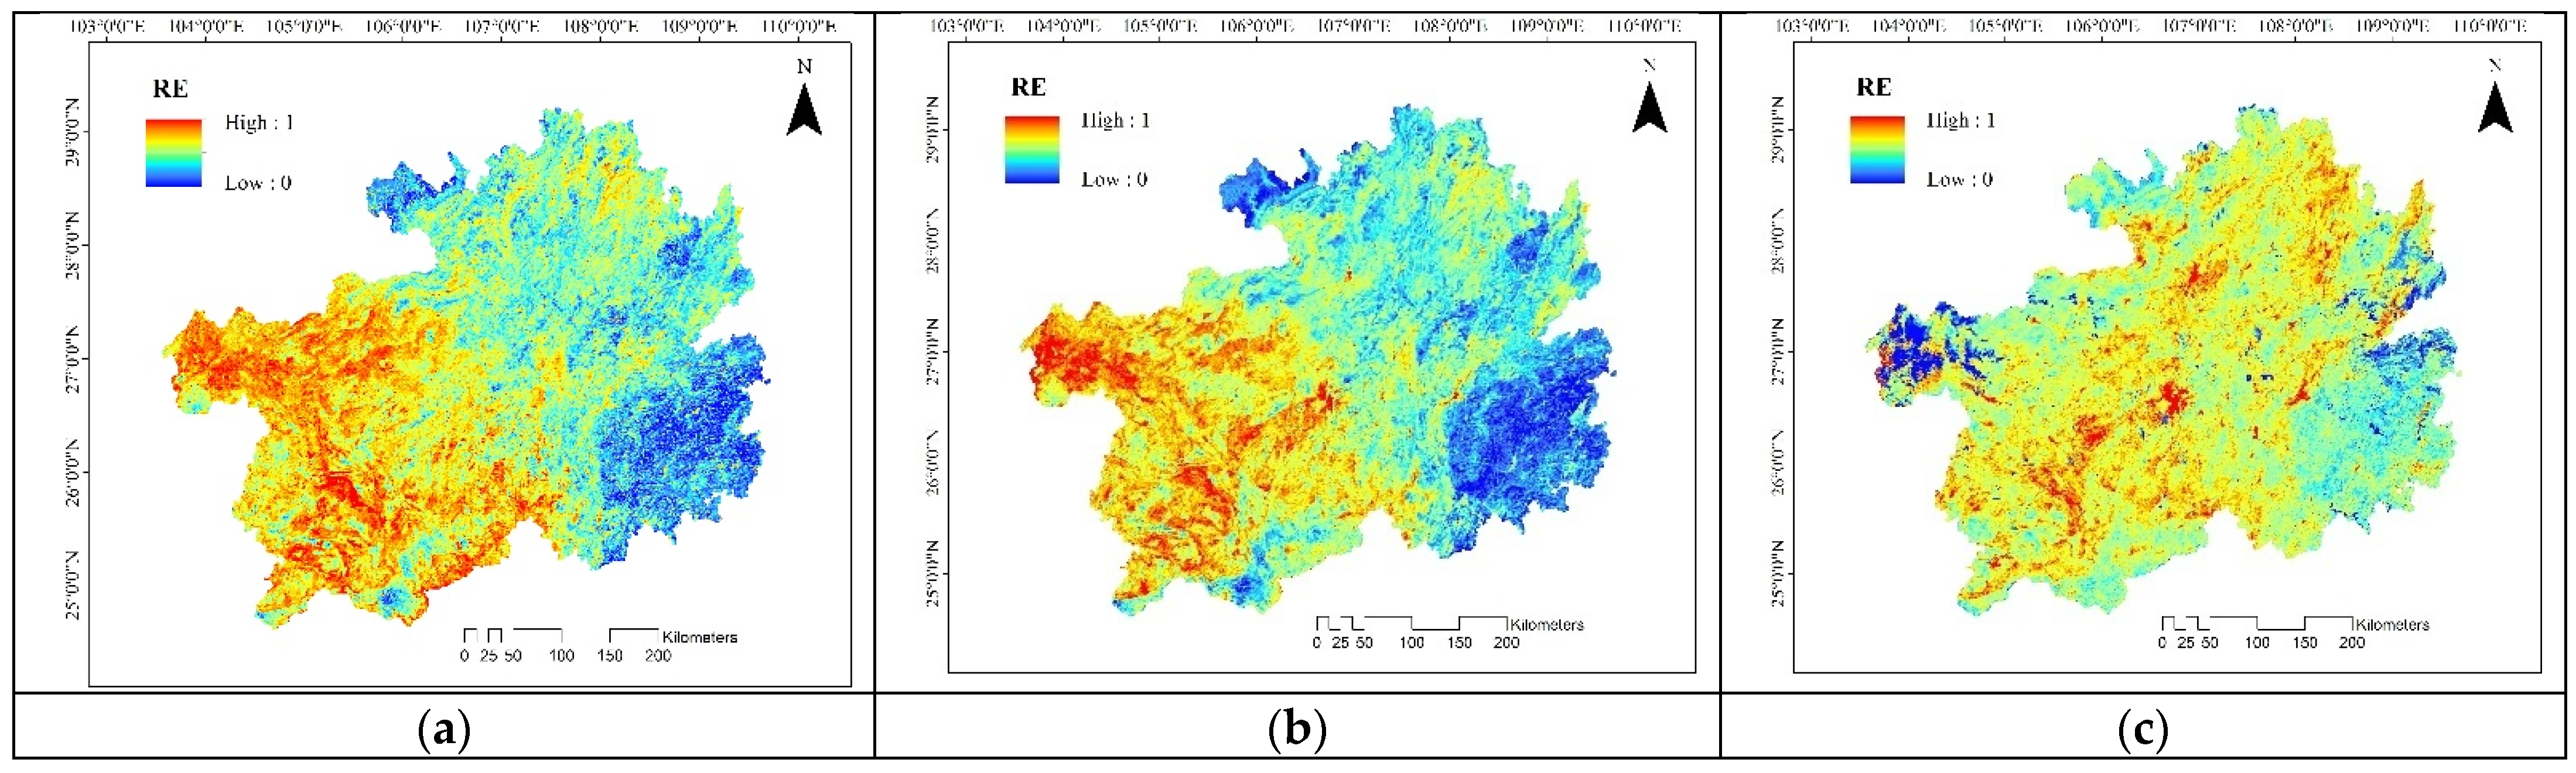
Rock exposure (RE) usually occurs in rocky desertification areas, but some occur in non-rocky desertification areas. The RE index is an important feature of rock desertification; the higher the index, the more severe the degree of rock desertification. Due to defoliation in winter, the RE index may be higher in rocky or non-rocky desertification areas. However, vegetation grows more in summer, and if the RE index is very high at this time, it indicates that the area is in the state of rocky desertification. The RE index was extracted by MODIS09A1 from July to September (summer) in this study. The results are shown as Figure 5. The standard deviation of the RE index images based on the three synthesis methods was calculated and it showed that the standard deviations based on the maximum, mean, and minimum synthesis methods were 0.312, 0.278, and 0.21, respectively, which also indicated that the maximum synthesis method produced the best classification effect.
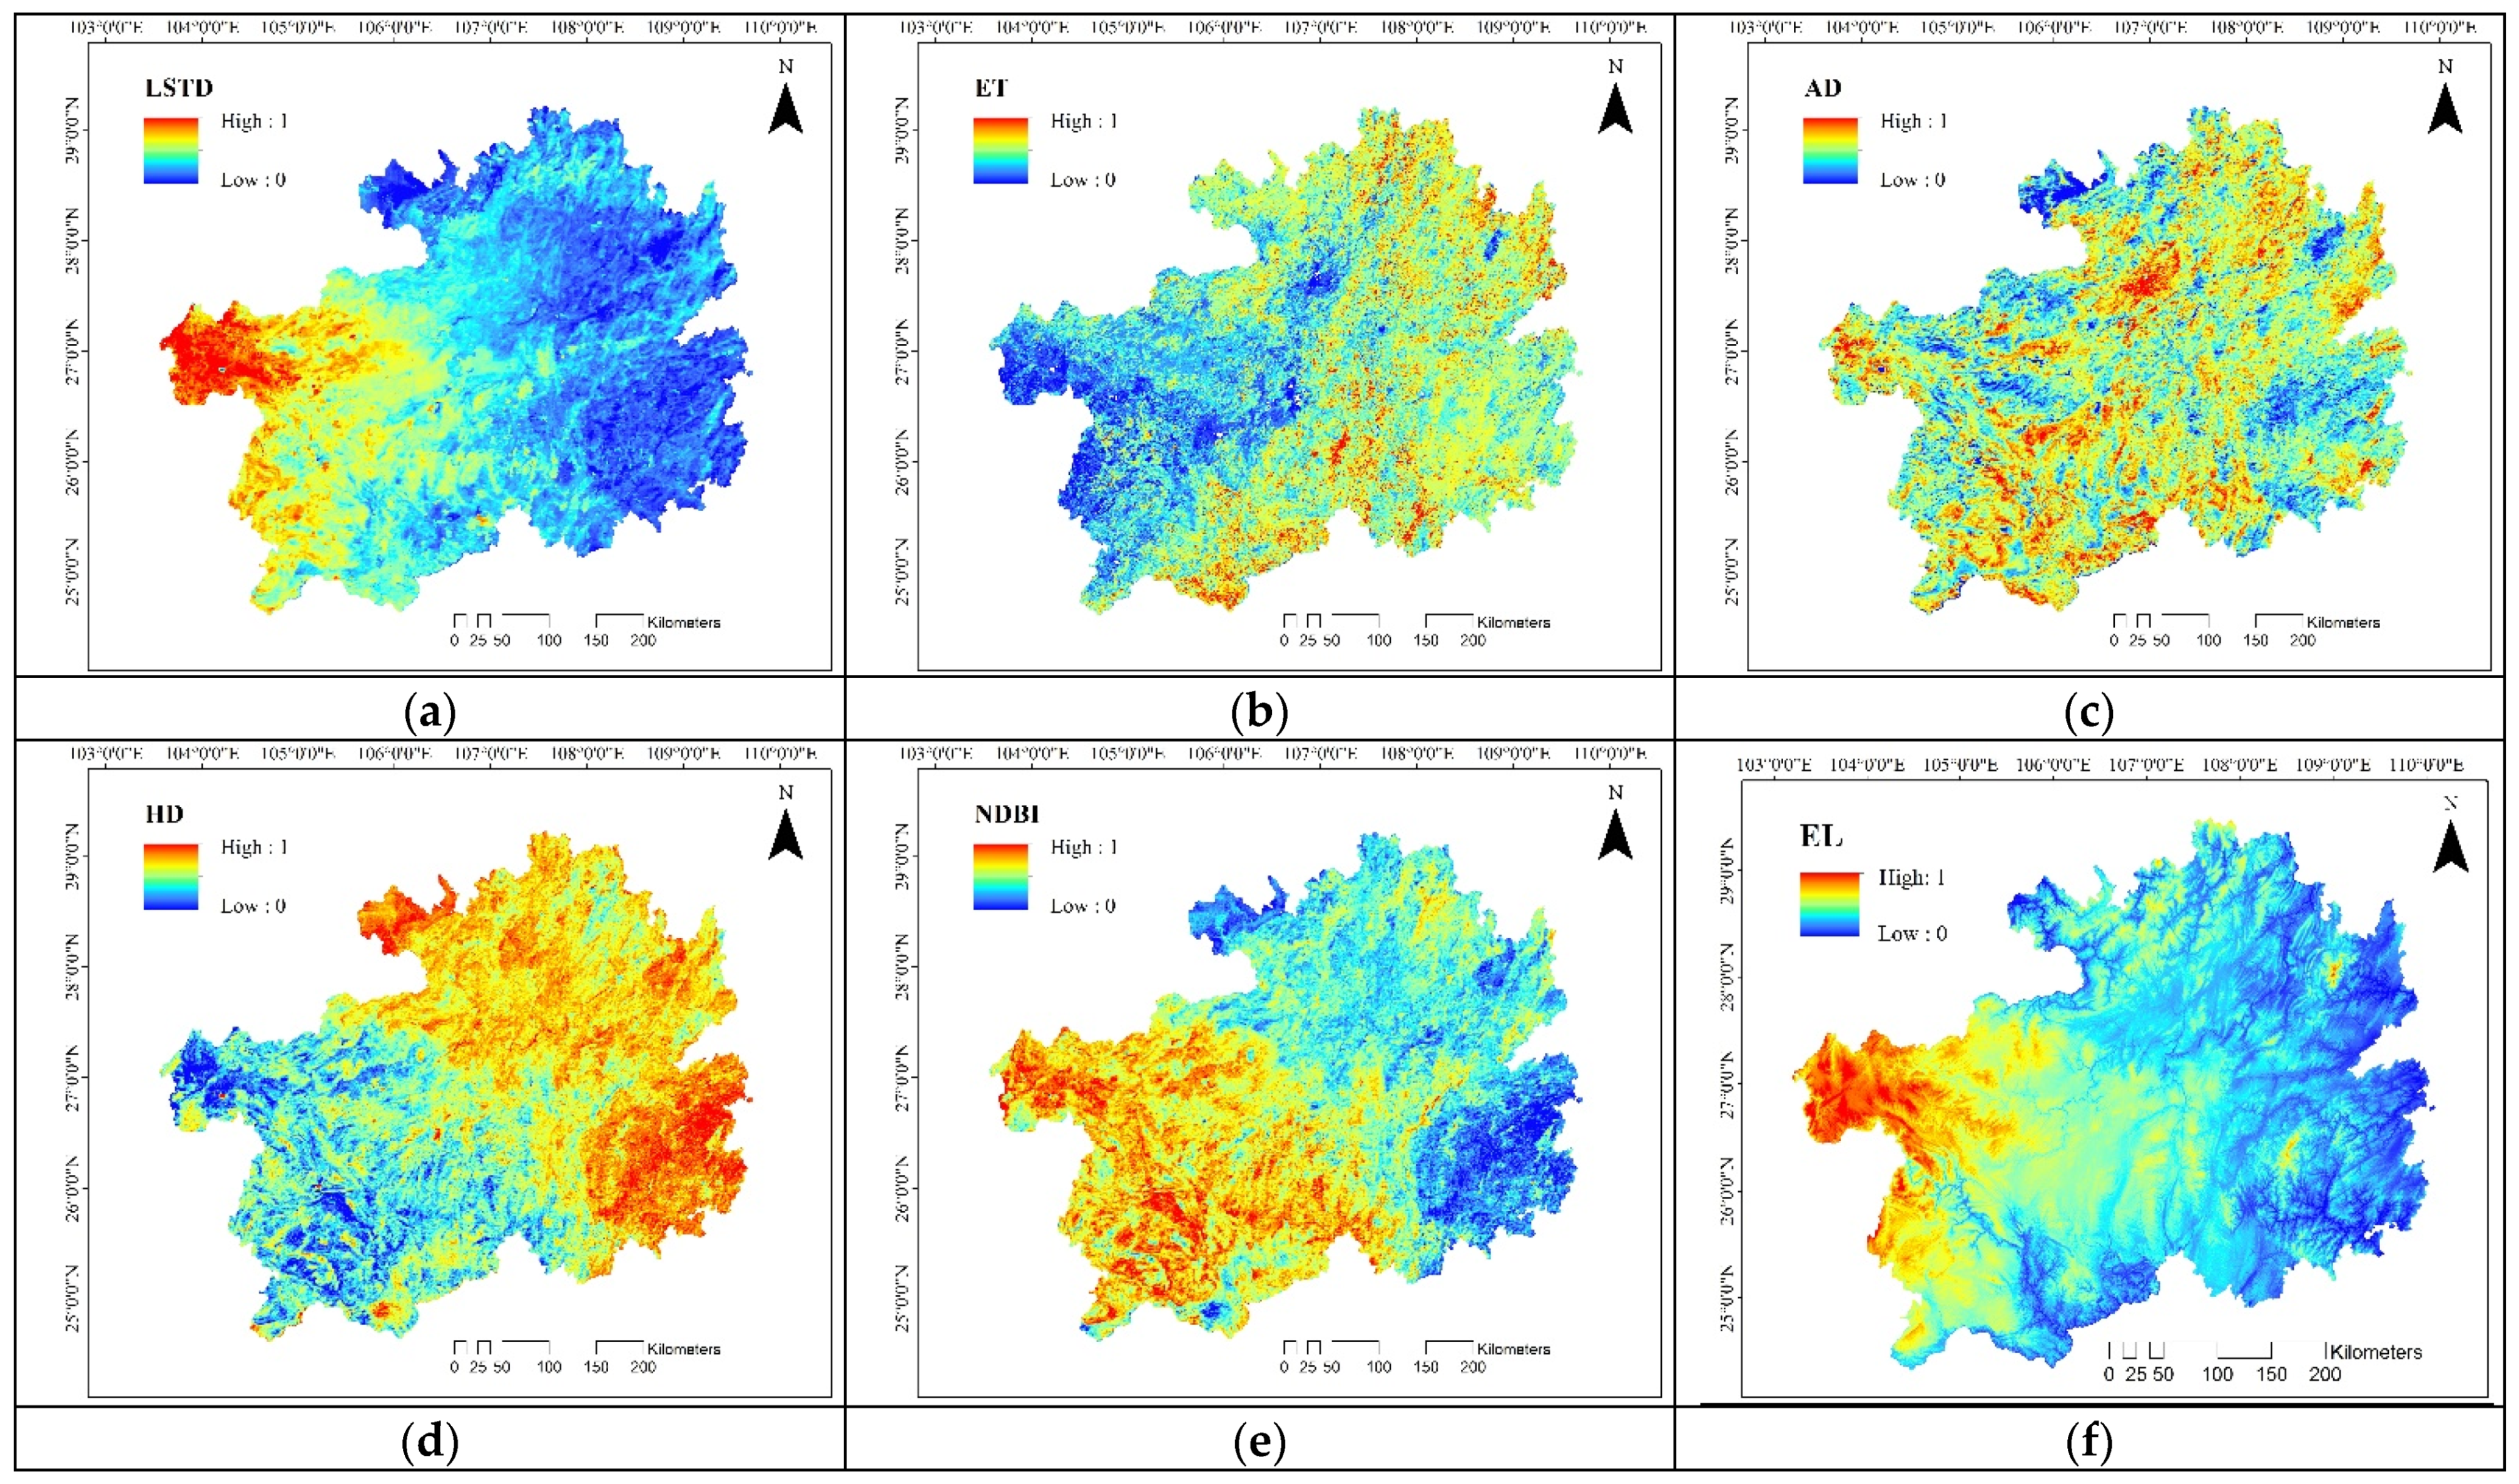
The more severe the rocky desertification, the sparser the vegetation and the higher the temperature difference between day and night. Due to the respiration of rich plants in non-karst areas, the temperature difference between day and night was relatively low. Therefore, the temperature difference can be used to characterize of rocky desertification. The maximum value synthesis method was used to extract the temperature difference factor. At the same time, humidity, brightness, and evapotranspiration factors were extracted by the mean synthesis method and NDBI and albedo factors were extracted by the minimum synthesis method in this paper. The results of each factor extraction are shown in Figure 6.
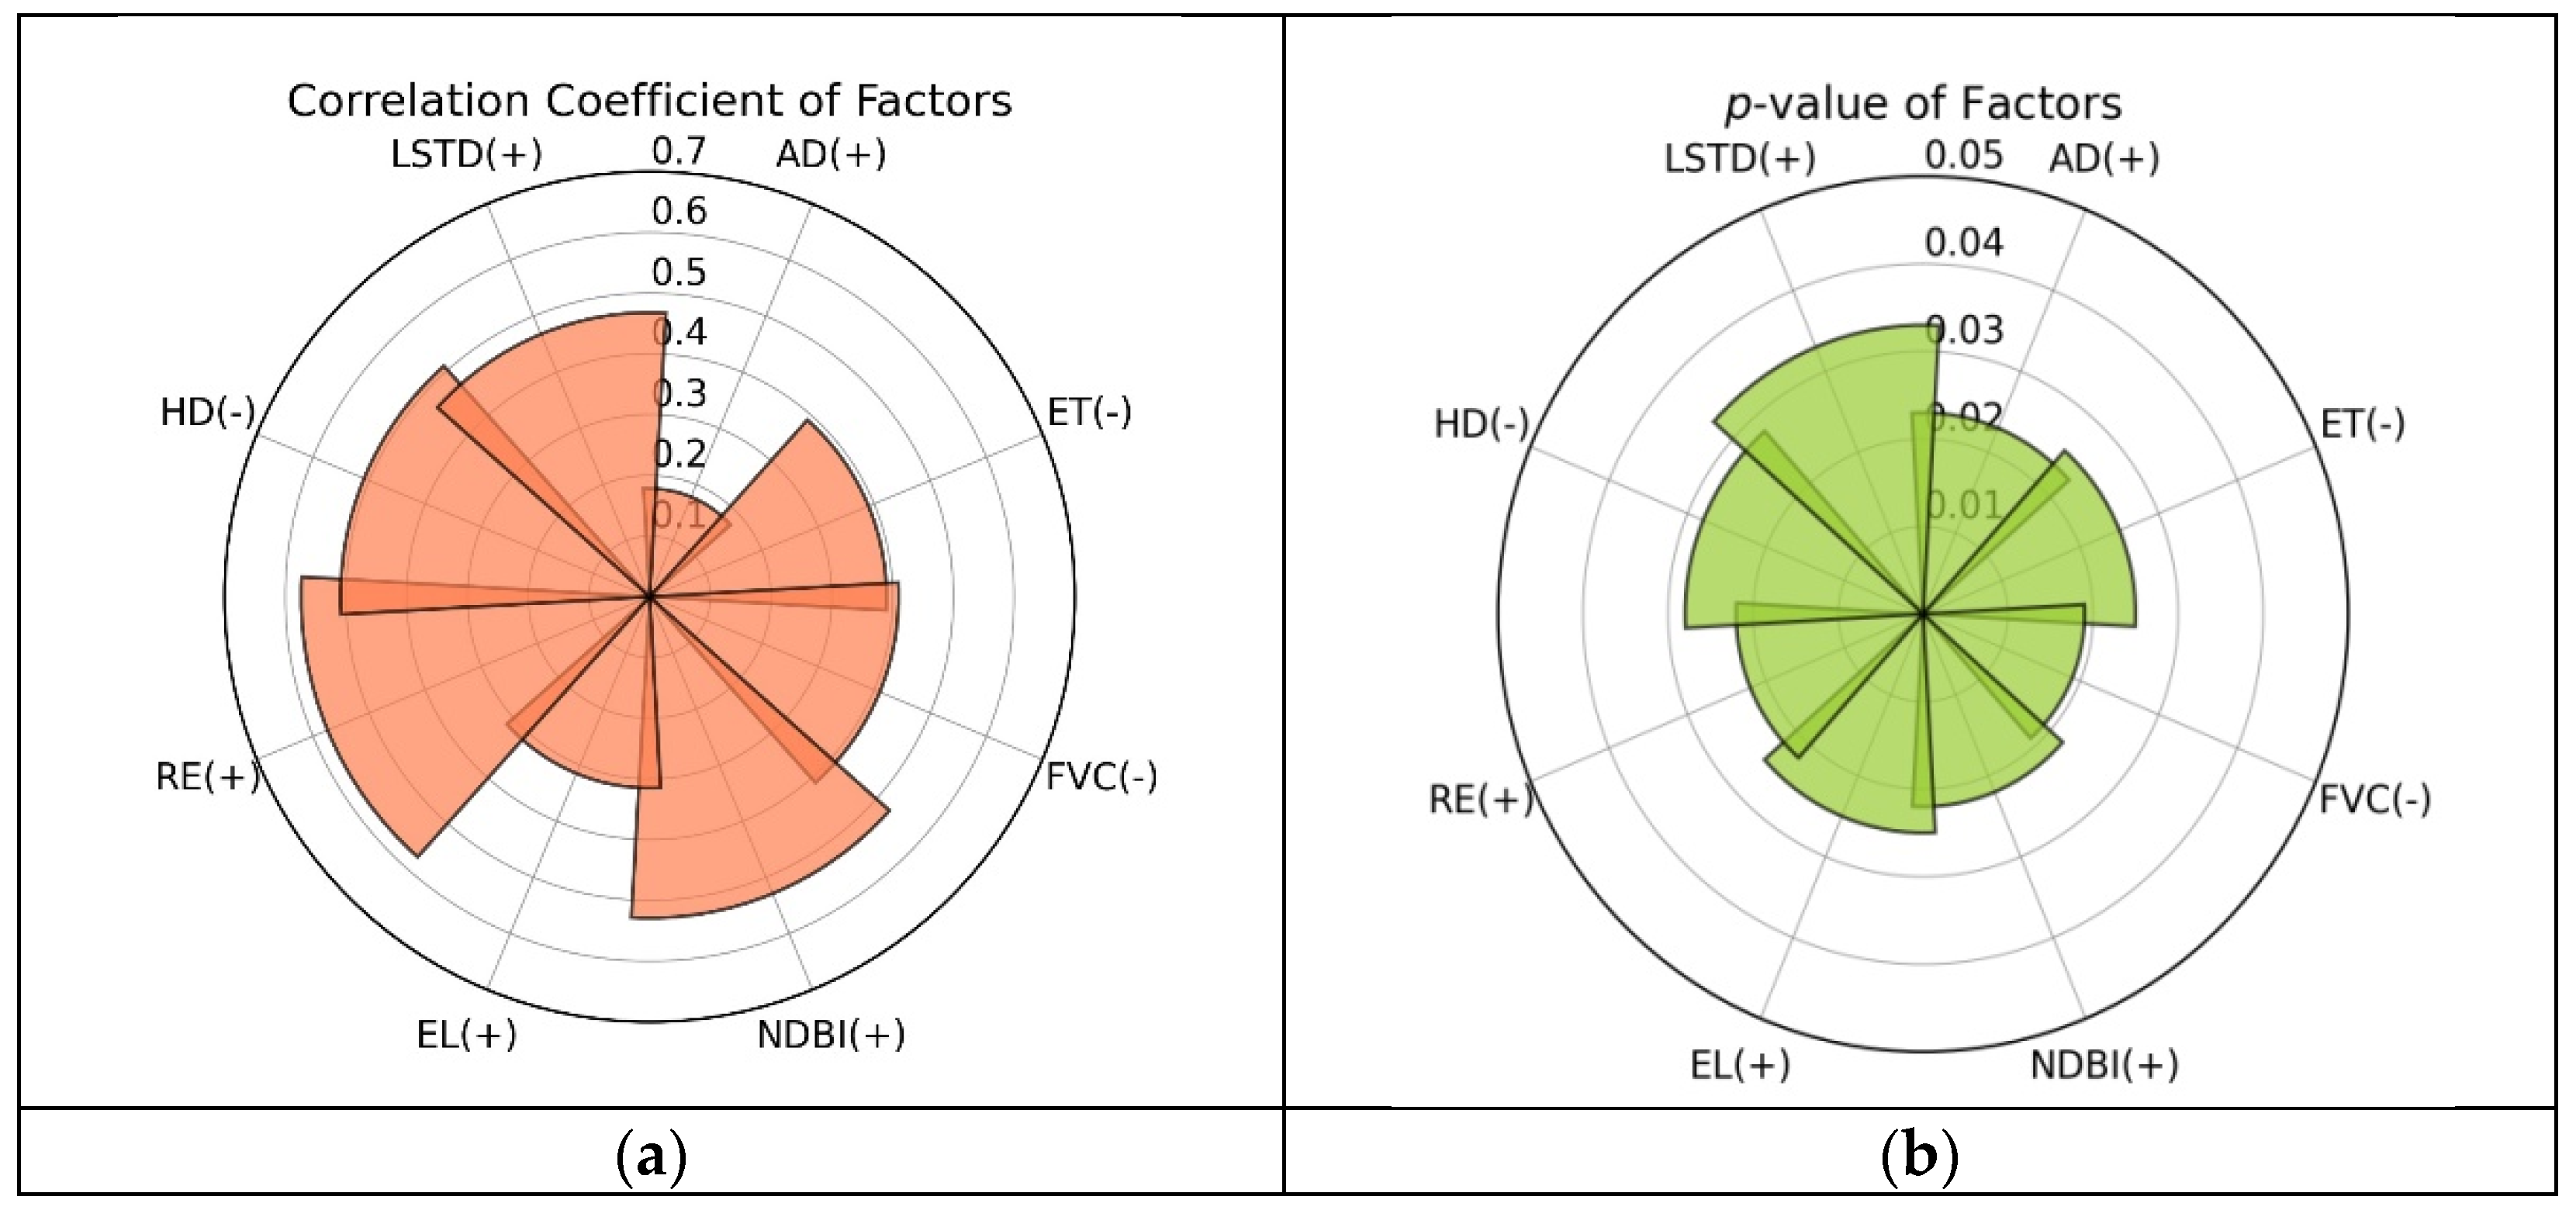
Rocky desertification was relatively severe from abiological point of view, we considered to judge the rationality of factor selection by the correlation between factors. The correlation between the factors and rocky desertification was analyzed by calculating the Pearson correlation coefficient, which is shown as Figure 7. The results showed that the correlation between these factors and rocky desertification was significant. The most significant correlation was RE, which was0.574; the smallest was AD with a value of 0.178, and p-value was within 0.05. Among them, FVC, ET, and HD were negatively correlated with rocky desertification, while the other six factors were positively correlated.
4.2. Construction and Comparison of Rocky Desertification Models
The rocky desertification monitoring model was derived from samples in 2010. These data excluded 234 samples of buildings, farmland, water, and other non-rocky desertified land, so the remaining 5266 samples were used in this study. Among them, 80% of the samples (4213) were prepared for model building and 20% of the samples (1053) were used for model verification. Then, the models were constructed by three algorithms: logical linear regression, random forest (RF), and support vector machine (SVM). Finally, the accuracy of the classification results of the three models was analyzed based on the statistical method known as the error matrix and the results are shown in Table 2 and Table 3. Among them, the accuracy of SVM was the highest, followed by RF, and then the logical linear regression model.
Compared with the traditional factor weight accumulation method or decision tree method, the accuracy of the rocky desertification monitoring model constructed by the three algorithms in this study is higher than that of the traditional method [43,59]. The results are shown in Table 2. The total accuracy of the logistic linear regression model was 73.7%, the QD was 9.2%, the AD was 17.1%, and the Kappa coefficient was 0.608. The total accuracy of the random forest model was 78.2%, the QD was 8.2%, the AD was 13.7%, and the Kappa coefficient was 0.672. The SVM model extended the factor set of the model to high-dimensional space, which can expand the differences between samples and can improve the classification accuracy. Therefore, the total classification accuracy of the SVM model constructed in this paper was 80.6%, the QD was 7.1%, the AD was 12.3%, and the Kappa coefficient was 0.707.
4.3. Optimization of the Rocky Desertification Estimation Model
4.3.1. Workflow of Model Improvement
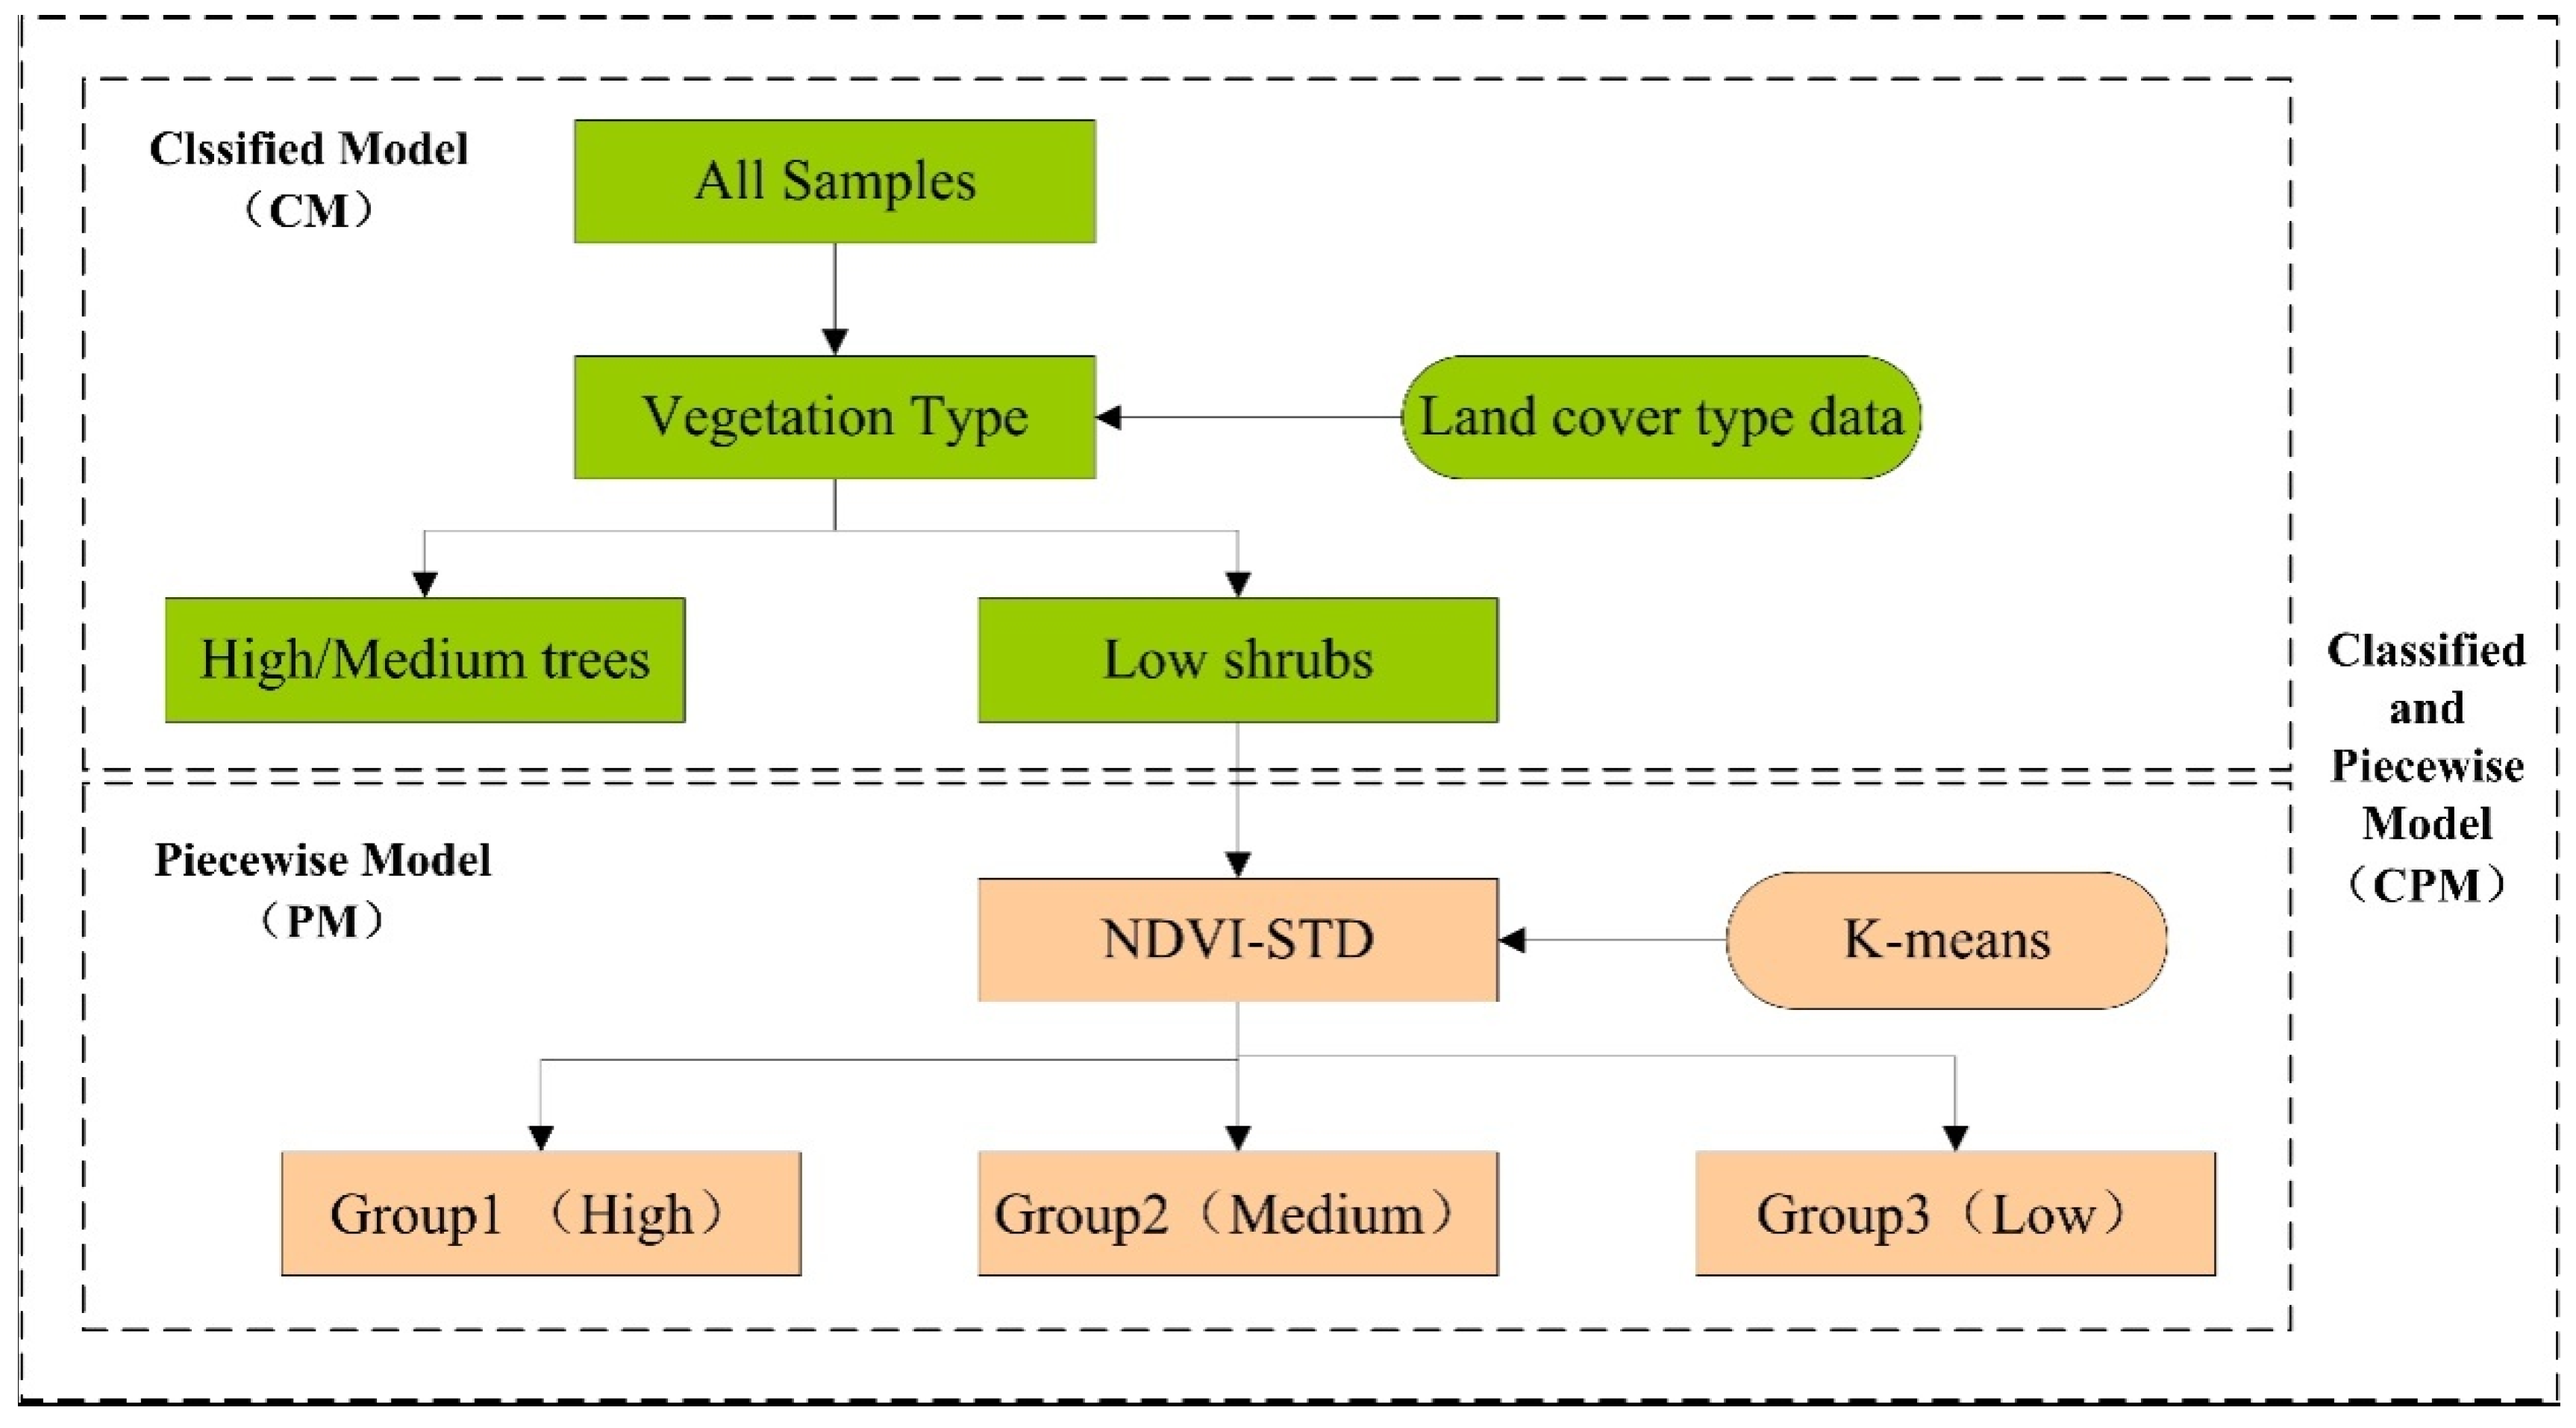
In this study, we used vegetation type and seasonal phase (NDVI-STD: the standard deviation of seasonal NDVI) to optimize the model. The workflow is shown in Figure 8.
4.3.2. Model Optimization Based on Vegetation Types at Different Heights
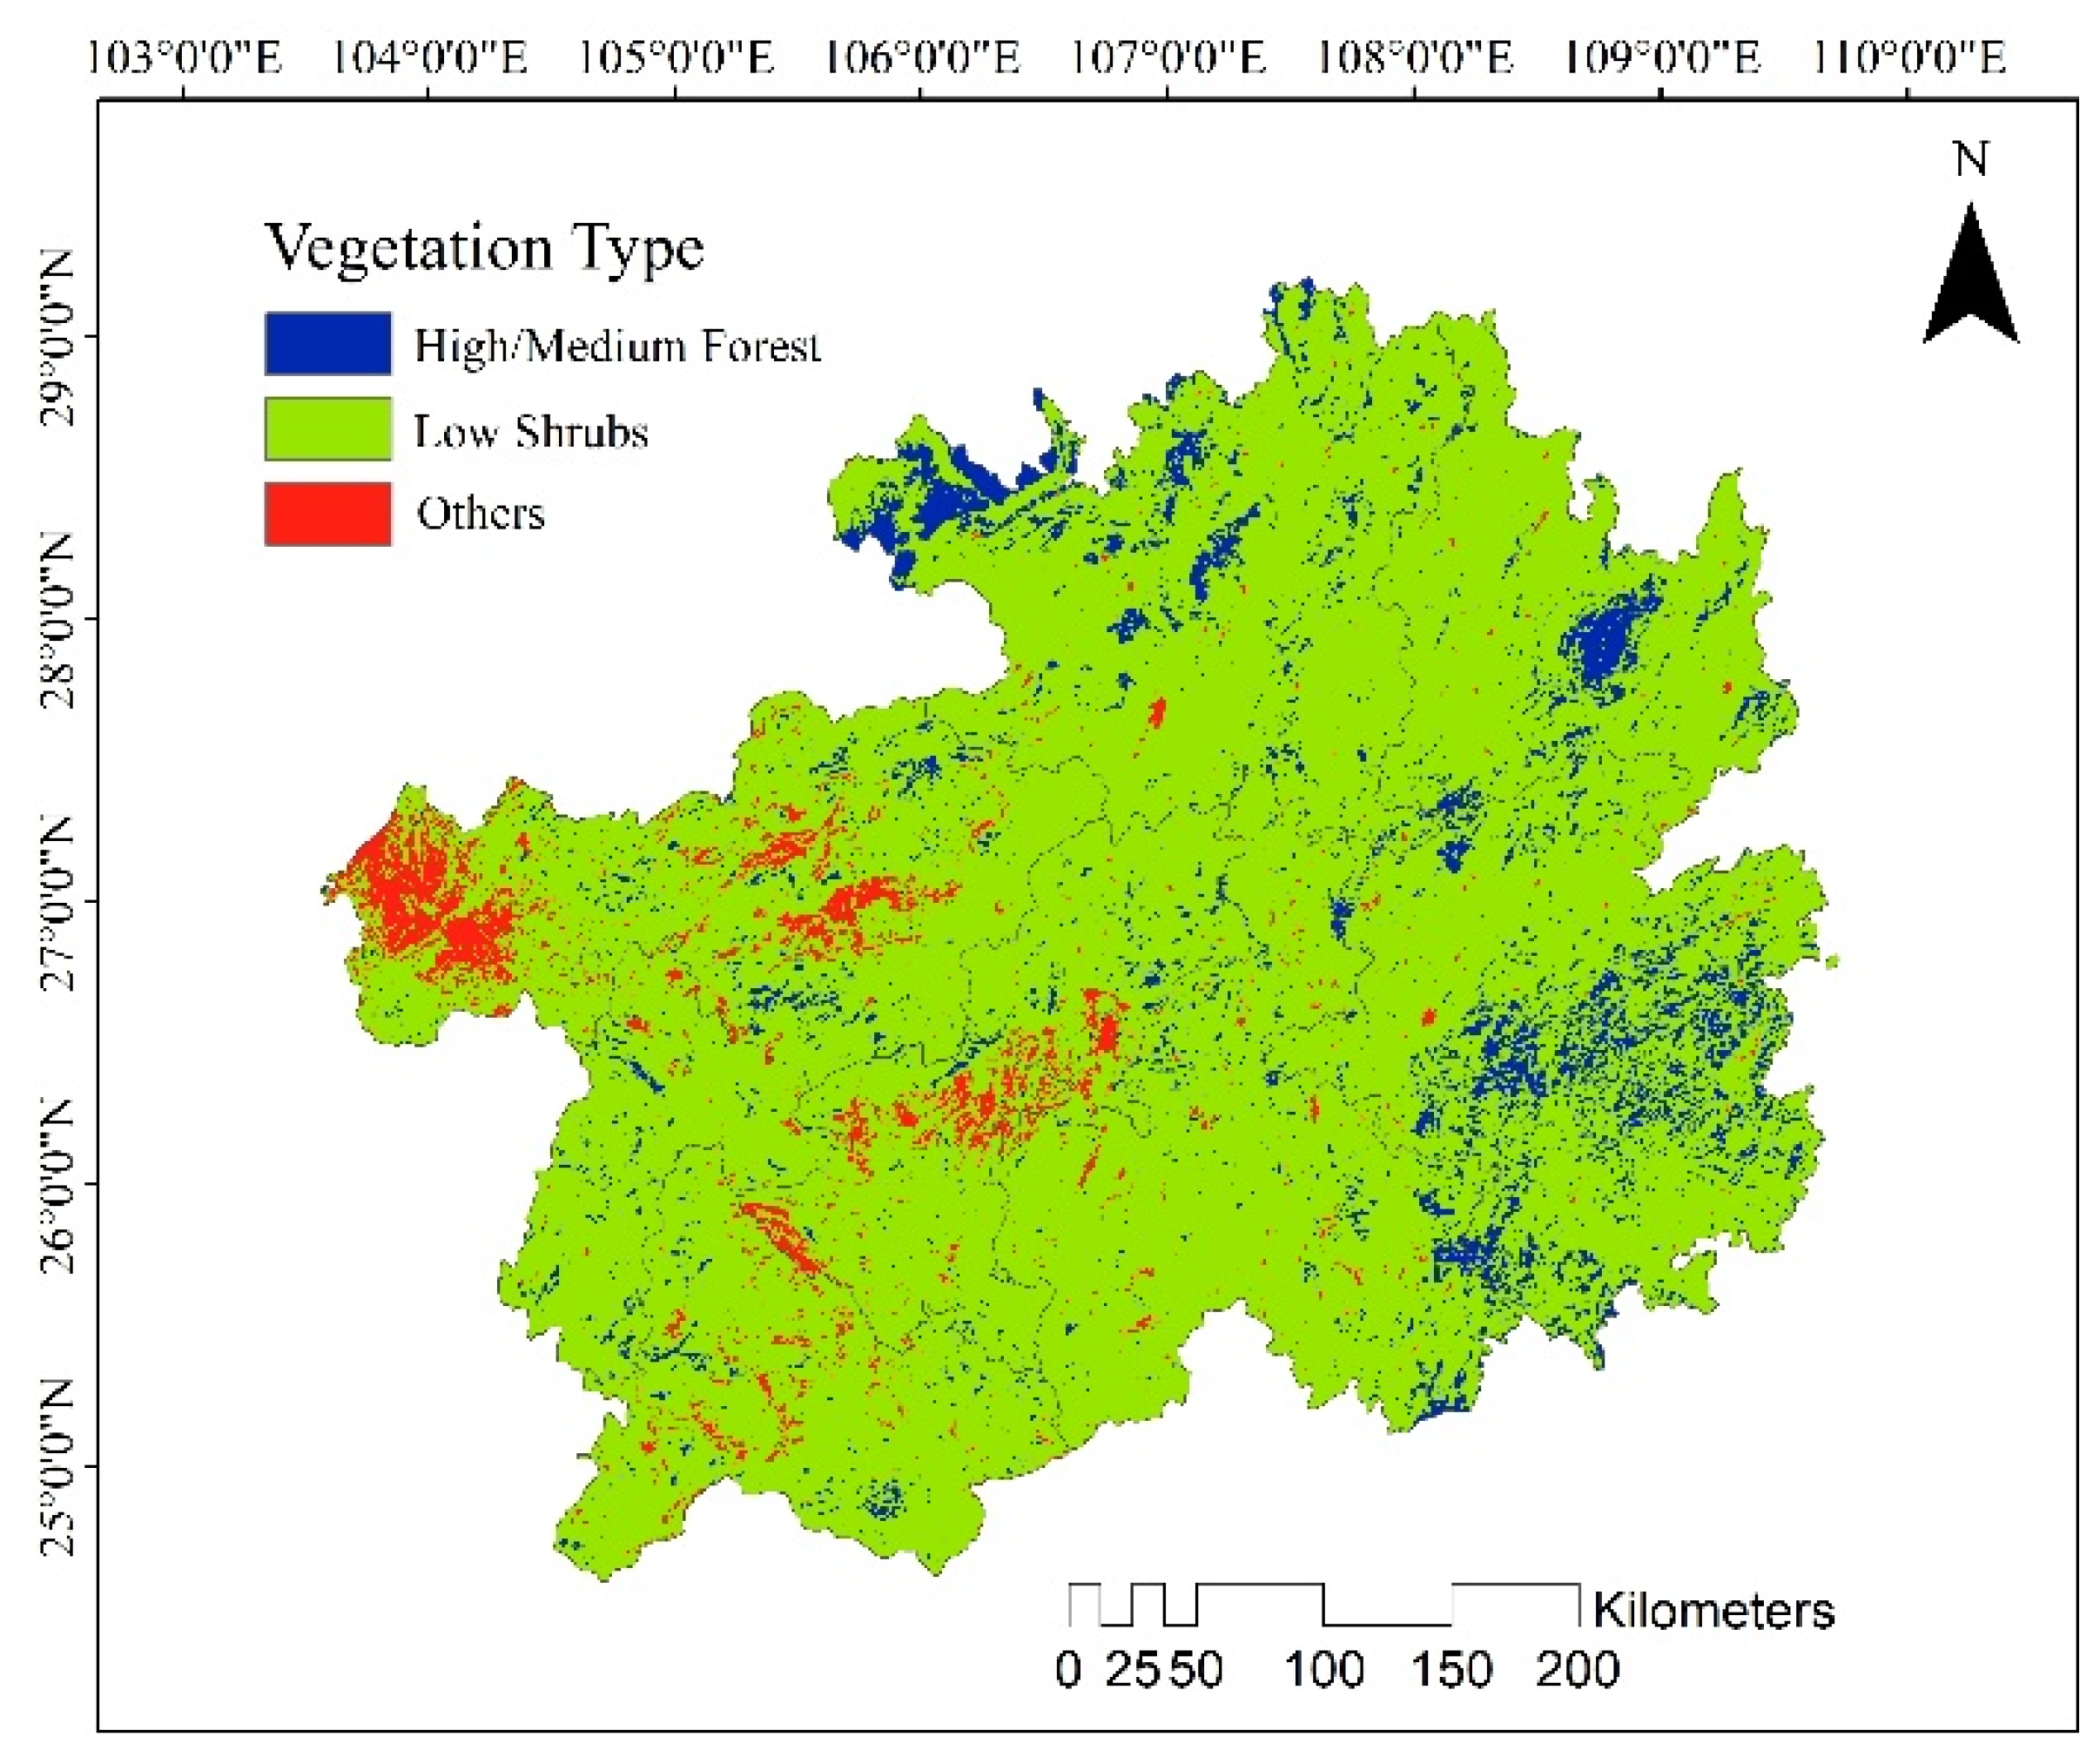
The spectral indices of the research objects were similar, but the heterogeneity of vegetation structure (horizontal structure and vertical structure) might be the internal difference causing the instability in the rocky desertification estimation. For example, there were significant differences in the vertical structure between grassland, low shrubs, and medium-high coniferous and broad-leaved forests, but their spectral characteristics were similar. We proposed optimizing the monitoring model of rocky desertification based on vegetation types with different vertical heights in this paper. All of the samples were divided into two groups according to the different vertical heights of vegetation from MODIS land cover data, which were medium/high trees and low shrubs to perform classified model(CM). They are shown in Table 4 and Figure 9.
4.3.3. Extraction and Analysis of Seasonal NDVI-STD
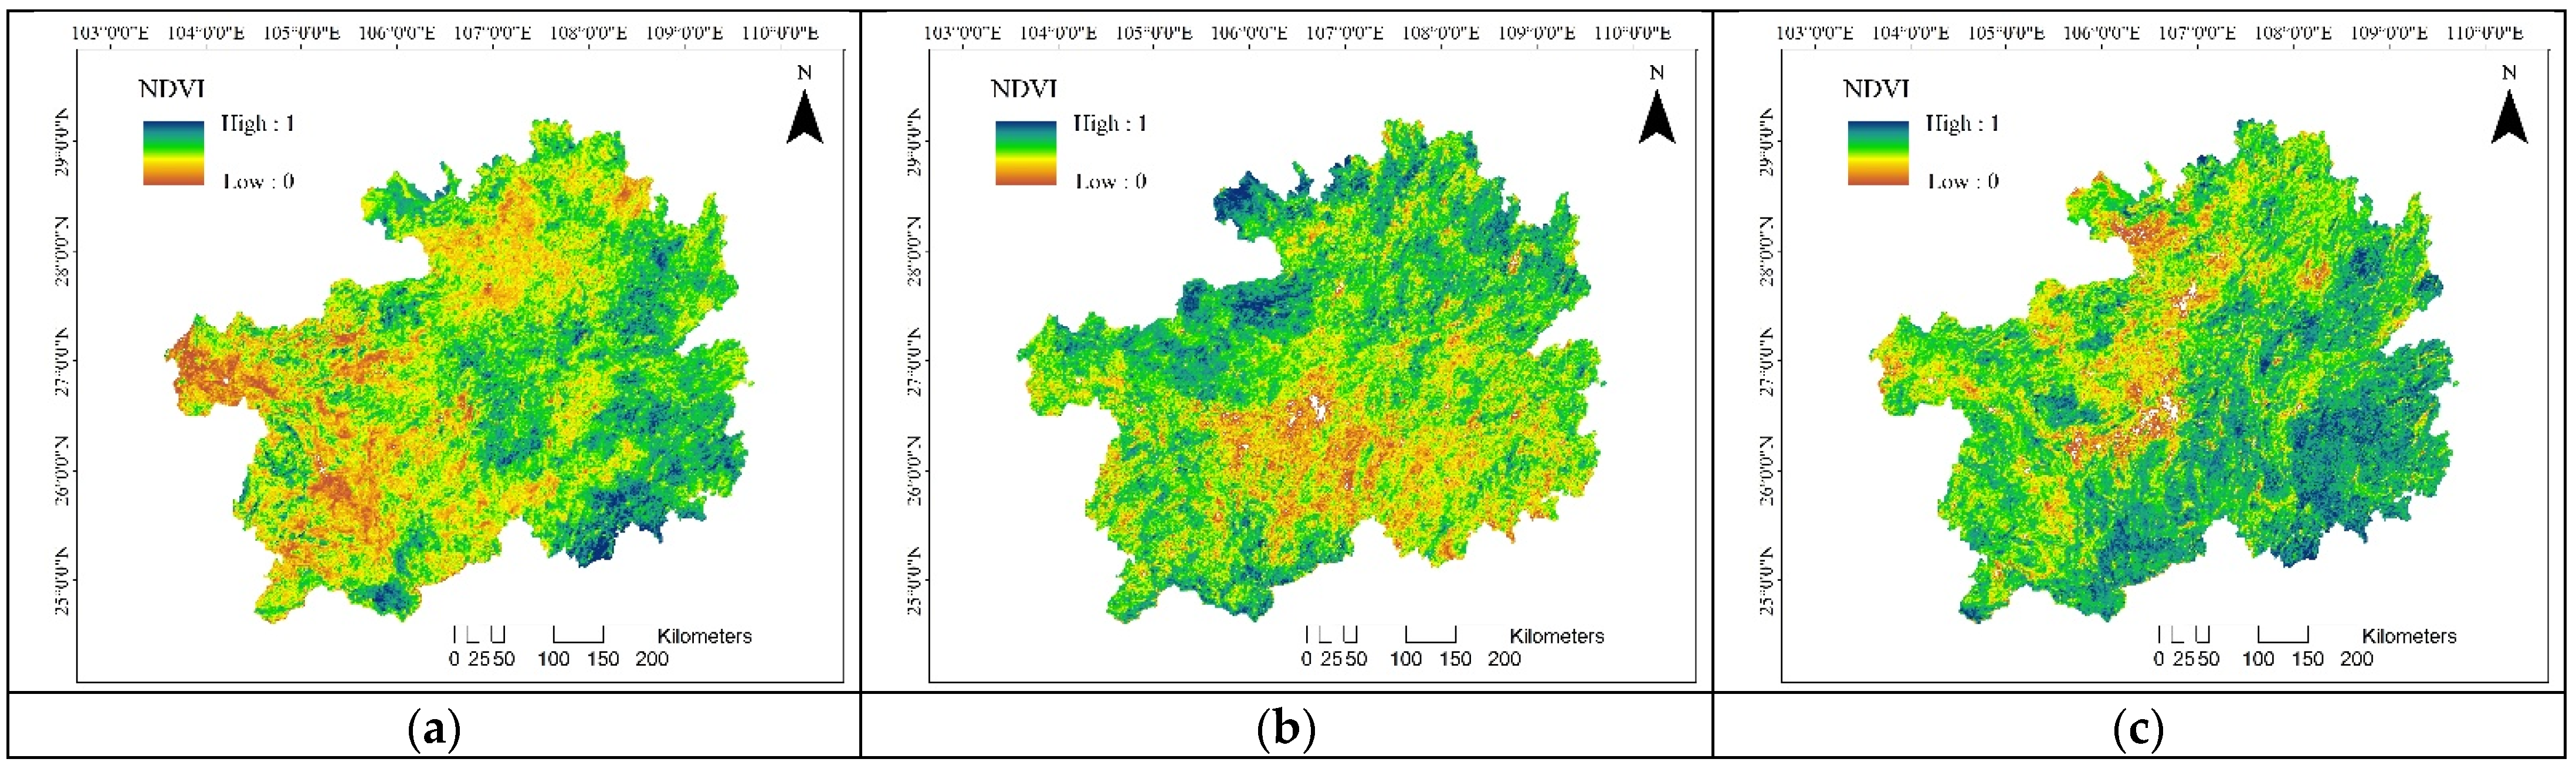
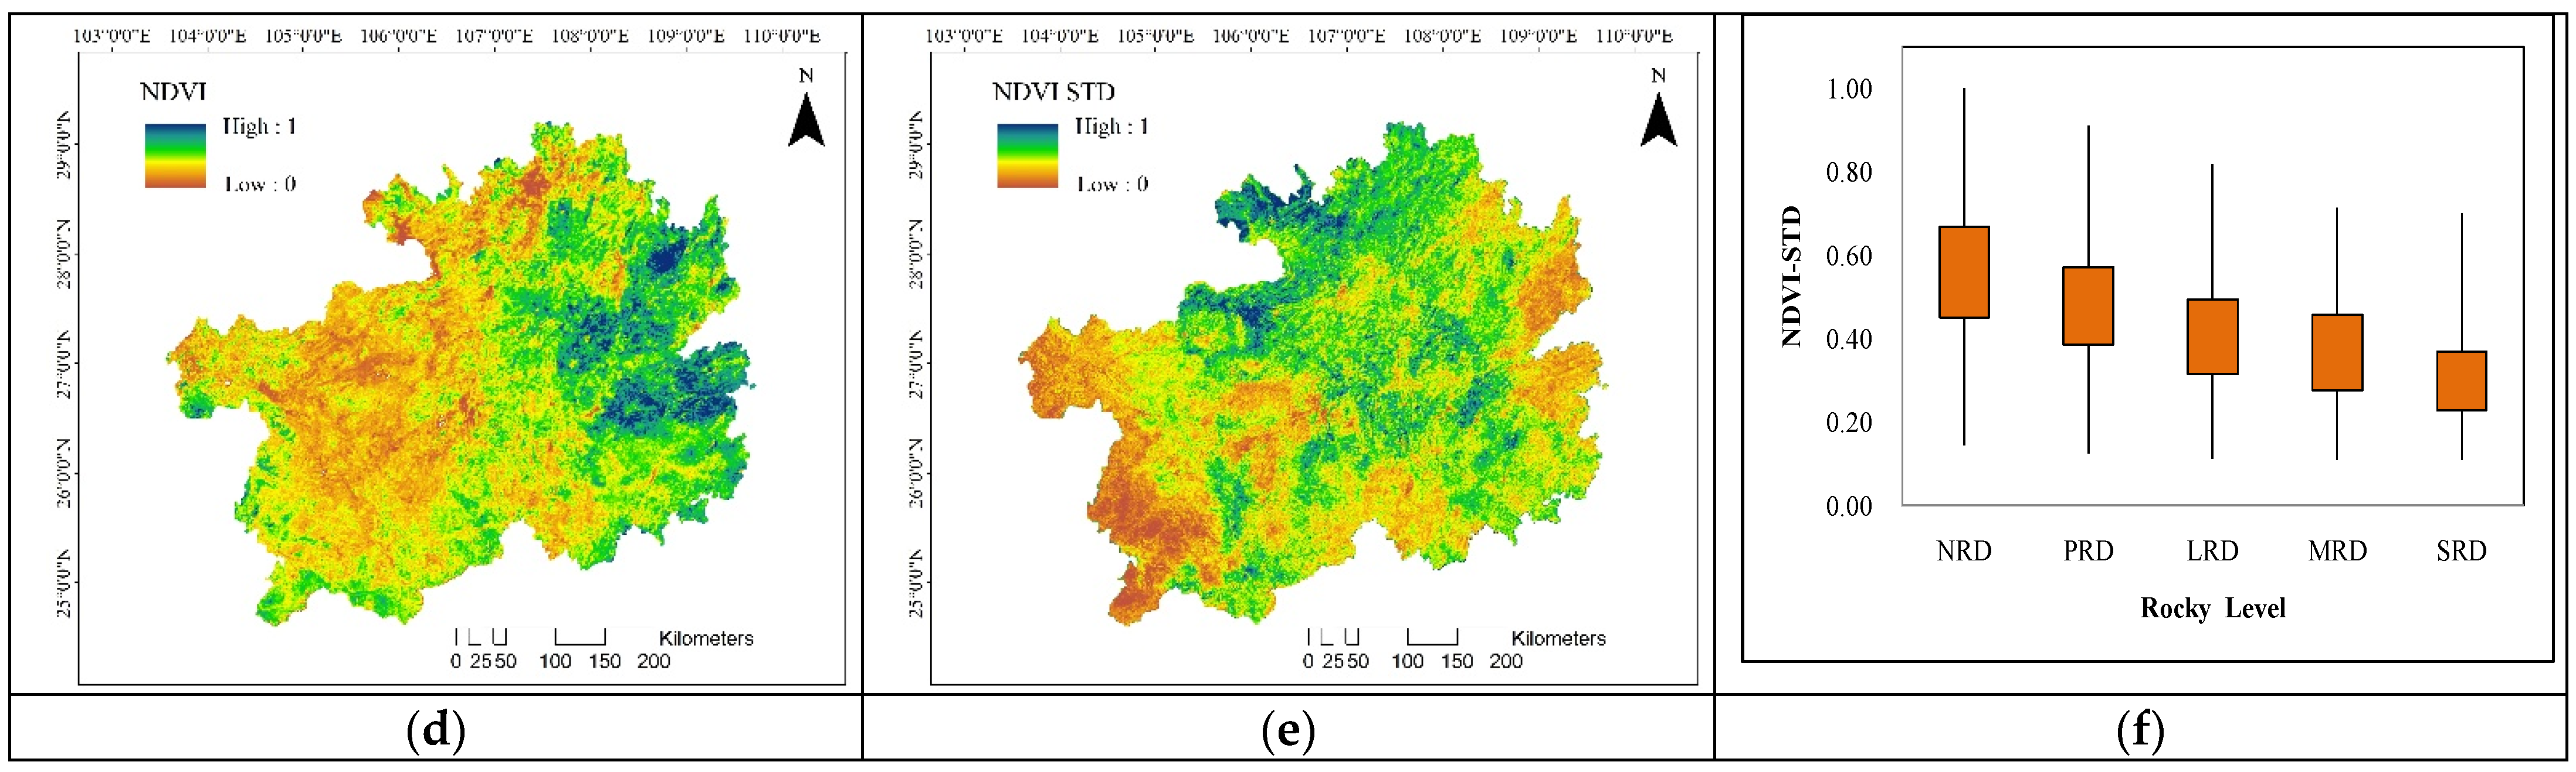
The NDVI is an important index that reflects the growth of vegetation. There was less growth of vegetation in rocky desertification areas and less fluctuation in NDVI in the four seasons. Due to the growth of vegetation in summer and its withering in winter, the NDVI of slight rocky desertification or non-karst areas was different in the four seasons, especially for deciduous broad-leaved forest. Therefore, the change in NDVI in the four seasons was an effective method to improve the classification accuracy of rocky desertification. First, the NDVI indexes of the four seasons, spring (March to May), summer (June to August), autumn (September to November), and winter (December to February), were extracted using the mean synthesis method. Then, the standard deviation of NDVI (NDVI-STD) was calculated and normalized. The result is shown in Figure 10. Finally, the piecewise model (PM) was built based on samples according to the different NDVI-STD values.
4.3.4. Optimizing the Model by Integrating the Seasonal Phase and Vegetation Height
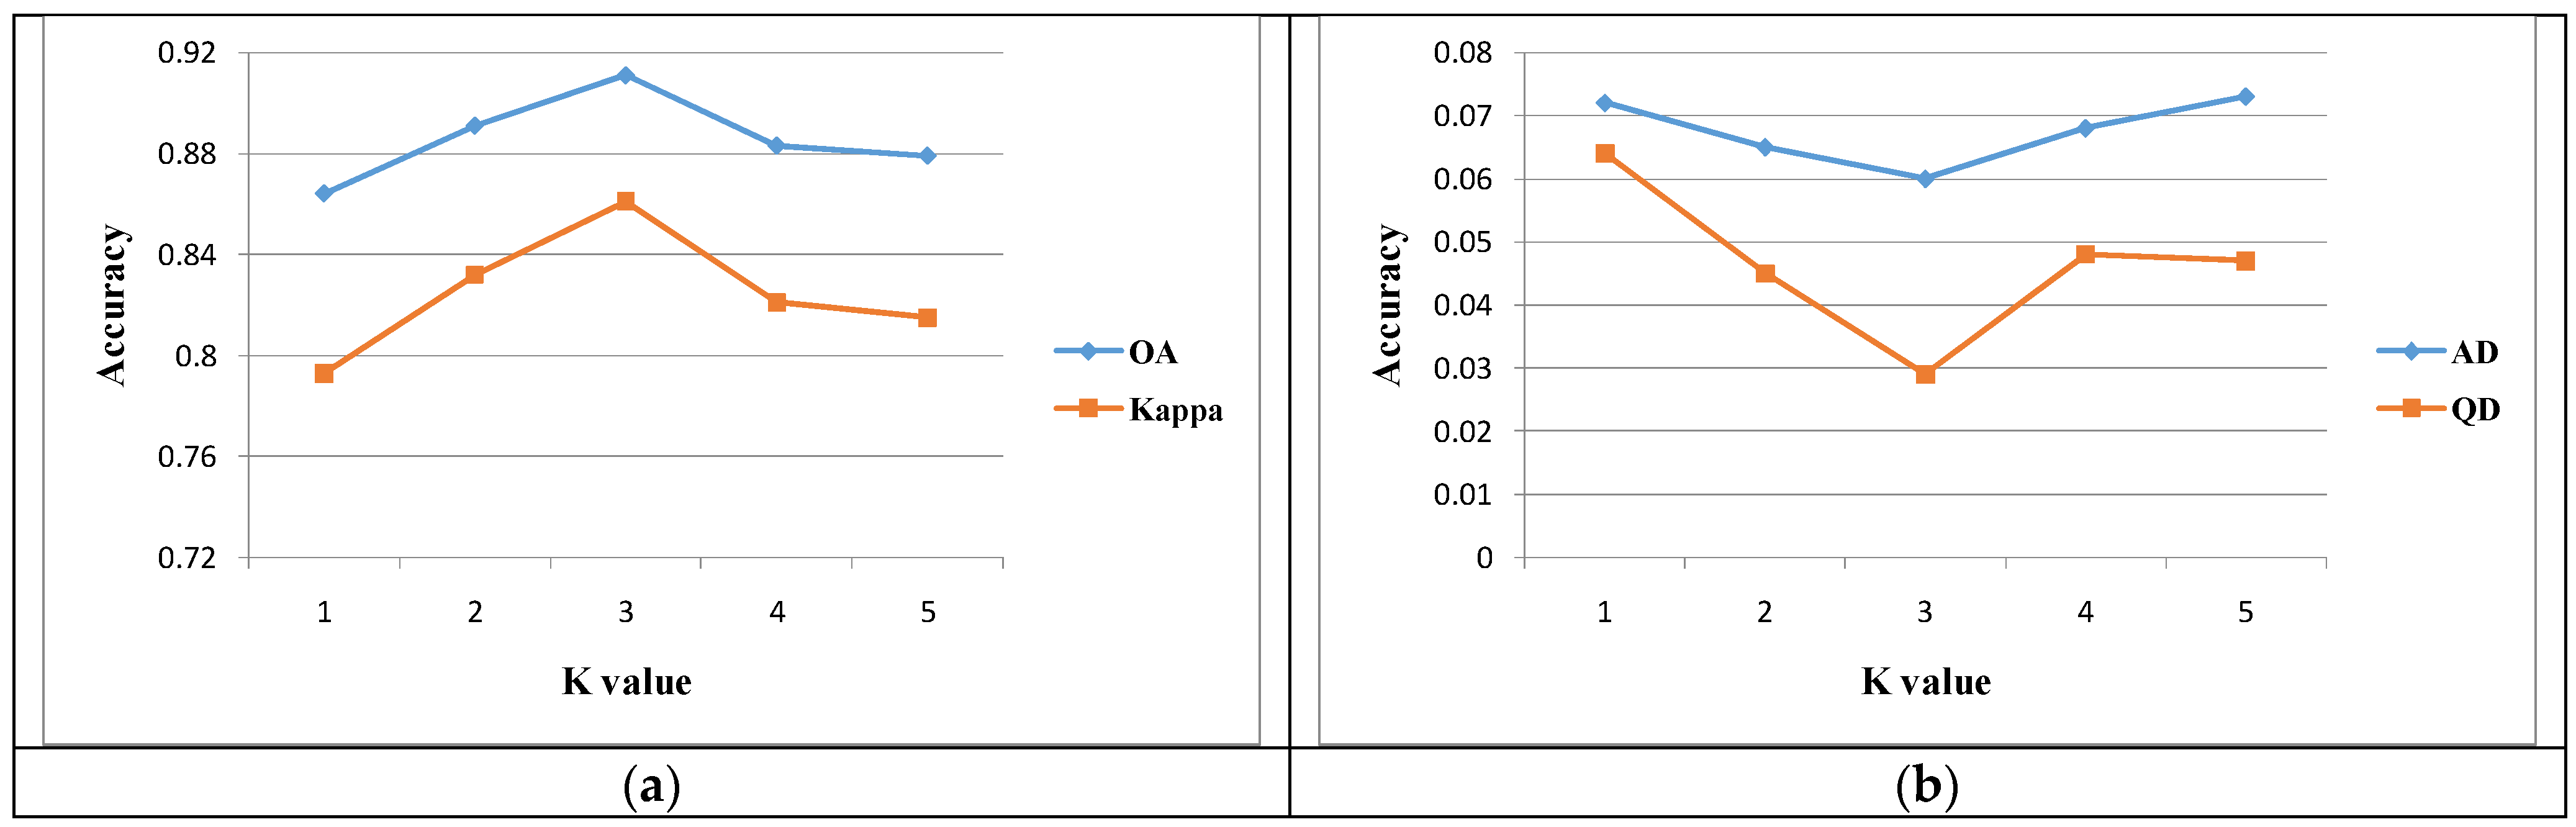
The samples were divided into two groups according to the difference in vegetation vertical height and then the NDVI-STD was integrated into the seasonal data to further subdivide the modeling; that is, CM and PM were fused, which is defined as the CPM method in this paper. K-means clustering was used to determine the number of NDVI-STD segments. Through experimental analysis, when the number of segments was three, the accuracy of the model was the highest, as shown in Figure 11.
Therefore, the original samples were modeled separately after the differences in seasonal time and vegetation vertical height were fused by the CPM method. The results are shown in Table 5 and Table 6, where the total accuracy of classification was91.1% and the Kappa coefficient was0.861, which were10.5% and 0.154 higher than the basic SVM model, respectively, and 4.7% and 0.068 higher than the CM method, respectively, only considering the difference in vegetation vertical height.
The QD and AD was0.029 and 0.060 in CPM model, which were0.042 and 0.063 lower than the basic SVM model, and 0.035 and 0.012 lower than the CM method.
4.4. Analysis of Spatiotemporal Change in Rocky Desertification
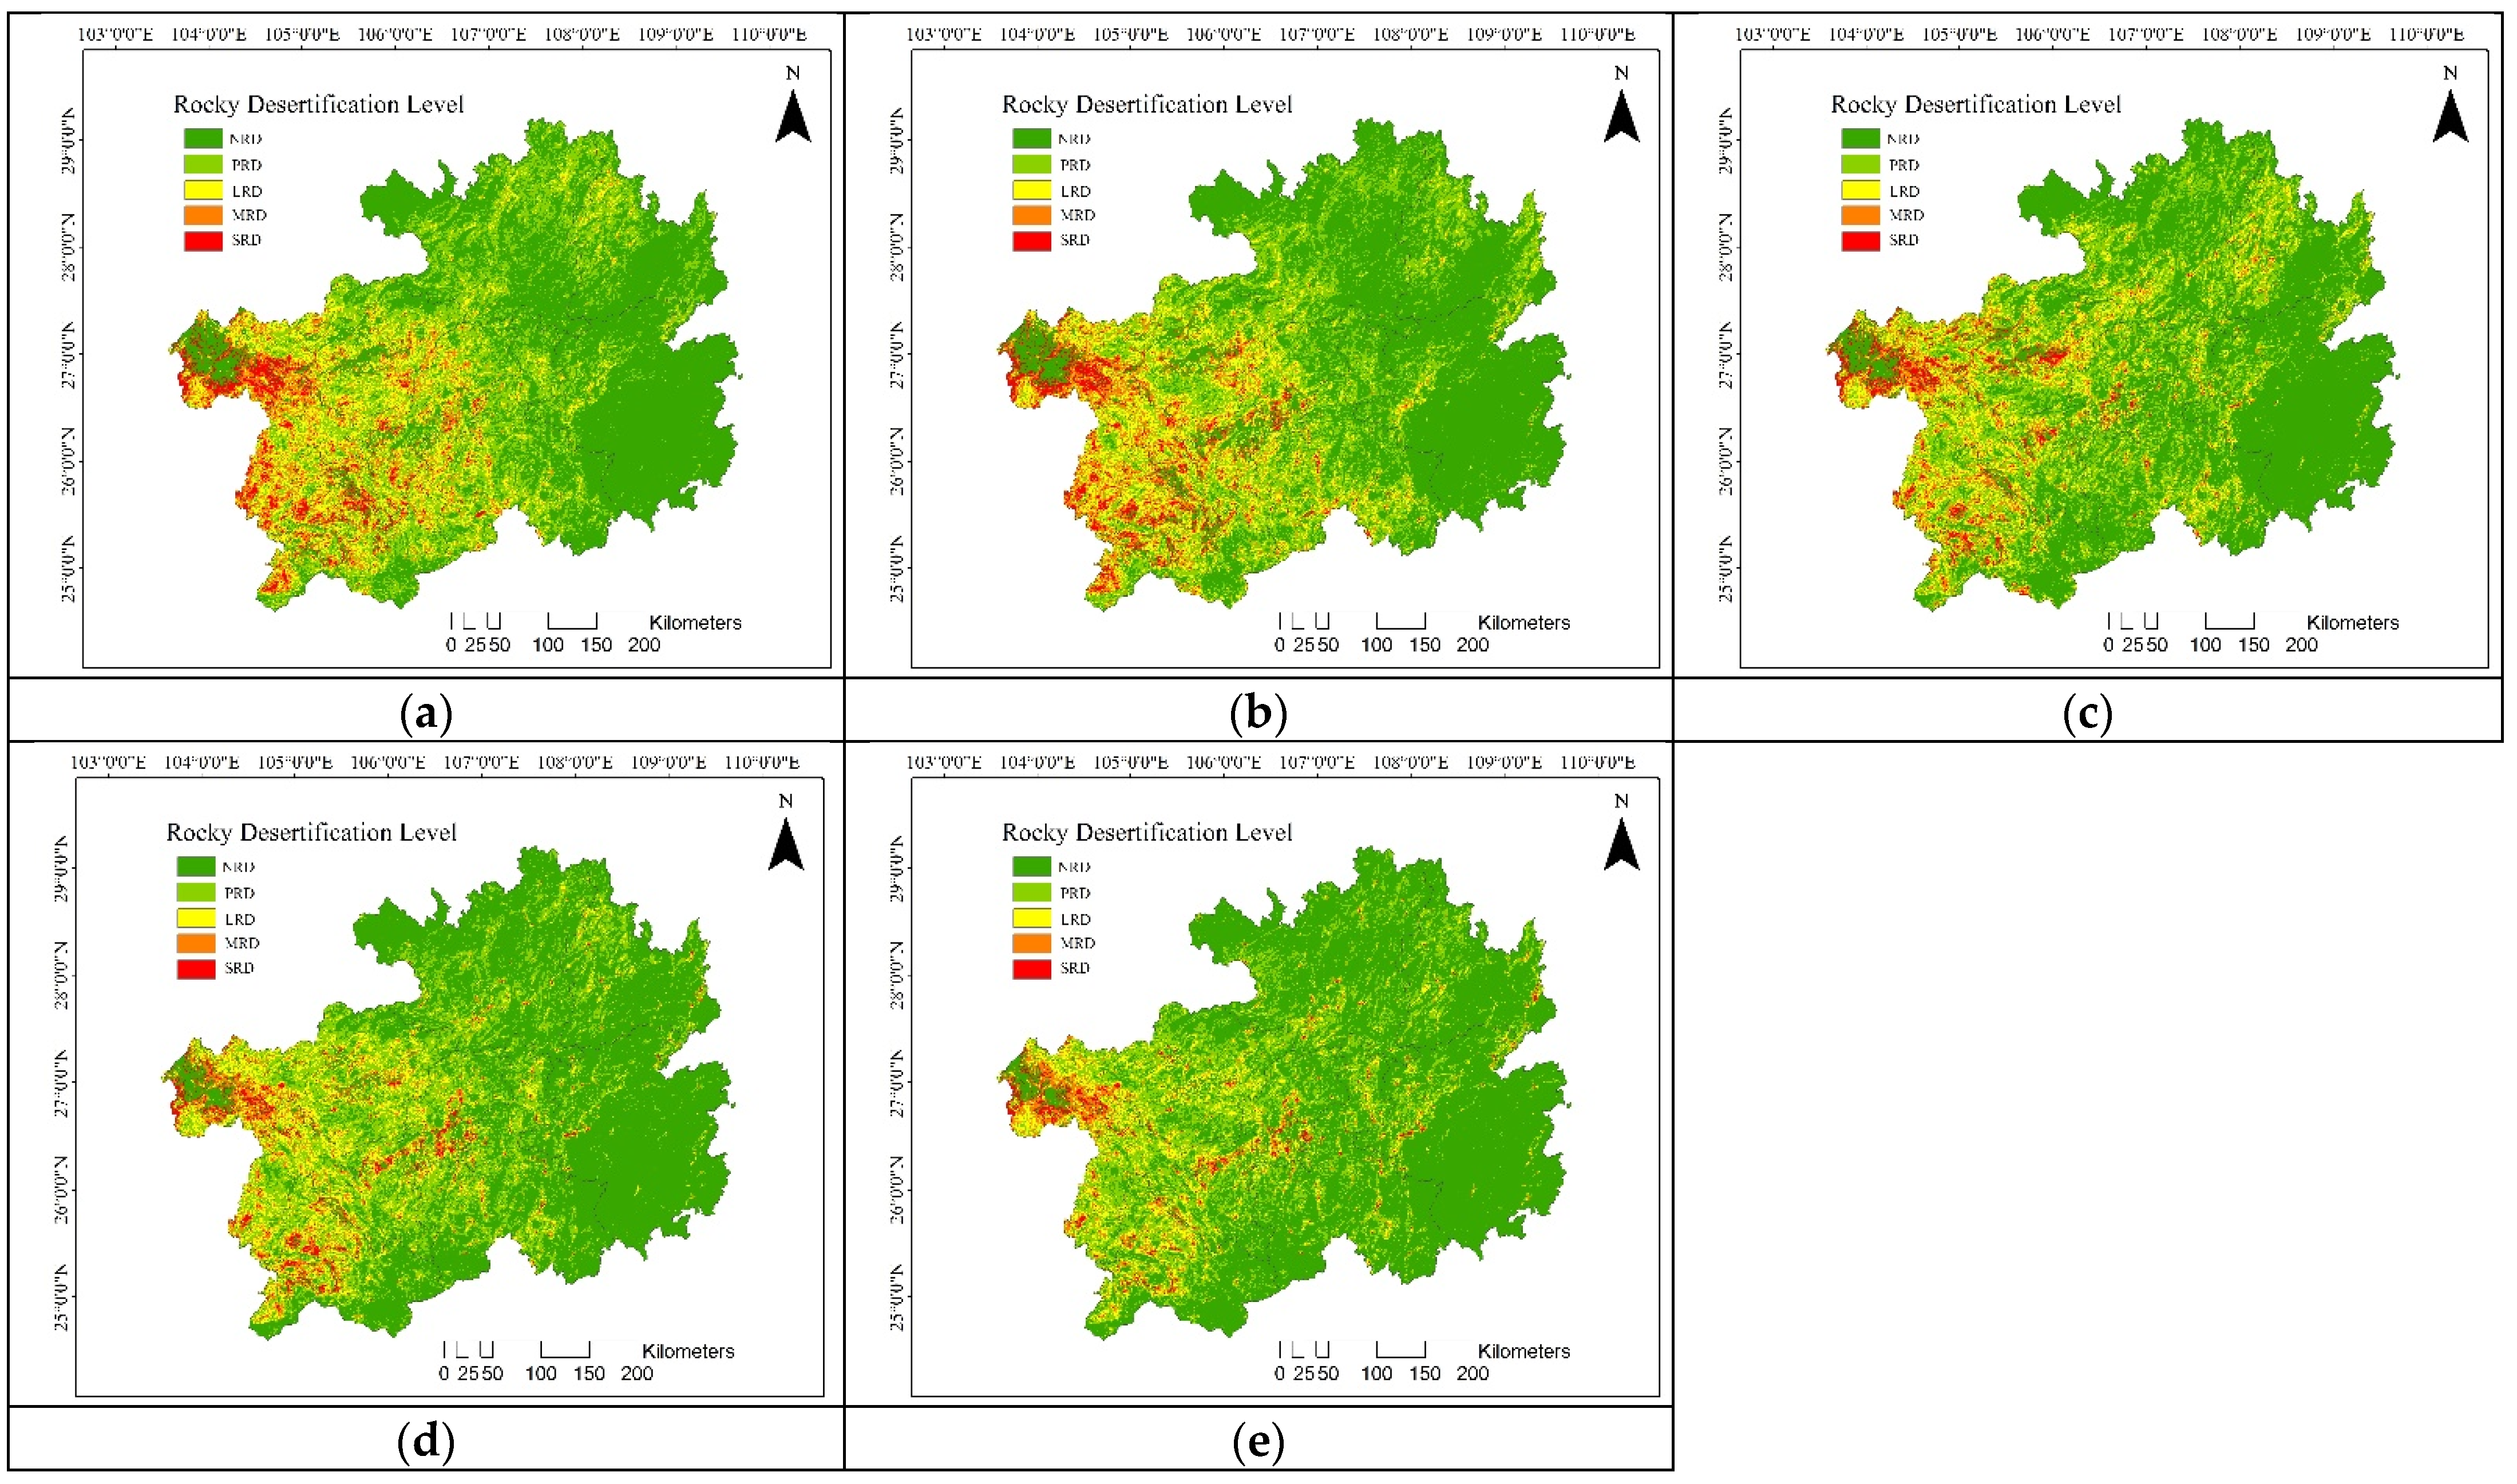
The MODIS multisource data and NFCI data in 2010 were used to build the rocky desertification monitoring model. The results showed that the rocky desertification monitoring model integrating vegetation height type and seasonal phase performed the best. The model was used to monitor and analyze the rocky desertification in Guizhou in the last 20 years and to explore the temporal and spatial variation in rocky desertification in this area. We chose the years 2001, 2005, 2010, 2015, and 2019 for monitoring. The results are shown in Figure 12.
Guizhou has a total area of 176,167 km2. Combining Figure 11 and Table 7, the rocky desertification state in Guizhou presents a spatial distribution pattern of being heavy in the west and south and being light in the east and north. The area of severe rocky desertification in Guizhou decreased each year from 5.391 × 10³ km2 in 2001 to 2.325 × 10³ km2 in 2019; the proportion decreased from 3.06% to 1.32%, with an average annual decrease of 170.30 km2. The area of medium rocky desertification decreased slowly from 13.565 × 10³ to 13.318 × 10³ km2 before 2005; after 2005, the decline rate increased to 6.888 × 10³ km2 in 2019 for an average annual decrease of 370.93 km2. The area of slight rocky desertification continued to decrease from 24.880 × 10³ km2 in 2001 to 14.939 × 10³ km2 in 2019, and the proportion decreased from 14.05% to 8.48%, for an annual decrease of 545.14 km2. The potential rocky desertification area decreased steadily from 46.385 × 10³ km2 in 2001 to 41.012 × 10³ km2 in 2019; the proportion decreased from 26.33% to 23.28%, with an average annual decrease of 298.51 km2. The non-rocky desertification area increased from 86.075 × 10³ km2 in 2001 to 111.003 × 10³ km2 in 2019 and the proportion increased from 48.86% to 63.01%, for an average annual increase of 1384.87 km2.
We concluded from the previous analysis that the trend in the amount of severe rocky desertification was first stable and then gradually decreased; moderate rocky desertification was first stable and then gradually decreased; mild rocky desertification was first stable and then gradually decreased; potential rocky desertification and non-rocky desertification increased each year. Severe rocky desertification was mainly distributed in Bijie in the northwest, Liupanshui in the west, Southwest Guizhou, and Anshun in the southwest. The degree of rocky desertification in these areas was more severe than in other areas. The terrain slope of these areas was higher and more soil erosion occurred. The non-desertification area was mainly distributed in Southeast Guizhou and Zunyi because these areas were mostly non-karst areas and had geothermal conditions, superior forest growth conditions, and a healthy forest ecological environment.
5. Discussion
Rocky desertification monitoring can provide reliable data support for precise rocky desertification control and ecological restoration. The accuracy of rocky desertification monitoring depends on the accuracy of the model and reliable samples and an efficient model algorithm to help improve the quality of the rocky desertification monitoring. In most previous studies, models were constructed using factors such as FVC, RE, and slope, with weight analysis and cumulative calculation, which were then classified; these models produced low rocky desertification monitoring and classification accuracy. In this study, different vegetation heights and vegetation seasonal phases were fused to build a nonlinear machine learning model based on sufficient ground truth and multisource remote sensing data, so the accuracy of our proposed model was higher.
5.1. Effects of Different Vegetation Types on Rocky Desertification Monitoring
The difference in vegetation heights was considered in the optimization of our rocky desertification estimation model. As a result, the accuracy of the estimation model was significantly increased, from 80.6% to 86.4%, and the Kappa coefficient was improved from 0.707 to 0.793. This shows that the different vertical heights of vegetation had a close relationship with rocky desertification in this study. The average vegetation heights of different grades of rocky desertification areas (especially the difference between the non-karst and the karst rocky desertification areas) were obviously different. The soil conditions were good and the possibility of rocky desertification was relatively low in areas with high vegetation growth. Vegetation rarely grows into tall and dense trees in karst rocky desertification areas; even if some vegetation cover is present, it is mainly composed of small shrubs or grass. However, the difference in the spectral characteristics between low shrubs and medium and high trees in the images was low; that is, the different ground objects had the same spectrum, which affects the accuracy of the rocky desertification estimation model.
In this study, land cover type was divided into three categories in the model. The first type included the categories of farmland, buildings, and water, which were removed before modeling because they did not occur in rocky desertification areas. However, if not removed, the buildings and terraces in high-altitude areas are often misjudged as rocky desertification areas, which affects the accuracy of the model. The second type included dwarf shrub and grassland, i.e., low-level vegetation. Due to the poor soil and water conditions in rocky desertification areas, shrubs, mosses, and herbaceous vegetation easily grow on the rock surfaces or crevices. The third type included tall arbor forest land, i.e., high-level vegetation. These areas have fertile soil and good water and soil conditions, so rocky desertification does not easily occur. This vegetation type division modeling can avoid rocky desertification misjudgment, i.e., the problem of different objects having the same spectrum.
Although there were enough samples in the original sample data, there were not enough sample points of extremely severe rocky desertification. Therefore, the severe rocky desertification and extremely severe rocky desertification were combined in the rocky desertification model. In future research, we will attempt the accurate discrimination of severe and extremely severe rocky desertification using the sample equilibrium method. Limited by the unbalanced number of original samples, the vegetation types were divided into two levels, high and low, according to the difference in the vertical height of vegetation growth in this study. This classification method is rough and does not consider the more precise division of vertical height of grassland, shrub, coniferous forest, broad-leaved forest, and other vegetation. More samples will be obtained to achieve more precise differentiation of vegetation types in future research to improve the accuracy of rocky desertification estimation.
5.2. Effects of Seasonal and Temporal Differences on Rocky Desertification Monitoring
In rocky desertification areas, vegetation growth was worse, the vegetation index was low, and the difference in different season phases was minimal, especially in moderate and severe rocky desertification areas. The soil nutrients were better in the non-rocky desertification area, the vegetation growth conditions were better, and, generally, there were medium and tall trees. Therefore, the vegetation index of these sample areas was higher and the differences in the seasonal phases in deciduous forest areas were obvious. The accuracy of the rocky desertification monitoring model was effectively improved by incorporating the seasonal differences in the vegetation index. The standard deviation of the vegetation index in the four seasons was calculated and used as the basis for further classification modeling in this study, which improved the accuracy of the rocky desertification monitoring model from 86.4% to 91.1%, and the Kappa coefficient was improved from 0.793 to 0.861. Xu et al. [63] used SVM to classify rocky desertification areas and the results showed that the overall accuracy in Liujiang county was 85.50% and the Kappa coefficient was 0.81; the overall accuracy in Changshun county was 84.0% and the Kappa coefficient was 0.79; the overall accuracy in Zhenyuan County was 84.46% and the Kappa coefficient was 0.81.
Since satellite remote sensing data are vulnerable to cloud interference, it is often necessary to synthesize multiphase data to obtain the complete satellite data of a study area. Therefore, we divided it into four seasons, spring, summer, autumn, and winter, to calculate the seasonal temporal vegetation index, and each season had six periods of data synthesis to ensure that the data were basically free from cloud interference. However, there may be some errors in using only four groups of data (spring, summer, autumn, and winter) to determine the change in the vegetation index over a year. In the future, the data filling method for areas with cloud interference will be researched and more groups of data will be used to express the temporal differences of samples in a year in order to improve the accuracy of temporal data and to improve the accuracy of the rocky desertification monitoring model.
In addition, we only used the seasonal temporal data as the basis of classification modeling and errors may have occurred in distinguishing evergreen forest land and rocky desertification areas. The seasonal temporal differences and the vegetation index characteristics of the samples will be combined as the basis of classification modeling to optimize the estimation model of rocky desertification in future research.
5.3. Mixed Pixels and Scale Effect
Scale effect is an important factor that affects the rocky desertification monitoring model. We tried to reduce the error caused by the scale effect in the following three aspects:
5.3.1. Ground Survey Data
NFCI data were used as the ground-measured data of the rocky desertification monitoring model in this study. The size of the sample survey area was 25.8m × 25.8 m, but the recorded rocky desertification grade data were not only based on the size of survey area; we conducted a comprehensive evaluation of the rocky desertification around the survey area. Therefore, the ground survey data were reliable in this study.
5.3.2. MODIS Data
Affected by the lithology, structure, and human activities, the distribution of rocky desertification had obvious regionality and most of them were contiguous. The average area of rocky desertification patches is 0.45 km2; the resolution is about 212 m [64,65]. The original spatial resolution of the MODIS satellite remote sensing data used in this paper ranged from 250 to 1000 m. In the research process, the resolution was unified to 250 m using the resampling method, which was basically consistent with the spatial distribution characteristics of rocky desertification.
5.3.3. Google Earth Engine
Google Earth high-definition image data were used for visual interpretation assistance and each grade of the rocky desertification samples was randomly selected for visual interpretation in this study. We selected rocky desertification in Guizhou as the research object and used MODIS images as research data. This met our research needs under the 250 m resolution standard. Based on the above three aspects, the error of the scale effect of the data used in this study was low and the research results were reliable. Instrument stability, light saturation imaging, and shadows in optical sensors may also have caused problems, so SAR data can be integrated to compensate for the shortcomings of optical images in future research. The fusion of high-resolution remote sensing images (such as Landsat) and MODIS images not only retained the advantages of the temporal resolution of MODIS data but also had the advantages of medium to high spatial resolution, which met the accuracy requirements of different-scaled research better.
5.4. Spatial Distribution Characteristics of Rocky Desertification
The MODIS and ground survey data of 2010 were used for modeling in this study. After accuracy verification, the model was extended to other years and we obtained results for a 2001–2019 rocky desertification time series. The model was able to accurately extract the spatiotemporal variation pattern in rocky desertification, which will help the government to implement projects such as precise rocky desertification control and ecological restoration.
Due to the complex interactions between the different levels of rocky desertification, each area presents changes in its characteristics, so the evaluation of the overall changes in rocky desertification cannot be judged by the change in a single rocky desertification level area but should synthesize the change characteristics of each level of rocky desertification. The total area of rocky desertification is decreasing and the overall level is generally weakening due to natural restoration and the implementation of various ecological projects, especially the rocky desertification special project. However, steep slope reclamation and overgrazing are still occurring in a few areas, which are creating new rocky desertification areas. The degree of rocky desertification is different in different areas in Guizhou. The areas with severe rocky desertification are mainly distributed in the west and south of Guizhou, while the degree of rocky desertification is lower in the east and north. This is closely related to the geographical environment and the intensity of local rocky desertification control. The degree of rocky desertification continued developing in a good direction in Guizhou from 2001 to 2019: the proportion of rocky desertification in all levels showed a downward trend and the area of non-rocky desertification area continued to increase.
The spatial distribution characteristics of rocky desertification in Guizhou are obvious, showing a spatial pattern of being heavy in the west, light in the east, heavy in the south, and light in the north. This is consistent with the conclusion of previous studies [39,63]. Each grade of rocky desertification is mainly transforming to non-rocky desertification and potential rocky desertification, and the transformation area of mild, moderate, and severe rocky desertification is relatively small, which is consistent with the results of Zhao and Bai [27,39,66]. In 2010, the area of severe rocky desertification was 4228.008 km2, accounting for 2.4% of the whole province; the area of moderate rocky desertification was 10,570.02 km2, accounting for 6% of the whole province; the area of slight rocky desertification was 21,140.04 km2, accounting for 6% of the whole province; the potential rocky desertification area was 45,803.42 km2, accounting for 26% of the whole province; the area of non-rocky desertification was 94,425.512 km2, accounting for 53.6% of the whole province. These results are similar to those of Wang et al. [67]. The model results in 2005 and 2015 were compared with the NFCI data in the same year, and the overall accuracy was more than 90%, indicating that the proposed rocky desertification monitoring model was reliable. Although the visual interpretation was conducted in 2001 and 2019, there may be some deviations due to the lack of ground survey data. However, the accuracy of MODIS remote sensing data quantitative processing was high and this difference might be small, which needs further verification in the future.
6. Conclusions
The MODIS data were used to extract vegetation coverage and bare bedrock rate. Vegetation seasonal phase data and vertical height difference data were fused in this study. Based on the NFCI data, rocky desertification classification models were built using a logical linear model, a random forest model, and a support vector machine model. Mapping of rocky desertification using multisource remote sensing data were conducted in Guizhou. By introducing vegetation types and seasonal changes, the results have shown that the optimized SVM rocky desertification monitoring model was the most accurate, with an overall classification accuracy of 91.1%, kappa coefficient of 0.861, AD value of 0.060, and QD of 0.029. The degree of rocky desertification in Guizhou was significantly reduced and the total proportion areas of LRD, MRD, and SRD have decreased from 24.86% to 15.2% from 2001 to 2019.
In this study, MODIS data was used to generate the rocky desertification level map at 250 m resolution, which was consistent with the continuous distribution scale of rocky desertification in nature, though there may still be mixed pixels [68]. In the future, more attention should be paid on the mixture pixel problem by using the linear spectral unmixing method to further improve the performance of the rocky desertification mapping. With the rapid development of high resolution remote sensing, a high resolution optical and SAR image can be integrated in the future research, and more state-of-the-art methods, such as deep learning algorithm, can be used to further improve the spatial resolution and accuracy of the rocky desertification mapping [69,70]. In addition, the future study will explore the temporal and spatial pattern change of rocky desertification from the aspects of transferring area and transferring rate [15]. The driving-force analysis of the rocky desertification level will also be conducted, so as to provide scientific decision support for the making of ecological protection planning [69,70,71,72].
Author Contributions
Conceptualization, C.Q., H.Q., and M.L.; data curation: C.Q., H.Q., and F.W.; formal analysis: C.Q. and M.L.; funding acquisition: M.L.; investigation: C.Q. and M.L.; methodology: C.Q. and M.L.; project administration: C.Q. and M.L.; resources: M.L.; software: C.Q. and H.Q.; supervision: M.L.; validation: C.Q., M.L.; visualization: C.Q., H.Q., and F.W; writing original draft: C.Q.; writing review and editing: C.Q. and H.Q. All authors have read and agreed to the published version of the manuscript.
Funding
This research was funded by the National Natural Science Foundation of China, grant number 31770679,and supported by the Overseas Research Program of Jiangsu Universities.
Data Availability Statement
Both the statistical table of the inventory data and the rocky desertification classification data are freely available at http://0-doi-org.brum.beds.ac.uk/10.5281/zenodo.5102744 (accessed on 18 July 2021).
Conflicts of Interest
The authors declare no conflict of interest. The founding sponsors had no role in the design of the study; in the collection, analyses or interpretation of data; in the writing of the manuscript; nor in the decision to publish the results.
References
- Reynolds, J.F.; Stafford Smith, D.M.; Lambin, E.F.; Turner, B.L.; Mortimore, M.; Batterbury, S.P.J.; Downing, T.E.; Dowlatabadi, H.; Fernandez, R.J.; Herrick, J.E.; et al. Global desertification: Building a science for dryland development. Science 2007, 316, 847–851. [Google Scholar] [CrossRef] [Green Version]
- Zhang, J.Y.; Dai, M.H.; Wang, L.C.; Zeng, C.F.; Su, W.C. The challenge and future of rocky desertification control in karst areas in southwest China. Solid Earth 2016, 7, 83–91. [Google Scholar] [CrossRef] [Green Version]
- Zhang, M.; Wang, K.; Liu, H.; Zhang, C.; Wang, J.; Yue, Y.; Qi, X. How ecological restoration alters ecosystem services: An analysis of vegetation carbon sequestration in the karst area of northwest Guangxi, China. Environ. Earth Sci. 2015, 74, 5307–5317. [Google Scholar] [CrossRef]
- Zhao, Y.; Han, R.; Cui, N.; Yang, J.; Guo, L. The Impact of Urbanization on Ecosystem Health in Typical Karst Areas: A Case Study of Liupanshui City, China. Int. J. Environ. Res. Public Health 2021, 18, 93. [Google Scholar] [CrossRef]
- Wang, S.J.; Li, R.L.; Sun, C.X.; Zhang, D.F.; Li, F.Q.; Zhou, D.Q.; Xiong, K.N.; Zhou, Z.F. How types of carbonate rock assemblages constrain the distribution of karst rocky desertified land in Guizhou Province, PR China: Phenomena and mechanisms. Land Degrad. Dev. 2004, 15, 123–131. [Google Scholar] [CrossRef]
- Xiong, Y.J.; Qiu, G.Y.; Mo, D.K.; Lin, H.; Sun, H.; Wang, Q.X.; Zhao, S.H.; Yin, J. Rocky desertification and its causes in karst areas: A case study in Yongshun County, Hunan Province, China. Environ. Geol. 2009, 57, 1481–1488. [Google Scholar] [CrossRef]
- Yuan, D.X. Innovation in the field of karst resources and environment in China. Carsologica Sin. 2015, 34, 98–100. [Google Scholar]
- Chen, Y.H.; Xiong, K.N.; Chi, Y.K. Progress of karst rocky desertification control in South China. Jiangsu Agric. Sci. 2019, 47, 17–21. [Google Scholar]
- Luo, X.L.; Wang, S.J.; Bai, X.Y.; Tan, Q.; Rang, C.; Chen, H.; Xi, H.P.; Chen, F.; Cao, Y.; Wu, L.H. Spatiotemporal evolution of rocky desertification in karst area of Southwest China. Acta Ecol. Sin. 2021, 41, 680–693. [Google Scholar]
- Rang, C.; Bai, X.; Tan, Q.; Luo, X.; Chen, H.; Xi, H. Response of the landscape pattern of rocky desertification to land use change in Typical Karst Area. Acta Ecol. Sin. 2018, 38, 8901–8910. [Google Scholar]
- Tang, J.; Tang, X.; Qin, Y.; He, Q.; Yi, Y.; Ji, Z. Karst rocky desertification progress: Soil calcium as a possible driving force. Sci. Total Environ. 2019, 649, 1250–1259. [Google Scholar] [CrossRef] [PubMed]
- Xiao, J.Y.; Wang, S.J.; Bai, X.Y.; Zhou, D.Q.; Tian, Y.C.; Li, Q.; Qian, Q.Q.; Chen, F.; Zeng, C. Temporal and spatial changes of vegetation in key karst zones and its driving factors. Acta Ecol. Sin. 2018, 38, 8799–8812. [Google Scholar]
- Jiang, Z.; Lian, Y.; Qin, X. Rocky desertification in Southwest China: Impacts, causes, and restoration. Earth-Sci. Rev. 2014, 132, 1–12. [Google Scholar] [CrossRef]
- Ying, B.; Xiao, S.Z.; Xiong, K.N.; Cheng, Q.W.; Luo, J.S. Comparative studies of the distribution characteristics of rocky desertification and land use/land cover classes in typical areas of Guizhou province, China. Environ. Earth Sci. 2014, 71, 631–645. [Google Scholar] [CrossRef]
- Chen, F.; Wang, S.; Bai, X.; Liu, F.; Zhou, D.; Tian, Y.; Luo, G.; Li, Q.; Wu, L. Assessing spatial-temporal evolution processes and driving forces of karst rocky desertification. Geocarto Int. 2021, 36, 262–280. [Google Scholar] [CrossRef]
- Kim, J.W.; Lu, Z.; Kaufmann, J. Evolution of sinkholes over Wink, Texas, observed by high-resolution optical, and SAR imagery. Remote Sens. Environ. 2019, 222, 119–132. [Google Scholar] [CrossRef]
- Yin, C.; Zhou, Z.F.; Tan, W.Y.; Wang, P.; Feng, Q. Inversion model of soil profile moisture content in rocky desertification area based on microwave and optical remote sensing. J. Infrared Millim. Waves 2018, 37, 360–370. [Google Scholar] [CrossRef]
- Zhang, M.; Wang, K.; Zhang, C.; Chen, H.; Liu, H.; Yue, Y.; Luffman, I.; Qi, X. Using the radial basis function network model to assess rocky desertification in northwest Guangxi, China. Environ. Earth Sci. 2011, 62, 69–76. [Google Scholar] [CrossRef]
- Wei, H.; Wang, J.; Cheng, K.; Li, G.; Ochir, A.; Davaasuren, D.; Chonokhuu, S. Desertification Information Extraction Based on Feature Space Combinations on the Mongolian Plateau. Remote Sens. 2018, 10, 1614. [Google Scholar] [CrossRef] [Green Version]
- Dou, H.; Zhen, L.; Li, H. Spatial distribution characteristics of rocky desertification in Qiandongnan Prefecture of Guizhou Province. J. Resour. Ecol. 2017, 8, 422–432. [Google Scholar]
- Mokhtar, A.; He, H.; Alsafadi, K.; Li, Y.; Zhao, H.; Keo, S.; Bai, C.; Abuarab, M.; Zhang, C.; Elbagoury, K.; et al. Evapotranspiration as a response to climate variability and ecosystem changes in southwest, China. Environ. Earth Sci. 2020, 79, 312. [Google Scholar] [CrossRef]
- Deng, Y.; Wang, S.; Bai, X.; Tian, Y.; Wu, L.; Xiao, J.; Chen, F.; Qian, Q.J. Relationship among land surface temperature and LUCC, NDVI in typical karst area. Sci. Rep. 2018, 8, 641. [Google Scholar] [CrossRef]
- Zhang, Z.; Huang, X.; Zhou, Y. Factors influencing the evolution of human-driven rocky desertification in karst areas. Land Degrad. Dev. 2021, 32, 817–829. [Google Scholar] [CrossRef]
- Li, R.; Wang, S.; Xiong, K.; Zhou, D. Correlation between Rocky Desertification and Slope Degree in Karst Area of Guizhou. Bull. Soil Water Conserv. 2006, 4, 82–86. [Google Scholar]
- Su, C.; Yue, T.; Jiang, L.; Li, X.; Wang, W. Karst Rocky Desertification Information Extraction Based on the Decision Tree. Int. Arch. Photogramm. Remote Sens. Spat. Inf. Sci. 2020, 42, 367–373. [Google Scholar] [CrossRef] [Green Version]
- You, H. Orienting rocky desertification towards sustainable land use: An advanced remote sensing tool to guide the conservation policy. Land Use Policy 2017, 61, 171–184. [Google Scholar] [CrossRef]
- Zhao, L.P. Spatiotemporal Evolution Characteristics of Rocky Desertification in Karst Area Based on MODIS Data. Master’s Thesis, China University of Geosciences, Beijing, China, 2015. [Google Scholar]
- Zhang, J.; Liu, M.; Liu, X.; Luo, W.; Wu, L.; Zhu, L. Spectral analysis of seasonal rock and vegetation changes for detecting karst rocky desertification in southwest China. Int. J. Appl. Earth Obs. Geoinf. 2021, 100, 102337. [Google Scholar] [CrossRef]
- Qi, X.; Zhang, C.; Wang, K. Comparing Remote Sensing Methods for Monitoring Karst Rocky Desertification at Sub-pixel Scales in a Highly Heterogeneous Karst Region. Sci. Rep. 2019, 9, 13368. [Google Scholar] [CrossRef] [PubMed] [Green Version]
- Gao, J.; Du, F.; Zuo, L.; Jiang, Y. Integrating ecosystem services and rocky desertification into identification of karst ecological security pattern. Landsc. Ecol. 2020, 36, 2113–2133. [Google Scholar] [CrossRef]
- Yang, Q.; Jiang, Z.; Yuan, D.; Ma, Z.; Xie, Y. Temporal and spatial changes of karst rocky desertification in ecological reconstruction region of Southwest China. Environ. Earth Sci. 2014, 72, 4483–4489. [Google Scholar] [CrossRef]
- Liao, C.; Yue, Y.; Wang, K.; Fensholt, R.; Tong, X.; Brandt, M. Ecological restoration enhances ecosystem health in the karst regions of southwest China. Ecol. Indic. 2018, 90, 416–425. [Google Scholar] [CrossRef]
- Huang, Q.H.; Cai, Y.L.; Xing, X.S. The control of rocky desertification and regional sustainable development in Karst Mountainous Areas in Southwest China. Ambio 2008, 37, 372–374. [Google Scholar] [CrossRef]
- Cheng, A.Y.; Wang, S.J.; Li, Y.B.; Bai, X.Y.; Ni, X.B. Study on the historical evolution of Karst Rocky Desertification in Guizhou Province and its significance. Bull. Soil Water Conserv. 2010, 30, 15–23. [Google Scholar]
- Liu, L.C.; Xiong, K.N.; Luo, Y. Advances in Evaluation of Sustainable Development Capability in Karst Region. Guizhou Agric. Sci. 2012, 40, 67–72. [Google Scholar]
- Yuan, Y.L.; Lian, B.; An, Y.L.; Tang, Y.; Wang, S.J.; Yi, Z.Y. Ecological environment protection and sustainable development in Karst Area. Earth Environ. 2013, 41, 388–397. [Google Scholar]
- Xiong, K.N. A Typical Study on Karst Rocky Desertification Based on Remote Sensing and GIS: A Case Study of Guizhou Province; Geological Publishing House: Beijing, China, 2002; pp. 17–44. [Google Scholar]
- Xiong, K.N.; Liu, L.C.; Luo, Y. The Evaluation Studies Progress and Prospects of Sustainable Development in Rocky Desertification Reegion. Ecol. Econ. 2012, 1, 44–49. [Google Scholar]
- Wu, L.L.; Guan, Y.L.; Li, J.W.; Yuan, C.X.; Li, R. Study on Karst Rocky Desertification Based on MODIS Image—A case study of Guizhou Province. Remote Sens. Land Resour. 2019, 31, 235–242. [Google Scholar]
- Ma, S.B.; Yang, G.B.; An, Y.L.; Zhang, Y.R. Vegetation degradation and attribution in Guizhou Province Based on MODIS NDVI. Carsologica Sin. 2019, 38, 227–232. [Google Scholar]
- Remer, L.A.; Kaufman, Y.J.; Tanre, D.; Mattoo, S.; Chu, D.A.; Martins, J.V.; Li, R.R.; Ichoku, C.; Levy, R.C.; Kleidman, R.G.; et al. The MODIS aerosol algorithm, products, and validation. J. Atmos. Sci. 2005, 62, 947–973. [Google Scholar] [CrossRef] [Green Version]
- Zhong, H.Z.; Xu, X.L.; Zhang, R.F.; Liu, M.X. MODIS-driven estimation of regional evapotranspiration in Karst area of Southwest China based on the Penman-Monteith-Leuning algorithm. J. Appl. Ecol. 2018, 29, 1617–1625. [Google Scholar] [CrossRef]
- Zhu, L.F. Spatiotemporal Variation of Vegetation Coverage and Rocky Desertification Monitoring Based on MODIS Data. Ph.D. Dissertation, Southwest University, Chongqing, China, 2018. [Google Scholar]
- Earth Engine Code Editor. Available online: https://code.earthengine.google.com/ (accessed on 18 January 2021).
- Google Earth Engine. Available online: https://developers.google.com/earth-engine/datasets/catalog/modis (accessed on 18 January 2021).
- Xie, X.K.; Wang, Q.L.; Dai, L.M.; Su, D.K.; Wang, X.C.; Qi, G.; Ye, Y.J. Application of China’s National Forest Continuous Inventory Database. Environ. Manag. 2011, 48, 1095–1106. [Google Scholar] [CrossRef] [PubMed]
- Zeng, W.S.; Erkki, T.; Sean, P.; Klaus, V. The national forest inventory in China: History—Results—International context. For. Ecosyst. 2015, 2, 23. [Google Scholar] [CrossRef] [Green Version]
- Li, C.; Li, M.Y.; Iizuka, K.; Liu, J.; Chen, K.; Li, Y.C. Effects of Forest Canopy Structure on Forest Aboveground Biomass Estimation Using Landsat Imagery. IEEE Access 2020, 9, 5285–5295. [Google Scholar] [CrossRef]
- Forest Resources Management Department. Technical Regulations of National Forest Resources Continuous Inventory; China Forestry Administration: Beijing, China, 2014; pp. 54–86. [Google Scholar]
- Li, Y.B.; Wang, S.J.; Cheng, A.Y.; Li, W.H. Study on evaluation method of regional rocky desertification: A case study of Panxian county. Earth Environ. 2009, 37, 275–279. [Google Scholar]
- MODIS Web. Available online: https://modis.gsfc.nasa.gov/ (accessed on 18 January 2021).
- Li, M.M. Study on Remote Sensing Estimation Method of Vegetation Coverage. Master’s Thesis, Institute of Remote Sensing Applications Chinese Academy of Sciences, Beijing, China, 2003. [Google Scholar]
- Zhang, X.L. Study on Comprehensive Application Technology of Remote Sensing Monitoring of Rocky Desertification in Southeast Yunnan. Master’s Thesis, Kunming University of Science and Technology, Kunming, China, 2013. [Google Scholar]
- Sun, F.D. Dynamic Remote Sensing Monitoring of the Main Lakes in China from 2000 to 2010. Ph.D. Dissertation, Nanjing University, Nanjing, China, 2013. [Google Scholar]
- Zha, Y.; Gao, J.; Ni, S. Use of Normalized Difference Built-up Index in Automatically Mapping Urban Areas from TM Imagery. Int. J. Remote Sens. 2003, 24, 583–594. [Google Scholar] [CrossRef]
- Rogan, J.; Franklin, J.; Roberts, D.A. A Comparison of Methods for Monitoring Multitemporal Vegetation Change Using Thematic Mapper Imagery. Remote Sens. Environ. 2002, 80, 143–156. [Google Scholar] [CrossRef]
- Zhou, Z.H. Machine Learning; Tsinghua University Press: Beijing, China, 2016; pp. 55–87. [Google Scholar]
- Du, P.J. Remote Sensing Multi Classifier Ensemble Method and Its Application; Science Press: Beijing, China, 2019; pp. 35–67. [Google Scholar]
- Wang, Y.Y. Study on the Extraction of Rocky Desertification Information and the Geological Driving Factors Based on Multi-Source Data. Master’s Thesis, Guizhou University, Guizhou, China, 2019. [Google Scholar]
- Pontius, R.G.; Millones, M. Death to Kappa: Birth of quantity disagreement and allocation disagreement for accuracy assessment. Int. J. Remote Sens. 2011, 32, 4407–4429. [Google Scholar] [CrossRef]
- Warrens, M.J. Properties of the quantity disagreement and the allocation disagreement. Int. J. Remote Sens. 2015, 36, 1439–1446. [Google Scholar] [CrossRef]
- Xi, H.P.; Wang, S.J.; Bai, X.Y.; Wu, L.H.; Tang, H.; Chen, F.; Xiao, J.Y.; Wang, M.M.; Cao, Y.; Chen, H.; et al. Spatiotemporal evolution characteristics of rocky desertification in typical karst areas of Southwest China: A case study of Puding county, Guizhou Province. Acta Ecol. Sin. 2018, 38, 8919–8933. [Google Scholar]
- Xu, E.Q. Description of Karst Rocky Desertification Evolution Process and Information Mining Technology; Science Press: Beijing, China, 2020; pp. 45–66. [Google Scholar]
- Li, Y.B.; Li, W.H.; Wang, S.J.; Luo, G.J.; Chen, A.Y. Dynamic behavior characteristics and classification evaluation of rocky desertification patches. Prog. Geogr. 2010, 29, 335–341. [Google Scholar]
- Yan, N.Z.; Li, Y.B. Analysis on the distribution characteristics and influencing factors of rocky desertification landscape pattern—A case study of Pan County, Guizhou Province. Carsologica Sin. 2008, 3, 255–260. [Google Scholar]
- Bai, X.Y.; Wang, S.J.; Chen, Q.W.; Cheng, A.Y.; Ni, X.B. Spatiotemporal evolution and evaluation of rocky desertification types in Guizhou Province. Acta Geogr. Sin. 2009, 64, 609–618. [Google Scholar]
- Wang, P.B.; An, Y.L. Spatial and temporal characteristics of rocky desertification in Guizhou karst area from 2000 to 2010. J. Guizhou Norm. Univ. (Nat. Sci. Ed.) 2014, 32, 10–15, 46. [Google Scholar]
- Xiong, X.; Li, J.H.; Zhang, T.; Wang, S.N.; Huo, W.J. Simulation of coupled transport of soil moisture and heat in a typical karst rocky desertification area, Yunnan Province, Southwest China. Environ. Sci. Pollut. Res. 2021, 28, 4716–4730. [Google Scholar] [CrossRef]
- Fan, Z.; Li, S.; Fang, H.J. Explicitly identifying the desertification change in CMREC area based on multisource remote data. Remote Sens. 2020, 12, 3170. [Google Scholar] [CrossRef]
- Pu, J.; Zhao, X.; Dong, P.; Wang, Q.; Yue, Q.J. Extracting Information on Rocky Desertification from Satellite Images: A Comparative Study. Remote Sens. 2021, 13, 2497. [Google Scholar] [CrossRef]
- Li, L.; Xiong, K.N. Study on peak cluster-depression rocky desertification landscape evolution and human activity-influence in South of China. Eur. J. Remote Sens. 2021, 54, 309–317. [Google Scholar] [CrossRef]
- Wu, X.; Liu, H.; Zhou, T. Human driving forces: Analysis of rocky desertification in karst region in Guanling County, Guizhou Province. Chin. Geogr. Sci. 2011, 21, 92–100. [Google Scholar] [CrossRef]
Figure 1.
Research area and typical samples.

Figure 2.
Workflow of the processing steps in this study. (RE: rock exposure; FVC: fractional vegetation cover; EL: elevation; AD: albedo; NDBI: normalized difference building index; HD: humidity; ET: evapotranspiration; LSTD: land surface temperature difference).
Figure 2.
Workflow of the processing steps in this study. (RE: rock exposure; FVC: fractional vegetation cover; EL: elevation; AD: albedo; NDBI: normalized difference building index; HD: humidity; ET: evapotranspiration; LSTD: land surface temperature difference).

Figure 3.
Cloud recognition. (a) Original image (b) Cloudy identification.

Figure 4.
FVC index. (a) Maximum value combination. (b) Mean value combination. (c) Minimum value combination.
Figure 4.
FVC index. (a) Maximum value combination. (b) Mean value combination. (c) Minimum value combination.

Figure 5.
RE index. (a) Maximum value combination. (b) Mean value combination. (c) Minimum value combination.
Figure 5.
RE index. (a) Maximum value combination. (b) Mean value combination. (c) Minimum value combination.

Figure 6.
Other KRD factors. (a) LSTD. (b) ET. (c) AD. (d) HD. (e) NDBI. (f) EL.

Figure 7.
Factor correlation. (a) Correlation coefficient. (b) p-value.

Figure 8.
Workflow of model improvement.

Figure 9.
Vegetation type at different vertical heights.

Figure 10.
NDVI and NDVI-STD on different seasons. (a) Spring. (b) Summer. (c) Autumn. (d) Winter. (e) Seasonal NDVI-STD. (f) NDVI-STDon rocky level.
Figure 10.
NDVI and NDVI-STD on different seasons. (a) Spring. (b) Summer. (c) Autumn. (d) Winter. (e) Seasonal NDVI-STD. (f) NDVI-STDon rocky level.


Figure 11.
Analysis of K-means clustering results. (a) OA and Kappa. (b) AD and QD.

Figure 12.
Rocky desertification level from 2001 to 2019: (a) 2001, (b) 2005, (c) 2010, (d) 2015, and (e) 2019.
Figure 12.
Rocky desertification level from 2001 to 2019: (a) 2001, (b) 2005, (c) 2010, (d) 2015, and (e) 2019.


Table 1.
Rocky desertification factors.
| Index | Formula | Reference |
|---|---|---|
| FVC | Li, M. M, 2003 [52] | |
| RE | Zhang, X.L, 2013 [53]; Sun, F. D, 2013 [54] | |
| NDBI | Zha, et al., 2003 [55] | |
| LSTD | MOD11A1 | |
| HD | Rogan, J. et al., 2002 [56] | |
| AD | --- | MCD43A3 |
| ET | --- | MOD16A2 |
| EL | --- | DEM |
Table 2.
Rocky desertification model comparation.
| Model | Level | NRD | PRD | LRD | MRD | SRD | Total | UA |
|---|---|---|---|---|---|---|---|---|
| logical linear regression | NRD | 406 | 82 | 41 | 20 | 7 | 556 | 0.730 |
| PRD | 42 | 198 | 23 | 9 | 4 | 276 | 0.717 | |
| LRD | 8 | 9 | 98 | 10 | 3 | 128 | 0.766 | |
| MRD | 3 | 3 | 6 | 52 | 2 | 66 | 0.788 | |
| SRD | 0 | 0 | 1 | 4 | 22 | 27 | 0.815 | |
| Total | 460 | 293 | 170 | 96 | 38 | 1053 | ||
| PA | 0.885 | 0.678 | 0.580 | 0.547 | 0.579 | |||
| random forest | NRD | 427 | 67 | 36 | 18 | 8 | 556 | 0.768 |
| PRD | 30 | 218 | 18 | 6 | 4 | 276 | 0.790 | |
| LRD | 7 | 8 | 105 | 5 | 3 | 128 | 0.820 | |
| MRD | 5 | 3 | 5 | 51 | 2 | 66 | 0.773 | |
| SRD | 1 | 0 | 1 | 3 | 22 | 27 | 0.815 | |
| Total | 470 | 296 | 165 | 83 | 39 | 1053 | ||
| PA | 0.909 | 0.736 | 0.636 | 0.614 | 0.564 | |||
| SVM | NRD | 443 | 62 | 32 | 14 | 5 | 556 | 0.797 |
| PRD | 28 | 219 | 18 | 9 | 2 | 276 | 0.793 | |
| LRD | 7 | 5 | 108 | 5 | 3 | 128 | 0.844 | |
| MRD | 3 | 2 | 3 | 56 | 2 | 66 | 0.848 | |
| SRD | 0 | 1 | 1 | 2 | 23 | 27 | 0.852 | |
| Total | 481 | 289 | 162 | 86 | 35 | 1053 | ||
| PA | 0.921 | 0.758 | 0.667 | 0.651 | 0.657 |
NRD: no rocky desertification, PRD: potential rocky desertification, LRD: light rocky desertification, MRD: middle rocky desertification, SRD: severe rocky desertification, UA: user accuracy, PA: production accuracy.
Table 3.
Rocky desertification classification accuracy comparation.
| Method | OA (Overall Accuracy) | QD (Quantity Disagreement) | AD (Allocation Disagreement) | Kappa |
|---|---|---|---|---|
| LR(Linear Regression) | 0.737 | 0.092 | 0.171 | 0.608 |
| RF(Random Forest) | 0.782 | 0.082 | 0.137 | 0.672 |
| SVM | 0.806 | 0.071 | 0.123 | 0.707 |
Table 4.
Vertical height level.
| Vertical Height Level | Land Cover Type |
|---|---|
| High/Medium trees | Evergreen/deciduous needleleaf/broadleaf forests, and mixed forests |
| Low shrubs | Open/closed shrublands, woody savannas, savannas, grasslands, and croplands/natural vegetation mosaics |
| Other(Masked) | Permanent wetlands, cropland, urban and built-up lands, water bodies, etc. |
Table 5.
The result of rocky desertification based on the seasonal phase and vegetation type.
| Level | NRD | PRD | LRD | MRD | SRD | Total | User Accuracy |
|---|---|---|---|---|---|---|---|
| NRD | 503 | 36 | 10 | 5 | 2 | 556 | 0.901 |
| PRD | 14 | 253 | 5 | 3 | 1 | 276 | 0.917 |
| LRD | 4 | 2 | 121 | 1 | 0 | 128 | 0.945 |
| MRD | 4 | 1 | 2 | 58 | 1 | 66 | 0.879 |
| SRD | 0 | 0 | 1 | 2 | 24 | 27 | 0.889 |
| Total | 525 | 292 | 139 | 69 | 28 | 1053 | 0.911 |
| Production Accuracy | 0.958 | 0.866 | 0.871 | 0.841 | 0.857 |
Table 6.
Accuracy comparation on the improved model.
| Method | OA | QD | AD | Kappa |
|---|---|---|---|---|
| SVM | 0.806 | 0.071 | 0.123 | 0.707 |
| CM (SVM+ vegetation type) | 0.864 | 0.064 | 0.072 | 0.793 |
| CPM (SVM+ vegetation type+ seasonal phase) | 0.911 | 0.029 | 0.060 | 0.861 |
Table 7.
Rocky desertification classification: 2001–2019.
| Year | SRD | MRD | LRD | PRD | NRD | |||||
|---|---|---|---|---|---|---|---|---|---|---|
| Area (103 km2) | Rate (%) | Area (103 km2) | Rate (%) | Area (103 km2) | Rate (%) | Area (103 km2) | Rate (%) | Area (103 km2) | Rate (%) | |
| 2001 | 5.391 | 3.06 | 13.565 | 7.70 | 24.751 | 14.05 | 46.385 | 26.33 | 86.075 | 48.86 |
| 2005 | 5.444 | 3.09 | 13.318 | 7.56 | 22.585 | 12.82 | 43.408 | 24.64 | 91.413 | 51.89 |
| 2010 | 4.263 | 2.42 | 10.517 | 5.97 | 21.246 | 12.06 | 45.698 | 25.94 | 94.443 | 53.61 |
| 2015 | 3.101 | 1.76 | 8.720 | 4.95 | 18.427 | 10.46 | 45.293 | 25.71 | 100.627 | 57.12 |
| 2019 | 2.325 | 1.32 | 6.888 | 3.91 | 14.939 | 8.48 | 41.012 | 23.28 | 111.003 | 63.01 |
Publisher’s Note: MDPI stays neutral with regard to jurisdictional claims in published maps and institutional affiliations. |
© 2021 by the authors. Licensee MDPI, Basel, Switzerland. This article is an open access article distributed under the terms and conditions of the Creative Commons Attribution (CC BY) license (https://creativecommons.org/licenses/by/4.0/).
Share and Cite
MDPI and ACS Style
Qian, C.; Qiang, H.; Wang, F.; Li, M. Optimization of Rocky Desertification Classification Model Based on Vegetation Type and Seasonal Characteristic. Remote Sens. 2021, 13, 2935. https://0-doi-org.brum.beds.ac.uk/10.3390/rs13152935
AMA Style
Qian C, Qiang H, Wang F, Li M. Optimization of Rocky Desertification Classification Model Based on Vegetation Type and Seasonal Characteristic. Remote Sensing. 2021; 13(15):2935. https://0-doi-org.brum.beds.ac.uk/10.3390/rs13152935
Chicago/Turabian StyleQian, Chunhua, Hequn Qiang, Feng Wang, and Mingyang Li. 2021. "Optimization of Rocky Desertification Classification Model Based on Vegetation Type and Seasonal Characteristic" Remote Sensing 13, no. 15: 2935. https://0-doi-org.brum.beds.ac.uk/10.3390/rs13152935
Note that from the first issue of 2016, this journal uses article numbers instead of page numbers. See further details here.