Article

Evaluation of Operational Monsoon Moisture Surveillance and Severe Weather Prediction Utilizing COSMIC-2/FORMOSAT-7 Radio Occultation Observations

National Science and Technology Center for Disaster Reduction, New Taipei City 23143, Taiwan
*
Author to whom correspondence should be addressed.
Remote Sens. 2021, 13(15), 2979; https://0-doi-org.brum.beds.ac.uk/10.3390/rs13152979
Submission received: 23 May 2021 / Revised: 22 July 2021 / Accepted: 26 July 2021 / Published: 28 July 2021

Abstract

:
Operational monsoon moisture surveillance and severe weather prediction is essential for timely water resource management and disaster risk reduction. For these purposes, this study suggests a moisture indicator using the COSMIC-2/FORMOSAT-7 radio occultation (RO) observations and evaluates numerical model experiments with RO data assimilation. The RO data quality is validated by a comparison between sampled RO profiles and nearby radiosonde profiles around Taiwan prior to the experiments. The suggested moisture indicator accurately monitors daily moisture variations in the South China Sea and the Bay of Bengal throughout the 2020 monsoon rainy season. For the numerical model experiments, the statistics of 152 moisture and rainfall forecasts for the 2020 Meiyu season in Taiwan show a neutral to slightly positive impact brought by RO data assimilation. A forecast sample with the most significant improvement reveals that both thermodynamic and dynamic fields are appropriately adjusted by model integration posterior to data assimilation. The statistics of 17 track forecasts for typhoon Hagupit (2020) also show the positive effect of RO data assimilation. A forecast sample reveals that the member with RO data assimilation simulates better typhoon structure and intensity than the member without, and the effect can be larger and faster via multi-cycle RO data assimilation.

1. Introduction

Taiwan—as an island located in the East Asian monsoon region adjacent to the northwestern Pacific Ocean—is subject to various severe weather systems, such as Meiyu fronts, typhoons, and local thunderstorms [1]. Rainfall brought by these severe weather systems is the main source of water on the island, but excessive rainfall may cause massive landslides or floods that threaten human life and property. For timely water resource management and disaster risk reduction, it is essential to enhance the surveillance of monsoon moisture and the prediction of severe weather systems. The enhancement relies greatly on utilizing more advanced and widespread remote sensing observations, especially meteorological satellite observations over the ocean where in-situ measurements hardly exist. Most active and passive meteorological satellites sense the radiation emitted and reflected by the Earth and its atmosphere in the nadir direction using multiple channels of different wavelengths, which provide data at high horizontal resolution. However, with nadir sounding, the vertical profiles of the atmospheric state are indirectly estimated by assuming weighting functions as a function of altitude for all the channels. The vertical resolution of the estimated profiles is limited, and the accuracy is vulnerable to the sensitivity of sensors and the uncertainty of algorithms. To retrieve a more accurate atmospheric state at higher vertical resolution, the global navigation satellite system (GNSS [2,3]) radio occultation (RO) observations aboard low Earth orbit (LEO [4,5]) satellites have been regarded as the best solution thus far. From these limb-sounding observations, the Doppler shift of each refracted ray is used to derive the bending angle of the ray, and then the bending angle profile is used to derive refractivity that contains implicit information about atmospheric pressure, temperature, and humidity. The vertical resolution of GNSS RO profiles can reach up to dozens of meters in the lower troposphere via the high sampling rate of LEO receivers, and the accuracy is immune to the sensitivity of sensors because the phase information of electromagnetic waves is used instead of the amplitude.
The first application of the GNSS RO technique to atmospheric sounding was made by the Microlab-1 microsatellite in the Global Positioning System/Meteorology (GPS/MET) experiment managed by the University Corporation for Atmospheric Research (UCAR) from 1995 to 1997, which confirmed the feasibility and potential of this technique [6]. Following the success of GPS/MET, more satellite missions with GNSS RO measurements have been launched, such as the Challenging Minisatellite Payload (CHAMP [7]) by Germany, the Satélite de Aplicaciones Científicas-C (SAC-C [8]) by Argentina, the Gravity Recovery and Climate Experiment (GRACE [9]) by the United States (US) and Germany, the Constellation Observing System for Meteorology, Ionosphere, and Climate/Formosa Satellite Mission 3 (COSMIC/FORMOSAT-3 [10]) and COSMIC-2/FORMOSAT-7 [11] by the US and Taiwan, the Meteorological Operational Satellite (MetOp [12]) by Europe, the Terra X-band Synthetic Aperture Radar (TerraSAR-X [13]) by Germany, the Lemur CubeSats [14] by the US, and the Sentinel-6 [15] by Europe and the US. Among these missions, COSMIC/FORMOSAT-3 was the first one dedicated to the needs of operational climate monitoring and weather forecasting by deploying a constellation of six LEO satellites in 2006, which was retired and succeeded by COSMIC-2/FORMOSAT-7 with another constellation of six in 2019. The major differences between the two constellations are the orbital inclination and the compatibility with GNSSs. The COSMIC/FORMOSAT-3 constellation had a 72° inclination, which led to a more uniform global distribution of observations, and only received signals from GPS. Instead, the COSMIC-2/FORMOSAT-7 constellation has a 24° inclination, which favors observations at low and middle latitudes, and receives signals from GPS and the Russian Globalnaya Navigatsionnaya Sputnikovaya Sistema (GLONASS [2,3]) with an average of 4000 profiles per day at present. This quantity is several times as large as that in COSMIC/FORMOSAT-3, and it can be larger when signals from the European Galileo system [2,3] are receivable as well. Therefore, evaluating the effects of COSMIC-2/FORMOSAT-7 RO observations on the essential monsoon moisture surveillance and severe weather prediction becomes the motivation of this study.
For the purpose of monsoon moisture surveillance, information about atmospheric pressure, temperature, and humidity contained by RO refractivity data can be retrieved via a one-dimensional variational (1DVar) procedure and utilized. The 1DVar analyses were verified with radiosonde measurements and global weather analyses soon after the success of GPS/MET and proved reliable [16,17]. As for severe weather prediction, assimilating RO observations into numerical models is considered a key factor to improve forecast accuracy [18,19]. Regarding the assimilated variable, the retrieved pressure, temperature, and humidity may not be the best choice because of the uncertainty embedded in the 1DVar procedure. Therefore, the upstream variables, such as refractivity and the bending angle, have been more favorable for data assimilation with the necessity of corresponding observation operators [20,21]. The refractivity operator was derived as a function of the total pressure, the partial pressure of water vapor, and the absolute temperature [20], and the bending angle operator was derived as a function of the impact parameter and the Abel transform of a refractivity profile under a local spherical symmetry assumption [21]. It is also worth noting that some studies explored more sophisticated operators to alleviate the errors resulting from the local spherical symmetry assumption, such as ray-tracing operators [22,23,24]. Another advance was the proposal of a nonlocal linear observation operator for the modeled and observed excess phase paths, which integrate the modeled and Abel-derived refractivities, respectively, along the refracted ray trajectory below the top of the numerical model [25,26]. The excess phase path operator accurately accounts for horizontal along-track refractivity gradients, which are strong around severe weather systems, by canceling the linearization and discretization errors during the two integration processes, and it is faster than the ray-tracing operator and simple for practical implementation.
There have been numerous studies employing the aforementioned operators to investigate the effects of RO data assimilation on numerical model analyses and forecasts. The assimilation of refractivity from Microlab-1 was pioneered by a series of observing system simulation experiments using the fifth generation Penn State University/National Center for Atmospheric Research (NCAR) mesoscale model (MM5) three-dimensional variational (3DVar [27]) system for the scenario of an extratropical cyclone, which found that the analyses of temperature and humidity and the consequent forecast of the cyclone were improved [18]. The assimilation of the bending angle from Microlab-1 was pioneered using the Spectral Statistical Interpolation (SSI) 3DVar system of the National Centers for Environmental Prediction (NCEP), which found that the analysis increment of temperature was the largest in the middle and upper troposphere and stratosphere while that of humidity was the largest in the lower troposphere [19]. After these pioneering studies, multiple-run evaluations were performed by two studies using the NCEP SSI 3DVar system. One assimilated 837 bending angle profiles from Microlab-1 over 11 days and obtained more accurate analyses and forecasts of temperature and humidity between the 200- and 850-hPa levels, verified with 56 collocated radiosonde profiles [28]. The other assimilated 3030 bending angle profiles from CHAMP over 16 days and reduced the large cold bias of the NCEP analyses without CHAMP, verified with 264 collocated radiosonde and dropsonde profiles [29]. Both studies validated the positive effects of RO data assimilation, which were more pronounced in the Southern Hemisphere because more in-situ measurements were assimilated in the Northern Hemisphere. Hence, RO observations have been operationally assimilated worldwide at most numerical weather prediction centers, such as the European Centre for Medium-Range Weather Forecasts (ECMWF [30,31]), NCEP [32,33], Environment and Climate Change Canada (ECCC [34]), the Met Office [35], and the Deutscher Wetterdienst (DWD [36]). For further insight into severe weather prediction, several studies were devoted to optimizing RO data assimilation for tropical cyclone cases. It was found that the forecasts of tropical cyclone tracks, intensity, and induced rainfall could be improved by RO data assimilation [37,38,39,40,41,42,43], and more improvement could be made by increasing the number of assimilation cycles [38], using the nonlocal observation operator [39,41], using a flow-dependent assimilation scheme [38], or assimilating other kinds of observations in addition [37,38,40]. Similar conclusions were also drawn for rainfall forecasts in Meiyu cases [38,41,44].
Recent studies have started to assess the performance of the COSMIC-2/FORMOSAT-7 RO observations, which have the best coverage ever at low and middle latitudes as mentioned earlier. Preliminary results revealed that the observations agreed well with independent radiosondes [11,45], LEO satellites [45,46], and model analyses [11], and their high signal-to-noise ratios benefited the accuracy of humidity retrieval [45]. Utilizing such high-resolution, high-quality RO observations—this study develops and evaluates operational products for monsoon moisture surveillance and severe weather prediction [47] at the National Science and Technology Center for Disaster Reduction (NCDR), which serves as a think tank on disaster risk reduction in Taiwan. The purpose is to understand the accuracy of these operational products and scrutinize the role played by the RO observations. Section 2 describes the materials and methods, including the regional verification of the RO observations, a suggested RO moisture indicator, the design of numerical model experiments with RO data assimilation, and the statistical method of the paired t-test. Section 3 presents the corresponding results. Section 4 provides in-depth discussion on observational and modeling aspects. Section 5 is devoted to conclusions.

2. Materials and Methods

2.1. Source and Verification of the COSMIC-2/FORMOSAT-7 RO Observations

On the Taiwan side, the COSMIC-2/FORMOSAT-7 RO observations are operationally received, processed, archived, and released by Taiwan Analysis Center for COSMIC (TACC [48]). The first test data were released on 10 December 2019, and real-time data have been open to the public since 7 March 2020. TACC provides raw GNSS data as well as retrieved atmospheric and ionospheric data at various processing levels and formats, among which the files named atmPrf and wetPf2 are automatically downloaded by NCDR every hour. The latency is about 50 min from the observation time. The atmPrf files mainly contain the profiles of the refractivity, bending angle, dry pressure, dry temperature, azimuth, and impact parameter at the heights of the refracted rays. The wetPf2 files mainly contain the profiles of the 1DVar-retrieved pressure, temperature, and humidity interpolated to 50- and 100-m resolution at the heights of 0–20 and 20–60 km, respectively. Figure 1 shows the daily number of the downloaded RO profiles from the start date, 1 October 2019, of the first test data to a recent date, 26 April 2021. The average is 4114 per day.
Although the quality of the COSMIC-2/FORMOSAT-7 RO observations has been well recognized [11,45,46], this study still begins with a comparison between sampled RO profiles and nearby radiosonde profiles around Taiwan so as to understand their regional characteristics prior to further applications. The compared variables are temperature and specific humidity ( s ) interpolated to 10-hPa resolution as well as precipitable water ( W x ) above certain pressure levels ( p x ), calculated as [49]:
W x = 1 g p x 10   hPa s d p
where g is gravity; the values of p x include 500, 600, 700, 850, 925, and 1000 hPa. The water vapor above the 10-hPa level is omitted. From 1 October 2019 to 23 June 2020, there are 59 RO profiles sampled for being within 100 km and ±2 h from nearby radiosonde profiles provided by six radiosonde stations, including Banqiao with 9 profiles, Hualien with 13, Tungsha with 13, Pingtung with 9, Magong with 11, and Green Island with 4 as shown in Figure 2. The selection of the 100-km and ±2-h thresholds is a compromise between sufficient samples and sufficient representativeness in space and time to ensure statistical significance. Moreover, because the quality of RO observations in the tropical lower troposphere can be influenced by the effect of multipath propagation resulting from the large vertical gradients of refractivity in precipitation systems [50,51], the 59 RO profiles are divided into the sunny group and the cloudy/rainy group for separate statistics. An RO profile is classified into the sunny group if the majority of its surrounding area within a 30-km distance is cloudless, according to satellite images from Himawari-8; otherwise, it is classified into the cloudy/rainy group.

2.2. Experimental Design for Monsoon Moisture Surveillance

The rainy season of the East Asian summer monsoon consists of two phases [52]. The first phase begins with the onset of the South China Sea summer monsoon, characterized by strong southwesterly flow that penetrates the South China Sea and transports abundant moisture to East Asia. This phase is also called the pre-flood period [53], during which a large-scale stationary front with heavy rain (called Meiyu) occurs over South China, Taiwan, and Okinawa. The second phase is called the grand-onset phase, characterized by the stationary front migrating to Central and East China, the main islands of Japan (called Baiu), and the Korean Peninsula (called Changma). The moisture in this phase is mainly transported from the Bay of Bengal [54]. Therefore, this study retrieves daily moisture variations in the South China Sea during 26 April–10 June 2020, and the Bay of Bengal during 1 May–30 July 2020, using the COSMIC-2/FORMOSAT-7 RO observations, an observational approach of monsoon moisture surveillance in addition to the use of reanalysis data [52,53,54]. The indicator is total precipitable water ( W T ), calculated as [49]:
W T = 1 g p 0 p 20 s d p
where p 0 and p 20 are the pressure at the heights of 0 and 20 km, respectively. Figure 3 shows two separate surveillance domains in the South China Sea (110–120°E, 5–15°N) and the Bay of Bengal (80–97.5°E, 0–22.5°N). The RO observations in each domain are collected every 24 h from 12:00 to next 11:59 UTC (Coordinated Universal Time) and then averaged into a daily mean profile of pressure and specific humidity, from which the daily mean total precipitable water is derived via Equation (2). To evaluate this approach, the NCEP Climate Forecast System Reanalysis (CFSR [55]) data and the undermentioned regional model analyses with RO data assimilation are also used to calculate domain-averaged total precipitable water every 00:00 UTC during the surveillance periods for intercomparison.

2.3. Experimental Design for Severe Weather Prediction

To examine the effects of COSMIC-2/FORMOSAT-7 RO data assimilation on severe weather prediction around Taiwan, this study employs the version 3.8.1 of the Weather Research and Forecasting (WRF) model and WRF data assimilation (WRFDA) system [56] with one-way, triple-nested domains, as shown in Figure 4. Domains 1, 2, and 3 span 221 × 127, 183 × 195, and 150 × 180 horizontal grid points at 45-, 15-, and 5-km resolution, respectively. There are 45 vertical eta levels with a model top of 30 hPa. The physics schemes include the Goddard Cumulus Ensemble (GCE) microphysics [57], Kain–Fritsch cumulus parameterization [58], revised MM5 surface layer [59], Noah land surface model [60], Yonsei University planetary boundary layer [61], and the Rapid Radiative Transfer Model for GCMs (RRTMG) longwave and shortwave radiation [62]. For data assimilation, the 3DVar component of WRFDA is used with the background error covariance option of five control variables (CV5), which contain the stream function, unbalanced velocity potential, unbalanced surface pressure, unbalanced temperature, and pseudo relative humidity. Three outer loops are applied to the minimization of the cost function. The background error variance and length scaling variables refer to empirical values in a previous study [43]. Implementing this configuration, two operational 84-h forecast members are initialized with the NCEP Global Forecast System (GFS) 0.5° forecast every 00:00, 06:00, 12:00, and 18:00 UTC. Member 1 assimilates the Global Telecommunication System (GTS) in-situ observations at the initial time for all the three domains. Member 2 additionally assimilates the RO refractivity profiles within ±3 h from the initial time, which are thinned to 200-m vertical resolution to approach the model resolution. For each WRF member, 152 moisture and rainfall forecasts initialized during 00:00 UTC 26 May–18:00 UTC 2 July 2020, are verified with the water vapor mixing ratio data of the NCEP GFS analyses and the radar-derived quantitative precipitation estimation (QPE [63]) data around Taiwan from the Central Weather Bureau (CWB); 17 track forecasts for Typhoon Hagupit (2020) initialized during 12:00 UTC 1 August–12:00 UTC 5 August 2020 are verified with the best track data from CWB. Moreover, the forecast samples initialized at 12:00 UTC 6 June and 12:00 UTC 1 August 2020, for the cases of Meiyu and typhoon Hagupit, respectively, are spatially scrutinized, and the latter is additionally compared with two sensitivity experiments that perform three 6-h assimilation cycles prior to the forecast.

2.4. Statistical Method of the Paired t-test

To properly assess the statistical significance for the comparisons between the sampled RO and radiosonde profiles and between the rainfall forecasts made by WRF Members 1 and 2, the paired t-test is carried out [64]. Suppose there are n sampled pairs with an average pair difference of d ¯ . The t value for the paired t-test is calculated as:
t = d ¯ μ 0 s d / n
where μ 0 is the expected value of the population; s d is the sample standard deviation of the pair differences. In this study, μ 0 is set to 0 and then the calculated t value is compared against the critical value with a 95% confidence interval. If the absolute t value is smaller than the critical value, it means there is no statistically significant difference between the two groups.

3. Results

3.1. Comparison between the Sampled RO and Radiosonde Profiles

Figure 5a–f calculate the average temperature, specific humidity, and precipitable water differences of the sampled COSMIC-2/FORMOSAT-7 RO profiles minus nearby radiosonde profiles for the sunny and cloudy/rainy groups separately. The standard deviations of the temperature and specific humidity differences are also shown. All sample number curves reveal a decreasing trend below the 700-hPa level because the lowest observable altitudes of the RO profiles near Banqiao, Hualien, and Pingtung radiosonde stations, located on the mountainous main island of Taiwan, are mostly higher than the other samples. The temperature difference for the sunny group is small at most levels with a standard deviation of approximately 1 K (Figure 5a), whereas the one for the cloudy/rainy group is notably negative below the 850-hPa level, reaching −2.7 K (Figure 5b). The specific humidity difference for the sunny group is positive above the 450-hPa level but negative below, and the absolute value and standard deviation decrease with altitude owing to rare water vapor at high levels (Figure 5c). The vertical distribution of the specific humidity difference for the cloudy/rainy group is analogous to the sunny group, except for a larger absolute value and a positive difference instead between the 550- and 700-hPa levels (Figure 5d). It is to be noticed that the point-to-point temperature and specific humidity comparison between the RO and radiosonde profiles within a certain spatial and temporal distance is very rigorous, especially for moisture that can have larger spatial and temporal gradients. Therefore, the precipitable water vertically integrating the specific humidity above the 500-, 600-, 700-, 850-, 925-, and 1000-hPa levels is also compared. The precipitable water difference for the sunny group is near zero above all the six levels (Figure 5e), whereas the one for the cloudy/rainy group is notably negative above the 925- and 1000-hPa levels, reaching −5.5 kg m2 (Figure 5f). Paired t-tests are carried out with the whole 59 sampled pairs of RO and radiosonde profiles. For temperature, the absolute t values are smaller than the critical values at almost all levels (Figure 5g). For specific humidity, the absolute t values exceed the critical values below the 900-hPa level and above the 400-hPa level (Figure 5h). As a concluding remark, the sunny group exhibits greater consistency than the cloudy/rainy group, and the overall consistency is great except for specific humidity at very low levels (where sample numbers are small) and high levels (where moisture is rare).

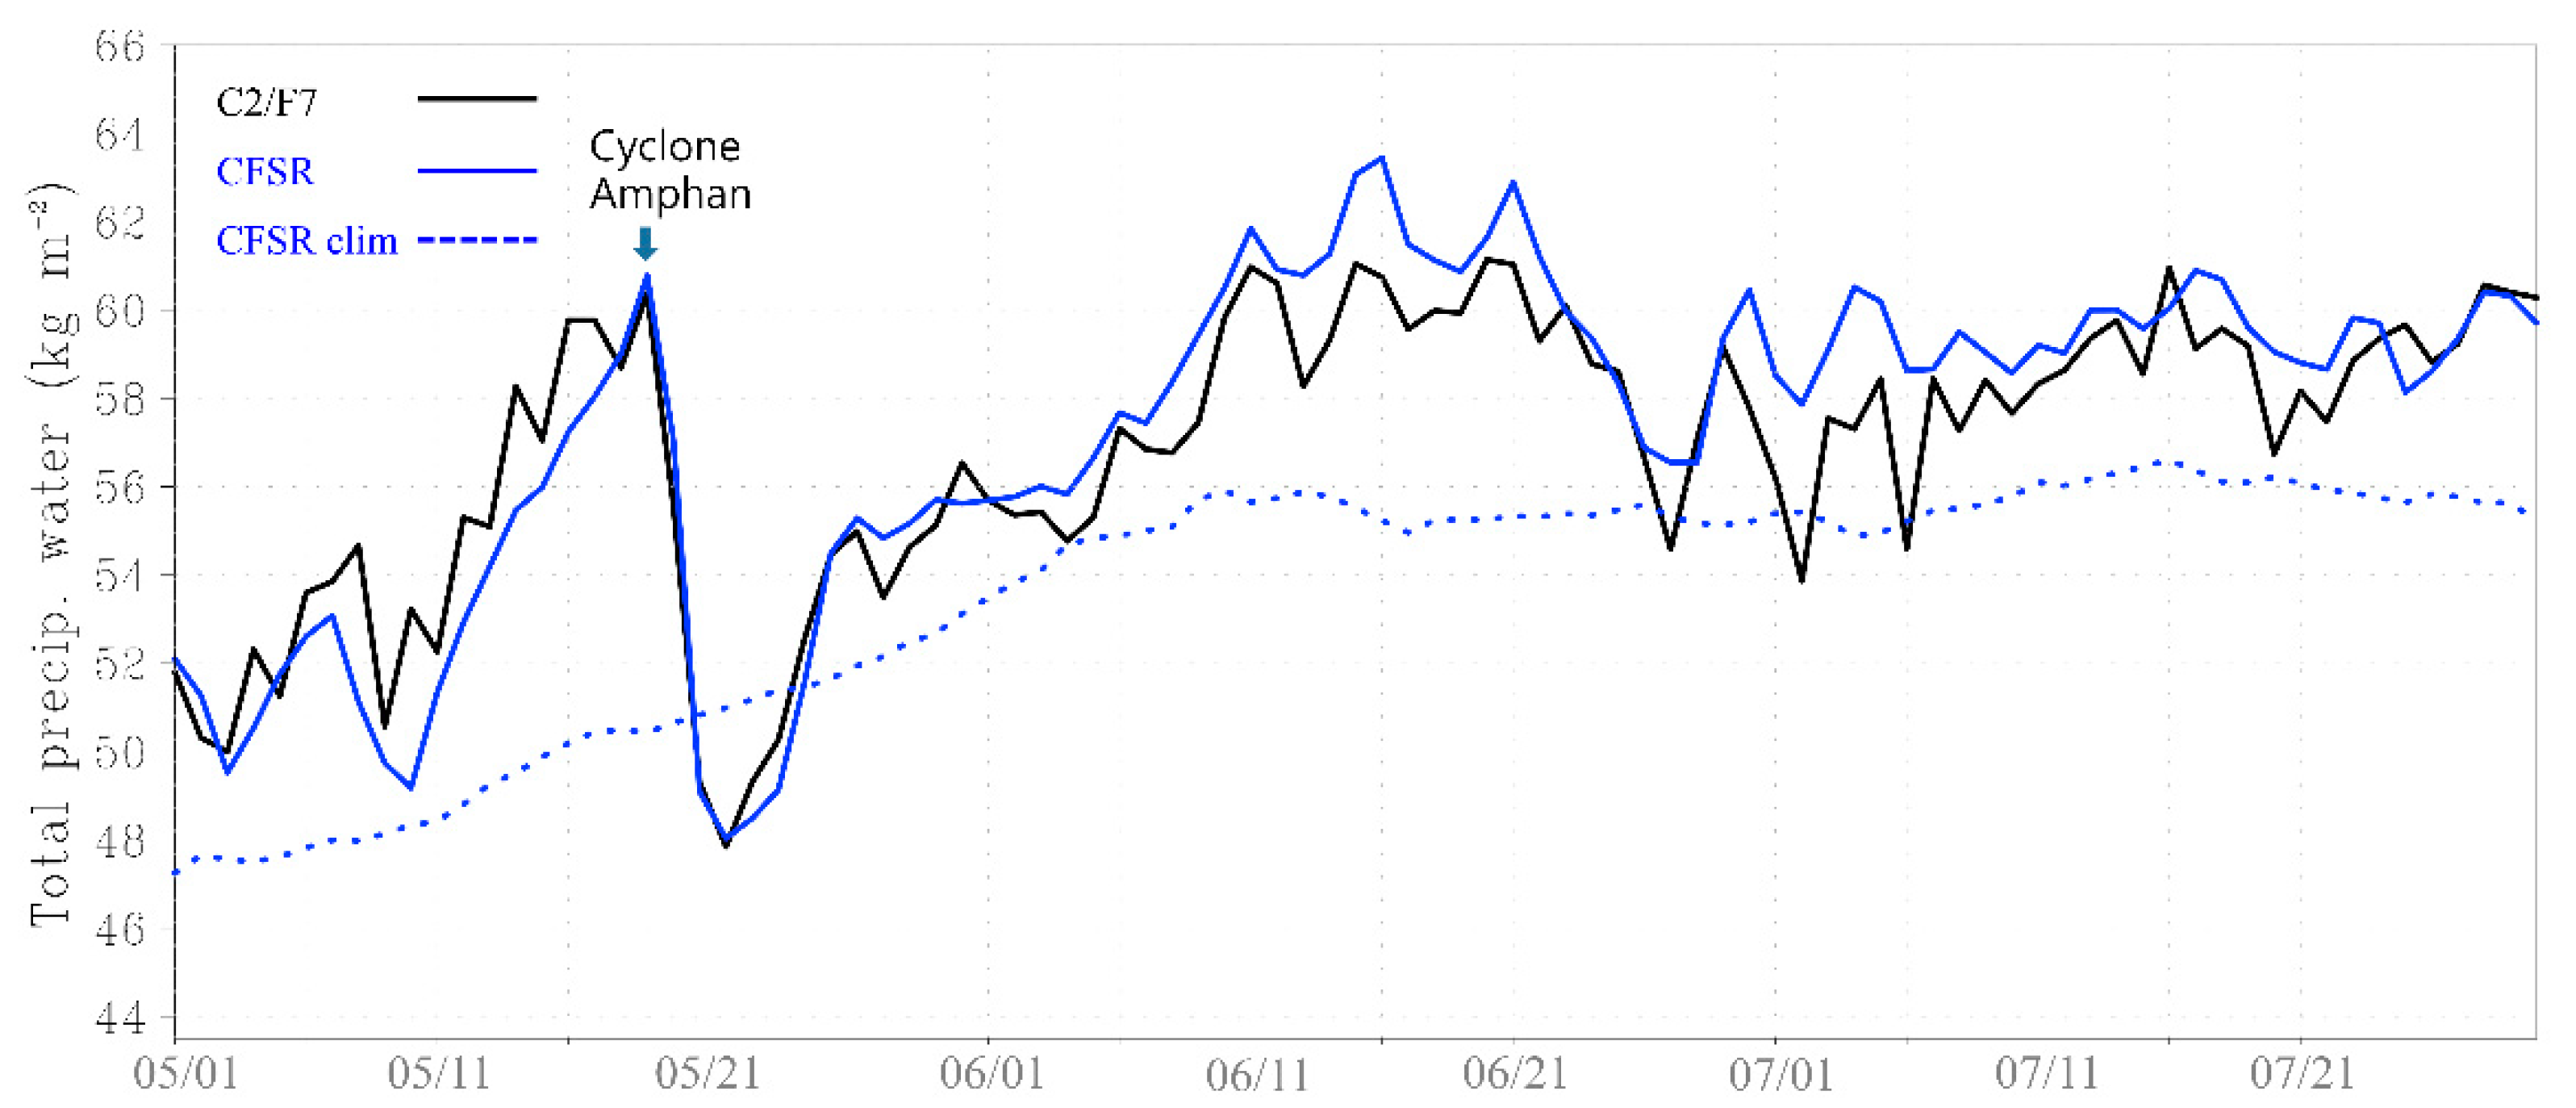
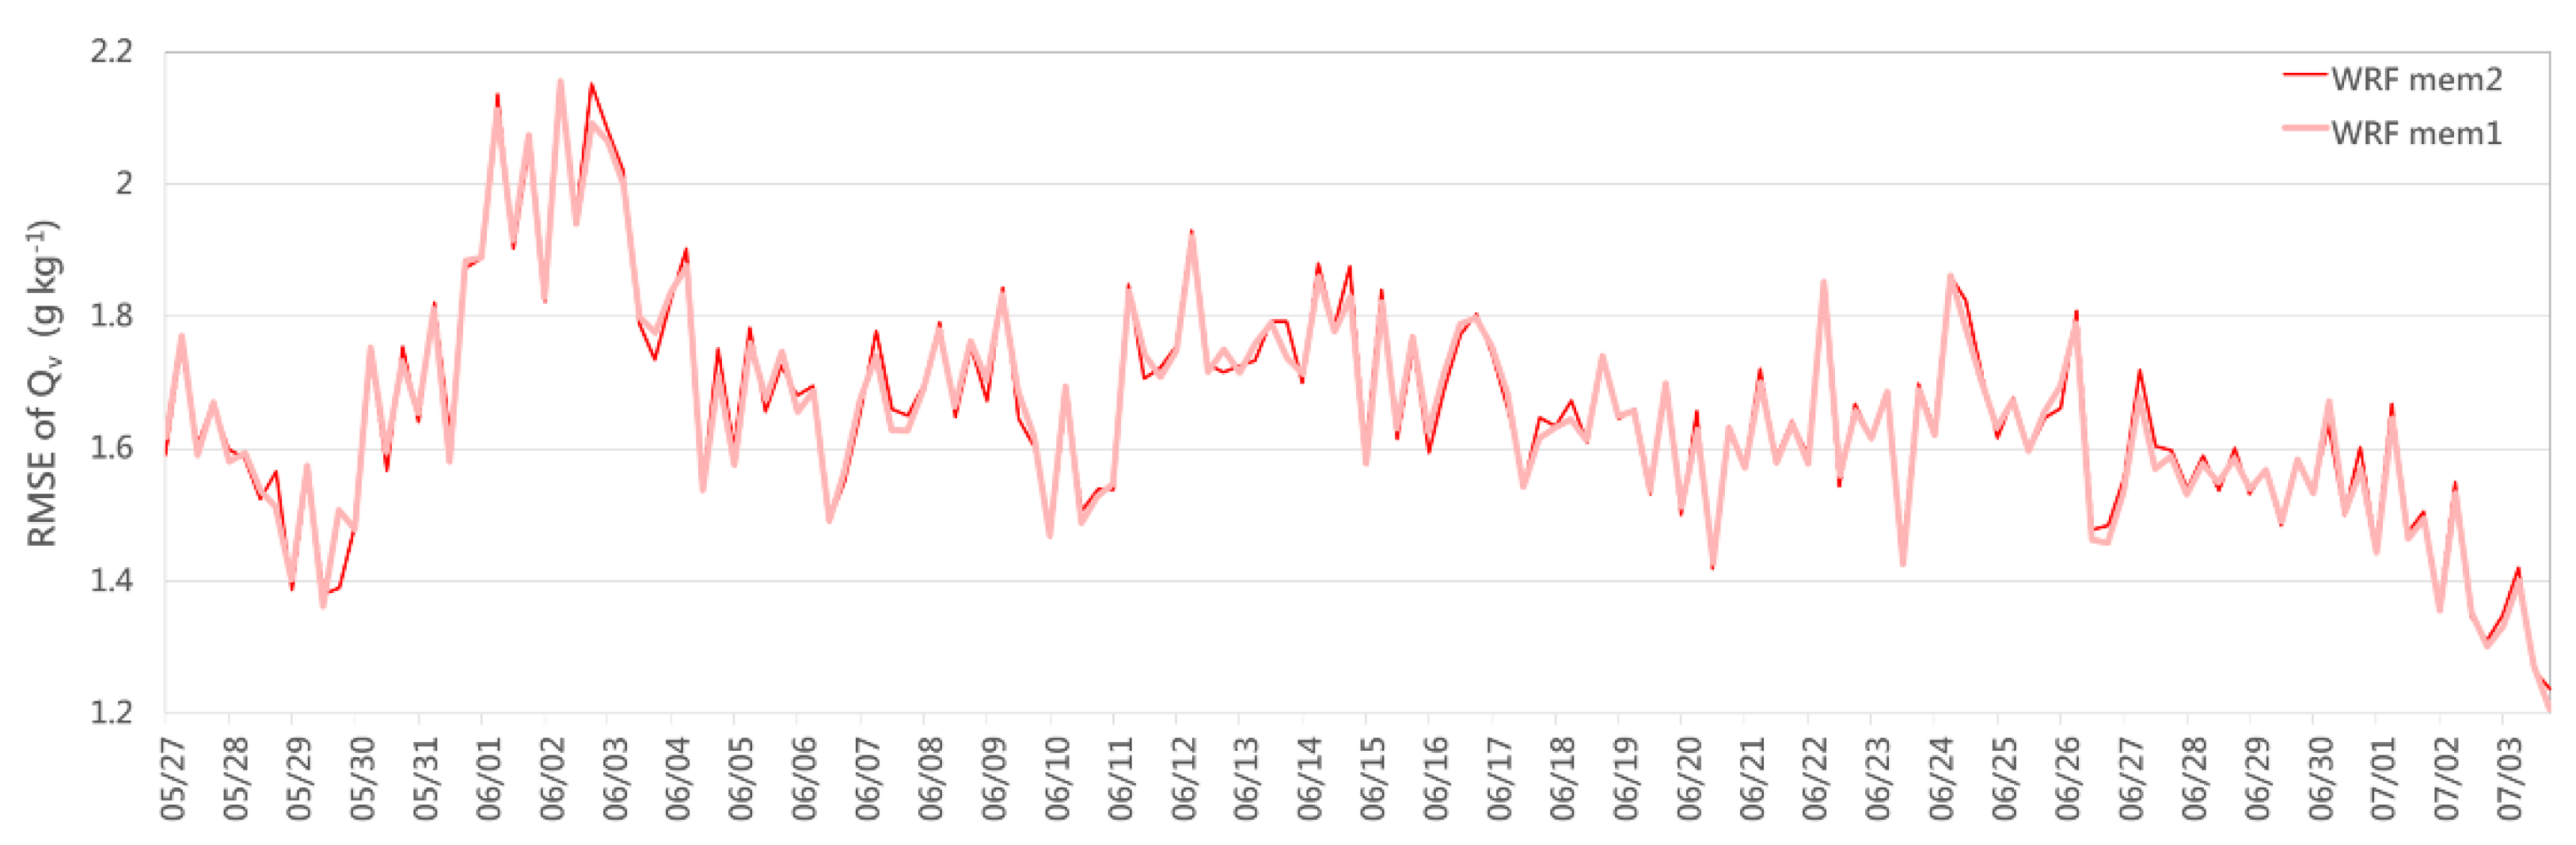
3.2. Monsoon Moisture Surveillance

Figure 6 calculates the daily total precipitable water in the South China Sea during 26 April–10 June 2020, retrieved with the COSMIC-2/FORMOSAT-7 RO observations, the CFSR data, and the analyses of the aforementioned WRF Member 2. The 41-year (1979–2019) climatological average with the CFSR data is also shown. It is obvious that the RO observation curve corresponds well with the CFSR and WRF analysis curves, which look smoother with larger data size though. This confirms that the direct use of the RO humidity retrieval is sufficient for an accurate moisture indicator in a monsoon region. In comparison with the climatological average, the total precipitable water in the South China Sea was significantly higher during 3–7 May and 20–24 May 2020, with southeasterly and southwesterly prevailing winds (not shown), respectively, according to the CFSR data. The value during 20–24 May 2020 that reached 60 kg m−2 led to pronounced northeastward moisture flux and, consequently, the heaviest daily rainfall (668.5 mm) of the year in Taiwan on 22 May 2020. Therefore, for a more comprehensive outlook on monsoon rainfall, it is necessary to supplement the moisture indicator with the information of wind, which is not contained in the RO observations.
Likewise, Figure 7 calculates the daily total precipitable water in the Bay of Bengal during 1 May–30 July 2020, retrieved with the RO observations and CFSR data. The RO observation curve still corresponds well with the smoother CFSR analysis curve, reconfirming the usability of the RO humidity retrieval. The comparison with the climatological average reveals tremendous moisture in the Bay of Bengal throughout the 2020 monsoon rainy season. The first peak that exceeded 60 kg m−2 on 19 May 2020, was due to cyclone Amphan, which was the first and strongest tropical cyclone in the 2020 North Indian Ocean cyclone season. Since mid-June 2020, the total precipitable water had kept around 60 kg m−2 for a couple of months, with a southwesterly prevailing wind (not shown) according to the CFSR data. This led to extreme northeastward moisture flux toward southern China and, consequently, the most devastating floods in the Yangtze basin since 1998.

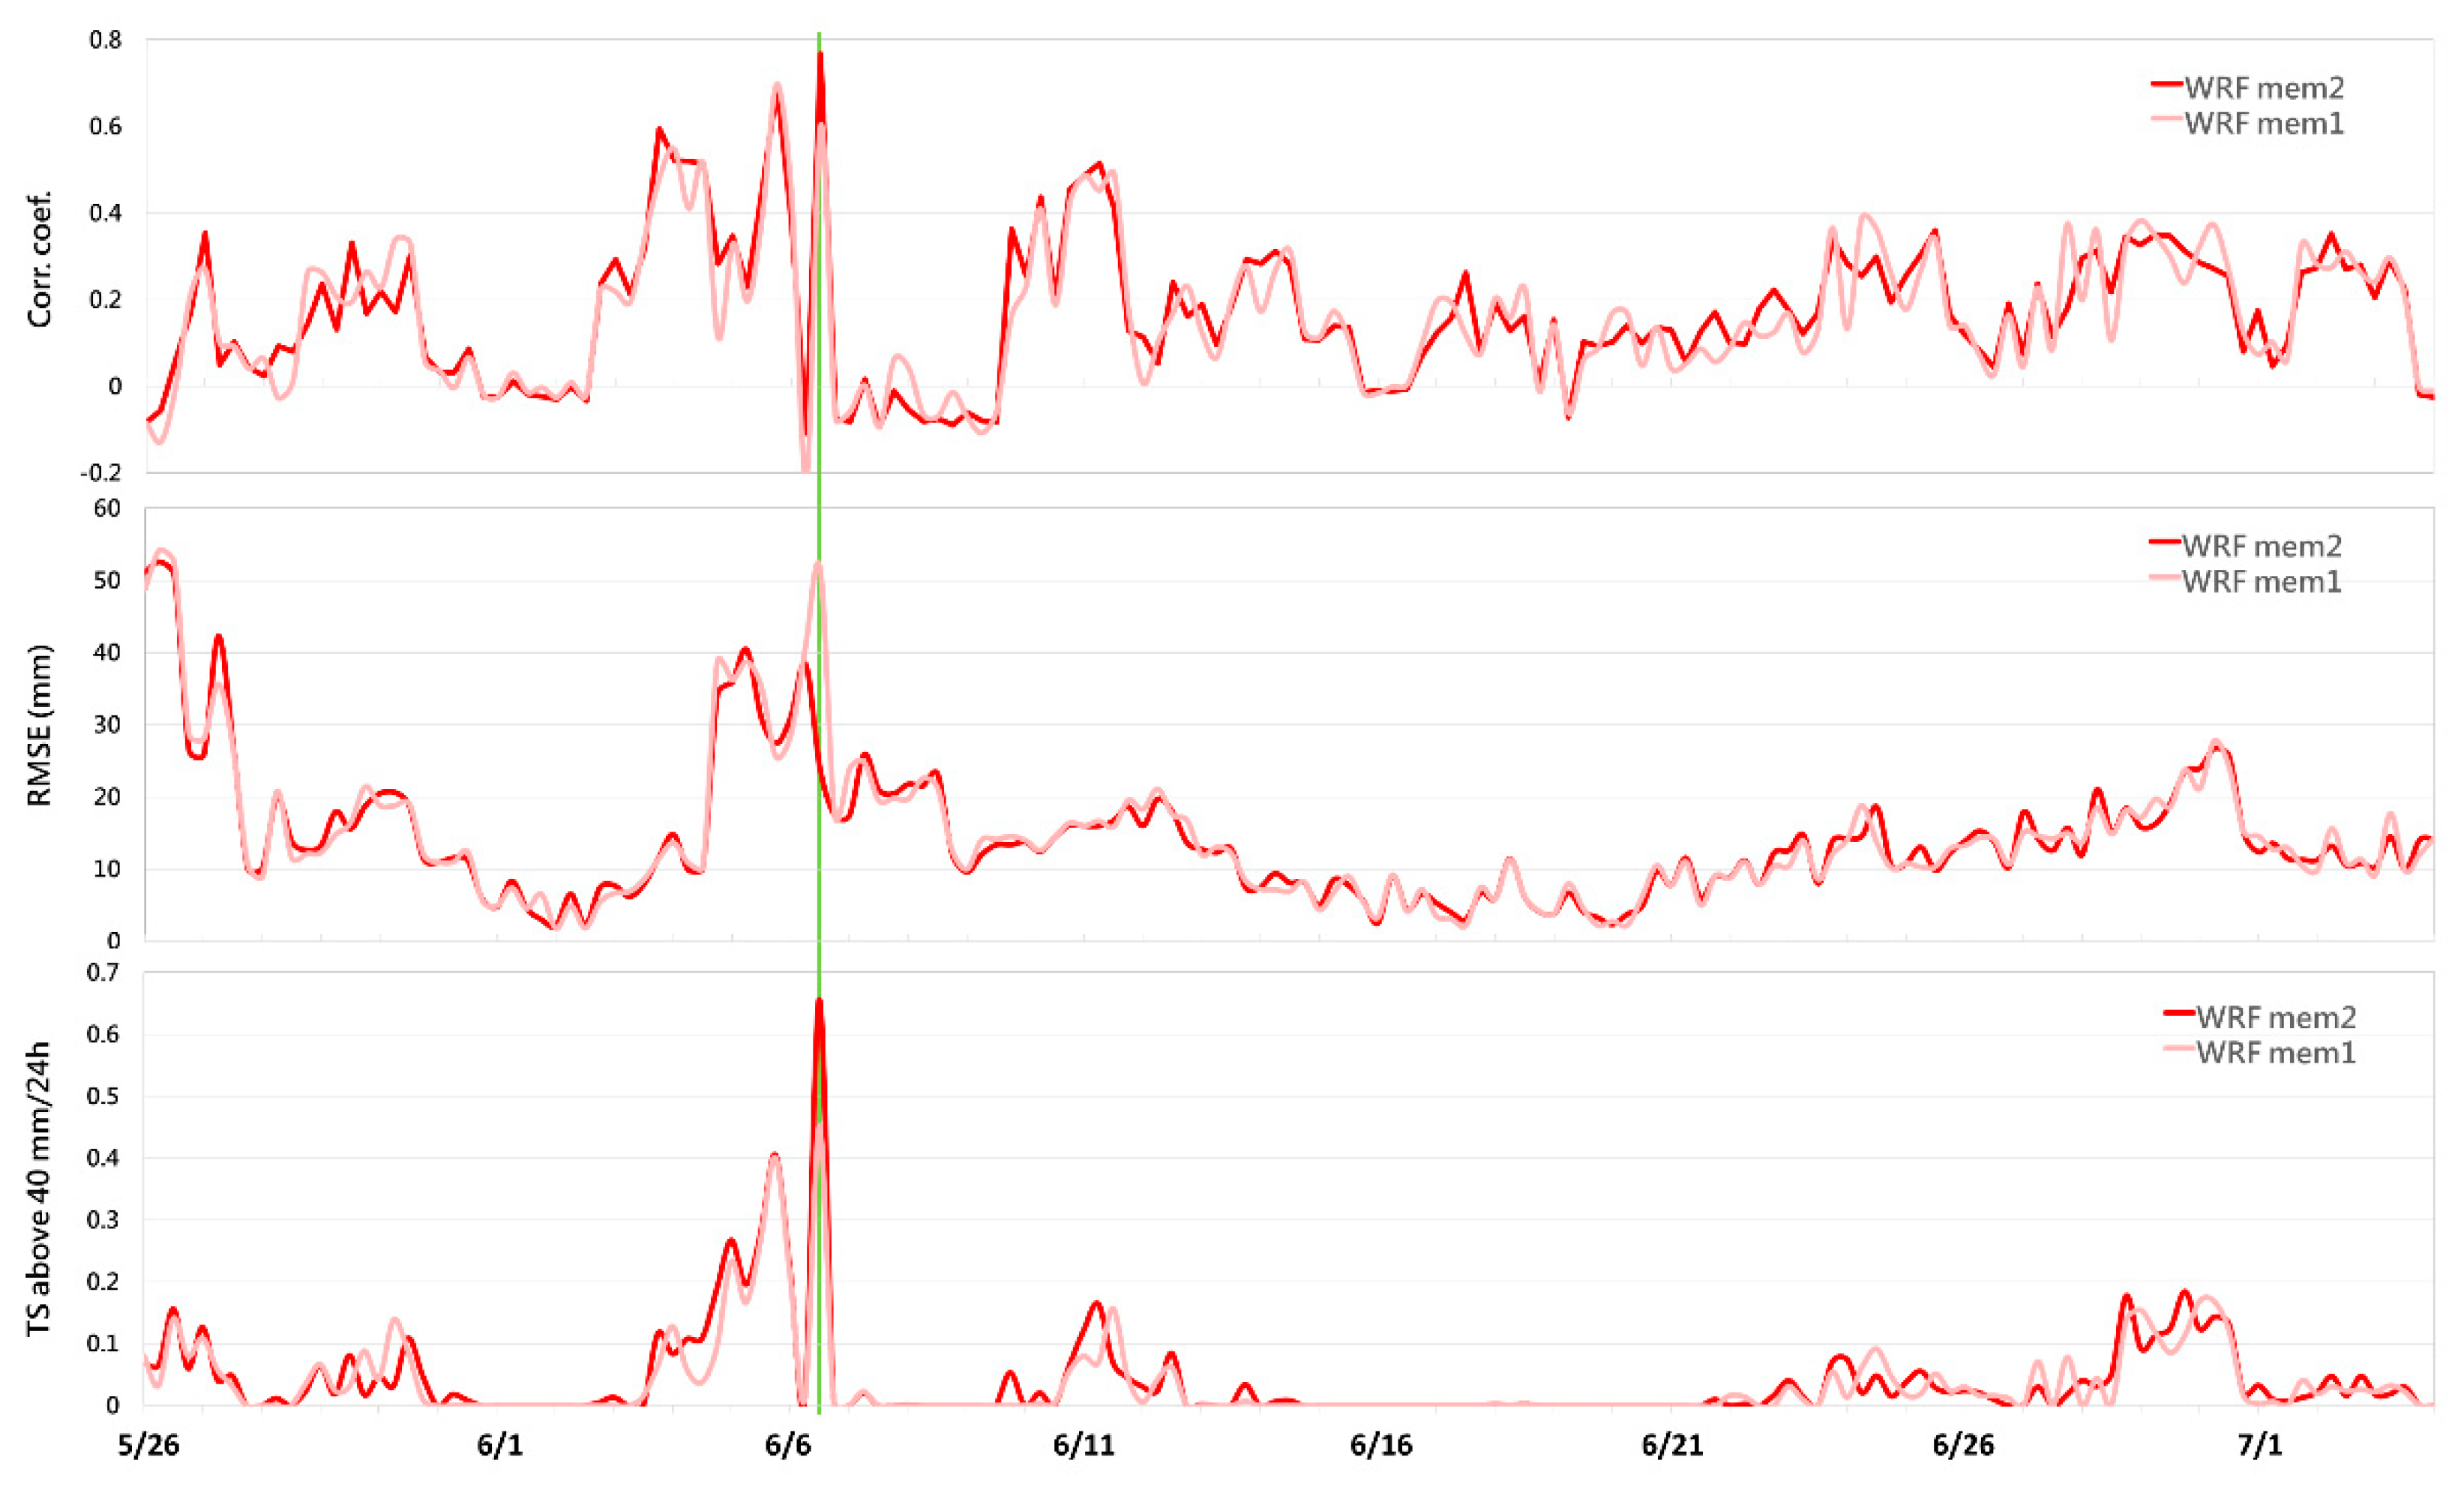
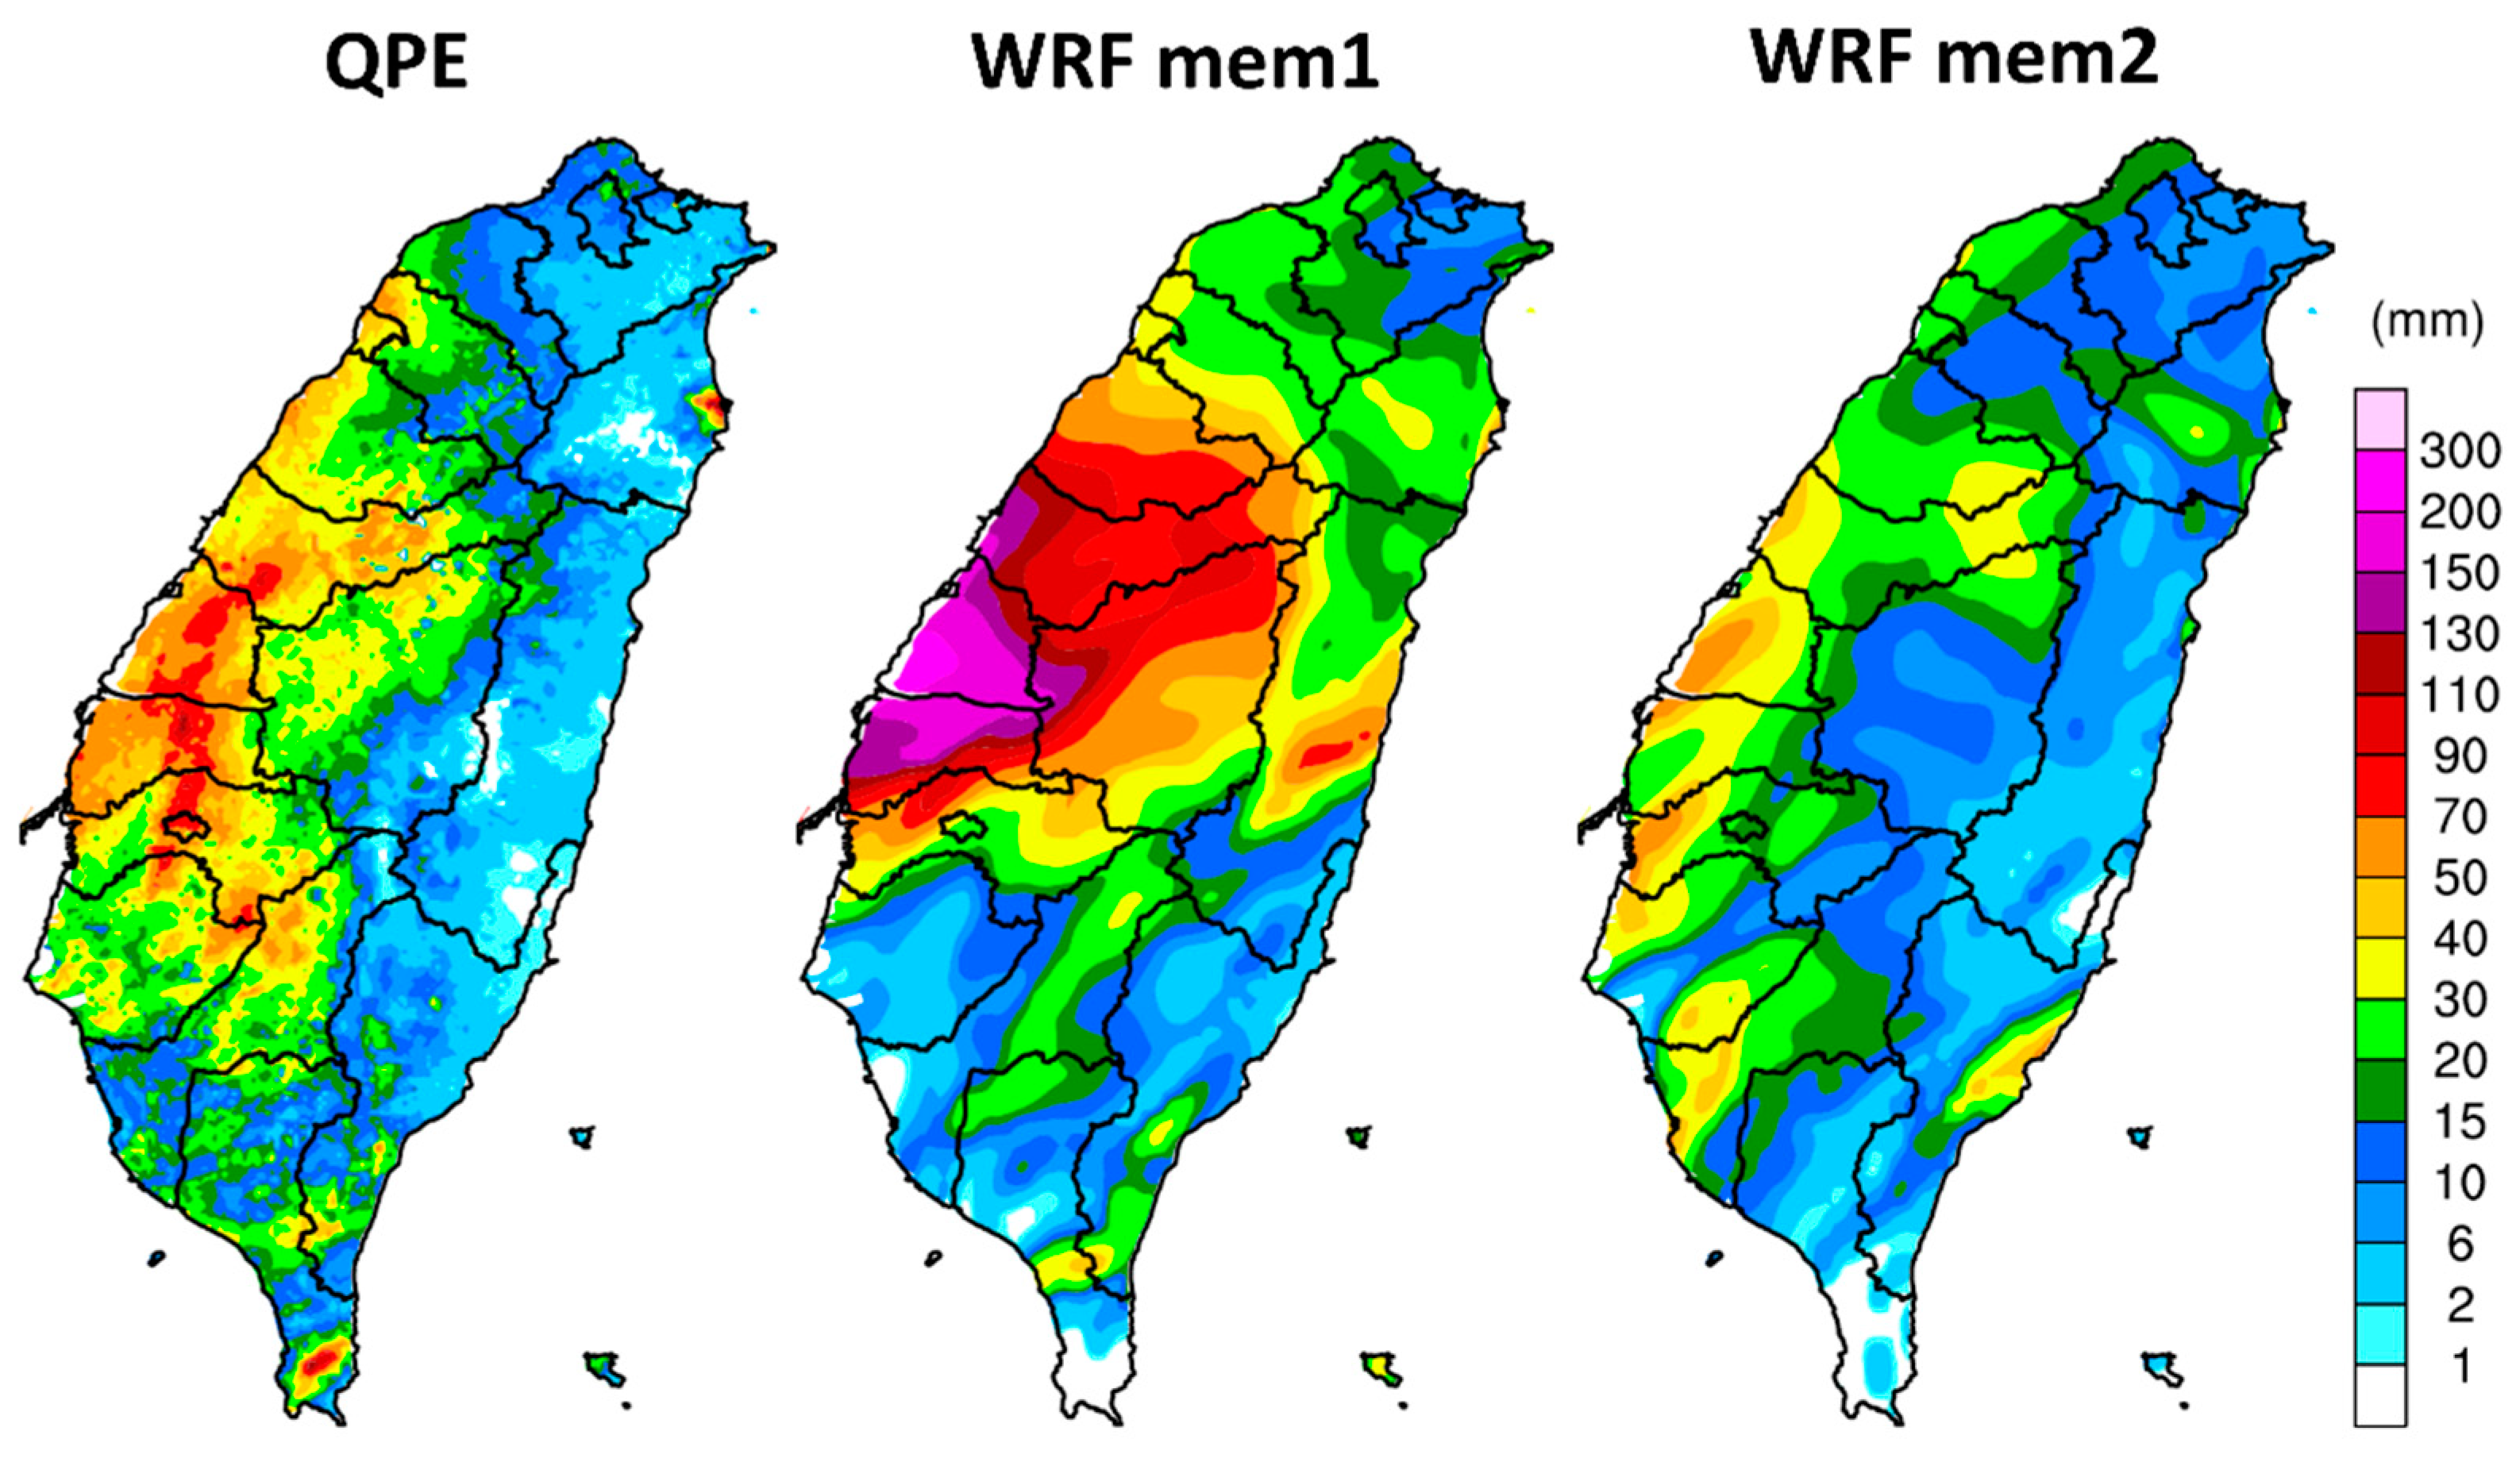
3.3. Severe Weather Prediction

The 152 moisture and rainfall forecasts made by each WRF member are verified with the NCEP GFS analysis and radar-derived QPE data, respectively. For the moisture forecasts, Figure 8 calculates the root-mean-square error of the predicted 850-hPa water vapor mixing ratio at 24 h in Domain 2 for both members. Although the COSMIC-2/FORMOSAT-7 RO observations contain implicit information about humidity, the two similar curves indicate that the impact of RO data assimilation tends to become neutral on the moisture field after 24-h model integration posterior to data assimilation. Nevertheless, a slightly positive impact exists in the predicted 24–48-h rainfall. Figure 9 calculates the correlation coefficient, root-mean-square error, and threat score above a 40-mm threshold of the predicted 24–48-h rainfall for both members. It is found that Member 2 mostly has higher correlation coefficients, lower root-mean-square errors, and higher threat scores than Member 1 despite limited differences. The average correlation coefficient, root-mean-square error, and threat score values for Members 1 and 2 are 0.163 and 0.171, 14.5 and 14.3 mm, and 0.0562 and 0.0633, respectively. Paired t-tests are carried out with the whole 152 pairs of rainfall forecasts made by Members 1 and 2. The absolute t values are 1.67 and 1.14 for the correlation coefficient and root-mean-square error, respectively. Both values are smaller than 1.97, which is the critical value with a 95% confidence interval. This infers that the additional assimilation of the RO observations at the initial time has a neutral to slightly positive impact on the moisture and rainfall forecasts during the Meiyu season in Taiwan. The most significant improvement occurs in the forecast sample initialized at 12:00 UTC 6 June 2020, whose predicted 24–48-h rainfall maps for Members 1 and 2 are compared with the simultaneous radar-derived rainfall map in Figure 10. It is found that Member 2 has a more similar rainfall pattern and intensity to the radar-derived rainfall than Member 1, which has a serious overprediction in central Taiwan without RO data assimilation.
With respect to typhoon prediction, the track forecasts for Typhoon Hagupit, for which CWB issued a sea warning during 2–3 August 2020, are verified with the best track data at 6-h intervals. Figure 11a calculates the total track error within 72 h averaged over the 17 forecasts made by each WRF member. It is found that the positive effect of RO data assimilation is distinguishable since 48 h and more significant since 66 h. For a closer inspection of the beginning 48 h, Figure 11b calculates the average total track, along-track, and cross-track error differences of Member 1 minus Member 2, where positive values represent the superiority of Member 2. The comparison reveals that RO data assimilation has a neutral impact on the moving speed and slightly positive impact on the moving direction of the predicted typhoon within 48 h. Taking the forecast sample initialized at 12:00 UTC 1 August 2020, for example, the track predicted by Member 2 is closer to the best track than that by Member 1 during 06:00 UTC 3 August (42 h)–06:00 UTC 4 August (66 h) 2020 (Figure 12). As the best track during this period approaches the coastal waters of northern Taiwan, the improvement of the track forecast can benefit the timing of the sea warning issuance. In order to enhance the positive effect, two sensitivity experiments that perform initialization at 00:00 UTC 1 August 2020 and three 6-h assimilation cycles at 00:00, 06:00, and 12:00 UTC (termed as partial cycling) to incorporate earlier observation information are carried out for comparison. One, named as Member 1PC, follows Member 1 to only assimilate the GTS in-situ observations. The other, named as Member 2PC, follows Member 2 to additionally assimilate the RO refractivity profiles. Both partial cycling members use the same configuration of WRF and WRFDA as that in Members 1 and 2. The tracks predicted by Members 1PC and 2PC are found to correct the excessive moving speed of those predicted by Members 1 and 2 (Figure 12). Table 1 further lists the total track error differences of Member 2 minus Member 2PC and Member 1PC minus Member 2PC, where positive values represent the superiority of Member 2PC. The result reveals significant outperformance of Member 2PC over Member 2 and Member 1PC. This forecast sample infers that, based on the background provided by global model forecasts, regional model forecasts are likely to benefit from suitable partial cycling assimilation of regional observations, especially the high-resolution, high-quality COSMIC-2/FORMOSAT-7 RO observations.

4. Discussion

The 59 sampled pairs of COSMIC-2/FORMOSAT-7 RO and radiosonde profiles around Taiwan exhibit great overall consistency, except for specific humidity at very low levels for the cloudy/rainy group (Figure 5). The exception is similar to the results of a recent study [45] and attributable to the low-level atmospheric instability in precipitation systems. There are also statistically significant differences at high levels, but they are understandable because the true locations of the RO and radiosonde observations can horizontally deviate from the locations of the occultation point and radiosonde station, respectively, as the height increases. The horizontal deviation degrades the representativeness of the comparison, especially for moisture that has a higher spatial variability. Despite these observational uncertainties, the suggested approach of monsoon moisture surveillance using the RO observations still accurately indicates daily moisture variations in the South China Sea and the Bay of Bengal (Figure 6 and Figure 7). An accurate moisture indicator is certainly helpful for anticipating measures against potential droughts or heavy rainfall hazards.
The statistics of the 152 moisture and rainfall forecasts for the 2020 Meiyu season in Taiwan (Figure 8 and Figure 9) and the 17 track forecasts for typhoon Hagupit (Figure 11) have shown the neutral to slightly positive effects of COSMIC-2/FORMOSAT-7 RO data assimilation. This subsection is to spatially scrutinize the reasons via the forecast samples initialized at 12:00 UTC 6 June and 12:00 UTC 1 August 2020, respectively. Figure 13 shows the 700-hPa temperature and wind differences as well as 850-hPa specific humidity and wind differences of WRF Member 2 minus WRF Member 1 at 0, 24, and 48 h for the Meiyu forecast sample. There is one RO profile (118.31°E, 26.58°N) available in Domain 3 at the analysis time, the assimilation of which decreases the temperature and moisture only near the profile location. However, it varies the wind analysis throughout the domain, where a northeasterly difference can be seen over the South China Sea. This suppresses the intensity of the southwesterly flow impinging on Taiwan and, consequently, results in lower temperature and moisture over the Taiwan Strait for the 24-h forecast. For the 48-h forecast, Member 2 still has lower moisture around Taiwan than Member 1 despite higher temperature, and thus the serious overprediction of the 24–48-h rainfall in central Taiwan is successfully corrected by RO data assimilation (Figure 10).
With respect to the typhoon Hagupit forecast sample, Figure 14 shows the west-east cross-sections, which pass through the typhoon center denoted by the black lines, of the temperature and geopotential height differences of WRF Member 2 minus WRF Member 1 at 6 h. The temperature difference is positive at 550–850 hPa west of the typhoon center (Figure 14a), which implies that the simulated condensation heating of the western eyewall updraft is strengthened and favorable for the warm core after RO data assimilation. The geopotential height difference is negative at 850–1000 hPa within the rainband areas and positive at 250–850 hPa west of the typhoon center (Figure 14b), which implies that the structure of radial inflow at lower levels and outflow at upper levels is further established. Figure 15 shows the 850-hPa geopotential height, wind speed, and wind differences of Member 2 minus Member 1 at 24 h. After 24-h simulation, a dipole pattern is visible around the typhoon center location in both maps because the tracks have become different between the two members (Figure 11). There are extensive decrease of geopotential height and increase of wind speed in the northwest quadrant of the typhoon, which demonstrates that the intensity and symmetry of the typhoon circulation is improved at low levels by RO data assimilation from a weaker and asymmetric circulation simulated in Member 1 (not shown). The improvement of the typhoon structure explains why Member 2 makes more accurate track forecasts to a certain degree (Figure 12). Lastly, to further explore the effect of RO data assimilation with a partial cycling assimilation strategy, Figure 16 shows the 850-hPa geopotential height, wind speed, and wind differences of Member 2PC minus Member 1PC for the analyses and 24-h forecasts. At the final analysis time, the geopotential height difference is negative around the typhoon area but positive in its periphery, which demonstrates the reinforcement of the inner low pressure and outer subsidence. The wind speed difference is positive west and east of the typhoon center, which represents higher intensity in Member 2PC. After 24-h simulation, the improvement of the typhoon structure and intensity is significantly expanded. As a concluding remark on Figure 12, Table 1, and Figure 16, the effect of one-cycle RO data assimilation is smaller and slower, whereas multi-cycle RO data assimilation can enhance the quality of typhoon prediction more efficiently.

5. Conclusions

This study utilizes COSMIC-2/FORMOSAT-7 RO observations to suggest a moisture indicator and design numerical model experiments for the purposes of monsoon moisture surveillance and severe weather prediction, respectively. Prior to the experiments, a comparison between 59 sampled RO profiles and nearby radiosonde profiles around Taiwan, divided into the sunny and cloudy/rainy groups, is made to verify the RO data quality. The comparison exhibits great overall consistency, except for specific humidity at very low levels for the cloudy/rainy group. Despite the exception, the suggested moisture indicator, which calculates total precipitable water out of the 1DVar-retrieved humidity profile, accurately monitors daily moisture variations in the South China Sea and the Bay of Bengal throughout the 2020 monsoon rainy season. With respect to the numerical model experiments, the performances of two operational 84-h WRF forecast members with and without RO data assimilation are compared. The statistics of 152 moisture and rainfall forecasts for the 2020 Meiyu season in Taiwan show a neutral to slightly positive impact brought by RO data assimilation. A forecast sample with the most significant improvement reveals that not only the temperature and moisture fields, but also the wind field is appropriately adjusted by model integration posterior to data assimilation. The statistics of 17 track forecasts for typhoon Hagupit (2020) also show the positive effect of RO data assimilation. A forecast sample reveals that the member with RO data assimilation simulates better typhoon structure and intensity than the member without, and the effect can be larger and faster via multi-cycle RO data assimilation.
It is noteworthy that even though there are globally more than 4000 COSMIC-2/FORMOSAT-7 RO profiles per day, there may sometimes be very few or no RO profiles available in a regional domain at the analysis time such as Figure 13. Therefore, the partial cycling (or even full cycling) assimilation strategy becomes a key factor in propagating more RO observation information into the regional domain and indeed improves the typhoon forecast sample in this study. For future prospects, the statistics of operational multi-cycle forecasts can be carried out as well for a more systematical evaluation. It is also to be emphasized that even though the relatively cheaper 3DVar assimilation scheme and local refractivity observation operator are employed for the consideration of operational costs, this study still explores the benefits of the cutting-edge COSMIC-2/FORMOSAT-7 RO observations in both observational and modeling aspects. The statistical results can provide a benchmark for more advanced assimilation schemes or observation operators.

Author Contributions

Conceptualization, Y.-C.C.; methodology, Y.-C.C. and Y.-c.W.; software, Y.-C.C., Y.-c.W., A.-H.W. and H.-H.L.; validation, Y.-C.C. and Y.-c.W.; formal analysis, Y.-C.C., C.-C.T., C.-J.W., H.-H.L. and D.-R.C.; writing—original draft preparation, C.-C.T.; supervision, C.-C.T. and Y.-C.Y.; funding acquisition, C.-C.T. and Y.-C.Y. All authors have read and agreed to the published version of the manuscript.

Funding

This research was funded by Taiwan’s National Science and Technology Center for Disaster Reduction (NCDR).

Data Availability Statement

The operational products for monsoon moisture surveillance and severe weather prediction are available online: https://watch.ncdr.nat.gov.tw/watch_fs7, accessed on 23 May 2021. The digitial data are not publicly available due to NCDR’s right of privacy.

Acknowledgments

The authors are grateful to Ying-Hwa Kuo at UCAR for the insightful suggestions and Shao-Chin Huang and Chung-Yi Lin at NCDR for the discussions about this study.

Conflicts of Interest

The authors declare no conflict of interest.

References

  1. Lin, H.-H.; Tsai, C.-C.; Liou, J.-C.; Chen, Y.-C.; Lin, C.-Y.; Lin, L.-Y.; Chung, K.-S. Multi-weather evaluation of nowcasting methods including a new empirical blending scheme. Atmosphere 2020, 11, 1166. [Google Scholar] [CrossRef]
  2. Hofmann-Wellenhof, B.; Lichtenegger, H.; Wasle, E. GNSS—Global Navigation Satellite Systems: GPS, GLONASS, Galileo, and More; Springer Wien: Vienna, Austria, 2008; pp. 1–518. [Google Scholar] [CrossRef] [Green Version]
  3. Hein, G.W. Status, perspectives and trends of satellite navigation. Satell. Navig. 2020, 1, 22. [Google Scholar] [CrossRef]
  4. Melbourne, W.G.; Davis, E.S.; Duncan, C.B.; Hajj, G.A.; Hardy, K.R.; Kursinski, E.R.; Meehan, T.K.; Young, L.E.; Yunck, T.P. The Application of Spaceborne GPS to Atmospheric Limb Sounding and Global Change Monitoring; Jet Propulsion Laboratory Publication 94-18: Pasadena, CA, USA, 1994; pp. 1–142. [Google Scholar]
  5. Kursinski, E.R.; Hajj, G.A.; Schofield, J.T.; Linfield, R.P.; Hardy, K.R. Observing earth’s atmosphere with radio occultation measurements using the global positioning system. J. Geophys. Res. 1997, 102, 23429–23465. [Google Scholar] [CrossRef]
  6. Ware, R.; Exner, M.; Feng, D.; Gorbunov, M.E.; Hardy, K.; Herman, B.; Kuo, Y.-H.; Meehan, T.; Melbourne, W.; Rocken, C.; et al. GPS sounding of the atmosphere from low earth orbit: Preliminary results. Bull. Amer. Meteor. Soc. 1996, 77, 19–40. [Google Scholar] [CrossRef] [Green Version]
  7. Wickert, J.; Reigber, C.; Beyerle, G.; König, R.; Marquardt, C.; Schmidt, T.; Grunwaldt, L.; Galas, R.; Meehan, T.K.; Melbourne, W.G.; et al. Atmosphere sounding by GPS radio occultation: First results from CHAMP. Geophys. Res. Lett. 2001, 28, 3263–3266. [Google Scholar] [CrossRef] [Green Version]
  8. Hajj, G.A.; Ao, C.O.; Iijima, B.A.; Kuang, D.; Kursinski, E.R.; Mannucci, A.J.; Meehan, T.K.; Romans, L.J.; de la Torre Juárez, M.; Yunck, T.P. CHAMP and SAC-C atmospheric occultation results and intercomparisons. J. Geophys. Res. 2004, 109, D06109. [Google Scholar] [CrossRef]
  9. Tapley, B.D.; Bettadpur, S.; Ries, J.C.; Thompson, P.F.; Watkins, M.M. GRACE measurements of mass variability in the earth system. Science 2004, 305, 503–505. [Google Scholar] [CrossRef] [Green Version]
  10. Anthes, R.A.; Bernhardt, P.A.; Chen, Y.; Cucurull, L.; Dymond, K.F.; Ector, D.; Healy, S.B.; Ho, S.-P.; Hunt, D.C.; Kuo, Y.-H.; et al. The COSMIC/FORMOSAT-3 mission: Early results. Bull. Amer. Meteor. Soc. 2008, 89, 313–334. [Google Scholar] [CrossRef]
  11. Schreiner, W.S.; Weiss, J.P.; Anthes, R.A.; Braun, J.; Chu, V.; Fong, J.; Hunt, D.; Kuo, Y.-H.; Meehan, T.; Serafino, W.; et al. COSMIC-2 radio occultation constellation: First results. Geophys. Res. Lett. 2020, 47, e2019GL086841. [Google Scholar] [CrossRef]
  12. Luntama, J.-P.; Kirchengast, G.; Borsche, M.; Foelsche, U.; Steiner, A.; Healy, S.; von Engeln, A.; O’Clerigh, E.; Marquardt, C. Prospects of the EPS GRAS mission for operational atmospheric applications. Bull. Amer. Meteor. Soc. 2008, 89, 1863–1876. [Google Scholar] [CrossRef] [Green Version]
  13. Brusch, S.; Lehner, S.; Fritz, T.; Soccorsi, M.; Soloviev, A.; van Schie, B. Ship surveillance with TerraSAR-X. IEEE Trans. Geosci. Remote. Sens. 2011, 49, 1092–1103. [Google Scholar] [CrossRef]
  14. Saeed, N.; Elzanaty, A.; Almorad, H.; Dahrouj, H.; Al-Naffouri, T.Y.; Alouini, M.-S. CubeSat communications: Recent advances and future challenges. IEEE Commun. Surv. Tutor. 2020, 22, 1839–1862. [Google Scholar] [CrossRef]
  15. Maiwald, F.; Brown, S.T.; Koch, T.; Milligan, L.; Kangaslahti, P.; Schlecht, E.; Skalare, A.; Bloom, M.; Torossian, V.; Kanis, J.; et al. Completion of the AMR-C instrument for Sentinel-6. IEEE J. Sel. Top. Appl. Earth Obs. Remote. Sens. 2020, 13, 1811–1818. [Google Scholar] [CrossRef]
  16. Rocken, C.; Anthes, R.; Exner, M.; Hunt, D.; Sokolovskiy, S.; Ware, R.; Gorbunov, M.E.; Schreiner, W.; Feng, D.; Herman, B.; et al. Analysis and validation of GPS/MET data in the neutral atmosphere. J. Geophys. Res. 1997, 102, 29849–29866. [Google Scholar] [CrossRef]
  17. Poli, P.; Joiner, J.; Kursinski, E.R. 1DVAR analysis of temperature and humidity using GPS radio occultation refractivity data. J. Geophys. Res. 2002, 107, 4448. [Google Scholar] [CrossRef]
  18. Kuo, Y.-H.; Zou, X.; Huang, W. The impact of Global Positioning System data on the prediction of an extratropical cyclone: An observing system simulation experiment. Dynam. Atmos. Ocean. 1998, 27, 439–470. [Google Scholar] [CrossRef]
  19. Zou, X.; Wang, B.; Liu, H.; Anthes, R.A.; Matsumura, T.; Zhu, Y.-J. Use of GPS/MET refraction angles in three-dimensional variational analysis. Q. J. R. Meteorol. Soc. 2000, 126, 3013–3040. [Google Scholar] [CrossRef]
  20. Smith, E.K.; Weintraub, S. The constants in the equation for atmospheric refractive index at radio frequencies. Proc. IRE 1953, 41, 1035–1037. [Google Scholar] [CrossRef] [Green Version]
  21. Phinney, R.A.; Anderson, D.L. On the radio occultation method for studying planetary atmospheres. J. Geophys. Res. 1968, 73, 1819–1827. [Google Scholar] [CrossRef]
  22. Zou, X.; Vandenberghe, F.; Wang, B.; Gorbunov, M.E.; Kuo, Y.-H.; Sokolovskiy, S.; Chang, J.C.; Sela, J.G.; Anthes, R.A. A ray-tracing operator and its adjoint for the use of GPS/MET refraction angle measurements. J. Geophys. Res. 1999, 104, 22301–22318. [Google Scholar] [CrossRef] [Green Version]
  23. Poli, P.; Joiner, J. Effects of horizontal gradients on GPS radio occultation observation operators. I: Ray tracing. Q. J. R. Meteorol. Soc. 2004, 130, 2787–2805. [Google Scholar] [CrossRef]
  24. Poli, P. Effects of horizontal gradients on GPS radio occultation observation operators. II: A fast atmospheric refractivity gradient operator (FARGO). Q. J. R. Meteorol. Soc. 2004, 130, 2807–2825. [Google Scholar] [CrossRef]
  25. Sokolovskiy, S.; Kuo, Y.-H.; Wang, W. Assessing the accuracy of a linearized observation operator for assimilation of radio occultation data: Case simulations with a high-resolution weather model. Mon. Weather Rev. 2005, 133, 2200–2212. [Google Scholar] [CrossRef] [Green Version]
  26. Sokolovskiy, S.; Kuo, Y.-H.; Wang, W. Evaluation of a linear phase observation operator with CHAMP radio occultation data and high-resolution regional analysis. Mon. Weather Rev. 2005, 133, 3053–3059. [Google Scholar] [CrossRef] [Green Version]
  27. Sasaki, Y. An objective analysis based on the variational method. J. Meteorol. Soc. Jpn. 1958, 36, 77–88. [Google Scholar] [CrossRef] [Green Version]
  28. Liu, H.; Zou, X.; Shao, H.; Anthes, R.A.; Chang, J.C.; Tseng, J.-H.; Wang, B. Impact of 837 GPS/MET bending angle profiles on assimilation and forecasts for the period June 20–30, 1995. J. Geophys. Res. 2001, 106, 31771–31786. [Google Scholar] [CrossRef] [Green Version]
  29. Zou, X.; Liu, H.; Anthes, R.A.; Shao, H.; Chang, J.C.; Zhu, Y.-J. Impact of CHAMP radio occultation observations on global analysis and forecasts in the absence of AMSU radiance data. J. Meteorol. Soc. Jpn. 2004, 82, 533–549. [Google Scholar] [CrossRef] [Green Version]
  30. Healy, S.B.; Thépaut, J.-N. Assimilation experiments with CHAMP GPS radio occultation measurements. Q. J. R. Meteorol. Soc. 2006, 132, 605–623. [Google Scholar] [CrossRef]
  31. Healy, S.B.; Eyre, J.R.; Hamrud, M.; Thépaut, J.-N. Assimilating GPS radio occultation measurements with two-dimensional bending angle observation operators. Q. J. R. Meteorol. Soc. 2007, 133, 1213–1227. [Google Scholar] [CrossRef]
  32. Cucurull, L.; Derber, J.C.; Treadon, R.; Purser, R.J. Assimilation of Global Positioning System radio occultation observations into NCEP’s Global Data Assimilation System. Mon. Weather Rev. 2007, 135, 3174–3193. [Google Scholar] [CrossRef] [Green Version]
  33. Cucurull, L.; Derber, J.C. Operational implementation of COSMIC observations into NCEP’s Global Data Assimilation System. Weather Forecast. 2008, 23, 702–711. [Google Scholar] [CrossRef]
  34. Aparicio, J.M.; Deblonde, G.; Garand, L.; Laroche, S. Signature of the atmospheric compressibility factor in COSMIC, CHAMP, and GRACE radio occultation data. J. Geophys. Res. 2009, 114, D16114. [Google Scholar] [CrossRef]
  35. Rennie, M.P. The impact of GPS radio occultation assimilation at the Met Office. Q. J. R. Meteorol. Soc. 2010, 136, 116–131. [Google Scholar] [CrossRef]
  36. Anlauf, H.; Pingel, D.; Rhodin, A. Assimilation of GPS radio occultation data at DWD. Atmos. Meas. Tech. 2011, 4, 1105–1113. [Google Scholar] [CrossRef] [Green Version]
  37. Huang, C.-Y.; Kuo, Y.-H.; Chen, S.-H.; Vandenberghe, F. Improvements in typhoon forecasts with assimilated GPS occultation refractivity. Weather Forecast. 2005, 20, 931–953. [Google Scholar] [CrossRef]
  38. Kuo, Y.-H.; Liu, H.; Guo, Y.-R.; Terng, C.-T.; Lin, Y.-T. Impact of FORMOSAT-3/COSMIC data on typhoon and Mei-yu prediction. In Recent Progress in Atmospheric Sciences: Application to the Asia-Pacific Region; Liou, K.-N., Chou, M.-D., Eds.; World Scientific: Singapore, 2008; pp. 458–483. [Google Scholar] [CrossRef] [Green Version]
  39. Chen, S.-Y.; Huang, C.-Y.; Kuo, Y.-H.; Guo, Y.-R.; Sokolovskiy, S. Assimilation of GPS refractivity from FOMOSAT-3/COSMIC using a nonlocal operator with WRF 3DVAR and its impact on the prediction of a typhoon event. Terr. Atmos. Ocean. Sci. 2009, 20, 133–154. [Google Scholar] [CrossRef] [Green Version]
  40. Kueh, M.-T.; Huang, C.-Y.; Chen, S.-Y.; Chen, S.-H.; Wang, C.-J. Impact of GPS radio occultation refractivity soundings on a simulation of Typhoon Bilis (2006) upon landfall. Terr. Atmos. Ocean. Sci. 2009, 20, 115–131. [Google Scholar] [CrossRef] [Green Version]
  41. Huang, C.-Y.; Kuo, Y.-H.; Chen, S.-Y.; Terng, C.-T.; Chien, F.-C.; Lin, P.-L.; Kueh, M.-T.; Chen, S.-H.; Yang, M.-J.; Wang, C.-J.; et al. Impact of GPS radio occultation data assimilation on regional weather predictions. GPS Solut. 2010, 14, 35. [Google Scholar] [CrossRef]
  42. Liu, H.; Anderson, J.; Kuo, Y.-H. Improved analyses and forecasts of Hurricane Ernesto’s genesis using radio occultation data in an ensemble filter assimilation system. Mon. Weather Rev. 2012, 140, 151–166. [Google Scholar] [CrossRef] [Green Version]
  43. Chen, Y.-C.; Hsieh, M.-E.; Hsiao, L.-F.; Kuo, Y.-H.; Yang, M.-J.; Huang, C.-Y.; Lee, C.-S. Systematic evaluation of the impacts of GPSRO data on the prediction of typhoons over the northwestern Pacific in 2008–2010. Atmos. Meas. Tech. 2015, 8, 2531–2542. [Google Scholar] [CrossRef] [Green Version]
  44. Huang, C.-Y.; Chen, S.-Y.; Anisetty, S.K.A.V.P.R.; Yang, S.-C.; Hsiao, L.-F. An impact study of GPS radio occultation observations on frontal rainfall prediction with a local bending angle operator. Weather Forecast. 2016, 31, 129–150. [Google Scholar] [CrossRef]
  45. Ho, S.-P.; Zhou, X.; Shao, X.; Zhang, B.; Adhikari, L.; Kireev, S.; He, Y.; Yoe, J.G.; Xia-Serafino, W.; Lynch, E. Initial assessment of the COSMIC-2/FORMOSAT-7 neutral atmosphere data quality in NESDIS/STAR using in situ and satellite data. Remote Sens. 2020, 12, 4099. [Google Scholar] [CrossRef]
  46. Cao, C.; Wang, W.; Lynch, E.; Bai, Y.; Ho, S.-P.; Zhang, B. Simultaneous radio occultation for intersatellite comparison of bending angles toward more accurate atmospheric sounding. J. Atmos. Ocean. Technol. 2020, 37, 2307–2320. [Google Scholar] [CrossRef]
  47. NCDR WATCH. Available online: https://watch.ncdr.nat.gov.tw/watch_fs7 (accessed on 22 May 2021). (In Chinese)
  48. TACC-Taiwan Data Process Center. Available online: https://tacc.cwb.gov.tw/v2/en/index.html (accessed on 22 May 2021).
  49. Tsonis, A.A. An Introduction to Atmospheric Thermodynamics, 2nd ed.; Cambridge University Press: Cambridge, UK, 2007; pp. 1–187. [Google Scholar]
  50. Gorbunov, M.E.; Gurvich, A.S. Algorithms of inversion of Microlab-1 satellite data including effects of multipath propagation. Int. J. Remote Sens. 1998, 19, 2283–2300. [Google Scholar] [CrossRef]
  51. Liu, H.; Kuo, Y.-H.; Sokolovskiy, S.; Zou, X.; Zeng, Z.; Hsiao, L.-F.; Ruston, B.C. A quality control procedure based on bending angle measurement uncertainty for radio occultation data assimilation in the tropical lower troposphere. J. Atmos. Ocean. Technol. 2018, 35, 2117–2131. [Google Scholar] [CrossRef]
  52. Wang, B.; LinHo. Rainy season of the Asian–Pacific summer monsoon. J. Clim. 2002, 15, 386–398. [Google Scholar] [CrossRef]
  53. Wang, B.; LinHo; Zhang, Y.; Lu, M.-M. Definition of South China Sea monsoon onset and commencement of the East Asia summer monsoon. J. Clim. 2004, 17, 699–710. [Google Scholar] [CrossRef] [Green Version]
  54. LinHo; Wang, B. The time-space structure of the Asian–Pacific summer monsoon: A fast annual cycle view. J. Clim. 2002, 15, 2001–2019. [Google Scholar] [CrossRef]
  55. Saha, S.; Moorthi, S.; Pan, H.-L.; Wu, X.; Wang, J.; Nadiga, S.; Tripp, P.; Kistler, R.; Woollen, J.; Behringer, D.; et al. The NCEP Climate Forecast System Reanalysis. Bull. Amer. Meteor. Soc. 2010, 91, 1015–1058. [Google Scholar] [CrossRef]
  56. Skamarock, W.C.; Klemp, J.B.; Dudhia, J.; Gill, D.O.; Barker, D.M.; Duda, M.G.; Huang, X.-Y.; Wang, W.; Powers, J.G. A Description of the Advanced Research WRF Version 3; NCAR Technical Note NCAR/TN-475+STR; NCAR: Boulder, CO, USA, 2008; pp. 1–125. [Google Scholar] [CrossRef]
  57. Tao, W.-K.; Simpson, J.; Baker, D.; Braun, S.; Chou, M.-D.; Ferrier, B.; Johnson, D.; Khain, A.; Lang, S.; Lynn, B.; et al. Microphysics, radiation and surface processes in the Goddard Cumulus Ensemble (GCE) model. Meteor. Atmos. Phys. 2003, 82, 97–137. [Google Scholar] [CrossRef]
  58. Kain, J.S. The Kain-Fritsch convective parameterization: An update. J. Appl. Meteor. 2004, 43, 170–181. [Google Scholar] [CrossRef] [Green Version]
  59. Jiménez, P.A.; Dudhia, J.; González-Rouco, J.F.; Navarro, J.; Montávez, J.P.; García-Bustamante, E. A revised scheme for the WRF surface layer formulation. Mon. Weather Rev. 2012, 140, 898–918. [Google Scholar] [CrossRef] [Green Version]
  60. Chen, F.; Dudhia, J. Coupling an advanced land surface-hydrology model with the Penn State-NCAR MM5 modeling system. Part I: Model implementation and sensitivity. Mon. Weather Rev. 2001, 129, 569–585. [Google Scholar] [CrossRef] [Green Version]
  61. Hong, S.-Y.; Noh, Y.; Dudhia, J. A new vertical diffusion package with an explicit treatment of entrainment processes. Mon. Weather Rev. 2006, 134, 2318–2341. [Google Scholar] [CrossRef] [Green Version]
  62. Iacono, M.J.; Delamere, J.S.; Mlawer, E.J.; Shephard, M.W.; Clough, S.A.; Collins, W.D. Radiative forcing by long-lived greenhouse gases: Calculations with the AER radiative transfer models. J. Geophys. Res. 2008, 113, D13103. [Google Scholar] [CrossRef]
  63. Zhang, J.; Howard, K.; Langston, C.; Vasiloff, S.; Kaney, B.; Arthur, A.; Van Cooten, S.; Kelleher, K.; Kitzmiller, D.; Ding, F.; et al. National Mosaic and Multi-Sensor QPE (NMQ) system: Description, results, and future plans. Bull. Am. Meteorol. Soc. 2011, 92, 1321–1338. [Google Scholar] [CrossRef] [Green Version]
  64. Kim, T.K. T test as a parametric statistic. Korean J. Anesthesiol. 2015, 68, 540–546. [Google Scholar] [CrossRef] [Green Version]
Figure 1. The daily number of the COSMIC-2/FORMOSAT-7 RO profiles from 1 October 2019 to 26 April 2021.
Remotesensing 13 02979 g001
Figure 2. The distribution of the 59 sampled pairs of COSMIC-2/FORMOSAT-7 RO and radiosonde profiles.
Remotesensing 13 02979 g002
Figure 3. Two monsoon moisture surveillance domains in the South China Sea (110–120°E, 5–15°N) and the Bay of Bengal (80–97.5°E, 0–22.5°N).
Remotesensing 13 02979 g003
Figure 4. The employed triple-nested WRF model domains.
Remotesensing 13 02979 g004
Figure 5. The average (a,b) temperature difference, (c,d) specific humidity difference, and (e,f) precipitable water difference of the sampled COSMIC-2/FORMOSAT-7 RO profiles minus nearby radiosonde profiles for the (a,c,e) sunny and (b,d,f) cloudy/rainy groups. The blue and green curves in (af) denote the average differences and sample numbers, respectively. The red curves in (ad) denote the standard deviations of the temperature and specific humidity differences. The profiles of the paired t-tests for (g) temperature and (h) specific humidity are also shown, where the blue and red curves denote the t values and critical values, respectively.
Remotesensing 13 02979 g005aRemotesensing 13 02979 g005b
Figure 6. The daily total precipitable water in the South China Sea during 26 April–10 June 2020, retrieved with the COSMIC-2/FORMOSAT-7 RO observations (black curve), the CFSR data (blue solid curve), and the analyses of WRF Member 2 (red curve). The blue dotted curve denotes the 41-year (1979–2019) climatological average with the CFSR data.
Remotesensing 13 02979 g006
Figure 7. The daily total precipitable water in the Bay of Bengal during 1 May–30 July 2020, retrieved with the COSMIC-2/FORMOSAT-7 RO observations (black curve) and CFSR data (blue solid curve). The blue dotted curve denotes the 41-year (1979–2019) climatological average with the CFSR data.
Remotesensing 13 02979 g007
Figure 8. The root-mean-square error of the predicted 850-hPa water vapor mixing ratio at 24 h in Domain 2 for the 152 forecasts initialized during 00:00 UTC 26 May–18:00 UTC 2 July 2020, for WRF Members 1 (pink curves) and 2 (red curves).
Remotesensing 13 02979 g008
Figure 9. The (from top to bottom) correlation coefficient, root-mean-square error, and threat score above a 40-mm threshold of the predicted 24–48-h rainfall for the 152 rainfall forecasts initialized during 00:00 UTC 26 May–18:00 UTC 2 July 2020, for WRF Members 1 (pink curves) and 2 (red curves). The green line denotes the forecast initialized at 12:00 UTC 6 June 2020.
Remotesensing 13 02979 g009
Figure 10. The maps of rainfall during 12:00 UTC 7 June–12:00 UTC 8 June 2020, for (from left to right) the radar-derived QPE data and the predicted 24–48-h rainfall of the forecasts initialized at 12:00 UTC 6 June 2020, for WRF Members 1 and 2.
Remotesensing 13 02979 g010
Figure 11. (a) The total track error within 72 h averaged over the 17 forecasts for typhoon Hagupit initialized during 12:00 UTC 1 August–12:00 UTC 5 August 2020, for WRF Members 1 (pink curve) and 2 (red curve); (b) the total track error difference (black curve), along-track error difference (orange curve), and cross-track error difference (purple curve) of WRF Member 1 minus WRF Member 2 within 48 h averaged over the same 17 forecasts, where positive values represent the superiority of WRF Member 2.
Remotesensing 13 02979 g011
Figure 12. The 78-h track forecasts for typhoon Hagupit initialized at 12:00 UTC 1 August 2020, for WRF Members 1 (pink curve), 2 (red curve), 1PC (light purple curve), and 2PC (dark purple curve). The black curve denotes the best track at 6-h intervals from CWB. The green dots denote the COSMIC-2/FORMOSAT-7 RO observations assimilated by WRF Members 2 and 2PC.
Remotesensing 13 02979 g012
Figure 13. The (top) 700-hPa temperature and wind differences as well as (bottom) 850-hPa specific humidity and wind differences of WRF Member 2 minus WRF Member 1 at (from left to right) 0, 24, and 48 h for the forecast sample initialized at 12:00 UTC 6 June 2020. The color shading indicates the temperature and specific humidity differences. The arrows indicate the wind difference. The green dot denotes the COSMIC-2/FORMOSAT-7 RO observation assimilated by WRF Member 2. The gray shading indicates terrain.
Remotesensing 13 02979 g013
Figure 14. The west–east cross-sections of the (a) temperature difference and (b) geopotential height difference of WRF Member 2 minus WRF Member 1 at 6 h for the forecast sample initialized at 12:00 UTC 1 August 2020. The cross-sections pass through the typhoon center denoted by the black lines.
Remotesensing 13 02979 g014
Figure 15. The 850-hPa (a) geopotential height difference and (b) wind speed difference of WRF Member 2 minus WRF Member 1 at 24 h for the forecast sample initialized at 12:00 UTC 1 August 2020. The arrows indicate the wind difference. The green dots denote the COSMIC-2/FORMOSAT-7 RO observations assimilated by WRF Member 2. The dark blue shading indicates terrain.
Remotesensing 13 02979 g015
Figure 16. The 850-hPa (top) geopotential height difference and (bottom) wind speed difference of WRF Member 2PC minus WRF Member 1PC for the (left) analyses at 12:00 UTC 1 August 2020, and (right) 24-h forecasts. The arrows indicate the wind difference. The green dots denote the COSMIC-2/FORMOSAT-7 RO observations assimilated by WRF Member 2. The dark blue shading indicates terrain.
Remotesensing 13 02979 g016
Table 1. The total track error differences (km) of Member 2 minus Member 2PC and Member 1PC minus Member 2PC, where positive values represent the superiority of Member 2PC.
Experiments0 h6 h12 h18 h24 h30 h36 h42 h48 h54 h60 h66 h72 h78 h
Member 2 minus Member 2PC4.5−4.5−2.030.748.790.7115.3115.6150.8184.0201.7190.5217.4235.5
Member 1PC minus Member 2PC33.816.4−8.33.7−0.7−0.28.36.96.137.80.6123.627.368.0
Publisher’s Note: MDPI stays neutral with regard to jurisdictional claims in published maps and institutional affiliations.

