Article

Towards Sustainable Management of Mussel Farming through High-Resolution Images and Open Source Software—The Taranto Case Study

1
Water Research Institute—Italian National Research Council (CNR-IRSA), Via F. De Blasio 5Zona Industriale, 70132 Bari, Italy
2
Environmental Protection Agency of Apulia (ARPA Puglia), Corso Trieste 27, 70126 Bari, Italy
*
Author to whom correspondence should be addressed.
Remote Sens. 2021, 13(15), 2985; https://0-doi-org.brum.beds.ac.uk/10.3390/rs13152985
Submission received: 21 June 2021 / Revised: 23 July 2021 / Accepted: 27 July 2021 / Published: 29 July 2021

Abstract

:
This research activity, conducted in collaboration with the Aero-Naval Operations Department of the Guardia di Finanza of Bari as part of the Special Commissioner for urgent measures of reclamation, environmental improvements and redevelopment of Taranto’s measurement, is based on the use of a high-resolution airborne sensor, mounted on board a helicopter to identify and map all in operation and abandoned mussel farming in the first and second inlet of Mar Piccolo. In addition, factors able to compromise the environmental status of the Mar Piccolo ecosystem were also evaluated. The methodological workflow developed lets extract significant individual frames from the captured video tracks, improves images by applying five image processing algorithms, georeferences the individual frames based on flight data, and implements the processed data in a thematic Geographical Information System. All mussel farms, in operation and derelict, all partially submerged and/or water-coated invisible to navigation poles and other elements such as illegal fishing nets and marine litter on the seabed up to about 2 m deep, have been identified and mapped. The creation of an instant, high-precision cartographic representation made it possible to identify the anthropogenic pressures on the Mar Piccolo of Taranto and the necessary actions for better management of the area.

Graphical Abstract

1. Introduction

The recent development of remote sensing techniques has contributed significantly to improving the ability to monitor coastal areas more efficiently, providing cost-fitting spatially distributed data [1,2].
Many different observing sensors are used to measure the qualitative parameters of water bodies, i.e. suspended sediments, dissolved organic matter (DOM), chlorophyll-a, and pollutants, map coastal areas and monitor anthropogenic pressures [3].
They are divided into two main categories based on the platforms used to locate them. Airborne sensors are assembled on a platform within the Earth’s atmosphere (i.e. helicopter, aircraft, etc.), and spaceborne sensors are mounted on spacecraft or satellites outside of the Earth’s atmosphere [4].
Airborne sensors have greater spectral and spatial resolutions compared to space-borne sensors [5,6].
Among the most commonly used sensors, there are digital cameras, Light Detection and Ranging (LiDAR), Synthetic-aperture radar (SAR), MultiSpectral and Iperspectral Scanner [7]. However, each platform has advantages and disadvantages necessary to know to choose the more appropriate instruments to achieve work objectives (Supplementary Material, Tables S1–S3) [7,8,9,10].
Among the remote-sensing applications interesting is mapping mussels aquaculture farms using high-resolution images acquired from different sources [11].
The primary role of mussel aquaculture is to provide food, but it also has an important ecological role through carbon fixation and, therefore, contributes to improving coastal ecosystems’ capacity to absorb atmospheric CO2 from anthropic sources [12,13].
However, the massive expansion of mussel aquaculture started in the 1990s continued to proliferate rapidly [12]. This significant development took place in establishing several illegals farms due to inadequate control and management. Consequently, mussel aquaculture became a considerable pressure for natural resources by producing large quantities of decomposing biomass that leads to eutrophication of the waters and enhancing potentially harmful algal blooms with effects on local and migratory wildlife and the aesthetic value of the coastal area [14].
Traditional mapping aquaculture farms are currently being developed on-site, including Global Positioning Systems (GPS) [2,15]. However, these methods appear expensive for the cost of field survey, time-consuming and potentially dangerous for the physical restrictions that make navigation difficult. In this context, mussel farms, distributed over vast areas, are difficult to detect and monitor with traditional monitoring devices.

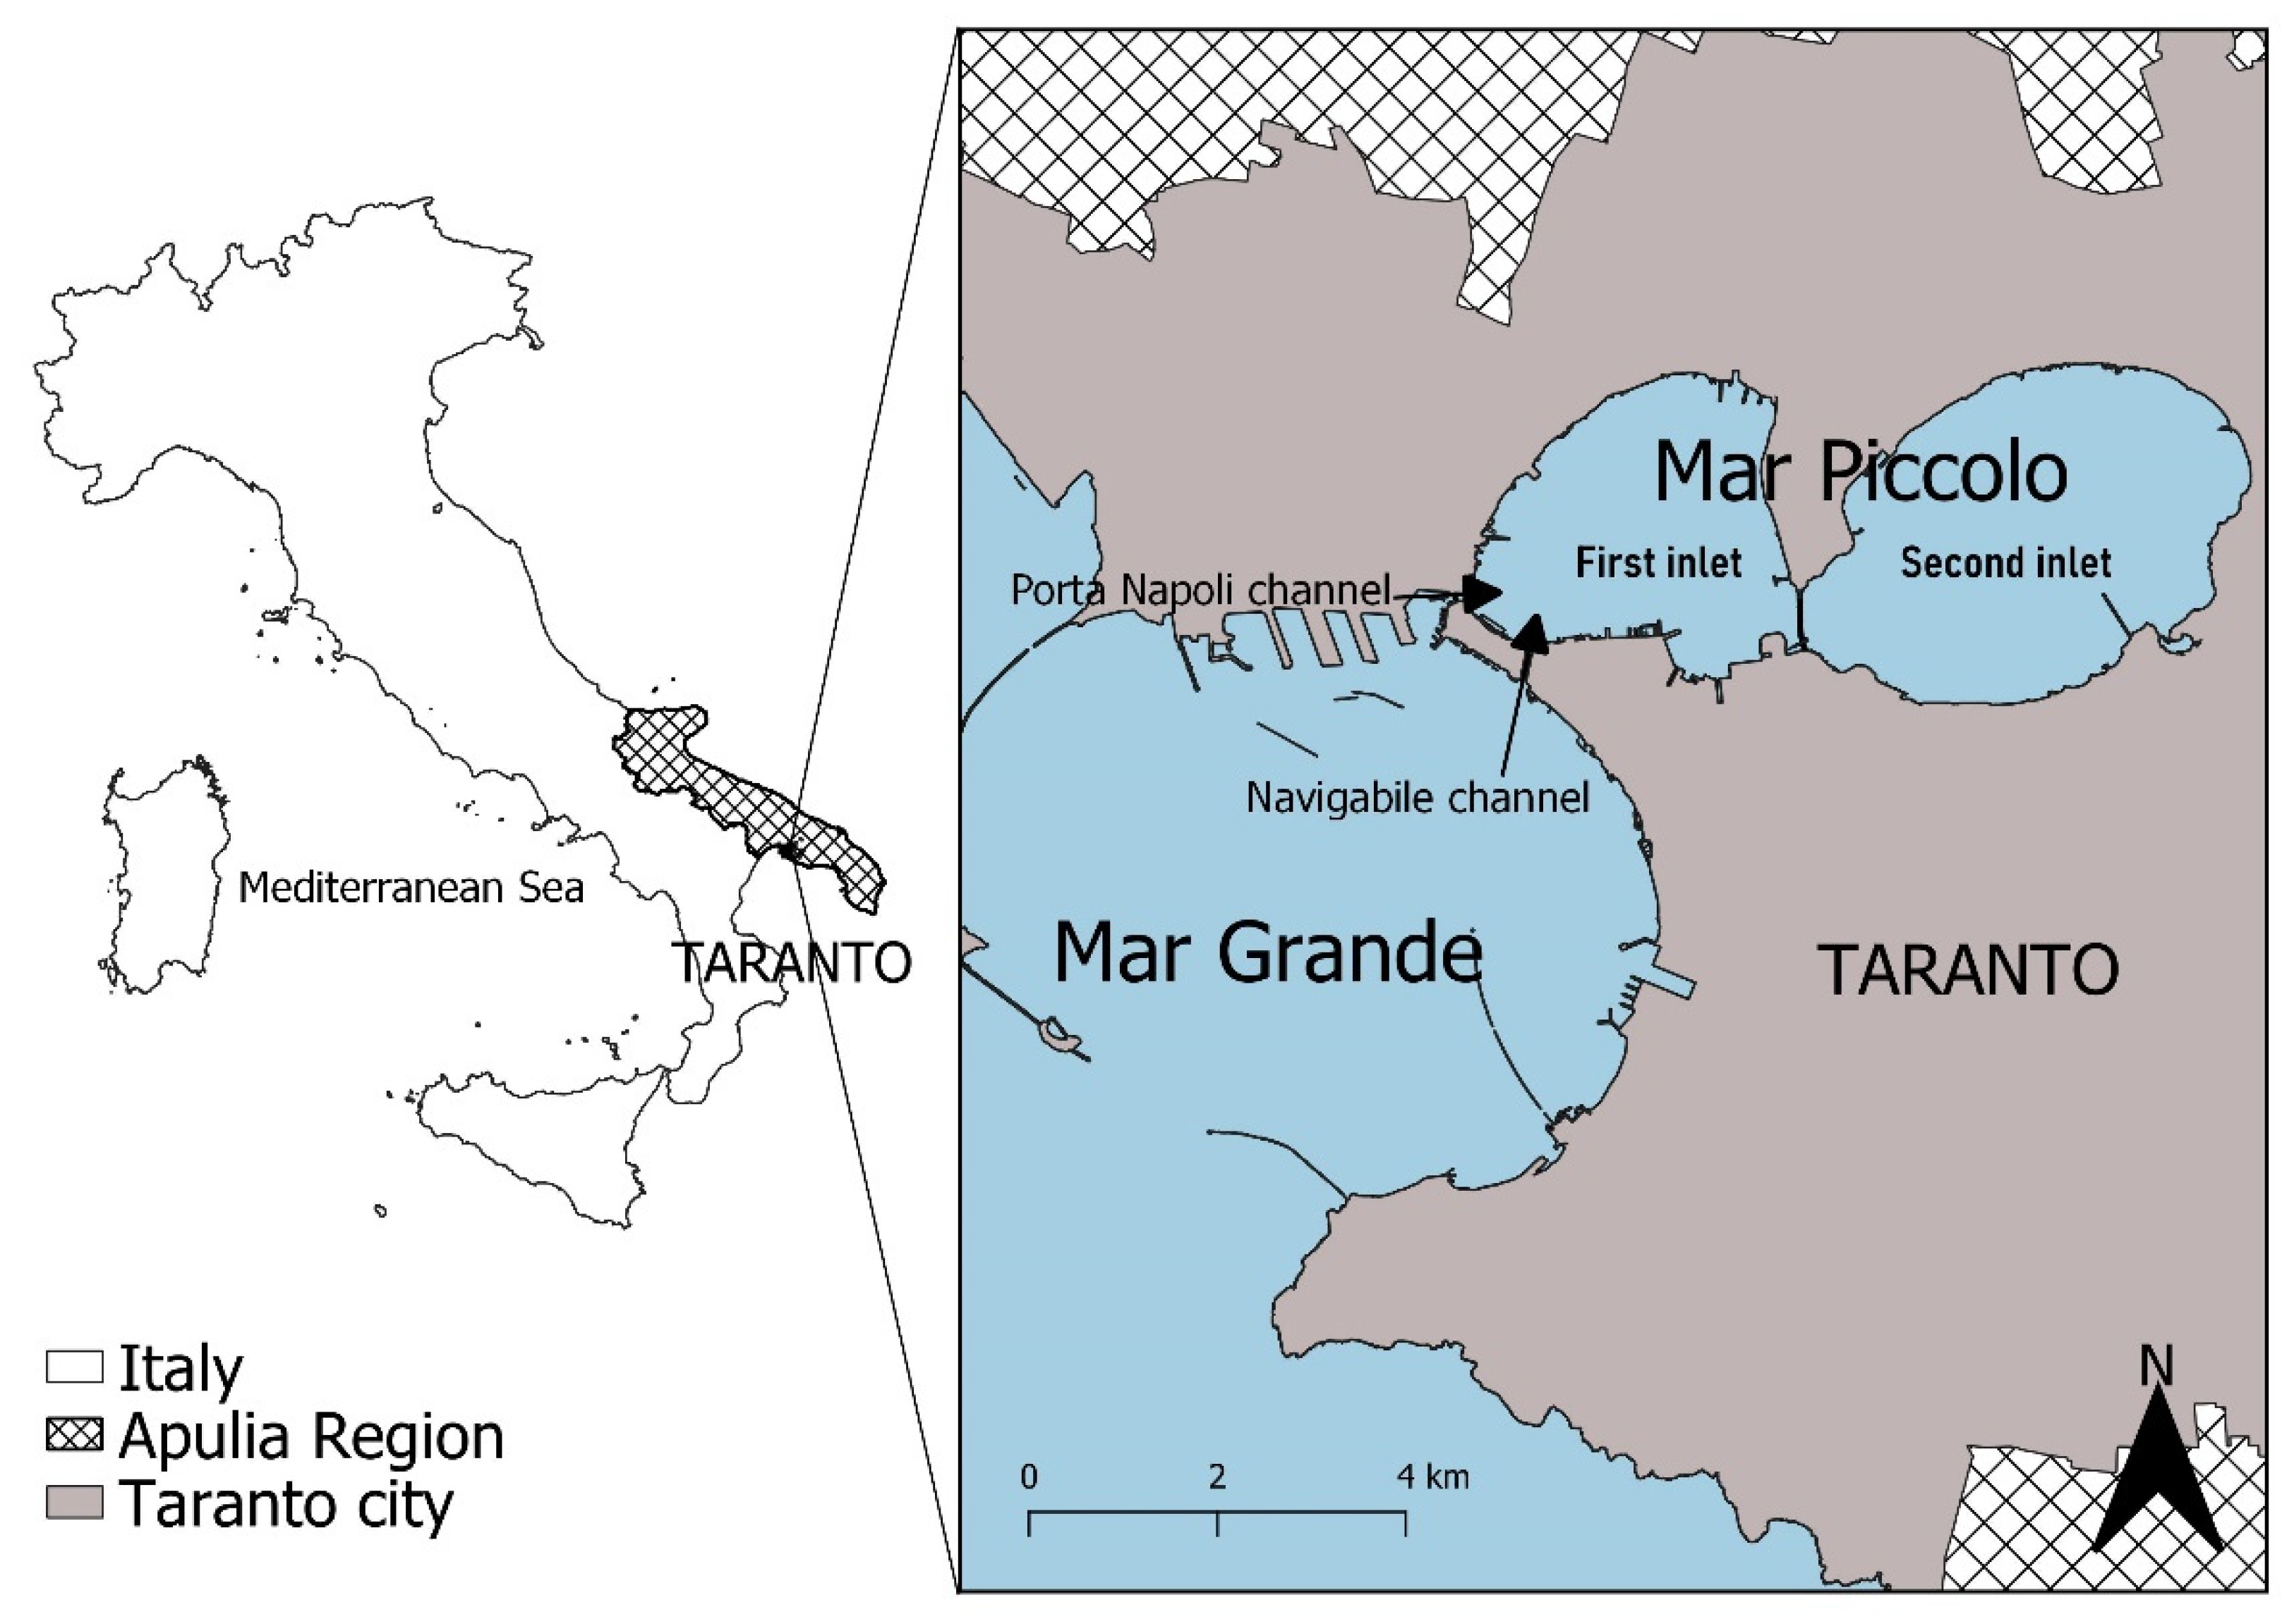
1.1. Framework and Criticalities of the Study Area

The experimental site is located in the Southern ItalyApulia Region; it is the Mar Piccolo of Taranto, in the northern part of the town (Figure 1). This transitional water system is characterised by an enclosed basin that shows lagoon characteristics due to numerous submarine freshwater springs, knows as “citri” [16,17,18]. These submarine springs, supplied by an underlying karst aquifer, recharge the Mar Piccolo with freshwater, which influences the equilibrium of its ecosystem and provides it with the features of a transition environment [19,20].
The total surface area of the basin (20.72 km2), divided into two inlets, called first (west) and second (east) inlet, which have a maximum depth of 18 m and 29 m [21] at the citri and 8 m and 13 m as average values, respectively. The Mar Piccolo is connected with the Mar Grande through two channels, the Navigabile and the Porta Napoli channels (Figure 1). The tidal range does not exceed 30–40 cm [22]. The circulation of sea waters in the Mar Piccolo is influenced not only by the semi-enclosed characteristics but also by human infrastructure [23]. Due to its peculiar characteristics, the Mar Piccolo is one of the major mussel farming sites in the Mediterranean Sea, with a maximum production capacity of about 60.000 t/y [24,25].
Mussel farming is one of the oldest practices in aquaculture of the Taranto area [24], particularly in the Mar Piccolo. It is dated back to the end of the 17th century and was carried out on fixed structures that have remained almost similar to this day. Techniques are based on the empirical knowledge of mussel farmers handed down from father to son for centuries. It assumes high socio-economic importance in Taranto, and cooperatives or individual firms traditionally practise it often family-run without a real management collaboration plan. The entire sector comprises 37 individual cooperatives, employing about 900 farmers (300 full time and 600 part-time) [24]. However, it is not easy to quantify the annual turnover, which is in the order of M€ [26].
The current legal framework, through the Ordinance of the Taranto Port Authority n°107/2005 (subsequently amended and supplemented by Ordinance n°222/2009 [27] regulates the mooring, transit and anchorage of nautical vehicles and people in the first and second inlets of the Mar Piccolo, outlining the profile of mussel plants in the two water basins. In addition, different regulations apply to the two inlets: for the first inlet, the Ordinance of the President of the Regional Council n°532 of 13 September 2018 [28] in which it is forbidden for mussels to exceed 28 mm in this sub-basin due to accumulation of water contaminants; for the second inlet, a fixed monitoring station was identified for the health surveillance of mussel farming areas under EC regulation n°854/04 [29].
If, on the one hand, mussel farming represents a characteristic of the Taranto area and products are particularly appreciated, on the other hand, this practice contributes to increasing pollution. In particular, mussel farming causes the accumulation of marine litter, especially plastic waste ghost nets [30] in the Mar Piccolo basin.
In recent decades serious organisational and management deficiencies have led to a deterioration in the quality of the mussels produced. In July 2011, following the detection of dioxins and polychlorinated biphenyl dioxins-like (PCB—DL) in the mussels of the first inlet, its collection and handling was banned [26].
In addition, the lack of maintenance has favoured over the years the accumulation of ancient structures to the point that abandoned farming areas become a source of danger to shipping or are illegally occupied without authorisation. Hence, through accurate spatial planning, regulating mussel production is essential to ensure sustainable use of marine resources [31].
Due to this poor management of permits, licenses and concessions, illegal phenomena, industrial pollution, and climate change affected mussel quality and productivity [32,33,34]. This area is included within the Italian Sites of National Interest (SIN) of Taranto, which needs urgently environmental remediation [35]. More recently, the Mar Piccolo has been the subject of several studies to identify strategies for the site’s reclamation [36,37].
As generally happens in this type of activity, data coming from mussels cultivation are highly variable, aggregated and poorly documented. However, valid and reliable data is here reported: the production of mussels in 2010 is close to 40,000 tons/year, in the Mar Piccolo, of which about 13,000 t/year in the first inlet [24,26].

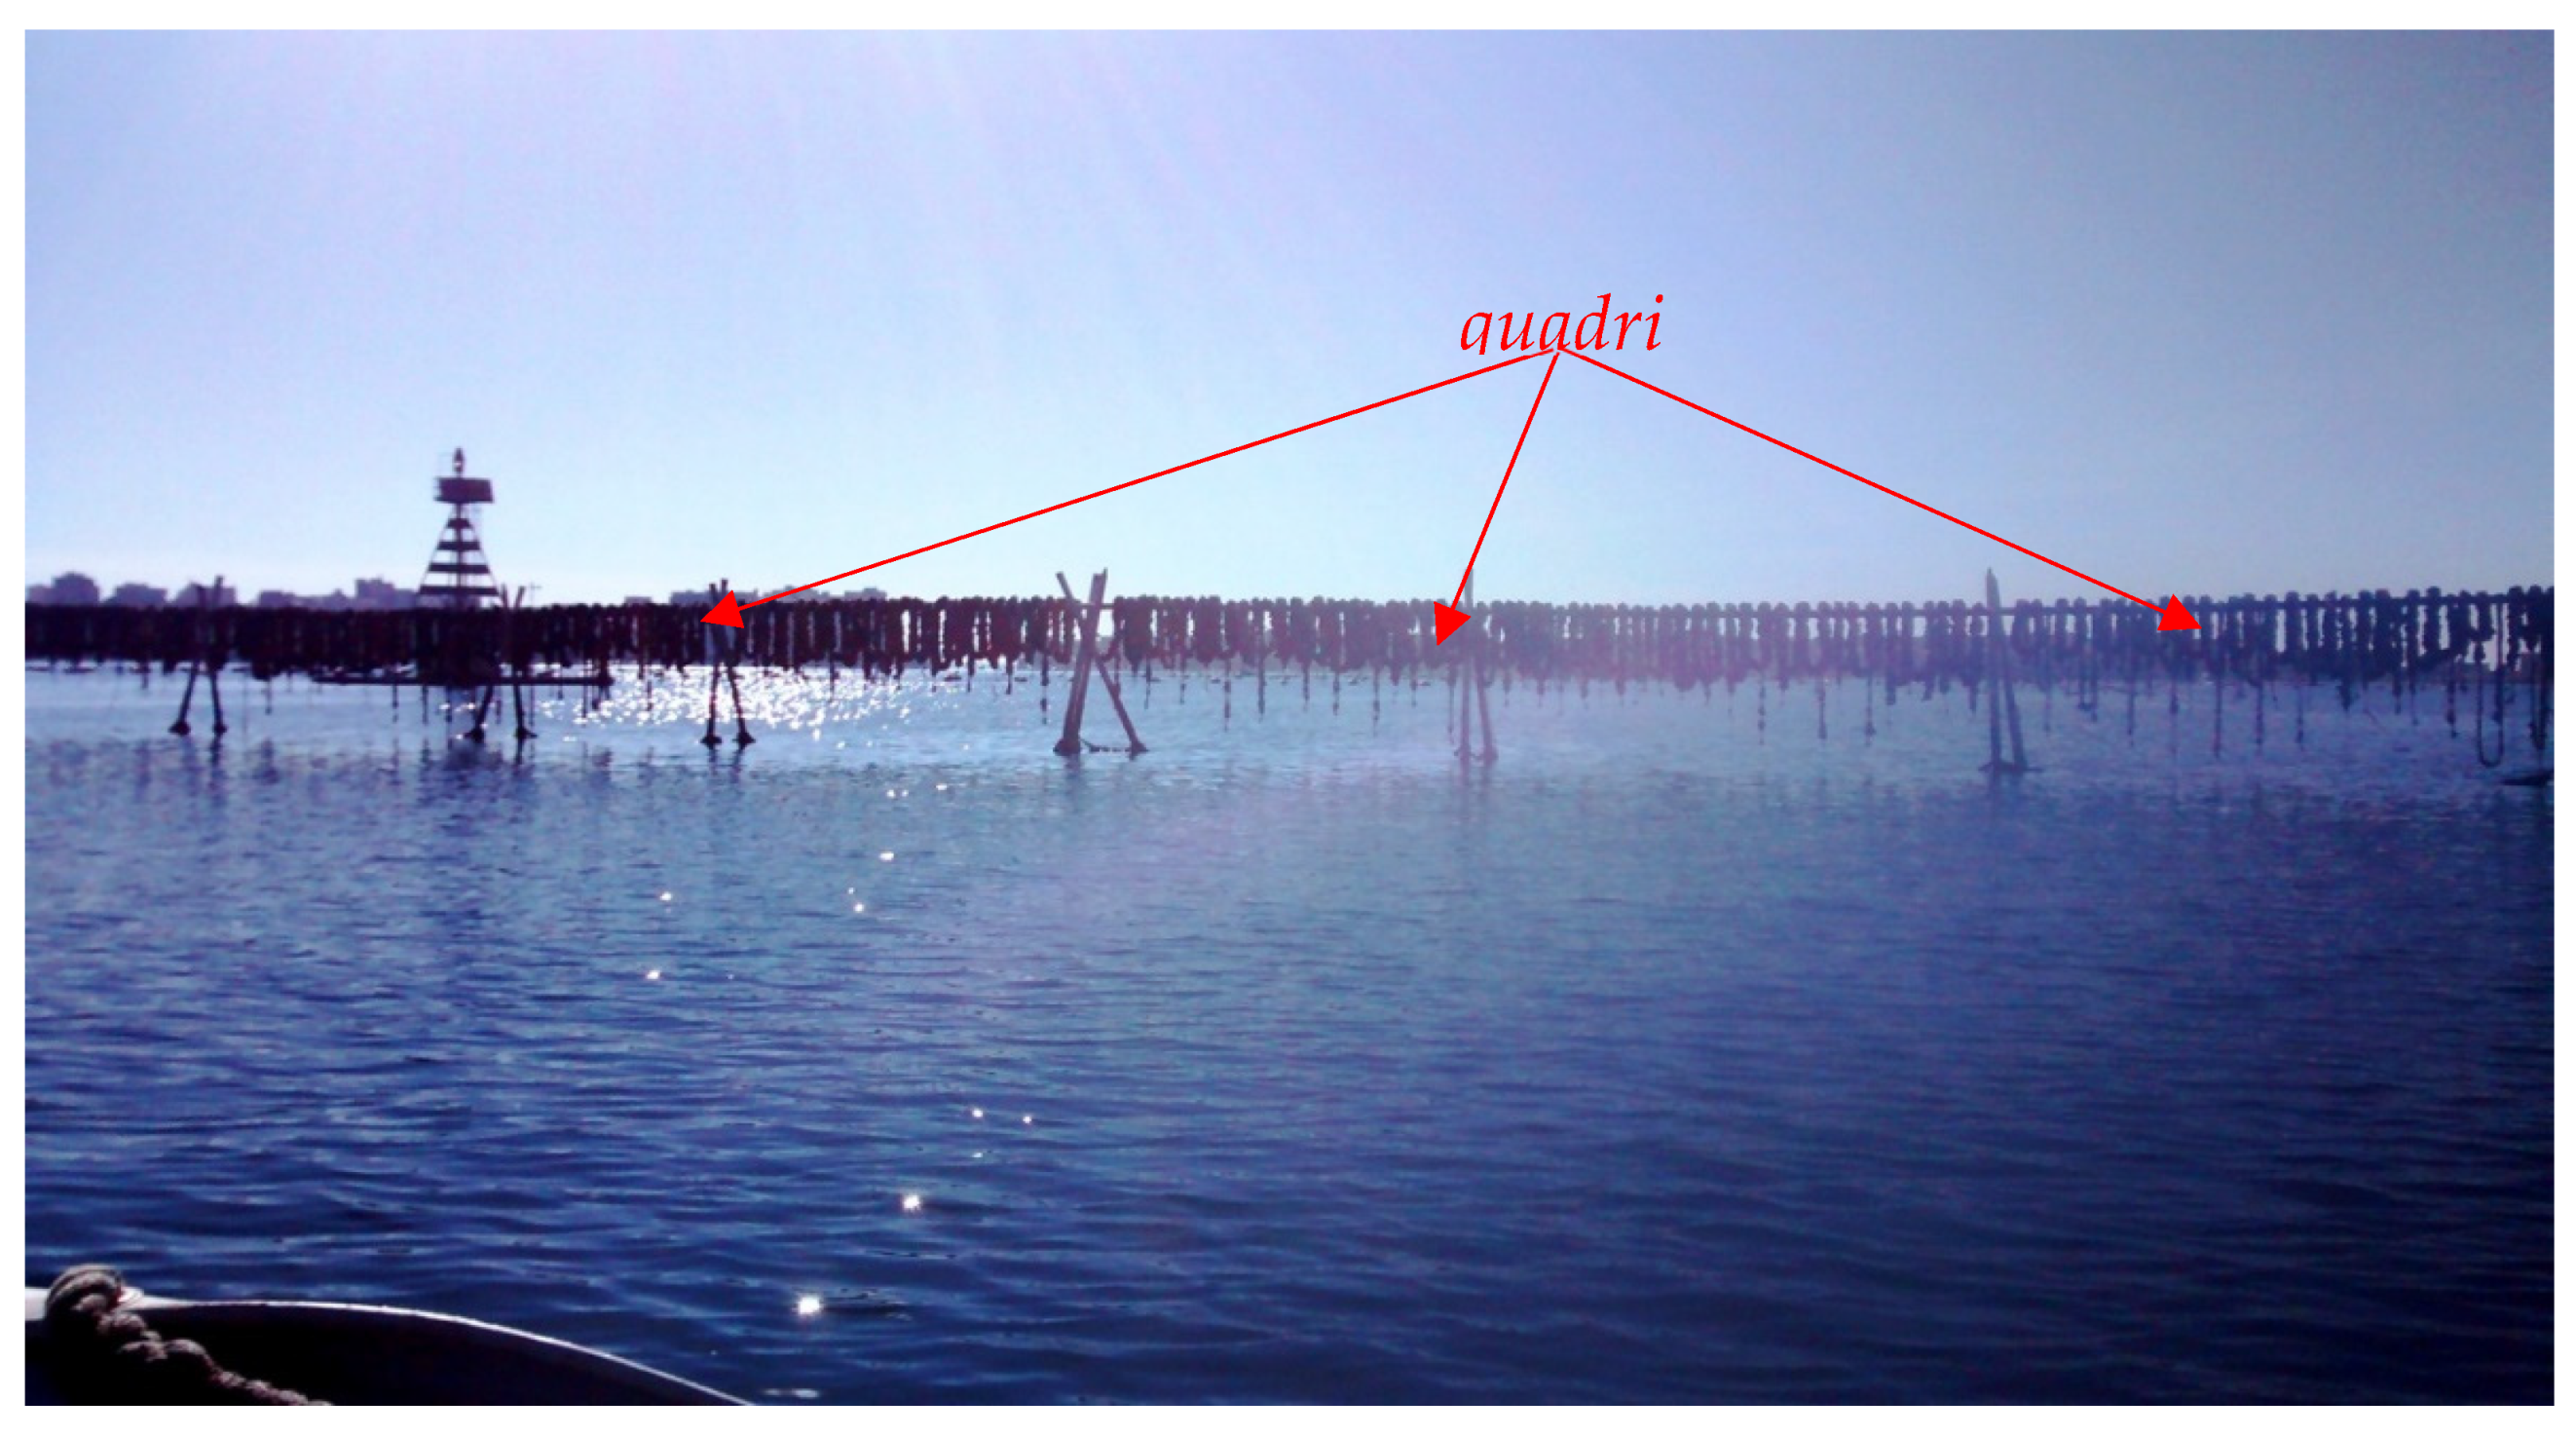
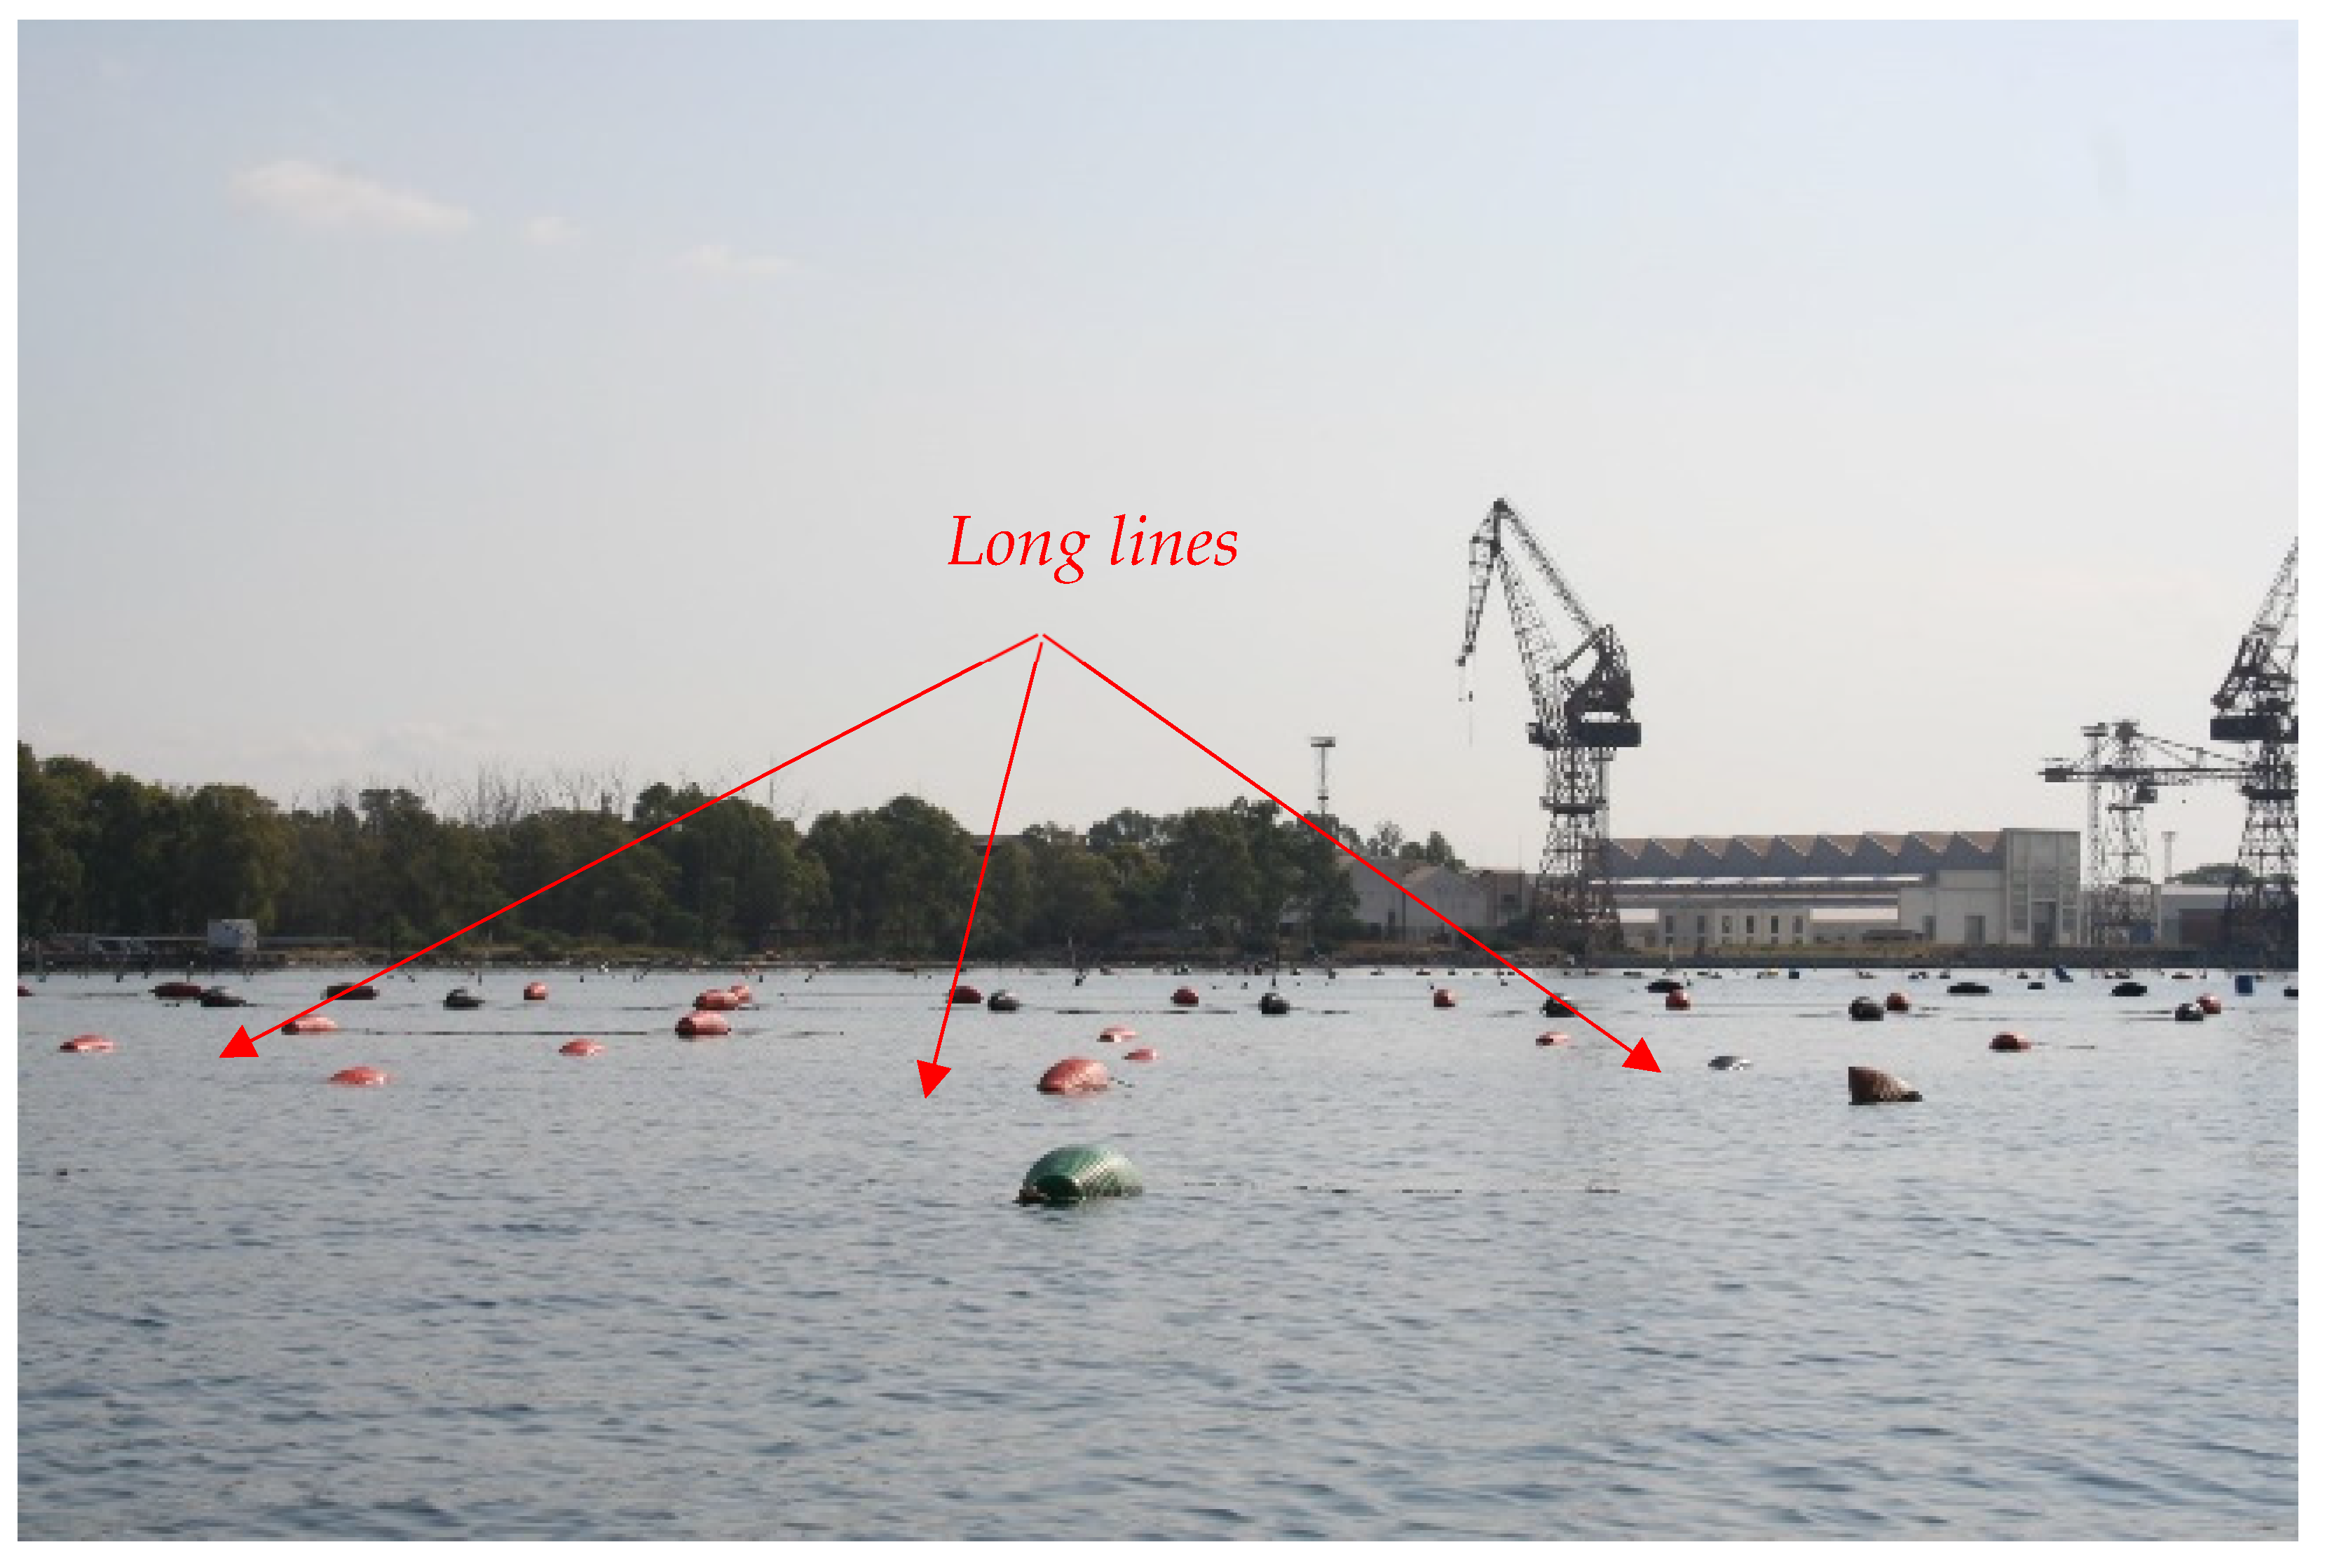
1.2. Mussel Farms of Mar Piccolo

The Mar Piccolo of Taranto is the Mytilus galloprovincialis L. historical breeding site, representing a significant socio-economic activity.
A high density of mussel farms characterises the study site. Among these are recognisable traditional plants called quadri (Figure 2), built with chestnut poles and synthetic strings [38], and those created using plastic materials [39], to form the latest long lines (Figure 3) [24].
Mussel crops, called squares, are formed by a variable number (4–6) of parallel rows of chestnut wood poles for the tip at the bottom of the sea. Under the sea’s surface, the poles are connected by ropes of synthetic material, called libàni.
Each module consists of a rope, generally of polypropylene, called ventìa, whose thickness varies between 40 and 50 mm and whose length is not less than 5 m. The floats placed at the two ends of the ventìa were anchored to the bottom using dead bodies in concrete, with an anchoring function, with polyethene or polypropylene cables, whose length varies according to the bathymetry of the site. The ventìa has the function of supporting the reste, tubular stockings in which the mussels are grafted and supporting growth.
In the last decades, the availability of floats in plastic material has allowed the construction of floating systems, called long lines, which have spread, progressively replacing the systems with poles. These floating suspension farms are typical of inland seas and lagoons, such as the Mar Piccolo.

1.3. Objectives of the Work

The activity reported in the present work was born as part of the actions undertaken by “Special Commissioner for urgent measures of reclamation, environmental improvements and redevelopment of Taranto”, in cooperation with National Research Council, University of Bari Aldo Moro and Apulian Aero Naval Regional Command of the Finance Police. It is titled: “Interventions for the mitigation of impacts on the Mar Piccolo”.
The general objective of the present study is to develop a methodology that combines High-Resolution airborne images with open-source software for the elaboration of data aimed to map aquaculture mussel farms in the “Mar Piccolo” of Taranto city (South Italy).
Moreover, the specific aims of the study referred to the study case of Taranto were:
  • realise a census of all the mussels farms in the first and second inlet of the Mar Piccolo providing accurate information on the number of units, the precise location through georeferentiation, the area, perimeter and density of mussel farms;
  • identify and georeferencing abandoned cultivation fields for which navigation can be dangerous;
  • identify illegal installations and provide details necessary to local port authorities to define the appropriate management interventions of the area
  • detect any unauthorised anthropogenic action and environmental pressures that may alter the profile of the marine ecosystem in terms of overfishing
  • plan strategies for the surveillance, remediation and restoration of the Mar Piccolo area
These problems and criticalities have been showing up lately as over time no remediation operations have ever been carried out on the systems that have gone into disrepair and now creates severe problems for the Mar Piccolo ecosystem and navigation, as they are real hidden dangers (Figure 4).

2. Materials and Methods

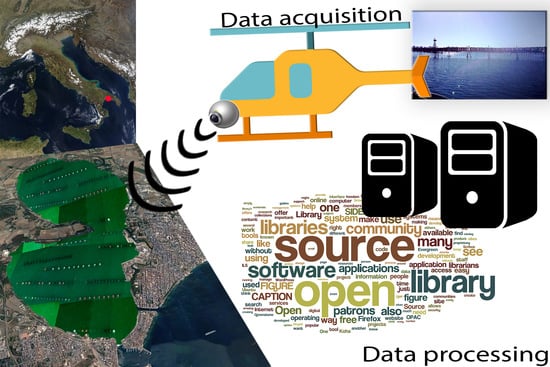
2.1. Data Acquisition

2.1.1. Sensor Characteristics

The Leonardo Electro-Optic Surveillance System (LEOSS) is the latest multi-sensor, high accuracy, four axes gyro-stabilised for aerial surveillance applications, designed to be compliant with demanding vibration profiles. The system combines high-performance sensors capable of meeting the requirements of advanced fixed and rotary-wing aerial platforms. The Optronic Turret Unit (OTU) is the central unit of the system that, through the IR (Infrared) and CCD (Change Couple Device) sensors, produces the visible and infrared vision of the framed scene. Among the electro-optical sensors of the system, there are a High Definition Color Camera, TVC-HD; an IR SD (Standard Definition) camera and a Short-wave Infrared (SWIR) camera.
The TVC-HD Camera is a High Definition Serial Digital Interface whit CMOS technology. It produces an image of 1920 × 1080 pixels and has a 40X optical zoom up to NFOV 0.5° any more than a 4X digital zoom.
The IR SD Camera works in the 3–5 micron IR spectrum. It produces an image of 640 × 512 pixels and has optics SD and 2× optical zoom whit a Narrow Field of View (NFOV) of 0.6° × 0.48°.
The SWIR camera, on the other hand, offers the possibility to observe scenarios with low visibility (haze, fog, fumes); it is set to work in the 0.9–1.7 micron spectrum and produces an image of 640 × 512 pixels. The optic has a High Field of View (HFOV) from 27° to 0.7° and a 40× optical zoom integrated whit 4× digital zoom.
The sensor is mounted on an AgustaWestland AW-109N Nexus helicopter.

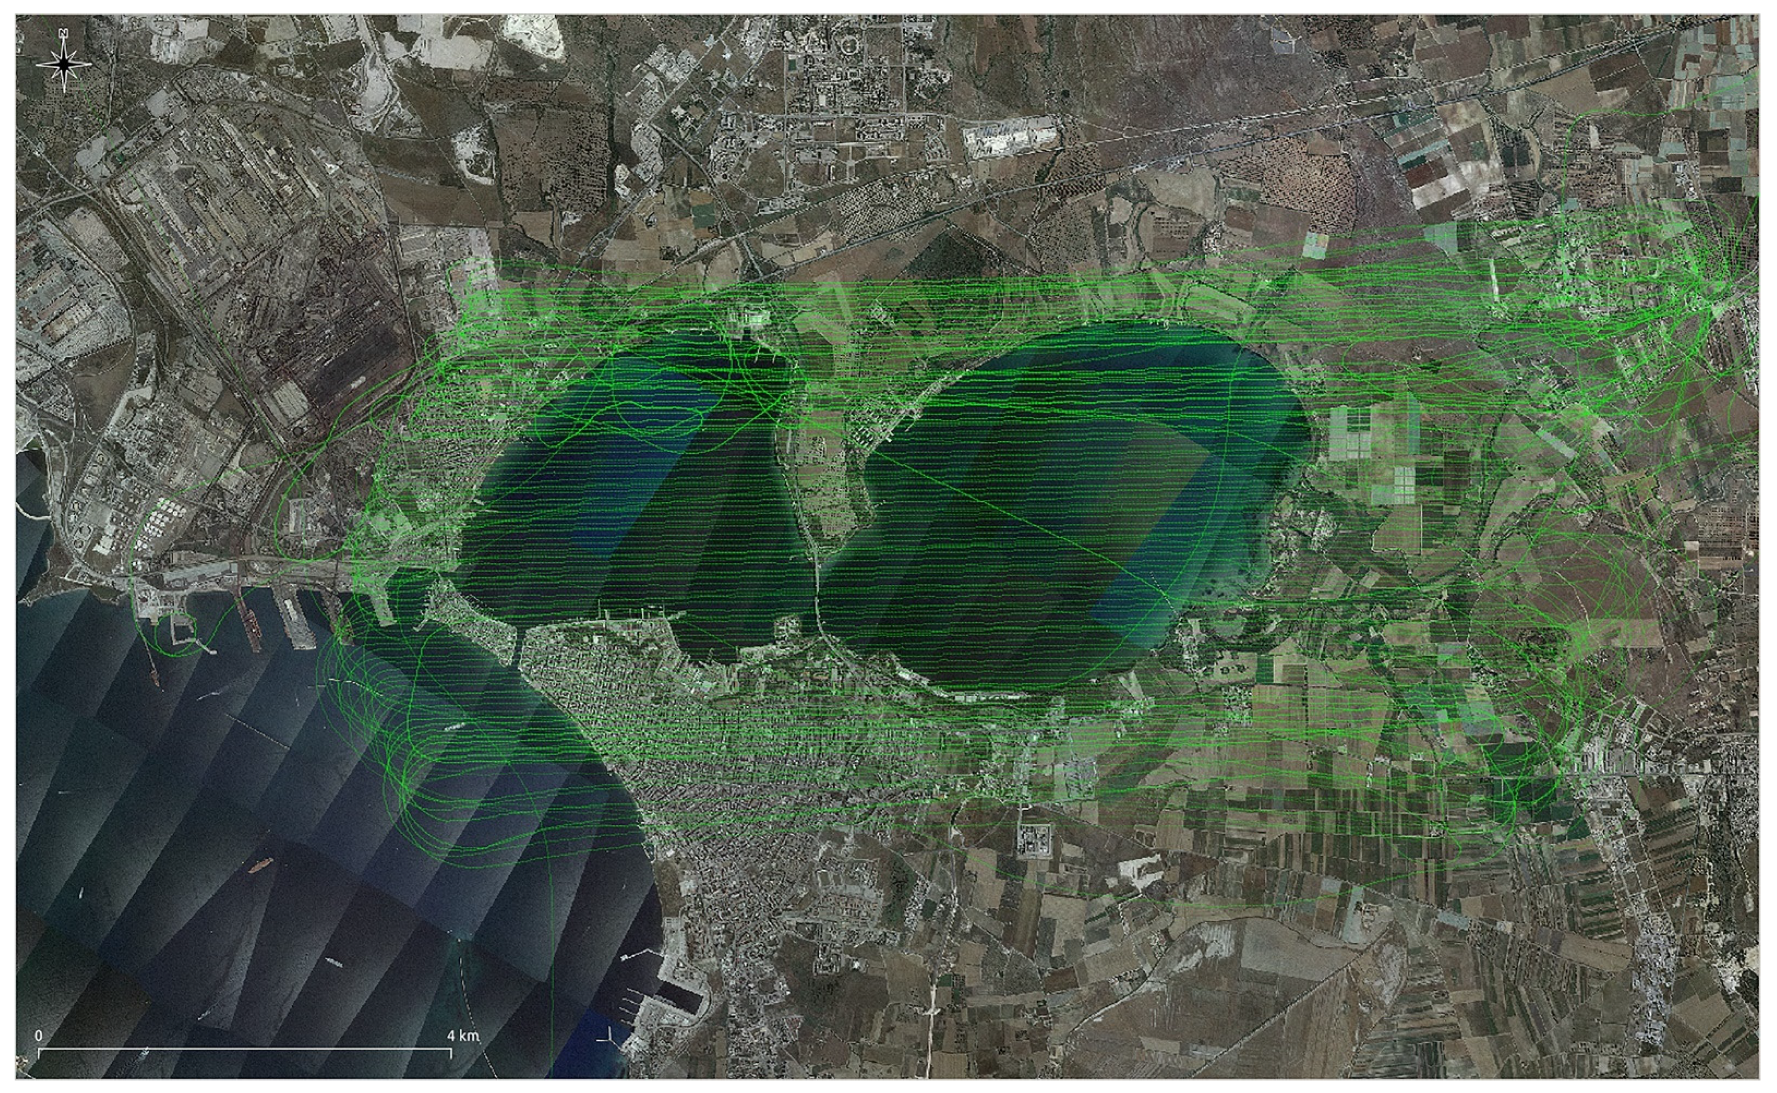
2.1.2. Planning of Flight

The flights were carried out in eight days of activity from 17 to 25 June 2018. In total, eighty-three video tracks for over 34GB of archive data have been acquired.
The optical data for each swipe consist of video files with an average duration of 3 minutes and 30 seconds, with a frame rate of 25 frames/second and resolution of 1920 × 1080 pixels in AVI format, for a final resolution on the ground of 5 cm.
All the flight paths used were georeferenced to understand the totality of the activity carried out in the overflights of the Mar Piccolo. The trajectories were processed by combining the information provided by the GNSS receiver and the inertial platform on board the helicopter with the information provided by the permanent GNSS stations of Ginosa, Valenzano and Fasano. The precision processing of the trajectories is necessary to correctly identify the position and orientation of sensors during the flight. The files generated by the onboard navigation system are called logbooks; they have been exported in CSV exchange format and contain the following information: date, time, latitude, longitude, altitude of helicopter and the observed object, roll, pitch, yaw. Figure 5 shows all the flight trajectories (set of all georeferenced points) performed obtained from the logbooks of the onboard instrumentation. All data were planimetrically reported in the WGS 84/UTM zone 33N reference system, EPSG 32633.

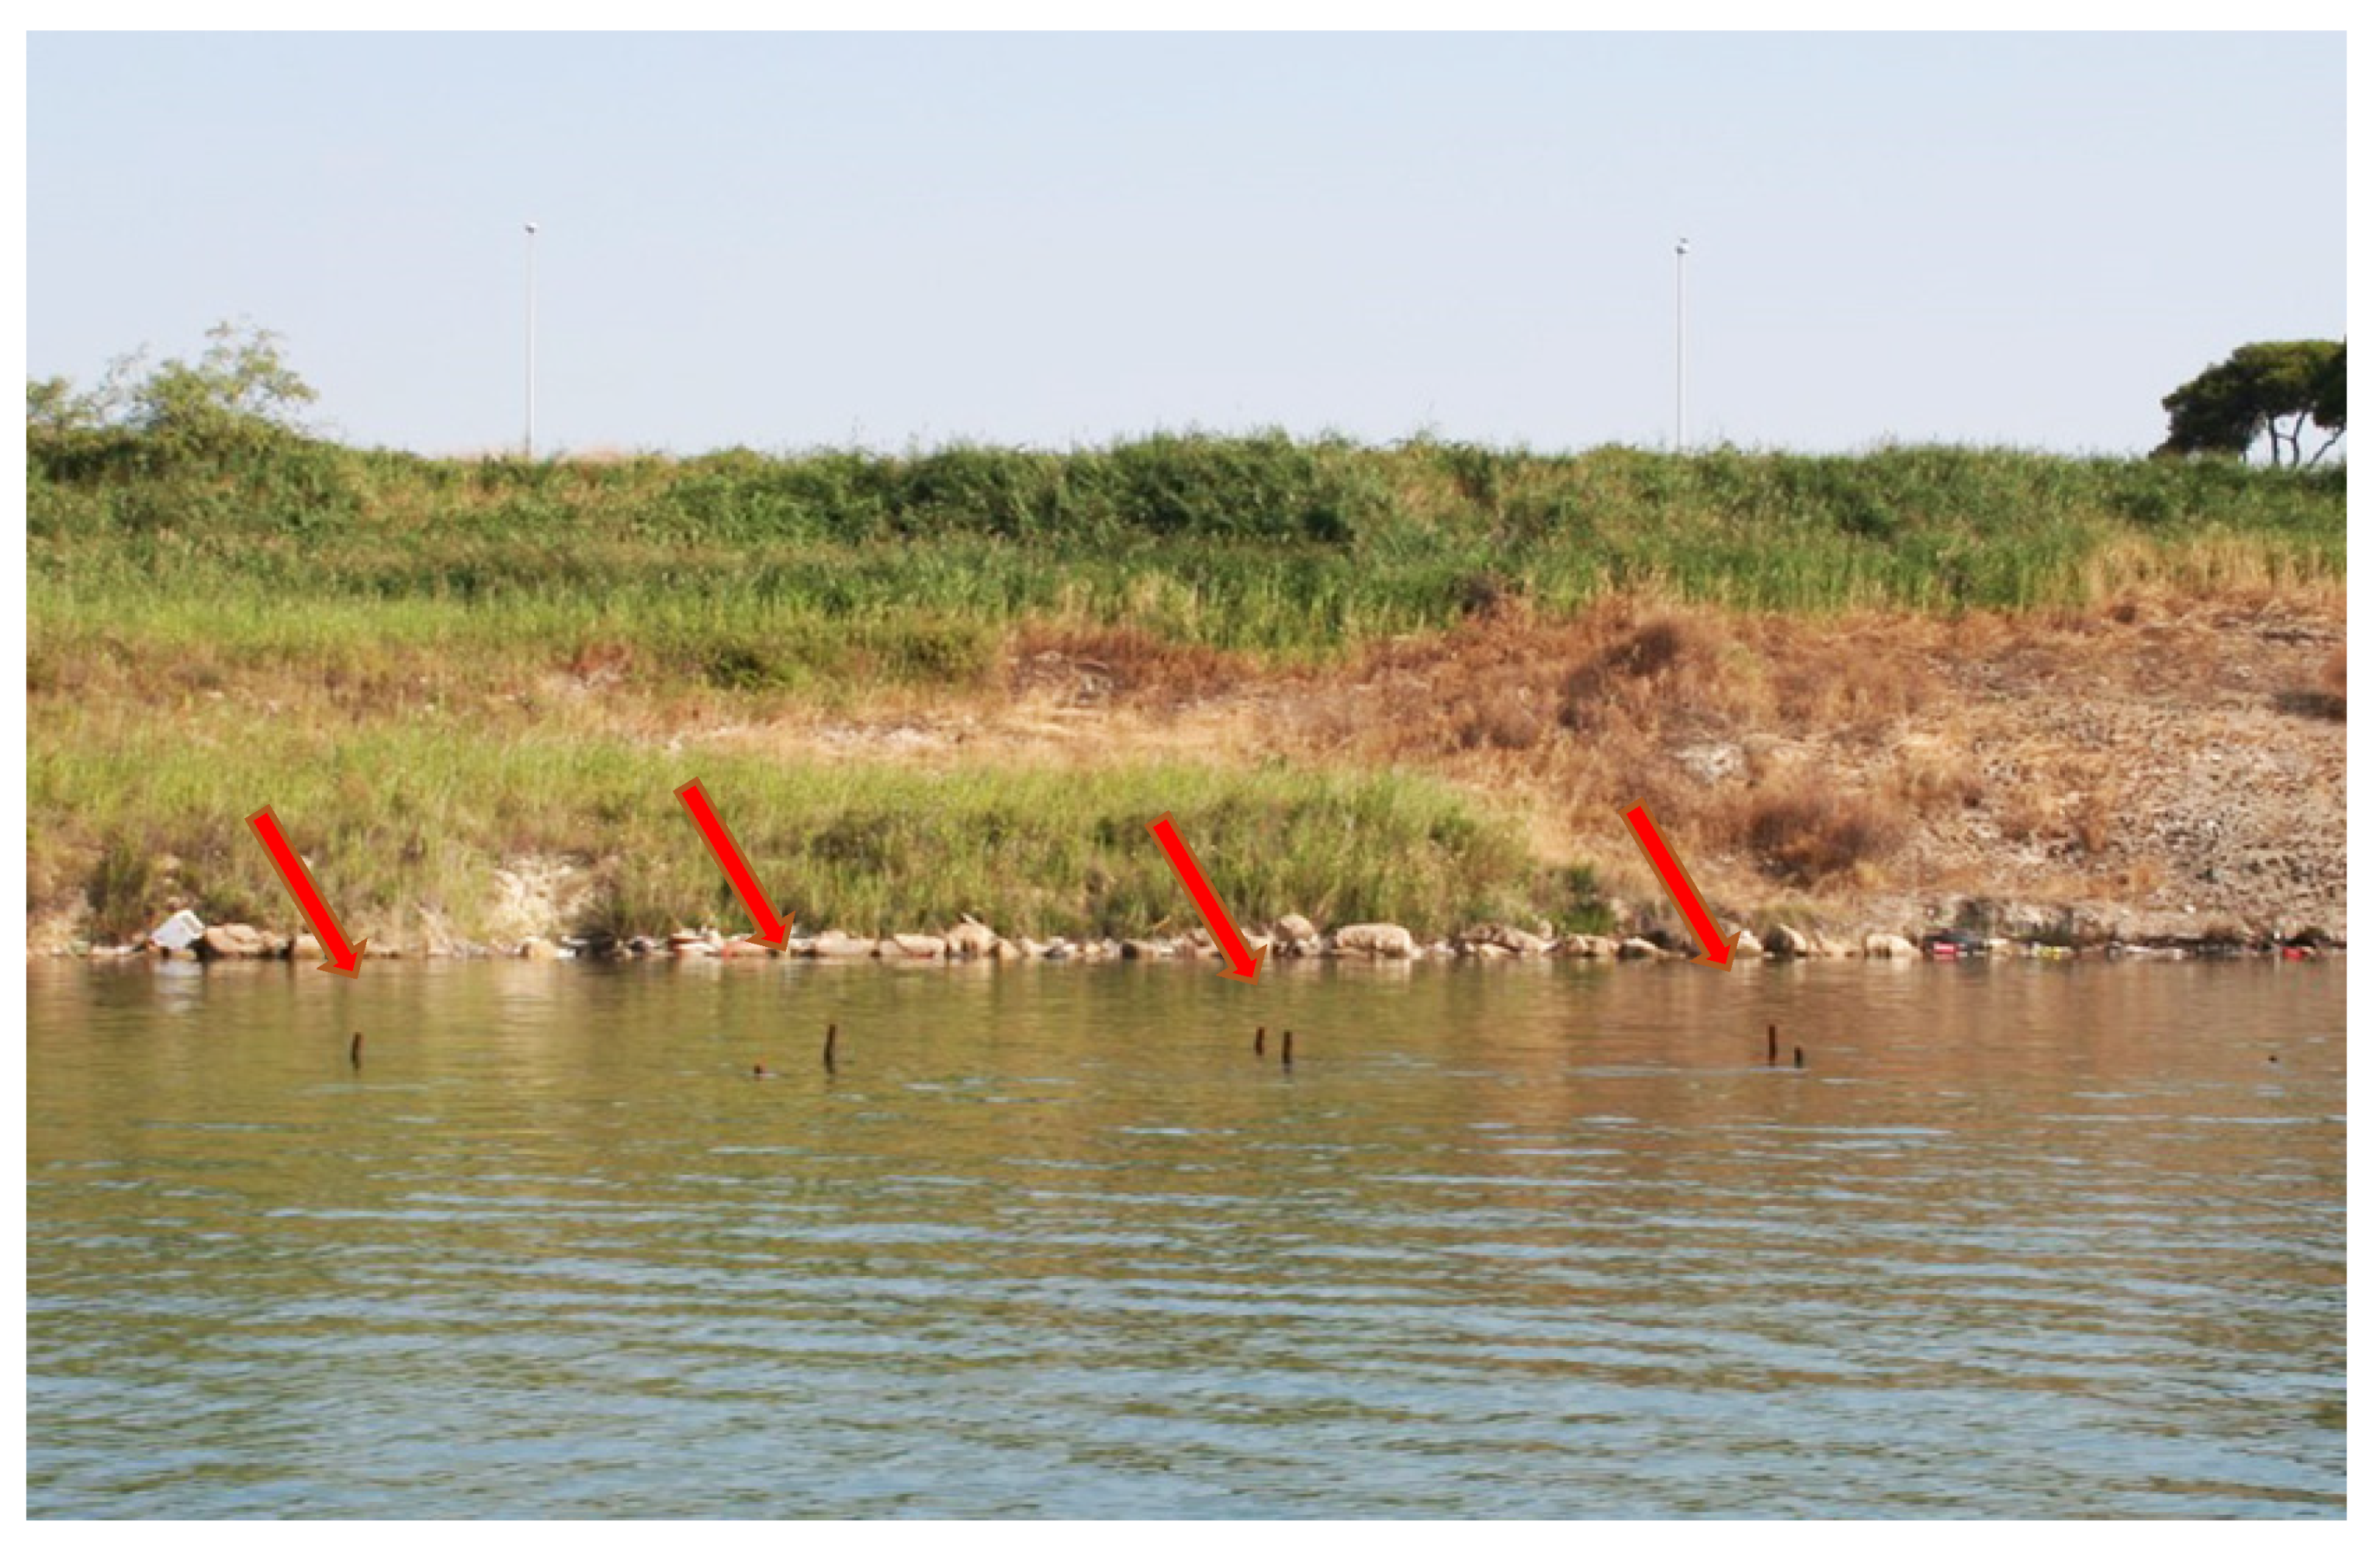
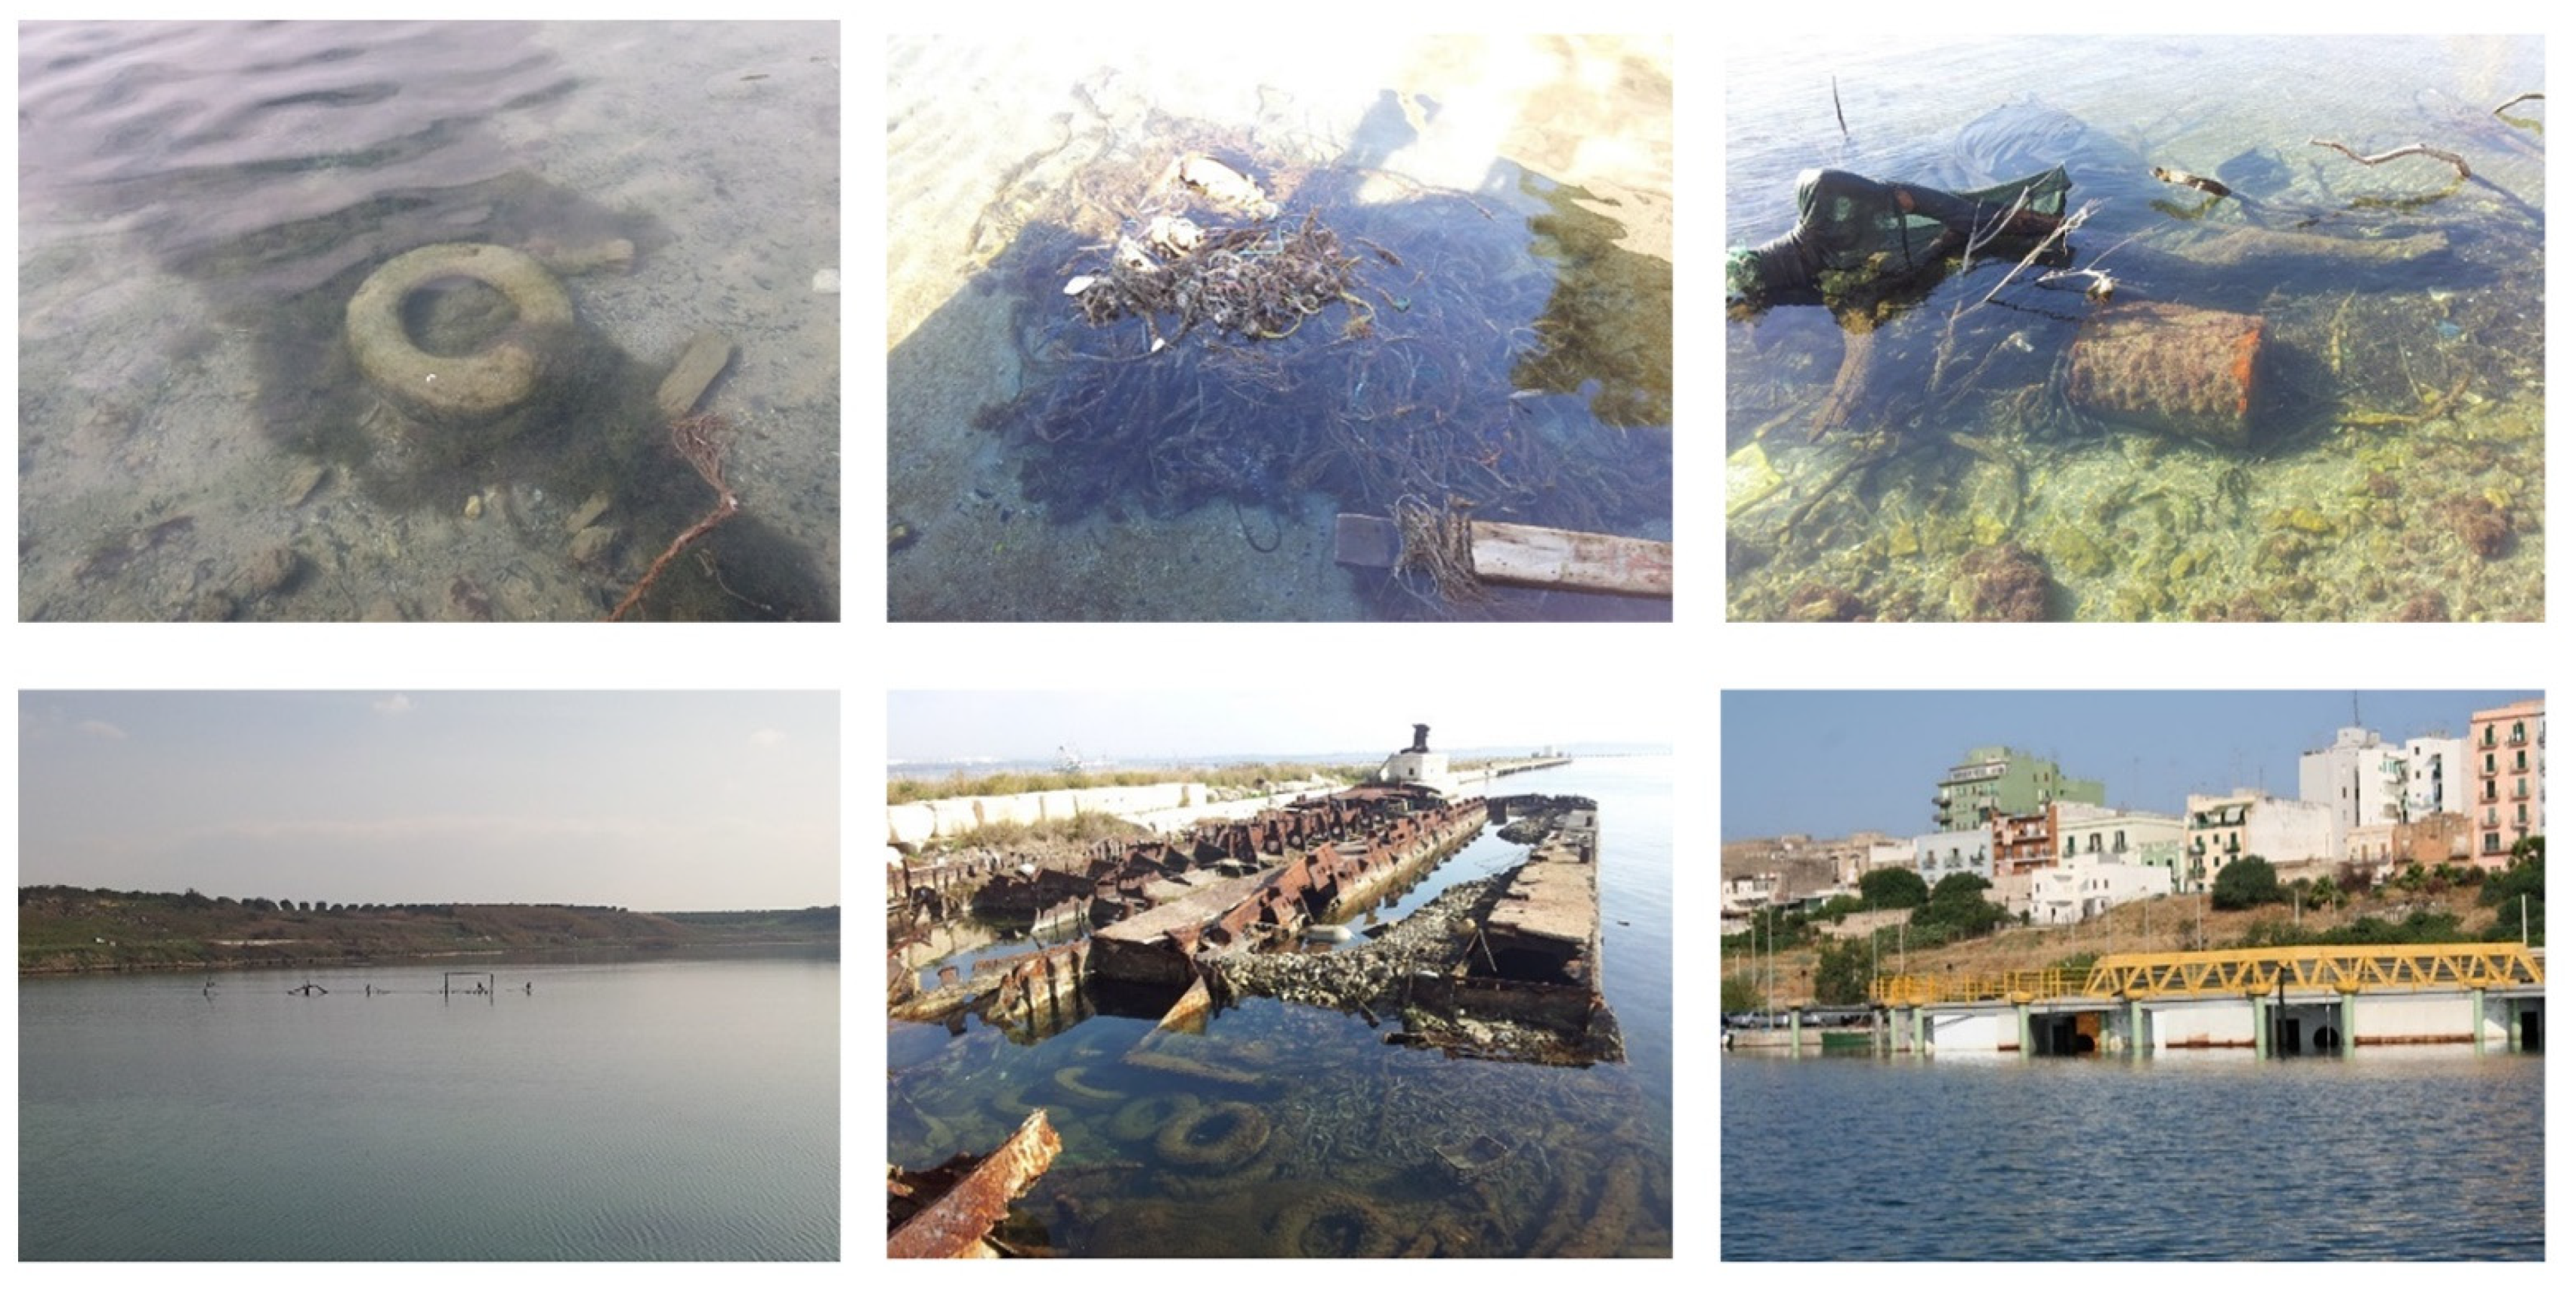
2.1.3. Field Inspections

To verify the correctness of the coordinates of some acquired details and when the ground control points (GCPs) were not sufficient, additional inspections were carried out aimed at thickening the network of GCPs with Leica CS25 differential GPS.

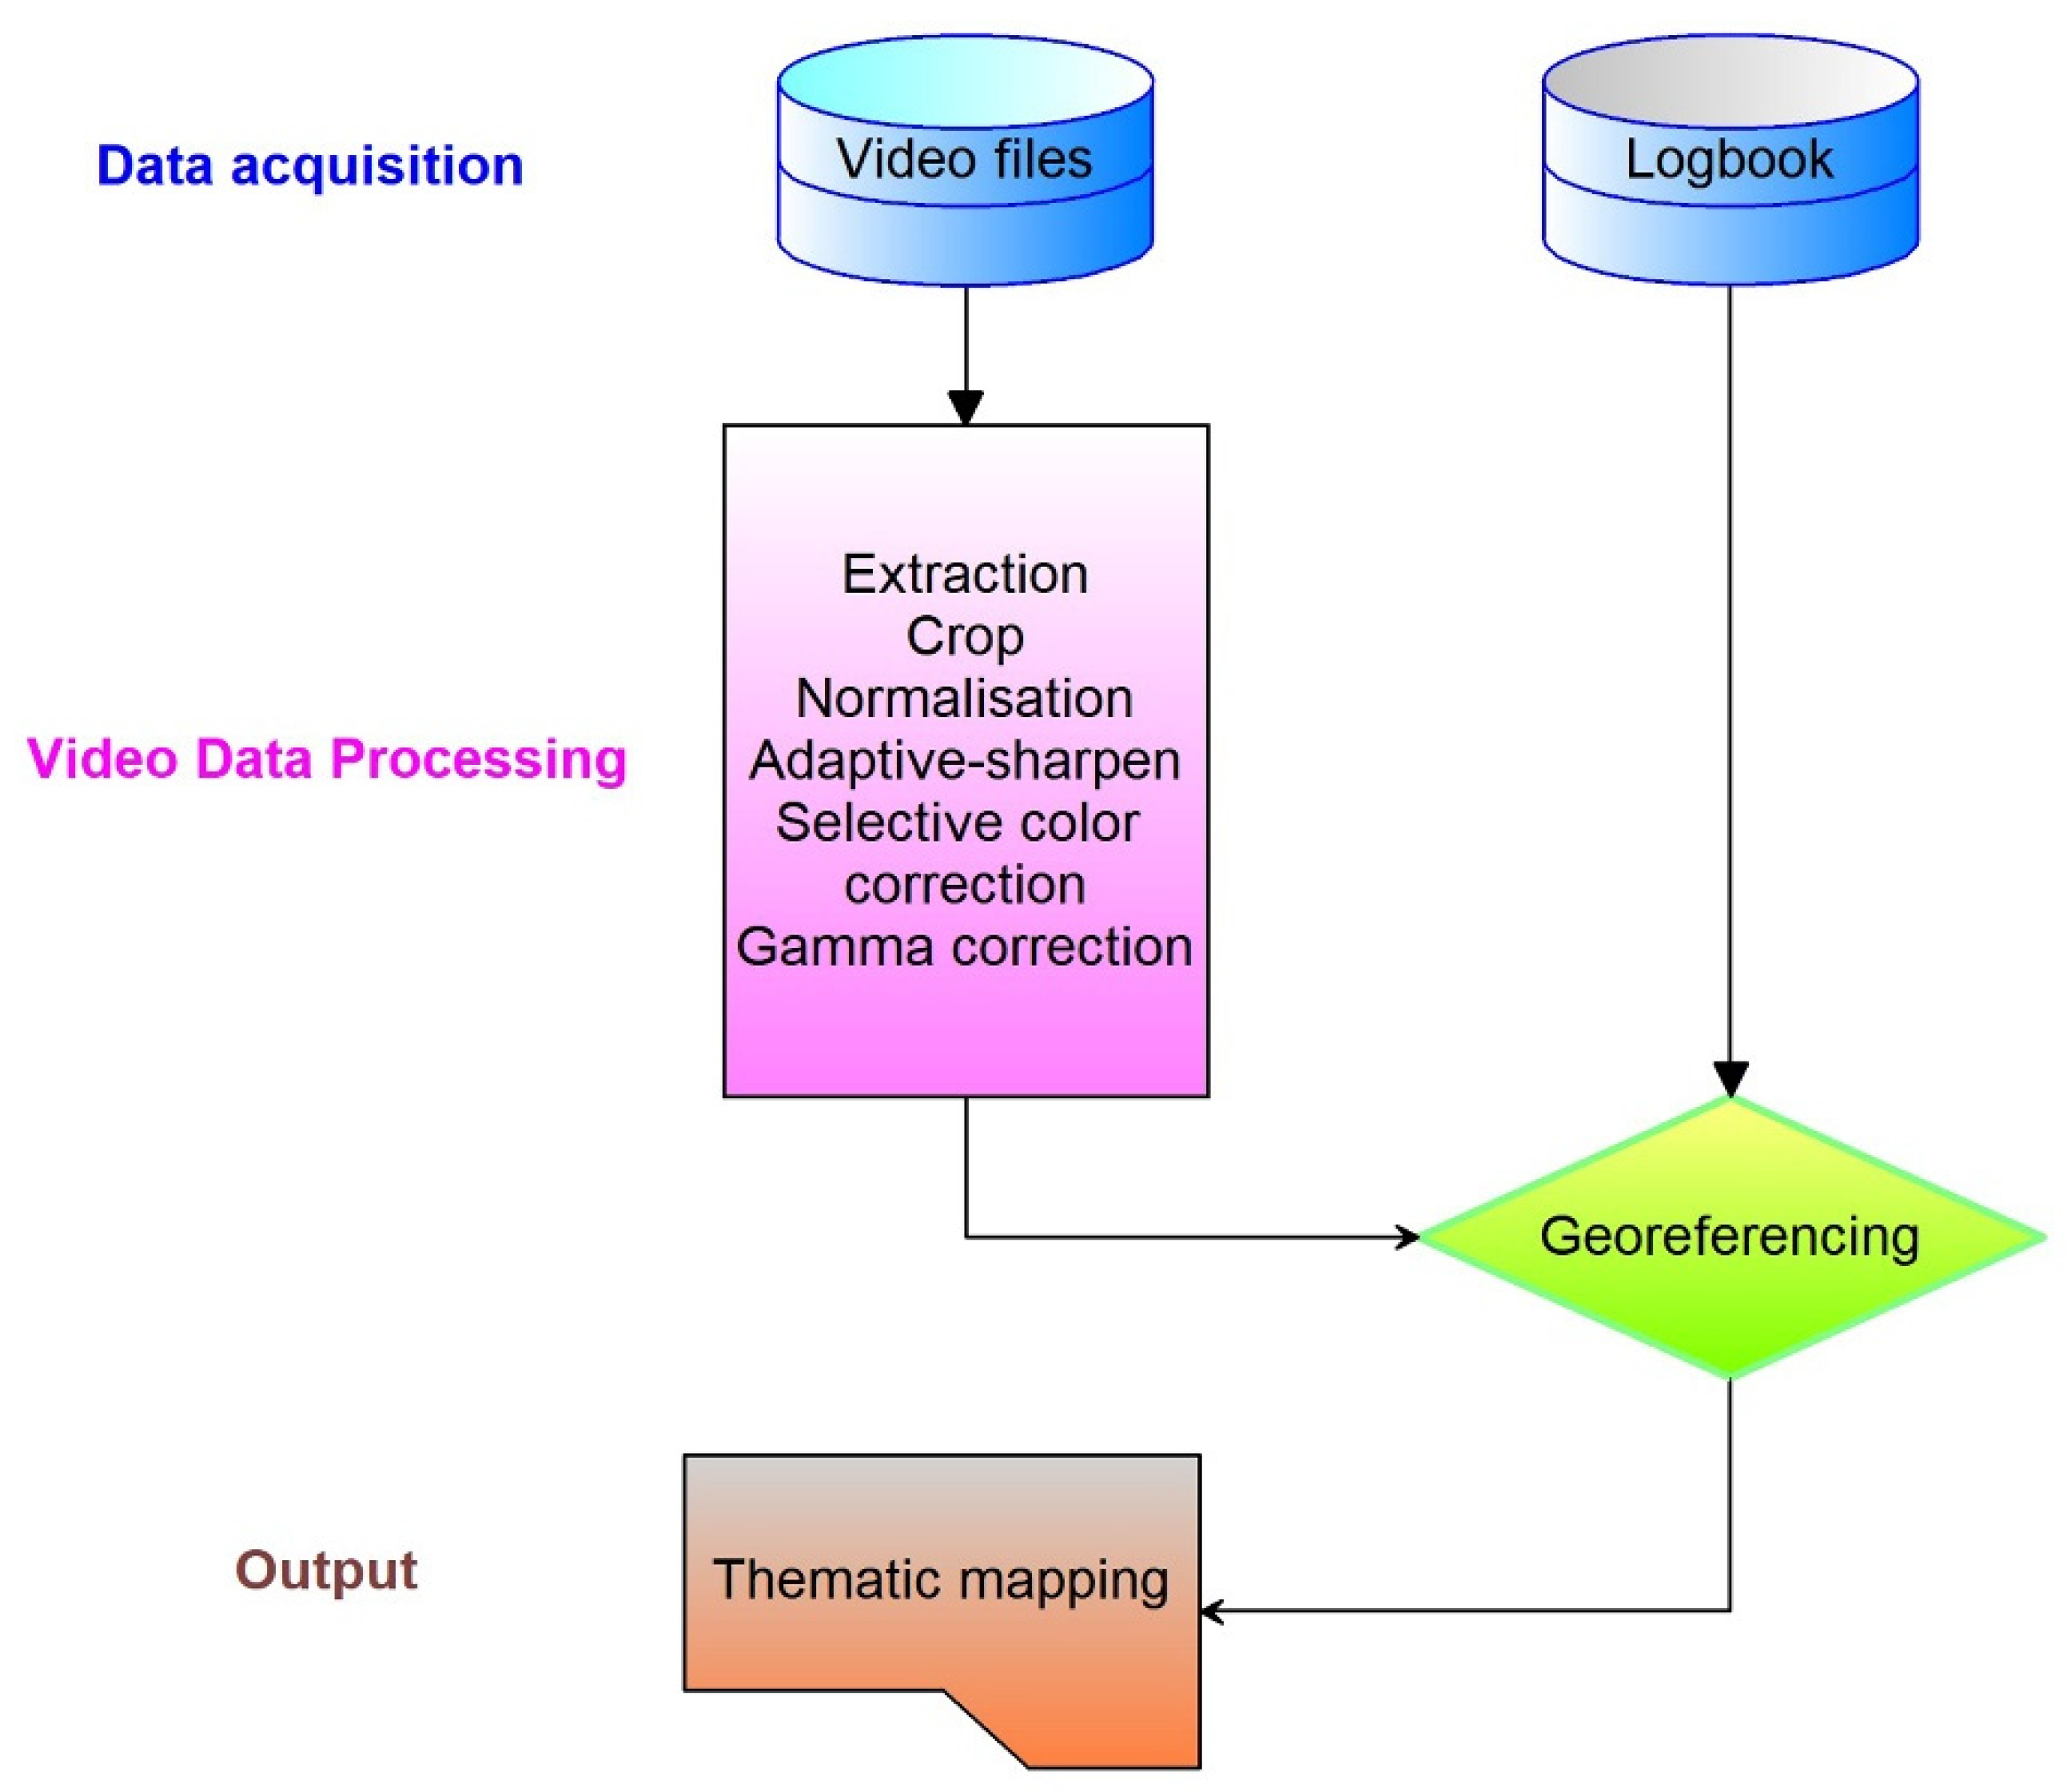
2.2. Image Processing

To pursue our mapping objectives, they are generally used push-broom sensors (also known as an along-track scanner) installed on aircraft. However, given the necessary presence of the Guardia di Finanza to monitor other aspects with a high degree of confidentiality, to optimise resources, we found it helpful to develop an ad-hoc operational workflow based on interoperability tools. It is based on the steps reported in Figure 6. As shown in Figure 6, for video files, substantial processing (six distinct phases) is required to georeferences the individual frames through the data of the flight logbooks. Only after georeferenciation, it is possible to obtain the information indispensable to create the thematic maps helpful in achieving our objectives.
Differently from many satellite images and that produced by well-known airborne sensors for which many algorithms and software for the image processing are available, our novel LEOSS sensor miss of any correlated tools. Therefore, our efforts aimed also to develop a new methodology fitted for LEOSS sensors that fulfil our application purposes.
Right from the design of the activity, it was known that to adapt the specific engineering of the sensor and the acquisition methods via helicopter to our specific mapping targets, several changes in the acquisition-processing phase were necessary to reach the set goal. In addition, we always considered the possibility to introduce several new useful functions according to other needs that could emerge during the operations.
Driven by these needs, we opted for the choice of Open Source software focusing exclusively on the high-level programming language python, considered very robust and highly versatile and with a consistent number of python bindings [40], that are packages and extensions tools for programming and manipulating the Geospatial Data Abstraction Library (GDAL) [41].
The CNR-IRSA working group has therefore developed a series of scripts capable of extracting a considerable amount of information from the video data acquired at the same time as the aircraft’s logbooks, preserving the considerable degree of detail (as said resolution of 5 cm) allowing to obtain an instant representation of the investigated area focused mainly on the mapping of mussel farms present.

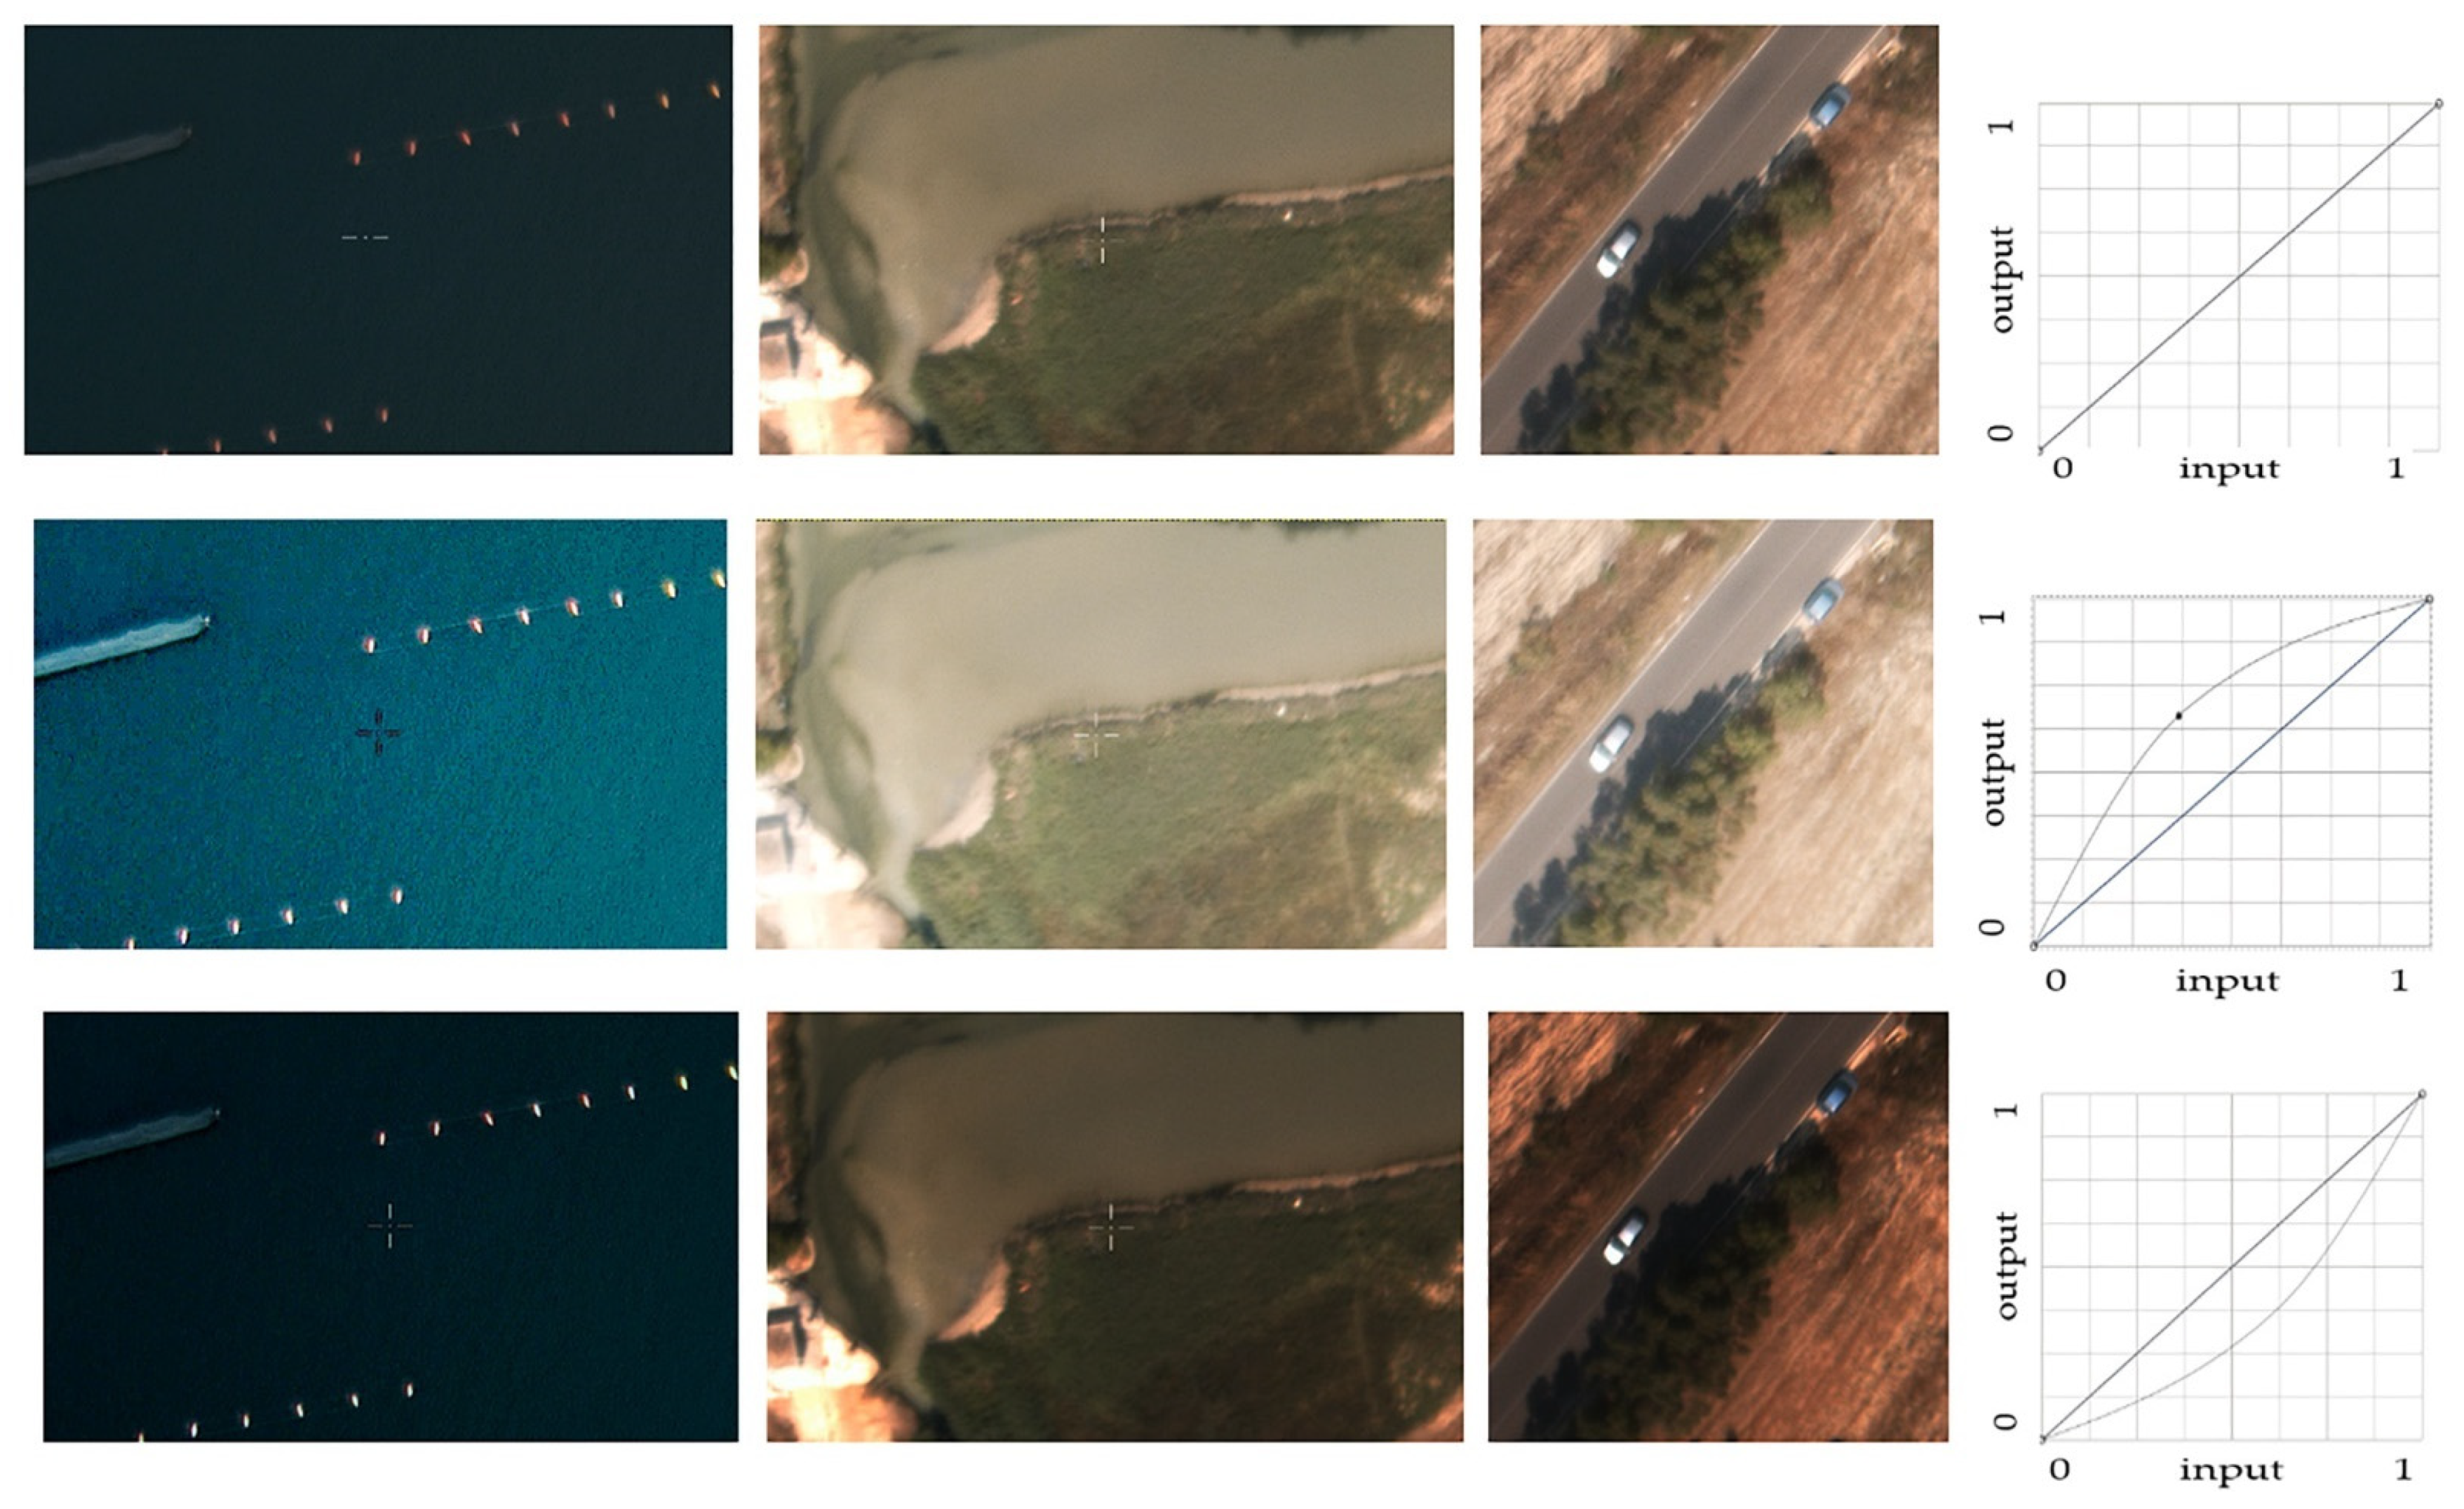
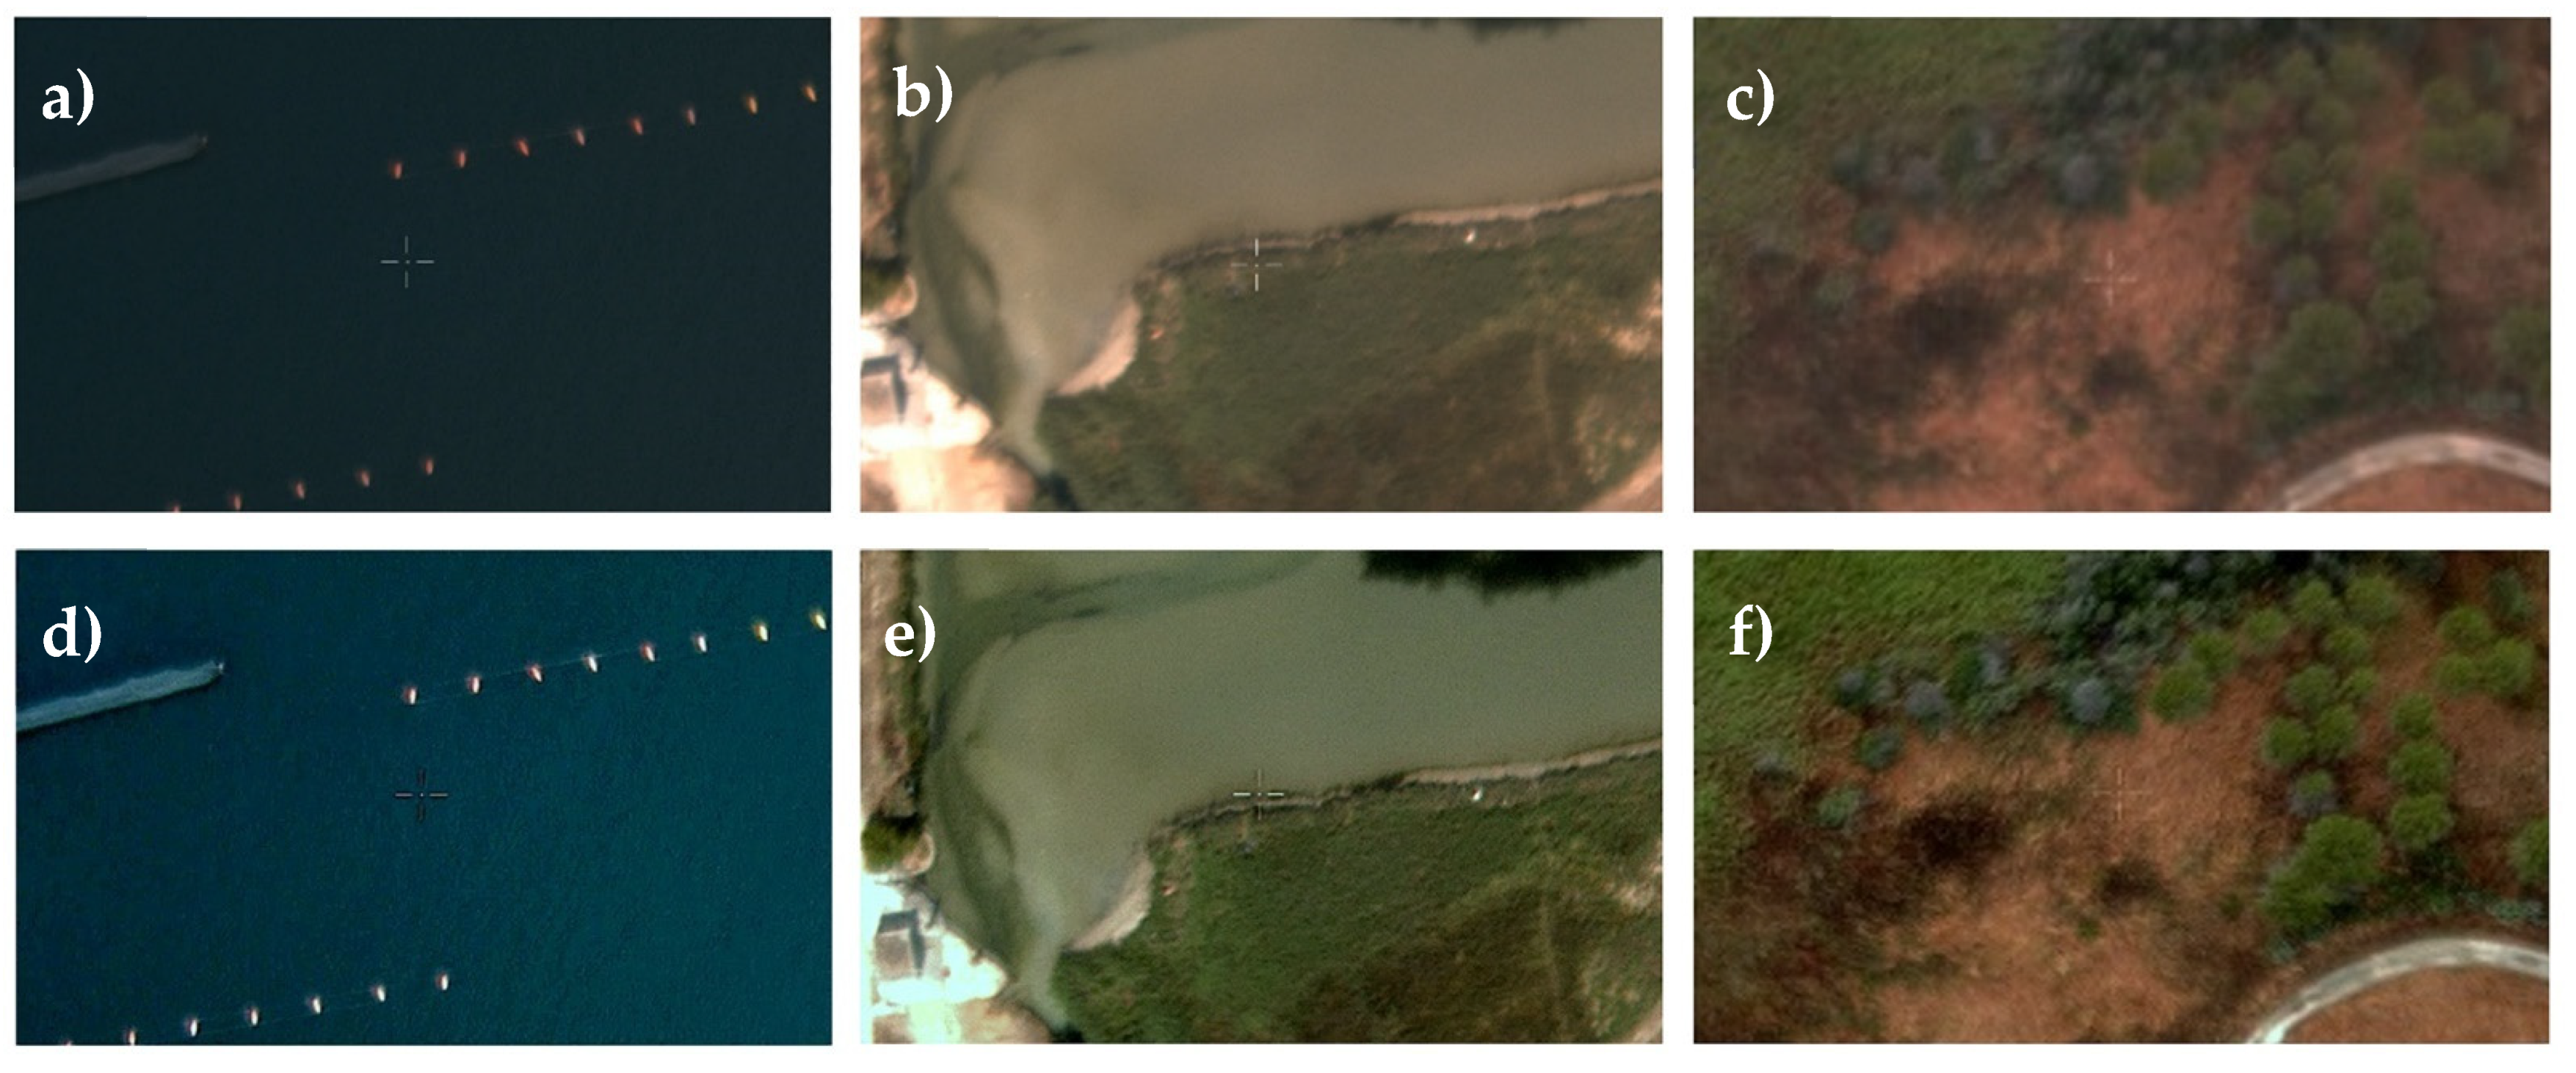
2.2.1. Video Data Processing

For our purpose, first, we used FFmpeg [42], a leading multimedia framework, able to decode, encode, transcode, mux, demux, stream, filter and play the video under the GNU Lesser General Public License [43] under an Ubuntu server [44]. So, the first step consists of a frame extraction technique that implements video content by selecting a set of summary keyframes to represent video sequences [45].
Secondly, a crop filter was applied [46] to remove undesired logos such as compass and navigation data. The number of pixels removed is always the same because these are portions of the video which are fixed and which report navigation data. In this way, each frame is cleared of the raw data frame of the video file in which the superimposed information relating to the aeronautical acquisition software appears.
After these first two phases, we included the use of another free software delivered as a ready-to-run binary distribution or as source code that can be used, copied, modified, and distributed in both open and proprietary applications [47] under a derived Apache 2.0 license [48].
The third stage of video processing consists of a normalisation operation increasing the contrast in an image by stretching the range of intensity values. Normalisation transforms any n-dimensional grayscale image (in the case of an RBG, every single channel) into a new image according to the formula with the desired range 0–255 to obtain more contrast through the dynamic range expansion techniques [49]. The linear normalisation of a greyscale digital image is performed according to the formula:
I N = ( I   - Min )   newMax newMin   Max Min +   newMin
with:
  • IN new pixel value;
  • I old pixel value;
  • Min and Max are the minimum and maximum pixel value measured;
  • newMin and newMax are the new minimum and maximum desired pixel values.
An adaptive-sharpen filter was then applied to the processed frame aimed at improving the contours by borrowing the technique from the processing of medical images that are known to have a blur with a special tuning weight that controls the amount of the produced sharpness helped to increase the acutance of edges and improve the overall sharpness significantly in the processed images [50].
Subsequently, to correct the intrinsic characteristics related to the acquisition in the optical field of the sensor with an IR cut filter for low light visibility (not removed due to other mission purposes), selective colour correction had to be applied. The result is that the red band was shifted towards the thermal infrared and selective colour correction had to be applied by selectively correcting the green colour by an empirical value of 20% to counterbalance the shift towards red.
This step is highly effective for improving colours for coastal environments and improving the contrast between semi-submerged and submerged objects near the coast in the water matrix.
A gamma value correction was applied, which indicates the slope of the logarithmic curve representative of the relationship between signal and response according to (2) (specifically, it represents the derivative of the relationship between input and output in a logarithmic space).
γ = d   log Vout d   log Vin
with:
  • γ gamma value;
  • d log(Vout) logarithmic value of the digital signal in output;
  • d log(Vin) logarithmic value of the digital signal in input.
To keep the data in a domain as uniform as possible from the perceptual point of view, the gamma value of the images in post-processing was empirical. For the case study, we based on the acquisition of 10 keyframes representing different conditions, set at +0.9, which was also valuable for enhancing the contrast. Indeed, if the gamma value increases, the resulting curve will be convex, and the resulting image will be more bright while shrinking that value will darken the image, and the curve will be concave [51]. In Figure 7. we report three of the ten keyframes used.
An example of a result relating to the overall improvement of the image for each frame is shown in Figure 8. As it is possible to observe, the improvement has also significantly reduced the slight blur of the starting image because the sensor was unable to focus well due to the speed of the aircraft and the focal values. The reader can also notice how the green colour looks (much closer to reality) in the final result (Figure 8).

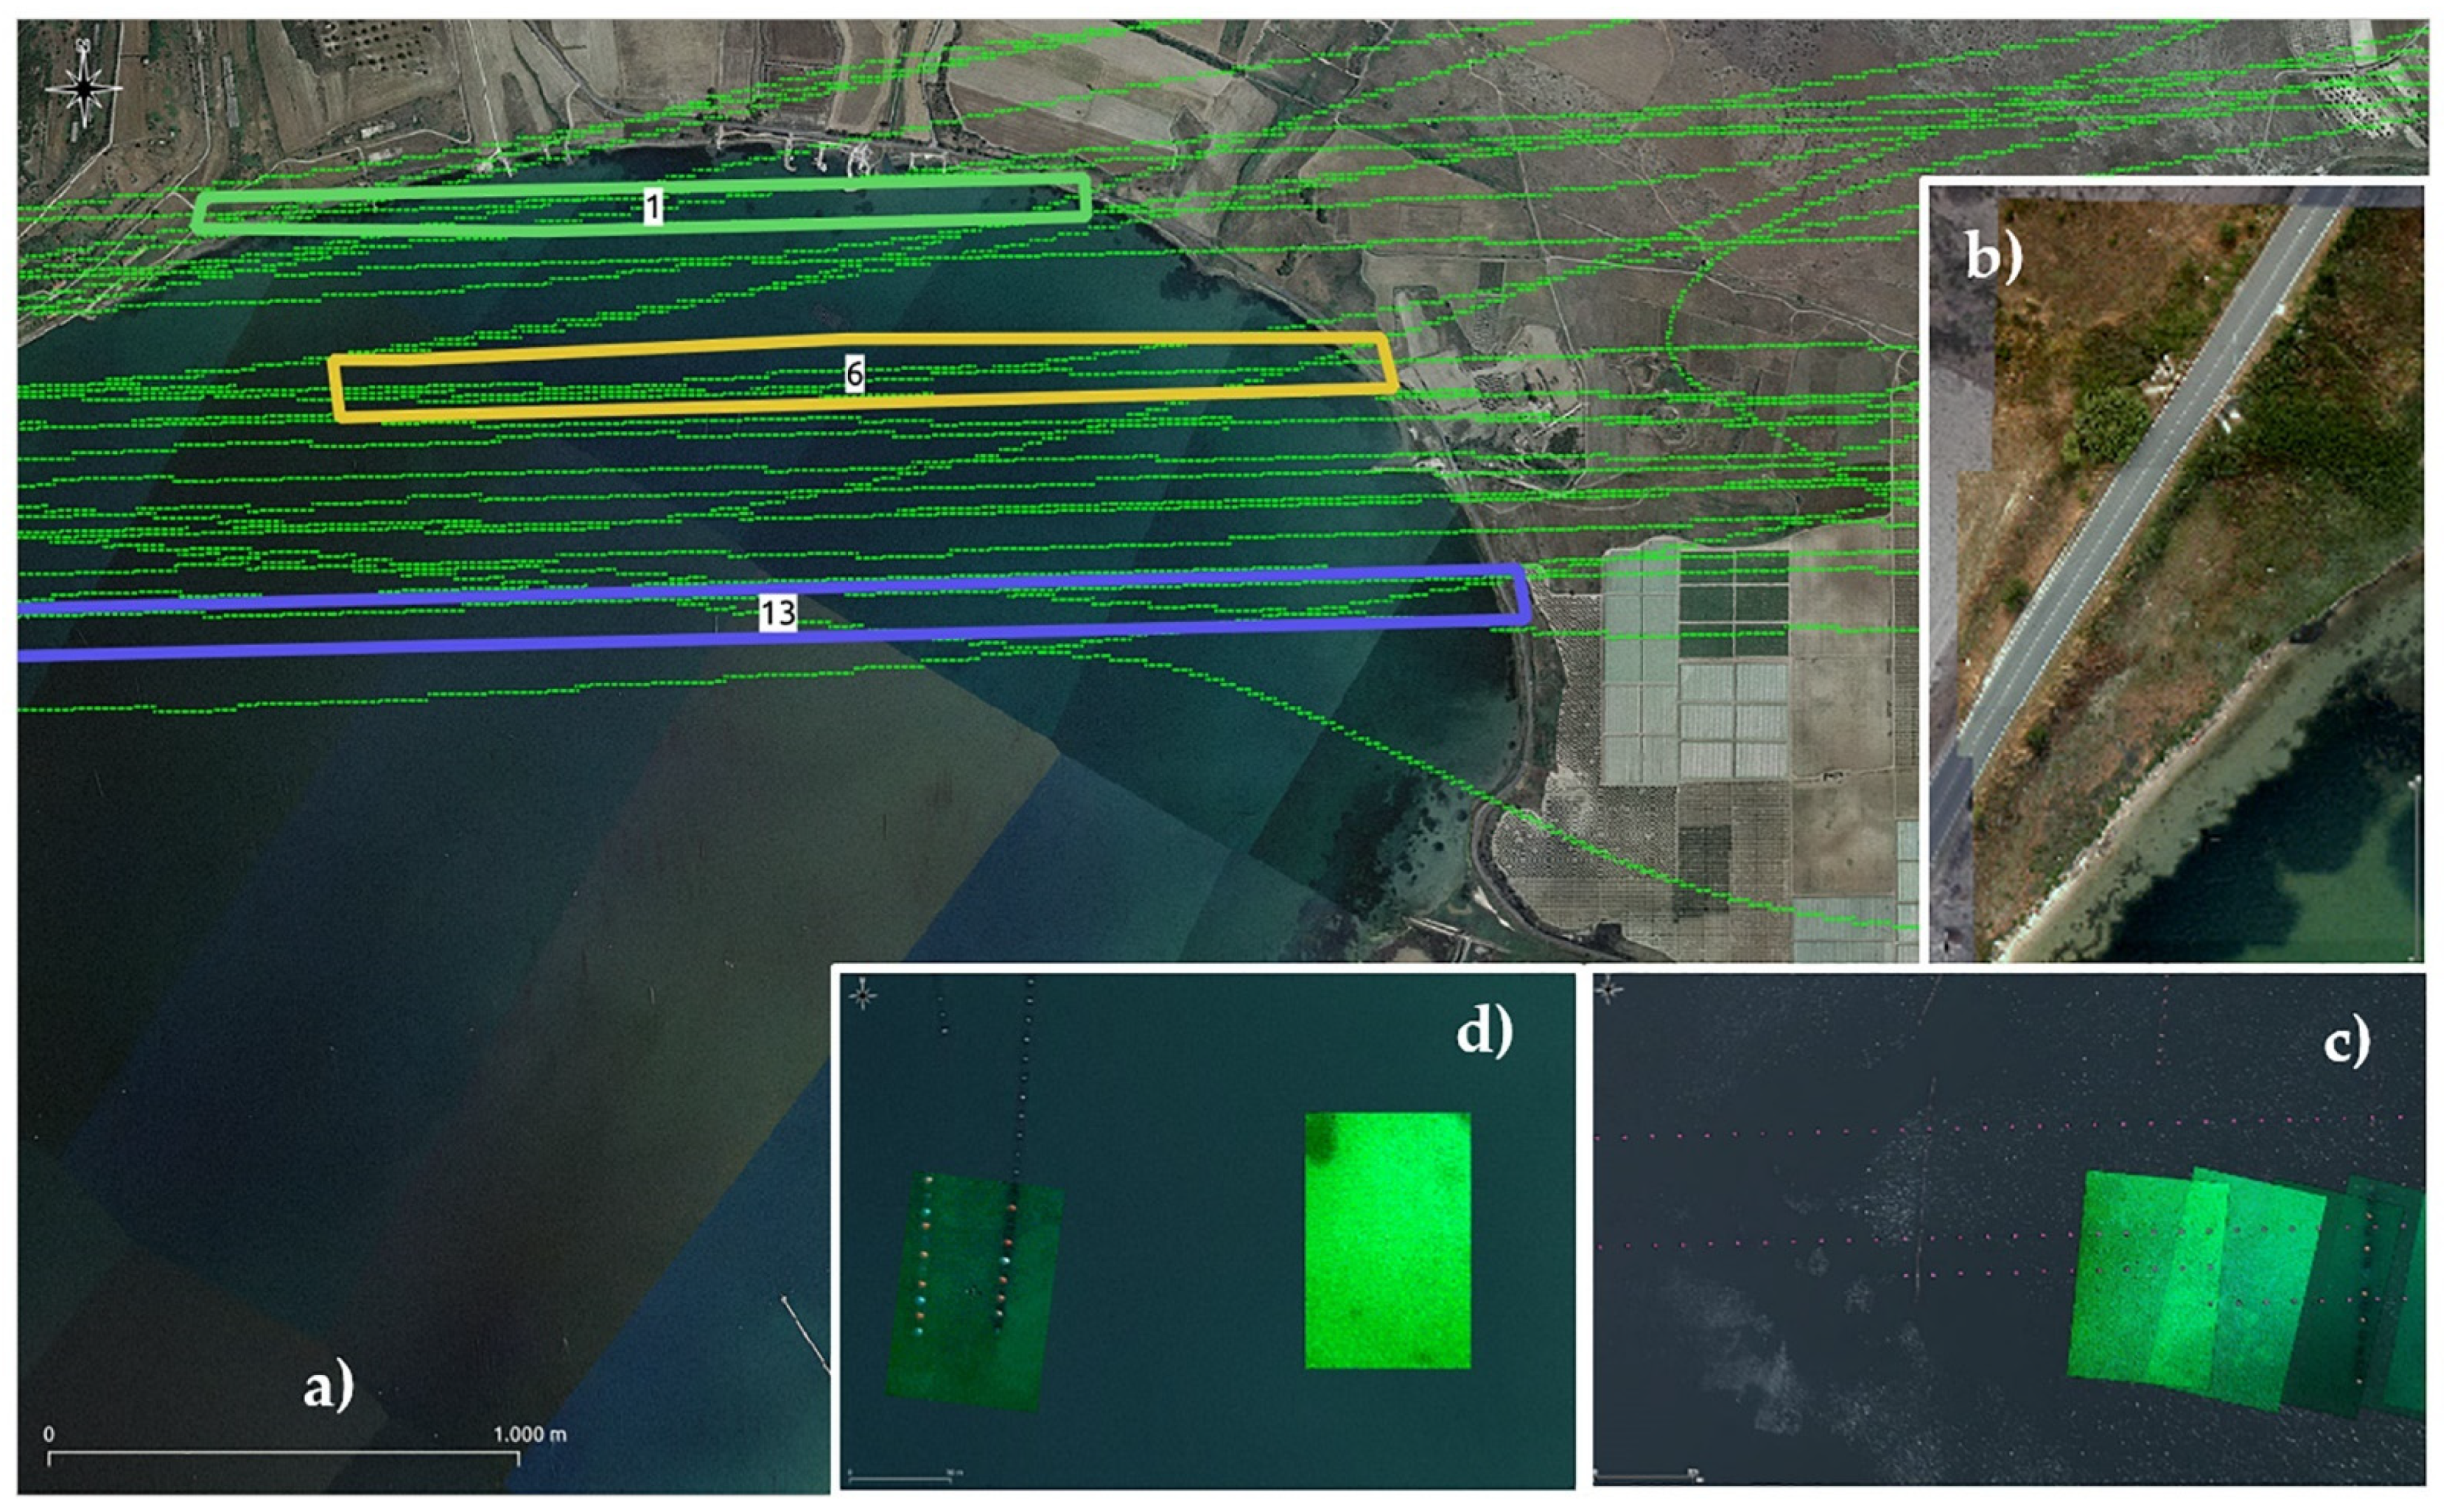
2.2.2. Frames Georeferencing

At the end of the image enhancement phase, we inserted the georeferencing procedure prepared with the data coming from the logbooks of the onboard instruments. The first critical aspect of this phase is linked to the fact that there was only one point for georeferencing the helicopter position from which we had to obtain the coordinates of the point in the centre of the frame with geometric calculations.
The second critical aspect is related to the frame rotation value derived from the sensor positioning angle that was not recorded in the flight logbooks. Therefore, every effort was made to derive this data from the helicopter position values assuming that the helicopter and sensor moved in unison.
So, we used the following Free and Open Source libraries named Geospatial Data Abstraction Library (GDAL) [41] and the following python bindings [40]. The main python modules implemented are osgeo, gdal, osr, math, utm.
The georeferencing of the single video frames in geographic raster takes place through the creation of a geotransform array that gdal uses to describe a raster position that needs the following input information: upper left position in x and y coordinates, pixel scale for x and y directions, values of x and y inclinations and finally the epsg code of the projection.
Since there was often wind and consequently the rotation value increased, to perform a more precise georeferencing we preferred using an Affine Transformation through the implementation of the affine package and calculating the necessary input parameters through the gdalinfo and pil packages, helpful retrieving geometric information from the images. Data from logbooks provided information on the position in the spatial and temporal moment of the acquisition.
In essence, an Affine Transformation represents and gives life to a relation between two images of affine self-similarity to the point of giving life to fractals [52]. Affine transformation can be expressed in matrix multiplication (linear transformation) followed by a vector addition (translation). We can use an Affine Transformation [53] to express:
  • rotations (linear transformation), if we think to the sensor;
  • translations (vector addition) if we think to the shift due to wind shifts;
  • scale operations (linear transformation), introduced because the wide-angle lens created a difference in surfaces re-covered by the pixels, i.e. the central pixels cover less surface than the lateral ones.
In summary, the following parameters were calculated, and some necessary correction factors were implemented (the onboard instrumentation was still in the testing phase, and there was no detailed information on the position of the sensor concerning that of the helicopter) to obtain the correct centimetre georeferencing of the frames can be automatic:
  • total framed width as a function of the shooting height;
  • average coverage area of the pixel recorded on the monitor;
  • calculation of the upper left corner upwards in degrees for final translation;
  • semi-diagonal frame calculation;
  • calculation of the number of base map pixels involved;
  • calculation of the scale parameter between the two maps;
  • correction factors for the above reasons.
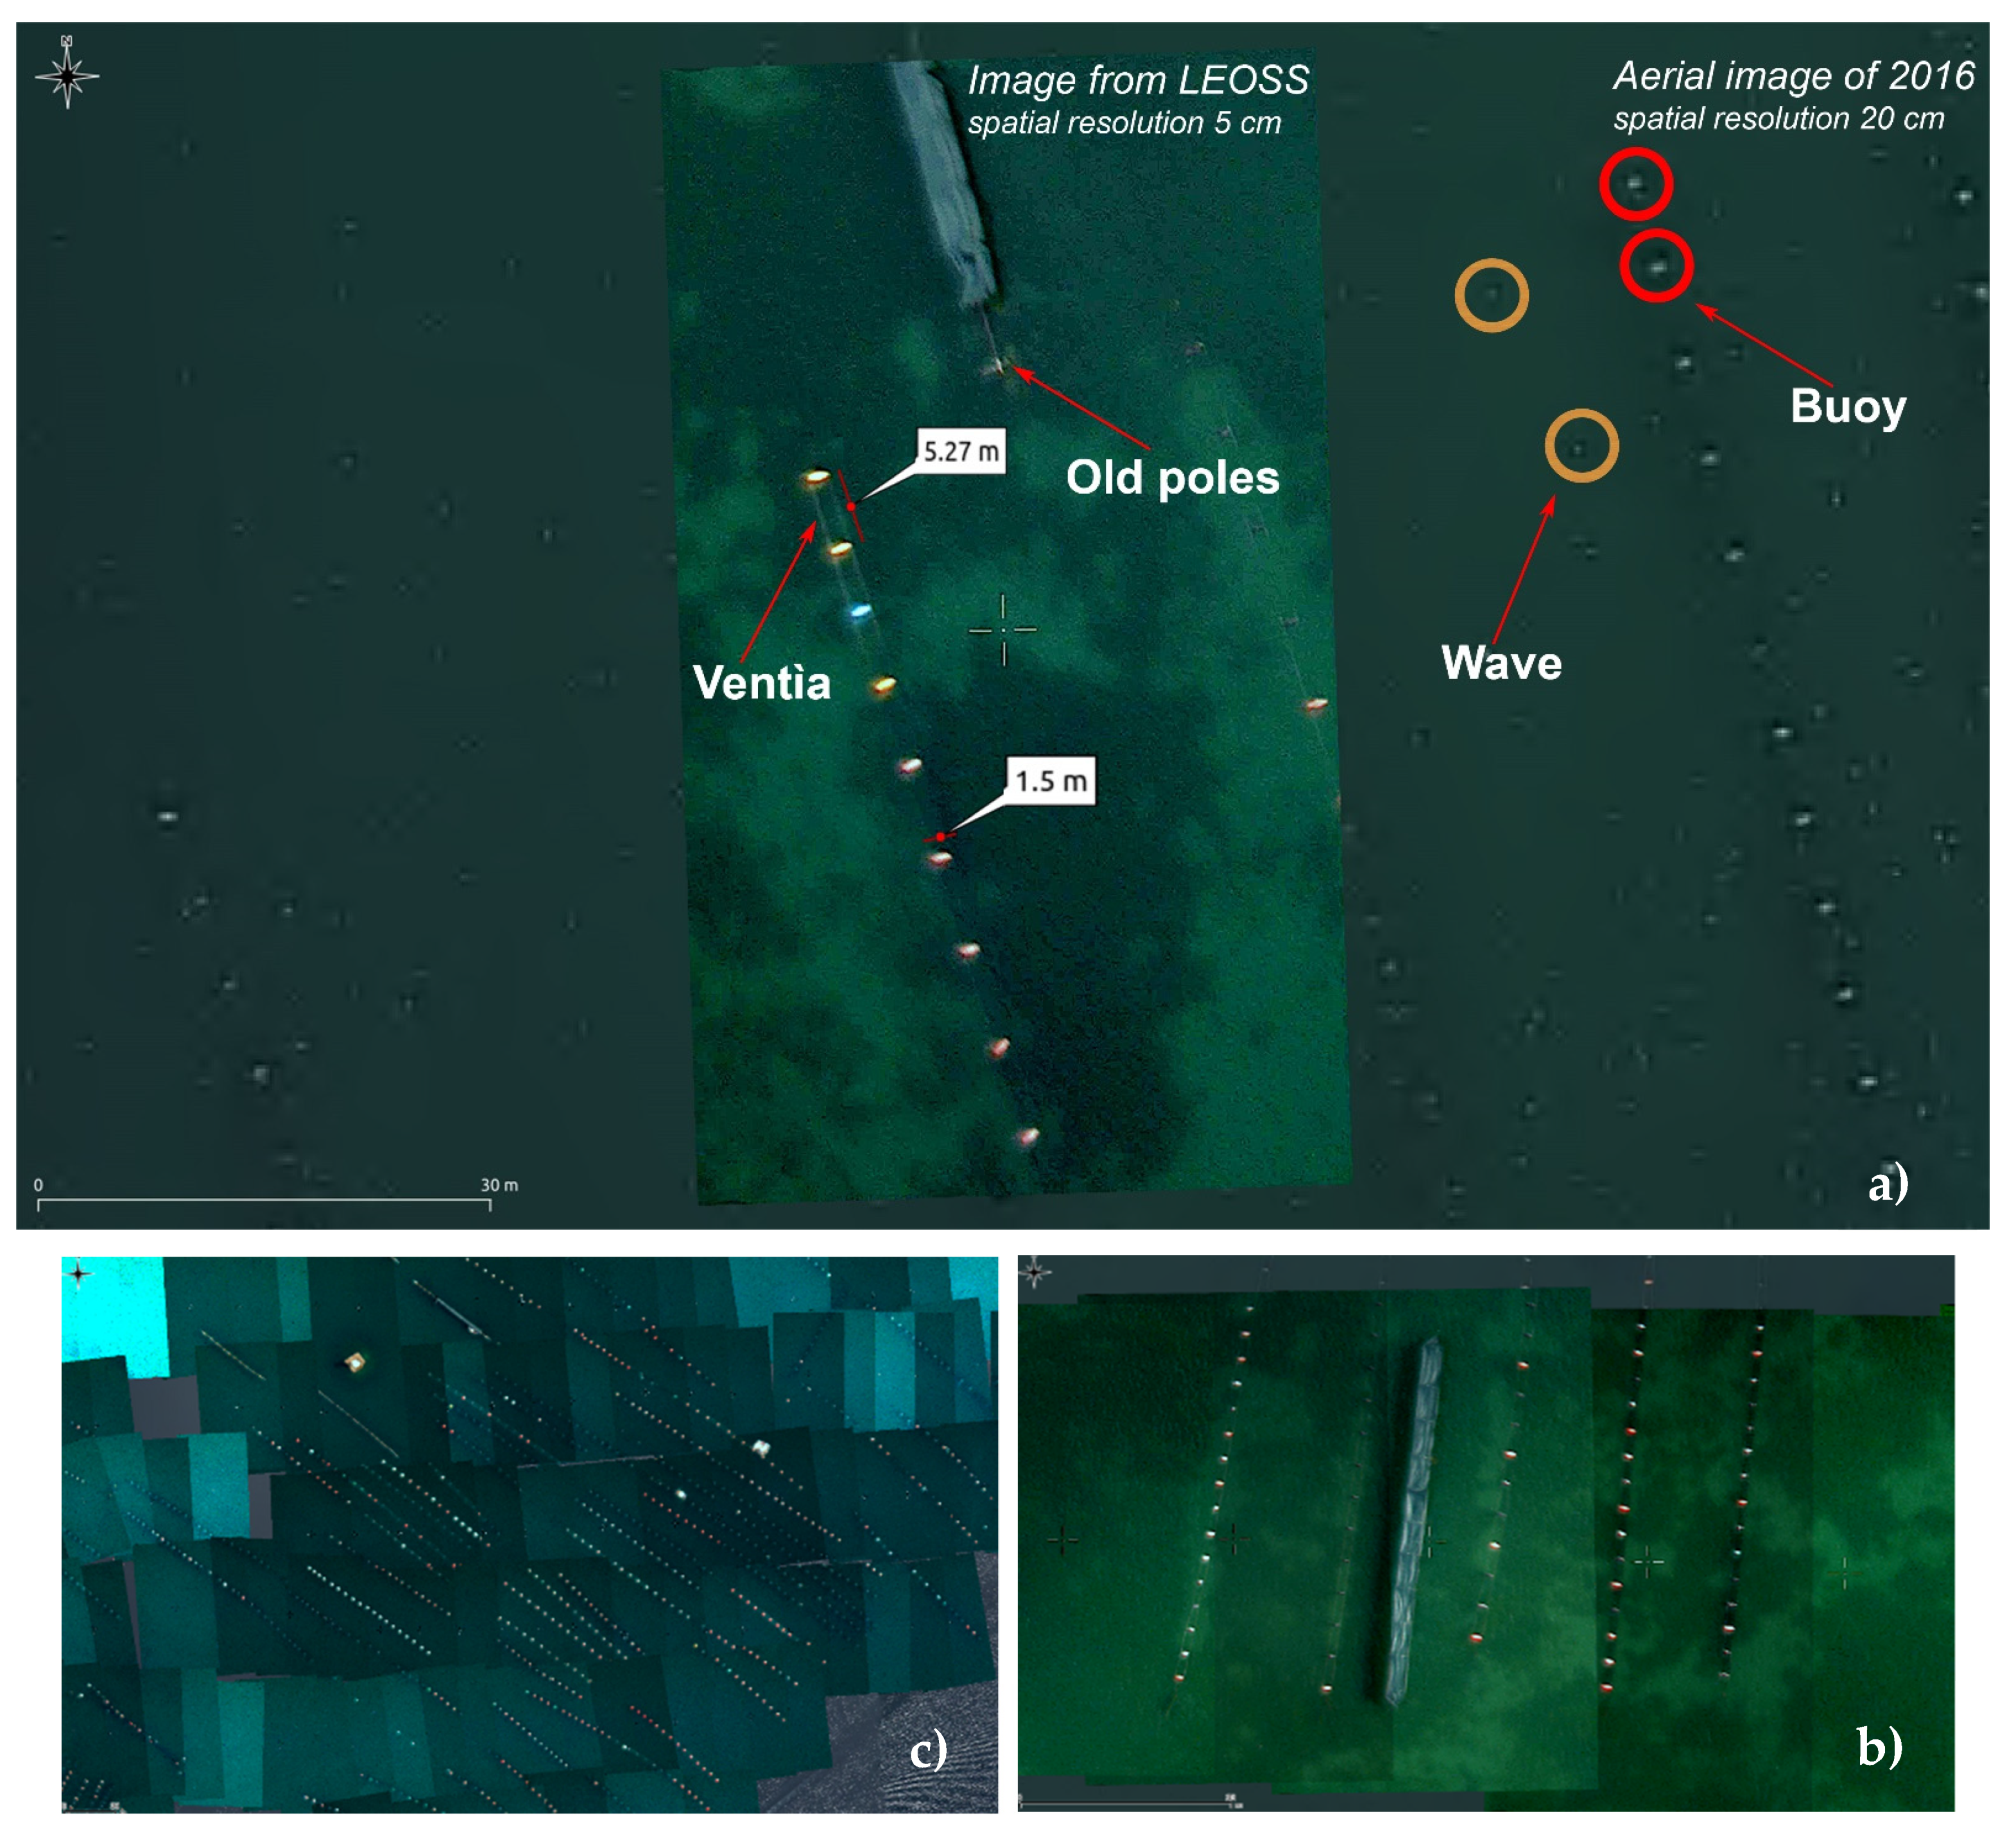
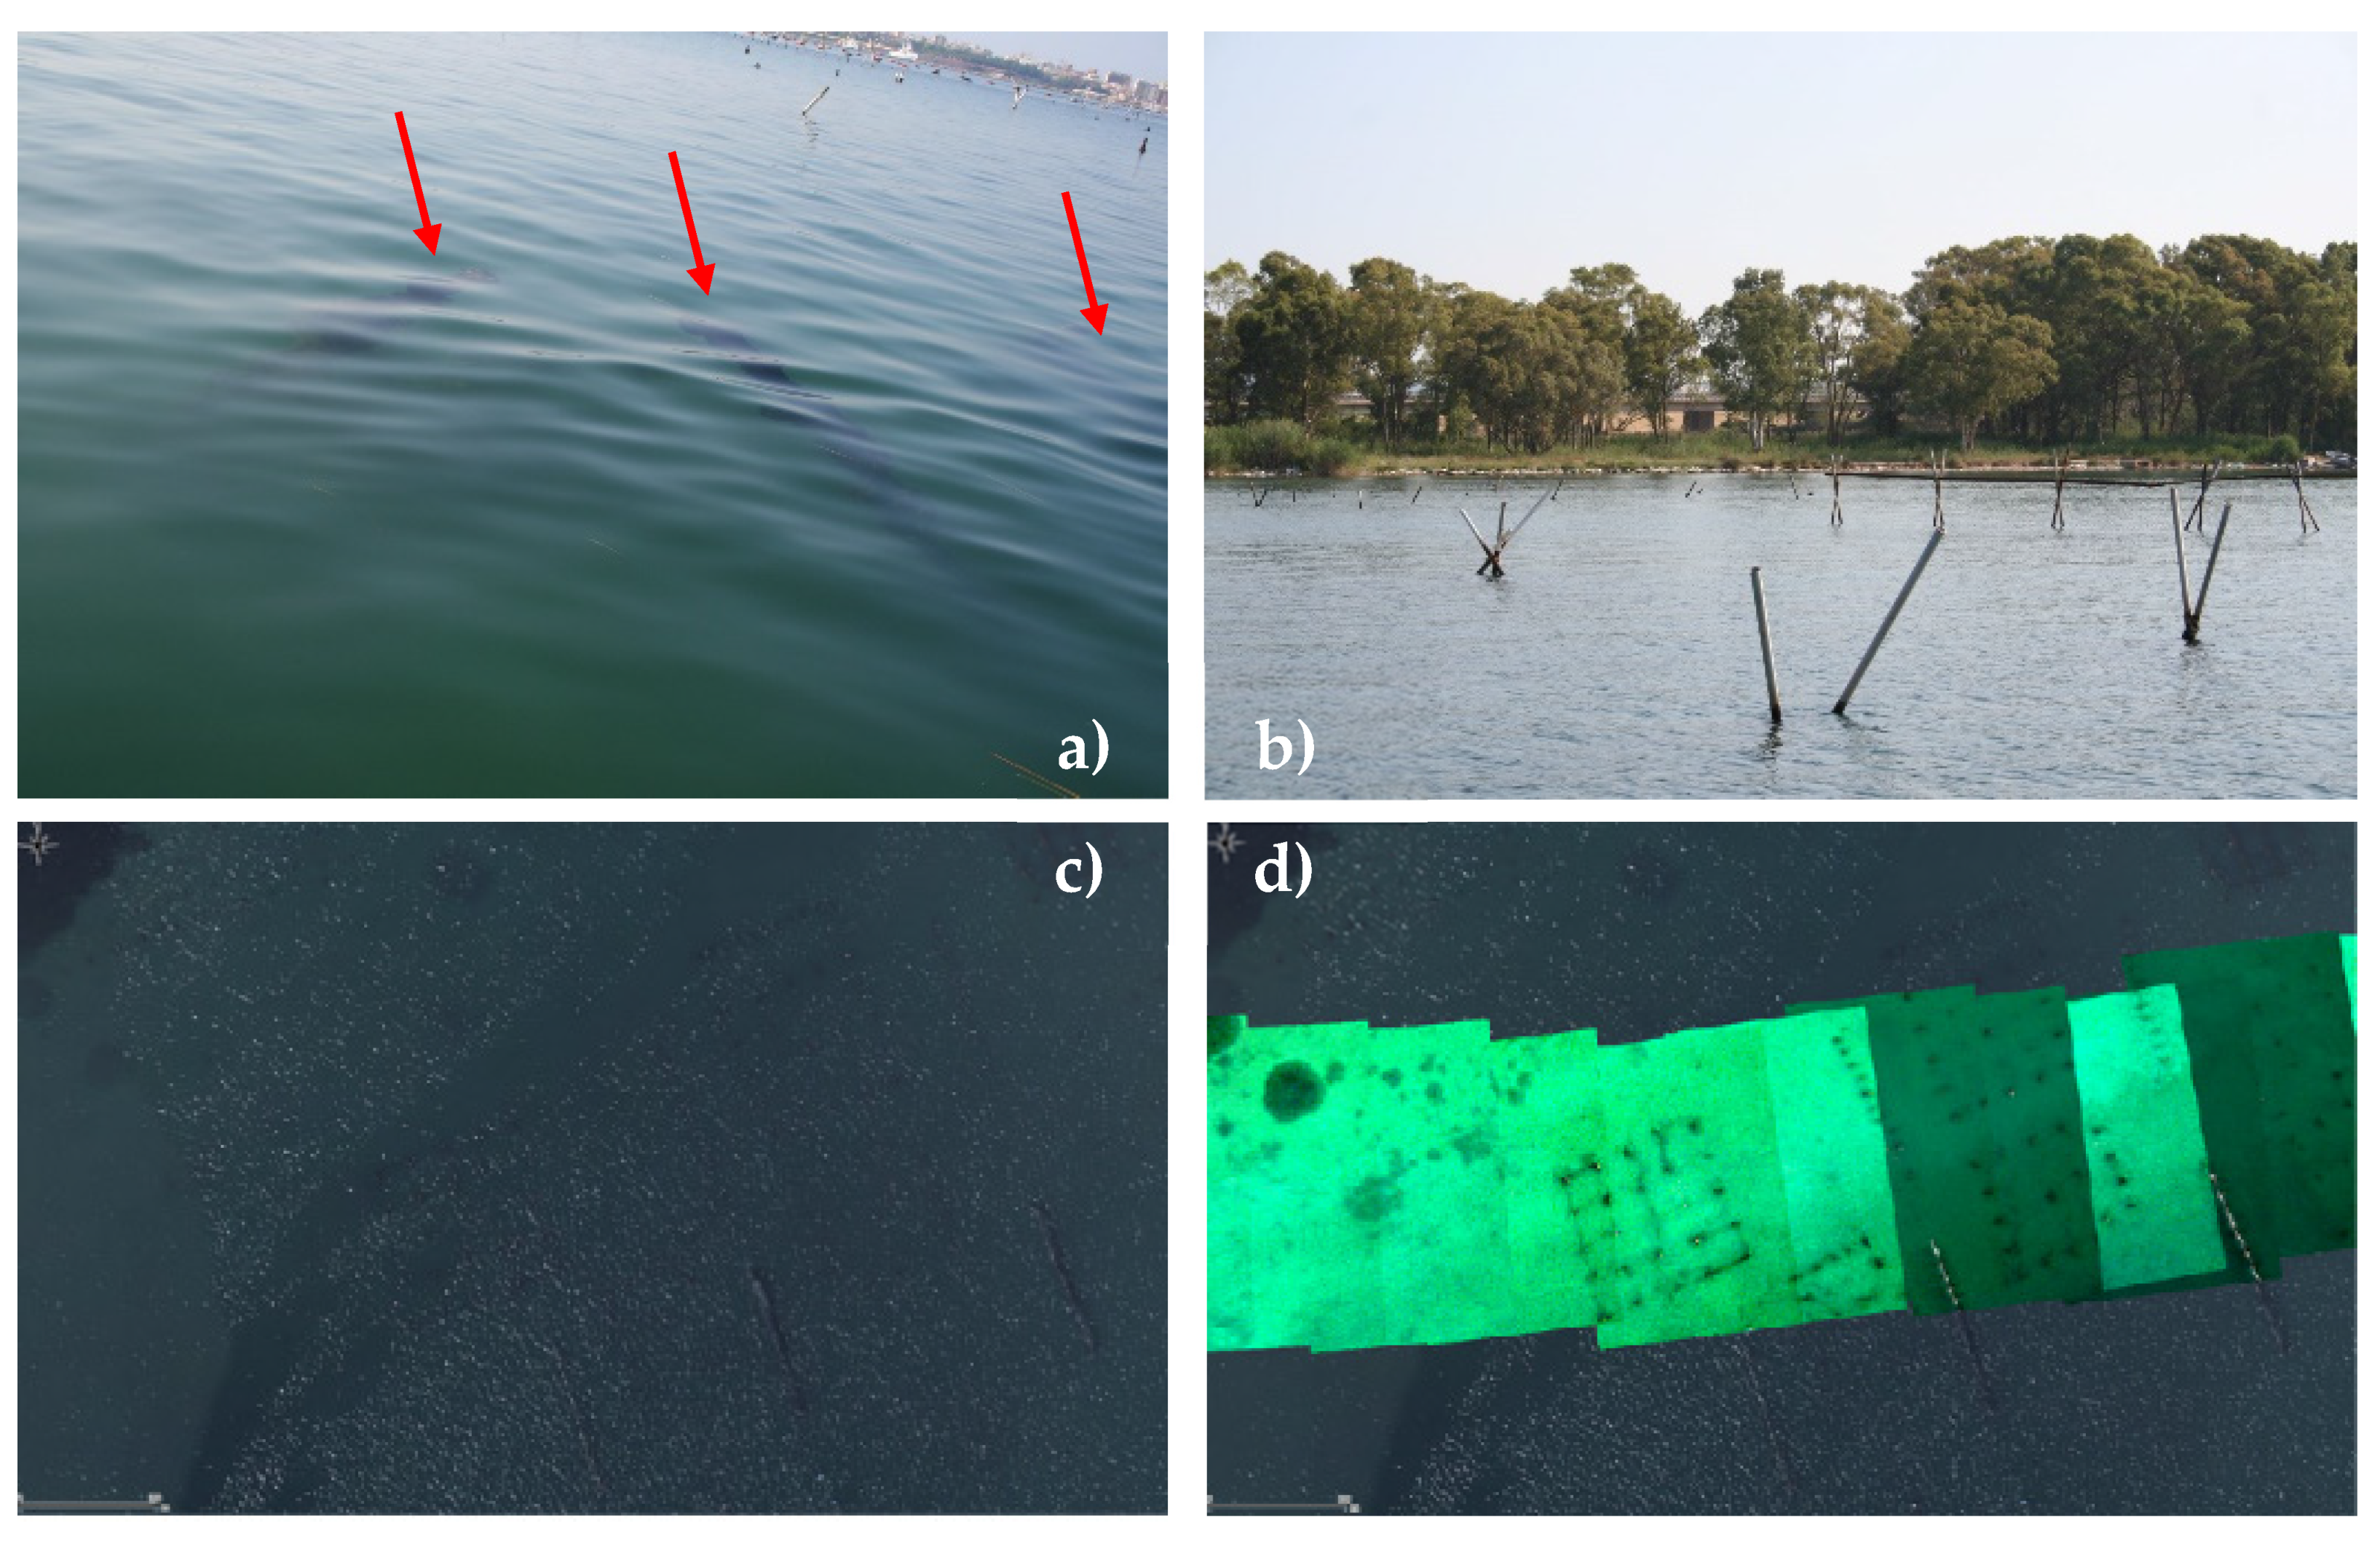
Once imported into the GIS, each frame was rechecked using different information layers relating to the most recent years to verify the correct georeferencing and carrying out, where necessary, a further orthorectification. All the images produced were subsequently used to create a mosaic, overlapping them from east to west and creating a unique raster for each captured video. In this way, it was possible to analyse the entire area of interest and create a shapefile as a union framework (Figure 9a) from a mosaic of more frames (Figure 9b), appreciable when superimposed on a recent base map, aerial image of Puglia Region dated 2016 [54].
In addition, operating in this way, it is possible to see in Figure 9c a result of the superimposition of the georeferenced frames and their relative variability.
This variability is due to the wind, above for the rotation and with the flight paths that instead seem straight in the very short instant of time.
Unfortunately, despite the introduction of some correction factors and even if the script created extracts the individual "tiles" from the acquired video and places them in a reference system thanks to the data contained in the flight route logbooks, sometimes due to synchrony discrepancies due to instrumental problems, the activity required further manual corrections for single frames, this correction was made in a Geographical Information System (GIS) environment with a tool to perform an interactive raster georeferencing [55]. However, the number of frames thus rectified amounts to less than 5%.
More complicated and precise georeferencing algorithms could not be applied; for example, polynomial algorithms need at least n. 3 points.
Only the framework is shown as the data are reserved for ongoing investigations aimed at verifying any spaces illegally occupied and being judicial evidence. In the event of publication the charges, for formal defects provided for by the Italian legislation, would lapse and therefore cannot be made public.
Through the processing carried out, it was possible to investigate the Mar Piccolo (I and II inlet) entire basin for all the areas affected by the phenomena under investigation. Whereas fish farms were not found, the frames were discarded to lighten the files produced to make them easier to use on each machine.
This activity was relatively immediate to carry out because, with the implemented procedure in the absence of objects of anthropogenic origin (i.e. buoy) in the sensor’s field of view, the single frame is coloured in intense green, very easy to find and put aside (Figure 9d).
We did not consider it helpful to use many “machine hours” to create a mosaic of raster to reduce the visibility of the edges of the frames as this lengthy procedure would not have added anything useful but could only be applied for aesthetic purposes.

3. Results

For the first time, a complete mapping of the mussel farming plants present, active and abandoned, in the first and second inlet of the Mar Piccolo of Taranto was carried out. This achieved result represents a significant milestone to understand the dynamics taking place in the territory
useful to implement initiatives for the sustainable management of this delicate transition ecosystem.
In total, over 5000 frames were georeferenced for a total of over 126 GB of files in Tagged Image File Format (TIFF) format have been produced relating to ultra-detailed mapping (resolution < 5 cm) of the over 80 videos acquired by the Guardia di Finanza. Images acquired and processed provided the mapping of each cultivation module of the mussel farm.
Pole mussel farms, floating buoys and longlines were easily visualised because their identification on the image is related to the sensor’s spatial resolution. The socks, generally made of polypropylene, have a length ranging from 5 to 6 m, are located at a distance of about 1.5 m from each other and have meshes whose size depends on the size of the mussels. All these details were not possible to map with the aerial images of the Puglia region in 2016 as they are subject to the influence of waves that confuse the interpretation of the images, while this does not happen with the LEOSS sensor (Figure 10a).
Aiming to detect any unauthorised anthropogenic actions that may alter the ecosystem profile, efforts were made to provide new, highly detailed information.
The long lines identified in each module is located at a distance very variable in the interval of 10–20 m one to each other (Figure 10b,c).
In addition, through the on-screen interpretation, with GIS Desktop software, it is possible, for example, to identify variations in the perimeter of mussel farming fields. These variations, in removal and addition, have been identified in a percentage >20% as a total number.
Furthermore, old poles mussel farms in wood and galvanised steel alloys (semi-submerged and submerged), colour (red, blue, yellow, white) of floating polyethene buoys of varying sizes (generally 1 m in length) were also identified (Figure 11a,b).
Thanks to work carried out, it is also possible to identify and recognise those fields once used and now abandoned (Figure 11c,d) that are not visible with the aerial images available [54] and not even with the well-known Google services.
On the one hand, in the first inlet, the estimated area dedicated to mussel farming is 2.8 km2 (on a total area of 8.3 km2), representing 34% coverage. The 13% of the area dedicated to mussel cultivation (0.38 km2) is affected by ancient abandoned structures. These structures are mainly located near the Galeso submarine water spring and at the mouth of the homonymous river.
On the other hand, in the second inlet, the estimated area dedicated to mussel aquaculture activities is 6.54 km2 (on a total area of 12.4 km2), representing 53% coverage. Differently from the first inlet, in the second one, just 2% of the area dedicated to mussel farms (0.15 km2) is affected by the presence of abandoned structures.
This difference is probably due to the presence of several shipyards active in the first inlet until a few years ago, which prevented the installation of the mussel facilities to ensure the navigation of ships.
In addition, lately, water pollution phenomena due to PCBs and dioxins, have led to a further abandonment of mussel crops by fishermen in the first inlet.
In the second inlet, it was possible to increase the density of farms because no active shipyards and no pollution phenomena subsist.
The high quality of the images processed, according to the procedures used, also made it possible to identify other partially submerged structures, bulky waste (wreck) and/or near “on the surface of the water” (tire) Figure 12. Precision mapping activities are still ongoing.

4. Discussion

The video data available were processed for two purposes:
  • Mapping of mussel crops (Figure 10) for a comparison with the authorised areas in the entire study area;
  • Identify semi-submerged poles, mussel cemeteries and other significant aspects of the environmental degradation of the area and ecosystem (Figure 11 and Figure 12).
Based on these objectives, the applied methodology has led to remarkable results (Figure 10) that can implement the cognitive status of the area of interest due to the higher resolution acquired than that obtained to date [54].
Given the importance of the ongoing investigations, using images certified by the Guardia di Finanza, it is possible to capture a picture of the state of the art of the entire ecosystem at a given moment. Otherwise, using images from free providers, we would notice that we have no absolute certainty of the acquisition date of the various strips and that the dates of contiguous strips often have different dates.
Therefore it would not be possible to have a representative image of the entire area at a given time. In addition, Italian law provides that evidence must be collected by state police bodies to initiate judicial activities.
In previous studies, mussel farms were often mapped and monitored using images from Landsat, QuickBird, SPOT, RADARSAT and ENVISAT satellites [11,56]. However, the limited spatial resolution of satellite images could not provide sufficient information to map in detail mussel aquaculture systems.
Among the different satellites images, the maximum spatial resolution achievable is not confrontable with the visible range of LEOSS.
Comparing aerial images with a 20 cm spatial resolution with our images acquired by LEOSS sensor with a higher resolution (5 cm) (Figure 10), it is possible to observe an evident improvement of the level of detail of our images, allowing us to distinguish the mapped buoys farm’s typology and colour, the presence of ventia and pole farm’s shape. Moreover, it should be considered that detailed aerial images are not freely accessible, and their retrieval is not so easy even for port authorities.
Analysing the overall results, is it possible to observe a very disordered situation in the Mar Piccolo of Taranto (Figure 13), resulting from clear overexploitation of the area also due to the presence of old mussel aquaculture systems. Moreover, different types of waste, submerged and semi-submerged wrecks and abandoned structures, were also observed (Figure 11 and Figure 12). All these aspects translate into a real obstacle course that makes navigation extraordinarily complex and dangerous for boats and local authorities.
Proper management of the areas of the Mar Piccolo granted in concession for the development of mussel farming activities should take into account the load-bearing capacity of the system to guarantee both the environmental and economic sustainability of the production site.
However, in the absence of specific studies in this sense, it has not been possible to give more precise indications on the maximum load for each plant (e.g. the number of pergolas per farm room) relying on the direct experience of mussel farmers.
In this context, based on our data, manufacturers will have indications on the optimal load to be respected to have a quality product.
The work carried out has provided important information, which, however, cannot be fully carried out because of the ongoing investigations by the competent authorities. Many mussel farms had no authorisation at the time of video acquisition. In addition, this study made it possible to identify the distance between the different plants and their location in the two inlets. This aspect is important to quantify the production capacity of the considering marine area also considering the benefits to the community in terms of ecosystem services [12].
According to [56], the spatial planning of mussel fields must occur in a specific site way analysing the different variables that characterise the area of interest. Therefore, according to current regulations, a specification for the use and management of the areas granted for mussel farming activities is required considering the studies and the surveys carried out [25,57].
The single area covered by the state concession, i.e. the water mirror intended for mussel farming, is assigned by procedure and public evidence.
The spaces that can be granted in the Mar Piccolo of Taranto are located in the First inlet and the Second inlet only within the areas delimited for this purpose by the Ordinance of the Port Authority 107/2005 [58]. According to the provisions of the abovementioned Ordinance, the individual fields suitable for the necessary installation have been identified within each area consented to mussel farming.
This assessment took into account the bathymetric development of the seabed, the presence along the coast of canals and rivers [59], potential landing points, the necessary safety distances for the navigation of nautical means and their passage through mussel fields. The individual modules that can be obtained for mussel cultivation, each rectangular, have an extension of 2 Ha (125 m × 160 m). For the First Inlet, 63 areas are planned, for a total area of 126 Ha. In the Second Inlet, 238 areas of 2 hectares each are designed, for a total area of 476 Ha. Therefore, the total number of areas in the Mar Piccolo is equal to 126 + 476 = 602 Ha. The current spatial planning has a minimum distance of 20 m between adjacent rows of areas and 5 m from offshore to coast. A minimum distance of 50 m has been provided among the sectors identified, suitably increased at potential landing areas. Dealers must ensure this minimum distance. Each area granted is characterised by a unique code consisting of the sector name and an identification number. At each of the four vertices of the area in use, the dealer must place a yellow bi-conic buoy. Among these, the one at the S-E summit of the concession must be equipped with a flag and must have applied an identification plate of the concession. The plant structure consists of a series of parallel modules, organised according to the “monoventìa” or “biventìa” system, i.e. with one or two main ropes suspended on the same series of floats.
Each module consists of a polypropylene rope, usually called “ventìa”, whose thickness varies between 40 and 50 mm and the length of which is not less than 6 metres. The long line consists of a number between 10 and 20 “ventìe” [60]. Floats are PE-HD buoys for mussel breeding in various colours and generally varying in size (generally 1 m in length). Floats at both ends of the “ventìa” are anchored to the bottom by dead concrete bodies, having an anchor function, with polyethene or polypropylene cables, the length of which varies with the bathymetry of the site. The “ventìa” has the function of supporting the “reste”, tubular socks that act as a support for the mussel growth [25]. The socks, generally made of polypropylene, have a length ranging from 4 to 6 m, are located at about 40–50 cm from each other. The mesh size depends on the size of the mussels. The distance between the floats carrying the parallel “ventìe” is between 10 and 20 m (Figure 14).
Each concession must adopt floats of the same colour and size (unless otherwise indicated for any housing areas), taking care to adopt colours other than adjacent concessions, to distinguish the ownership of the area. Finally, particular attention should be paid to waste that can create problems for the marine ecosystem [30,61]. In this regard, the municipality of Taranto has already signed an agreement protocol for the use of bioplastics [62].
Possible alternatives to current mussel farming systems could be identified by multi-purpose structures such as shellfish towers that can be used for mussels and other possible candidates as seaweed, lobsters, sponges or tunicates [63,64]. However, these structures are currently in the prototype phase, and they need deep waters, present only in limited areas of the Mar Piccolo, to be installed. This is a big deal because the sediment of the Mar Piccolo is susceptible to remoulding and resuspension due to its very low consistency [36]. Therefore this solution may not be optimal for the reference area.
The possibility of installing mussel farms hooked to the supporting structures of offshore wind farms appears to be very advantageous [65], but even in this case, we must consider some aspects. Regarding the positioning of mussel systems in the Puglia region, the legislation provides that mussel farms must limit the impact on the environment through mitigation actions locating them far from protected areas. In addition, the solution proposed by [65] has to take into account the health and hygiene, landscape constraints and cultural and economic aspects (cost of authorisations) that subsist in the area.
Theoretically, it would not be possible to build mussel farms in the first inlet due to the proximity to the SIN (currently we go in derogation of the regulations).
Moreover, the role of mussels in water filtering and remediation [66] remains essential as an ecosystem service for the environment [67].
Lately, mussel farming practices in the first inlet are in decline due to heavy pollution, which forces farmers to pay higher costs, often to dispose of polluted and unsaleable crops. Therefore the point on which to focus attention is to remove the pollution sources and reclaim the area. In addition to this delicate aspect, the right approach is to make the practice more sustainable by reusing waste products such as mussel shells and recovering plastic materials, as highlighted by the many project proposals present in the Italian Recovery and Resilience Plan (NRRP) [68] which are based on studies on hotspots as evaluation more critical of the life cycle of mussel farms [69].

5. Conclusions

The specific activity carried out supports the interventions to be implemented for the reduction and/or interruption of contamination flows in the Mar Piccolo as well as the exploitation of marine resources.
The territorial analysis carried out led to the achievement of an instant and current cartographic representation of the state of the places in the entire basin of the Mar Piccolo.
The digital cartography produced provides a knowledge database thanks to which those structures that impact the ecosystem of interest can be identified with high precision and a large scale of detail.
The results achieved by these activities have led to the definition of detail of all the mussel farms in the Mar Piccolo sea and the areas affected by illegal mussel cultivation activities. Therefore, it was possible to map those areas where it was necessary to remove abusive structures and sanction fishers and lay the groundwork to develop a sustainable management model in the two inlets of the Mar Piccolo concerning mussel farming. In addition, the foundations have been laid to implement a specification of use for these activities, which has become an integral part of the Municipal Coastal Area Management Plan [70].
The level of detail reached with our methodology (airborne sensors and open-source software) is considerably higher than satellite imagery, allowing us to frame in great detail the state of mussel farming and propose guidelines for crops for the first time and allowing the identification of submerged objects up to 1m deep.
Moreover, through the operational workflow developed, it was also possible to identify different types of marine litter (e.g., out-of-use tires), illegal activities along the banks, uncontrolled mini landfills and illegal fishing and submerged objects otherwise not visible (e.g., "ghost nets", wrecked boats and sunken mussel seed capture installations).
The adaptability of open source software to particular and complex contexts has been widely demonstrated as they can also integrate well with hardware components whose characteristics are in a certain way little known and sometimes secret.
Finally, during the processing of the images, it was also possible to identify algal communities; these would not have been identified with sensors operating in the same i.e., the visible range. This reveals new research perspectives for developing new sensors dedicated to the detailed mapping of these biological characteristics of transitional waters and shallow water bodies.
Other developments that can be hypothesised and on which appropriate investigations are being made are:
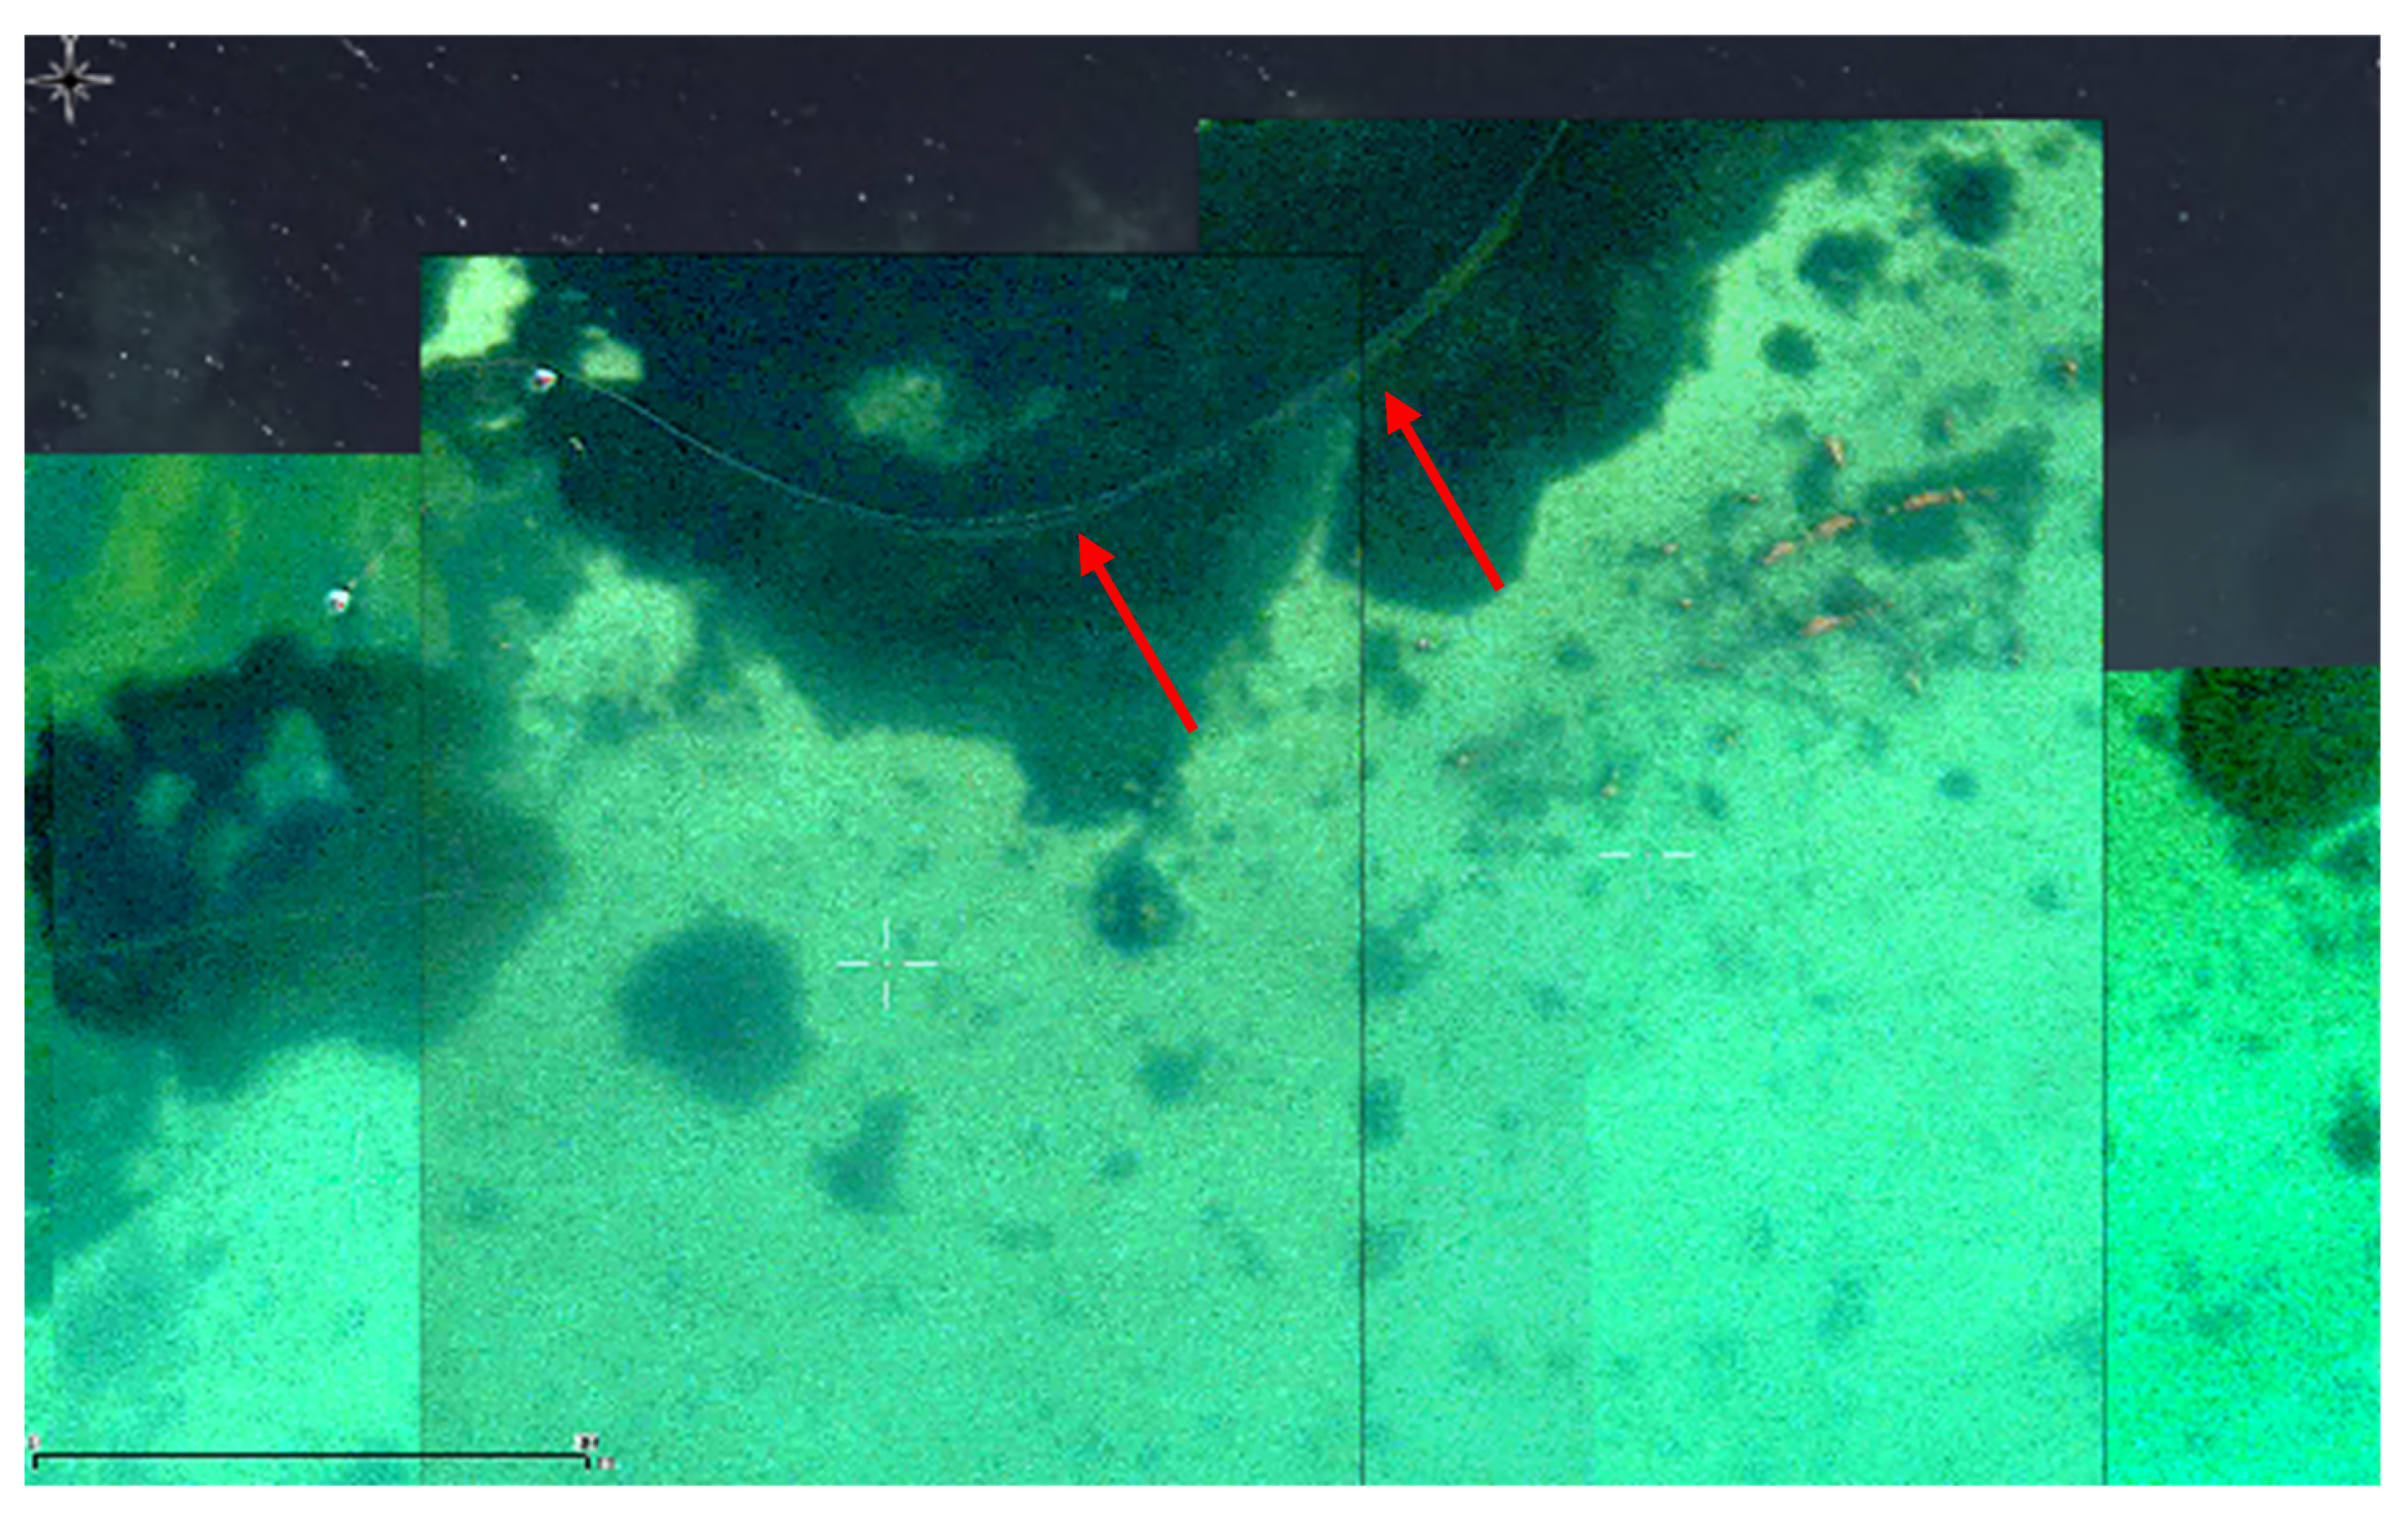
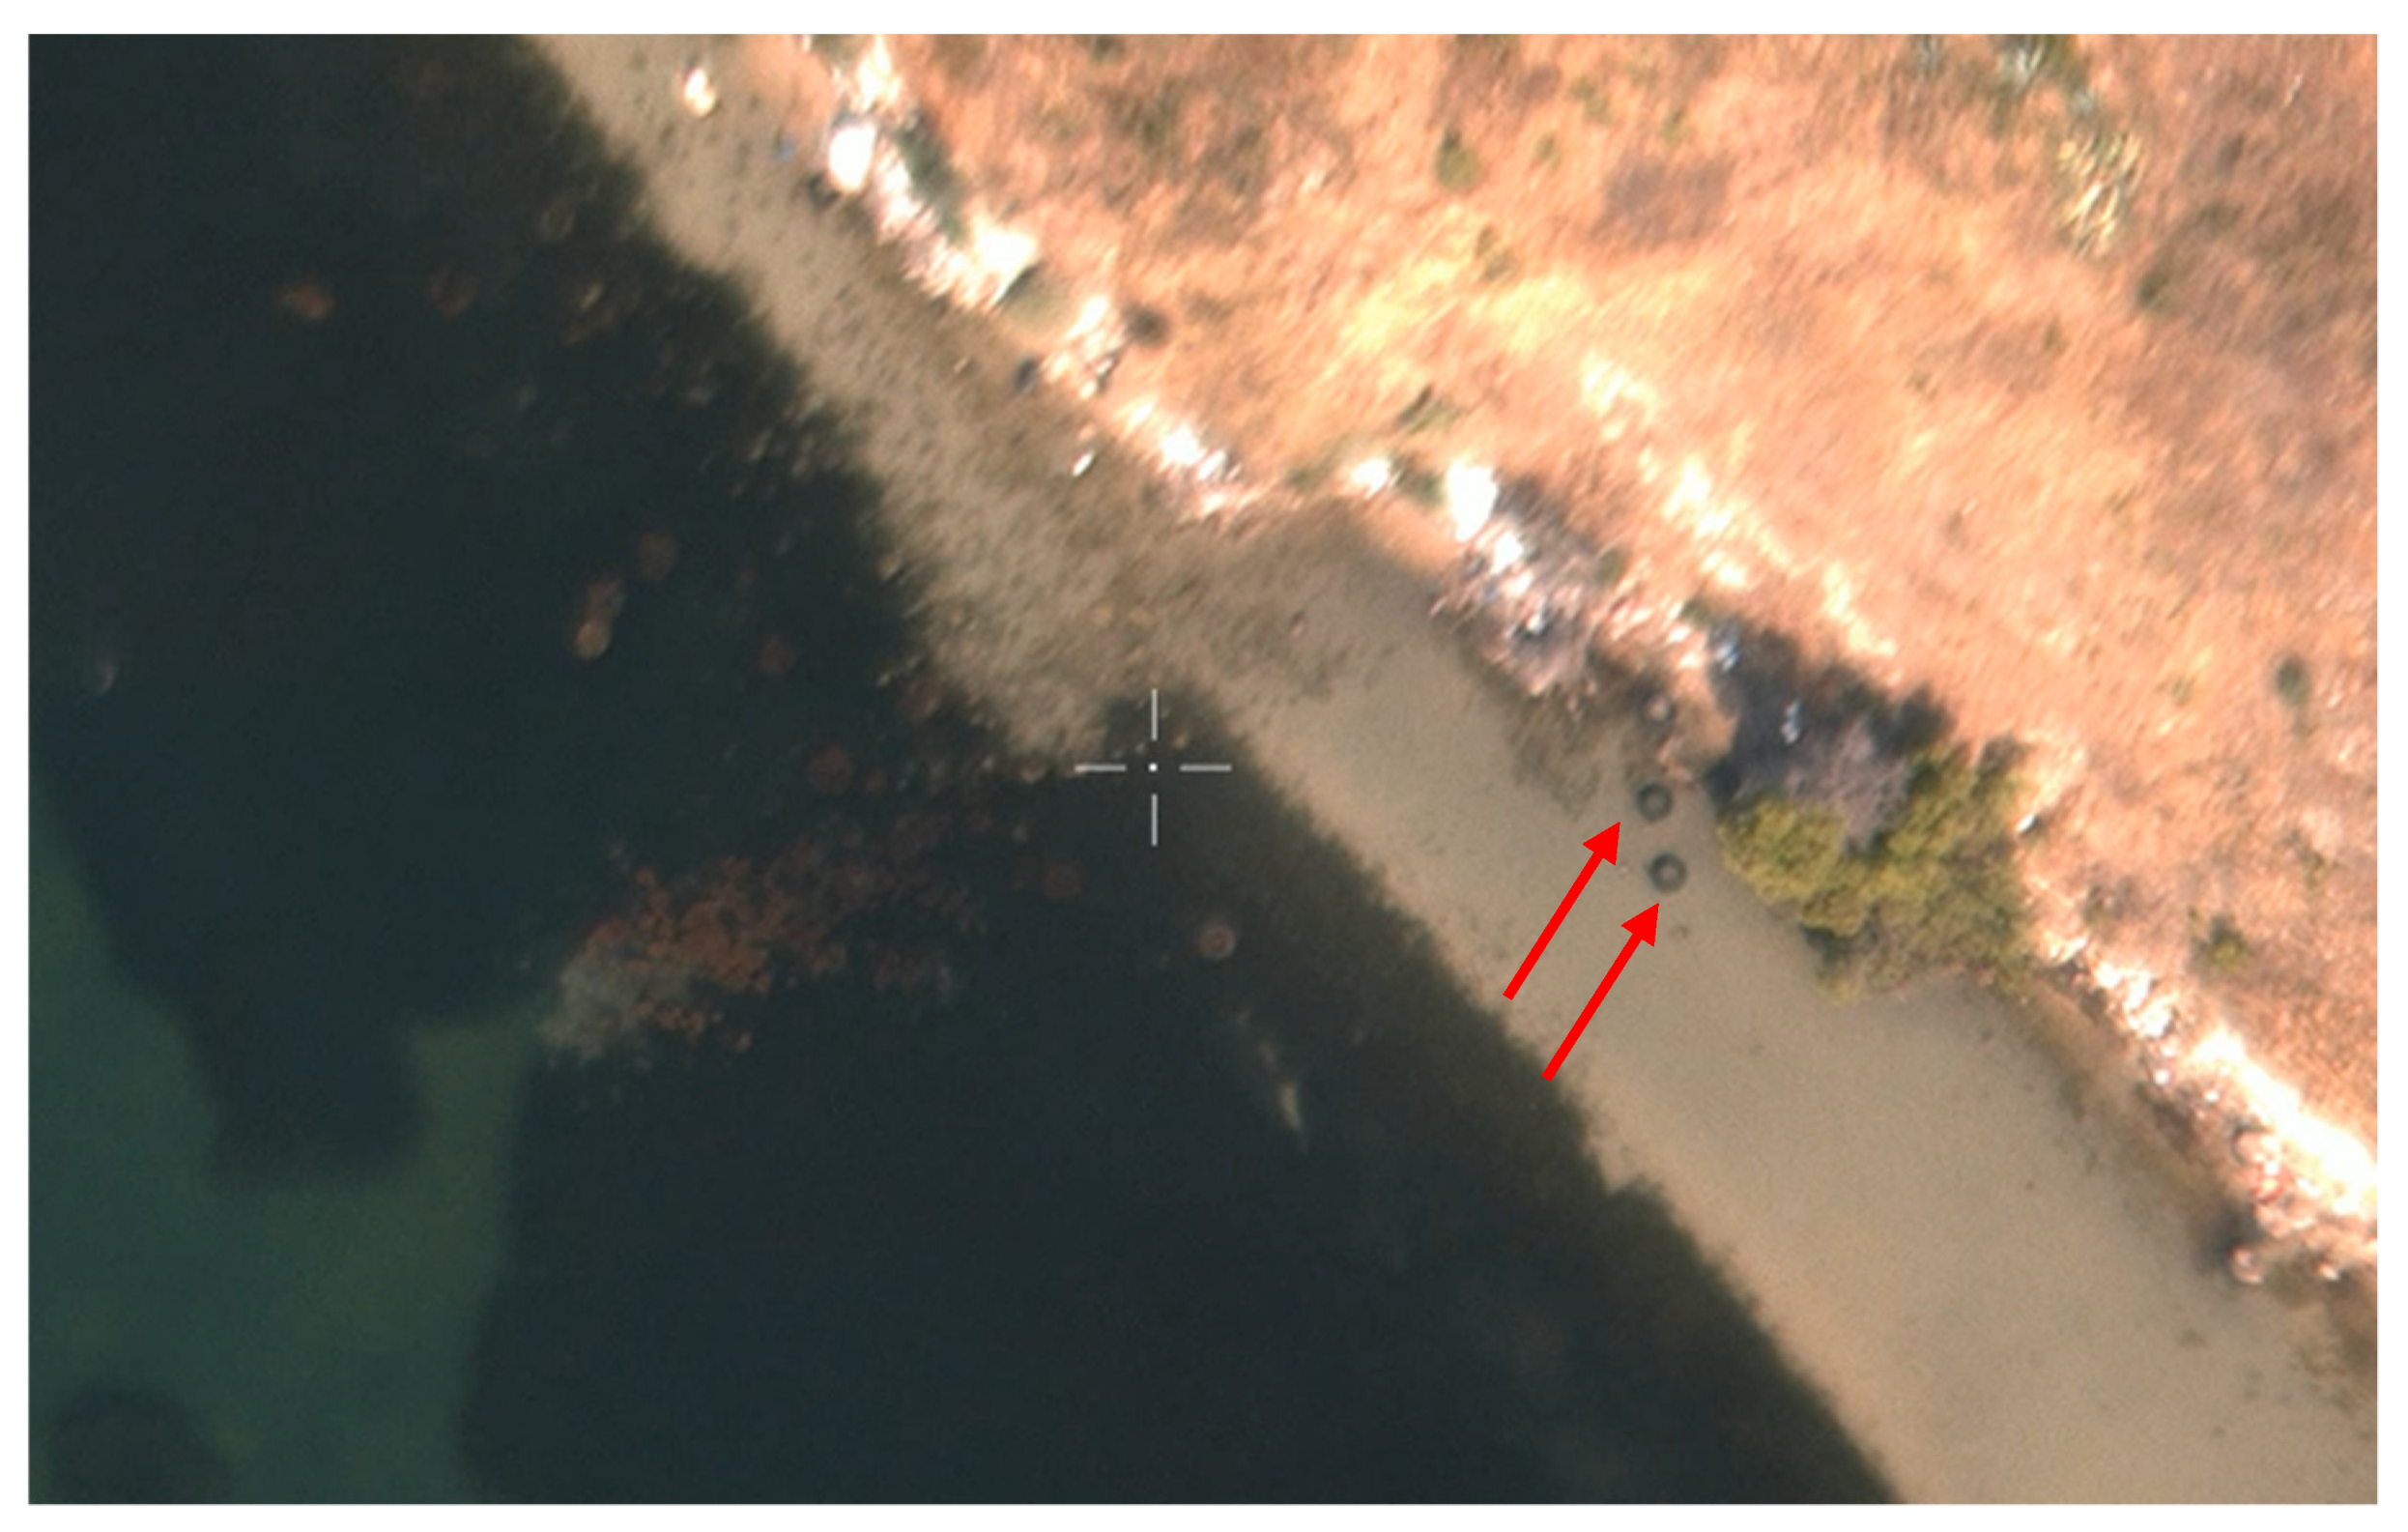
  • identification of any illegal activities as the presence of the fishing net Figure 15;
  • detailed mapping of all waste (Figure 16, Figure 17);
  • algal blooms and species of high ecological interest (phanerogams, biocenosis) that have been registered in the study area on the days of image acquisition;
  • identification of unfavourable locations for mussel farm sites due to turbidity or potential development of harmful algal blooms (we could perform this also using historical series of satellite maps);
  • identification and mapping of marine biocoenosis and phanerogams of high ecological interest
Although our most ambitious goal would be to create other aircraft features, such as real-time counting and mapping, immediate change detection through implementing the harris algorithm [71].
Finally, it is hoped that this case study will become best practices in the combined use of open source technologies in previously precluded fields, especially for a valuable purpose to the community.

Supplementary Materials

Author Contributions

Conceptualization, C.M. and V.F.U.; methodology, C.M. and C.G.; software, C.M.; validation, C.M., C.G. and I.S.; formal analysis, C.M., C.G. and I.S.; investigation, C.M., C.G., I.S. and C.C.; resources, C.M. and V.F.U.; data curation, C.M. and C.G.; writing—original draft preparation, C.M, C.G., I.S. and C.C.; writing—review and editing, C.M., C.G., I.S. and C.C.; visualization, C.M., C.G., I.S. and C.C.; supervision, C.M. and V.F.U.; project administration, C.M. and V.F.U.; funding acquisition, V.F.U. All authors have read and agreed to the published version of the manuscript.

Funding

Not applicable.

Data Availability Statement

The datasets generated during the current study are not publicly available and are used through a specific clearance issued by the Special Commissioner for urgent measures of reclamation, environmental improvements and redevelopment of Taranto.

Acknowledgments

This study was promoted, supervised and funded by the Special Commissioner for urgent measures of reclamation, environmental improvements and redevelopment of Taranto, V. Corbelli, in the framework of the Collaboration Agreement (ex article 15 of law 241/90). The authors gratefully thank ROAN of Bari for the active collaboration.

Conflicts of Interest

The authors declare no conflict of interest.

References

  1. Huang, W.; Fu, B. Remote sensing for coastal area management in China. Coast. Manag. 2002, 30, 271–276. [Google Scholar] [CrossRef]
  2. Mumby, P.J.; Green, E.P.; Edwards, A.J.; Clark, C.D. The cost-effectiveness of remote sensing for tropical coastal resources assessment and management. J. Environ. Manag. 1999, 55, 157–166. [Google Scholar] [CrossRef]
  3. McCarthy, M.J.; Colna, K.E.; El-Mezayen, M.M.; Laureano-Rosario, A.E.; Méndez-Lázaro, P.; Otis, D.B.; Toro-Farmer, G.; Vega-Rodriguez, M.; Muller-Karger, F.E. Satellite Remote Sensing for Coastal Management: A Review of Successful Applications. Environ. Manag. 2017, 60, 323–339. [Google Scholar] [CrossRef] [PubMed]
  4. Gholizadeh, M.H.; Melesse, A.M.; Reddi, L. A comprehensive review on water quality parameters estimation using remote sensing techniques. Sensors 2016, 16, 1298. [Google Scholar] [CrossRef] [Green Version]
  5. Transon, J.; d’Andrimont, R.; Maugnard, A.; Defourny, P. Survey of hyperspectral Earth Observation applications from space in the Sentinel-2 context. Remote Sens. 2018, 10, 157. [Google Scholar] [CrossRef] [Green Version]
  6. Lu, B.; Dao, P.D.; Liu, J.; He, Y.; Shang, J. Recent advances of hyperspectral imaging technology and applications in agriculture. Remote Sens. 2020, 12, 2659. [Google Scholar] [CrossRef]
  7. Fu, W.; Ma, J.; Chen, P.; Chen, F. Remote Sensing Satellites for Digital Earth. In Manual of Digital Earth; Springer: Singapore, 2020. [Google Scholar]
  8. Gholizadeh, A.; Kopačková, V. Detecting vegetation stress as a soil contamination proxy: A review of optical proximal and remote sensing techniques. Int. J. Environ. Sci. Technol. 2019, 16. [Google Scholar] [CrossRef]
  9. Chang, J.; Clay, E.D. Matching ReMatching Remote Sensing to Problems-Remote Sensing to Problems November 2016. In iGrow Corn: Best Management Practices; Clay, E.D., Clay, S.A., Carlson, C.G., Byamukama, E., Eds.; South Dakota State University: Brookings, South Dakota, 2016. [Google Scholar]
  10. Haji Gholizadeh, M.; Melesse, A.M.; Reddi, L. Spaceborne and airborne sensors in water quality assessment. Int. J. Remote Sens. 2016, 37, 3143–3180. [Google Scholar] [CrossRef]
  11. Grant, J.; Bacher, C.; Ferreira, J.G.; Groom, S.; Morales, J.; Rodriguez-Benito, C.; Saitoh, S.-I.; Sathyendranath, S.; Stuart, V. Remote Sensing Applications in Marine Aquaculture-Remote Sensing in Fisheries and Aquaculture—Chapter 6 Remote Sensing Applications in Marine Aquaculture; Forget, M.-H., Stuart, V., Platt, T., Eds.; IOCCG: Dartmouth, NS, Canada, 2009. [Google Scholar]
  12. Suplicy, F.M. A review of the multiple benefits of mussel farming. Rev. Aquac. 2020, 12, 204–223. [Google Scholar] [CrossRef]
  13. Ottinger, M.; Clauss, K.; Kuenzer, C. Aquaculture: Relevance, distribution, impacts and spatial assessments-A review. Ocean. Coast. Manag. 2016, 119, 244–266. [Google Scholar] [CrossRef]
  14. Nikolaidis, G.; Koukaras, K.; Aligizaki, K.; Heracleous, A.; Kalopesa, E.; Moschandreou, K.; Tsolaki, E.; Mantoudis, A. Harmful microalgal episodes in Greek coastal waters. J. Biol. Res. 2005, 3, 77–85. [Google Scholar]
  15. Green, E.P.; Mumby, P.J.; Edwards, A.J.; Clark, C.D. A review of remote sensing for the assessment and management of tropical coastal resources. Coast. Manag. 1996, 24, 1–40. [Google Scholar] [CrossRef]
  16. Cerruti, A. Le sorgenti sottomarine (Citri) del Mar Grande e Mar Piccolo di Taranto. Ann. Ist. Super. Nav. Di Napoli 1938, 7, 171–196. [Google Scholar]
  17. Spizzico, M.; Tinelli, R. Hydrogeology of Galese spring, Mar Piccolo of Taranto (South Italy). In Proceedings of the 9th Salt Water Intrusion Meet, Delft, The Netherlands, 12–16 May 1986. Water Manag. Group Delft Univ. Technol.: Delft, The Netherlands, 1986; pp. 85–97. [Google Scholar]
  18. Massarelli, C.; Matarrese, R.; Uricchio, V.F.; Vurro, M. GRASS GIS processing to detect thermal anomalies with TABI sensor. Conf. FOSS4G Eur. Como 2015, 1, 477–482. [Google Scholar]
  19. Zuffianò, L.E.; Basso, A.; Casarano, D.; Dragone, V.; Limoni, P.P.; Romanazzi, A.; Santaloia, F.; Polemio, M. Integrated Environmental Characterization of the Contaminated Marine Coastal Area of Taranto, Ionian Sea (Southern Italy)-The RITMARE Project. Environ. Sci. Pollut. Res. 2016, 12491–12494. [Google Scholar] [CrossRef]
  20. Valenzano, E.; D’Onghia, M.; De Giosa, F.; Demonte, P. Morfologia Delle Sorgenti Sottomarine Dell’area di Taranto (Mar Ionio). Mem. Descr. Carta Geol. d’It. 2020, 105, 65–69. [Google Scholar]
  21. ARPA-Puglia. Approfondimento Tecnico-Scientifico Sulle Interazioni tra il Sistema Ambientale ed i Flussi di Contaminanti da Fonti Primarie e Secondarie. Elaborazione di un Modello Concettuale Sito-Specifico; Ecomondo—ReclaimEXPO: Rimini, Italy, 2014. [Google Scholar]
  22. Cardellicchio, N.; Buccolieri, A.; Giandomenico, S.; Lopez, L.; Pizzulli, F.; Spada, L. Organic pollutants (PAHs, PCBs) in sediments from the Mar Piccolo in Taranto (Ionian Sea, Southern Italy). Mar. Pollut. Bull. 2007, 55, 451–458. [Google Scholar] [CrossRef]
  23. Parenzan, P. Parenzan Il Mar Piccolo e il Mar Grande di Taranto. Thalass. Salentina 1969, 3. [Google Scholar] [CrossRef]
  24. Caroppo, C.; Giordano, L.; Palmieri, N.; Bellio, G.; Bisci, A.P.; Portacci, G.; Sclafani, P.; Hopkins, T.S. Progress toward sustainable mussel aquaculture in Mar Piccolo, Italy. Ecol. Soc. 2012, 17. [Google Scholar] [CrossRef] [Green Version]
  25. Giordano, L.; Portacci, G.; Caroppo, C. Multidisciplinary tools for sustainable management of an ecosystem service: The case study of mussel farming in the Mar Piccolo of Taranto (Mediterranean, Ionian Sea). Ocean. Coast. Manag. 2019, 176, 11–23. [Google Scholar] [CrossRef]
  26. Portacci, G. Contabilizzazione Dei Servizi Ecosistemici: Il Caso Della Molluschicoltura Environmental-Accounting of the Ecosystem Services; 48° Congresso della Societá Italiana di Biologia Marina: Rome, Italy, 2017. [Google Scholar]
  27. Guardia Costiera Taranto. Capitaneria di Porto di Taranto. 2005. Available online: https://www.guardiacostiera.gov.it/Taranto/Pages/ordinanze.aspx (accessed on 20 June 2021).
  28. Regione Pugia. Ordinanza del Presidente Della Giunta Regionale, n. 532: Misure Sanitarie Straordinarie di Controllo del Rischio Per Diossina e PCB Nelle Produzioni di Mitili di Taranto. BURP: Regione Pugia, Italy, 2018.
  29. European Parliament and Council of Europe. Corrigendum to Regulation (EC) No 854/2004 of the European Parliament and of the Council of 29 April 2004 Laying Down Specific Rules for the Organisation of Official Controls on Products of Animal Origin Intended for Human Consumption. Available online: https://eur-lex.europa.eu/LexUriServ/LexUriServ.do?uri=OJ:L:2004:226:0083:0127:EN:PDF (accessed on 20 June 2021).
  30. Spirkovski, Z.; Ilik-Boeva, D.; Ritterbusch, D.; Peveling, R.; Pietrock, M. Ghost net removal in ancient Lake Ohrid: A pilot study. Fish. Res. 2019, 211, 46–50. [Google Scholar] [CrossRef]
  31. Tecniche, A.N.D.I.; Giuseppe, O.A.; Lobasso, V.; Melucci, R.; Fabrizio Manzulli, I. DI NTA PCC. 2020. Available online: https://www.comune.taranto.it/attachments/article/3378/RELAZIONE%20%20PCC%20TARANTO_DIC_2020.pdf (accessed on 3 June 2021).
  32. Mali, M.; Dell’Anna, M.M.; Notarnicola, M.; Damiani, L.; Mastrorilli, P. Combining chemometric tools for assessing hazard sources and factors acting simultaneously in contaminated areas. Case study: “Mar Piccolo” Taranto (South Italy). Chemosphere 2017, 184, 784–794. [Google Scholar] [CrossRef] [PubMed]
  33. Di Leo, A.; Cardellicchio, N.; Giandomenico, S.; Spada, L. Mercury and methylmercury contamination in Mytilus galloprovincialis from Taranto Gulf (Ionian Sea, Southern Italy): Risk evaluation for consumers. Food Chem. Toxicol. 2010, 48, 3131–3136. [Google Scholar] [CrossRef]
  34. Cardellicchio, N.; Buccolieri, A.; Di Leo, A.; Giandomenico, S.; Spada, L. Levels of metals in reared mussels from Taranto Gulf (Ionian Sea, Southern Italy). Food Chem. 2008, 107, 890–896. [Google Scholar] [CrossRef]
  35. Republic Italian National Law n. 426/1998. In Nuovi Interventi in Campo Ambientale; Gazzetta Ufficiale n. 291del 14 dicembre 1998; 1998. Available online: https://www.mite.gov.it/sites/default/files/archivio/normativa/legge_09121998_426.pdf (accessed on 3 June 2021).
  36. Cotecchia, F.; Vitone, C.; Sollecito, F.; Mali, M.; Miccoli, D.; Petti, R.; Milella, D.; Ruggieri, G.; Bottiglieri, O.; Santaloia, F.; et al. A geo-chemo-mechanical study of a highly polluted marine system (Taranto, Italy) for the enhancement of the conceptual site model. Sci. Rep. 2021, 11. [Google Scholar] [CrossRef] [PubMed]
  37. Labianca, C.; De Gisi, S.; Todaro, F.; Notarnicola, M. DPSIR Model Applied to the Remediation of Contaminated Sites. A Case Study: Mar Piccolo Taranto. Appl. Sci. 2020, 10, 5080. [Google Scholar] [CrossRef]
  38. Garen, P.; Robert, S.; Bougrier, S. Comparison of growth of mussel, Mytilus edulis, on longline, pole and bottom culture sites in the Pertuis Breton, France. Aquaculture 2004, 232, 511–524. [Google Scholar] [CrossRef] [Green Version]
  39. Konstantinou, Z.I.; Kombiadou, K. Rethinking suspended mussel-farming modelling: Combining hydrodynamic and bio-economic models to support integrated aquaculture management. Aquaculture 2020, 523, 735179. [Google Scholar] [CrossRef]
  40. Welcome to the Python GDAL/OGR Cookbook!—Python GDAL/OGR Cookbook 1.0 Documentation. Available online: http://pcjericks.github.io/py-gdalogr-cookbook/index.html# (accessed on 3 June 2021).
  41. GDAL—GDAL Documentation. Available online: https://gdal.org/index.html (accessed on 3 June 2021).
  42. FFmpeg License and Legal Considerations. Available online: https://ffmpeg.org/legal.html (accessed on 3 June 2021).
  43. GNU licenses. Available online: https://www.gnu.org/licenses/lgpl-3.0.txt (accessed on 1 June 2021).
  44. Ubuntu Server-for Scale Out Workloads | Ubuntu. Available online: https://ubuntu.com/server (accessed on 3 June 2021).
  45. Shi, Y.; Yang, H.; Gong, M.; Liu, X.; Xia, Y. A Fast and Robust Key Frame Extraction Method for Video Copyright Protection. J. Electr. Comput. Eng. 2017, 2017. [Google Scholar] [CrossRef]
  46. FFmpeg Filters Documentation. Available online: https://ffmpeg.org/ffmpeg-filters.html#crop (accessed on 8 June 2021).
  47. The ImageMagick Development Team. Available online: https://imagemagick.org (accessed on 8 June 2021).
  48. Apache Licenses. Available online: https://www.apache.org/licenses/ (accessed on 3 June 2021).
  49. Gonzalez, R.C.; Woods, R.E. Digital Image Processing; Pearson: London, UK, 2008; ISBN 978-0-13-168728-8. [Google Scholar]
  50. Al-Ameen, Z. Sharpness Improvement for Medical Images Using a New Nimble Filter. 3D Res. 2018, 9, 1–12. [Google Scholar] [CrossRef]
  51. Bull, D.R. Digital Picture Formats and Representations. In Communicating Pictures; Elsevier: Amsterdam, The Netherlands, 2014; pp. 99–132. [Google Scholar]
  52. Barnsley, M.F. Fractals Everywhere; Elsevier: Amsterdam, The Netherlands, 1993; ISBN 978-0-12-079061-6. [Google Scholar]
  53. Szeliski, R. Computer Vision; Texts in Computer Science; Springer: London, UK, 2011; ISBN 978-1-84882-934-3. [Google Scholar]
  54. Apulia Region Territorial Information System. Available online: http://www.sit.puglia.it/portal/portale_cartografie_tecniche_tematiche/WMS (accessed on 3 June 2021).
  55. GitHub-Gvellut/FreehandRasterGeoreferencer: QGIS Plugin for the Interactive Georeferencing of Rasters. Available online: https://github.com/gvellut/FreehandRasterGeoreferencer (accessed on 3 June 2021).
  56. Alexandridis, T.K.; Topaloglou, C.A.; Lazaridou, E.; Zalidis, G.C. The performance of satellite images in mapping aquacultures. Ocean Coast. Manag. 2008, 51, 638–644. [Google Scholar] [CrossRef]
  57. Corbelli, V.; Capasso, G.; Velardo, R. Talassografico “A. Cerruti”. In AUSL Taranto-Dipartimento di Prevenzione Disciplinare d’uso e Gestione Delle Aree Concesse per Attività di Mitilicoltura nel Mar Piccolo e Mar Grande di Taranto; BURP: Puglia Region, Italy, 2019. [Google Scholar]
  58. Guardia Costiera Taranto. Orders nn. 222/2009 and 107/2005; Guardia Costiera Taranto: Taranto, Italy, 2009. [Google Scholar]
  59. Konstantinou, Z.I.; Kombiadou, K.; Krestenitis, Y.N. Effective mussel-farming governance in Greece: Testing the guidelines through models, to evaluate sustainable management alternatives. Ocean Coast. Manag. 2015, 118, 247–258. [Google Scholar] [CrossRef]
  60. Regione autonoma della Sardegna. Acquacoltura in Sardegna. Tradizioni, Innovazione e ambiente; Laore Sardegna: Cagliari, Italy, 2016. [Google Scholar]
  61. Da Ros, L. LIFE-GHOST Project. Final Report; ISMAR Istituto di Scienze Marine: Venice, Italy, 2016. [Google Scholar]
  62. Retine in Bioplastica per la Mitilicoltura, Firmato un Protocollo D’intesa tra Comune di Taranto e Novamont. Available online: https://www.comune.taranto.it/index.php/elenco-news/3121-retine-in-bioplastica-per-la-mitilicoltura-firmato-un-protocollo-d-intesa-tra-comune-di-taranto-e-novamont (accessed on 14 June 2021).
  63. Heasman, K.G.; Scott, N.; Smeaton, M.; Goseberg, N.; Hildebrandt, A.; Vitasovich, P.; Elliot, A.; Mandeno, M.; Buck, B.H. New system design for the cultivation of extractive species at exposed sites-Part 1: System design, deployment and first response to high-energy environments. Appl. Ocean Res. 2021, 110, 102603. [Google Scholar] [CrossRef]
  64. Landmann, J.; Fröhling, L.; Gieschen, R.; Buck, B.H.; Heasman, K.; Scott, N.; Smeaton, M.; Goseberg, N.; Hildebrandt, A. New system design for the cultivation of extractive species at exposed sites-Part 2: Experimental modelling in waves and currents. Appl. Ocean Res. 2021, 113, 102749. [Google Scholar] [CrossRef]
  65. Dalton, G.; Bardócz, T.; Blanch, M.; Campbell, D.; Johnson, K.; Lawrence, G.; Lilas, T.; Friis-Madsen, E.; Neumann, F.; Nikitas, N.; et al. Feasibility of investment in Blue Growth multiple-use of space and multi-use platform projects; results of a novel assessment approach and case studies. Renew. Sustain. Energy Rev. 2019, 107, 338–359. [Google Scholar] [CrossRef]
  66. Montaudouin, X.; de Sandra, E. (Eds.) Shellfish aquaculture and the environment. Environ. Sci. Pollut. Res. 2014, 21, 7781–7783. [Google Scholar] [CrossRef]
  67. Jansen, H.M.; Van Den Burg, S.; Bolman, B.; Jak, R.G.; Kamermans, P.; Poelman, M.; Stuiver, M. The feasibility of offshore aquaculture and its potential for multi-use in the North Sea. Aquac. Int. 2016, 24, 735–756. [Google Scholar] [CrossRef] [Green Version]
  68. The National Recovery and Resilience Plan (NRRP)-Ministry of Economy and Finance. Available online: https://www.mef.gov.it/en/focus/The-National-Recovery-and-Resilience-Plan-NRRP/ (accessed on 22 July 2021).
  69. Tamburini, E.; Turolla, E.; Fano, E.A.; Castaldelli, G. Sustainability of Mussel (Mytilus Galloprovincialis) Farming in the Po River Delta, Northern Italy, Based on a Life Cycle Assessment Approach. Sustainability 2020, 12, 3814. [Google Scholar] [CrossRef]
  70. Comune di Taranto Avviso Pubblico Adozione Piano Comunale Delle Coste. Available online: https://www.comune.taranto.it/index.php/41-avvisi/3378-avviso-adozione-piano-comunale-delle-coste (accessed on 19 June 2021).
  71. Tadonki, C.; Lacassagne, L.; Dadi, E.; El Daoudi, M. Accelerator-based implementation of the Harris algorithm. In Lecture Notes in Computer Science (including subseries Lecture Notes in Artificial Intelligence and Lecture Notes in Bioinformatics); Springer: Berlin, Heidelberg, 2012; Volume 7340, pp. 485–492. [Google Scholar]
Figure 1. Study area.
Remotesensing 13 02985 g001
Figure 2. Traditional mussel farms called “quadri” in the first inlet of Mar Piccolo (Puglia Region). May 2015.
Remotesensing 13 02985 g002
Figure 3. Floating systems of mussel farms called “long lines” where the plastic buoys are clearly visible (in the background, a former shipyard is visible) in the first inlet of Mar Piccolo (Puglia Region). May 2018.
Remotesensing 13 02985 g003
Figure 4. Ancient mussel farms abandoned and never restored (the red arrows indicate the barely visible poles on the water). First inlet of Mar Piccolo (Puglia Region). May 2018.
Remotesensing 13 02985 g004
Figure 5. All flight paths from the logbook.
Remotesensing 13 02985 g005
Figure 6. The operative workflow implemented.
Remotesensing 13 02985 g006
Figure 7. The figure represents how to change three of the ten keyframes used to empirically testing how to change three of the ten keyframes used to set empirically the gamma value based on acquired video files. On the right, the slope of the curve representing the relationship (in logarithmic terms) between signal and response.
Remotesensing 13 02985 g007
Figure 8. Image enhancement in three different environments: (ac) the acquired image, (df) the same reworked image.
Remotesensing 13 02985 g008
Figure 9. (a) phase of the creation of the union framework. Detail of some video tracks during processing, a detail in which the set of significant individual frames is superimposed for each flight path. (b) Mosaic of two frames of the investigated study area. The perfect overlap of them is shown with the example of a street; (c) Overlapping of the frames after the georeferencing phase with the flight route data identified with dots; (d) Example of how a frame, not affected by the presence of anthropogenic objects, is coloured (right).
Remotesensing 13 02985 g009
Figure 10. (a) Example of details identifiable with LEOSS unlike the aerial images of Puglia of 2016; (b) Detail of the part of the overall mosaic of all mussel farms; (c) Magnification of the high degree of detail provided.
Remotesensing 13 02985 g010
Figure 11. (a) Invisible and submerged poles (red arrows), (First Inlet of the Mar Piccolo, Puglia Region); (b) Abandoned mussel fields. First Inlet of the Mar Piccolo near Galeso river mouth, Puglia Region (c) Identification of an abandoned mussel farm. (c) Aerial image of Puglia in 2016; (d) LEOSS recent image on the right after the processing here reported. We could call it the “luminol” effect.
Remotesensing 13 02985 g011
Figure 12. Some waste and wrecks identified by the mapping activities (the photos are related to post-mapping inspections. First and second inlet of the Mar Piccolo (Puglia Region).
Remotesensing 13 02985 g012
Figure 13. Example of disorder due to overexploitation.
Remotesensing 13 02985 g013
Figure 14. Scheme of the mussel farm module according to the proposed specification. B = Buoy.
Remotesensing 13 02985 g014
Figure 15. Illegal fishing net.
Remotesensing 13 02985 g015
Figure 16. Detail of two tires (red arrows) on the beach.
Remotesensing 13 02985 g016
Figure 17. Inspection in which we verified the presence of waste on the banks. First inlet of the Mar Piccolo (Puglia Region). September 2019.
Remotesensing 13 02985 g017
Publisher’s Note: MDPI stays neutral with regard to jurisdictional claims in published maps and institutional affiliations.

