
A Waveform-Encoded SAR Implementation Using a Limited Number of Cyclically Shifted Chirps


1
German Aerospace Center (DLR), Microwaves and Radar Institute, 82234 Wessling, Germany
2
Airbus Defence and Space, 88090 Immenstaad, Germany
*
Author to whom correspondence should be addressed.
†
At the time the major part of this work was performed F.G. was an intern with the German Aerospace Center (DLR), Microwaves and Radar Institute, 82234 Wessling, Germany.
Remote Sens. 2021, 13(15), 3038; https://0-doi-org.brum.beds.ac.uk/10.3390/rs13153038
Submission received: 18 June 2021
/
Revised: 17 July 2021
/
Accepted: 28 July 2021
/
Published: 2 August 2021
(This article belongs to the Special Issue Earth Environment Monitoring with Advanced Spaceborne Synthetic Aperture Radar: New Architectures, Operational Modes, and Processing Techniques)
Abstract
:Synthetic aperture radar (SAR) provides high-resolution images of the Earth’s surface irrespective of sunlight and weather conditions. In conventional spaceborne SAR, nadir echoes caused by the pulsed operation of SAR may significantly affect the SAR image quality. Therefore, the pulse repetition frequency (PRF) is constrained within the SAR system design to avoid the appearance of nadir echoes in the SAR image. As an alternative, the waveform-encoded SAR concept using a pulse-to-pulse variation of the transmitted waveform and dual-focus postprocessing can be exploited for nadir echo removal and to alleviate the PRF constraints. In particular, cyclically shifted chirps have been proposed as a possible waveform variation scheme. However, a large number of distinct waveforms is required to enable the simple implementation of the concept. This work proposes a technique based on the Eulerian circuit for generating a waveform sequence starting from a reduced number of distinct cyclically shifted chirps that can be effectively exploited for waveform-encoded SAR. The nadir echo suppression performance of the proposed scheme is analyzed through simulations using real TerraSAR-X data and a realistic nadir echo model that shows how the number of distinct waveforms and therefore the system complexity can be reduced without significant performance loss. These developments reduce the calibration burden and make the concept viable for implementation in future SAR systems.
1. Introduction
Synthetic aperture radar (SAR) is a technology capable of providing high-resolution images for remote sensing applications regardless of sunlight illumination and weather conditions [1,2]. A typical SAR system is mounted on a moving platform to transmit electromagnetic pulses and to receive the reflections from the region of interest.
The pulsed operation of SAR results in a simultaneous return of the echoes from the desired scene and the echoes of succeeding pulses reflected from the nearest range to the radar, referred to as nadir echoes. The nadir echo may significantly affect the SAR image quality with its strong intensity because of the shorter distance and the specular reflection even though it is attenuated by the transmit and receive antenna patterns. The nadir echo is typically seen as a bright stripe in the SAR image [3], as shown in Figure 1.
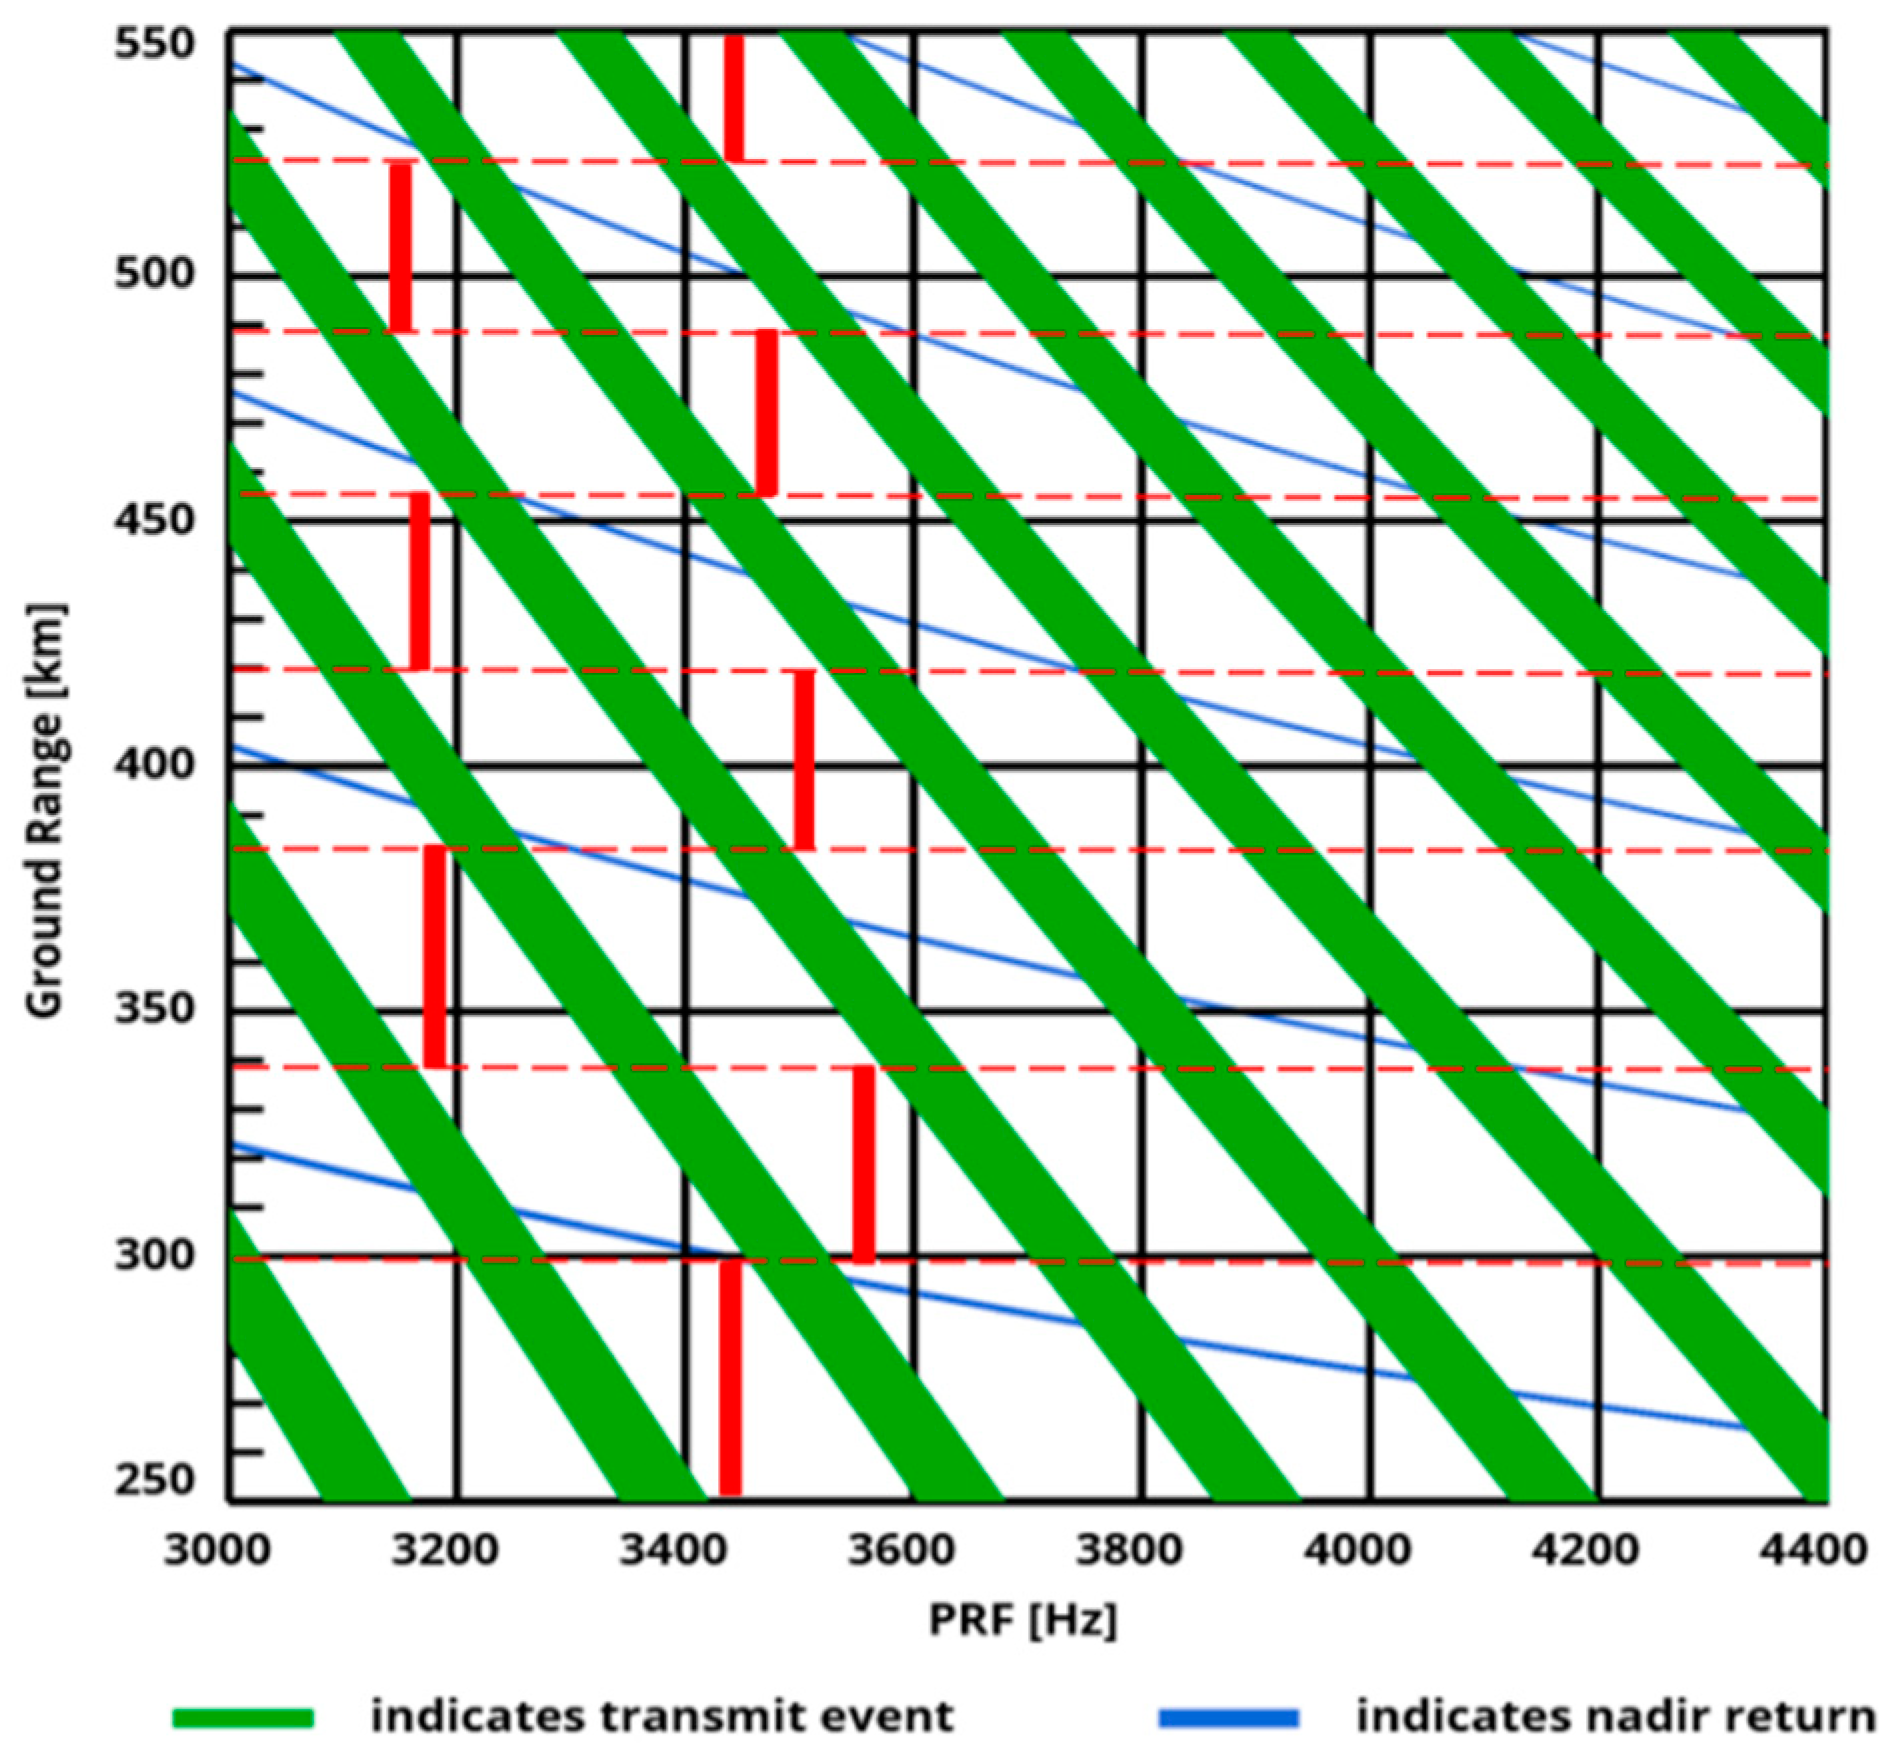
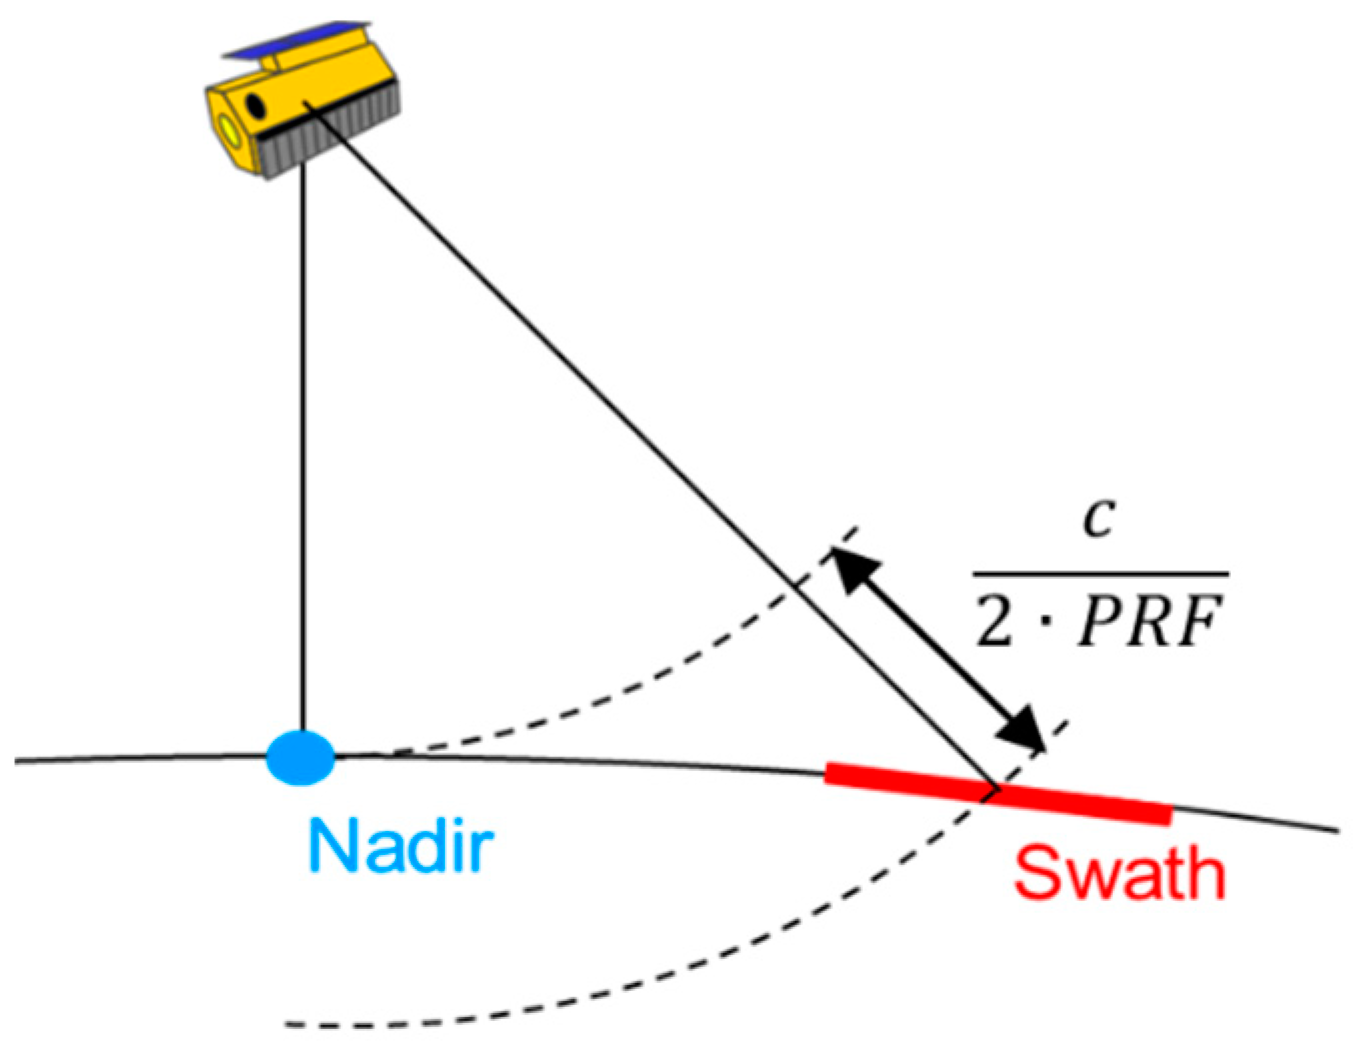
The nadir interference in SAR images is avoided by proper the selection of the pulse repetition frequency (PRF) in the design of conventional spaceborne SAR systems using a timing (or diamond) diagram [4,5], shown in Figure 2. The blue areas represent the “blind” ground ranges, which cannot be imaged due to the transmit interference, while the green areas represent ground ranges where nadir interference is present in the imaged scene. The PRF is selected for the desired range swath (in red) to be imaged without transmit and nadir interferences.
The constraint on the PRF selection additionally imposed by the nadir echoes limits the SAR system performances in terms of both swath width and ambiguities. Hence, nadir echo suppression can alleviate the constraint on the PRF selection so that the given requirements can be achieved without increasing the system complexity or the antenna size.
In this sense, an innovative waveform-encoded SAR concept for nadir echo suppression has been proposed [6,7,8]. This method exploits pulse-to-pulse variation of the transmitted waveform and different matched filters in postprocessing for nadir echo removal. This idea can also be adopted for the suppression of very strong range ambiguities [8,9,10]. Even if the postprocessing is not performed for range ambiguities, range ambiguities will still appear to be smeared [11]. Therefore, removing the nadir echo and smearing the range ambiguities through the waveform encoding provides more flexibility in PRF selection and image quality enhancement.
Cyclically shifted chirps have been suggested in the original concept [7] for the pulse-to-pulse variation of the transmitted waveform. Unlike the simple alternation of up- and down-chirps [12,13,14], cyclically shifted chirps allow for the implementation of nadir echo suppression that is also for SAR systems with multiple elevation beams, where the difference of travelling pulses between the swath and the nadir echo is different for each sub-swath. Furthermore, they lead to the smearing of all orders of range ambiguities. However, the originally proposed sequence of cyclically shifted chirps requires a high number of distinct waveforms, increasing the complexity in the hardware implementation and the calibration burden. SAR systems might have limited memory for storing distinct waveforms, e.g., the TerraSAR-X can store up to eight different waveforms for an acquisition [15].
This paper proposes a new idea to design a waveform sequence starting from a reduced number of distinct cyclically shifted chirps by exploiting the Eulerian circuit. For a given number of distinct waveforms, the set of optimum shifts of the cyclically shifted chirps are provided as normalized values that can be used for any pulse width. Furthermore, as the nadir echo suppression of waveform-encoded SAR using cyclically shifted chirps has so far only been assessed through point-target simulations [7]. This work provides additional realistic simulations using real TerraSAR-X data and a realistic nadir echo model derived from real radar measurements.
The paper is structured as follows: Section 2 recalls the concept of a waveform-encoded SAR using cyclically shifted chirps and addresses some issues related to the optimization of the variation of the shift across the azimuth. Section 3 introduces the waveform sequence design based on the Eulerian circuit to reduce the number of required distinct waveforms. Section 4 presents the results of both the point-target and the realistic simulations together with a performance analysis, and Section 5 draws some conclusions.
2. Cyclically Shifted Chirps for Waveform-Encoded SAR
The simultaneous return of the echo from the swath and the succeeding echo from the nadir results in the nadir echo appearing in a SAR image. A pulse-to-pulse variation of orthogonal waveforms allows the nadir echo to smeared while focusing the echo from the swath even though they are superimposed in the received signals by selectively using different matched filters because they correspond to different orthogonal waveforms [7]. The smeared nadir echo is less visible in a focused SAR image but still exists in the background.
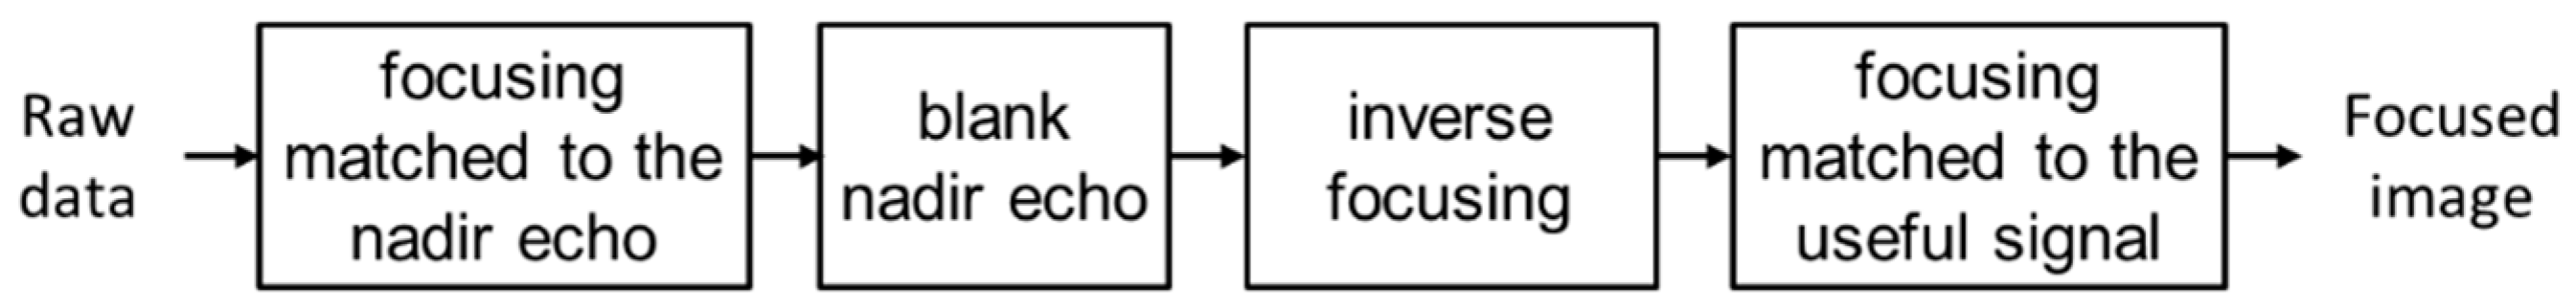
A dedicated multi-focus postprocessing shown in Figure 3 can be applied to further remove the nadir echo. The raw data is focused using a filter matched to the nadir echo instead of the useful signal. The focused nadir echo can be removed with only a negligible influence on the useful signal because the nadir echo is located within a narrow range interval. The focused nadir echo is blanked by simply replacing the samples with zeros or introducing noise with the mean level of the useful signal. The nadir echo removed data are inversely focused back into raw data and are then focused again using a filter matched to the useful signal. This concept is referred to as waveform-encoded SAR.
A possible implementation of the waveform-encoded SAR is based on the cyclically shifted chirps proposed in [10], an example of short-term shift-orthogonal waveforms [16], which is defined as follows [7]:
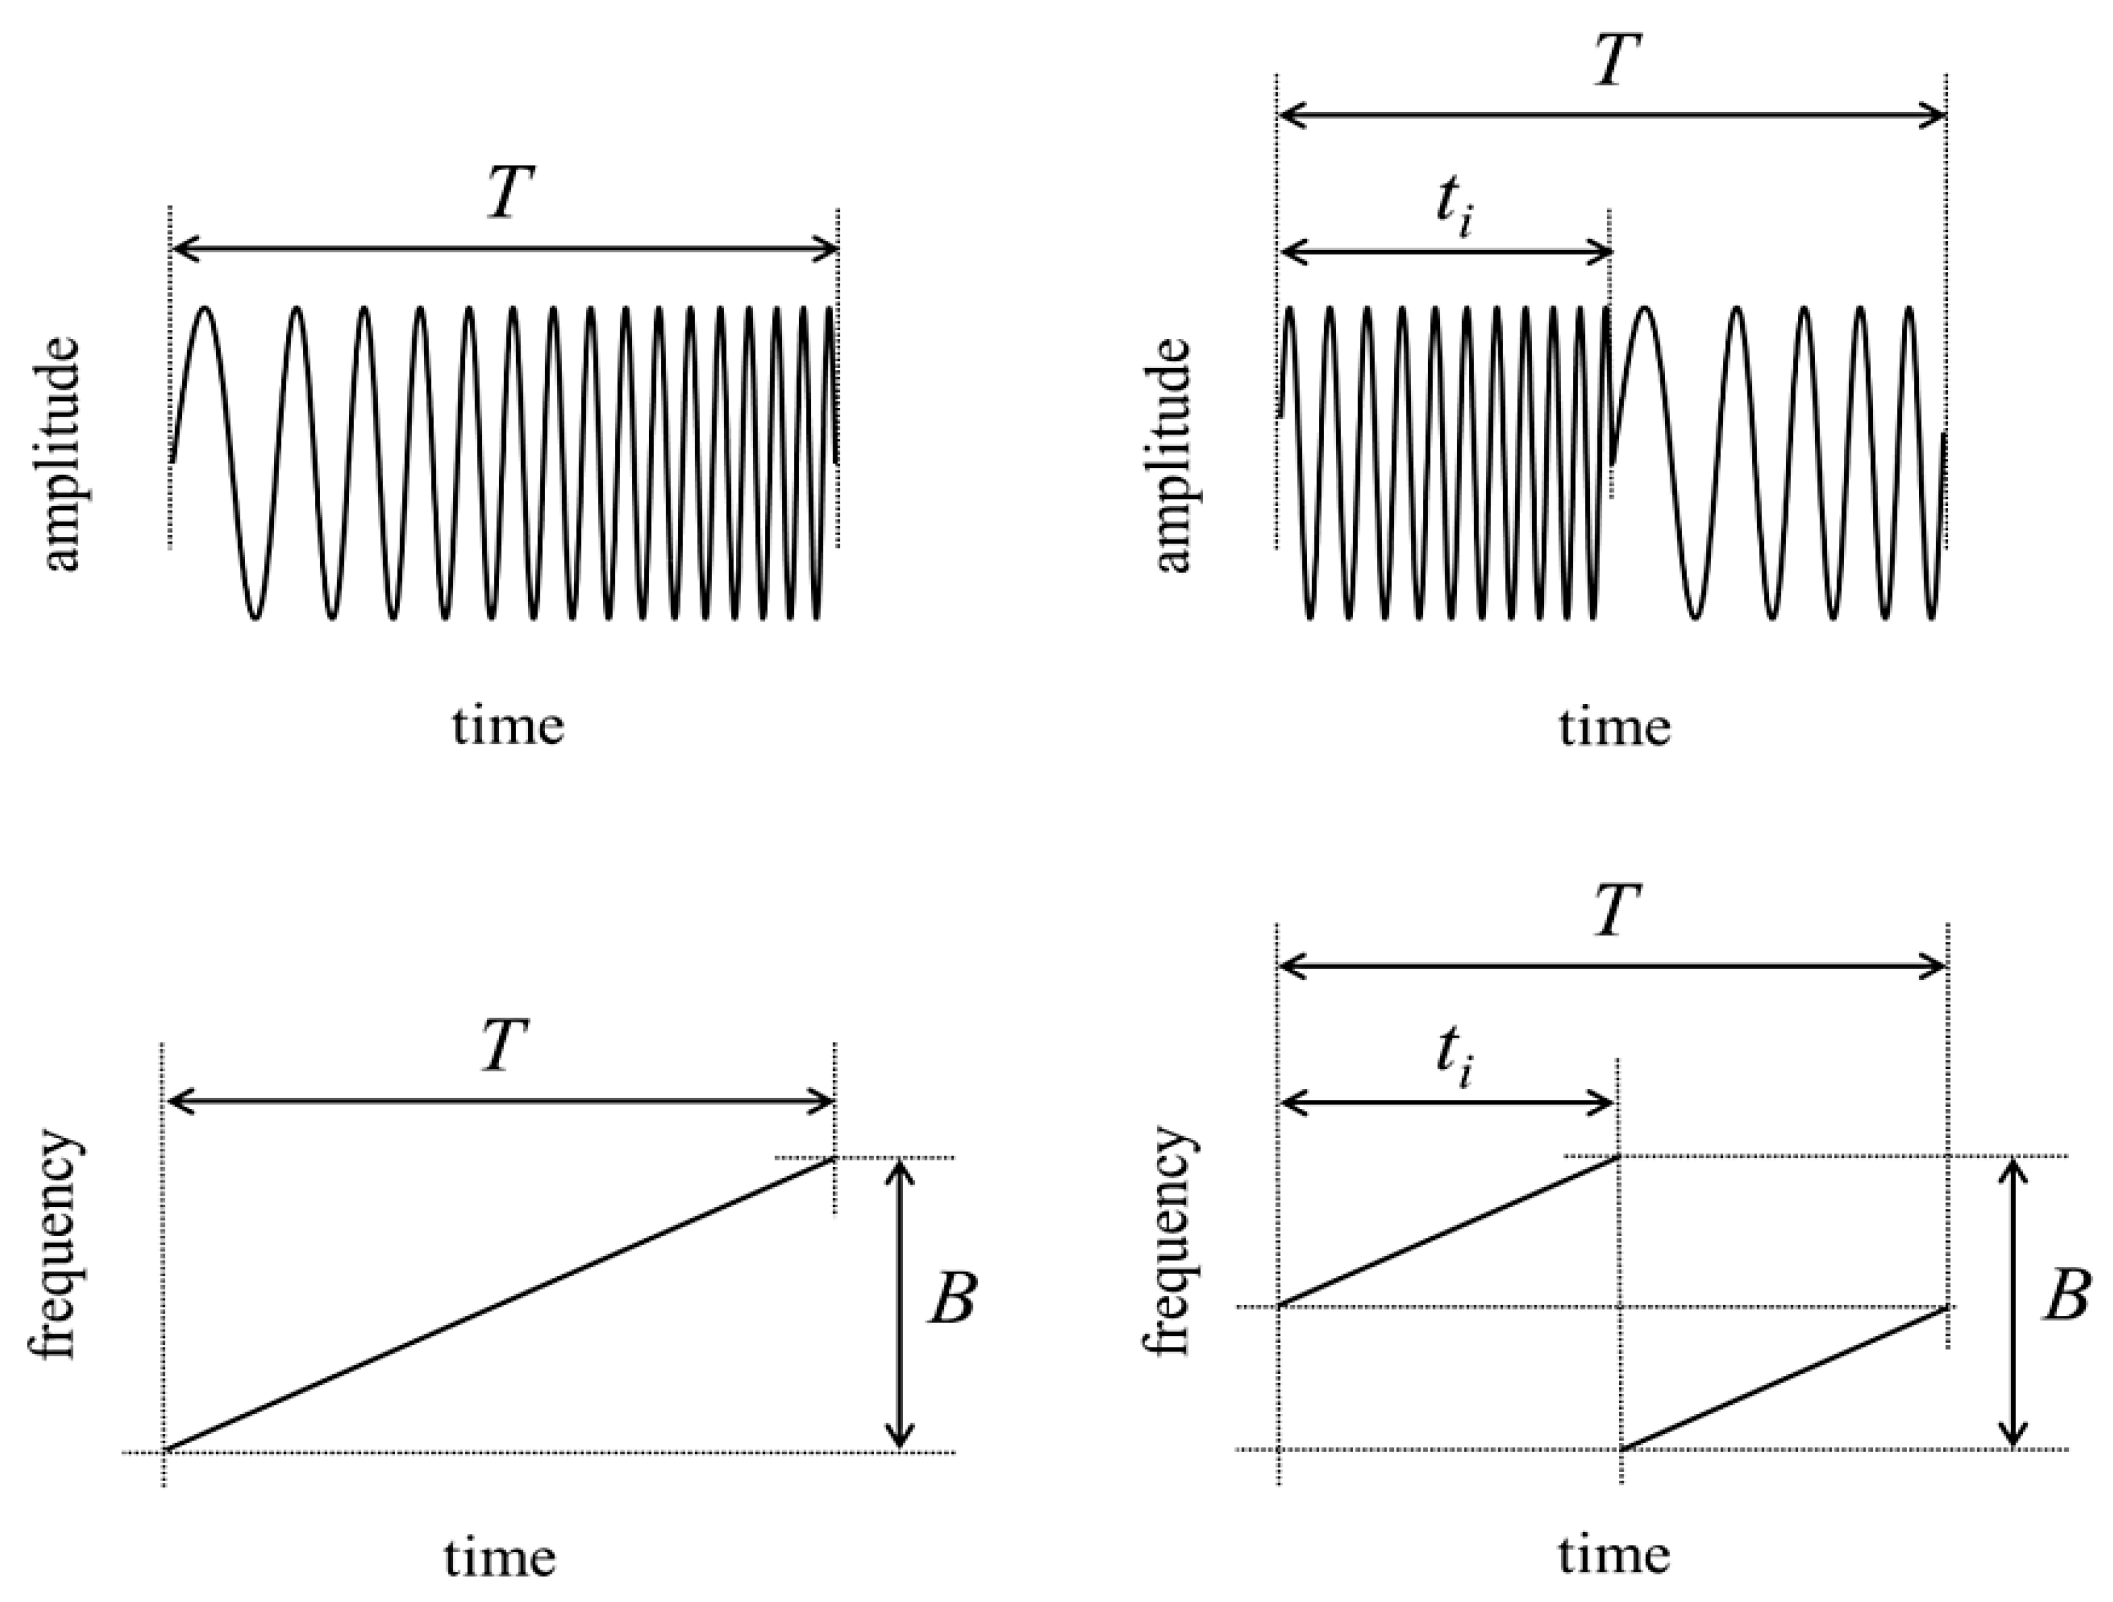
where is the chirp bandwidth, is the chirp width, and is the cyclical shift of the waveform. Figure 4 shows the schematic comparison of the conventional nonshifted and the cyclically shifted chirp.
The sequence of shifts, , which identifies the sequence of waveforms, is periodically repeated while and remain constant. The pulse-to-pulse variation across the azimuth is described by the variation given by the following quadratic law [7]:
The received echoes are processed using the ideal filter proposed in [17] instead of the usual matched filter. The nadir echo is focused at different ranges after range compression using a filter “matched” to the useful signal. The dislocation varies over the pulses according to the difference of the chirp shifts, which leads to the smearing of the nadir echo along the azimuth as a result of azimuth compression.
While in the example provided in [7] and the expression in Equation (2) allows the smearing of the nadir echo across twice the pulse width in range and the whole synthetic aperture in the azimuth, this is not the case for an arbitrary set of parameters. For that, a factor () is introduced as follows to achieve a uniform smearing in all systems [18]:
produces a faster variation of the shift across the azimuth, leading to the repetition of in every sample instead of in every sample in the azimuth. If is smaller than the number of azimuth samples of the synthetic aperture, the smearing in the azimuth extends over the fully synthetic aperture, leading to the following condition for :
where is the slant range, is the wavelength, is the antenna length, and is the platform speed, which results in
It is therefore desired for an optimized system to choose according to Equation (5) in order to maximize the smearing. Maximizing the smearing will also lead to a better suppression of the nadir echo during postprocessing.
Some typical TerraSAR-X parameters are listed in Table 1 and were adopted as a case study to simulate the nadir echo smearing of the cyclically shifted chirps. A simple scenario illustrated in Figure 5 in which a point target is located at the nadir is considered.
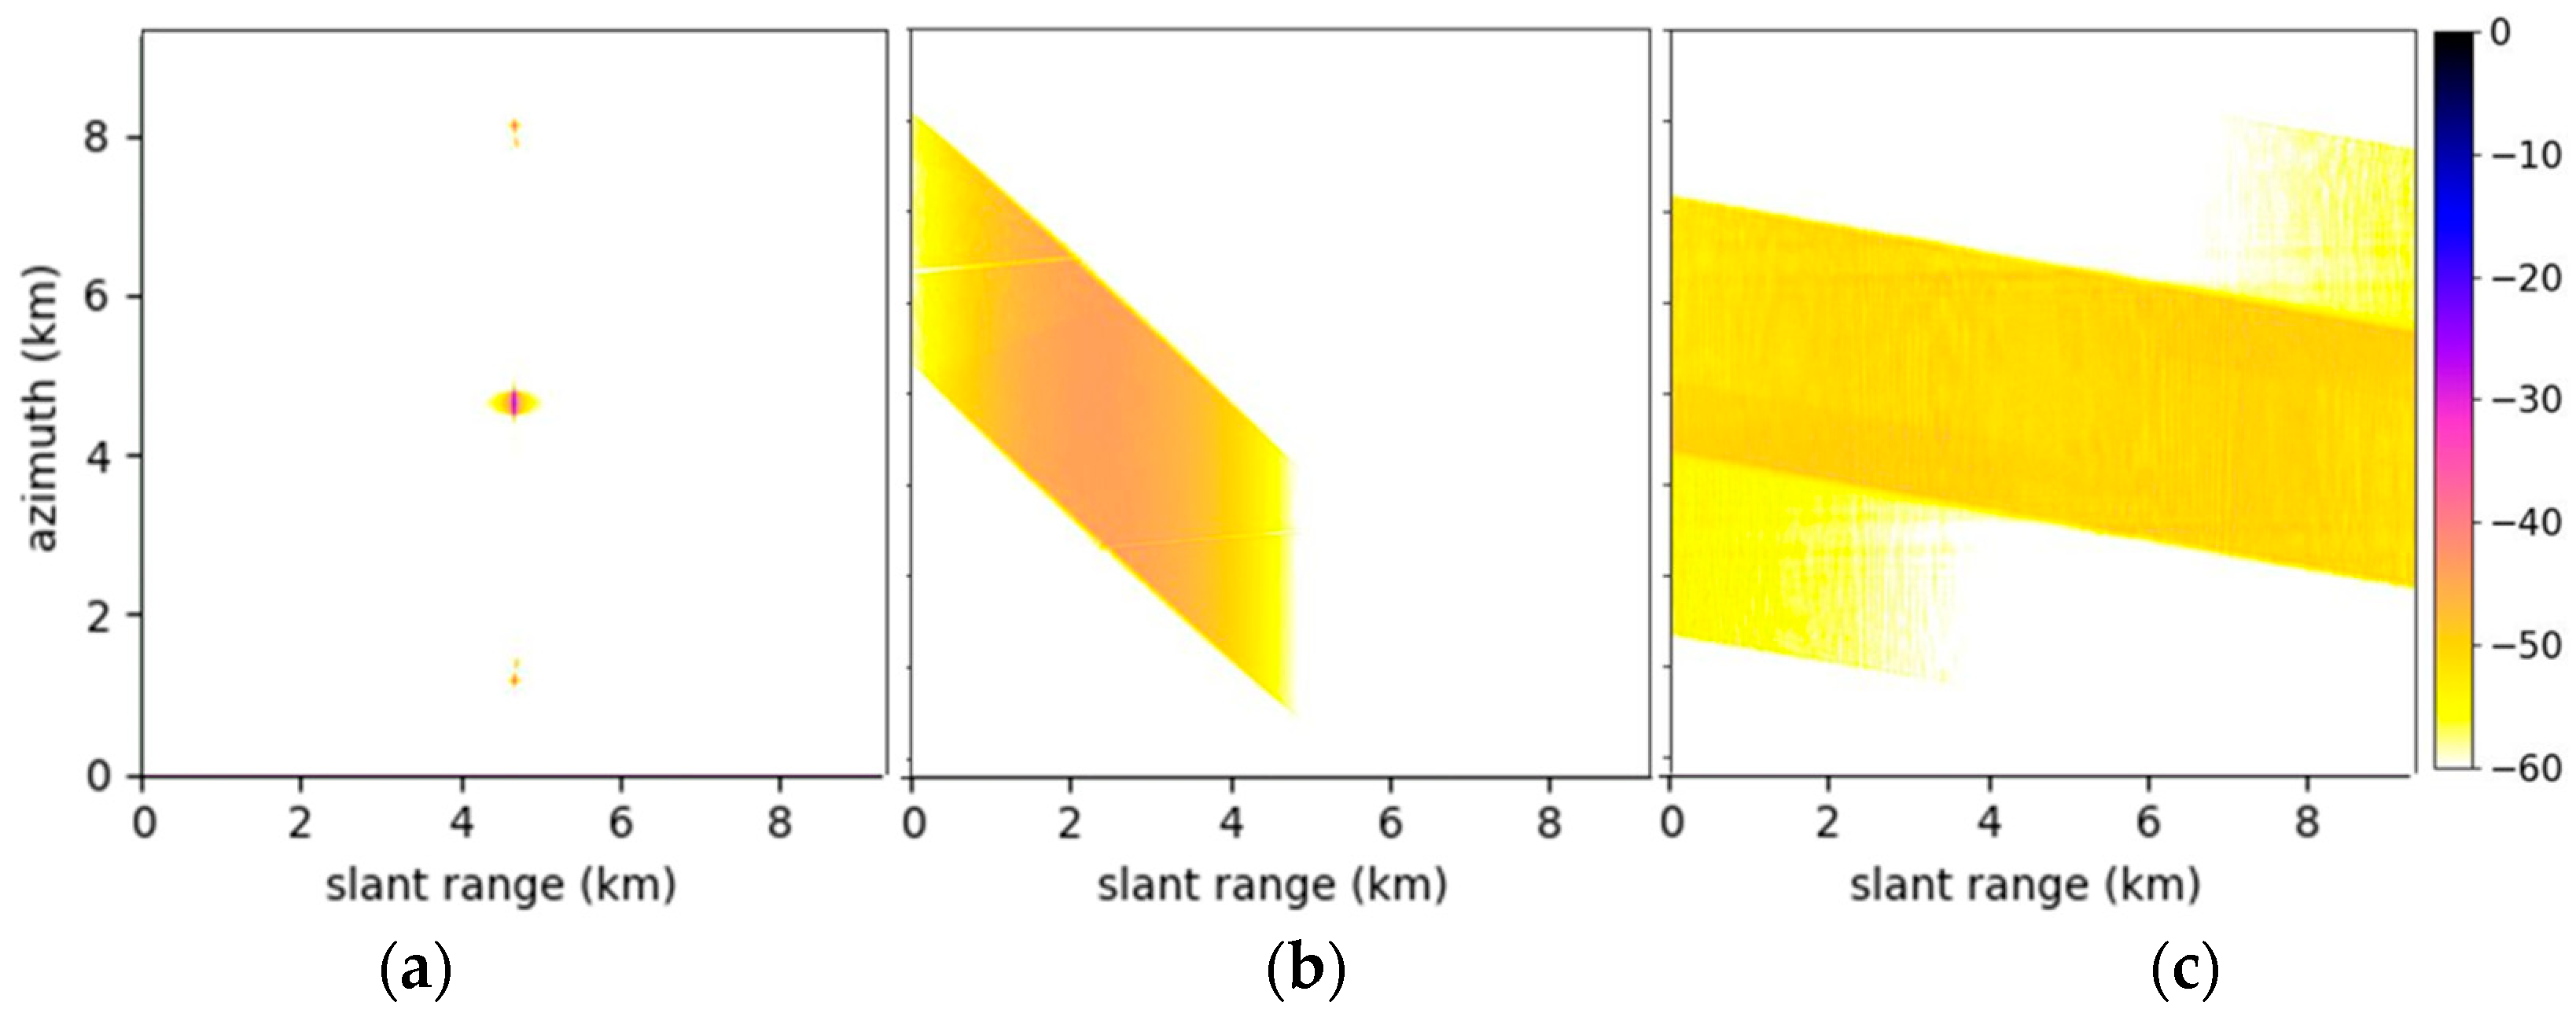
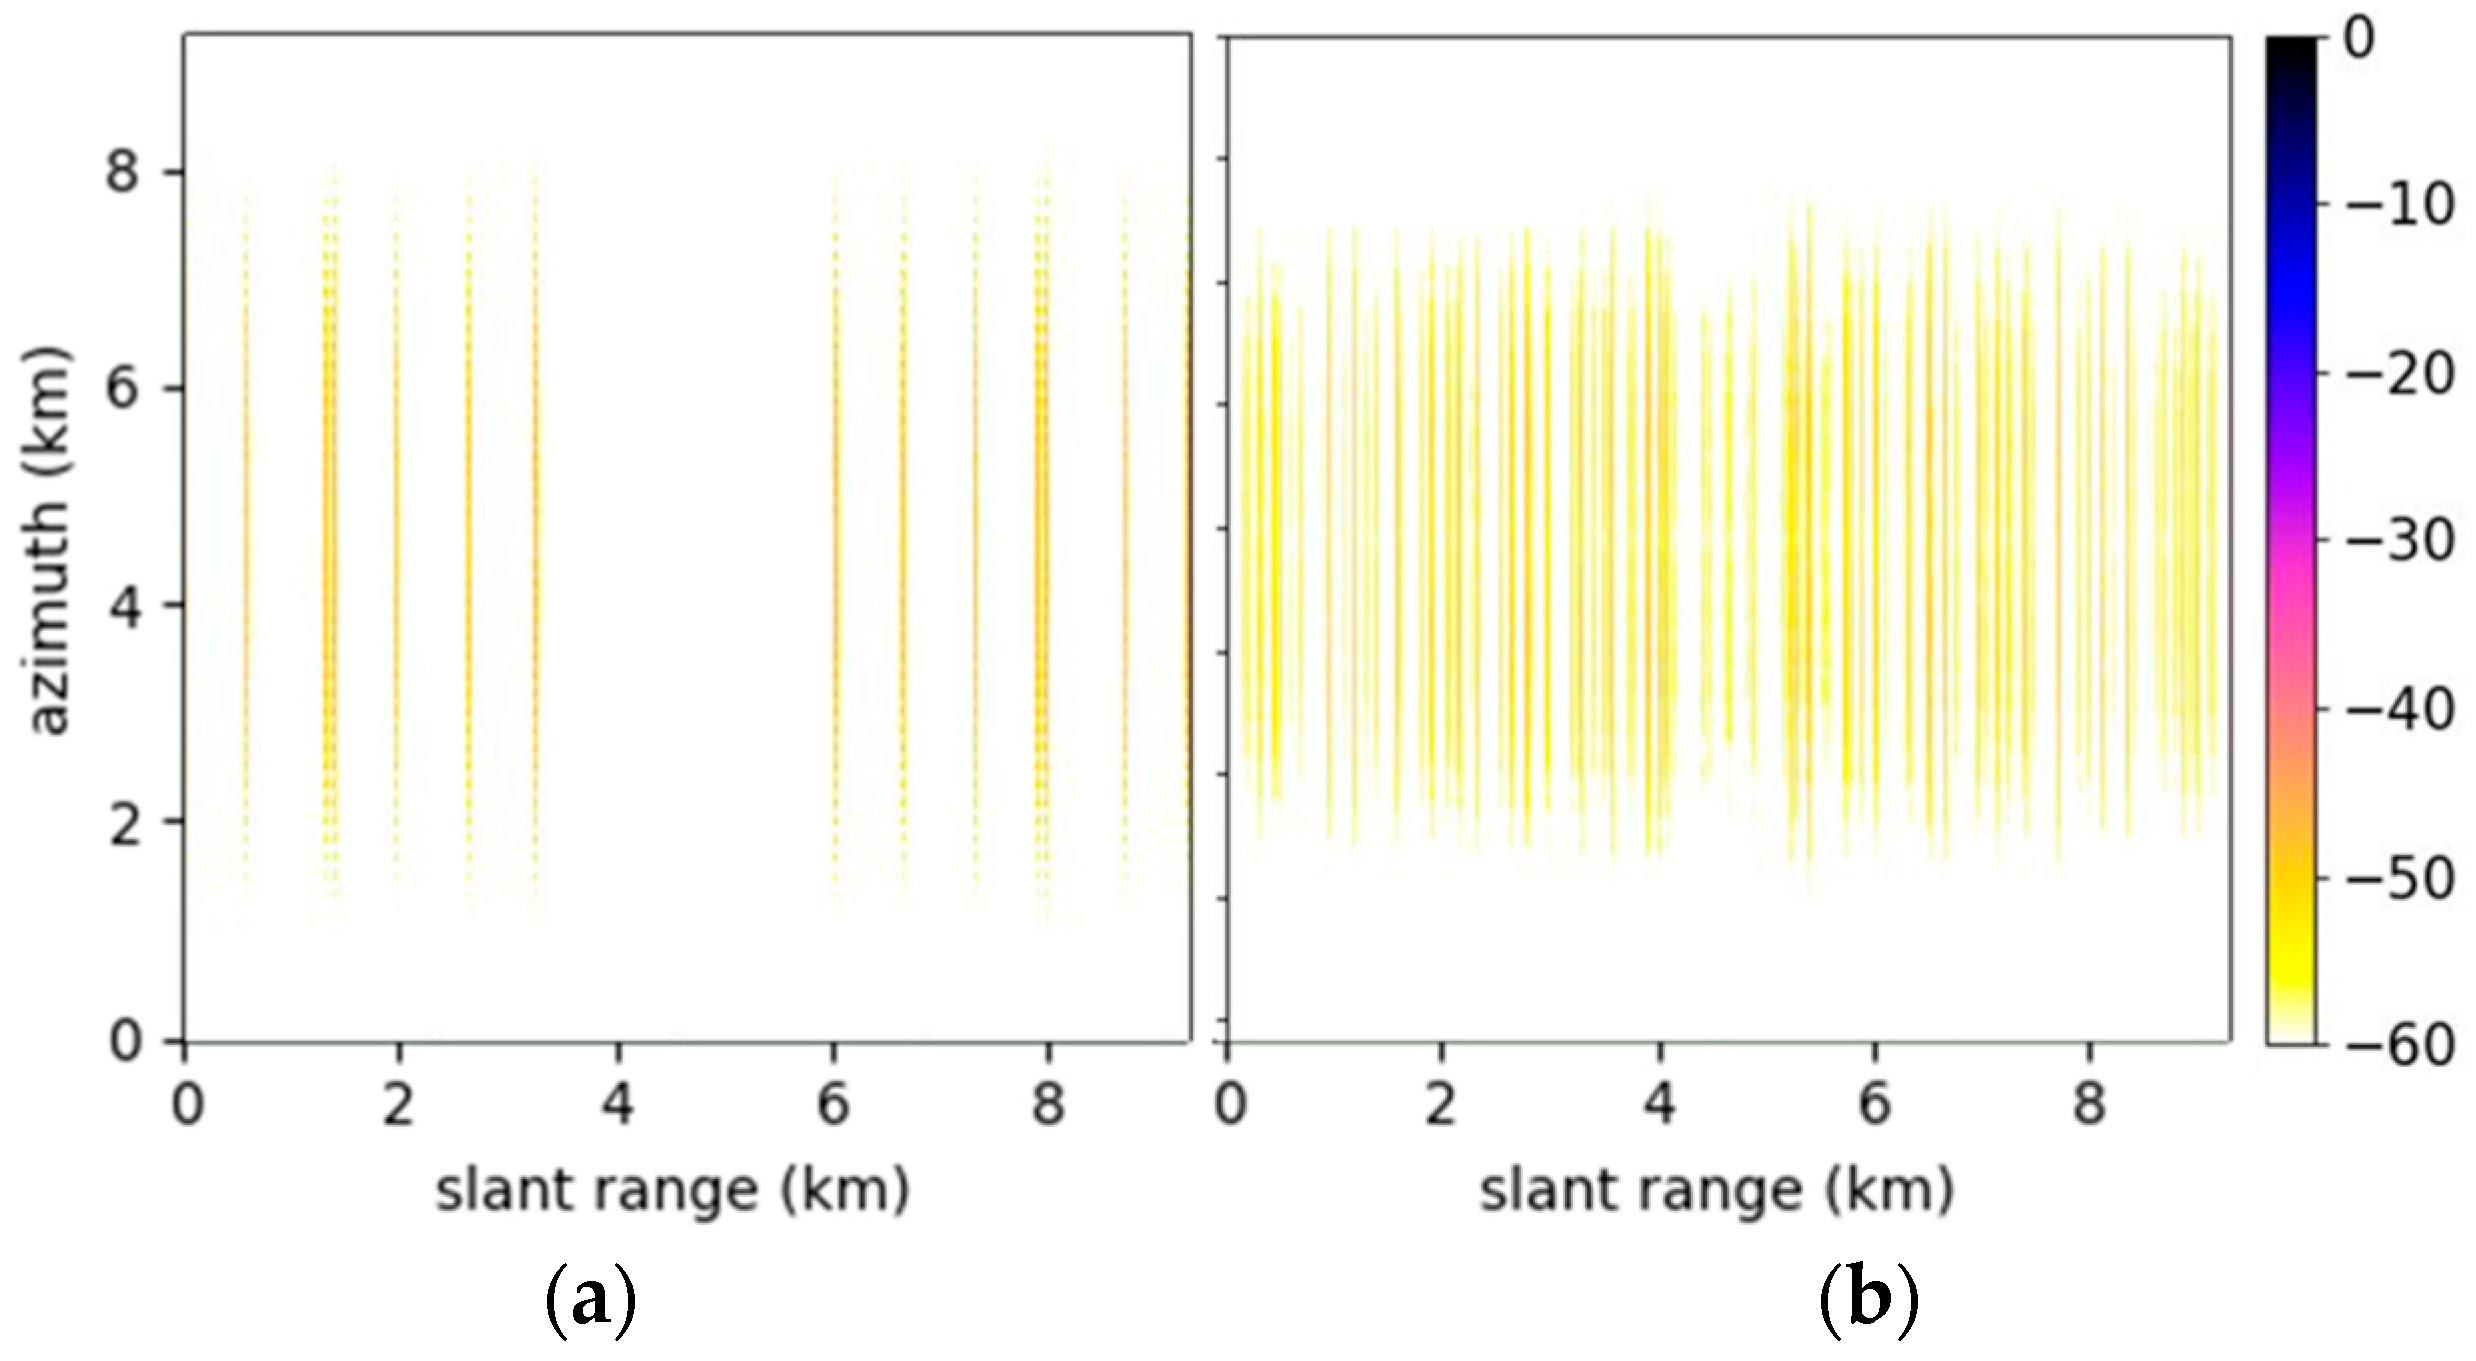
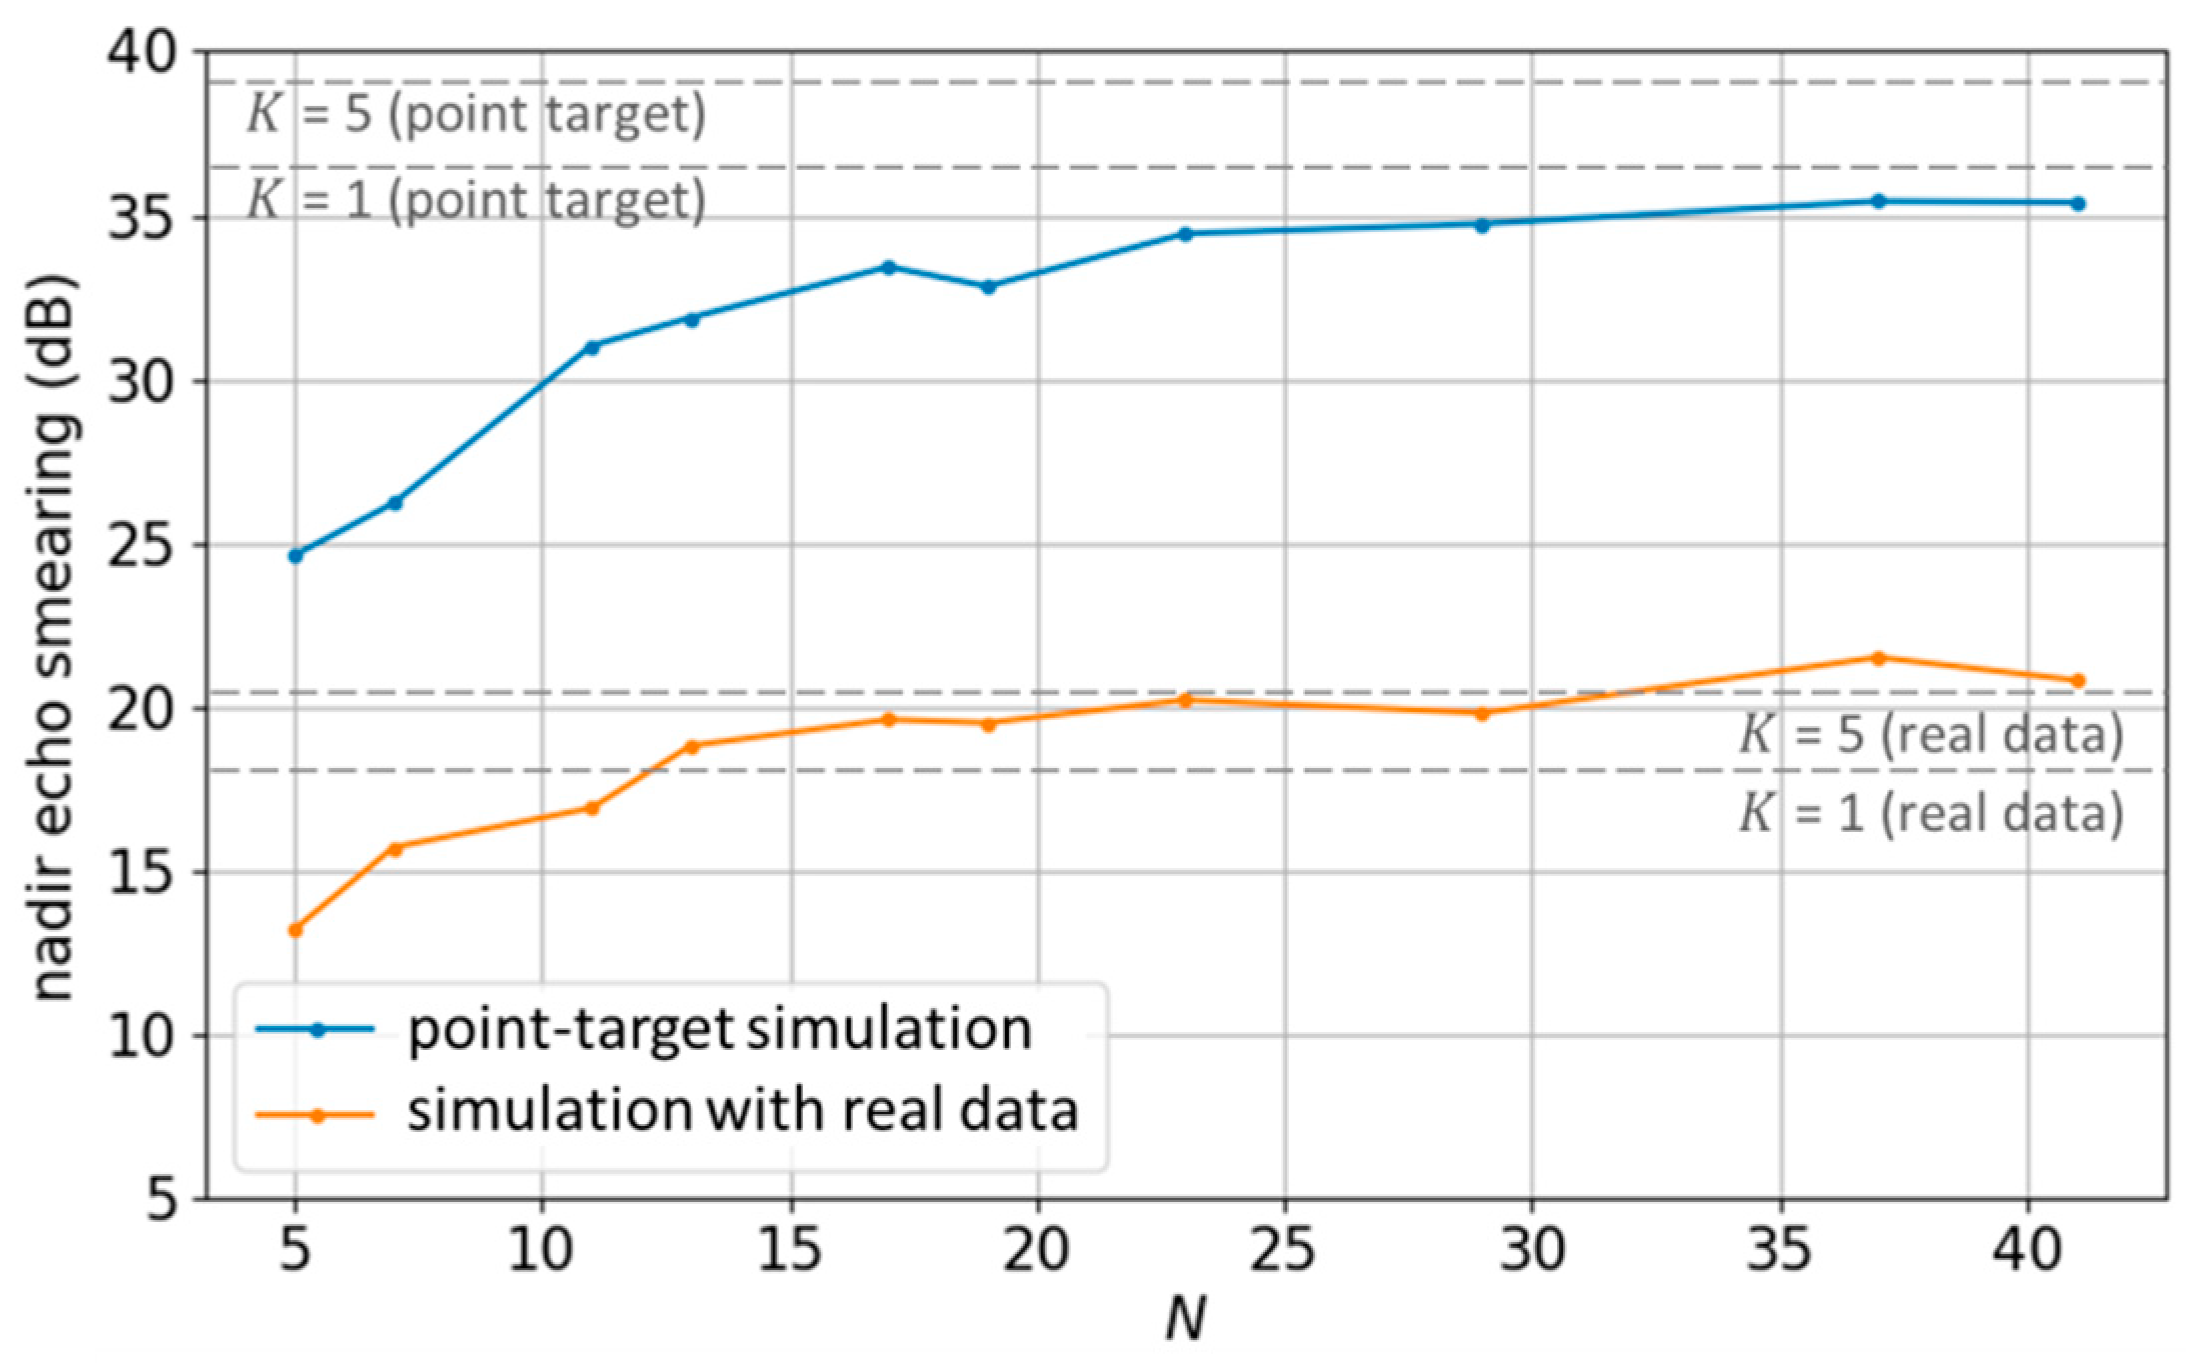
The simulation results of a conventional SAR and cyclically shifted chirp sequences with different values of , namely and , are shown in Figure 6. The image of the conventional SAR is significantly affected by the strong nadir echo, but the waveform-encoded SAR using the cyclically shifted chirps smears the nadir echo. Unlike the original cyclically shifted chirp sequence with = 1 that does not smear the nadir echo uniformly across azimuth, the cyclically shifted chirp sequence with = 5, which satisfies Equation (5), smears the nadir echo uniformly across the full synthetic aperture. Compared to the conventional SAR, the maximum level of the nadir echo decreases by 36.8 dB using the cyclically shifted chirp sequence with = 1 and by 39.4 dB using the cyclically shifted chirp sequence with = 5.
The number of distinct waveforms generated in this simulation was 5050, which means that a SAR system needs to store 5050 waveforms for real operation. Using a large number of waveforms determines an increase in system complexity. The TerraSAR-X satellite, for example, produces the transmit signal in a digital chirp generator [19,20], where up to eight different waveforms can be written in a waveform memory. The transmit waveform can be switched from pulse-to-pulse within an acquisition by selecting one out of the eight waveforms in the memory [15]. The reduction in the number of required waveforms is recommended from the hardware point of view. Moreover, when multiple waveforms are used within an acquisition, every received pulse needs to be calibrated in accordance with the transmitted waveform, i.e., to compensate the phase jumps [21]. The calibration burden dramatically decreases by reducing the number of distinct waveforms. Additionally, it is worth understanding how many waveforms are actually needed to satisfy the desired performance of nadir echo smearing.
3. Waveform Sequence Design Based on Eulerian Circuit
This section proposes a technique based on the Eulerian circuit for effectively generating a waveform sequence starting from a limited number of distinct waveforms. The sequence can be arbitrarily long and periodically repeated, while the number of employed distinct waveforms remains limited.
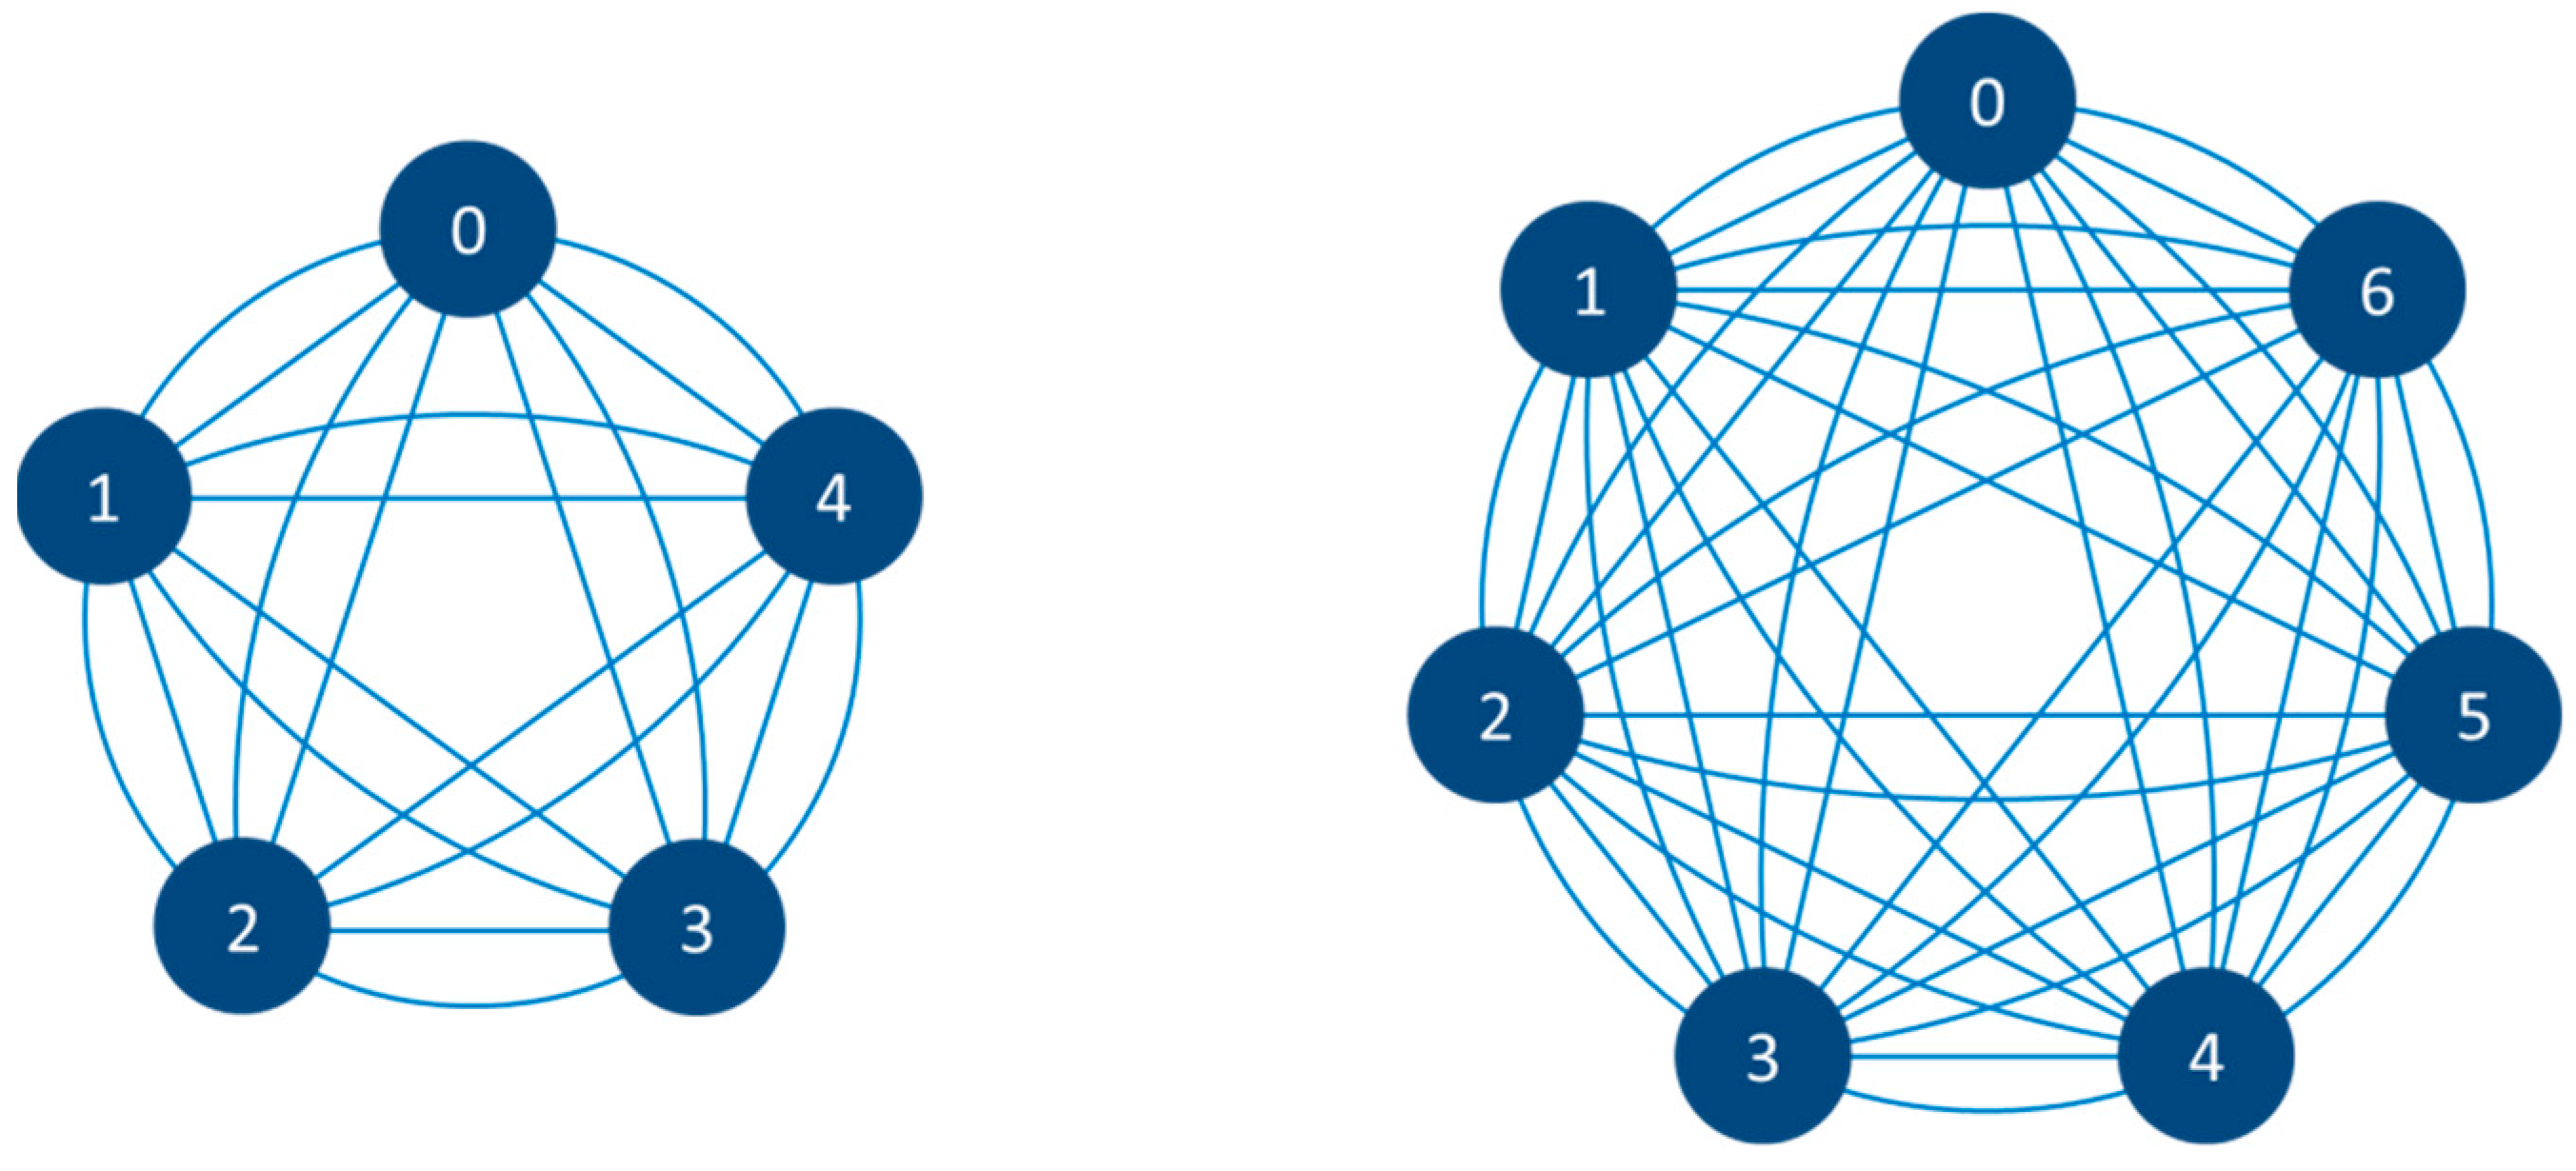
The location of the focused nadir echo varies in range according to the difference between the values of the pulses and are characterized by a distance given by the difference of traveling pulses to the nadir echo and the swath. In this respect, the main idea of the proposed method is to produce a long sequence of all of the possible transitions among the values for a given number of distinct waveforms , where . If the distinct waveforms are represented as the vertices of a polygon, the transitions among values can be represented as the edges of the polygon, where the number of vertices is . To generate a repeatable sequence that contains all of the possible transitions among distinct waveforms but only once, the Eulerian circuit [22,23] is adopted. The Eulerian path is a trail in a finite graph that visits every edge exactly once, although revisiting vertices is allowed. The Eulerian circuit is a kind of Eulerian path that starts and ends at the same vertex, which corresponds to a repeatable sequence. Figure 7 depicts the Eulerian circuit for the generation of waveform sequences, where the vertices represent the distinct waveforms, and the edges represent the pulse-to-pulse transitions of the distinct waveforms. There are two edges that exist between two vertices to account for the transition of values in both directions. In addition, all vertices having an even number of edges, guaranteeing the existence of the solution for the Eulerian circuit. The length of the sequence is the total number of edges in the Eulerian circuit, which is given by the permutation of , N2 . Finding solutions in the Eulerian circuit with a prime number of vertices is easier; thus, only prime numbers were considered for in this analysis. As a solution of the Eulerian circuit for a given prime , a sequence can be obtained as follows.
The sequence directly corresponds to the waveform sequence for a waveform-encoded SAR and can be periodically repeated along the azimuth. Further solutions exist for the Eulerian circuit, but the one in Equation (6) is referred to from now on.
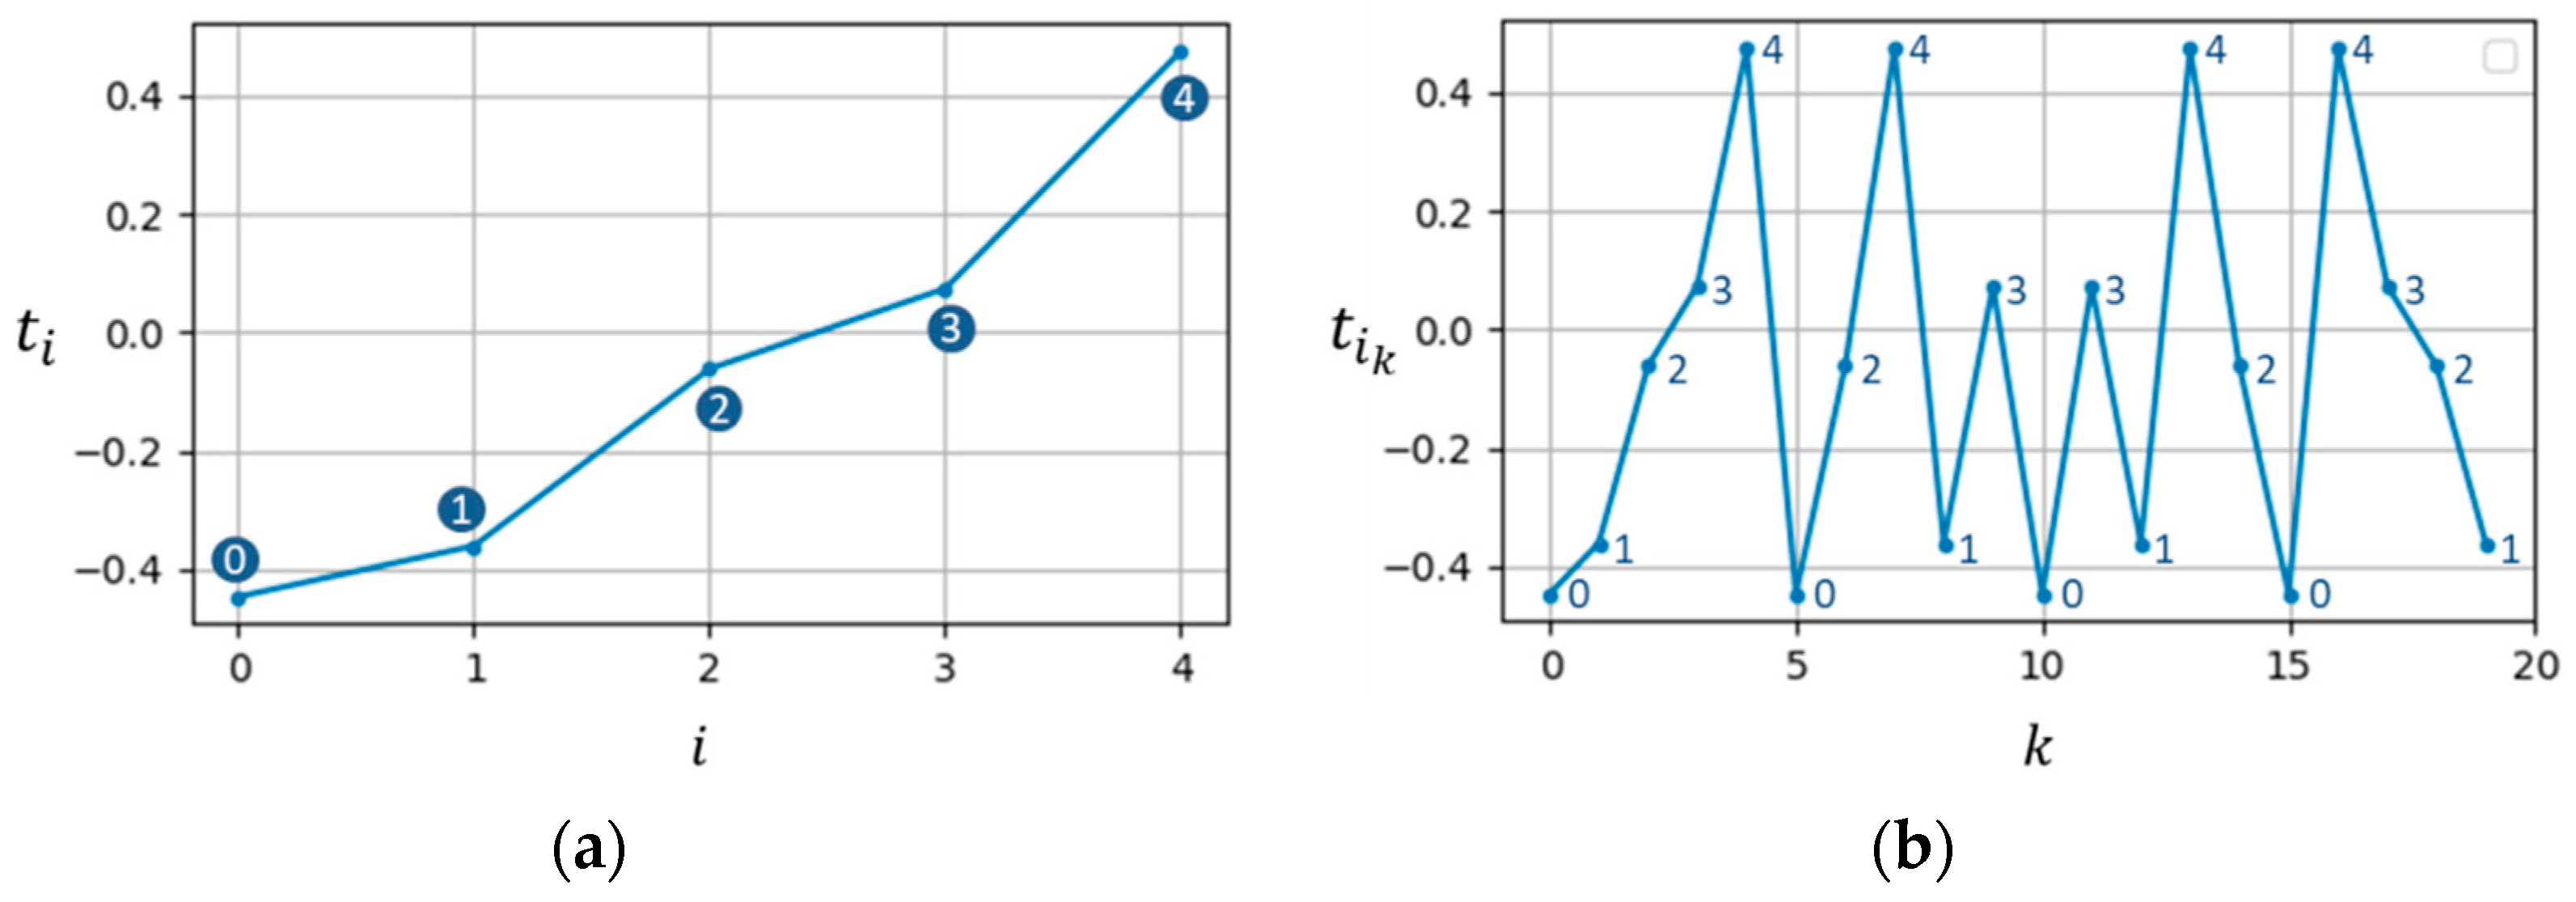
The values of are randomly determined within the uniform distribution from to instead of being generated using Equation (3). The randomly picked values may cause a variation in the performance of nadir echo suppression. After a sufficient number of simulations with different ordered sets of randomly generated values, the one with the best performance is selected for each . The selected values and its waveform sequence generated as the solution of the Eulerian circuit provided in Equation (5) for = 5 are shown in Figure 8 as an example.
The proposed method to reduce the number of distinct waveforms has been chosen after devising and considering various other methods, including the digitization (or quantization) of the sequence obtained using Equation (3); trimming a part of the sequence obtained using Equation (3); the decimation of the sequence obtained using Equation (3). The proposed method is determined to be showing better nadir echo suppression performance compared to other methods if the same number of distinct waveforms is used for all methods. Digitized revisits the same values frequently so that no shift occurs between the consecutive pulses. The shift variation for the trimmed is not enough to cover the full synthetic aperture, causing similar effects as = 1. Decimation of shows a better performance compared to the trimmed , but the number of available shift differences between the consecutive pulses is still not enough.
4. Simulation Results and Performance Analysis
The proposed technique has been validated through point-target simulations and simulations using real TerraSAR-X data in order to assess its performance in terms of nadir echo smearing. The point-target simulations are presented in Section 4.1, whereas the simulations using data generated from a real TerraSAR-X image and a realistic nadir echo model are presented in Section 4.2.
From the simulation results, the optimized waveform sequence with the best possible smearing performance is chosen because it leads to less degradation of the useful signal after multi-focus postprocessing.
4.1. Simulation Using Point Targets
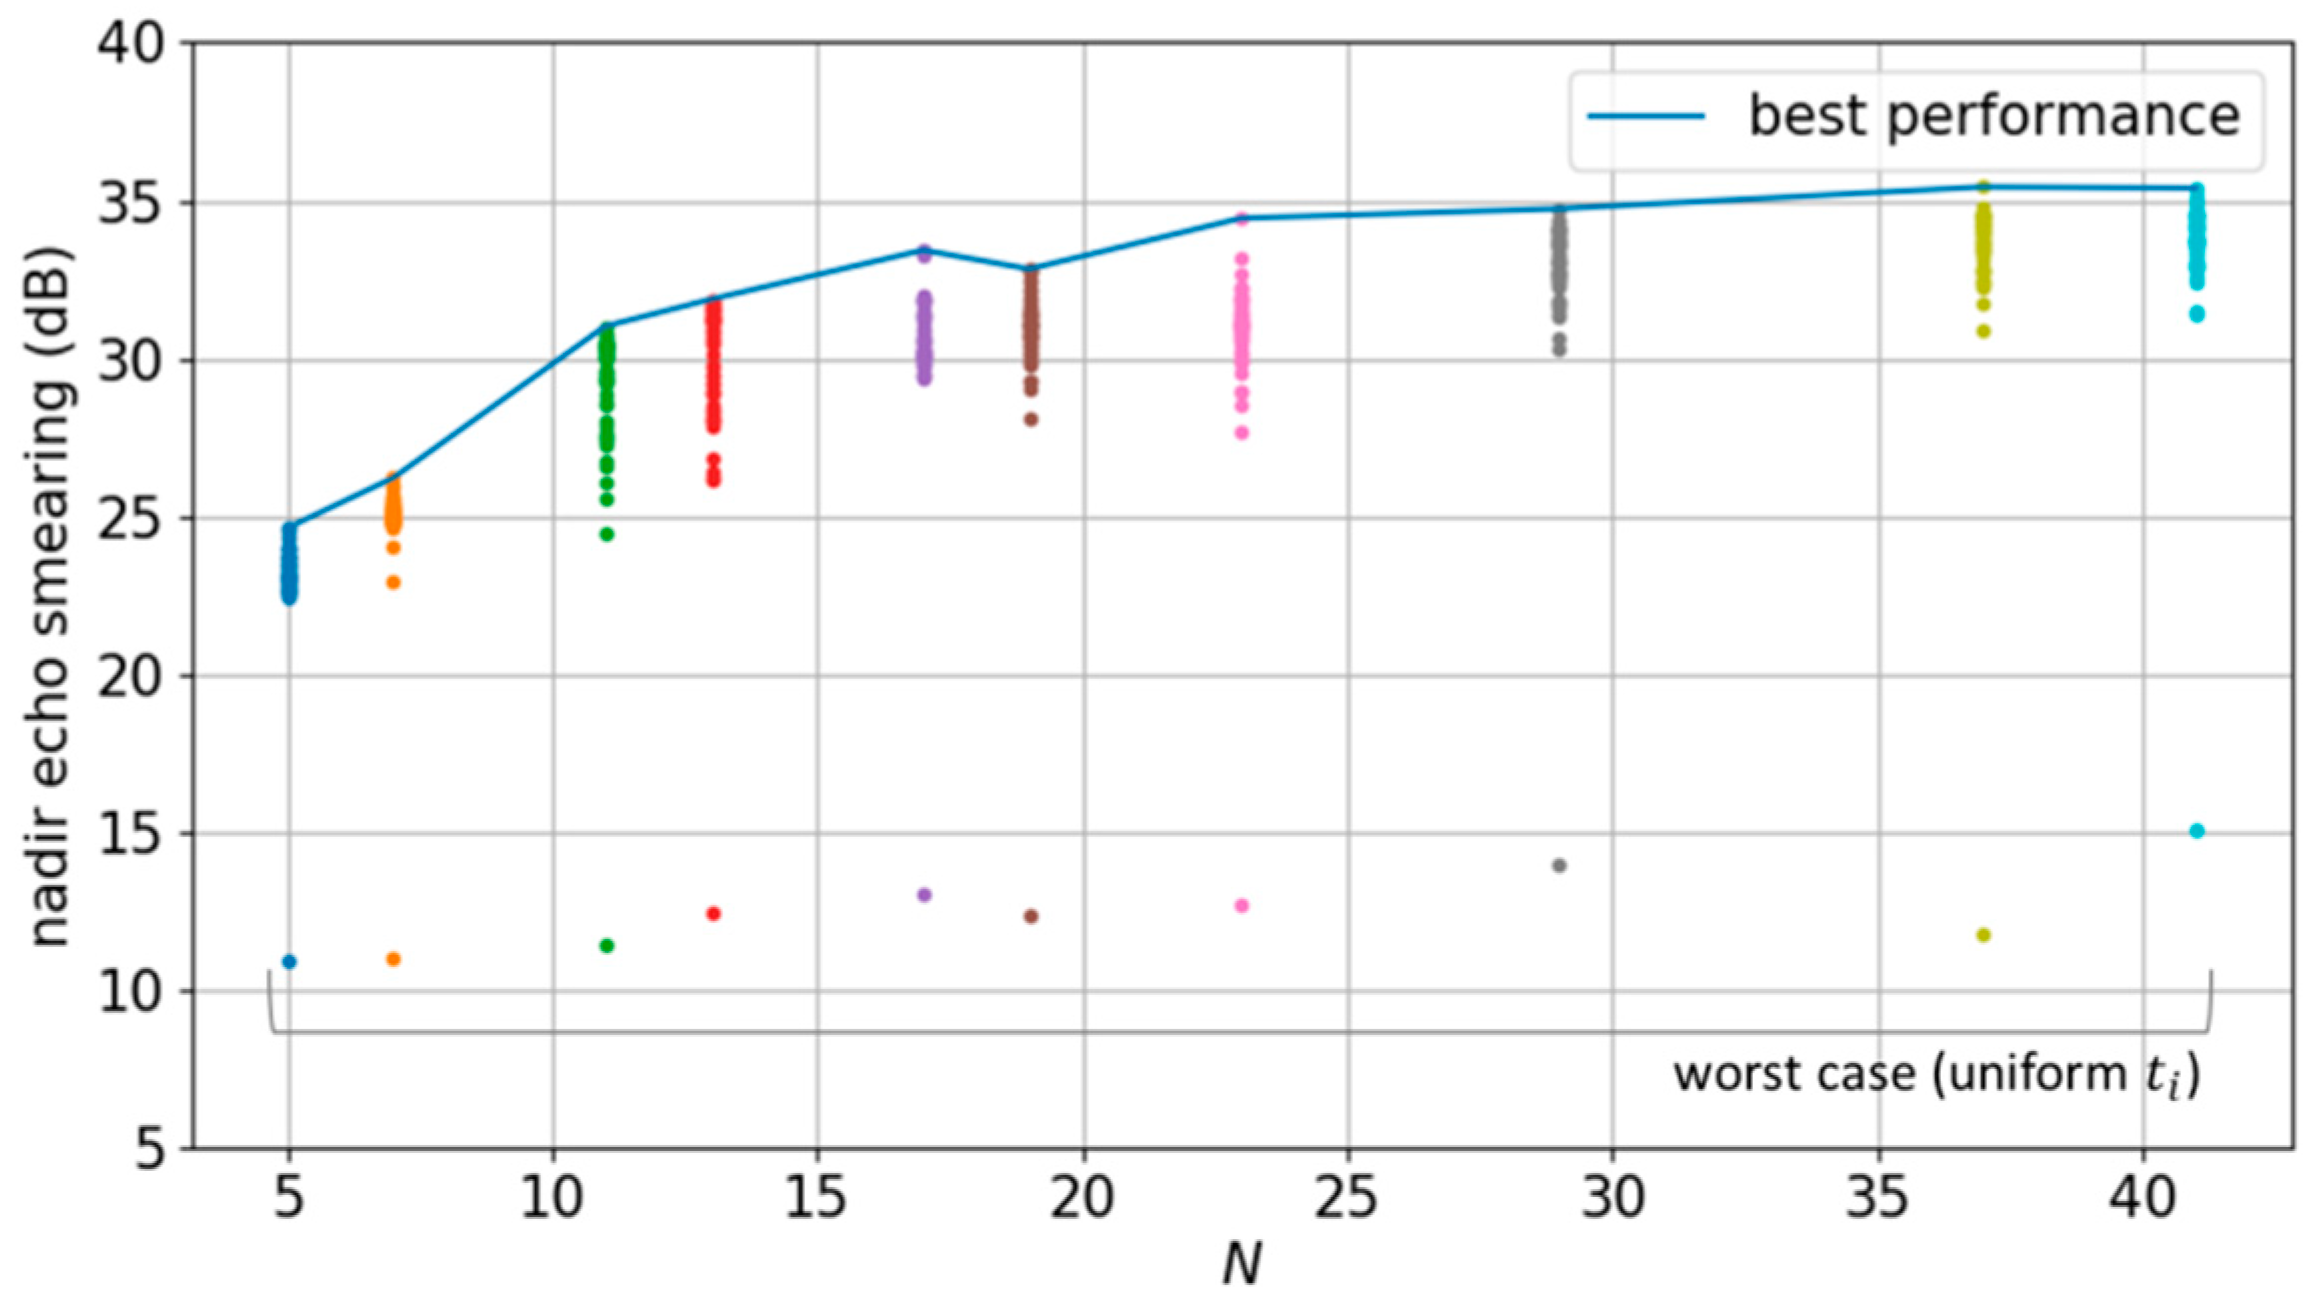
The raw data of a point target corresponding to the nadir echo is generated according to the SAR system parameters in Table 1. A conservative approach has been adopted to find a set of chirp shifts that shows satisfactory performance of practical interest. The results of a sufficient number of simulations for each to determine set of values with the best performance are shown in Figure 9, where each point corresponds to a set of values. The indicated worst possible cases happen when the values are uniformly spaced. The final (best) performances of nadir echo smearing for different numbers of distinct waveforms are listed in Table 2. The results of N = 5050 in Table 2 are from the cyclically shifted chirps described in Section 2, and the results of N = 5.41 are from the proposed method. The performance does not significantly improve as becomes larger than 17.
The optimum sets of values for primes between 5 and are listed in Table 3 as normalized to , i.e., their values are comprised between −/2 and /2. A proper can be chosen for an arbitrary system or configuration, and the values can simply be scaled to the pulse width without an iterative search for each system or acquisition. The procedure for the practical use of the results provided in this work is as follows:
- Choose a proper N for the system and desired configuration;
- Scale the normalized values provided in Table 3 to the pulse width of the system;
- Generate N distinct waveforms using (1) and the scaled values;
- Generate the waveform sequence using (5);
- For the th transmit pulse and select the waveform
- Repeat the waveform sequence for the whole acquisition.
The focused SAR images for = 5 and = 13 are representatively shown in Figure 10. The nadir echo is successfully smeared using the proposed method.
4.2. Simulation Using Real SAR Data and a Realistic Nadir Echo Model
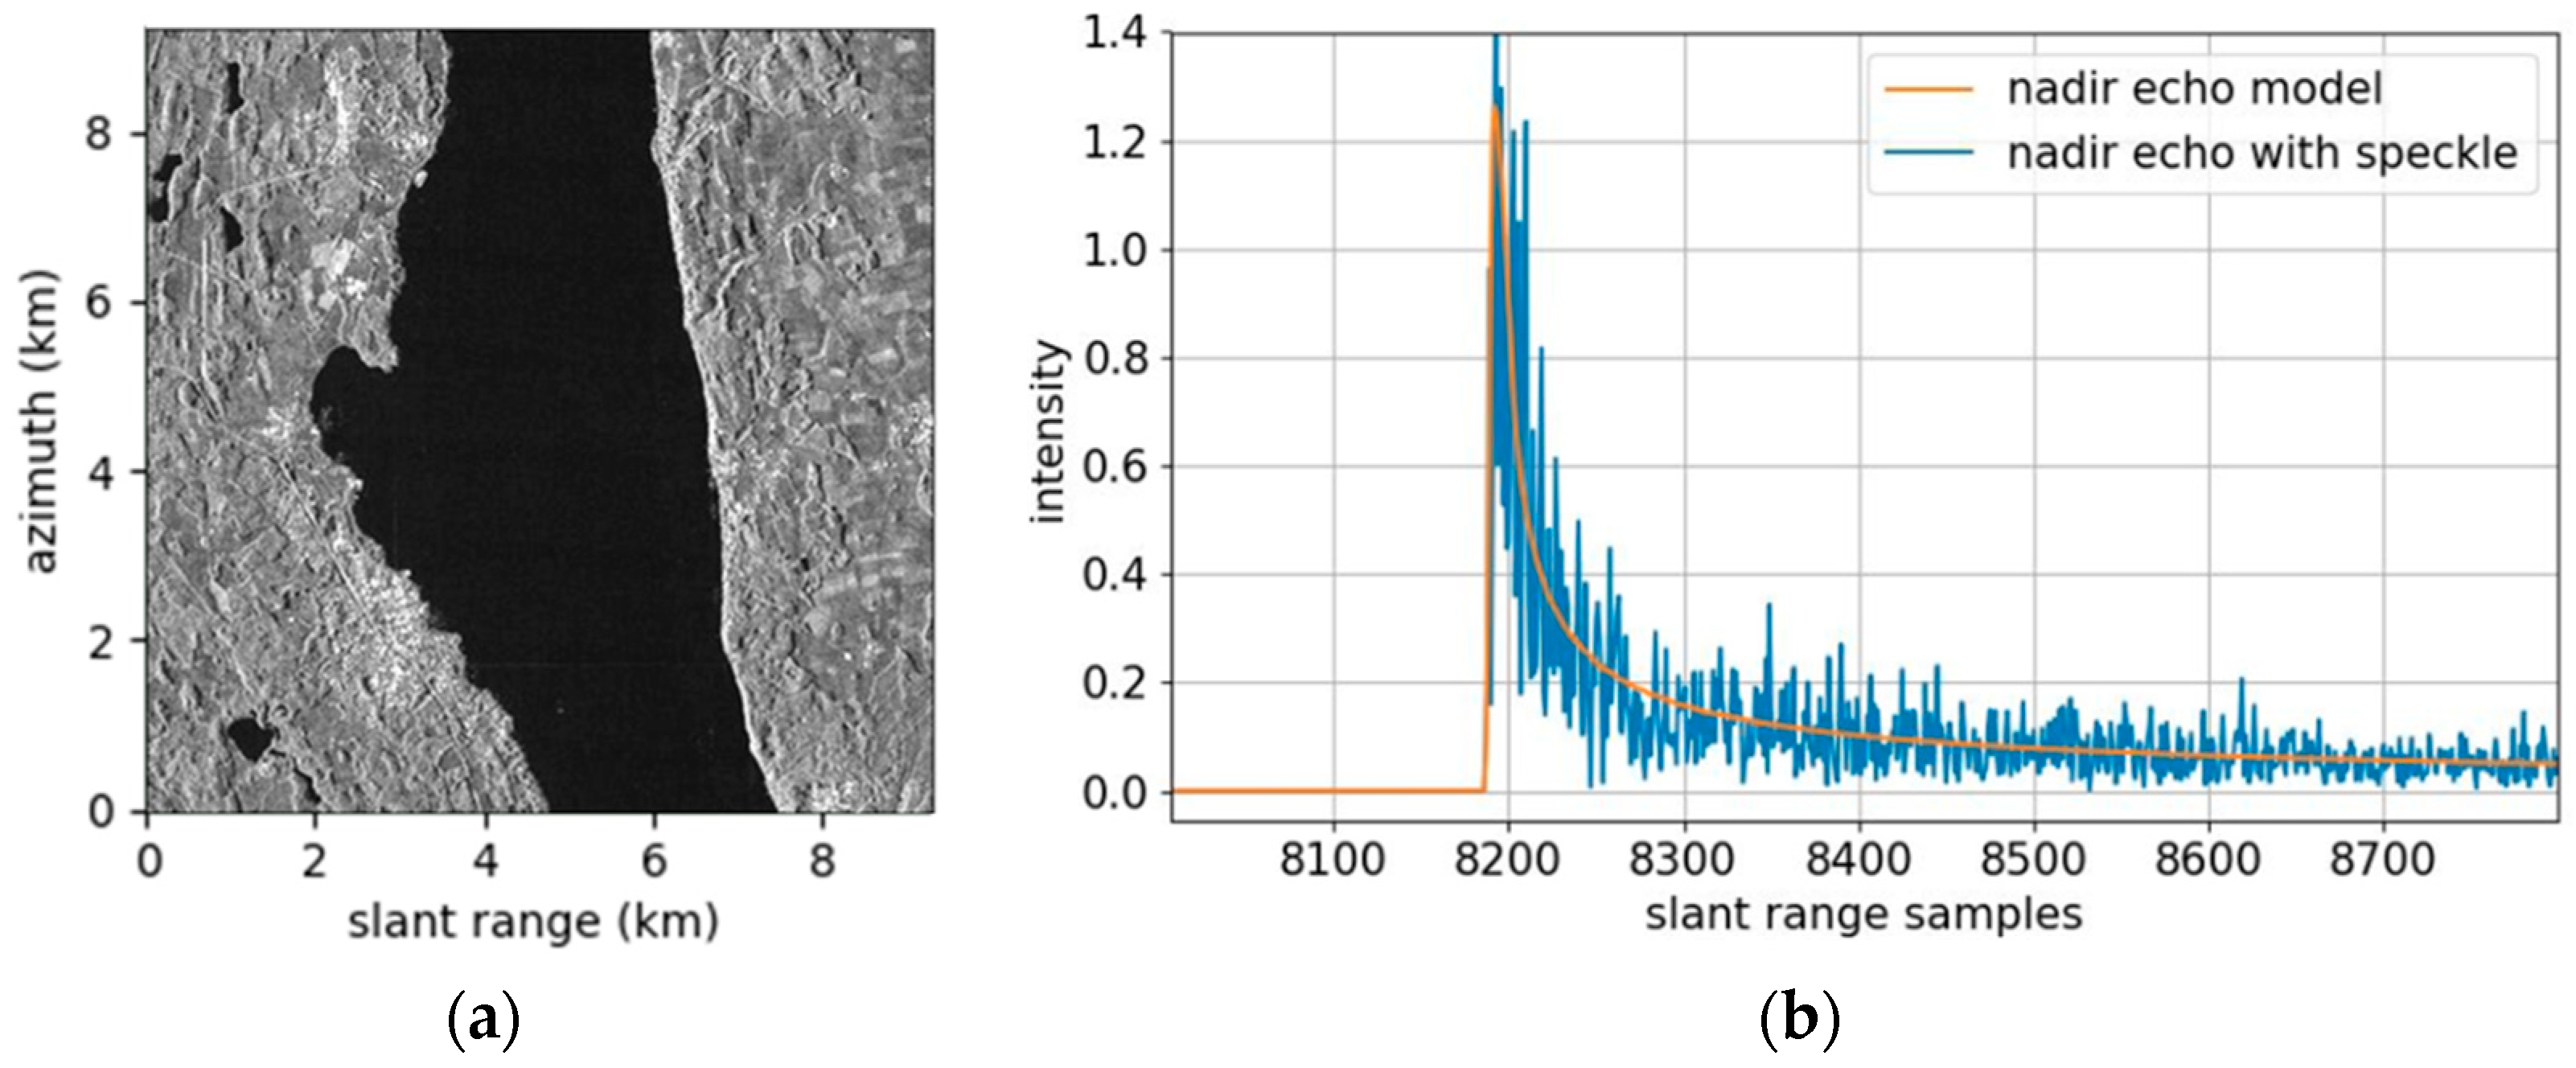
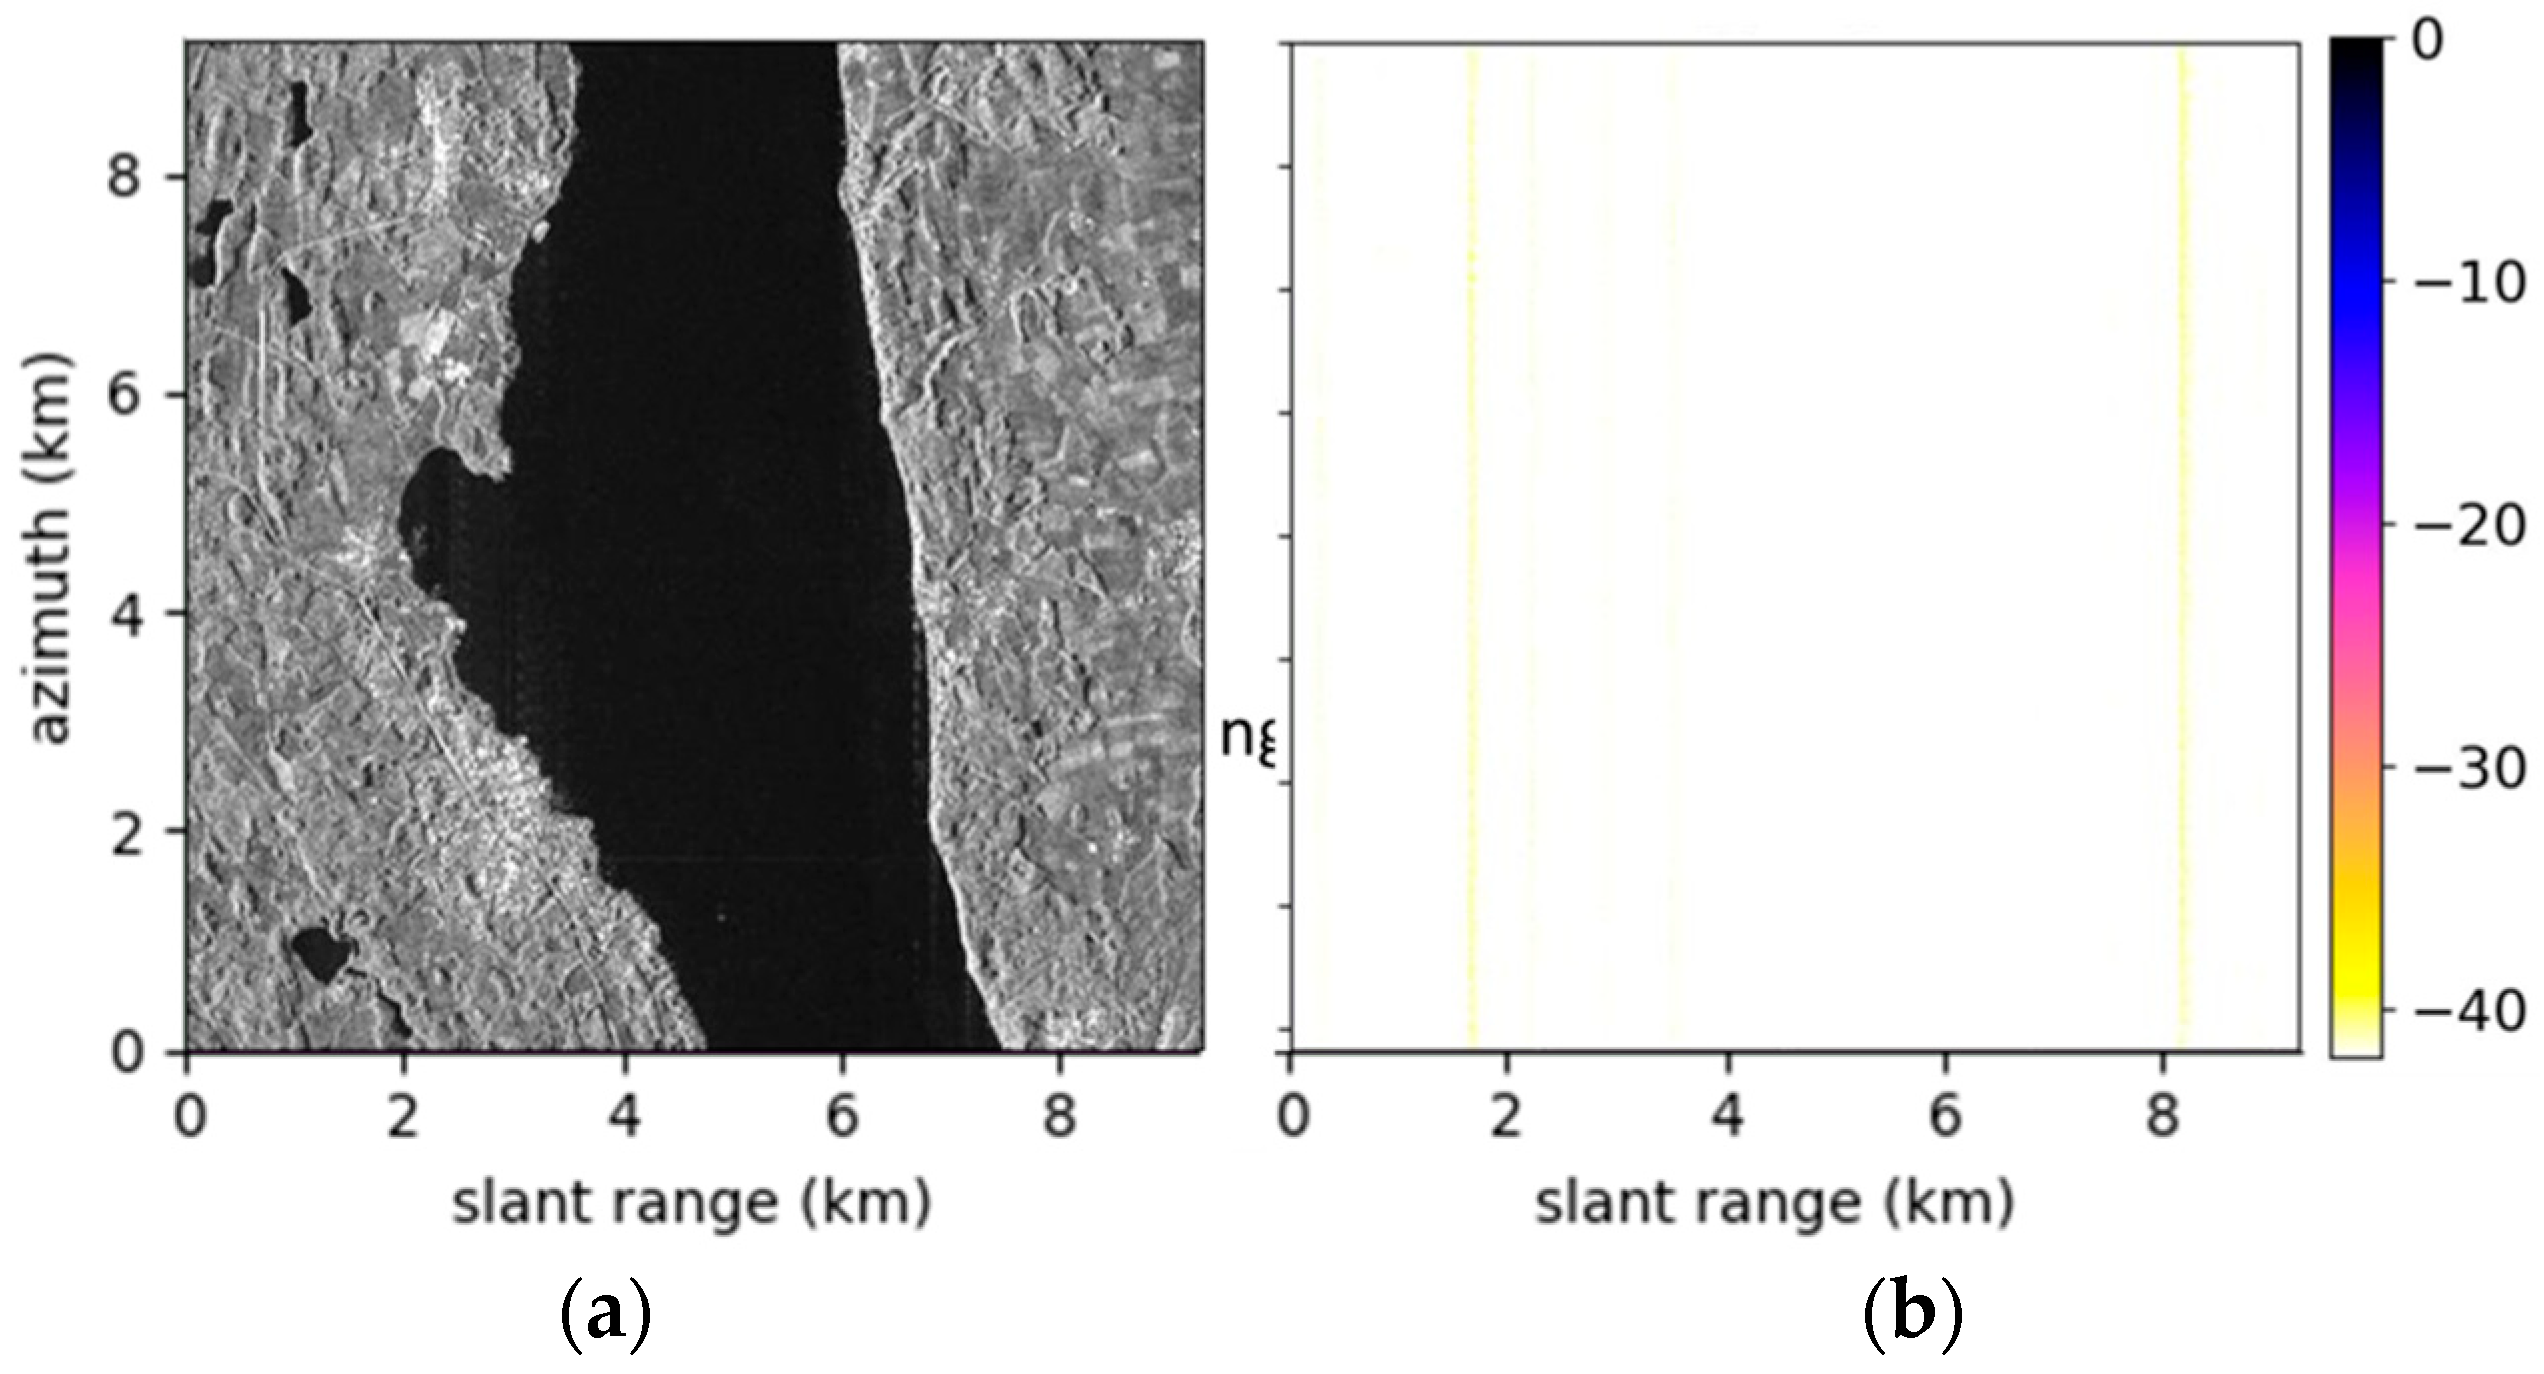
To better observe the impact of the waveform-encoded SAR based on a reduced number of distinct cyclically shifted chirps on image quality, simulations were conducted using a real TerraSAR-X image over Lake Starnberg, which is shown in Figure 11a. The raw SAR data can be generated from the complex backscatter of the TerraSAR-X image by introducing range and azimuth modulation [9] as if they were obtained by a SAR system with the parameters listed in Table 1. The azimuth modulation performs Doppler chirp modulation and applies the azimuth antenna pattern, and the range modulation performs range chirp modulation with the cyclically shifted chirps.
The realistic nadir echo model with a backscatter profile and an azimuth autocorrelation function was derived from TerraSAR-X images [24]. The range-compressed data were aligned to be nadir echo centered in all azimuth lines and were averaged across the azimuth to achieve the backscatter profile without speckle. The model was obtained by fitting the data to a parametric function. A realization of the resulting nadir echo for a range line is shown in Figure 11b. The nadir echo signal was then added to the raw data of the scene.
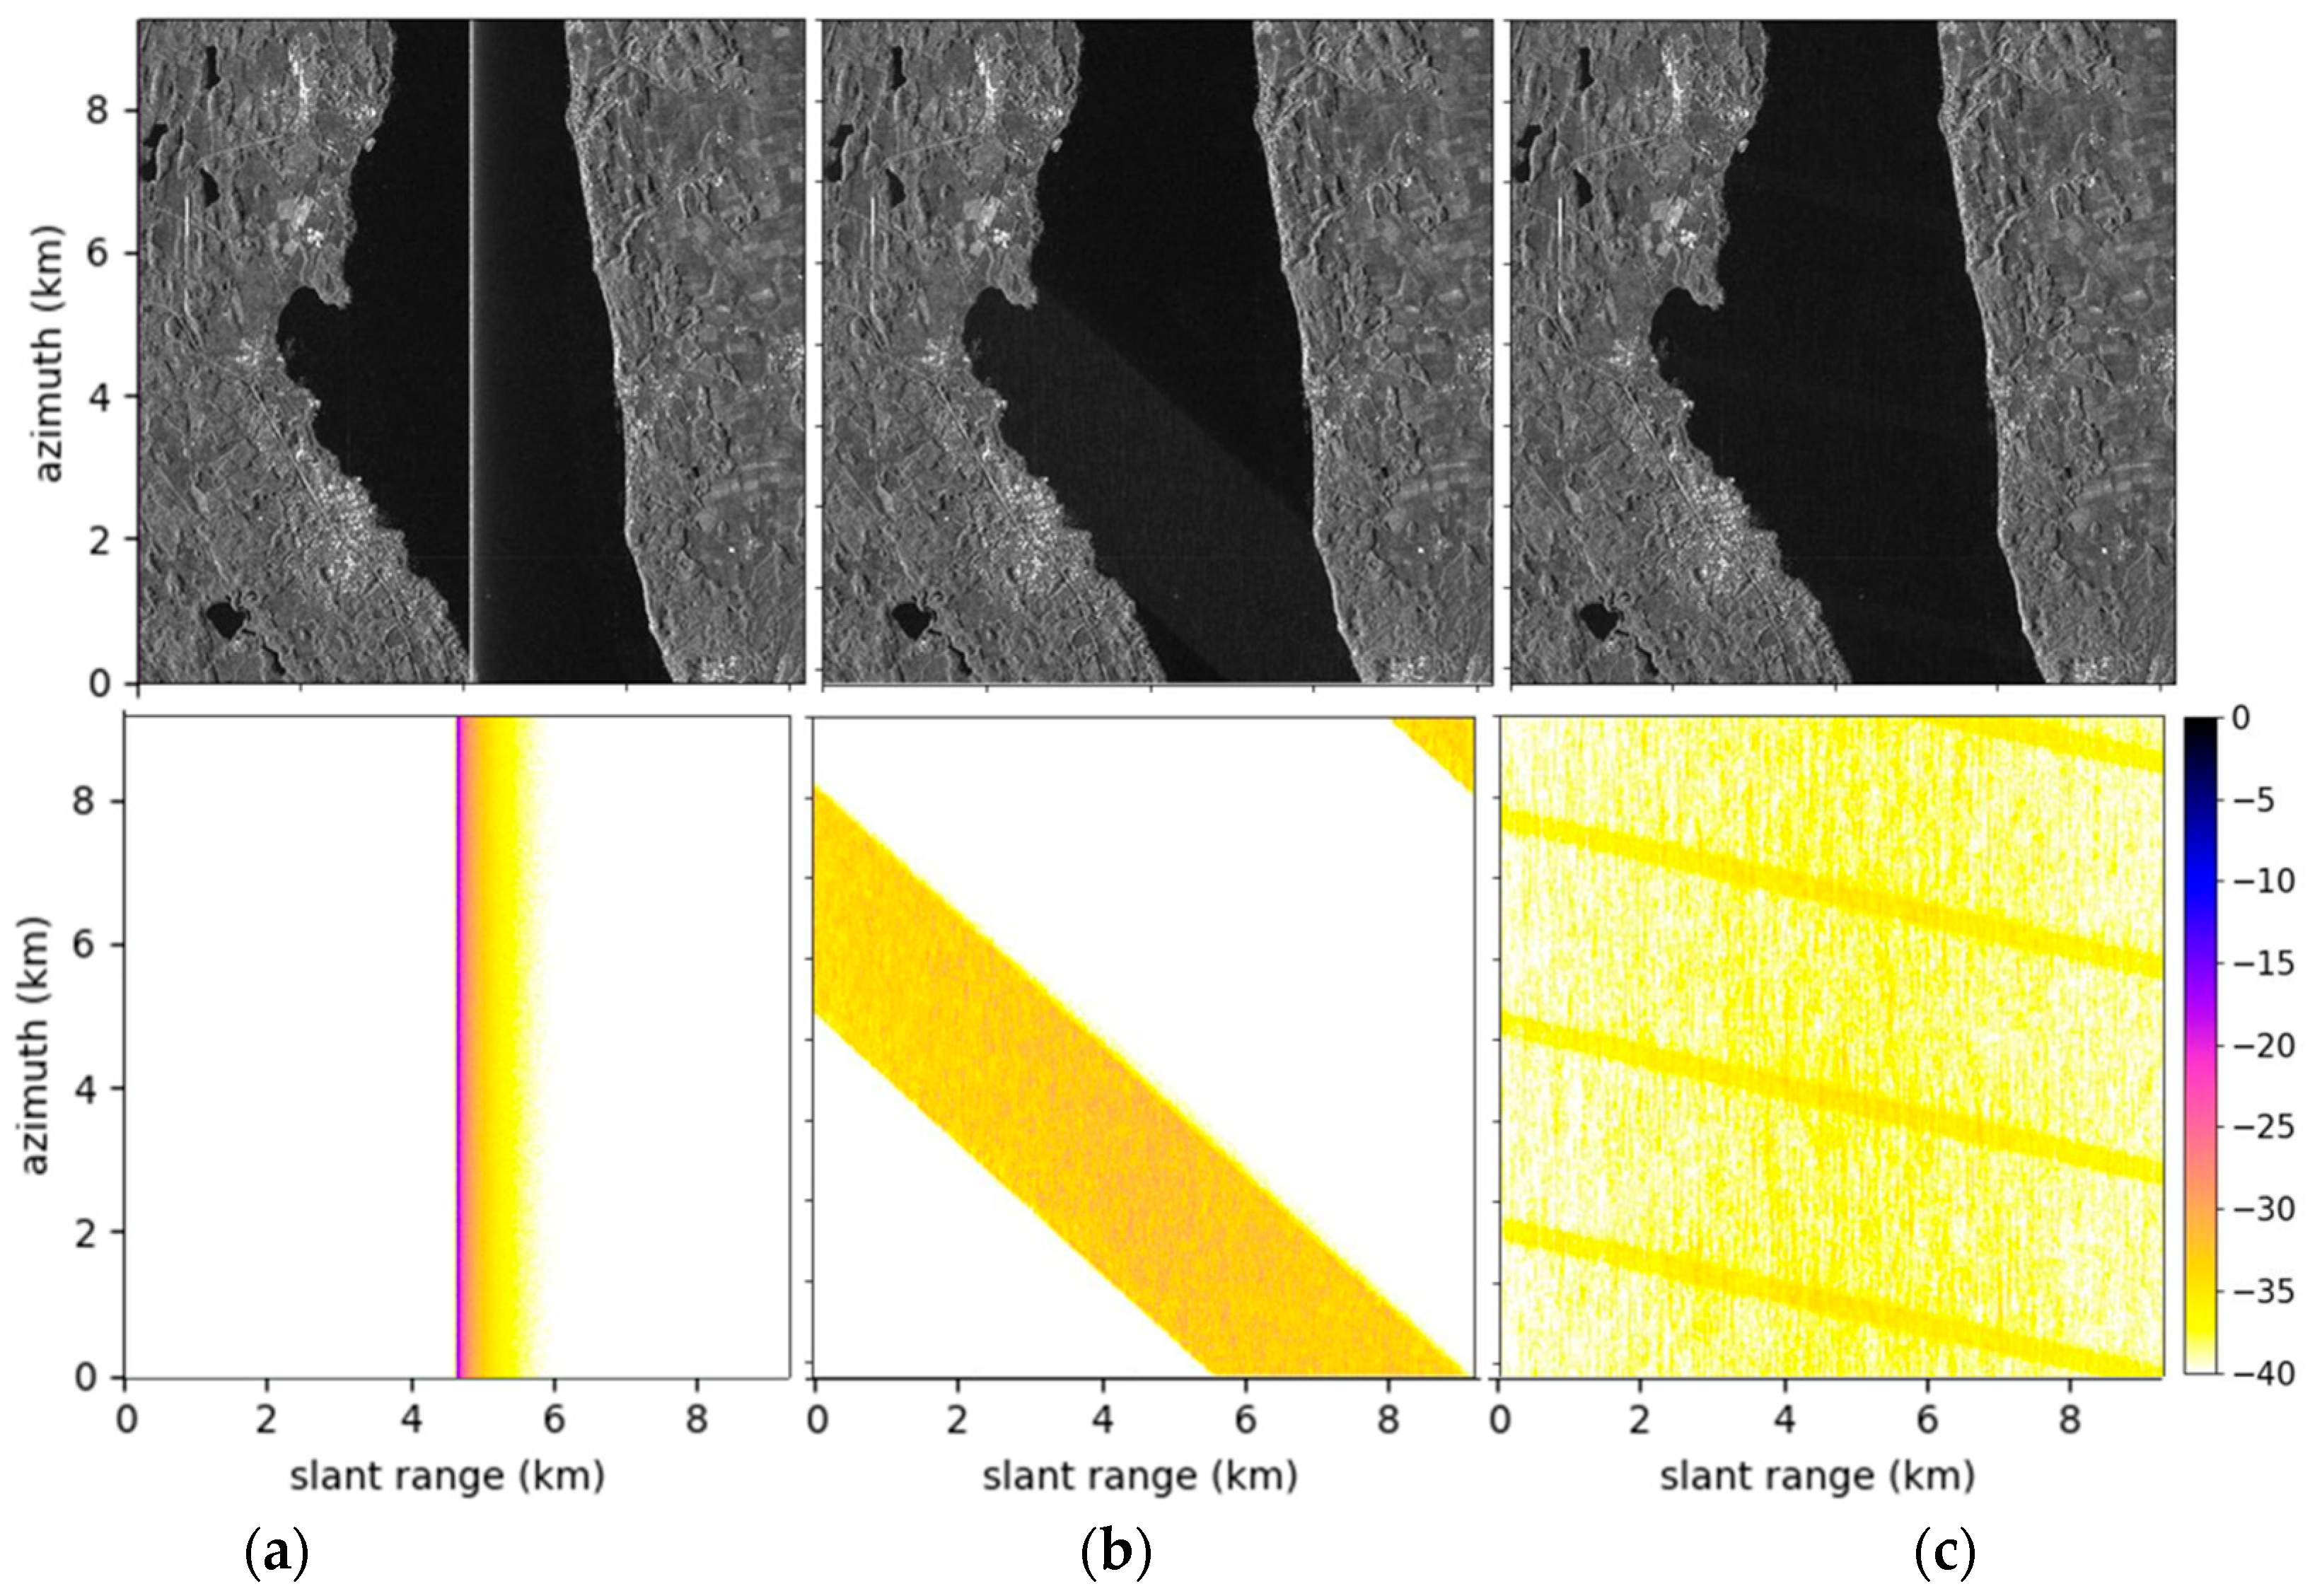
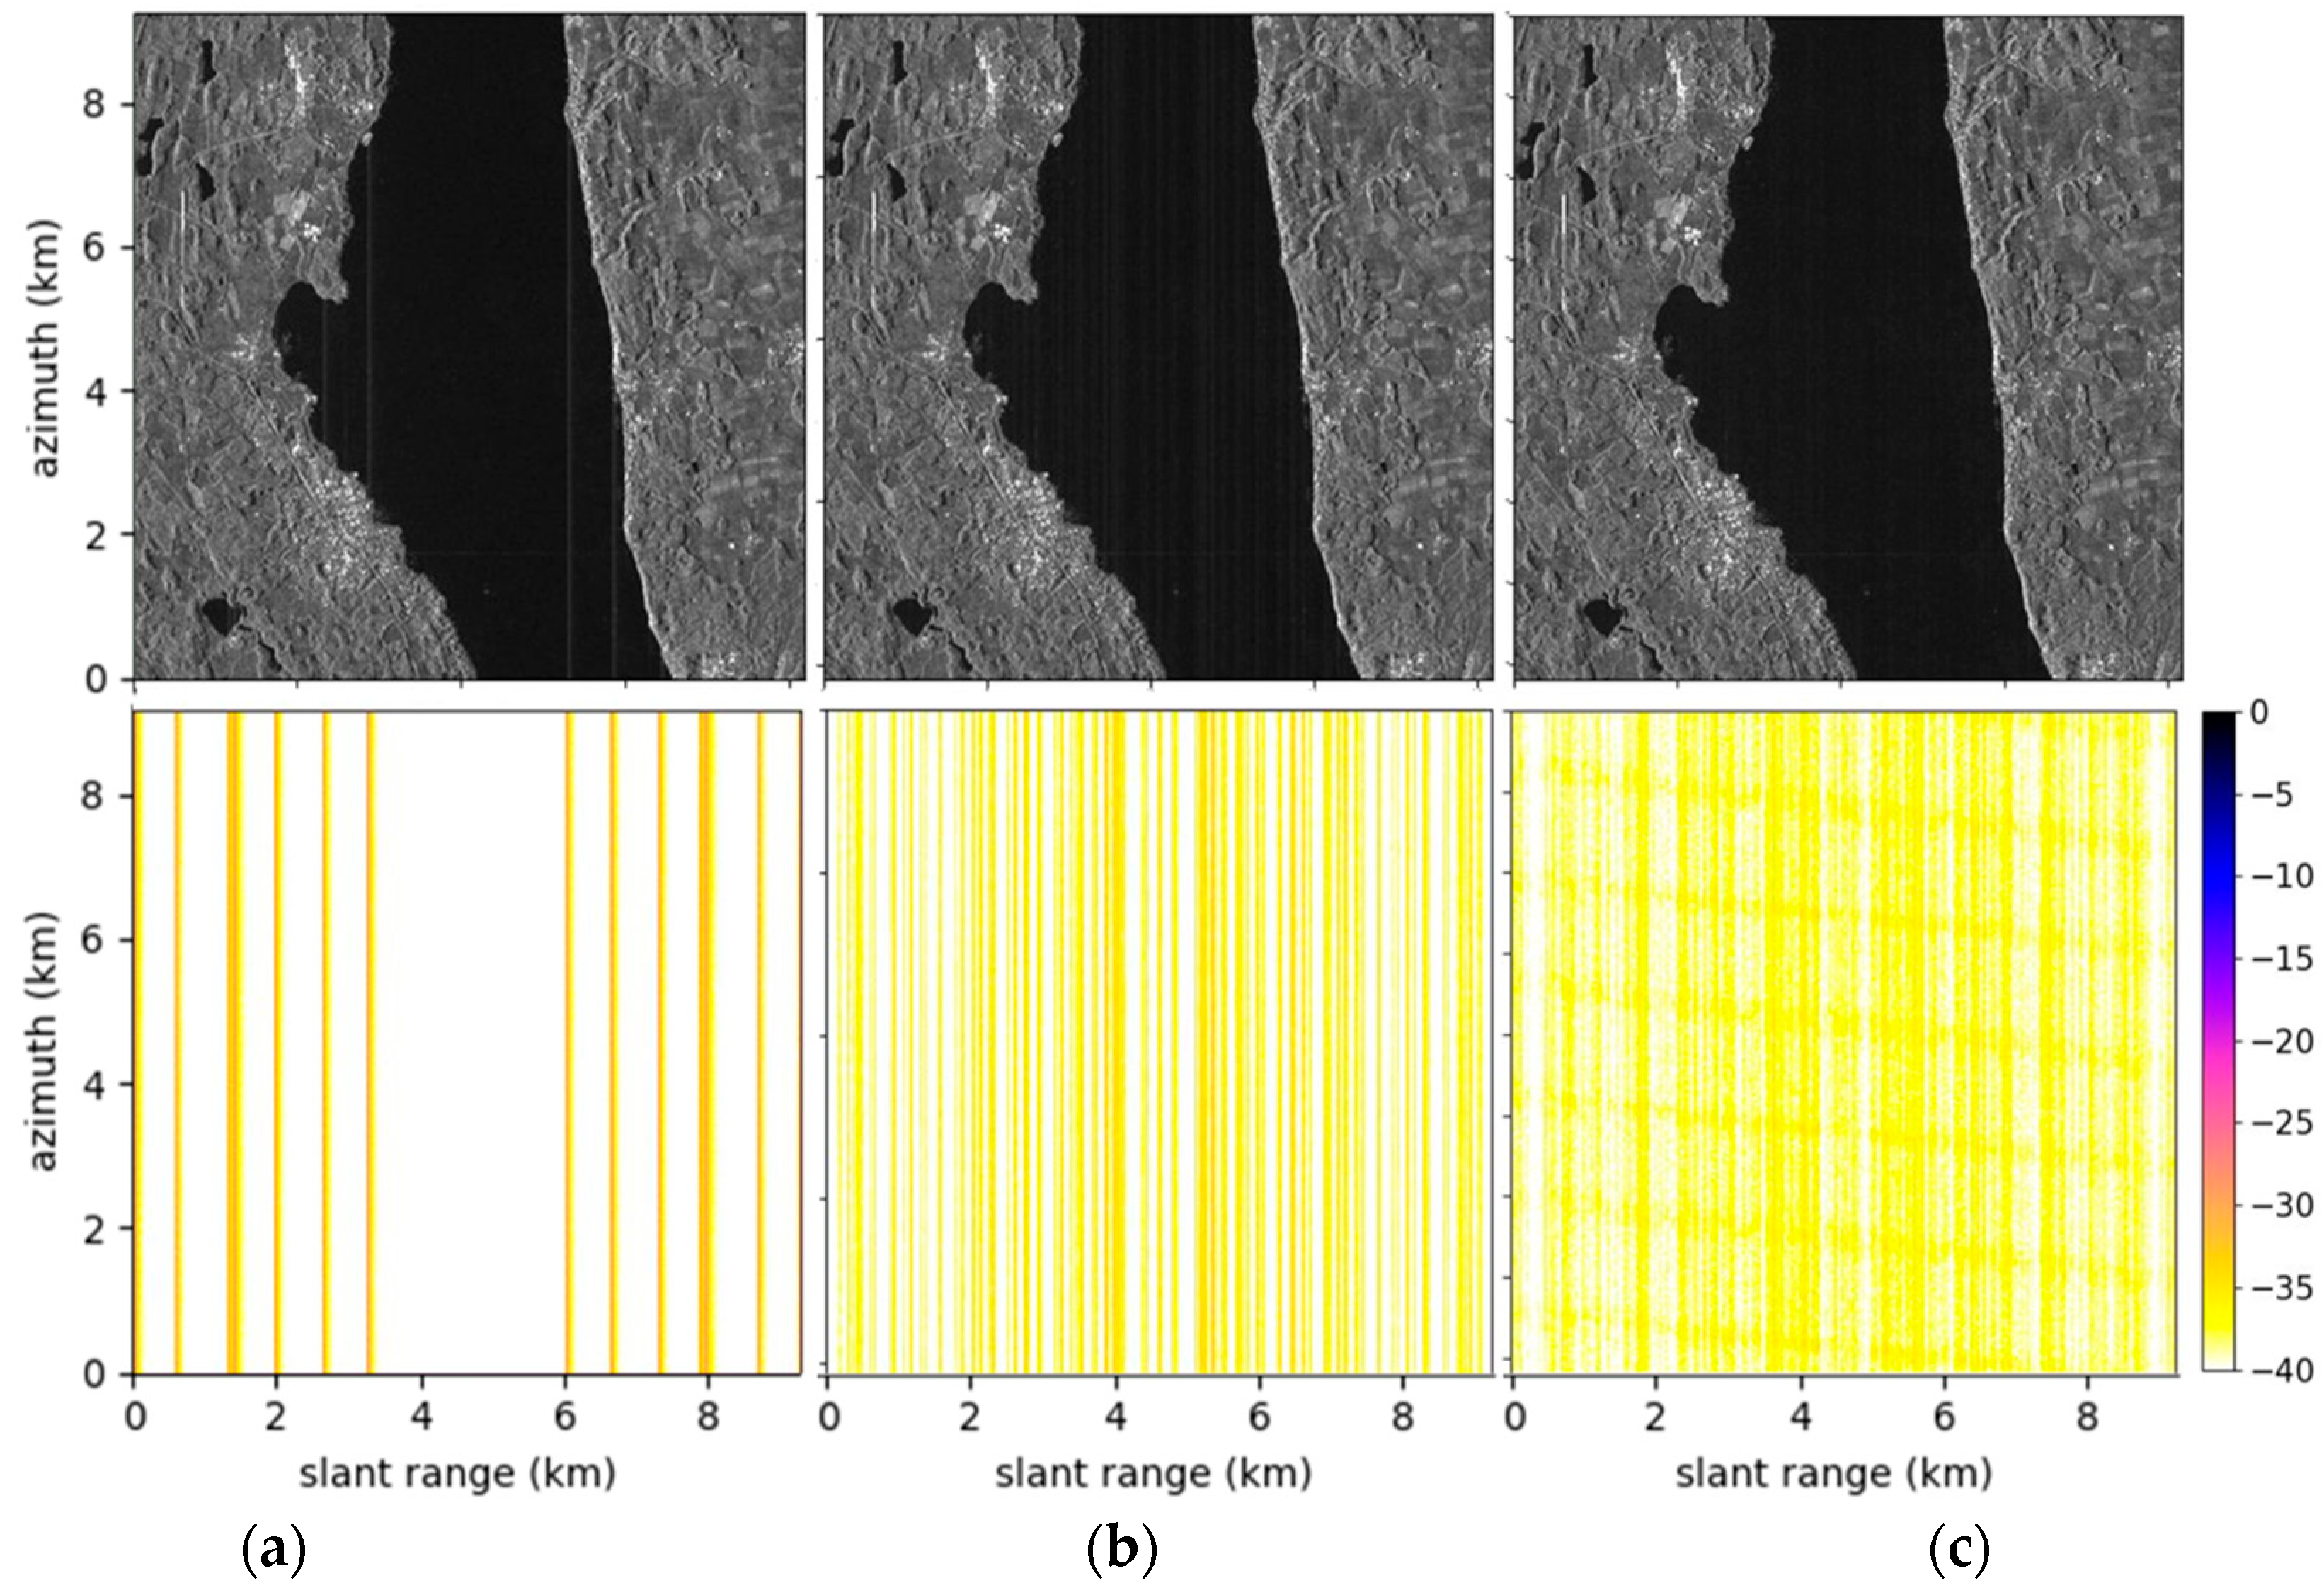
The focused SAR images of the simulations are shown in Figure 12 and Figure 13. The nadir echo appears as a bright vertical line in the conventional SAR image, while the nadir echo is successfully smeared using the proposed waveform sequences. The nadir echo smearing performances for different are listed in Table 4. The proposed method reduces the nadir echo peak by 13–21 dB for N comprised between 5 and 41.
The performances of nadir echo suppression in point-target simulations and simulations with real data are compared in Figure 14. In the case of simulation with real data, the sequence based on a short number of distinct waveforms reached or even outperformed the optimum sequence exploiting a very large number of distinct waveforms. This is due to a sort of “convolutional” effect, i.e., the extension of the nadir echo through its tail in range together favors a further smearing of the echo itself.
Instead of being smeared, the nadir echo can be further removed through a multi-focus postprocessing [7]. The proposed waveform sequence generated based on the Eulerian circuit is also eligible to further apply dedicated multi-focus postprocessing. The postprocessed image for = 5 is shown in Figure 15, where the nadir echo is significantly suppressed without affecting the underlying scene. The peak suppression of the nadir echo is 27.6 dB. The averaged range profiles of the images where the nadir echo is only smeared and removed through postprocessing for = 13 are compared to those of conventional SAR and to the waveform-encoded SAR case with the long sequence of = 5050 and = 5 (without postprocessing) in Figure 16. The postprocessing even removes the residual peaks with very low levels compared to the conventional SAR case.
5. Conclusions
A technique for generating a waveform sequence for waveform-encoded SAR with cyclically shifted chirps based on the Eulerian circuit and using a limited number of distinct waveforms has been proposed. This technique effectively reduces the number of the required distinct waveforms while retaining the performance of nadir echo suppression. The chirp shifts that define the distinct waveforms are randomly determined, and sets of normalized chirp shifts that lead to the best nadir echo suppression performance are provided.
The nadir echo suppression of the proposed technique has been tested through point-target simulations and simulations with a real TerraSAR-X image and a realistic nadir echo model. The simulation parameters were selected considering the TerraSAR-X specification, but the technique can be applied in general to any SAR system. The peak suppression performances for various numbers of distinct waveforms have been compared to the performance of the original long sequence of cyclically shifted chirps. In the realistic simulation, the proposed method with a number of distinct waveforms larger than 13 showed performances only slightly worse than using 5050 distinct waveforms. The proposed method is also eligible to further apply multi-focus postprocessing.
The implementation of the SAR system significantly benefits from reducing the number of required distinct waveforms using the proposed technique, which also reduces the calibration burden. The proposed waveform sequence generated based on the Eulerian circuit for cyclically shifted chirps will be further investigated through real TerraSAR-X experiments in the future, as has already done for up- and down- chirp alternation [13,14].
Author Contributions
Investigation, S.-Y.J., F.G. and M.V.; writing—original draft preparation, S.-Y.J.; writing—review and editing, M.V. All authors have read and agreed to the published version of the manuscript.
Funding
This research received no external funding.
Institutional Review Board Statement
Not applicable.
Informed Consent Statement
Not applicable.
Acknowledgments
The authors would like to acknowledge their colleague Josef Mittermayer for many constructive discussions.
Conflicts of Interest
The authors declare no conflict of interest.
References
- Moreira, A.; Prats-Iraola, P.; Younis, M.; Krieger, G.; Hajnsek, I.; Papathanassiou, K.P. A tutorial on synthetic aperture radar. IEEE Geosci. Remote Sens. Mag. 2013, 1, 6–43. [Google Scholar] [CrossRef] [Green Version]
- Cumming, I.G.; Wong, F.H. Digital Processing of Synthetic Aperture Radar Data: Algorithms and Implementation; Artech Housel: Boston, MA, USA, 2005. [Google Scholar]
- Balkoski, J.; Bordoni, F. Nadir echo properties, a study based on TerraSAR-X data. In Proceedings of the 2012 20th Telecommunications Forum (TELFOR), Belgrade, Servia, 20–22 November 2012. [Google Scholar]
- Mittermayer, J.; Younis, M.; Metzig, R.; Wollstadt, S.; Martinez, J.M.; Meta, A. TerraSAR-X system performance characterization and verification. IEEE Trans. Geosci. Remote Sens. 2010, 48, 660–676. [Google Scholar] [CrossRef]
- Curlander, J.C.; McDonough, R.N. Synthetic Aperture Radar: Systems and Signal Processing; John Wiley & Sons: New York, NY, USA, 1991; ISBN 978-0-471-85770-9. [Google Scholar]
- Villano, M.; Krieger, G.; Moreira, A. Verfahren und vorrichtung zur rechnergestuetzten Verarbeitung von SAR Rohdaten. German Patent DE 102017205 649, 5 December 2017. [Google Scholar]
- Villano, M.; Krieger, G.; Moreira, A. Nadir echo removal in synthetic aperture radar via waveform diversity and dual-focus postprocessing. IEEE Geosci. Remote Sens. Lett. 2018, 15, 719–723. [Google Scholar] [CrossRef]
- Villano, M.; Krieger, G.; Moreira, A. Waveform-encoded SAR: A novel concept for nadir echo and range ambiguity suppression. In Proceedings of the EUSAR 2018, 12th European Conference on Synthetic Aperture Radar, Aachen, Germany, 4–7 June 2018. [Google Scholar]
- Dell’Amore, L.; Villano, M.; Krieger, G. Assessment of image quality of waveform-encoded synthetic aperture radar using real satellite data. In Proceedings of the 2019 20th International Radar Symposium (IRS), Ulm, Germany, 26–28 June 2019; pp. 1–10. [Google Scholar]
- Stein, U.; Younis, M. Suppression of range ambiguities in synthetic aperture radar systems. In Proceedings of the IEEE Region 8 EUROCON 2003, Computer as a Tool, Ljubljana, Slovenia, 22–24 September 2003; pp. 417–421. [Google Scholar]
- Ustalli, U.; Villano, M. Impact of ambiguity statistics on information retrieval for conventional and novel SAR modes. In Proceedings of the 2020 IEEE Radar Conference (RadarConf20), Florence, Italy, 21–25 September 2020. [Google Scholar]
- Mittermayer, J.; Martinez, J.M. Analysis of range ambiguity suppression in SAR by up and down chirp modulation for point and distributed targets. In Proceedings of the IGARSS 2003, 2003 IEEE International Geoscience and Remote Sensing Symposium, Proceedings (IEEE Cat, No.03CH37477), Toulouse, France, 21–25 July 2003; Volume 6, pp. 4077–4079. [Google Scholar]
- Jeon, S.-Y.; Kraus, T.; Steinbrecher, U.; Villano, M.; Krieger, G. A TerraSAR-X experiment for validation of nadir echo suppression through waveform encoding and dual-focus postprocessing. In Proceedings of the European Conference on Synthetic Aperture Radar (EUSAR) 2021, Leipzig, Germany, 29 March–1 April 2021. [Google Scholar]
- Jeon, S.-Y.; Kraus, T.; Steinbrecher, U.; Krieger, G.; Villano, M. Experimental demonstration of nadir echo removal in SAR using waveform diversity and dual-focus postprocessing. IEEE Geosci. Remote Sens. Lett. 2021. in review. [Google Scholar]
- Steinbrecher, U.; Martinez, J.M.; Mittermayer, J.; Metzig, R.; Buchreuss, S.; Gottwald, M. New data take commanding concept for TerraSAR-X instrument. In Proceedings of the EUSAR 2004, Ulm, Germany, 25–27 May 2004. [Google Scholar]
- Krieger, G.; Gebert, N.; Moreira, A. Multidimensional waveform encoding: A new digital beamforming technique for synthetic aperture radar remote sensing. IEEE Trans. Geosci. Remote Sens. 2008, 46, 31–46. [Google Scholar] [CrossRef] [Green Version]
- Moreira, A.; Misra, T. On the use of the ideal filter concept for improving SAR image quality. J. Electromagn. Waves Appl. 1995, 9, 407–420. [Google Scholar] [CrossRef]
- Glatz, F. Assessment of nadir echo suppression in waveform-encoded synthetic aperture radar (SAR) using real TerraSAR-X data. Master’s Thesis, Ulm University, Ulm, Germany, 2020. [Google Scholar]
- Pitz, W. The TerraSAR-X satellite. In Proceedings of the EUSAR 2006, Dresden, Germany, 16–18 May 2006. [Google Scholar]
- Miller, D.; Stangl, M.; Metzig, R. On-ground testing of TerraSAR-X instrument. In Proceedings of the EUSAR 2006, Dresden, Germany, 16–18 May 2006. [Google Scholar]
- Gabele, M.; Bräutigam, B.; Schulze, D.; Steinbrecher, U.; Tous-Ramom, N.; Younis, M. Fore and aft channel reconstruction in the TerraSAR-X dual receive antenna mode. IEEE Trans. Geosci. Remote Sens. 2010, 48, 795–806. [Google Scholar] [CrossRef]
- Euler, L. Solutio problematis ad geometriam situs pertinentis. Comment. Academiae Sci. I Petropolitanae 1736, 8, 128–140. [Google Scholar]
- Bondy, J.A.; Murty, U.S.R. Graph Theory with Applications; Macmillan: London, UK, 1976. [Google Scholar]
- Peixoto, M.; Villano, M.; Krieger, G. Nadir echo suppression in staggered SAR. In Proceedings of the Advanced Remote Sensing Instruments (ARSI) 2019, Noordwijk, The Netherlands, 11–13 November 2019. [Google Scholar]
Figure 1.
TerraSAR-X image acquired over Australia as an example of nadir echo appearing in a SAR image. The horizontal and vertical axes correspond to slant range and azimuth, respectively.
Figure 1.
TerraSAR-X image acquired over Australia as an example of nadir echo appearing in a SAR image. The horizontal and vertical axes correspond to slant range and azimuth, respectively.

Figure 2.
Timing diagram for PRF selection of a conventional SAR. The green and blue areas indicate transmit and nadir interferences, respectively, while the red lines indicate possible swaths that avoid transmit and nadir interferences.
Figure 2.
Timing diagram for PRF selection of a conventional SAR. The green and blue areas indicate transmit and nadir interferences, respectively, while the red lines indicate possible swaths that avoid transmit and nadir interferences.

Figure 3.
Block diagram of the multi-focus postprocessing.

Figure 4.
Schematic representation of the pulses (Top) and time-frequency diagrams (Bottom) for the conventional nonshifted chirp (Left) and the cyclically shifted chirp (Right) [7].
Figure 4.
Schematic representation of the pulses (Top) and time-frequency diagrams (Bottom) for the conventional nonshifted chirp (Left) and the cyclically shifted chirp (Right) [7].

Figure 5.
Simulation scenario with a point target at nadir.

Figure 6.
Simulation results of nadir echo for (a) conventional SAR, (b) cyclically shifted chirp sequence with and (c) cyclically shifted chirp sequence with . All data are displayed in dB.
Figure 6.
Simulation results of nadir echo for (a) conventional SAR, (b) cyclically shifted chirp sequence with and (c) cyclically shifted chirp sequence with . All data are displayed in dB.

Figure 7.
The Eulerian circuit for generating a waveform sequence, where the vertices represent distinct waveforms, and the edges represent the transitions among them.
Figure 7.
The Eulerian circuit for generating a waveform sequence, where the vertices represent distinct waveforms, and the edges represent the transitions among them.

Figure 8.
(a) Selected values (normalized by ) for = 5 and (b) the waveform sequence generated using the Eulerian circuit.
Figure 8.
(a) Selected values (normalized by ) for = 5 and (b) the waveform sequence generated using the Eulerian circuit.

Figure 9.
Simulation results of nadir echo smearing for each with different sets of values.

Figure 10.
Focused SAR images for (a) = 5 and (b) = 13 showing the smearing of the nadir echo for a point scatterer. All data are displayed in dB.
Figure 10.
Focused SAR images for (a) = 5 and (b) = 13 showing the smearing of the nadir echo for a point scatterer. All data are displayed in dB.

Figure 11.
(a) TerraSAR-X image acquired over Lake Stanberg used to generate the simulated data and (b) realization of a range line of the nadir echo data.
Figure 11.
(a) TerraSAR-X image acquired over Lake Stanberg used to generate the simulated data and (b) realization of a range line of the nadir echo data.

Figure 12.
Focused images for (a) conventional SAR, (b) cyclically shifted chirp sequence with and (c) cyclically shifted chirp sequence with showing (Top) both the scene and the nadir echo displayed in linear scale and (Bottom) nadir echo only displayed in dB.
Figure 12.
Focused images for (a) conventional SAR, (b) cyclically shifted chirp sequence with and (c) cyclically shifted chirp sequence with showing (Top) both the scene and the nadir echo displayed in linear scale and (Bottom) nadir echo only displayed in dB.

Figure 13.
Focused images using the proposed technique for (a) = 5, (b) = 13, and (c) = 37 showing (Top) both the scene and the nadir echo displayed in linear scale and (Bottom) nadir echo only displayed in dB.
Figure 13.
Focused images using the proposed technique for (a) = 5, (b) = 13, and (c) = 37 showing (Top) both the scene and the nadir echo displayed in linear scale and (Bottom) nadir echo only displayed in dB.

Figure 14.
The nadir echo suppression performances in point-target and simulations with real data for various values of .
Figure 14.
The nadir echo suppression performances in point-target and simulations with real data for various values of .

Figure 15.
Focused image after multi-focus postprocessing for the proposed technique with = 5 showing (a) both the scene and the nadir echo displayed in linear scale and (b) nadir echo only displayed in dB.
Figure 15.
Focused image after multi-focus postprocessing for the proposed technique with = 5 showing (a) both the scene and the nadir echo displayed in linear scale and (b) nadir echo only displayed in dB.

Figure 16.
Averaged range profiles of the focused image for conventional SAR (blue), waveform variation using a very long sequence with = 5 (orange), mere waveform variation using a sequence with only = 13 distinct waveforms (green), and waveform variation and dual-focus postprocessing using a sequence with only N = 13 distinct waveforms (red).


Table 1.
System and Processing Parameters.
| Parameter | Value |
|---|---|
| Center frequency | 9.65 GHz |
| Antenna length | 4.8 m |
| Bandwidth | 100 MHz |
| Pulse width | 50 μs |
| PRF | 3113 Hz |
| Orbit height | 520 km |
| Processed Doppler bandwidth | 2765 Hz |
| Processing window in range | Generalized Hamming, = 0.6 |
| Processing window in azimuth | Generalized Hamming, = 0.6 |
Table 2.
Performance of Nadir Echo Suppression (Optimum Set of ) vs. Number of Distinct Waveforms.
| 5050 (K = 1) | 5050 (K = 5) | 5 | 7 | 11 | 13 | 17 | 19 | 23 | 29 | 37 | 41 | |
|---|---|---|---|---|---|---|---|---|---|---|---|---|
| Peak suppression (dB) | 36.8 | 39.4 | 24.6 | 26.2 | 31.0 | 31.9 | 33.4 | 32.8 | 34.4 | 34.7 | 35.4 | 35.4 |
Table 3.
Sets of values (normalized by ) with the best nadir echo suppression performance for primes between 5 and 17.
Table 3.
Sets of values (normalized by ) with the best nadir echo suppression performance for primes between 5 and 17.
| N | ti Values | ||||||||||
|---|---|---|---|---|---|---|---|---|---|---|---|
| 5 | −0.294 | −0.184 | 0.027 | 0.186 | 0.449 | - | - | - | |||
| 7 | −0.422 | −0.29 | −0.286 | −0.096 | 0.113 | 0.288 | 0.38 | - | |||
| 11 | −0.373 | −0.368 | −0.312 | −0.208 | −0.167 | −0.151 | 0.109 | 0.113 | |||
| −0.186 | 0.268 | 0.388 | - | - | - | - | - | ||||
| 13 | 0.468 | −0.284 | −0.27 | −0.225 | −0.224 | −0.138 | −0.065 | 0.05 | |||
| 0.069 | 0.12 | 0.16 | 0.218 | 0.268 | - | - | - | ||||
| 17 | −0.49 | −0.487 | −0.482 | −0.413 | −0.396 | −0.347 | −0.31 | −0.269 | |||
| −0.172 | −0.135 | −0.048 | 0.044 | 0.087 | 0.123 | 0.133 | 0.397 | 0.447 | |||
Table 4.
Performance of Nadir Echo Suppression in Simulation with Real Data vs. Number of Distinct Waveforms.
Table 4.
Performance of Nadir Echo Suppression in Simulation with Real Data vs. Number of Distinct Waveforms.
| N | 5050 (K = 1) | 5050 (K = 5) | 5 | 7 | 11 | 13 | 17 | 19 | 23 | 29 | 37 | 41 |
|---|---|---|---|---|---|---|---|---|---|---|---|---|
| Peak suppression (dB) | 17.7 | 20.7 | 13.2 | 15.7 | 16.9 | 18.8 | 19.6 | 19.5 | 20.2 | 19.8 | 21.5 | 20.8 |
Publisher’s Note: MDPI stays neutral with regard to jurisdictional claims in published maps and institutional affiliations. |
© 2021 by the authors. Licensee MDPI, Basel, Switzerland. This article is an open access article distributed under the terms and conditions of the Creative Commons Attribution (CC BY) license (https://creativecommons.org/licenses/by/4.0/).
Share and Cite
MDPI and ACS Style
Jeon, S.-Y.; Glatz, F.; Villano, M. A Waveform-Encoded SAR Implementation Using a Limited Number of Cyclically Shifted Chirps. Remote Sens. 2021, 13, 3038. https://0-doi-org.brum.beds.ac.uk/10.3390/rs13153038
AMA Style
Jeon S-Y, Glatz F, Villano M. A Waveform-Encoded SAR Implementation Using a Limited Number of Cyclically Shifted Chirps. Remote Sensing. 2021; 13(15):3038. https://0-doi-org.brum.beds.ac.uk/10.3390/rs13153038
Chicago/Turabian StyleJeon, Se-Yeon, Fabian Glatz, and Michelangelo Villano. 2021. "A Waveform-Encoded SAR Implementation Using a Limited Number of Cyclically Shifted Chirps" Remote Sensing 13, no. 15: 3038. https://0-doi-org.brum.beds.ac.uk/10.3390/rs13153038
Note that from the first issue of 2016, this journal uses article numbers instead of page numbers. See further details here.