Article

A Novel Sub-Image Local Area Minimum Entropy Reconstruction Method for HRWS SAR Adaptive Unambiguous Imaging

School of Information and Communication Engineering, University of Electronic Science and Technology of China, Chengdu 611731, China
*
Author to whom correspondence should be addressed.
Remote Sens. 2021, 13(16), 3115; https://0-doi-org.brum.beds.ac.uk/10.3390/rs13163115
Submission received: 7 June 2021 / Revised: 25 July 2021 / Accepted: 3 August 2021 / Published: 6 August 2021
(This article belongs to the Special Issue 2nd Edition Radar and Sonar Imaging and Processing)

Abstract

:
Multichannel high-resolution and wide-swath (HRWS) synthetic aperture radar (SAR) is a vital technique for modern remote sensing. As multichannel SAR systems usually face the problem of azimuth nonuniform sampling resulting in azimuth ambiguity, the conventional reconstruction methods are adopted to obtain the uniformly sampled signal. However, various errors, especially amplitude, phase, and baseline errors, always significantly degrade the performance of the reconstruction methods. To solve this problem, in this paper, a novel sub-image local area minimum entropy reconstruction method (SILAMER) is proposed, which has favorable adaptability to the HRWS SAR system with various errors. First, according to the idea of image domain reconstruction, the sub-images are generated by employing the back-projection algorithm. Then, we proposed an estimation algorithm based on sub-image local area minimum entropy to obtain the optimal reconstruction coefficient and the compensation phase, which can greatly improve the estimation efficiency by using a local area of the sub-image as the input for estimation. Finally, the sub-images are weighted by the optimal estimated reconstruction coefficient and calibrated by the compensation phase to obtain the unambiguous reconstruction image. The experimental results verify the effectiveness of the proposed method. Noticeably, the proposed algorithm has two additional advantages, i.e., (1) it can perform well under the condition of low signal-to-noise ratio (SNR), and (2) it is suitable for the curved trajectory SAR reconstruction. The simulations verify these advantages of the proposed method.

1. Introduction

High-resolution and wide-swath (HRWS) imaging has become an important trend for the synthetic aperture radar (SAR) technique [1,2,3,4,5], which is conducive to many fields such as continuous earth surface observation [6], moving target indication [7], and maritime reconnaissance [8]. However, for the traditional single-channel SAR system, low pulse repetition frequency (PRF) is required to obtain a wide swath image, which conflicts with the high RPF that is required in azimuth to avoid ambiguity. To solve this contradiction, the multichannel SAR technique was proposed [9]. One of the channels transmits the signals with low PRF to ensure a wide swath, and all channels that are set up along the track receive signals simultaneously to increase the PRF of the multichannel system. When the PRF of the SAR system, platform speed v, and the channel space d satisfy the uniform sampling condition, that is, PRF = 2 v / N d , the echo of each channel can be directly combined, which equals to the uniformly sampled data collected by a single-channel SAR system with N · PRF . Thus, the equivalent azimuth PRF of the multichannel system is increased, which can perform azimuth high-resolution imaging without ambiguity and ensures the range wide swath. Unfortunately, in practice, due to factors such as the avoidance of nadir echo, the improvement of the azimuth resolution, and the attitude change of the flight platform [9,10], the system parameters will deviate from the ideal values that satisfy the uniform sampling conditions. It forms periodically nonuniform sampling in azimuth and the azimuth ambiguity image will be obtained directly using the multichannel data. To solve this problem, numerous reconstruction methods have been extensively studied to recover the uniformly sampled signal from the periodic non-uniformly sampled signal. In [9,11], Krieger and Gebert et al. developed the filter bank reconstruction. To increase the robustness of the reconstruction, in [12,13] Li et al. proposed an adaptive reconstruction method based on the space-time adaptive processing approach. In addition, considering the good performance of maneuvering platforms SAR [14,15,16,17,18], the image domain reconstruction (IDR) method was proposed to deal with the curved trajectory HRWS SAR [19]. However, due to the change of channel characteristics affected by temperature and the hardware differences of each channel, the multichannel SAR system usually suffers from the amplitude errors and the phase errors [20,21]. They significantly degrade the performance of the reconstruction methods, resulting in the azimuth ambiguity.
To improve the multichannel reconstruction image quality, numerous amplitude and the phase errors calibration methods have been proposed to calibrate channel errors in the literature [2,4,20,22,23]. A time-domain phase mismatch calibration based on the azimuth cross correlation was proposed [24], which derived the phase mismatches from the phase of the cross-correlation function. However, when the Doppler center cannot be accurately provided in advance, it affects the performance of phase calibration. To solve this problem, a spatial cross correlation coefficient method was proposed to estimate the Doppler center for the multichannel HRWS SAR [25], which can calibrate the channel phase mismatch. However, due to the spatial correlation operation, the proposed method may be invalid when the clutter-to-noise ratio (CNR) is relatively low. In addition, subspace-based techniques have also been extensively studied. In [22], Li et al. proposed an orthogonal subspace method (OSM) based on the orthogonality of the signal subspace and the noise subspace to estimate channel phase error. To reduce the computational burden and improve accuracy, Yang et al. proposed a signal subspace comparison method [26], which is based on the fact that the signal subspace is equal to space spanned by the practical steering vectors. It requires only one matrix inverse operation compared with OSM, which improves efficiency. However, those subspace-based techniques require at least one redundant channel, which aggravates the multichannel system complexity. Besides, the performance of the phase error estimation suffers a severe degradation in the case of relatively low signal-to-noise ratio (SNR). To address this issue, in [4], Zhang et al. proposed a robust channel phase error calibration algorithm via maximizing the minimum variance distortionless response (MVDR) beamformer output power, which reduces the computation load by utilizing the inverse of the covariance matrix in place of subspaces to construct the optimization function. In [21], another optimization method based on the power maximization criterion was proposed to estimate phase error, which avoids the signal leakage in the low SNR case without the matrix eigenvalue decomposition. In [20], Zhang et al. proposed a robust channel-calibration algorithm based on minimum entropy, which obtained channel phase errors in all range blocks for the range variant phase mismatch by utilizing local maximum-likelihood (LML) estimation.
Besides, the mechanical manufacturing error and measurement error make the baseline inaccurate [27], which also seriously affects the reconstruction quality. Since the channel phase calibration algorithms cannot directly solve the influence of the baseline error, the baseline error estimation becomes one of the key problems for the HRWS SAR imaging. Baseline error estimation methods were widely studied based on the interferometric phase for multichannel GMTI-SAR systems [28,29]. The effective baseline estimation was proposed via calculating the interferometric phase in the 2-D frequency domain to deal with the baseline deviation of the Chinese Gaofen-3 SAR system [30]. By exploiting the slope of the linear interferometric phase ramp via eigen decomposition of the sample covariance matrix, the eigen-decomposition-based (EDB) method has been proposed to estimate the along-track baseline [31,32]. However, due to the Doppler ambiguity, the methods for GMTI may be invalid for the HRWS SAR baseline error estimation. In [33], a baseline estimation method was developed from the correlation function between the echoes of adjective channel for HRWS SAR. However, it may increase the noise components and create a number of cross terms [27]. Huang has proposed an along-track baseline estimation method by using the iterative adaptive approach [27]. Although this method is robust to the amplitude and phase errors, it may be invalid in the case of a relatively low clutter-to-noise ratio because of the spatial correlation operation.
Taking amplitude error, phase error, and baseline error into consideration, in this paper, a novel sub-image local area minimum entropy reconstruction method (SILAMER) is proposed. The proposed method consists of three steps: sub-images generation, reconstruction coefficient and compensation phase estimation, and unambiguous reconstruction. First, according to the idea of image domain reconstruction, the sub-images are generated by employing the back-projection algorithm [34,35]. During the sub-images imaging, due to the coherent accumulation, the nonlinear motion of the SAR platform can be accurately compensated. Then, we propose an estimation algorithm to estimate the reconstruction coefficient and the compensation phase, where a local area of the sub-image is used as the estimation input to improve the efficiency. For the estimation algorithm, as the closed form-solution based on minimum image entropy criteria cannot be obtained [20], the conjugate gradient method is used to solve the optimization problem, which is to minimize the entropy of the reconstructed image through iteration. Finally, the sub-images are weighted by the estimated reconstruction coefficient and corrected by the compensation phase to obtain the unambiguous reconstructed image.
The main contributions of this paper are as follows:
  • The proposed method can simultaneously correct amplitude error, baseline error, and phase error by estimating the reconstruction coefficient and compensation phase. It is a new strategy to adaptively reconstruct the sub-images based on minimum image entropy through iteration. It has favorable adaptability to the HRWS SAR system with various errors.
  • To improve the efficiency of estimating the reconstruction coefficient and the compensation phase, it selects a local area of each sub-image as the input of the estimation method. As the imaging scene of multi-channel SAR is extremely wide, the proposed algorithm using the local area for estimation will greatly improve the estimation efficiency.
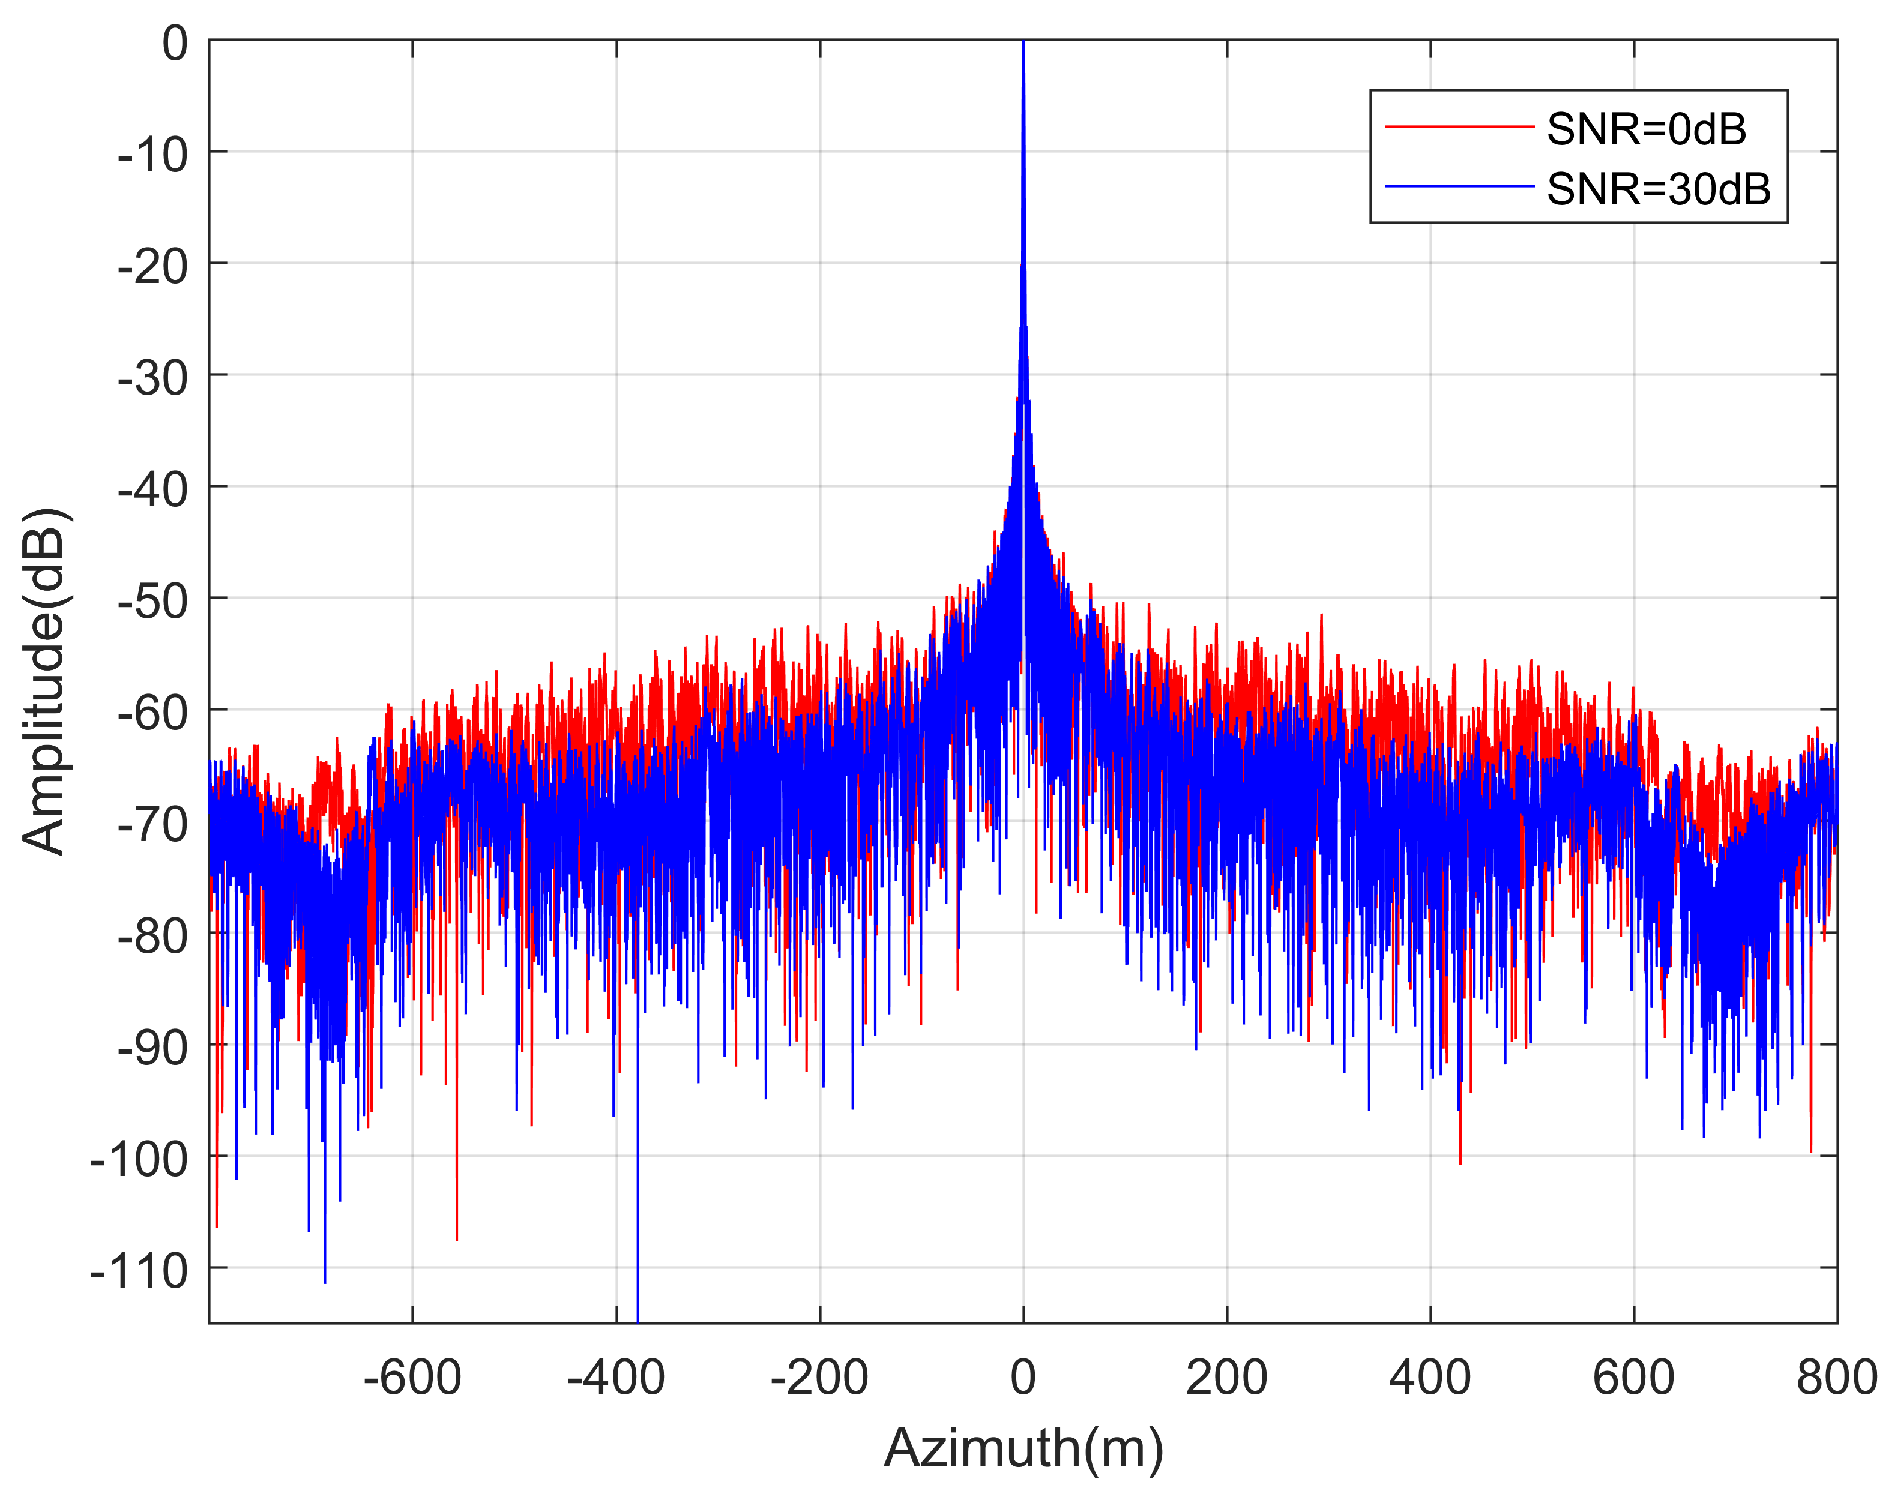
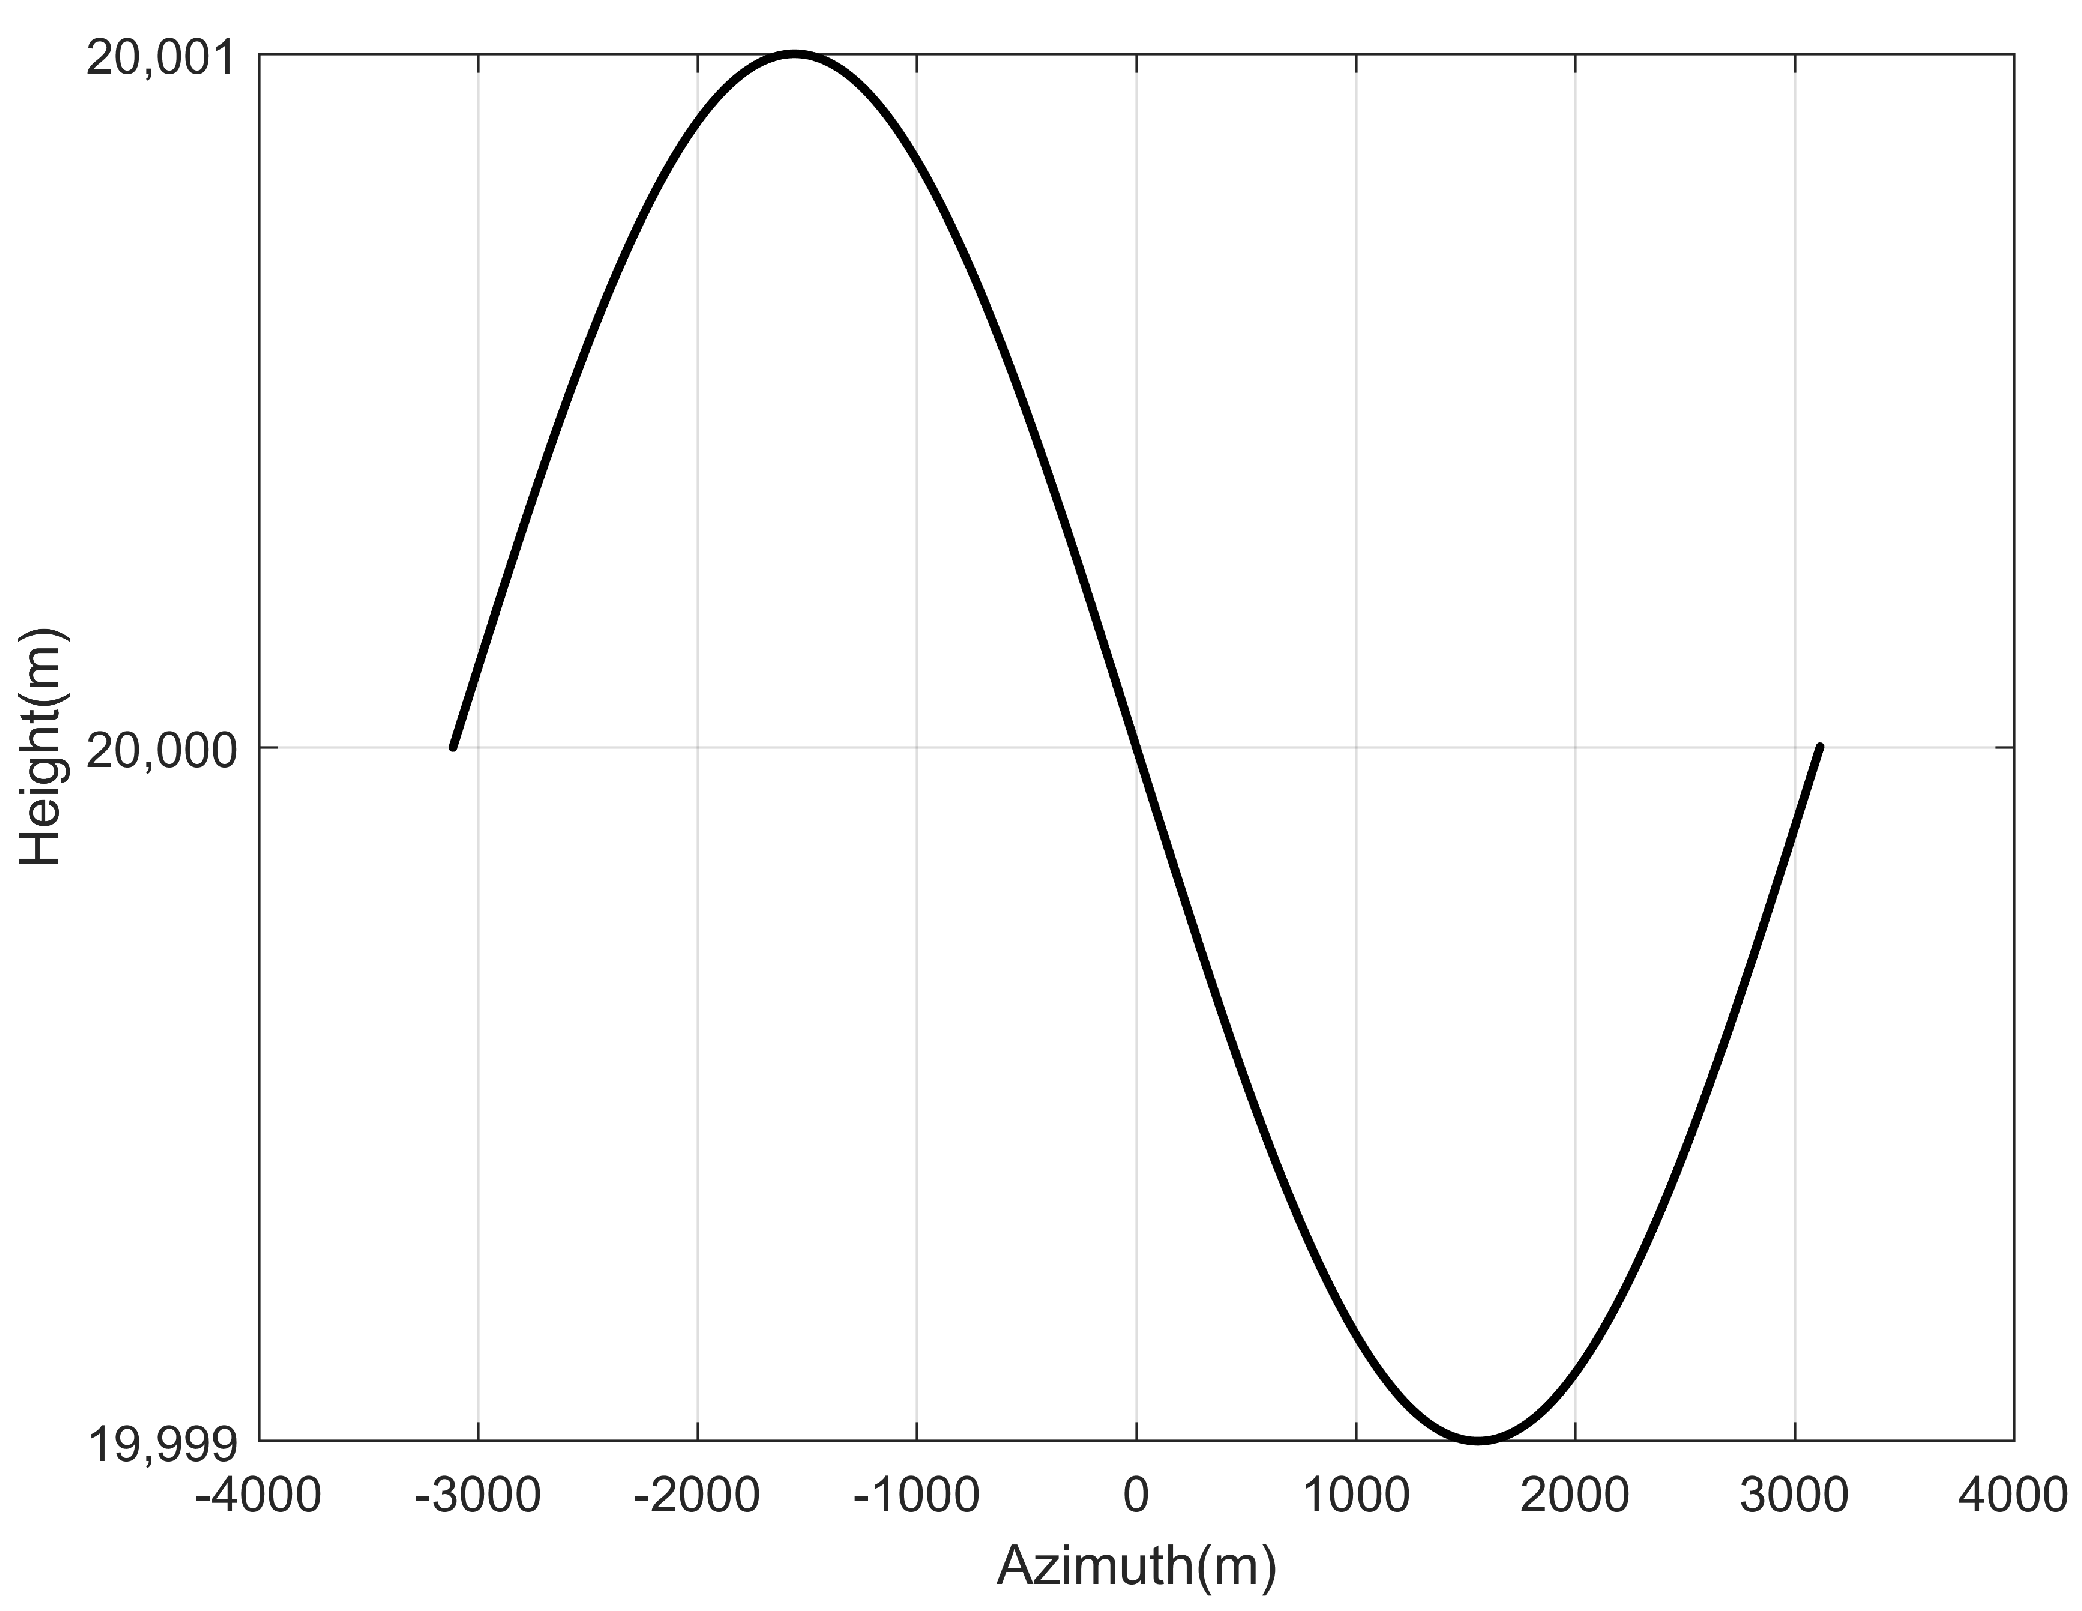
  • The proposed algorithm has two additional advantages. As the proposed method is to reconstruct in the image domain and perform minimum entropy estimation utilizing sub-images, the proposed method performs well when the SNR of the raw data is low. Moreover, the proposed method can perform the curved trajectory HRWS SAR reconstruction. It is because the motion error of the platform is compensated in the sub-images imaging by using the back-projection algorithm.
The rest of this paper is organized as follows. In Section 2, the signal model and non-uniformly sampled signal reconstruction theory is introduced. In Section 3, the proposed adaptive unambiguous reconstruction method is described in detail. In Section 4, the experimental results of simulated multichannel data and equivalent multichannel data generated from single-channel SAR verify the effectiveness of the proposed method. In Section 5, some discussion is given. Finally, Section 6 provides some conclusions.

2. Signal Model

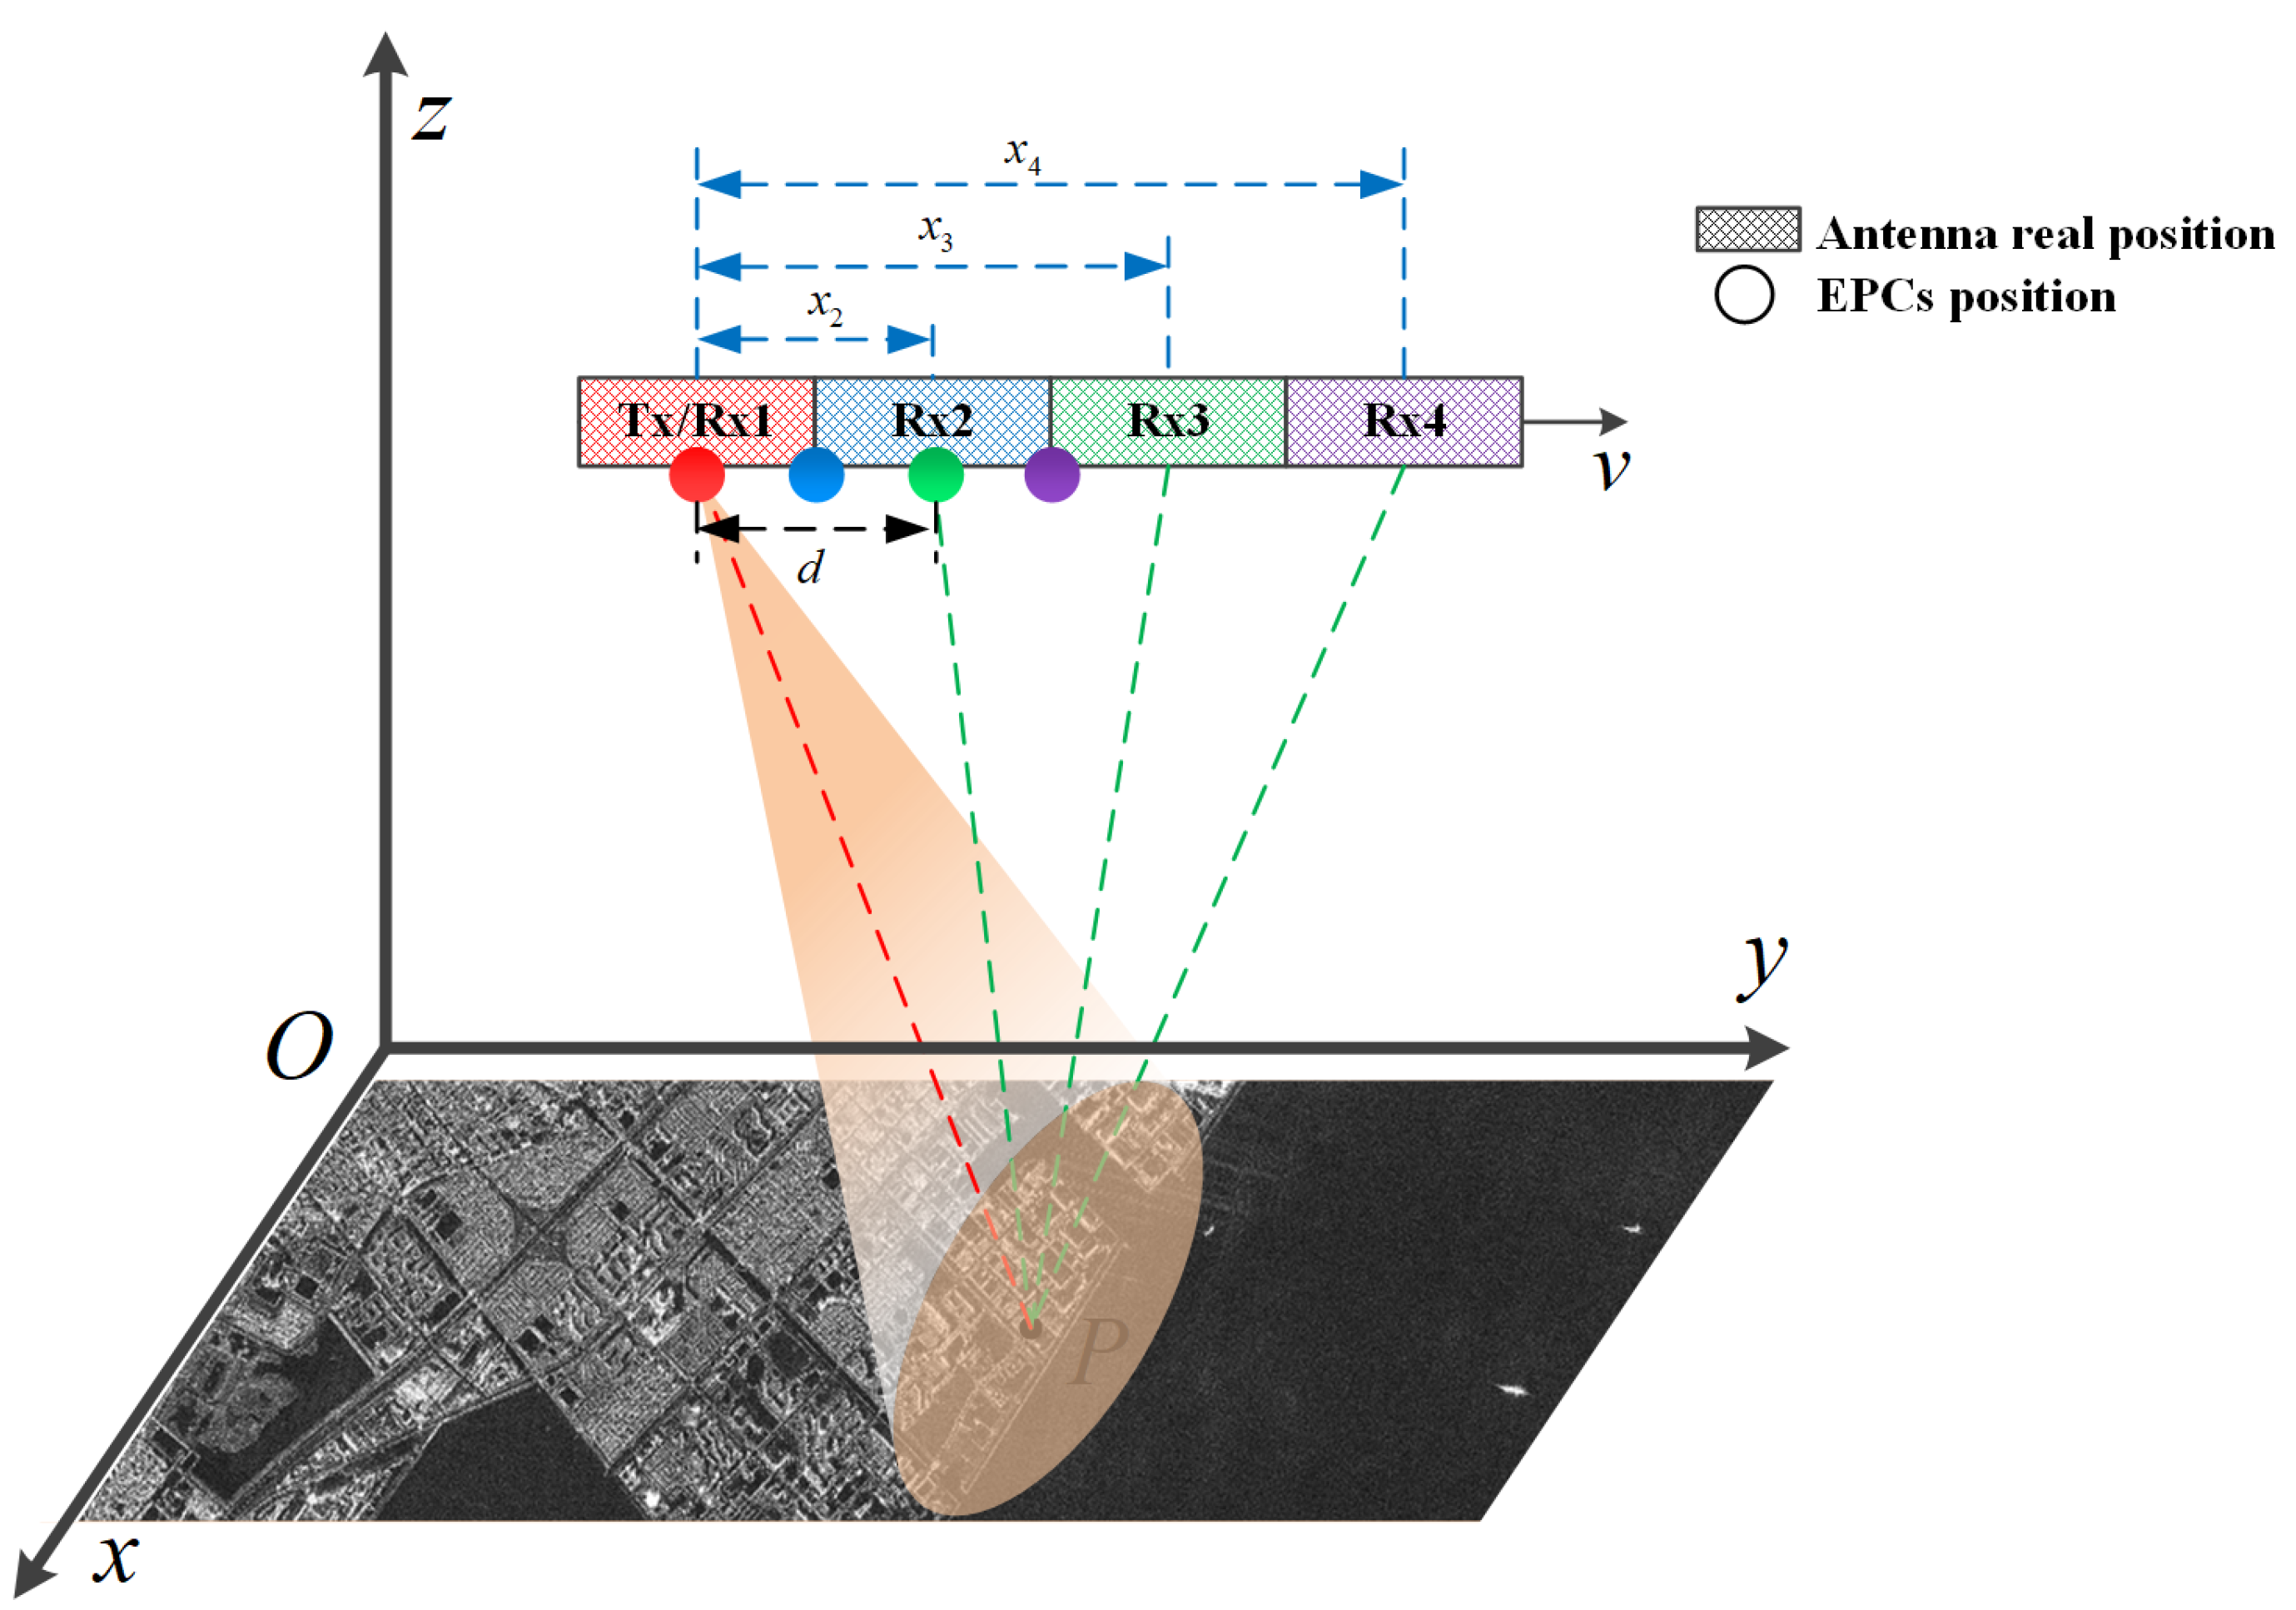
The observation geometry of the multichannel SAR system is depicted in Figure 1. y-axis denotes the platform movement direction and its velocity is v. P is a target in the observation scene. The system has four receivers, of which the receiver R x 1 is also a transmitter T x as a reference channel. Assuming d is the channel spacing, the baseline length between the nth channel and the reference channel is x n = ( n 1 ) · d , where n = 1 , 2 , 3 , 4 . It has been proved that the multichannel SAR system can be regarded as a SAR that transmits and receives signals at the effective phase centers (EPCs) that are located in the middle of the transmitter and receivers [9]. The spacing between the adjacent EPCs is d / 2 
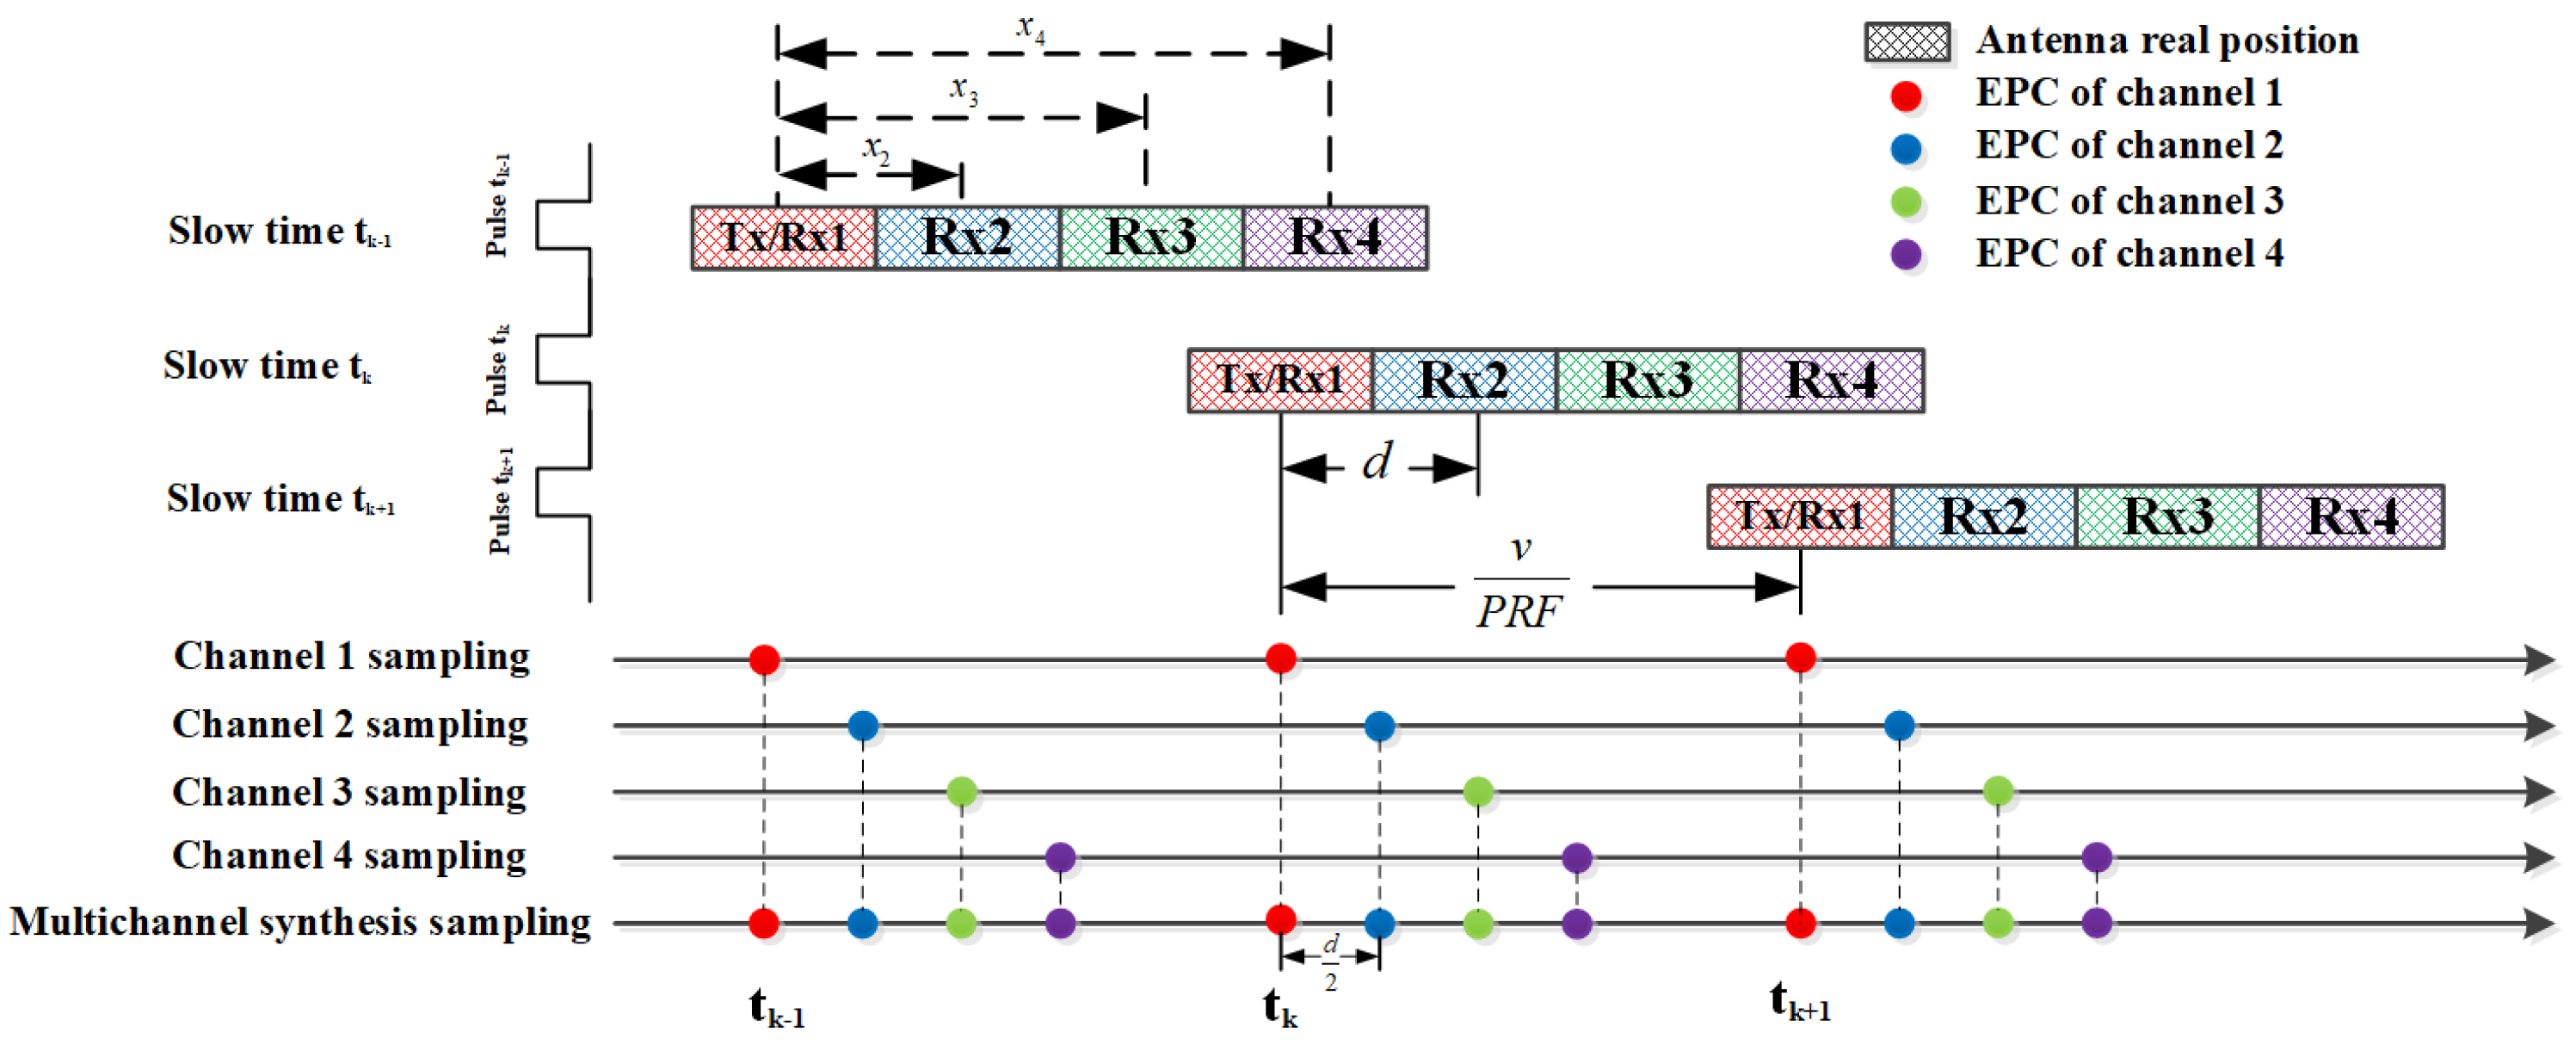
. The subsequent research in this paper is based on the effective phase centers model, and the azimuth sampling pattern for the four-channel SAR system is shown in Figure 2.
Thus, the instantaneous slant range from the EPC to the scatter P can be expressed as
R ( t ) = R 0 2 + ( v t ) 2
where t denotes the slow time of the corresponding EPC, and R 0 is the nearest distance from the target P to the line trajectory of the platform. Generally, assuming that the SAR system transmits a chirp signal, after pulse compression, the echo received by the EPC corresponding to the slow time t can be expressed as
s ( τ , t ) = α ( P ) w a ( t ) · sin c B τ 2 R t c · exp j 4 π R t λ
where τ is the dual echo delay from the EPCs to the mth pixel at slow time t, α P is the complex-valued reflectivity of the scatterer, w a t is the antenna pattern function, B is the bandwidth, c is the speed of light, and λ is the wavelength of the transmitted signal.
According to the geometric relationship of the multichannel effective phase centers shown in Figure 2, the EPCs are uniformly distributed in the azimuth only when the parameters PRF, v, and d satisfy
v PRF = N · d 2
where PRF is the pulse repetition frequency, N is the number of channels, and N = 4 in Figure 1. The HRWS imaging can be performed by rearranging the echoes corresponding to the uniformly distributed EPCs, where the bandwidth of the multi-channel system can be expanded to N · PRF . However, due to the limited choice of PRF, the change of the platform speed, it is difficult to strictly satisfy Equation (3). The EPCs are non-uniformly distributed after rearranging. The azimuth sampling time of the EPC corresponding to nth channel in the kth pulse repetition period can be given by
t k , n = k T r + t n , k = 1 , 2 , K
where T r is the pulse repetition time, K is the number of azimuth sampling periods of the echo. t n is the nth channel sampling time bias which can be written as
t n = ( n 1 ) · T b , n = 1 , 2 , , N
where T b is the time of the equivalent sampling interval of two adjacent channels. N denotes the number of channels.
Combining Equations (2) and (4), the non-uniformly sampled echo in the azimuth can be expressed as s ( τ , t k , n ) . Using this echo for imaging will cause image azimuth ambiguity. Thus, the uniformly sampled echo needs to be recovered. The uniform sampling time t k , n of channel n in the k th pulse repetition period can be expressed as
t k , n = k T r + ( n 1 ) T r N , k = 1 , 2 , K , n = 1 , 2 , , N
where k denotes the pulse repetition period, n denotes the channel. Combining Equations (2) and (6), the uniformly sampled echo can be expressed as s ( τ ( t k , n , m ) , t k , n ) , and it can be reconstructed by using the non-uniformly sampled signals [19], which are expressed as
s ( τ ( t k , n , m ) , t k , n ) = k = k L / 2 k = k + L / 2 n = 1 N s r ( τ t k , n , m , t k , n ) Ψ k n ( t k , n )
where L N is the interpolation period, and Ψ k n ( t k , n ) is the reconstruction coefficient, which can be expressed as
Ψ k n ( t k , n ) = q = 1 N sin [ π PRF ( t k , n t q ) ] q = 1 n N sin [ π PRF ( t n t q ) ] · ( 1 ) k N π PRF ( t k , n t k , n )
Generally, according to the BP algorithm [35], the BP component of the mth pixel of the imaging scene using the uniform sampling echo can be expressed as
I n ( m ) = k = 1 K s ( τ ( t k , n , m ) , t k , n ) exp { j ω τ ( t k , n , m ) } m = 1 , 2 , , M
where ω is the center angular frequency of the transmitted signal. Finally, I n are accumulated to obtain the final multichannel unambiguous reconstruction result, which is shown as
I ( m ) = n = 1 N I n ( m )

3. Sub-Image Local Area Minimum Entropy Reconstruction Method

Due to the change of channel characteristics affected by some environmental factors and the hardware differences of each channel, there are unavoidable channel mismatches among channels. Thus, the multichannel SAR system usually suffers from channel amplitude error and channel phase error, which significantly degrades the performance of the reconstruction methods. In addition, due to the low manufacturing accuracy of the antenna, its position deviates from the nominal one, resulting in baseline error. For this reason, the accurate reconstruction coefficient will not be obtained, leading to the wrong reconstruction. Therefore, baseline error is also a non-negligible factor that causes image azimuth ambiguity.
In this paper, we propose a novel sub-image local area minimum entropy reconstruction method (SILAMER). It can adaptively estimate the reconstruction coefficient and compensation phase through iteration, and simultaneously solve the problems of amplitude error, phase error, and baseline error in this process. SILAMER mainly consists of three steps: (1) According to the idea of image domain reconstruction, the sub-images are generated by using a back-projection method; (2) An estimation algorithm based on sub-image local area minimum entropy is proposed to obtain the optimal reconstruction coefficient and the compensation phase; (3) The sub-images are weighted by the optimal estimated reconstruction coefficient and calibrated by the compensation phase to obtain the unambiguous reconstruction image.

3.1. Sub-Images Generation and Reconstruction with Errors

According to the idea of image domain reconstruction [19], the sub-images need to be generated for reconstruction. To compensate platform motion error and to facilitate sub-image weighting in subsequent steps, the back-projection imaging algorithm is used to obtain sub-images. When the sub-images are correctly weighted by the reconstruction coefficient, an unambiguous image can be obtained. More importantly, the sub-images can be used to estimate the reconstruction coefficient and the compensation phase in the subsequent steps.
Substituting Equation (7) into Equation (9) and according to the characteristics of the reconstruction coefficient, the image of channel n can be written as
I n ( m ) = l = L 2 L 2 n = 1 N k = 1 + L 2 + l K L 2 + l s ( τ ( t k , n , m ) , t k , n ) · exp { j ω τ ( t k n , m ) } Ψ l n = l = L / 2 L / 2 n = 1 N I l n ( m ) Ψ l n m = 1 , 2 , , M
where k = k l ,
I l n ( m ) = k = 1 + L 2 + l K L 2 + l s ( τ ( t k , n , m ) , t k , n ) exp { j ω τ ( t k n , m ) }
Ψ k n ( t k , n ) can be transformed into an l · n dimensional vector Ψ l n that does not depend on t k , n [19]. I l n are the sub-images for channel n , which can be weighted and summed by the reconstruction coefficient Ψ l n to obtain the reconstructed result of each channel I n .
According to Equations (10) and (11), the final reconstructed image can be represented as
I ( m ) = n = 1 N l = L / 2 L / 2 n = 1 N I n l n ( m ) Ψ n l n
where I n l n represents all sub-images.
The amplitude imbalance of the channel is manifested as the inconsistent gain coefficient of the channel. Let A n denote the amplitude error of the nth channel, that is, the amplitude gain coefficient. Let ϕ n denote the phase error of the nth channel. Considering the amplitude error and the phase error, the reconstructed image can be expressed as
I ( m ) = n = 1 N l = L / 2 L / 2 n = 1 N A n exp ( i ϕ n ) I n l n ( m ) Ψ n l n
In addition, when there is a baseline error, the time bias t n in Equation (4) will change. This will affect the reconstruction coefficient Ψ n l n , resulting in an ambiguous image. Assume that the estimated reconstruction coefficient without baseline error is Ψ ˜ n l n . Let A ^ n and ϕ ^ n denote the estimations of the A n and ϕ n , respectively. Thus, the unambiguous reconstruction image is expressed as
I ( m ) = n = 1 N l = L / 2 L / 2 n = 1 N A n exp ( i ϕ n ) I n l n ( m ) Ψ ˜ n l n A ^ n exp ( i ϕ ^ n ) = n = 1 N l = L / 2 L / 2 n = 1 N A n exp ( i ϕ n ) I n l n ( m ) Ψ ^ n l n exp ( i ϕ ^ n )
where Ψ ^ n l n = Ψ ˜ n l n A ^ n . It indicates that the estimated value of the amplitude error can be combined with the reconstruction coefficient. Thus, the new reconstruction coefficient Ψ ^ n l n can correct amplitude error and baseline error.
In order to facilitate the derivation of the formula, the sub-images combining the amplitude and phase error can be expressed as a one-dimensional vector I = [ A 1 exp ( i ϕ 1 ) · I 111 ( m ) , A 2 exp ( i ϕ 2 ) I 112 ( m ) , , A n exp ( i ϕ n ) I n l n ( m ) , , A N exp ( i ϕ N ) I N L N ( m ) ] . If let I j ( m ) substitute A n exp ( i ϕ n ) I n l n ( m ) , I = [ I 1 ( m ) , I 2 ( m ) , , I j ( m ) , , I J ( m ) ] , where j = 1 , 2 , J and J = N 2 L is the number of sub-images. Correspondingly, the estimated reconstruction coefficient Ψ ^ n l n is re-expressed as a one-dimensional vector Ψ ^ = [ Ψ ^ 111 , Ψ ^ 112 , , Ψ ^ n l n , , Ψ ^ N L N ] . If let ψ ^ j substitute Ψ ^ n l n , Ψ ^ = [ ψ ^ 1 , ψ ^ 2 , , ψ ^ j , , ψ ^ J ] , where J is the length of the reconstructed coefficient. The estimated phase vector can be expressed as Φ ^ = [ ϕ ^ 1 , ϕ ^ 2 , , ϕ ^ N , ϕ ^ 1 , ϕ ^ 2 , , ϕ ^ N , , ϕ ^ 1 , ϕ ^ 2 , , ϕ ^ N ] = [ φ ^ 1 , φ ^ 2 , , φ ^ j , , φ ^ J ] .
The unambiguous reconstruction image can be rewritten as
I ( m ) = j = 1 J I j ( m ) ψ ^ j exp ( i φ ^ j )

3.2. Reconstruction Coefficient and Compensation Phase Estimation

In this subsection, we present an estimation algorithm based on sub-image minimum entropy. It can obtain the optimal reconstruction coefficient and the compensation phase to solve the problems of amplitude error, baseline error, and phase error simultaneously. If it uses the whole scene of the sub-image as the input, it suffers from a heavy computational burden. To improve the estimation efficiency, we use a local area of each sub-image as the input of the estimation algorithm.
As amplitude error, phase error, and baseline error result in azimuth ambiguity of the reconstructed image degrading the image quality, we design an estimation model based on optimal image quality criteria to estimate the reconstruction coefficient and the compensation phase to obtain an unambiguous image. Based on the fact when the SAR image quality is better, the image entropy value is smaller [36], image entropy is chosen as the evaluation criteria of image quality. The entropy of an image can be expressed as
ε ( Ψ ^ , Φ ^ ) = m = 1 M | I ( m ) | 2 S ln S | I ( m ) | 2 = ln S 1 S · G
where
S = m = 1 M | I ( m ) | 2 ,
G = m = 1 M | I ( m ) | 2 ln | I ( m ) | 2
| · | is the modulus of a complex number. I ( m ) is the mth pixel’s image value based on the estimated reconstruction coefficient and compensation phase.
When the estimated reconstruction coefficient and compensation phase are more accurate, the image entropy is smaller. The optimization model based on minimum entropy criteria can be expressed as follows
[ Ψ ^ , Φ ^ ] = arg min Ψ ^ , Φ ^ ε ( Ψ ^ , Φ ^ )
Hence, the optimal reconstruction coefficient and compensation phase should satisfy the following equation.
ε ( Ψ ^ , Φ ^ ) ψ ^ j = 0
ε ( Ψ ^ , Φ ^ ) φ ^ j = 0
To solve nonlinear equations, the partial derivative of entropy function ε ( Ψ ^ , Φ ^ ) with respect to ψ ^ j is first derived as
ε ( Ψ ^ , Φ ^ ) ψ ^ j = 1 S · S ψ ^ j G ψ ^ j S G S ψ ^ j S 2
where
S ψ ^ j = m = 1 M | I ( m ) | 2 ψ ^ j
G ψ ^ j = m = 1 M ( ln | I ( m ) | 2 + 1 ) · | I ( m ) | 2 ψ j
Since | I ( m ) | 2 = I ( m ) I * ( m )
| I ( m ) | 2 ψ ^ j = I ( m ) ψ ^ j I * ( m ) + I ( m ) I * ( m ) ψ ^ j = 2 Re [ I * ( m ) I ( m ) ψ ^ j ] = 2 Re [ I * ( m ) I j ( m ) exp ( i φ ^ j ) ]
thus,
S ψ ^ j = m = 1 M 2 Re [ I * ( m ) I j ( m ) exp ( i φ ^ j ) ]
G ψ ^ j = m = 1 M ( ln | I ( m ) | 2 + 1 ) · 2 Re [ I * ( m ) I j ( m ) exp ( i φ ^ j ) ]
The partial derivative of entropy function ε ( Ψ ^ ) with respect to φ ^ j is derived as
ε ( Ψ ^ , Φ ^ ) φ ^ j = 1 S · S φ ^ j G φ ^ j S G S φ ^ j S 2
where
S φ ^ j = m = 1 M | I ( m ) | 2 φ ^ j = m = 1 M I ( m ) φ ^ j I * ( m ) + I ( m ) I * ( m ) φ ^ j = m = 1 M I j ( m ) ψ ^ j exp ( i φ ^ j ) i I * ( m ) + I ( m ) [ I j ( m ) ψ ^ j exp ( i φ ^ j ) i ] * = m = 1 M 2 Re [ I j ( m ) ψ ^ j exp ( i φ ^ j ) i I * ( m ) ]
G φ ^ j = m = 1 M ( ln | I ( m ) | 2 + 1 ) · | I ( m ) | 2 φ ^ j = m = 1 M ( ln | ( m ) | 2 + 1 ) · 2 Re [ I j ( m ) ψ ^ j exp ( i φ ^ j ) i I * ( m ) ]
Thus, the gradient vectors can be expressed as
ε ( Ψ ^ , Φ ^ ) = [ ε ψ ^ 1 , ε ψ ^ 2 , , ε ψ ^ J , ε φ ^ 1 , ε φ ^ 2 , , ε φ ^ J ]
In order to solve Equations (21) and (22), there are several iterative estimation methods used to obtain the approximate solution, such as the steepest descent method, the Newton iteration method, and the conjugate gradient method. Considering the computation burden and the quality of the reconstruction image, the conjugate gradient method [37] is utilized in this paper. Combined with the conjugate gradient method, the algorithm steps for solving Equations (21) and (22) are outlined as Algorithm 1.
Algorithm 1. Reconstruction Coefficient and Compensation Phase Estimation
Inputs: reconstruction sub-images I j ( m ) , iterative number N
Outputs: reconstruction coefficient Ψ ^ , compensation phase Φ ^
Initialize: Θ ^ ( 0 ) = [ Ψ ^ ( 0 ) , Φ ^ ( 0 ) ] , n = 0 , d ( 0 ) = ε
while n < N do
Step 1: use Armijo line search method to calculate step size λ ( n ) by solving the
         following formula
          ε ( Θ ^ ( n ) + λ ( n ) d ( n ) ) = min ε ( Θ ^ ( n ) + λ d ( n ) )
Step 2: update the reconstruction coefficient and the compensation phase
          Θ ^ ( n + 1 ) = Θ ^ ( n ) + λ ( n ) d ( n )
Step 3: update search direction
          d ( n + 1 ) = ε ( Θ ^ ) + β ( n ) d ( n )
         where β ( n ) = ε ( Θ ^ ( n + 1 ) ) 2 ε ( Θ ^ ( n ) ) 2
          n n + 1
end while
return Θ ^ o p t Θ ^ ( n + 1 )
In the following, the computation complexity of the proposed method is analyzed. Assume that N A is the number of the azimuth-direction samples of one channel, and the pixels of the imaging scene are N x · N y . Each sub-image is obtained by performing a BP imaging, which uses the echo data of one channel. According to the characteristics of the BP algorithm, it can be known that the calculation amount of the BP algorithm is mainly in the back-projection part and the time complexity of the algorithm is O ( N A N x N y ) [19]. Let Θ B P denote the total amount of calculation of one of the sub-images. Thus, the amount of calculation to generate N L sub-images is N L Θ B P . The sub-images are weighted to get the final reconstruction result, and its calculation amount is N L · N x N y complex multiplication and ( N L 1 ) · N x N y complex addition. The proposed reconstruction algorithm uses the conjugate gradient method to calculate the reconstruction coefficient and the compensation phase, as shown in Algorithm 1. Step 1 of Algorithm 1 uses the Armijio Line Search algorithm to search for the best step size through iteration, which needs to calculate the entropy of the reconstruction result several times. In step 3 of Algorithm 1, the gradient of the image entropy function is calculated, which also includes calculating the entropy value of the reconstruction result. Due to the large imaging scene, calculating the entropy value of the reconstruction result is the main factor affecting the calculation amount of the conjugate gradient algorithm. We mainly consider the amount of image entropy calculation in the conjugate gradient algorithm. Usually, in one iteration of the conjugate gradient algorithm, it is necessary to calculate the entropy value of the reconstruction result several times, and after several iterations, the optimal reconstruction coefficient and compensation phase can be estimated. Assuming that one iteration needs to calculate the entropy function f 1 times on average, and iterate f 2 times to obtain the optimal solution. Then the amount of calculation is f 1 f 2 N L · N x N y complex multiplication and f 1 f 2 ( N L 1 ) · N x N y complex addition.
As we have seen, if the whole scene of the sub-image is used as the input of the estimation, the estimation algorithm suffers from a heavy computational burden. As the multichannel reconstruction with errors only causes the image azimuth ambiguity and does not affect the imaging performance in range, the effect on the reconstructed image ambiguity caused by errors at different distances can be considered to be consistent. The Local area of the imaging result, which includes part of the distance and the entire azimuth, can be used to indicate the imaging quality of the entire image. The selection of this local area needs to satisfy the condition that the imaging target and the ambituity of the target are in this area. For HRWS SAR image, an area including randomly several range bins and the entire azimuth bins can usually meet this condition.
Let the reconstruction image and sub-image be represented in two-dimensional forms, which are I C N x × N y and I j C N x × N y , N x N , N y N . The whole scene contains N x rows in range and N y columns in azimuth and has N x × N y pixels. Let I ( n x 1 : n x 2 , 1 : N y ) denote the n x 1 th row to the n x 2 th row of the reconstruction image, where 1 n x 1 < n x 2 N x . Let I j ( n x 1 : n x 2 , 1 : N y ) denote the n x 1 th row to the n x 2 th row of the sub-image. The local area reconstruction image can be expressed as
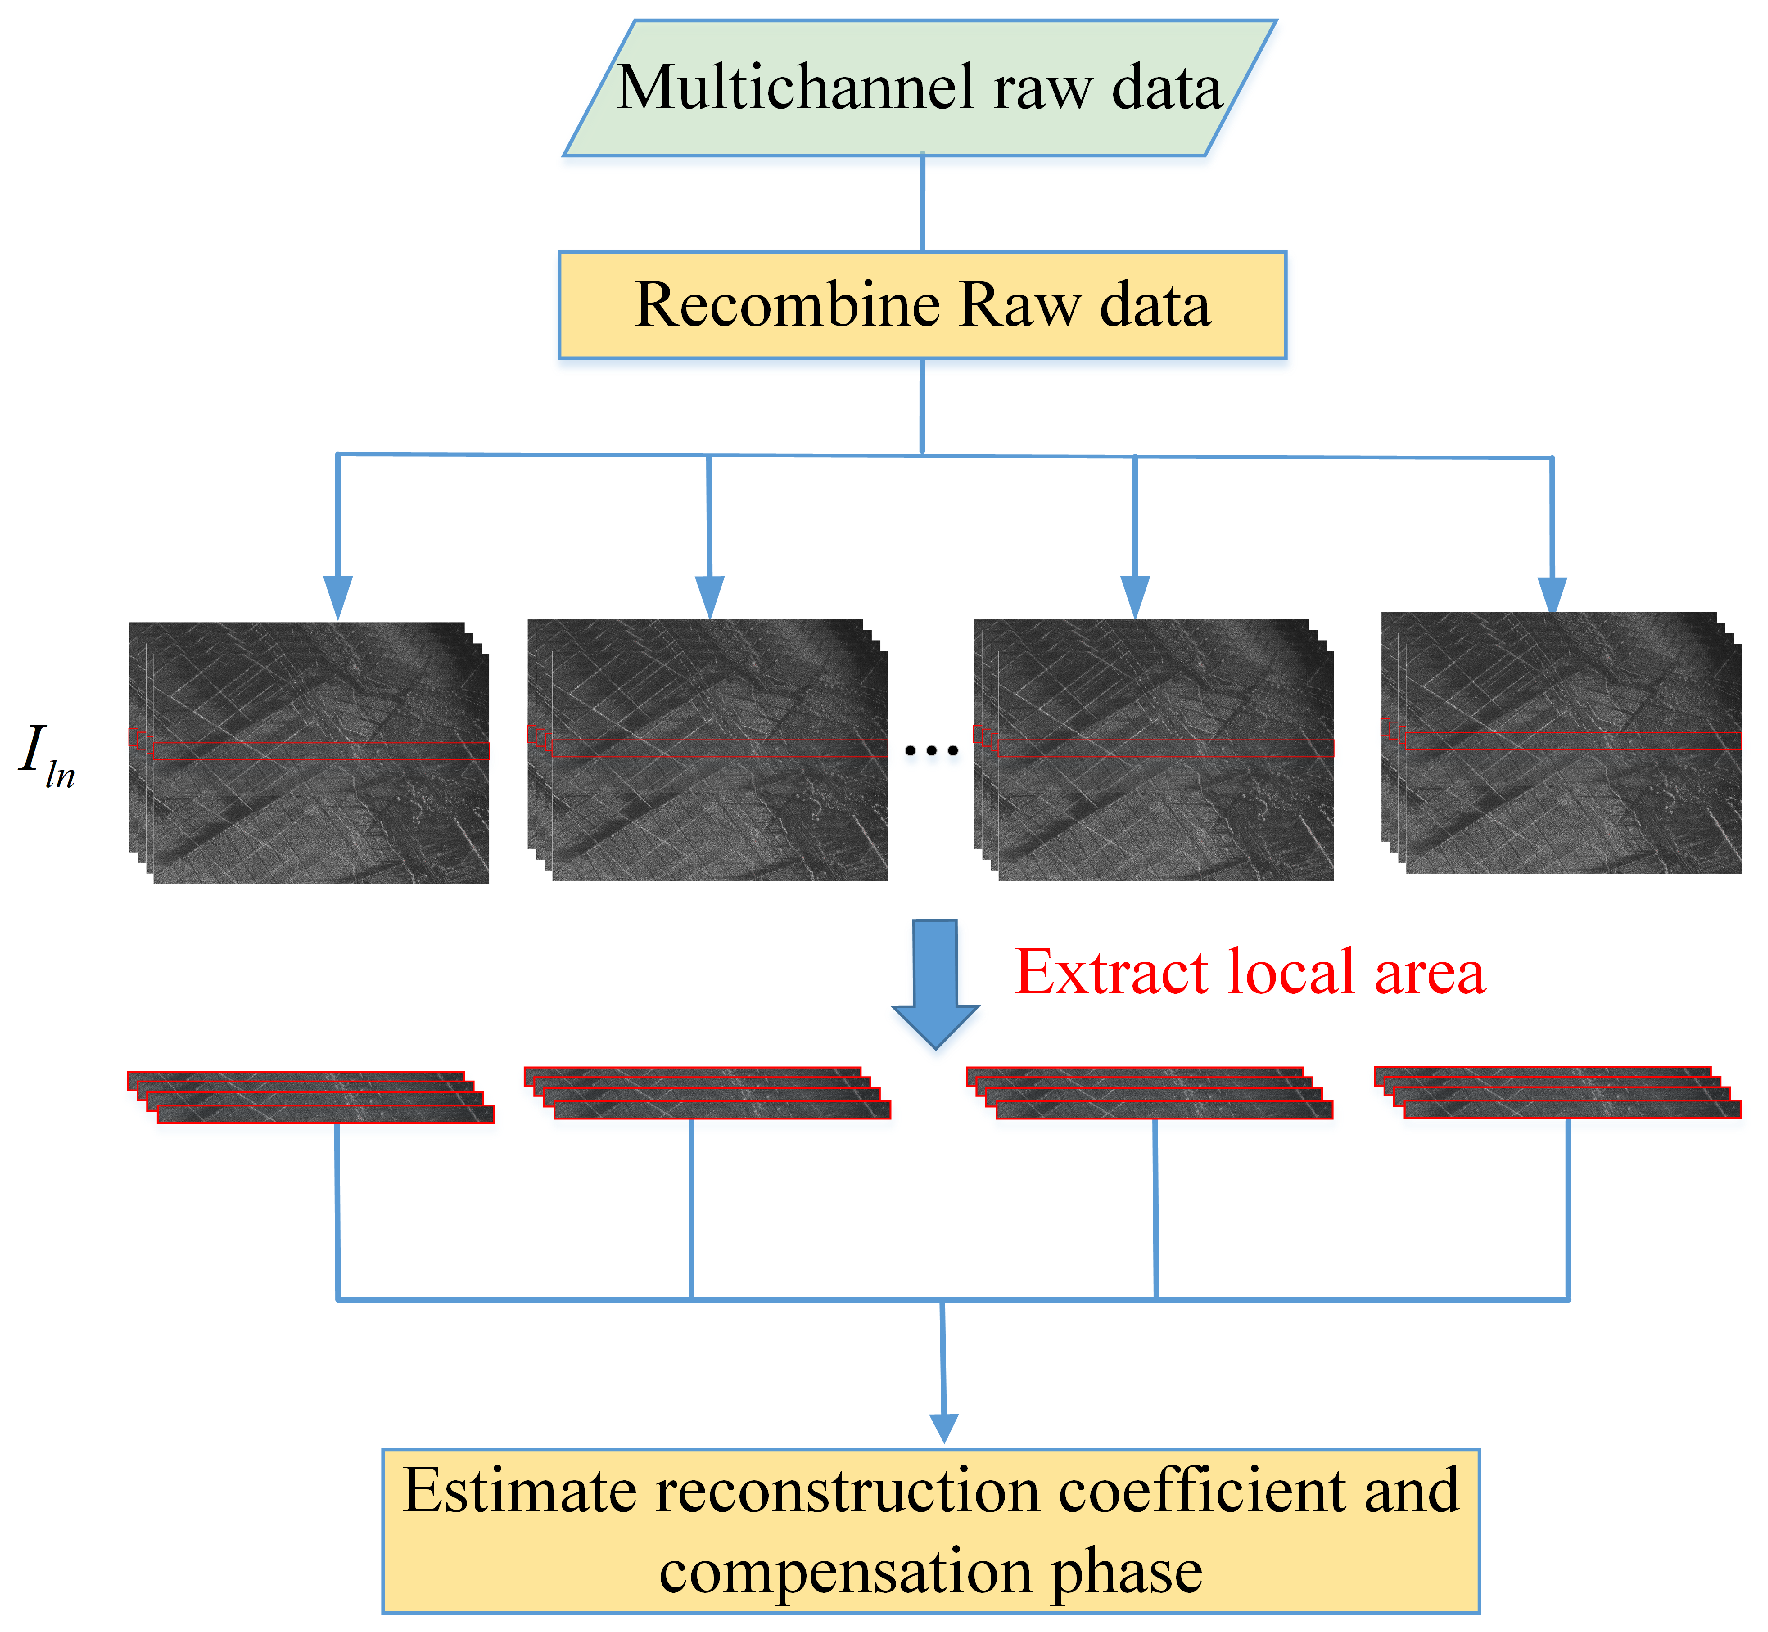
I ( n x 1 : n x 2 , 1 : N y ) = j = 1 J I j ( n x 1 : n x 2 , 1 : N y ) ψ ^ j exp ( i φ ^ j )
Local area reconstruction image I ( n x 1 : n x 2 , 1 : N y ) is obtained by using local area sub-image I j ( n x 1 : n x 2 , 1 : N y ) . Thus, to improve the efficiency of the estimation algorithm, we can select this local area sub-image I j ( n x 1 : n x 2 , 1 : N y ) as the input of the estimation algorithm and performs estimation operations. We randomly select several range bins from n x 1 to n x 2 and all azimuth bins from 1 to N y .
Figure 3 shows the local scene estimation method. Generally, the imaging scene of multi-channel SAR is extremely wide, so the proposed algorithm using the local area for estimation will greatly improve the estimation efficiency.

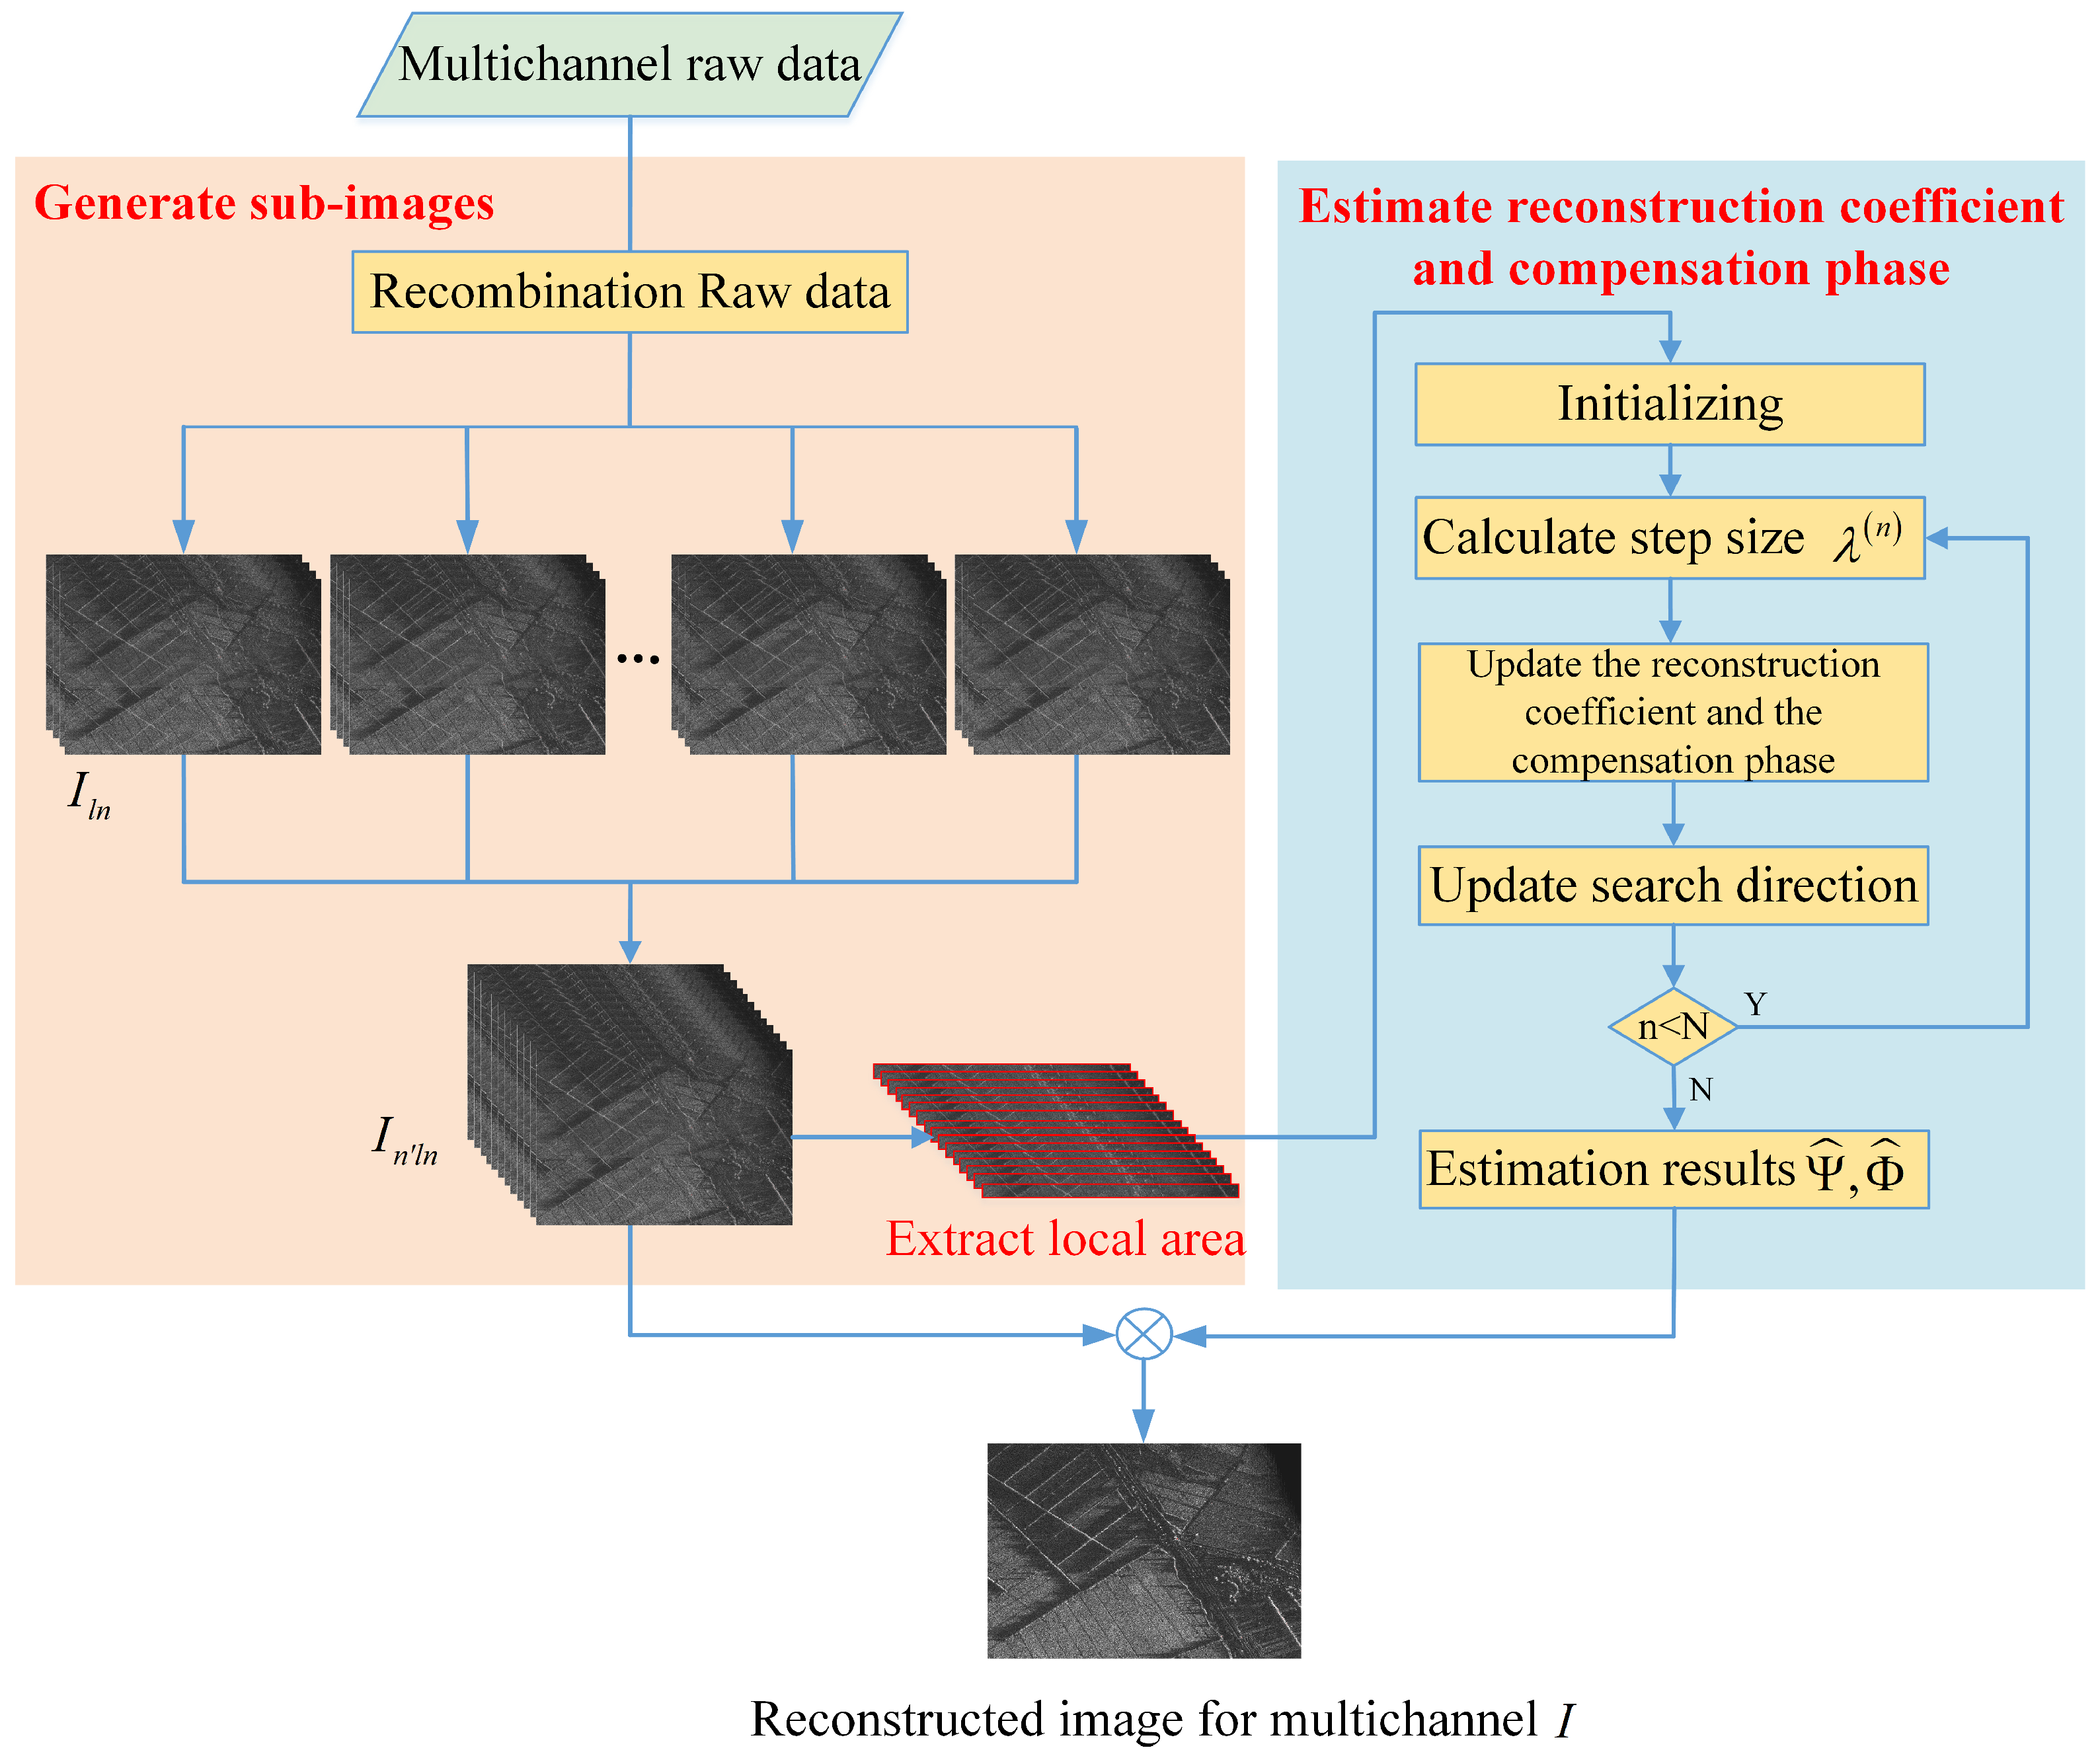
3.3. Unambiguous Reconstruction

Finally, when the optimal reconstruction coefficient estimation Ψ ^ and compensation phase Φ ^ are obtained, the sub-images are weighted by the reconstruction coefficient and calibrated by the compensation phase to obtain the unambiguous reconstruction image by Equation (16). The flow of SILAMER is depicted in Figure 4.

4. Experiments

In this section, the simulation experiment and the artificial multichannel SAR data processing are presented to validate the proposed method.

4.1. Simulated Multichannel SAR Data Experiment

In the following, the experiments are carried out to validate the effectiveness of the proposed method for the reconstruction with amplitude error, phase error, and baseline error. We simulated a four-channel SAR system, and the system parameters are shown in Table 1. The trajectory of the flight platform is a straight line. Set a point target in the observation scene for imaging. Every real channel spacing between two adjacent channels is d = 1 m. The measured channel spacing is set as d ˜ = 0.9 m with 10 % baseline error. The amplitude error multiples of the four channels are set as 1, 0.8, 1.2, and 1.5 times, respectively. The channel phase errors are set as 0 , 10 , 60 , and 20 , respectively, as listed in Table 2.
In order to analyze the influence of different errors on reconstruction, we perform three sets reconstruction experiments with only one type of error, and one set of reconstruction experiments when there are multiple types of errors at the same time. These experiments include amplitude, phase, and baseline errors, respectively. For convenience, the amplitude error, phase error, and baseline error are called AE, PE, and LE, respectively.
Figure 5 shows the reconstruction results with different errors by using IDR. In the figure, “AE” or “PE” or “LE” means that there is only one type of error. “AE, PE, LE” means that there are three kinds of errors at the same time. The reconstruction is performed without channel error calibration. It can be seen that each error will degrade the performance of the reconstruction resulting in azimuth ambiguity. When there are AE, PE, and LE at the same time, the azimuth ambiguity is the most serious.
Figure 6 shows the contour plots of the point target with different errors, which are reconstructed by IDR. It can be seen that the phase error will increase the target sidelobe level in azimuth, which seriously degrades the imaging performance. When there are multiple errors at the same time, the performance of the imaging result is worse.
Then, the proposed method SILAMER is used to perform the reconstruction with different errors. Table 3 shows the image quality indicators by IDR and SILAMER with different errors. When the error type is “NE”, it means that there is no error. When the error type is “AE” or “PE” or “LE”, it means that there is only one type of error. When the error type is “AE, PE, LE”, it means that there are three kinds of error at the same time. The image quality indicators shows that using SILAMER for different types of errors can get similar favorable reconstruction.
Figure 7 displays the reconstruction results when there is no error. It shows that IDR and SILAMER can both obtain the unambiguous reconstruction image.
Figure 8 displays the reconstruction results when there are amplitude, phase, and baseline errors at the same time. Figure 8a shows the reconstruction result of the point target by using IDR. The IDR performs well when there is no error, but its reconstruction performance is severely degraded when there are baseline, amplitude, and phase errors. By performing the proposed adaptive reconstruction method, the unambiguous reconstruction results are shown in Figure 8b, from which one can see that the azimuth ambiguities are suppressed. When using SILAMER, the initial value of the reconstruction coefficient is calculated by using the measured channel spacing d ˜ , and the initial value of the compensation phase is set as zero. The area used for estimation is 5 m × 1600 m, and the final reconstruction image is 50 m × 1600 m. The estimated compensation phases are 0 . 34 , 9 . 77 , 59 . 96 , 19 . 66 . Figure 8c,d show the contour plot of the target by IDR and SILAMER. It can be obviously seen from (a) and (c) that the errors not only result in the image ambiguity but also increase the target sidelobe level in azimuth. SILAMER can also suppress the sidelobe level improving the imaging quality, as shown in (d). Figure 8e,f show the comparison results of the point target profile in range and azimuth, respectively. They indicate that the errors seriously affect the imaging of target in azimuth, and do not affect the imaging in range. By using the proposed method, the performance of the sidelobe level of the point target is significantly suppressed.
In Table 3, image entropy, azimuth resolution, azimuth peak sidelobe ratio (PSLR), azimuth integrated sidelobe ratio (ISLR), and azimuth ambiguity-to-signal ratio (AASR) of the target are listed. It can be seen that the image entropy and AASR of SILAMER are lower than those of IDR. This shows that the image quality of SILAMER is better. The azimuth resolution of SILAMER is a little larger than that of IDR. This is because the proposed algorithm can suppress the side lobes, which causes the main lobe to widen. Combined with Figure 8f, we can find that the SILAMER method reduces the amplitude of the side lobes while broadening the main lobe a little. According to the peak sidelobe ratio (PSLR) and integrated sidelobe ratio (ISLR), it also shows that compared with IDR, the proposed method suppresses side lobes.
Then, the convergence speed of the proposed method is evaluated. Figure 9 shows the image entropy of the reconstruction result with different errors after each iteration. The image entropy of reconstruction with amplitude or baseline errors converges faster. Since the initial entropy of reconstruction with three kinds of errors is large and multiple errors need to be corrected at the same time, its convergence speed is slower. In general, after several iterations, the image entropy tends to the minimum.
In addition, we study the adaptability of the proposed method for a particular kind of baseline error. When each channel spacing between two adjacent channels is not equal to the same value d = 1 m, each channel interval is set as a random variable that has the uniform distribution on the interval [ 0.9 , 1.1 ] . Every measured channel spacing is d ˜ = 1 m. Figure 10 shows the reconstruction results by using IDR and SILAMER, respectively. According to the reconstruction theory [19], the signal processed by the IDR is a periodically non-uniformly sampled signal in the azimuth, where every channel spacing of the system is equal. When each channel spacing between two adjacent channels is not equal to the same value, the reconstruction coefficient cannot be calculated according to the reconstruction theory. Figure 10a shows the result by IDR, which cannot suppress ambiguity. Then, SILAMER is utilized for reconstruction. The initial value of the reconstruction coefficient for estimation is obtained according to the measured channel spacing d ˜ . The initial value of the compensation phase is set as zero. The ambiguity is suppressed well, as shown in Figure 10b. This is because SILAMER uses image entropy as the evaluation criterion to adaptively estimate the reconstruction coefficient and the compensation phase. In practice, when the complex multichannel system contains unknown error sources, the proposed algorithm may still perform a good reconstruction. The proposed method has favorable adaptability to the practical HRWS SAR system.

4.2. Equivalent Multichannel SAR Data Experiment

In order to further verify that the proposed algorithm is effective for real SAR data, an equivalent four-channel periodic non-uniformly sampled SAR data, which is obtained by down-sampling single-channel stripmap SAR data [19], is used for this experiment. The PRF of each channel is 500 and the main parameters of this equivalent experiment are listed in Table 4. In this equivalent multichannel SAR, the measured antenna spacing has a baseline error of 10 % . The amplitude and phase errors shown in Table 2 are added to the multichannel. The observation scene contains 2000 pixels in range and 3000 pixels in azimuth. The reconstruction result obtained by the IDR method is shown in Figure 11a, which suffers from the azimuth ambiguity. Then, the proposed method is used to estimate the reconstruction coefficient and compensation phase. As a local scene containing 50 × 3000 pixels is used for estimation, it greatly improves the estimation efficiency compared with using the whole scene for estimation. The reconstruct result is shown in Figure 11b. Compared to Figure 11a, it is obvious that ambiguity can be suppressed well. In addition, Figure 12 shows the azimuth profile of reconstruction image marked by the green line in Figure 11 by using IDR and SILAMER, from which one can see that the ambiguity components are completely suppressed by using SILAMER. Consequently, the effectiveness of the proposed method is verified by the processing results of the equivalent multichannel SAR data.

5. Discussion

In this section, we discuss two additional advantages of the proposed method. It can perform well under the condition of low SNR and is suitable for the curved trajectory SAR reconstruction.

5.1. Performance under Different SNR

Figure 13 shows the relationship between the image entropy of the reconstruction and the signal-to-noise ratio (SNR) after range compression, and the relationship between the AASR and SNR. It can be seen that the proposed method can suppress azimuth ambiguity well under different SNR. This is because the proposed method is to reconstruct in the image domain and the sub-image are used as input for the estimation, where the echo signal is used for azimuth filtering to obtain the sub-images. Compared with the algorithm that directly uses the echo signal for estimation, the SNR of the echo signal has a smaller effect on the proposed method. Some conventional subspace-based reconstruction methods perform eigenvalue decomposition of the covariance matrix, which may suffer from the signal leakage phenomenon and are influenced by the noise component under low SNR case, degrading reconstruction performance [4]. For the proposed method, when SNR is 0dB, the image entropy and AASR value increase slightly. This is due to the increased noise floor of the reconstructed result. Figure 14 shows the azimuth profile of the reconstructed result by SILAMER with different SNR. It indicates that even under low SNR conditions, the ambiguity is completely submerged in the noise and can also be suppressed well.

5.2. Simulated Multichannel SAR with the Curved Trajectory

To validate the effectiveness of the proposed method for the curved trajectory SAR, the curved trajectory HRWS SAR simulations with the distributed scene are conducted. The gray amplitude of a radar image is used to be the input radar cross section in echo generation. The size of the observation scene is 1000 m × 5000 m. The azimuth pixels of the image are 5000 and the range pixels are 1000. The scene is a seaport, it involves the land and sea. The flight trajectory of the platform is shown in Figure 15. It only deviates in height direction compared with the linear trajectory, which has a greater impact on imaging. This is a sinusoidal curve with an amplitude of 1 m in the height direction. As the curvature of the curved trajectory is small, that is, the instantaneous turning radius of the flight platform is large, EPCs can be approximately distributed on the curved trajectory. The system parameters are the same as the simulation for linear flight trajectory shown in Table 1. We assume that every measured channel spacing is d ˜ = 0.9 m with 10 % error. The amplitude and phase errors are the same as the point target experiments, as shown in Table 2.
Figure 16a shows the reconstruction result without errors, where four targets are selected and marked by yellow boxes for analysis. Figure 16b displays the reconstruction result by using IDR, where the multichannel system contains amplitude, phase, and baseline errors. Obviously, it can be seen that the ambiguity components are very noticeable. Then, the proposed method is used for unambiguous reconstruction. In the processing, the estimation algorithm is used to estimate the optimal reconstruction coefficient and compensation phase by using the full scene of the sub-images. After that, the sub-images are weighted by the estimated reconstruction coefficient and corrected by the compensation phase to obtain the reconstruction result shown in Figure 16c. The ambiguity components for the strong scatters are invisible across the whole imaging scene, which indicates that they have been suppressed well. In addition, the urban area of the imaging result in (c) is clearer than that in (b). Figure 16d is shown the reconstruction result by using the local area of the sub-images. The local area 100 m × 5000 m of the sub-images is used as the input of the estimation algorithm. The reconstruction performance is the same as Figure 16c.
Figure 17 shows the azimuth profile of reconstruction results of the targets in region A in Figure 16 by using IDR and SILAMER, from which one can see that the ambiguity components are completely suppressed by using SILAMER, and the reconstruction performance by using different sub-image sizes is the same. Thus, we prove that the proposed method has good reconstruction performance for curved trajectory HRWS SAR. In addition, the times of the estimation algorithm by using different sub-image sizes are shown in Table 5. It indicates that the estimation algorithm by using local area sub-images greatly improves the efficiency. The same entropy of reconstructed images using different sub-image sizes indicates that their image quality is the same.

6. Conclusions

In this paper, a novel sub-image local area minimum entropy reconstruction method is proposed for the multichannel HRWS SAR systems with amplitude, phase, and baseline errors. For the proposed method, we first generate the sub-images by utilizing the back-projection algorithm. Then, we proposed an estimation algorithm to obtain the optimal reconstruction coefficient and the compensation phase. It is worth noting that if the estimation algorithm uses the whole scene of the sub-image as the input, it suffers from a heavy computational burden. It greatly improves the estimation efficiency by using a local area of the sub-image as the input of the estimation. Finally, the sub-images are weighted by the estimated reconstruction coefficient and corrected by the compensation phase to obtain the unambiguous reconstructed image.
The proposed method can simultaneously correct amplitude error, baseline error, and phase error by using the estimated reconstruction coefficient and the compensation phase. Moreover, since the proposed method performs the reconstruction based on sub-image local area minimum entropy, it has the favorable adaptability to the multichannel SAR system with various errors. In addition, there are two other advantages of the proposed method. One of the advantages is that the proposed method can perform well under the condition of low SNR, because it is to reconstruct in the image domain and performs minimum entropy estimation utilizing sub-images. The other is that the proposed method can perform the curved trajectory HRWS SAR reconstruction. This is because the motion error of the platform is compensated in the sub-images imaging by using the back-projection algorithm. The simulation results and the equivalent multichannel SAR data processing generated from an airplane SAR system verify the effectiveness of the proposed method.
In addition, there is still some work to be done in the future, such as studying the highly squinted HRWS SAR reconstruction and considering the challenge of reconstruction for more complex maneuvering trajectories SAR.

Author Contributions

All the authors contributed extensively to the preparation of this manuscript. L.Z. and X.Z. (Xiaoling Zhang) conceived the methods and performed the experiments; L.P. and X.Z. (Xu Zhan) provided support for the experiment and offered suggestions on revision; T.Z. provided suggestions for modification; J.S. and S.W. supervised the research and commented on the manuscript; and L.Z. wrote the paper. All authors have read and agreed to the published version of the manuscript.

Funding

This work was supported in part by the National Key R&D Program of China under Grant No. 2017YFB0502700, and in part by the National Natural Science Foundation of China under Grant No.61671113, 61501098, and 61571099.

Institutional Review Board Statement

Not applicable.

Informed Consent Statement

Not applicable.

Data Availability Statement

No new data were created or analyzed in this study. Data sharing is not applicable to this article.

Acknowledgments

We thank anonymous reviewers for their comments towards improving this manuscript.

Conflicts of Interest

The authors declare no conflict of interest.

References

  1. Sakar, N.; Rodriguez-Cassola, M.; Prats-Iraola, P.; Moreira, A. Azimuth Reconstruction Algorithm for Multistatic SAR Formations with Large Along-Track Baselines. IEEE Trans. Geosci. Remote Sens. 2020, 58, 1931–1940. [Google Scholar] [CrossRef]
  2. Liang, D.; Wang, R.; Deng, Y.; Fan, H.; Zhang, H.; Zhang, L.; Wang, W.; Zhou, Y. A Channel Calibration Method Based on Weighted Backprojection Algorithm for Multichannel SAR Imaging. IEEE Geosci. Remote Sens. Lett. 2019, 16, 1254–1258. [Google Scholar] [CrossRef]
  3. Wang, Y.; Liu, Y.; Li, Z.; Suo, Z.; Fang, C.; Chen, J. High-Resolution Wide-Swath Imaging of Spaceborne Multichannel Bistatic SAR with Inclined Geosynchronous Illuminator. IEEE Geoence Remote Sens. Lett. 2017, 14, 2380–2384. [Google Scholar] [CrossRef]
  4. Zhang, L.; Gao, Y.; Liu, X. Robust Channel Phase Error Calibration Algorithm for Multichannel High-Resolution and Wide-Swath SAR Imaging. IEEE Geosci. Remote Sens. Lett. 2017, 14, 649–653. [Google Scholar] [CrossRef]
  5. Shang, M.; Qiu, X.; Han, B.; Ding, C.; Hu, Y. Channel Imbalances and Along-Track Baseline Estimation for the GF-3 Azimuth Multichannel Mode. Remote Sens. 2019, 11, 1297. [Google Scholar] [CrossRef] [Green Version]
  6. Wu, J.; Sun, Z.; An, H.; Qu, J.; Yang, J. Azimuth signal multichannel reconstruction and channel configuration design for geosynchronous spaceborne–airborne bistatic SAR. IEEE Trans. Geosci. Remote Sens. 2018, 57, 1861–1872. [Google Scholar] [CrossRef]
  7. Jin, T.; Qiu, X.; Hu, D.; Ding, C. An ML-Based Radial Velocity Estimation Algorithm for Moving Targets in Spaceborne High-Resolution and Wide-Swath SAR Systems. Remote Sens. 2017, 9, 404. [Google Scholar] [CrossRef] [Green Version]
  8. Zhang, T.; Zhang, X.; Shi, J.; Wei, S. Depthwise Separable Convolution Neural Network for High-Speed SAR Ship Detection. Remote Sens. 2019, 11, 2483. [Google Scholar] [CrossRef] [Green Version]
  9. Krieger, G.; Gebert, N.; Moreira, A. Unambiguous SAR signal reconstruction from nonuniform displaced phase center sampling. IEEE Geosci. Remote Sens. Lett. 2004, 1, 260–264. [Google Scholar] [CrossRef] [Green Version]
  10. Zhao, S.; Wang, R.; Deng, Y.; Zhang, Z.; Li, N.; Guo, L.; Wang, W. Modifications on Multichannel Reconstruction Algorithm for SAR Processing Based on Periodic Nonuniform Sampling Theory and Nonuniform Fast Fourier Transform. IEEE J. Sel. Top. Appl. Earth Obs. Remote Sens. 2015, 8, 4998–5006. [Google Scholar] [CrossRef]
  11. Gebert, N.; Krieger, G.; Moreira, A. Digital Beamforming on Receive: Techniques and Optimization Strategies for High-Resolution Wide-Swath SAR Imaging. IEEE Trans. Aerosp. Electron. Syst. 2009, 45, 564–592. [Google Scholar] [CrossRef] [Green Version]
  12. Li, Z.; Wang, H.; Su, T.; Bao, Z. Generation of wide-swath and high-resolution SAR images from multichannel small spaceborne SAR systems. IEEE Geosci. Remote Sens. Lett. 2005, 2, 82–86. [Google Scholar] [CrossRef]
  13. Yang, T.; Li, Z.; Suo, Z.; Liu, Y.; Bao, Z. Performance analysis for multichannel HRWS SAR systems based on STAP approach. IEEE Geosci. Remote Sens. Lett. 2013, 10, 1409–1413. [Google Scholar] [CrossRef]
  14. Zeng, T.; Li, Y.; Ding, Z.; Long, T.; Yao, D.; Sun, Y. Subaperture Approach Based on Azimuth-Dependent Range Cell Migration Correction and Azimuth Focusing Parameter Equalization for Maneuvering High-Squint-Mode SAR. IEEE Trans. Geosci. Remote Sens. 2015, 53, 6718–6734. [Google Scholar] [CrossRef]
  15. Li, Z.; Xing, M.; Liang, Y.; Gao, Y.; Chen, J.; Huai, Y.; Zeng, L.; Sun, G.; Bao, Z. A Frequency-Domain Imaging Algorithm for Highly Squinted SAR Mounted on Maneuvering Platforms with Nonlinear Trajectory. IEEE Trans. Geosci. Remote Sens. 2016, 54, 4023–4038. [Google Scholar] [CrossRef]
  16. Li, Z.; Yi, L.; Xing, M.; Huai, Y.; Gao, Y.; Zeng, L.; Zheng, B. An Improved Range Model and Omega-K-Based Imaging Algorithm for High-Squint SAR with Curved Trajectory and Constant Acceleration. IEEE Geosci. Remote Sens. Lett. 2016, 13, 656–660. [Google Scholar] [CrossRef]
  17. Zhou, R.; Sun, J.; Hu, Y.; Qi, Y. Multichannel high resolution wide swath SAR imaging for hypersonic air vehicle with curved trajectory. Sensors 2018, 18, 411. [Google Scholar] [CrossRef] [Green Version]
  18. Bie, B.; Sun, G.; Xia, X.; Xing, M.; Guo, L.; Bao, Z. High-Speed Maneuvering Platforms Squint Beam-Steering SAR Imaging without Subaperture. IEEE Trans. Geosci. Remote Sens. 2019, 57, 6974–6985. [Google Scholar] [CrossRef]
  19. Zhou, L.; Zhang, X.; Wang, Y.; Li, L.; Pu, L.; Shi, J.; Wei, S. Unambiguous Reconstruction for Multichannel Nonuniform Sampling SAR Signal Based on Image Fusion. IEEE Access 2020, 8, 71558–71571. [Google Scholar] [CrossRef]
  20. Zhang, S.X.; Xing, M.D.; Xia, X.G.; Liu, Y.Y.; Guo, R.; Bao, Z. A Robust Channel-Calibration Algorithm for Multi-Channel in Azimuth HRWS SAR Imaging Based on Local Maximum-Likelihood Weighted Minimum Entropy. IEEE Trans. Image Process. 2013, 22, 5294–5305. [Google Scholar] [CrossRef]
  21. Huang, H.; Huang, P.; Liu, X.; Xia, X.G.; Deng, Y.; Fan, H.; Liao, G. A Novel Channel Errors Calibration Algorithm for Multichannel High-Resolution and Wide-Swath SAR Imaging. IEEE Trans. Geosci. Remote Sens. 2021, 1–19. [Google Scholar] [CrossRef]
  22. Li, Z.; Bao, Z.; Wang, H.; Liao, G. Performance improvement for constellation SAR using signal processing techniques. IEEE Trans. Aerosp. Electron. Syst. 2006, 42, 436–452. [Google Scholar]
  23. Guo, X.; Gao, Y.; Liu, X. Azimuth-Variant Phase Error Calibration Technique for Multichannel SAR Systems. IEEE Geosci. Remote Sens. Lett. 2017, 14, 1383–1387. [Google Scholar] [CrossRef]
  24. Feng, J.; Gao, C.; Zhang, Y.; Wang, R. Phase Mismatch Calibration of the Multichannel SAR Based on Azimuth Cross Correlation. IEEE Geosci. Remote Sens. Lett. 2013, 10, 903–907. [Google Scholar] [CrossRef]
  25. Liu, Y.; Li, Z.; Wang, Z.; Bao, Z. On the Baseband Doppler Centroid Estimation for Multichannel HRWS SAR Imaging. IEEE Geosci. Remote Sens. Lett. 2014, 11, 2050–2054. [Google Scholar] [CrossRef]
  26. Yang, T.; Li, Z.; Liu, Y.; Bao, Z. Channel Error Estimation Methods for Multichannel SAR Systems in Azimuth. IEEE Geosci. Remote Sens. Lett. 2013, 10, 548–552. [Google Scholar] [CrossRef]
  27. Huang, P.; Xia, X.G.; Liu, X.; Jiang, X.; Chen, J.; Liu, Y. A novel baseline estimation method for multichannel HRSW SAR system. IEEE Geosci. Remote Sens. Lett. 2019, 16, 1829–1833. [Google Scholar] [CrossRef]
  28. Suchandt, S.; Runge, H.; Breit, H.; Steinbrecher, U.; Kotenkov, A.; Balss, U. Automatic Extraction of Traffic Flows Using TerraSAR-X Along-Track Interferometry. IEEE Trans. Geosci. Remote Sens. 2010, 48, 807–819. [Google Scholar] [CrossRef]
  29. Liu, B.; Wang, T.; Li, Y.; Shen, F.; Bao, Z. Effects of Doppler Aliasing on Baseline Estimation in Multichannel SAR-GMTI and Solutions to Address These Effects. IEEE Trans. Geoence Remote Sens. 2014, 52, 6471–6487. [Google Scholar] [CrossRef]
  30. Wang, C.; Liao, G.; Zhang, Q. First Spaceborne SAR-GMTI Experimental Results for the Chinese Gaofen-3 Dual-Channel SAR Sensor. Sensors 2017, 17, 2683. [Google Scholar] [CrossRef] [PubMed] [Green Version]
  31. Gierull, C.H. Digital Channel Balancing of Along-Track Interferometric SAR Data; Defence R & D Canada: Ottawa, ON, Canada, 2003. [Google Scholar]
  32. Chen, Z.Y.; Wang, T.; Ma, N. Accurate baseline estimation for synthetic aperture radar-ground moving target indication systems based on co-registration and median filtering. IET Radar Sonar Navig. 2014, 8, 607–615. [Google Scholar] [CrossRef]
  33. Zhang, S.; Xing, M. A Novel Doppler Chirp Rate and Baseline Estimation Approach in the Time Domain Based on Weighted Local Maximum-Likelihood for an MC-HRWS SAR System. IEEE Geosci. Remote Sens. Lett. 2017, 14, 299–303. [Google Scholar] [CrossRef]
  34. Doerry, A.W.; Bishop, E.E.; Miller, J.A. Basics of Backprojection Algorithm for Processing Synthetic Aperture Radar Images; Report No. SAND2016–1682; Sandia National Laboratory: New Mexico, CA, USA, 2016. [Google Scholar]
  35. Jun, S.; Xiaoling, Z.; Jianyu, Y.; Chen, W. APC Trajectory Design for One-Active Linear-Array Three-Dimensional Imaging SAR. IEEE Trans. Geosci. Remote Sens. 2010, 48, 1470–1486. [Google Scholar] [CrossRef]
  36. Zeng, T.; Wang, R.; Li, F. SAR Image Autofocus Utilizing Minimum-Entropy Criterion. IEEE Geosci. Remote Sens. Lett. 2013, 10, 1552–1556. [Google Scholar] [CrossRef]
  37. Wei, S.; Zhou, L.; Zhang, X.; Shi, J. Fast back-projection autofocus for linear array SAR 3-D imaging via maximum sharpness. In Proceedings of the 2018 IEEE Radar Conference (RadarConf18), Oklahoma City, OK, USA, 23–27 April 2018. [Google Scholar]
Figure 1. The observation geometry of the multichannel SAR system with four channels.
Remotesensing 13 03115 g001
Figure 2. The azimuth sampling pattern for the four-channel SAR system.
Remotesensing 13 03115 g002
Figure 3. The local area estimation method.
Remotesensing 13 03115 g003
Figure 4. The flow of SILAMER.
Remotesensing 13 03115 g004
Figure 5. The azimuth profile of of the reconstruction results with different errors.
Remotesensing 13 03115 g005
Figure 6. The contour plots of the point target with different errors by IDR (by dB scale). (a) with amplitude error; (b) with phase error; (c) with baseline error; (d) with amplitude, phase, and baseline error.
Remotesensing 13 03115 g006
Figure 7. Imaging results of the point target when there is no error (by dB scale). (a) Reconstruction result by IDR; (b) Reconstruction result by SILAMER.
Remotesensing 13 03115 g007
Figure 8. Imaging results of the point target with amplitude, phase, and baseline errors (by dB scale). (a) Reconstruction result by IDR; (b) reconstruction result by SILAMER; (c) contour plot of the target by IDR; (d) contour plot of the target by SILAMER; (e) 12 m range profile of the comparison of IDR and SILAMER; (f) 12 m azimuth profile of the comparison of IDR and SILAMER.
Remotesensing 13 03115 g008
Figure 9. Image entropy after each iteration for the simulated multichannel SAR data.
Remotesensing 13 03115 g009
Figure 10. Imaging results of the point target with nonconstant channel spacing error. (a) Reconstruction result by IDR; (b) reconstruction result by SILAMER.
Remotesensing 13 03115 g010
Figure 11. Reconstruction results of the equivalent multichannel SAR data (by amplitude normalization). (a) Reconstruction by IDR; (b) reconstruction by SILAMER.
Remotesensing 13 03115 g011
Figure 12. The azimuth profile of reconstruction results of the targets in Figure 11 by using IDR and SILAMER.
Remotesensing 13 03115 g012
Figure 13. The relationship between the image quality indicators of the reconstruction and the signal-to-noise ratio (SNR). (a) The relationship between the image entropy and SNR; (b) the relationship between the AASR and SNR.
Remotesensing 13 03115 g013
Figure 14. The azimuth profile of of the reconstructed result by SILAMER with different SNR.
Remotesensing 13 03115 g014
Figure 15. The curved trajectory of the moving platform.
Remotesensing 13 03115 g015
Figure 16. Imaging results of the distributed scene (by amplitude normalization). (a) Reconstruction result without errors; (b) reconstruction result by IDR with errors; (c) reconstruction result by SILAMER with errors (by using the whole scene of the sub-images); (d) reconstruction result by SILAMER with errors (by using the local area of the sub-images).
Remotesensing 13 03115 g016
Figure 17. The azimuth profile of reconstruction results of the targets in Region A in Figure 16 by using IDR and SILAMER.
Remotesensing 13 03115 g017
Table 1. Multichannel SAR simulation parameters.
ParametersValue
Carrier frequency9.6 GHz
Platform velocity1900 m/s
Platform height20 Km
Signal bandwidth150 MHz
Range sampling rata210 MHz
Azimuth bandwith1900 Hz
PRF700 Hz
Number of channels4
Channel spacing1 m
Table 2. Channel amplitude and phase errors.
Channel Number1234
Amplitude Error Multiples10.81.21.5
Phase Errors 0 10 60 20
Table 3. Image quality indicators of the point target.
Error TypeMethodImage EntropyAzimuth ResolutionAzimuth PSLRAzimuth ISLRAASR
NEIDR [19]6.400.92 m−13.27 dB−9.83 dB−53.64 dB
SILAMER (Ours)6.171.08 m−20.10 dB−18.19 dB−52.51 dB
AEIDR [19]6.730.94 m−12.12 dB−9.93 dB−19.34 dB
SILAMER (Ours)6.181.09 m−20.14 dB−18.26 dB−50.51 dB
PEIDR [19]7.550.94 m−10.97 dB−1.08 dB−13.92 dB
SILAMER (Ours)6.181.09 m−20.28 dB−18.35 dB−51.10 dB
LEIDR [19]6.670.91 m−12.65 dB−8.61 dB−24.04 dB
SILAMER (Ours)6.181.09 m−20.06 dB−18.27 dB−50.22 dB
AE, PE, LEIDR [19]8.200.97 m−10.21 dB−5.06 dB−9.66 dB
SILAMER (Ours)6.191.09 m−20.24 dB−18.32 dB−52.85 dB
Table 4. Equivalent multichannel SAR experimental parameters.
ParametersValue
Carrier frequencyKa band
Signal bandwidth900 MHz
PRF500 Hz
Platform velocity200 m/s
Platform height10 Km
Synthetic aperture length2.65 Km
Number of channels4
Table 5. Runtime comparison of the estimation algorithm by using different sub-image sizes.
Sub-Image SizeRuntimeReconstructed Image Entropy
1000 m × 5000 m32,680 s13.7
100 m × 5000 m52 s13.7
Publisher’s Note: MDPI stays neutral with regard to jurisdictional claims in published maps and institutional affiliations.

