
Terrestrial Videogrammetry for Deriving Key Forest Inventory Data: A Case Study in Plantation
by
 ,
,
Yining Lian
1,2,†, 
Zhongke Feng
3,†, 
Yongjian Huai
1,2,*,
Hao Lu
1,2,
Shilin Chen
3 and
Niwen Li
3 1
School of Information Science and Technology, Beijing Forestry University, Beijing 100083, China
2
Engineering Research Center for Forestry-Oriented Intelligent Information Processing, National Forestry and Grassland Administration, Beijing 100083, China
3
Precision Forestry Key Laboratory of Beijing, Beijing Forestry University, Beijing 100083, China
*
Author to whom correspondence should be addressed.
†
These authors contributed equally to this work and should be considered co-first authors.
Remote Sens. 2021, 13(16), 3138; https://0-doi-org.brum.beds.ac.uk/10.3390/rs13163138
Submission received: 27 June 2021
/
Revised: 30 July 2021
/
Accepted: 4 August 2021
/
Published: 8 August 2021
(This article belongs to the Special Issue 3D Reconstruction Based on Remote Sensing Imagery and Lidar Point Cloud)
Abstract
:Computer vision technology has promoted the rapid development of forest observation equipment, and video photography (videogrammetry) has provided new ideas and means for forestry investigation. According to the characteristics of videogrammetry, a spiral observation method is proposed. Meanwhile, a new point cloud data processing method is proposed, which extracts a point cloud at the diameter at breast height (DBH) section and determines the DBH of trees through cylinder fitting and circle fitting, according to the characteristics of the point cloud model and the real situation of occlusion in the sampled area, and then calculates the biomass. Through a large number of experiments, a more effective and relatively high-precision method for DBH extraction is obtained. Compared with the field survey data, the bias% of DBH extracted by videogrammetry was −3.19~2.87%, and the RMSE% was 5.52~7.76%. Compared with the TLS data, the bias% of −4.78~2.38%, and the RMSE% was 5.63~9.87%. The above-ground biomass (AGB) estimates from the videogrammetry showed strong agreement with the reference values with concordance correlation coefficient (CCC) and the RMSE values of 0.97 and 19.8 kg. Meanwhile, the AGB estimate from TLS agrees with the CCC values and the RMSE of 0.97 and 17.23 kg. Videogrammetry is not only cheap, low cost, and fast, but also can be observed in a relatively complex forest environment, with strong anti-interference ability. The experimental results prove that its accuracy is comparable to TLS and photogrammetry. Thus this work is quite valuable in a forest resources survey. We believe that the calculation accuracy of our new method can fully meet the needs of the forest survey.
1. Introduction
Forests are the backbone of terrestrial ecosystems. Scientific research on the monitoring and assessment methods of the quantity, quality, spatial distribution and annual changes in forest resources is the basis for tackling major issues such as global climate change, forestry, ecological environment construction, forest rights reform and trading, forest resources management, and the production of timber and forest byproducts. Individual tree diameter at breast height (DBH), individual tree height, individual tree volume, average stand volume, stand height, and stand density are important forest structure factors [1,2,3]. The measurement of forest structures could directly influence the evaluation of the land quality and forest growth [3,4,5]. Due to unpredictable field observation conditions, it is difficult to reach some plots, and forestry observation faces many challenges. Therefore, portable and efficient measuring equipment and reasonable observation schemes are significantly necessary.
DBH calipers are commonly used tools to measure the DBH of trees in various studies [6,7,8]. It is difficult to accurately find the 1.3 m position each time by manual measurement. This problem can be resolved well by terrestrial photogrammetry [9,10], which can precisely measure the breast height and DBH; in addition, images of a tree can be saved for comparison with the subsequent year’s images. Terrestrial laser scanning (TLS) [11,12] is extremely effective for obtaining tree factors, which is mainly used to obtain three-dimensional (3D) information in forests. The fitness of laser scanning techniques and simple geometric modeling can characterize the structure of trees in a forest environment. It also provides new insights into tree carbon sequestration, growth monitoring, and bioenergy assessments [13]. Besides, TLS can automatically and quickly build precise 3D tree models from point clouds of branches and trunks [14]. Tree DBH, tree height, and tree volume can all be accurately measured and documented with laser technology. Recently, TLS has been proven to be able to obtain high-precision tree attributes, such as high accuracy stem volume and biomass, which are indispensable but cannot be directly measured in forest resource surveys. DBH is the most commonly measured and utilized tree parameter, which is considered to be the most important parameter in forestry [15,16,17,18]. Yao and Lindberg et al. used TLS to extract the DBH values of trees in their study. The root mean square error (RMSE) and the bias of the DBH from Yao’s report estimation was 7.6 cm and 2.4 cm, respectively [19]. The bias of the DBH estimation in Lindberg’s study was 0.2 cm, and the RMSE was 3.8 cm [20]. Marín-Buzón et al. studied the tree crown volumes and discussed the effectiveness of various methods, including Google Maps, TLS, and photogrammetry [21]. In the last decade, the system for precise forest inventory using TLS has become more and more consummated. The 3D point cloud obtained through TLS is dense enough to extract almost all forest factors, and its accuracy has been accepted by researchers [22,23,24]. The system used for forest resources investigation is relatively effective. However, the expense of equipment, the time of data collection, and the processing of point clouds are still the most challenging problems to overcome. So the TLS technology cannot be widely used by all Chinese foresters due to the high cost [24].
Three-dimensional reconstruction is a research hotspot in the field of computer vision and photogrammetry. Its workflow is to convert the projection of objects in the real world into digital forms and then process it with computer methods to obtain information [25,26]. Currently, with the available algorithms and applications, we can utilize close-range photogrammetry to gain the parameters of plot or stand. Compared to traditional methods, close-range photogrammetry has many advantages, such as high convenience, good accuracy, and high sensitivity. Photogrammetry of forest parameters, due to recent advances in structure from motion (SfM) photogrammetry and dense image matching, has become more attractive in recent years, reducing the level of expertise required to obtain dense and accurate 3D point clouds. In most recent studies, a single still camera has been utilized on photogrammetric forest parameters, which is ordinarily handheld or associated with a few frames of a tripod. Under normal circumstances, the observation plot is based on the forest parameters of interest (section area, tree height, tree diameter) to obtain images. In any case, securing numerous pictures, particularly at distinctive levels, requires different shade discharges, which can be time-consuming and difficult. The securing time generally depends on the photographic way, standard, gear (such as central length), and the point cloud zoom strategy utilized. Liu’s study [27] proposed a framework that combines two pole-mounted cameras with an RTK GNSS for ceaseless capturing. Compared with total station measurements, their automatic determination of tree position, height, and DBH achieved RMSEs of 0.16–0.2 m, 2.41–2.51 m, and 0.92–1.13 cm, respectively. Piermattei et al. [28] were taken in scene arrange with a Nikon D800 advanced SLR camera to capture the covering digital terrestrial pictures. They utilized a tripod to guarantee high picture quality. Both of these studies have carried out innovations on the surveyed equipment and recommended the use of lightweight and portable equipment for forest resource surveys. It can be seen that the photogrammetric method solves the problems that TLS equipment is bulky and inconvenient to carry. At the same time, photogrammetry requires an expensive SLR camera for data collection to ensure the quality of the photos. And the long time on field data collection is a shortcoming, which does not satisfy our original intention of saving time in the field survey.
Videogrammetry is a type of close-range photogrammetry. The emergence of this technology has solved the time-consuming problem of photogrammetry in field data collection. By observations of the motion state and spatial position of an object, we can record the object in the form of a video or a sequence of thousands of images [28,29,30,31]. Based on the rule of close-range photogrammetry, we analyzed and processed the recorded data and established a 3D point cloud model to conduct quantitative and qualitative analyses of the characteristics of the objects by obtaining high-precision 3D spatial coordinates of its feature points. At present, the number of researchers applying 3D point cloud models to forestry is increasing.
The purpose of this study is as follows: (1) to propose a method to obtain forest factors by videogrammetry; (2) to obtain the DBH and above-ground biomass (AGB) of trees and compare with the result by ground survey and TLS; (3) to explore the potential for the application of videogrammetry in forest surveys. In order to diminish the taken cost of timberland asset studies while ensuring the accuracy and efficiency of the survey, this study combines photogrammetry with computer vision for proposing a method to obtain forest-mensuration factors through videogrammetry, forming a complete system of forest-mensuration factors. The survey system is a new breakthrough on the forest resource survey method.
2. Materials and Methods
2.1. Study Area
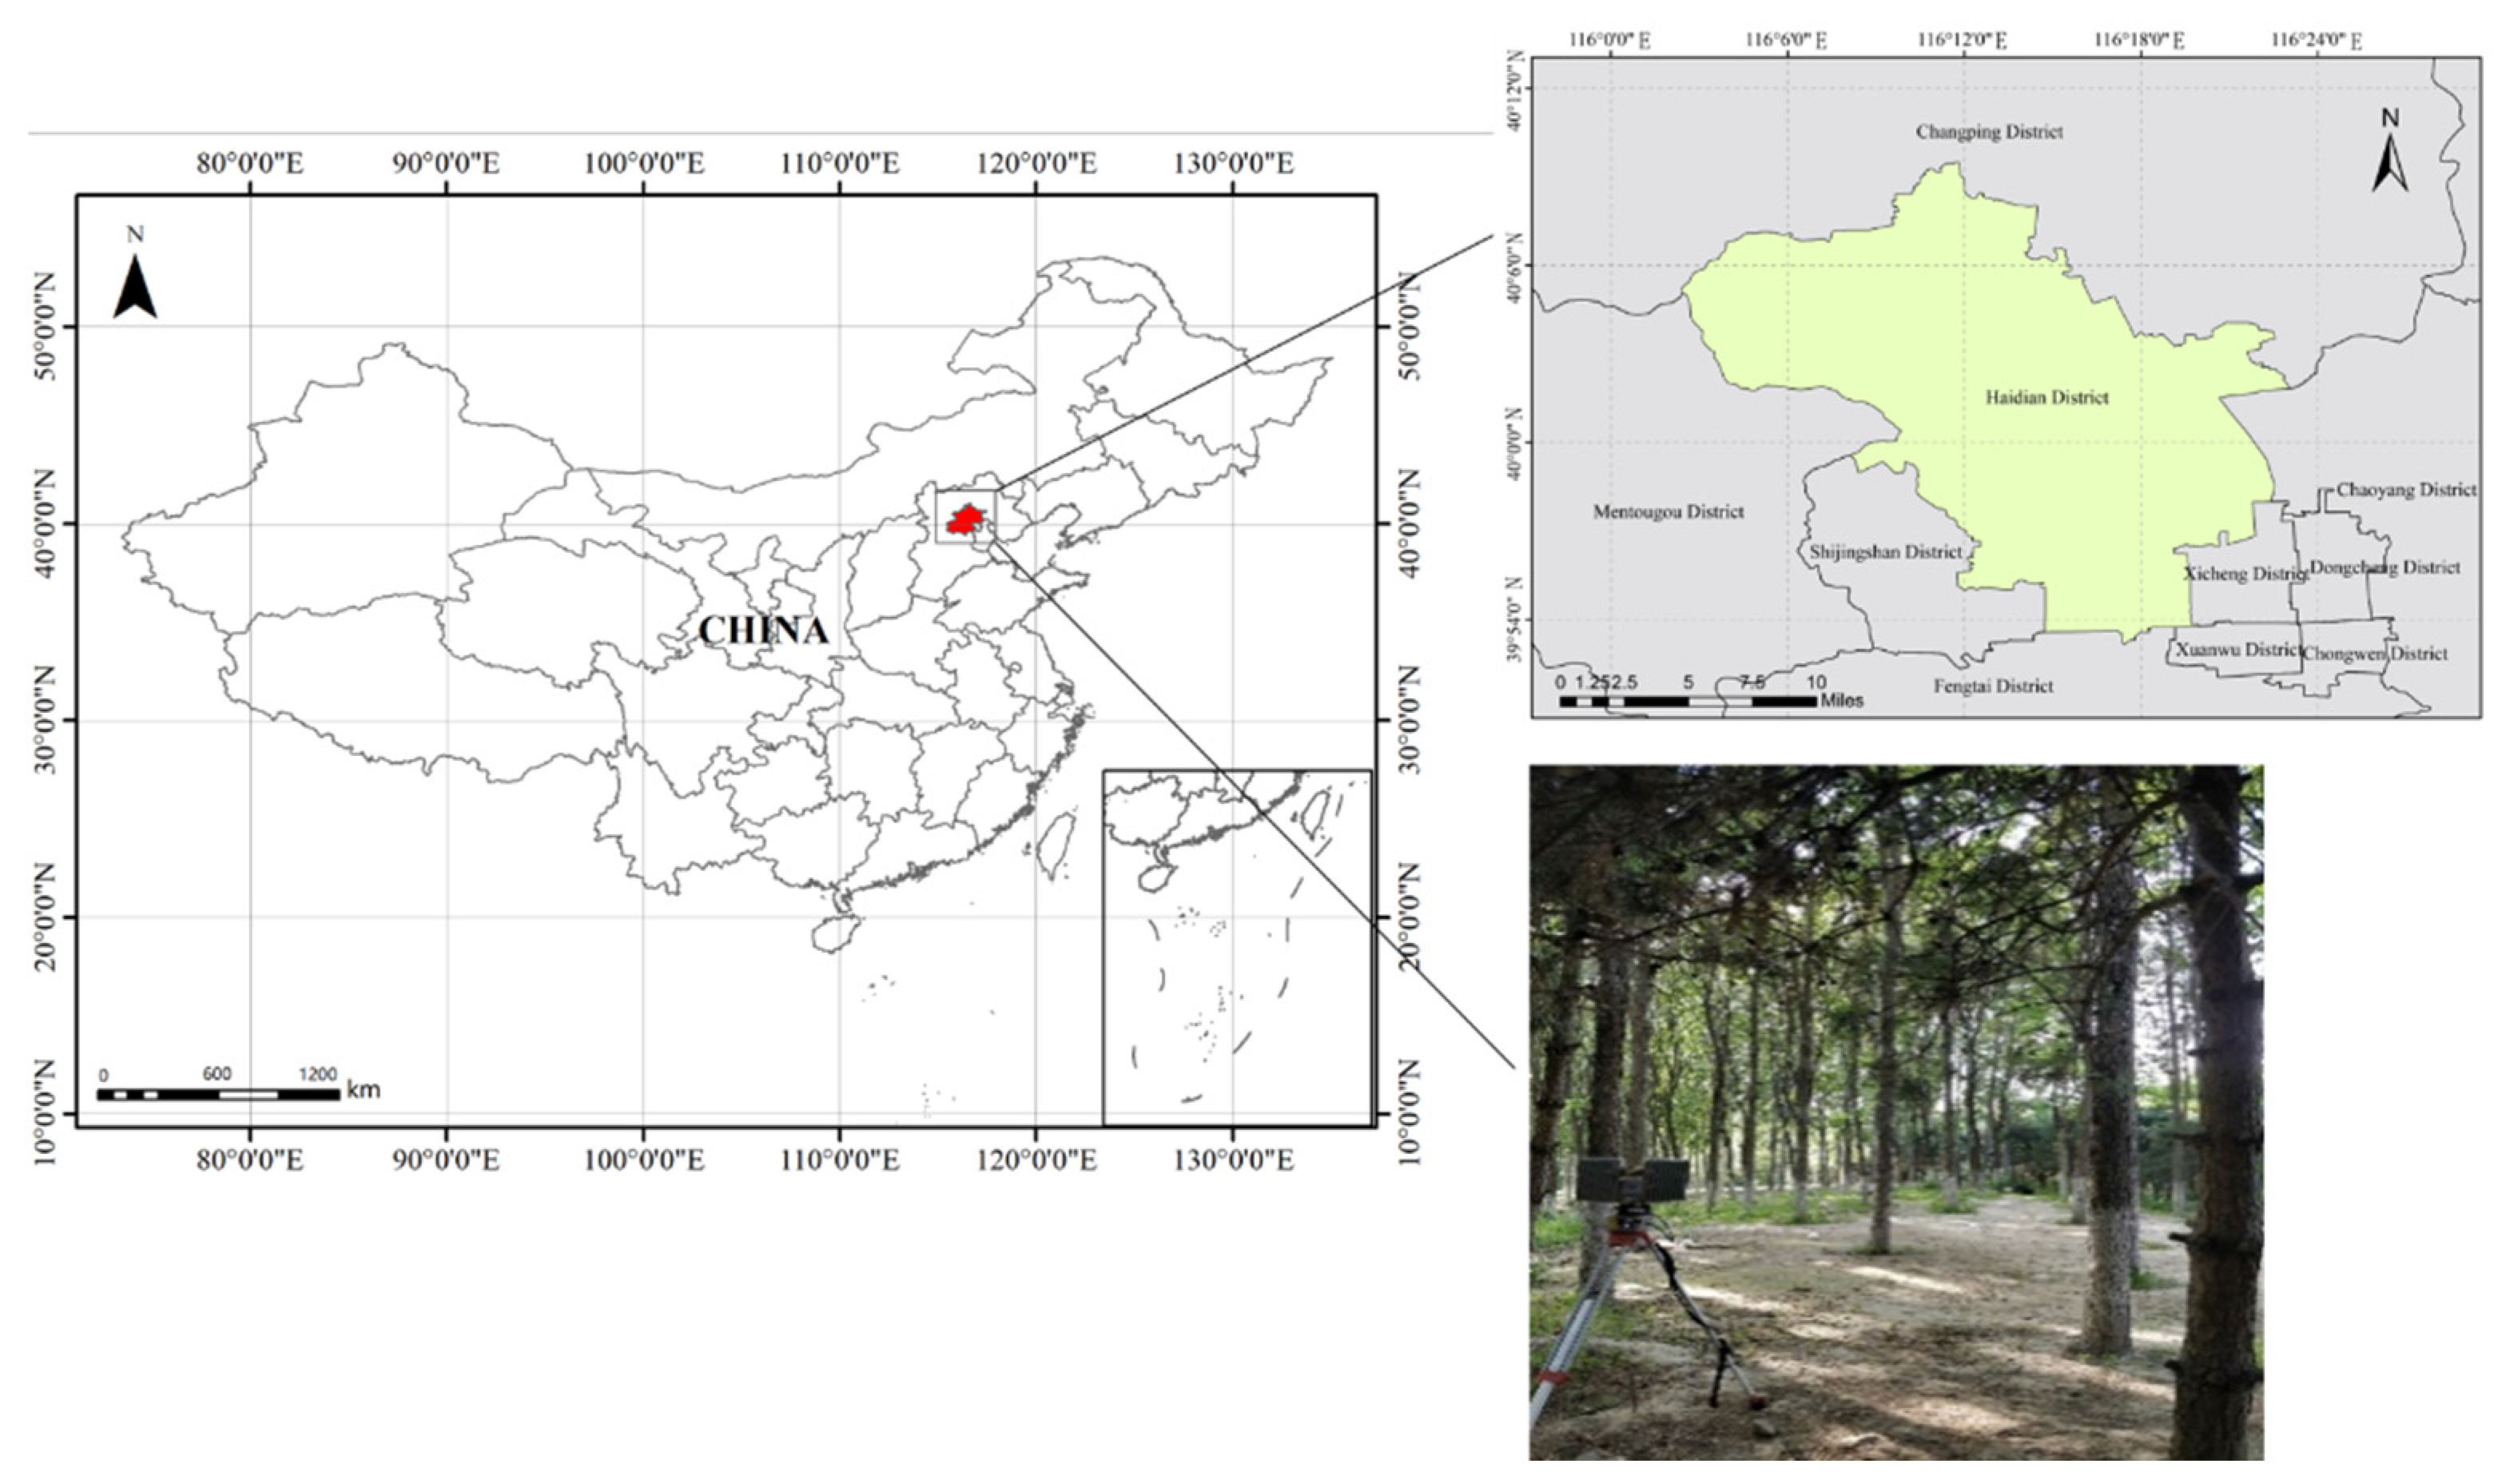
The investigation in this paper was carried out in Beijing’s Bajia Country Park, Haidian District. The geographic coordinates were approximately 40°00′30″N, 116°19′50″E. The study area occurred in a semi humid and semiarid continental monsoon climate, with obvious climate change, hot summers, cold winters, and small precipitation. The main tree species in this area were Sophora japonica, Fraxinus pennsylvanica, and Ginkgo biloba. The understory environment was relatively simple, and there were only a small number of understory herbs without bushes. The planting density of trees in this area was not high, the tree spacing was about 3–6 m, and the number of trees per hectare was about 350. Figure 1 shows the geographical location of the study area and the under-forest condition of the forest sample plot.
2.2. Experimental Instruments
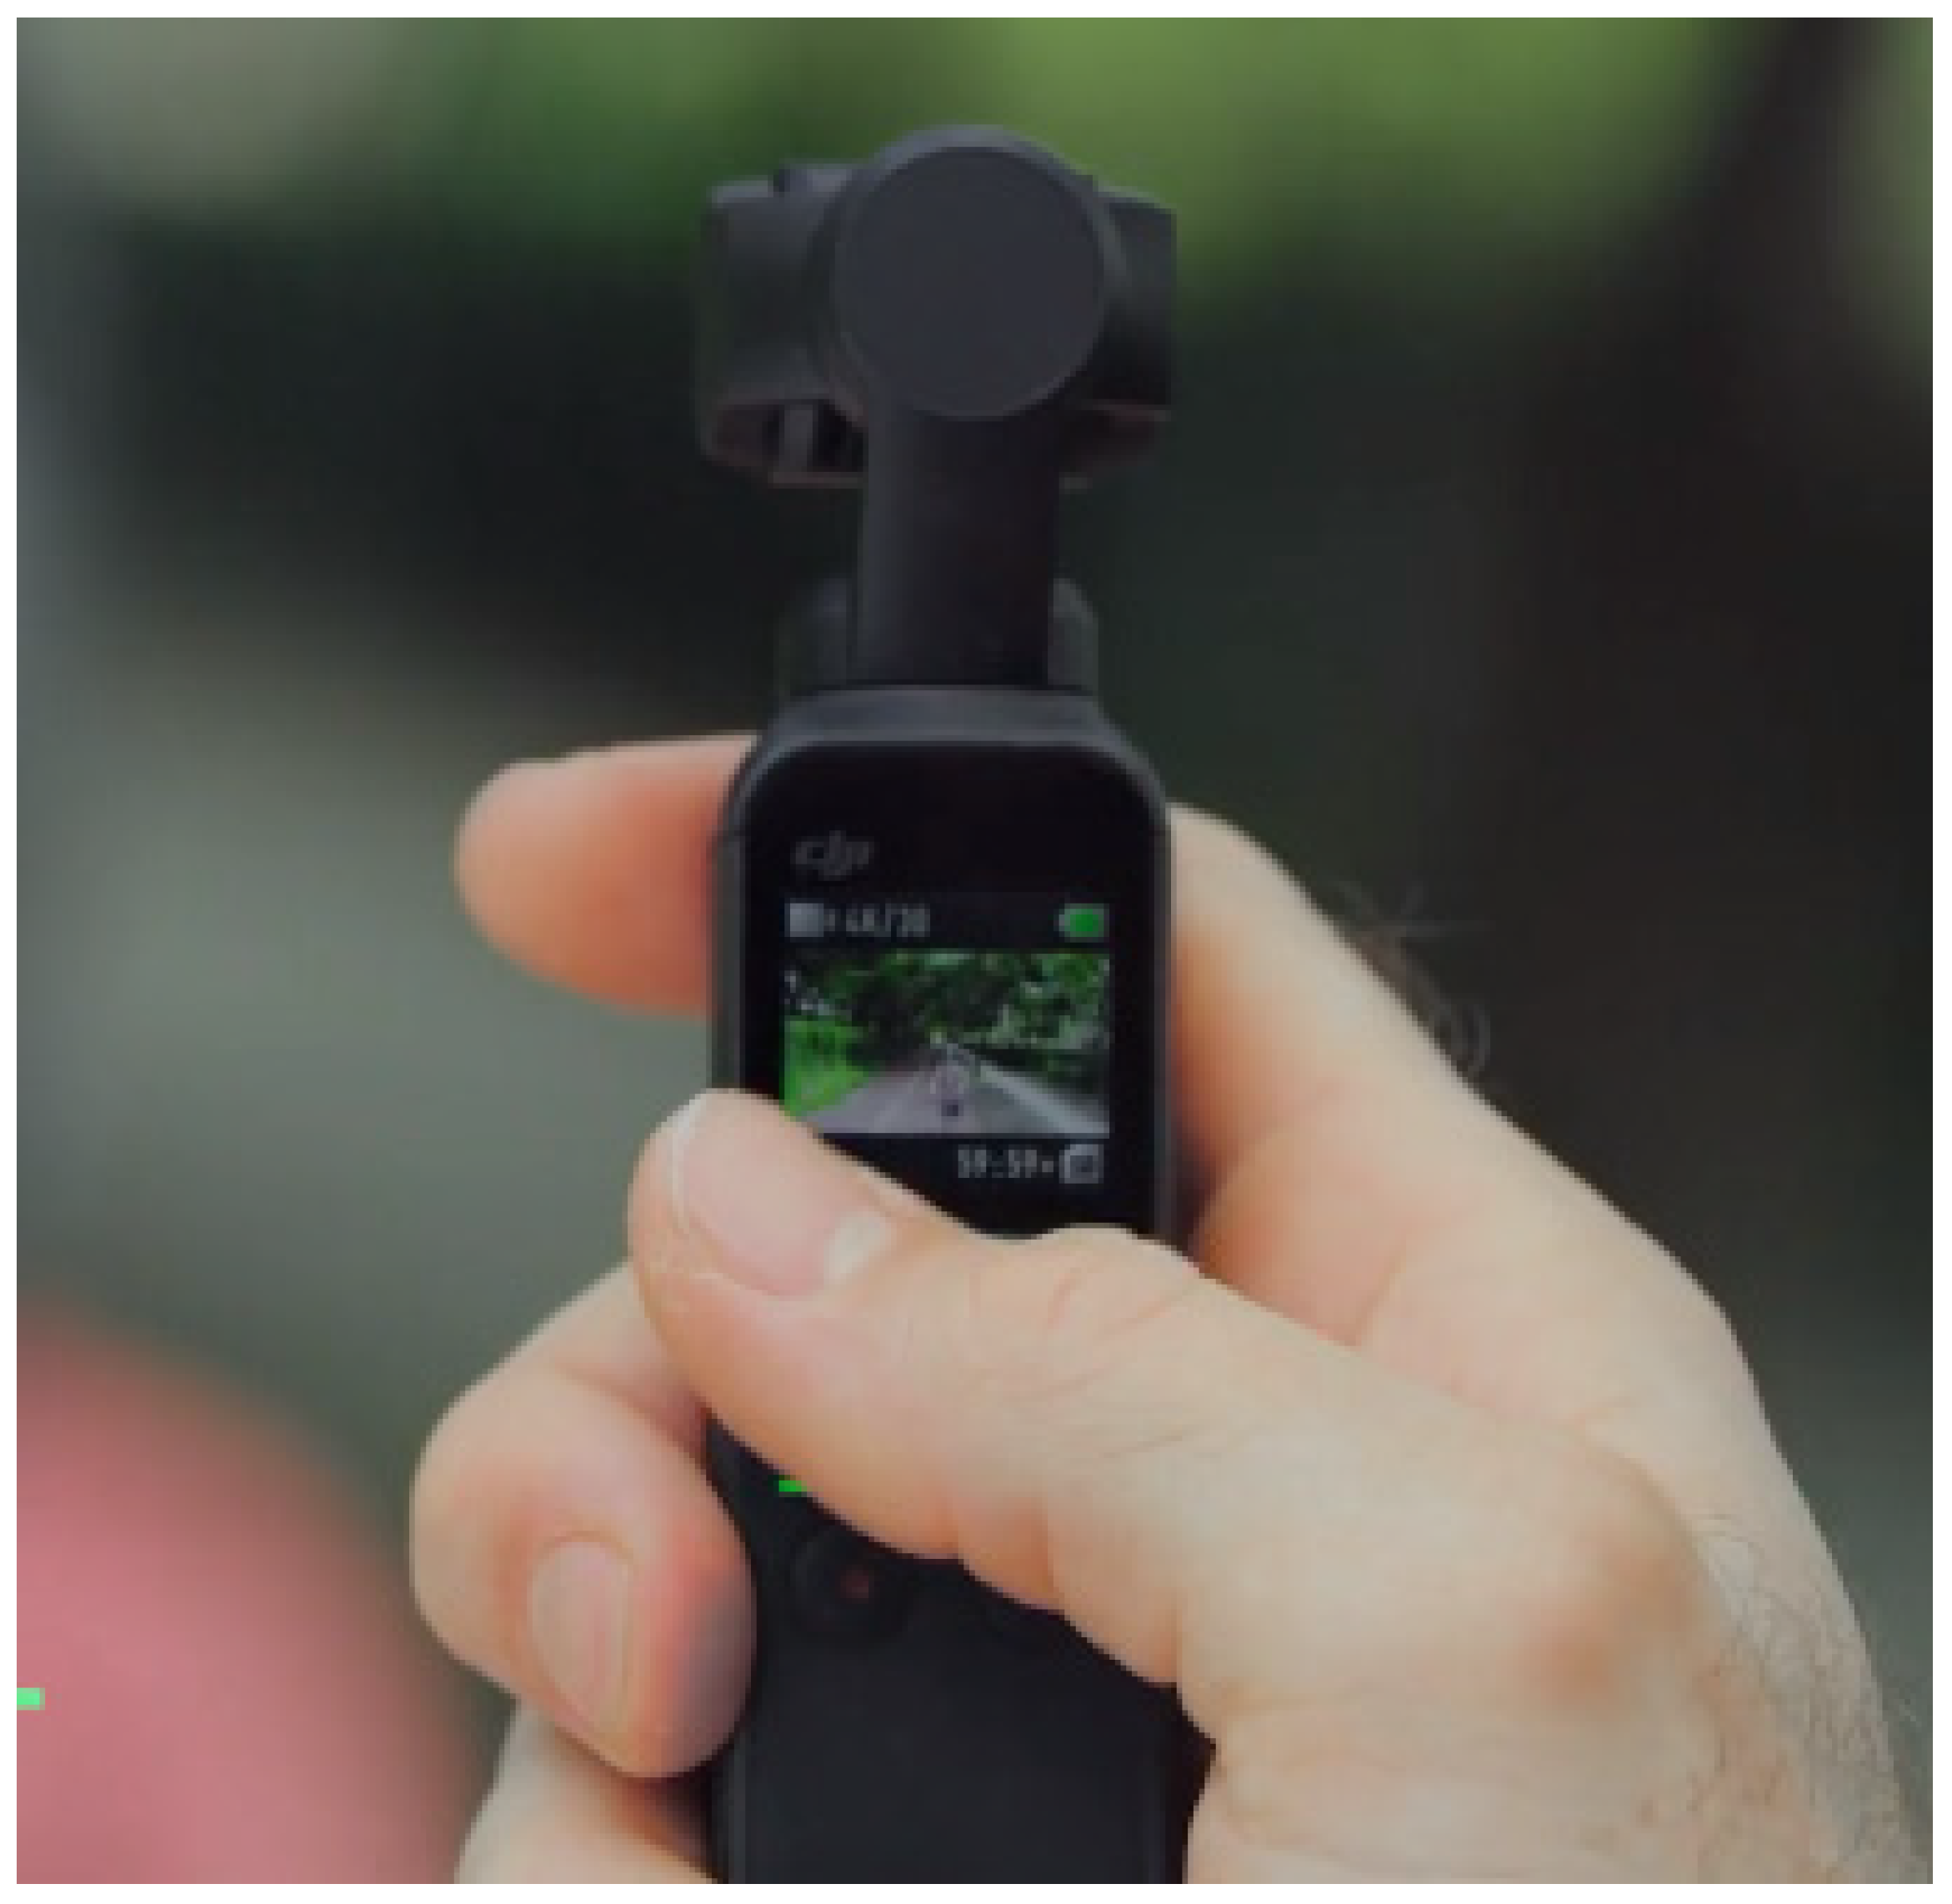
To improve the efficiency and quality of video observations, the stability of the equipment during video shooting must be ensured. We chose the Osmo Pocket for videogrammetry, which was newly released by the SZ DJI Technology Co., Ltd. (Shenzhen, China) and comes with the three-axis mechanical stabilization holder. This smart camera is light and portable, which greatly reduces the consumption of manpower and saves working time. Its appearance (Figure 2.) and some parameters (Table 1) are shown below.
2.3. Study Methods
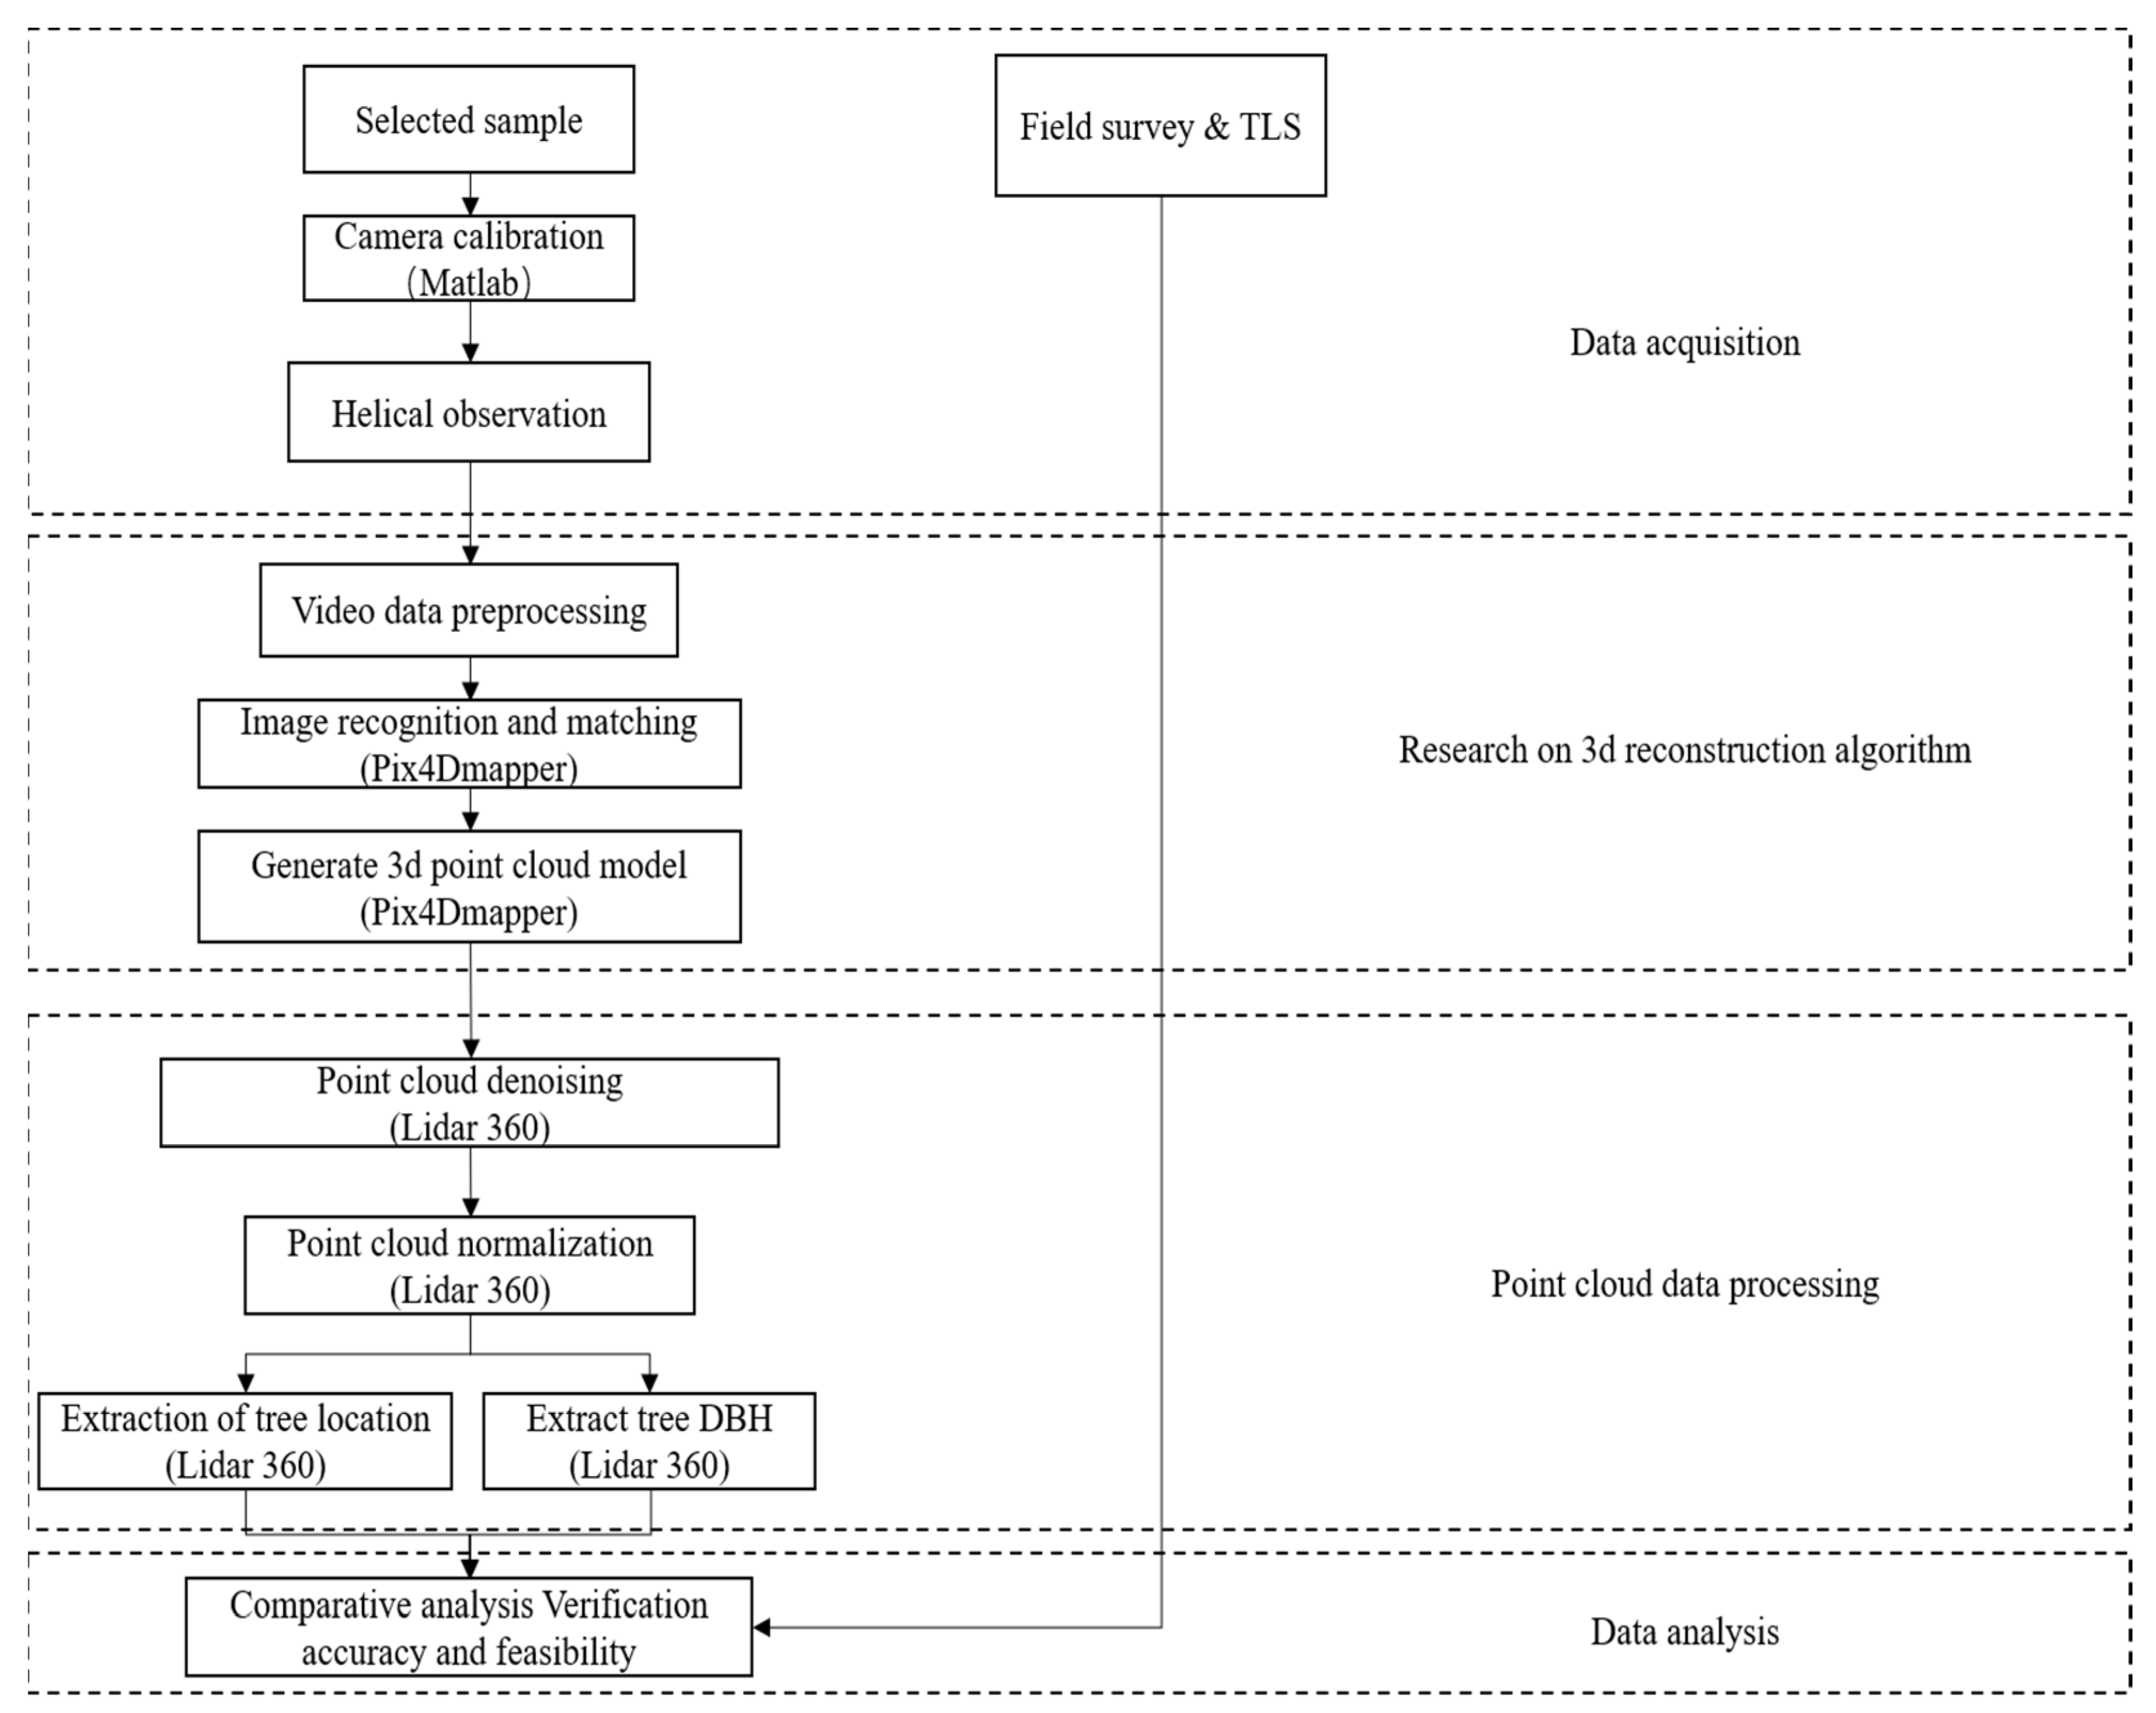
The method comprises three fundamental steps: data collection, data processing, and data analysis. First, the camera utilized to obtain parameters was calibrated to guarantee the exactness of the information preparing and conducted video observations to obtain basic data according to the designed observation scheme. Then, video data were preprocessed to generate 3D point cloud to obtain the DBH and the tree location of the stand used as the sample plot. Finally, the method was compared and analyzed based on the field data and TLS data, which verified the effectiveness and accuracy of the method. The detailed flow chart is shown in Figure 3.
2.4. Acquisition of the Observational Data
In the test area, we selected 10 rectangular samples of 20 m × 20 m for the experiment. After the selection of the sample plot, all the trees with a DBH more than 5 cm within the sample plot were numbered; their DBH values were measured with a DBH ruler, and tree species and location information were recorded at the same time.
2.4.1. Spiral Collection of Video Data
We tried a few strategies of navigating a forest plot and captured a steady and complete video path in the process. When observing the forest samples, we proposed a spiral observation method to finally acquire the video data. The spiral curve as a route is shown in Figure 4. We chose the HD resolution of 4K 30 p to capture every detail of the samples and to guarantee the accuracy of the point cloud restoration. Before shooting, we placed a standard measuring rod next to the most central tree in the sample field for scale reference. In the process of shooting, our handheld device was kept in front of chest about 1.4 m and moved slowly. The center of the lens pointed to the most central tree at all times to ensure the overlap of the photos when the images were matched.
When shooting the video, four key factors need to be considered. (1) The sample size needs to be determined. In the shooting process, if the observed sample area is small, the data quality of the final generated point cloud is high; if the observed sample area is large, the density of the point clouds will be reduced, resulting in low accuracy of the tree factor extraction. To ensure that all trees in the selected field are represented in the original cloud model, the maximum spiral radius of the video shooting should be more than 4–5 m so that the outermost trees are photographed. (2) The appropriate shooting route needs to be selected. The chosen route should avoid shade between each of the trees as much as possible; and, at the same time, ensure that all the trees in the sample area are well covered. (3) The camera needs to be kept vertical when shooting. We used the cradle head of the Ling Mou Osmo Pocket camera to ensure that the camera pose was vertical during shooting, which can simplify the transformation process of the coordinate system during image matching. In the event that a target outline is obscured, comparing focuses in each outline match cannot be identified, and it becomes to be troublesome to coordinate picture sets. (4) The appropriate shooting distance needs to be determined. It should be noted that the distance between the camera and the tree needs to be controlled when shooting. The resolution of an object in a picture diminishes as the separation between the camera and the object increments, which may result in the disappointment of 3D reproduction and lead to estimation blunder within the structural parameters and the number of trees perceptible within the 3D pictures. Meanwhile, shooting too close to the trees may lead to partial occlusion, while shooting too far from the trees can reduce the available information in the frame and induce noise generation, increasing the workload during data processing at the later stage.
2.4.2. TLS Data Acquisition
We collected TLS information employing a FARO Center S 150 terrestrial laser scanner delivered by FARO Advances Company (Orlando, FL, USA), a phase-based scanner with a field of view of 360° in the horizontal plane and approximately 300° in the vertical, with a minimum horizontal and vertical step of 0.009° (For a full hemispherical filter, approximately 40,000 laser beats). When we performed TLS data scanning, we deployed a total of 12 target balls in the sample plots. In order to ensure the accuracy of multi-site data matching, we require that each site can see more than 5 target balls. Because the selected sample plots are better under the forest and have a wider field of view, we set checking positions at four corners of the plot and the center to perform five successive checks of the trees in a clockwise grouping in arrange to induce more rich information.
2.5. Data Processing
2.5.1. Camera Calibration
For the videogrammetry, we used a non-measuring camera. To ensure the accuracy of image matching and the restoration of the 3D point cloud, we calibrated the camera in advance. In this study, the Camera Calibrator tool of MATLAB software was used to calibrate the camera. This calibration tool is by far the most commonly used and high-precision calibration method, which is very convenient and efficient. The calibration parameters of the Ling MoU Osmo Pocket obtained by the Camera Calibrator tool are shown below (Table 2).
2.5.2. Video Data Processing
The videogrammetry proposed in this research is based on computer vision, a method of three-dimensional reconstruction of plot information. Since it is a passive technology, the result is greatly affected by the input picture information. Videogrammetry uses an automated process through computer vision recognition and feature matching, which is fundamentally dependent on the quality of the image. So in the process of data processing, the input of the image is very important. Therefore, the video data of the forest plots should be preprocessed before usage. Pictures we require can be obtained by partitioning video clips into video frames. And we used Pix4D mapper software to obtain the frames from the videos which observed the forest sample plots. To ensure the quality of cloud information at the sample location, we need to extract the appropriate number of frames, and the number of frames is critical. Too few frames will result in insufficient information to match, and it is difficult to generate complete point cloud data. Too many frames will cause data redundancy and increase data processing time.
In the process of shooting video, our camera can obtain 30 frames of images per second, which ensures that information omission did not occur in the process of data collection. In order to obtain a high-precision point cloud data of the plot, it is necessary to ensure that the overlap of adjacent photos is greater than 50% during the 3D reconstruction. Due to the differences in the terrain conditions and surface vegetation of each plot, the speed at which the cameraman took the plot was also different, so the length of the video obtained by shooting the plot of the same size was different. Therefore, according to the length of the video and the size of the sample plots, we extracted 300–500 frames of information for each plot. It is inevitable that there will be slight jitter or occlusion during the shooting, and this part of the data is useless for us to build a 3D point cloud model. Therefore, we also need to manually remove these redundant data.
2.5.3. Establishment of the Point Cloud Model
The point cloud model of the forest plot was created and processed by Pix4D mapping software. Before the image is initialized and preprocessed, the quality parameters are set to a higher level during matching and programmed focal point calibration is performed at the same time. The point cloud is produced after the picture is matched, and the point density is set to low with the point density setting set to low. The results are shown in Figure 6.
When the spiral method is used to observe the forested sample area by video, data cannot be obtained for the tops of trees due to the viewing angle of the camera, so we can only observe the trunks of trees. Based on this, we processed the point cloud data of the tree trunks in the sample plot and extracted the DBH of the trees.
Because the video was shot in a sample stand, all objects in the area were sampled, including the surface vegetation and shrubs. But in this study, our research goal is trees. Therefore, after obtaining the point cloud of the sample stage, we use Lidar360 software for the initial sampling and processing of the point cloud data. Since the obtained point cloud contains all the feature information captured by the video, there is a large amount of redundant data, so we only keep the range of the sample plot we divided by cutting, and the part outside the sample plot is deleted. To accurately display the tree trunks, we further processed the point cloud data using Lidar360 software. First, the point cloud data were denoised to eliminate the outliers and other types of noise. Here, we find that one de-noising is not very effective, and when we perform two denoisings, the quality of the data obtained is better. Then, we classified the ground points and obtained the DEM of the ground points after filtering. At last, the point cloud data were normalized based on the ground points. The elevation value (Z) of each point was subtracted from the height esteem of the nearest ground point to dispense with the effect of topographic variance on the point cloud data and the point clouds of all the trees were put within the same even plane. At this point, we have obtained the preprocessed point cloud model. In arrange to calculate the outright scale, the measure of one scene within the video must be known, so a fixed-length rod, which we put in progress, is utilized to perform preparatory processing on the point cloud shown to adjust the scale show.
2.6. Extraction of DBH Data
Generally, there are two methods to extract DBHs from point cloud data: circle fitting and cylinder fitting. In order to obtain higher extraction accuracy, we applied the two methods to one of the sample plots, compared their accuracy, and then selected the method with better extraction accuracy. This method was used to extract the DBH of trees in all sample plots.
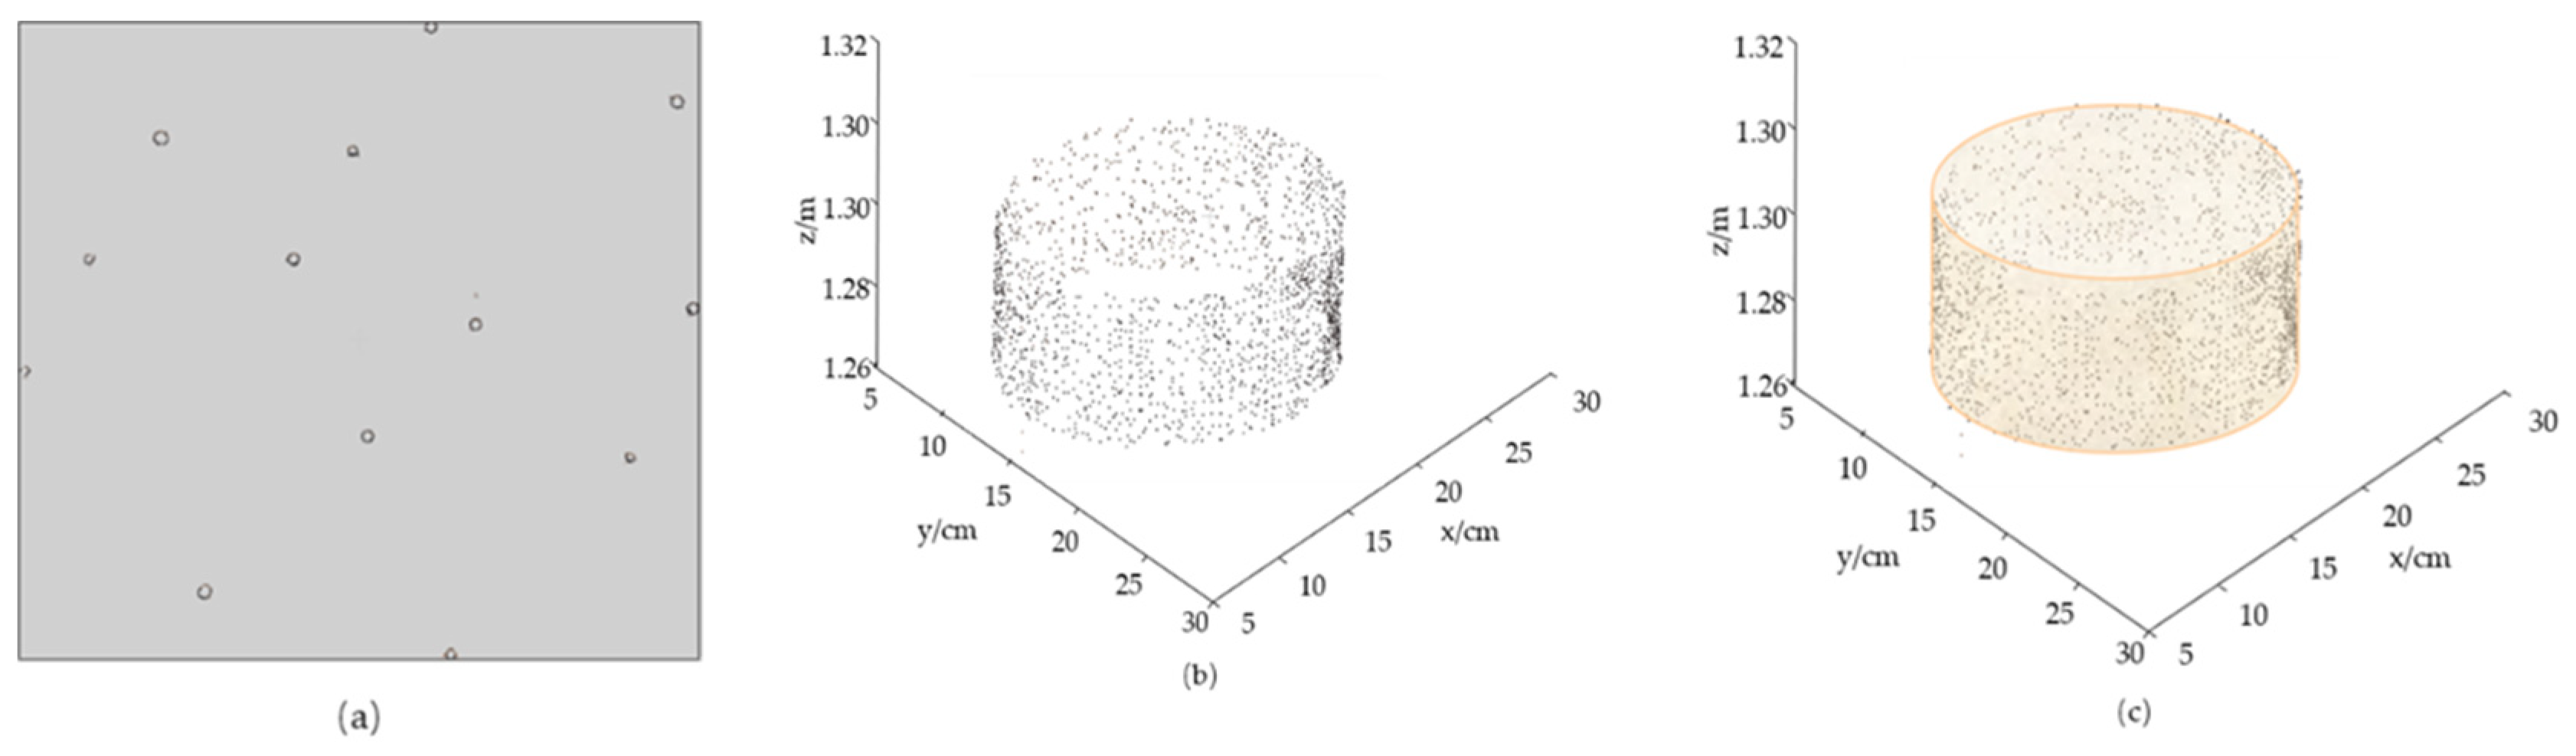
In the process of shooting video, some point cloud data were missing in the generated tree point cloud data because trees would block the camera’s perspective. That was, some trees lacked point cloud data in a certain direction. In order to eliminate the influence of incomplete trunk point cloud on DBH extraction, we intercepted the point cloud data with a thickness of 5 cm (1.27 m to 1.32 m) and obtained the DBH values through cylinder fit-ting and circle fitting. The point cloud data with this thickness can not only effectively eliminate the impact of point cloud information generated by branches and upper canopy on DBH extraction but also effectively avoid the impact of surface vegetation and shrubs on DBH extraction. Figure 7 shows the results of reconstructing the model at DBH using 5 cm thick point cloud data.
The specific steps of DBHs extraction were as follows: (1) we intercepted the point cloud data between 1.27 m and 1.32 m on the trunk (there were no branches below 1.5 m in the sample field) and used the point cloud data for cylinder and circle fitting; (2) we calculated the volume of the reconstructed cylinder and the circumference of the circle obtained by model fitting; and (3) we calculated the DBH of the trees by using Formulas (1) and (2) and obtained the value of DBH.
where V is the reconstructed cylinder volume, C is the circumference of the circle, D is the DBH value of the tree, and h is the intercepted point cloud thickness.
2.7. TLS Data Processing
When we process TLS data, we first use FARO Scene desktop software (FARO Technologies, Inc., version 7.1.0, www.faro.com, accessed on 1 October 2020) to match the TLS data obtained from multiple sites to obtain a complete point cloud data of a sample site. For the further processing of TLS data, we choose to use Lidar360 software, which is similar to the way of processing videogrammetry data. After evaluated the quality of the point cloud information and channel out “ghost points” and discrete points, we utilized the work of “Clear Sky” and “Clear Contour” to obtain more reliable 3D spatial information for advance demonstrating. The results of a part of the point cloud are shown in Figure 8.
2.8. Estimation of AGB
The appraisal of forest biomass incorporates the estimation of both above-ground biomass (AGB) and underground biomass. However, the calculation of below-ground biomass is difficult, and the effect is small relative to AGB. Therefore, only the biomass above the ground of the tree was discussed in this study. When estimating tree biomass, the errors caused by the measurement tool itself and manual operation are negligible. The most common method of AGB estimation in China Forest Resources Survey is based on one-variable individual tree biomass models [27]. In this study, we basically adopt the one-variable individual tree biomass models to obtain the AGB. The biomass models of ten tree species used in this study were obtained from published literature and references or national standards (Table 3). Only the Fraxinus pennsylvanica uses the two-variable individual tree biomass models. Therefore, the tree height of this tree species is calculated with the method proposed by Lai [32] to obtain the biomass. The tree height of Fraxinus pennsylvanica calculation model is shown in Formula (3).
where H is the tree height in meters, D is the DBH value in centimeters, and the unit is cm.
2.9. Precision Evaluation
In this study, we use the bias, root mean square error (RMSE), and relative bias for validation of measurement accuracy while calculating concordance correlation coefficient (CCC) [41] to further verify the accuracy of biomass estimation. Calculated as follows [42,43]:
where n is the number of estimations, is the ith estimation, is the ith reference, is the mean of the reference values, and ρ is Pearson’s correlation coefficient.
3. Results
To confirm the achievability of the videogrammetry method for the extraction of tree measurements, we selected 10 sample plots, each being 20 m × 20 m, in the study area to carry out our experiment. The videos of each sample taken by the camera were processed according to the methods described in Section 2.5.
3.1. Point Cloud Data
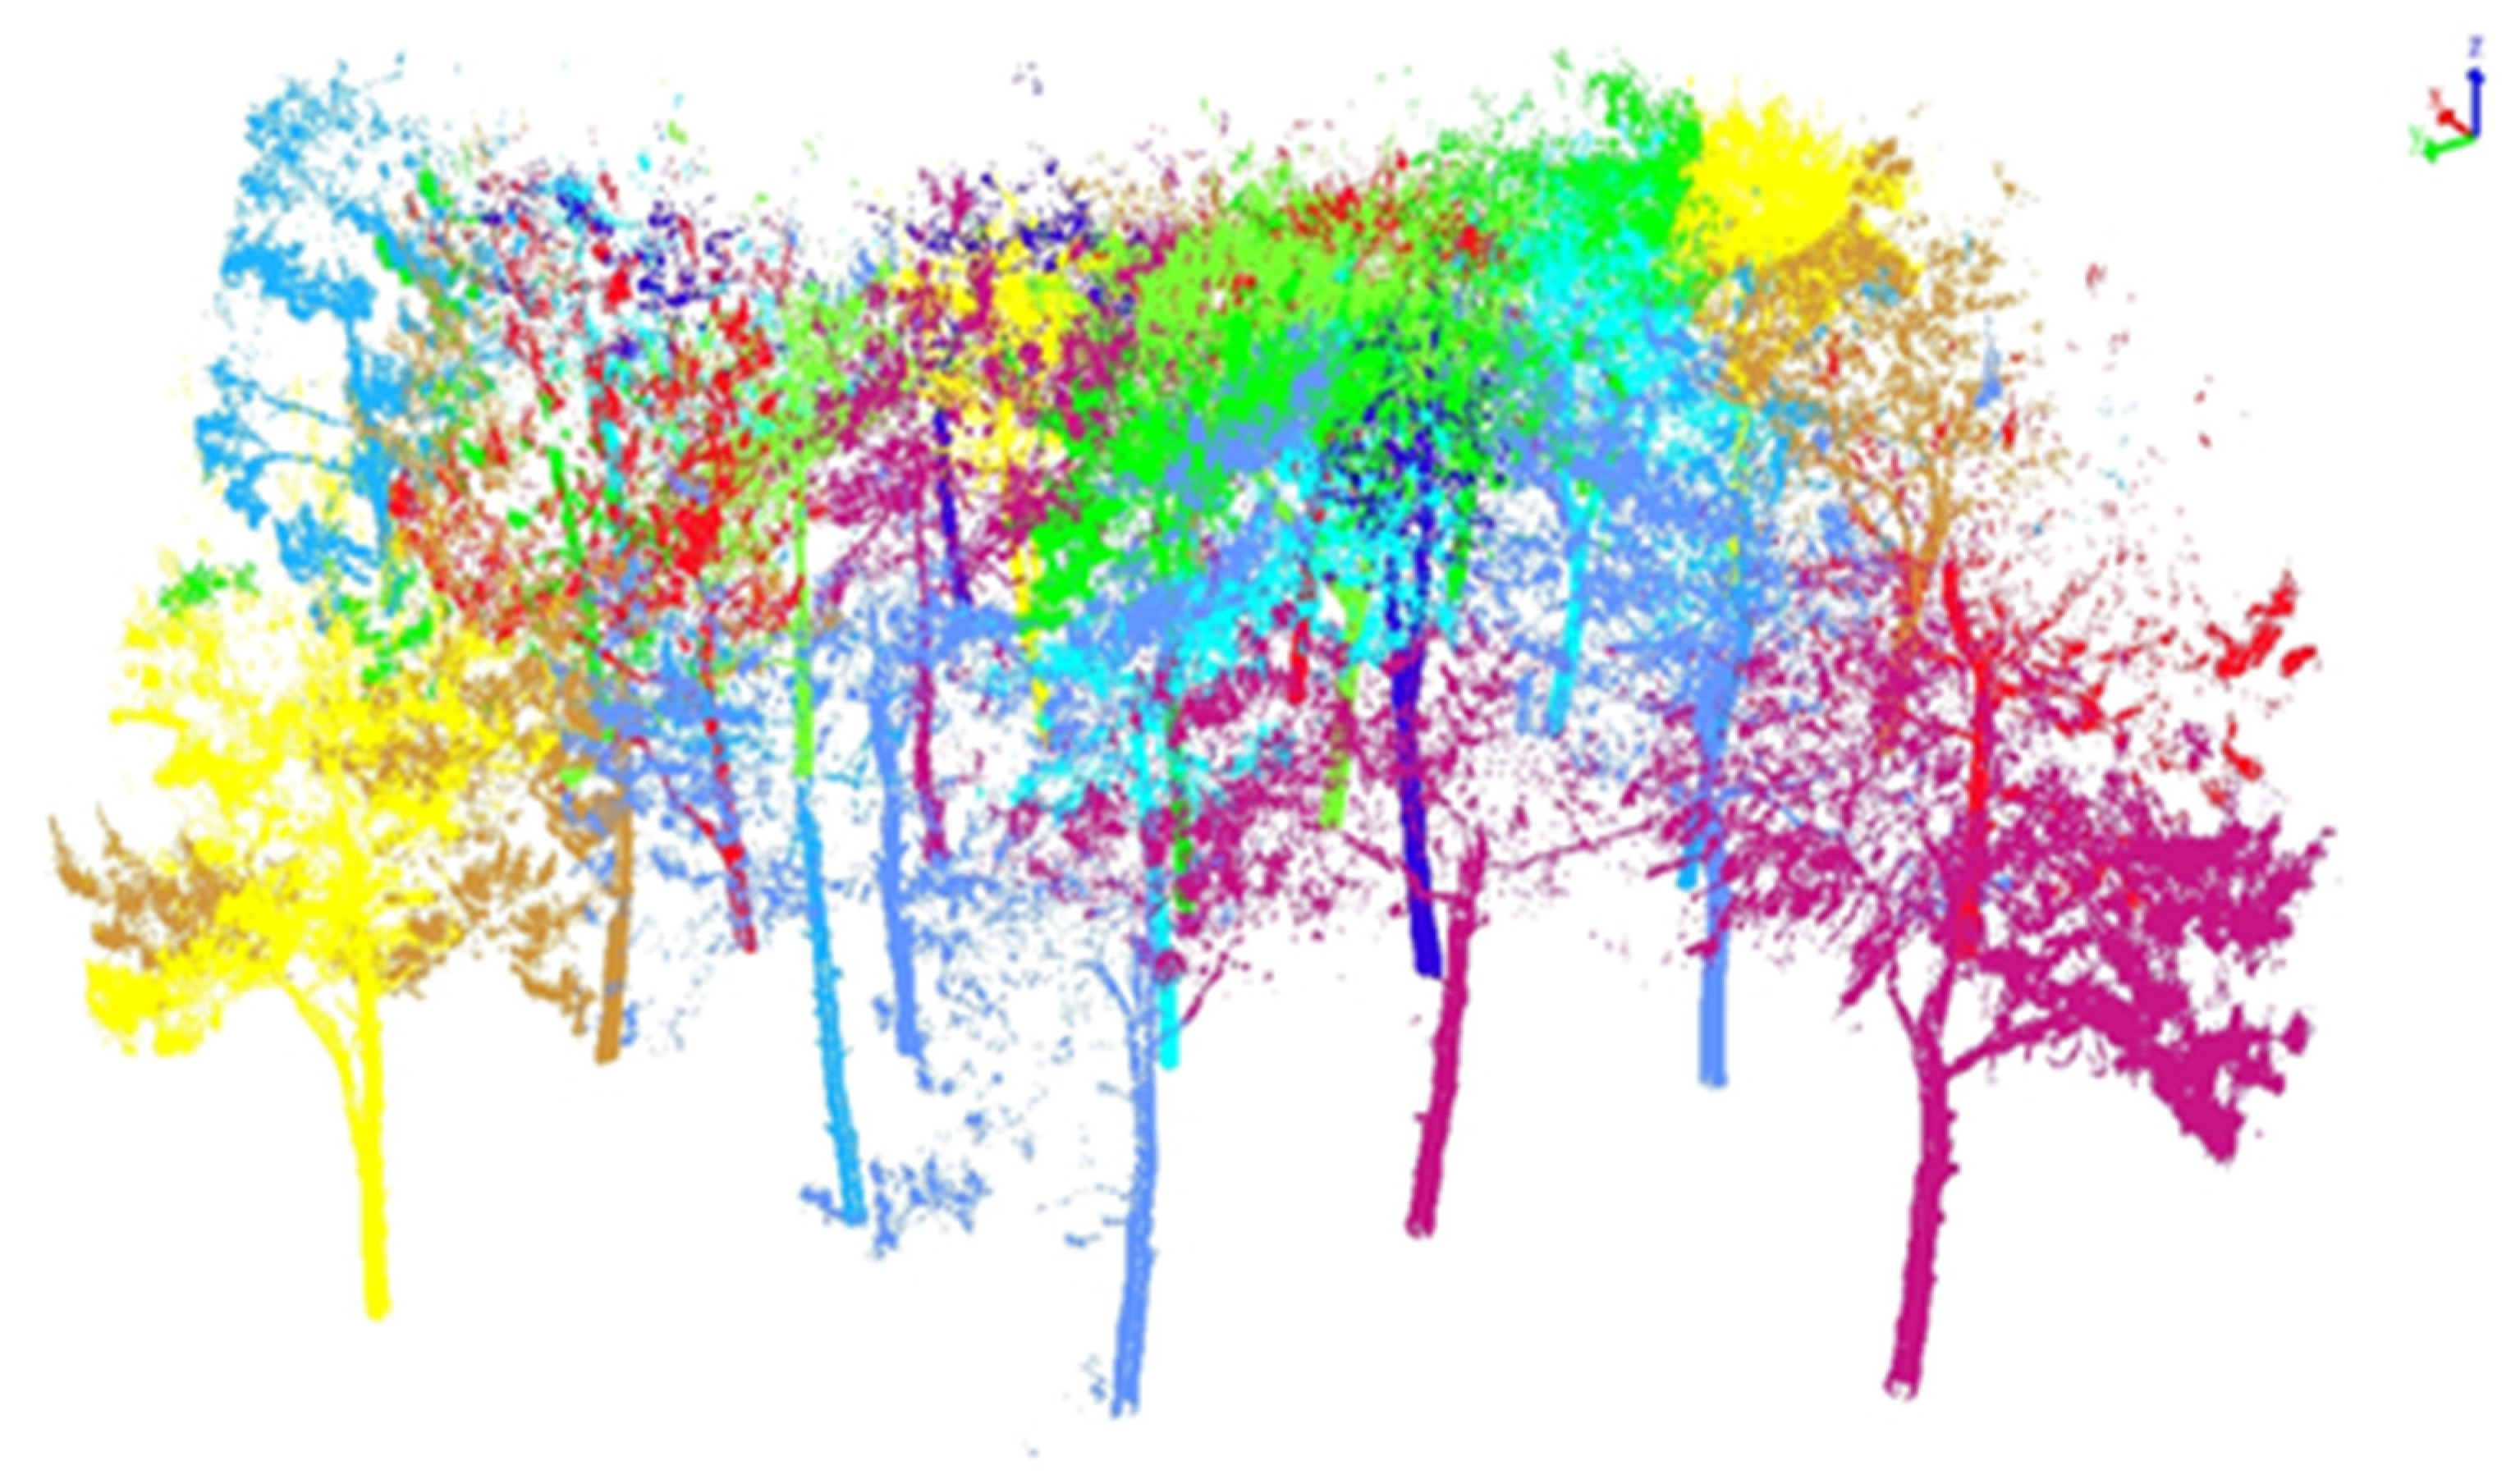
Through experiments, the data quality of the 3D point cloud model, which is established by videogrammetry to extract keyframes, is relatively high. According to the process of video data processing, we have obtained high-density point cloud data. Due to the keyframe matching effect is better, the generated noise points are relatively few, and a single tree can be distinguished very clearly, which provides a valid basis to extract the diameter at breast height. The relevant data are shown in Table 4.
3.2. Acquisition of DBH
3.2.1. Accuracies of Cylinder Fitting and Circular Fitting
In order to ensure that the DBH extracted in the videogrammetry is more accurate, we selected a part of all the sample data to compare and verify the accuracy of the diameter at breast height extracted by the circle fitting and the cylinder fitting method. To evaluate the accuracy of the tree DBH extraction, we used bias, bias%, RMSE, and RMSE%. As shown in Table 5, the bias% of the cylinder fitting DBH is 3.14%, the RMSE% is 5.52%, the circle fitting DBH is −0.04%, and the RMSE% is 4.03%. Therefore, in the process of DBH extract by videogrammetry, circle fitting has higher accuracy than cylinder fitting in DBH extract. Therefore, all the breast diameter extraction in this study will adopt the method of circle fitting.
3.2.2. Accuracies of Videogrammetry
We obtained the conclusion from Section 3.2.1 that the accuracy of circle fitting is higher than cylinder fitting when extracting DBH. Therefore, the other nine sample plots are selected in the research area to verify the accuracy of the videogrammetry circle fitting method for extracting the tree factors of stand measurements. At the same time, we used TLS to carry out the same explore within the same test plots and extracted the DBH of trees for comparison. A total of 134 trees belonging to the 10 samples were effectively extracted. Although cases of incomplete point cloud data of trees at the edge of the plot occurred during extracted trees, the errors of commission or omission did not occur. The DBH estimated by videogrammetry measurement and TLS was compared with the DBH reference value, which was measured with a diameter ruler (Figure 9).
Figure 9 shows the accuracy evaluation of the three sets of data. They are the accuracy comparison between DBH from circle fitted and DBH from field survey data (a), the accuracy comparison between DBH from TLS data and DBH from field survey data (b), and the accuracy comparison between DBH from circle fitted and DBH from TLS data. Our estimated result shows that most of the DBHs are near the 1:1 dashed line.
The R2 of the linear regression model describing the consistency of circle fit with the measured DBH values was 0.89 (Figure 9a). The R2 of the linear regression model describing the consistency of TLS with the measured DBH values was 0.93 (Figure 9b). The R2 of the linear regression model describing the consistency of circle fit with the measured DBH values was 0.85 (Figure 9c). We can see in Figure 9d–e that most of the residuals of the DBH values of the trees are around the straight line y = 0, which is consistent with the results in Figure 9a–c.
Table 6 shows the accuracy of the DBH estimates from the 10 sample plots claimed by the bias, bias%, RMSE, and RMSE%. The bias% of DBH extracted by videogrammetry is −3.19~2.87%, and the RMSE% is 5.52~7.76% (Table 6). The bias% of DBH extracted by TLS data is −2.96~1.68%, and the RMSE% is 4.49~6.23%. The DBH extracted by videogrammetry estimates reveal comparable precision with regard to TLS with the bias% of −4.78~2.38%, and the RMSE% was 5.63~9.87%.
In order to further verify the accuracy of tree DBH extracted by videogrammetry, we cross-validated the results of both videogrammetry vs. TLS data and videogrammetry vs. field measurements. We randomly selected the data of 7 plots out of 10 plots to establish a linear regression model. The relationships between DBH from videogrammetry and TLS and the established linear regression model are shown in Figure 10a. The relationships between DBH from videogrammetry and field survey and the established linear regression model are shown in Figure 10c. After obtaining the linear regression model, we used the remaining three plots for cross-validation. The R2 of the linear regression model describing the agreement of videogrammetry with the prediction values is 0.84 and 0.90. Meanwhile, the RMSE are 1.39 and 0.38, which provides a very good accuracy (Figure 10b,d). At the same time, we conducted a SWOT analysis on these three data acquisition methods (Table 7).
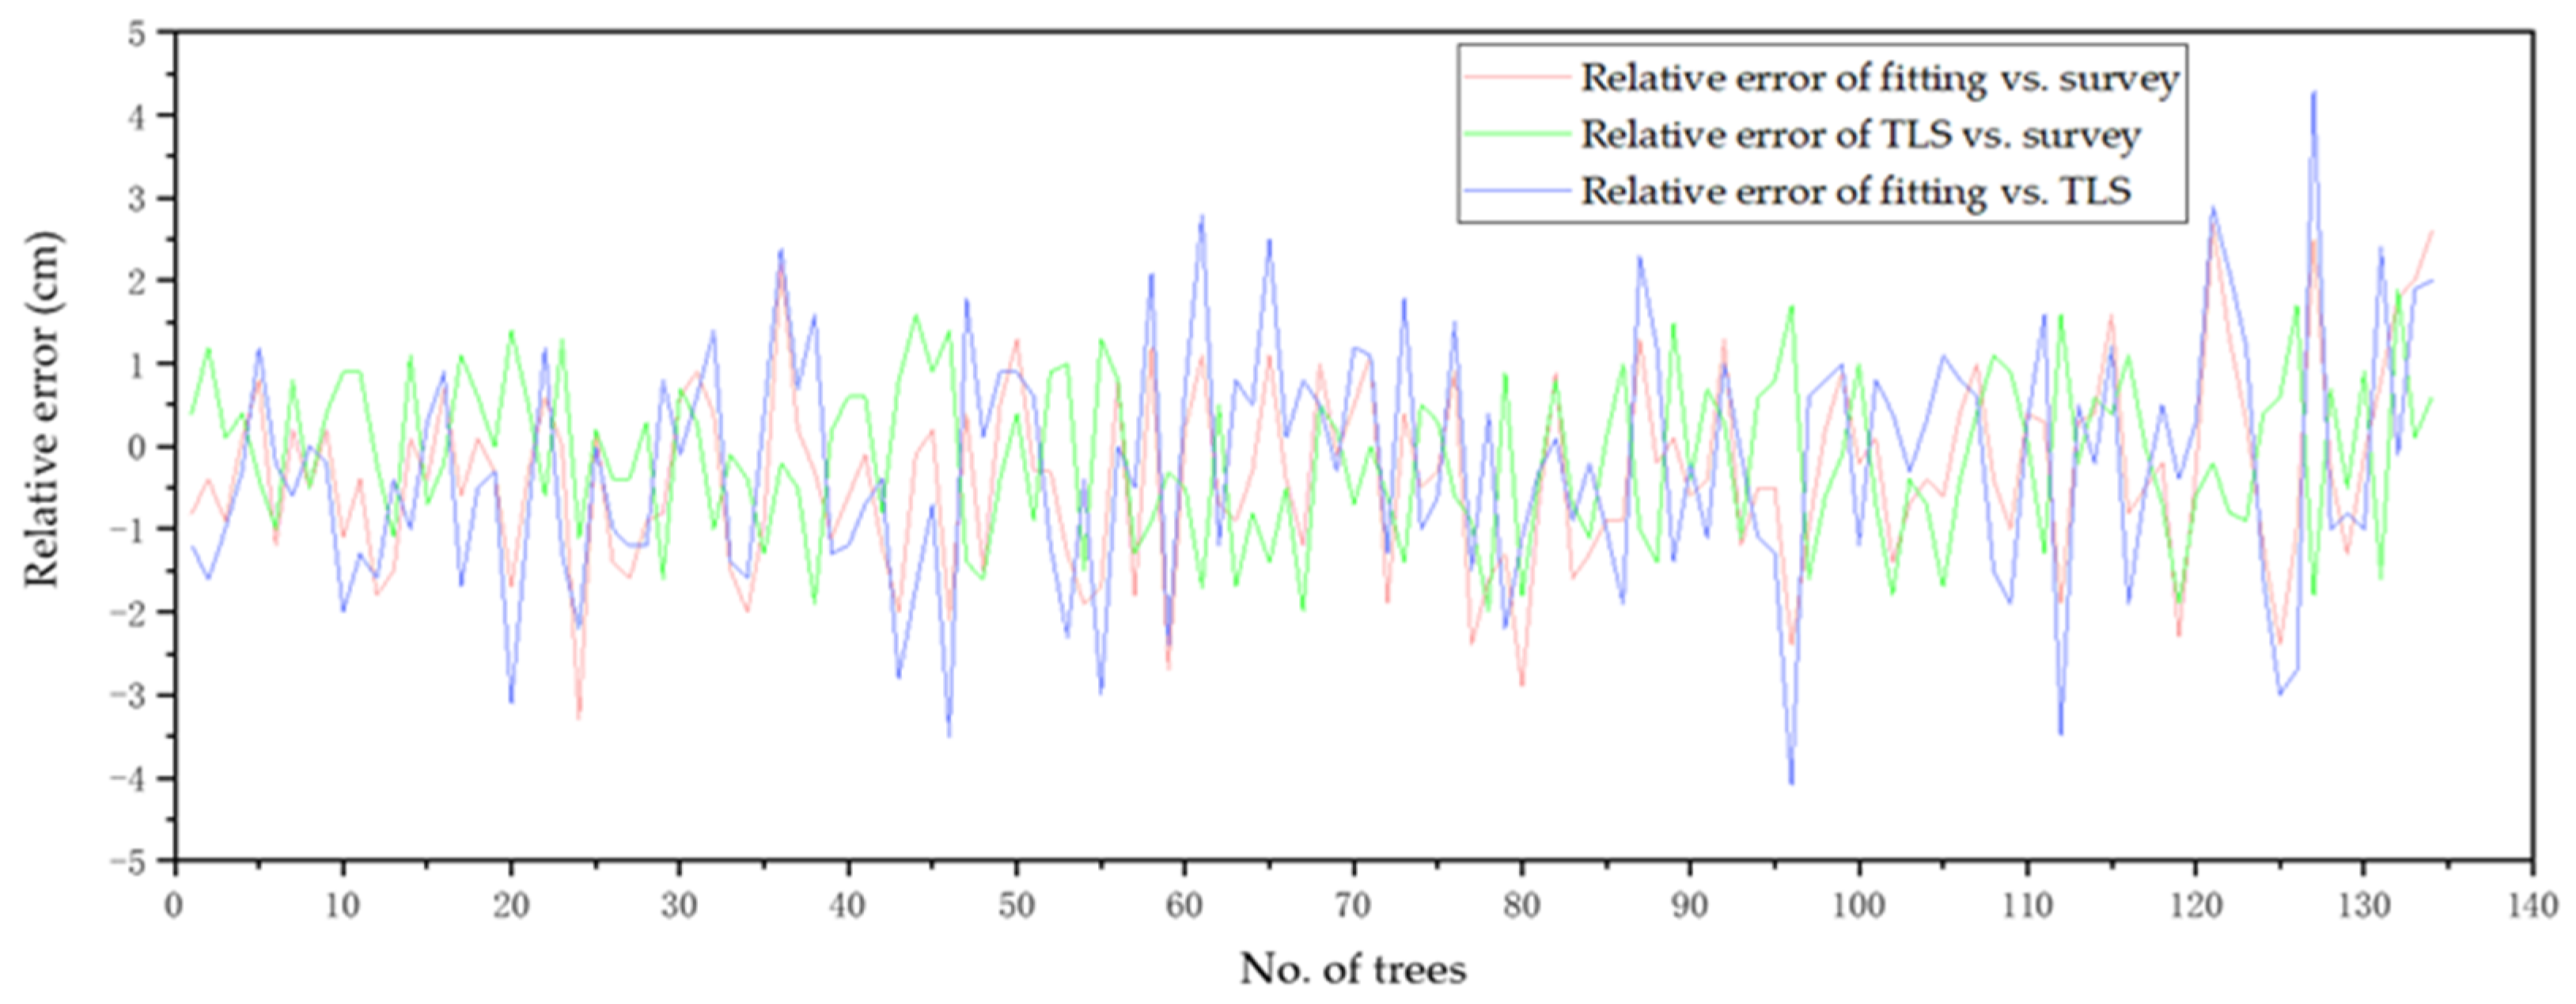
We sorted the 134 trees by diameter at breast height from small to large and calculated the relative error of fitting vs. survey, TLS vs. survey, and fitting vs. TLS. Both the DBH data obtained by videogrammetry and TLS show a high degree of consistency. We can see from Figure 11 that, except for individual special data, the accuracy decreases as the overall DBH increases. This is mainly produced in the process of circle fitting. When the tree has a larger DBH, the circle we fit based on the point cloud data will be larger. It resulted in the DBH being slightly larger than the actual value within the error range, but the overall accuracy can still be maintained. Therefore, all of these meet the requirements of forest resource surveys in China. And the method of extracting DBH of trees by videogrammetry can be widely used in forestry investigations in China.
3.3. Estimation of Above-Ground Biomass
We calculate the biomass of all the trees through the DBH calculated in Section 2.7 and the corresponding biomass models of each tree species. The comparison between the AGB obtained from the videogrammetry and the reference values is shown in Figure 12. This group data indicates that the entire RMSE of the AGB obtained by means of videogrammetry was 19.8 kg. The AGB from the videogrammetry approach and regional AGB from survey DBH are highly consistent at the 95% confidence interval level (CCC = 0.97). Also, there was no significant systematic deviation from the 1:1 line. As a result, there is no propensity for videogrammetry methods to overestimate or belittle the AGB of huge trees. Figure 12b shows the dispersion of the AGB residuals from distinctive tree species. Compared with the reference, the AGB from videogrammetry has not methodically tended to overestimate nor belittle the AGB of a specific tree species for diverse tree species.
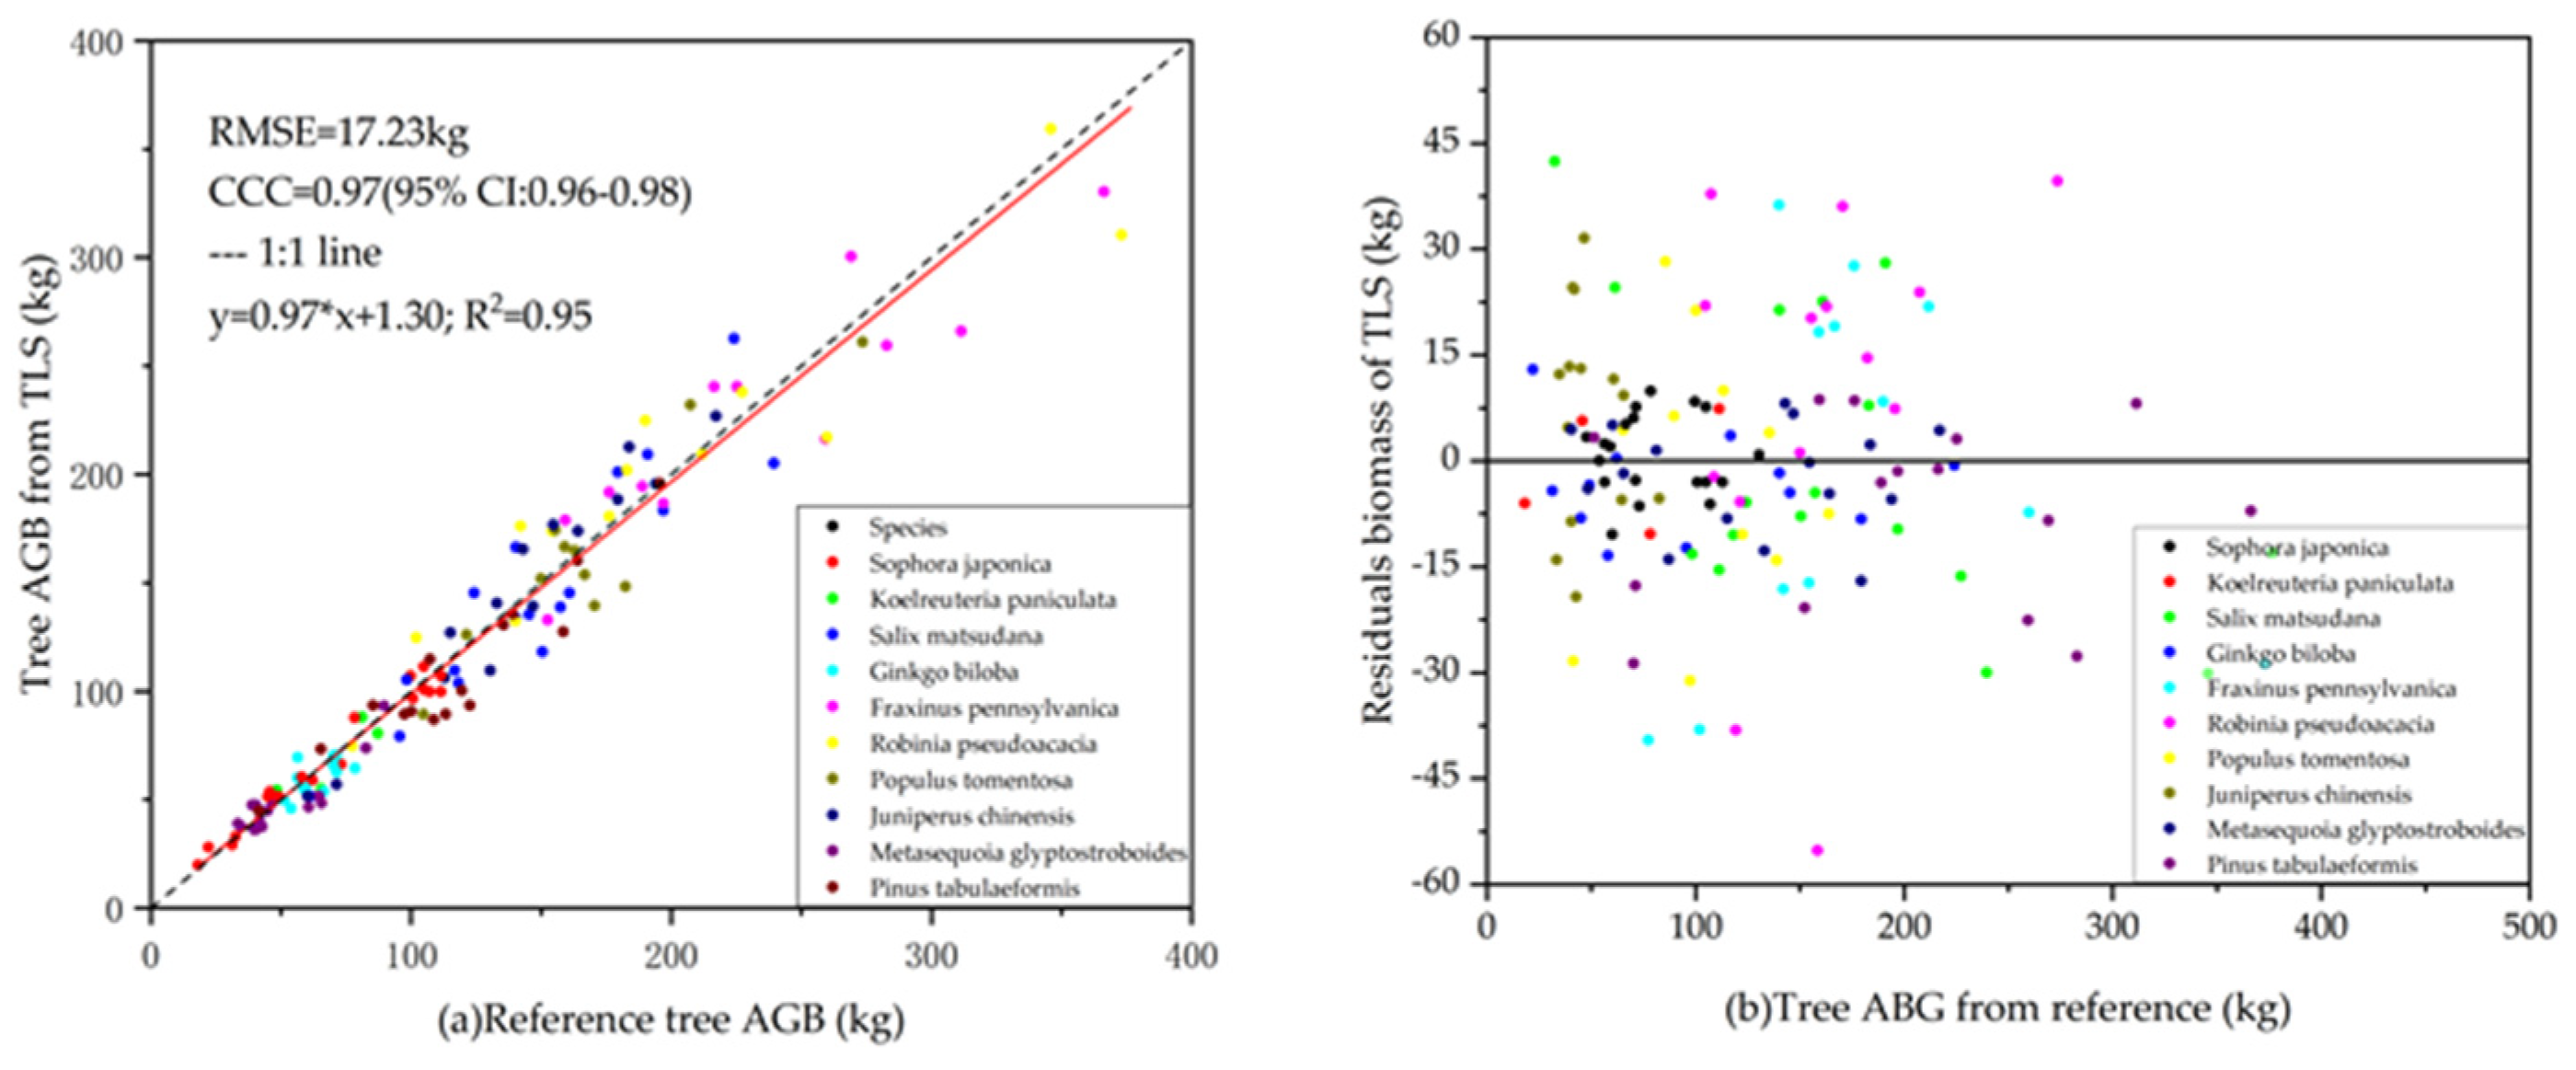
The comparison of the AGB of each tree from reference data and AGB from terrestrial laser scanning (TLS) is shown in Figure 13. This group data indicated that the entire RMSE of the AGB obtained by means of TLS was 17.23 kg. The AGB from the TLS approach and regional AGB from survey DBH were highly consistent at the 95% confidence interval level (CCC = 0.97). Also, there was no significant systematic deviation from the 1:1 line. As a result, there is no propensity for TLS methods to overestimate or belittle the AGBs of huge trees. Figure 13b shows the dispersion of the AGB residuals from distinctive tree species. Compared with the reference, the AGB from TLS has not methodically tended to overestimate nor belittle the AGB of a species for diverse tree species.
3.4. Comparison of Work Efficiency
Obtaining forest survey factors information with high accuracy and least taken a toll and shortest time is a key objective in forestry research. It is effective and cost-effective to use the videogrammetry method for sample surveys. Since no control points are set in advance, only a benchmark is required, so this method saves a lot of on-site work time. This not only greatly reduces the investment of workers but also greatly reduces labor costs. Additional investment requirements for data acquisition equipment or external expert knowledge can be minimized to a large extent. Table 8 is a comparison of the efficiency of the method proposed in this study and the two related methods. The first two methods were tested in plots of 20 × 20 m, and the third method was tested in a 30 m circular sample plot. We can intuitively see that the method of videogrammetry has saved a lot of time, whether it is in field survey or internal processing time. Therefore, the proposal of videogrammetry reduced the time of forestry workers working in the field, and more work will be completed on the computer. At the same time, videogrammetry provides forestry workers with a new forest survey method, which is easier and more interesting than field measurements. This contributes to the intelligent and informed development of forest survey work.
4. Discussion
At present, point cloud data are widely used in forest inventory, but research on modeling data collection utilizing point clouds is still based on direct measurement technology. The application of image-based point clouds in forest resource surveys has just begun. Point clouds based on terrestrial imagery have become a new source of data during forest resource surveys, which was proposed in a pilot study in 2014 [42]. Liang et al. mentioned that we could generate ground point cloud data of a forest area from overlapping photographs taken around a certain path in the forest area. These point clouds can be scaled and transferred to a local engineering coordinate reference system, which can then be used for individual tree measurement. The accuracy of experimental ground photogrammetry in tree detection and DBH estimation was comparable to the results of single-scan TLS [43]. Videogrammetry-based point cloud data are theoretically the same as TLS data because they both provide 3D points. The high quality of TLS point cloud data acquired by field acquisition scanning has good accuracy. But the equipment for TLS is expensive, bulky, and inconvenient to carry. The extracted video frames need to be matched, and the generated point clouds need to be transferred to the geographic coordinate system by coordinate transformation. It may take several hours to generate and process point clouds currently. Thanks to the rapid development of computing hardware (such as CPUs and GPUs), the reconstruction of the point cloud from images has been greatly improved in terms of efficiency. Therefore, more indoor work will be better than more outdoor work. Meanwhile, the point cloud from videos has its characteristics, which are related to the camera model, photographing path, lighting conditions, video data processing method, etc. These key factors present both advantages and challenges to the process of estimating tree properties.
The route taken by the surveyor is also a critical issue in the acquisition of data. The effect of the photographic route on the accuracy of forest metrics obtained from terrestrial SfM point clouds was first investigated by Liang et al. in 2014 and 2015, followed by Mokroš et al. in 2018 for this issue [44]. We proposed a spiral observation method to acquire the video data. By taking video shots along this path, we can not only observe the external information of the sample plot but also obtain the internal information of the sample plot. It can capture many photos with overlapping ranges in a short time, thus ensuring the imaging network with good geometry, complete coverage, enough intersection angles, and enough overlapping image similarities to automatically match their homologous points. The information collected through this route shooting is more comprehensive than the method proposed by Liang et al. [43] and more complete. Moreover, we can take a complete sample plot along one route at a time without going through several routes to achieve the purpose of covering the entire sample plot.
The results reported in this paper illustrate that videogrammetry has a certain potential to provide accurate estimates of tree attributes in forest surveys. We can obtain point cloud data of forest plots through videogrammetry. Since no facilitated data were included within the inquiry about preparation, the generated point cloud lacks a measurable conversion relationship with the real world. Therefore, this research uses a standard measuring rod to correct the proportional relationship of the point cloud during the video-shooting process. The scaling factor is estimated by the scale between the standard measuring rod in the video and the real-world space. When we perform a coordinate transformation, we need to convert the image-based point cloud from the camera space to the real-world space by scaling the values. At the same time, within the handle of obtaining information to guarantee the exactness of information collection, the information ought to be analyzed entirely in understanding with the depiction in Section 2.3. The information is a key component within the exact calculation of video pictures.
The advantage of videogrammetry to extract DBH of trees is that it simplifies the process of field data acquisition. In the process of collecting information in the field, the observer only needs to hold the camera to take a video of the sample along the spiral path, which greatly saves the manpower and material resources of the fieldwork and reduces the cost of the field investigation. Through the content of this study, the DBH data obtained by videogrammetry are compared with the data obtained by the current mainstream survey methods. As a result, the accuracy has a certain degree of reliability, which means the method can be applied to the work of forest resources survey. While reducing the workload in the field, more time needs to be spent on data processing indoors, which will make people choose different ways of working. At the same time, during the application of videogrammetry, only the DBH and the position of the trees can be extracted. The reason is that when the lens is vertical, due to the limitation of the angle of view, the captured video cannot cover the top of the tree, which is also the reason we can only use the univariate model when calculating AGB.
With the development of forest resource survey methods, more and more methods will be proposed by researchers and applied in their work. This is an opportunity and a challenge for videogrammetry. The proposal of the videogrammetry method conforms to the development trend of the informatization and intelligence of forestry. However, it still needs to be further studied as to how to optimize the methods and routes of data collection and how to improve the efficiency of internal data processing.
However, several questions are worth our attention. Videogrammetry can greatly reduce on-site working hours and labor costs, but data processing takes more time. Therefore, besides upgrading equipment for processing data, there is still a lot of room for optimization in the algorithm for generating point cloud models. In addition, DBH is the most important data that needs to be obtained in the forest survey. At the same time, if other information such as tree height can be obtained, we can further explore the structure of the forest and carry out the precise operation and management of the forest. On the basis of this research, we can also explore obtaining more forest parameters. We believe that video photogrammetry has great potential in the development of forest surveys.
5. Conclusions
Obtaining tree factors such as tree height, DBH, volume, and AGB of trees in the forest, in particular, is an important subject in forest resource surveys. In this work, we proposed a novel strategy for extracting sample plot parameters based on videogrammetry. We build up 3D point cloud models by using Osmo Pocket instrument and commercial software to extract the DBH of trees and estimate the AGB. Compared with previous studies, the foremost critical contribution of this technique is to supply a novel, high-precision, and stable method for extracting parameters of forest sample plots, thereby saving labor costs. Compared with surveys, the RMSE of DBH is 1.25 cm. Compared with TLS, the RMSE of diameter at breast height is 1.47 cm. At the same time, the RMSE of AGB is 19.8 kg. These are all within a relatively small error. This method may be a convenient and fast alternative to land field surveys, especially focusing on speed, which can accurately determine the attributes of each tree and stand in the forest. This method is not only simple and feasible but also can be used for observations in a relatively complex forest environment with strong anti-interference ability.
Nevertheless, there is still room for improvement. The method is theoretically suitable for forest sample surveys in various environments, but the study area of this study has certain limitations. Additionally, we need to further verify and promote it in more complex forests. At the same time, it is suggested that the next stage of research could focus on the optimization of point cloud data processing algorithms and the accuracy of the stem curve estimation using videogrammetry-based point cloud data.
Author Contributions
Conceptualization, Y.L., Z.F. and Y.H.; Data curation, Y.L. and N.L.; Formal analysis, Y.L.; Funding acquisition, H.L. and Y.H.; Investigation, Y.L., S.C. and N.L.; Resources, Z.F.; Software, S.C.; Visualization, H.L. and N.L.; Writing—original draft, Y.L.; Writing—review and editing, Y.L. and H.L. All authors have read and agreed to the published version of the manuscript.
Funding
This research was funded by the National Key Research and Development Program of China (Grant number 2020YFE0200800), the National Natural Science Foundation of China (Grant number 42001376), the National Natural Science Foundation of China (Grant number 31770589), and the Fundamental Research Funds for the Central Universities (Grant number 2015ZCQ-XX).
Data Availability Statement
The datasets generated and/or analyzed during the current study are available from the corresponding author on reasonable request.
Conflicts of Interest
The authors declare no conflict of interest.
References
- Watt, P.; Donoghue, D. Measuring forest structure with terrestrial laser scanning. Int. J. Remote Sens. 2005, 26, 1437–1446. [Google Scholar] [CrossRef]
- Maas, H.G.; Bienert, A.; Scheller, S.; Keane, E. Automatic forest inventory parameter determination from terrestrial laser scanner data. Int. J. Remote Sens. 2008, 29, 1579–1593. [Google Scholar] [CrossRef]
- McElhinny, C.; Gibbons, P.; Brack, C.; Bauhus, J. Forest and treeland stand structural complexity: Its definition and measurement. For. Ecol. Manag. 2005, 218, 1–24. [Google Scholar] [CrossRef]
- Nehrbass-Ahles, C.; Babst, F.; Klesse, S.; Nötzli, M.; Bouriaud, O.; Neukom, R.; Dobbertin, M.; Frank, D. The influence of sampling design on tree-ring-based quantification of forest growth. Glob. Chang. Biol. 2014, 20, 2867–2885. [Google Scholar] [CrossRef] [PubMed]
- Falkowski, M.J.; Hudak, A.T.; Crookston, N.L.; Gessler, P.E.; Uebler, E.H.; Smith, A.M. Landscape-scale parameterization of a tree-level forest growth model: A k-nearest neighbor imputation approach incorporating lidar data. Can. J. For. Res. 2010, 40, 184–199. [Google Scholar] [CrossRef]
- Kitahara, F.; Mizoue, N.; Yoshida, S. Evaluation of data quality in japanese national forest inventory. Environ. Monit. Assess. 2009, 159, 331. [Google Scholar] [CrossRef]
- Wullschleger, S.D.; Hanson, P.; Todd, D. Transpiration from a multi-species deciduous forest as estimated by xylem sap flow techniques. For. Ecol. Manag. 2001, 143, 205–213. [Google Scholar] [CrossRef]
- Lemenih, M.; Bekele, T. Effect of age on calorific value and some mechanical properties of three eucalyptus species grown in ethiopia. Biomass Bioenergy 2004, 27, 223–232. [Google Scholar] [CrossRef]
- Qiu, Z.; Feng, Z.; Lu, J.; Sun, R. Design and experiment of forest telescope intelligent dendrometer. Trans. Chin. Soc. Agric. Mach. 2017, 48, 202–207, 213. [Google Scholar]
- Qiu, Z.; Feng, Z.; Jiang, J.; Fan, Y. Design and experiment of forest intelligent surveying and mapping instrument. Trans. Chin. Soc. Agric. Mach. 2017, 48, 179–187. [Google Scholar]
- Moskal, L.M.; Zheng, G. Retrieving forest inventory variables with terrestrial laser scanning (tls) in urban heterogeneous forest. Remote Sens. 2011, 4, 1–20. [Google Scholar] [CrossRef] [Green Version]
- Kankare, V.; Holopainen, M.; Vastaranta, M.; Puttonen, E.; Yu, X.; Hyyppä, J.; Vaaja, M.; Hyyppä, H.; Alho, P. Individual tree biomass estimation using terrestrial laser scanning. ISPRS J. Photogramm. Remote Sens. 2013, 75, 64–75. [Google Scholar] [CrossRef]
- Dassot, M.; Colin, A.; Santenoise, P.; Fournier, M.; Constant, T. Terrestrial laser scanning for measuring the solid tree volume, including branches, of adult standing trees in the forest environment. Comput. Electron. Agric. 2012, 89, 86–93. [Google Scholar] [CrossRef]
- Raumonen, P.; Kaasalainen, M.; Åkerblom, M.; Kaasalainen, S.; Kaartinen, H.; Vastaranta, M.; Holopainen, M.; Disney, M.; Lewis, P. Fast automatic precision tree models from terrestrial laser scanner data. Remote Sens. 2013, 5, 491–520. [Google Scholar] [CrossRef] [Green Version]
- Yu, X.; Liang, X.; Hyyppä, J.; Kankare, V.; Vastaranta, M.; Holopainen, M. Stem biomass estimation based on stem reconstruction from terrestrial laser scanning point clouds. Remote Sens. 2013, 4, 344–353. [Google Scholar] [CrossRef]
- Liang, X.; Kankare, V.; Yu, X.; Hyyppa, J.; Holopainen, M. Automated Stem Curve Measurement Using Terrestrial Laser Scanning. IEEE Trans. Geosci. Remote Sens. 2014, 52, 1739–1748. [Google Scholar] [CrossRef]
- Astrup, R.; Ducey, M.J.; Granhus, A. Approaches for estimating stand-level volume using terrestrial laser scanning in a single-scan mode. Can. J. For. Res. 2014, 44, 666–676. [Google Scholar] [CrossRef]
- Newnham, G.J.; Armston, J.D.; Calders, K. Terrestrial Laser Scanning for Plot-Scale Forest Measurement. Curr. For. Rep. 2015, 1, 239–251. [Google Scholar] [CrossRef] [Green Version]
- Yao, Y.; Yang, X. Measuring forest structure and biomass in New England forest stands using Echidna ground-based lidar. Remote Sens. Environ. 2011, 115, 2965–2974. [Google Scholar] [CrossRef]
- Lindberg, E.; Holmgren, J.; Olofsson, K.; Olsson, H. Estimation of stem attributes using a combination of terrestrial and airborne laser scanning. Eur. J. For. Res. 2012, 131, 1917–1931. [Google Scholar] [CrossRef] [Green Version]
- Marín-Buzón, C.; Pérez-Romero, A.; Tucci-Álvarez, F.; Manzano-Agugliaro, F. Assessing the Orange Tree Crown Volumes Using Google Maps as a Low-Cost Photogrammetric Alternative. Agronomy 2020, 10, 893. [Google Scholar] [CrossRef]
- Fan, Y.; Feng, Z.; Abdul, M.; Tauheed, U.K.; Shen, C.Y.; Sajjad, S. Estimating Tree Position, Diameter at Breast Height, and Tree Height in Real-Time Using a Mobile Phone with RGB-D SLAM. Remote Sens. 2018, 10, 1845. [Google Scholar] [CrossRef] [Green Version]
- Chen, S.; Feng, Z.; Chen, P.; Tauheed, U.K.; Lian, Y. Nondestructive Estimation of the Above-Ground Biomass of Multiple Tree Species in Boreal Forests of China Using Terrestrial Laser Scanning. Forests 2019, 10, 936. [Google Scholar] [CrossRef] [Green Version]
- Qin, T.; Gu, X.; Tian, Z.; Pan, H.; Deng, J.; Wan, L. An empirical analysis of the factors influencing farmer demand for forest insurance: Based on surveys from lin’an county in zhejiang province of china. J. For. Econ. 2016, 24, 37–51. [Google Scholar] [CrossRef]
- Pollefeys, M. Detailed Real-Time Urban 3D Reconstruction from Video. Int. J. Comput. Vis. 2008, 78, 143–167. [Google Scholar] [CrossRef]
- Dandois, J.P.; Ellis, E.C. High spatial resolution threedimensional mapping of vegetation spectral dynamics using computer vision. Remote Sens. Env. 2013, 136, 259–276. [Google Scholar] [CrossRef] [Green Version]
- Liu, J.; Feng, Z.; Yang, L.; Mannan, A.; Khan, T.; Zhao, Z. Extraction of sample plot parameters from 3D point cloud reconstruction based on combined RTK and CCD continuous photography. Remote Sens. 2018, 10, 1299. [Google Scholar] [CrossRef] [Green Version]
- Piermattei, L.; Karel, W.; Wang, D. Terrestrial Structure from Motion Photogrammetry for Deriving Forest Inventory Data. Remote Sens. 2019, 11, 950. [Google Scholar] [CrossRef] [Green Version]
- Kurniawan, R.A.; Ramdani, F.; Tanzil, M.T. Videogrammetry: A new approach of 3-dimensional reconstruction from video using SfM algorithm: Case studi: Coal mining area. In Proceedings of the 2017 International Symposium on Geoinformatics (ISyG), Malang, Indonesia, 24–25 November 2017; pp. 24–25. [Google Scholar]
- Beraldin, J.A.; Lin, S.Y.; Mills, J.P. Integration of videogrammetry and terrestrial laser scanning for dynamic surface modeling. Proc. SPIE Int. Soc. Opt. Eng. 2005, 5665, 243–251. [Google Scholar]
- Tang, Y. The Study on Data Processing Method of High-Speed Video for Building Health Monitoring; Beijing University of Civil Engineering and Architecture: Beijing, China, 2018. (In Chinese) [Google Scholar]
- Lai, J.; Pan, Q.; Liang, J. Model Study on Growth Factors of Fraxinus in Beijing. Chin. Agric. Sci. Bull. 2015, 31, 21–26. [Google Scholar]
- Wang, Z.; Liu, L.; Peng, D.; Liu, X. Estimating woody aboveground biomass in an area of agroforestry using airborne light detection and ranging and compact airborne spectrographic imager hyperspectral data: Individual tree analysis incorporating tree species information. J. Appl. Remote. Sens. 2016, 10, 036007. [Google Scholar] [CrossRef]
- Zhang, X.; Leng, H.; Zhao, G.; Jun, J.; Aicui1, T.; Kun, S.; Da, L. Allometric models for estimating aboveground biomass for four common greening tree species in Shanghai. J. Nanjing For. Univ. 2018, 42, 144–149. [Google Scholar]
- Zeng, W. Developing One-variable Individual Tree Biomass Models Based on Wood Density for 34 Tree Species in China. For. Resour. Manag. 2017, 6, 41–46. [Google Scholar]
- Liu, K.; Cao, L.; Wang, G.; Cao, F. Biomass allocation patterns and allometric models of Ginkgo biloba. J. Beijing For. Univ. 2017, 39, 12–20. [Google Scholar]
- Li, H.; Lei, Y. Estimation and Evaluation of Forest Biomass Carbon Storage in China; China Forestry Publishing House: Beijing, China, 2010; pp. 52–58. (In Chinese) [Google Scholar]
- Zeng, W.-S. Developing Tree Biomass Models for Eight Major Tree Species in China. In Biomass Volume Estimation and Valorization for Energy; Jaya, S.T., Ed.; Books on Demand: Pasig City, PH, USA, 2017; pp. 3–21. [Google Scholar]
- State Forestry Administration of China (SFAC). Tree Biomass Models and Related Parameters to Carbon Accounting for Cunninghamia Lanceolata; China Standard Press: Beijing, China, 2014.
- Zhuang, H.; Becuwe, X.; Xiao, C.; Wang, Y.; Wang, H.; Yin, S.; Liu, C. Allometric Equation-Based Estimationof Biomass Carbon Sequestration in Metasequoia glyptostroboides Plantations in Chongming Island, Shanghai. J. Shanghai Jiaotong Univ. 2012, 30, 48–55. (In Chinese) [Google Scholar]
- Steichen, T.J.; Nicholas, J.C. A note on the concordance correlation coefficient. Stata J. 2002, 2, 183–189. [Google Scholar] [CrossRef] [Green Version]
- Liang, X. The use of a hand-held camera for individual tree 3D mapping in forest sample plots. Remote Sens. 2014, 6, 6587–6603. [Google Scholar] [CrossRef] [Green Version]
- Liang, X.; Wang, Y.; Jaakkola, A.; Kukko, A.; Kaartinen, H.; Hyyppä, J.; Honkavaara, E.; Liu, J. Forest Data Collection Using Terrestrial Image-Based Point Clouds from a Handheld Camera Compared to Terrestrial and Personal Laser Scanning. IEEE Trans. Geosci. Remote Sens. 2015, 53, 5117–5132. [Google Scholar] [CrossRef]
- Mokroš, M.; Liang, X.; Surový, P.; Valent, P.; Cernava, J.; Chudý, F.; Mergani, J. Evaluation of close-range photogrammetry image collection methods for estimating tree diameters. ISPRS Int. J. Geo-Inf. 2018, 7, 93. [Google Scholar] [CrossRef] [Green Version]
Figure 1.
The location of the study area and the situation under the forest.

Figure 2.
The appearance of the camera.

Figure 3.
Workflow diagram exhibiting the stepwise processing of the data.

Figure 4.
Image matching sequence diagram.
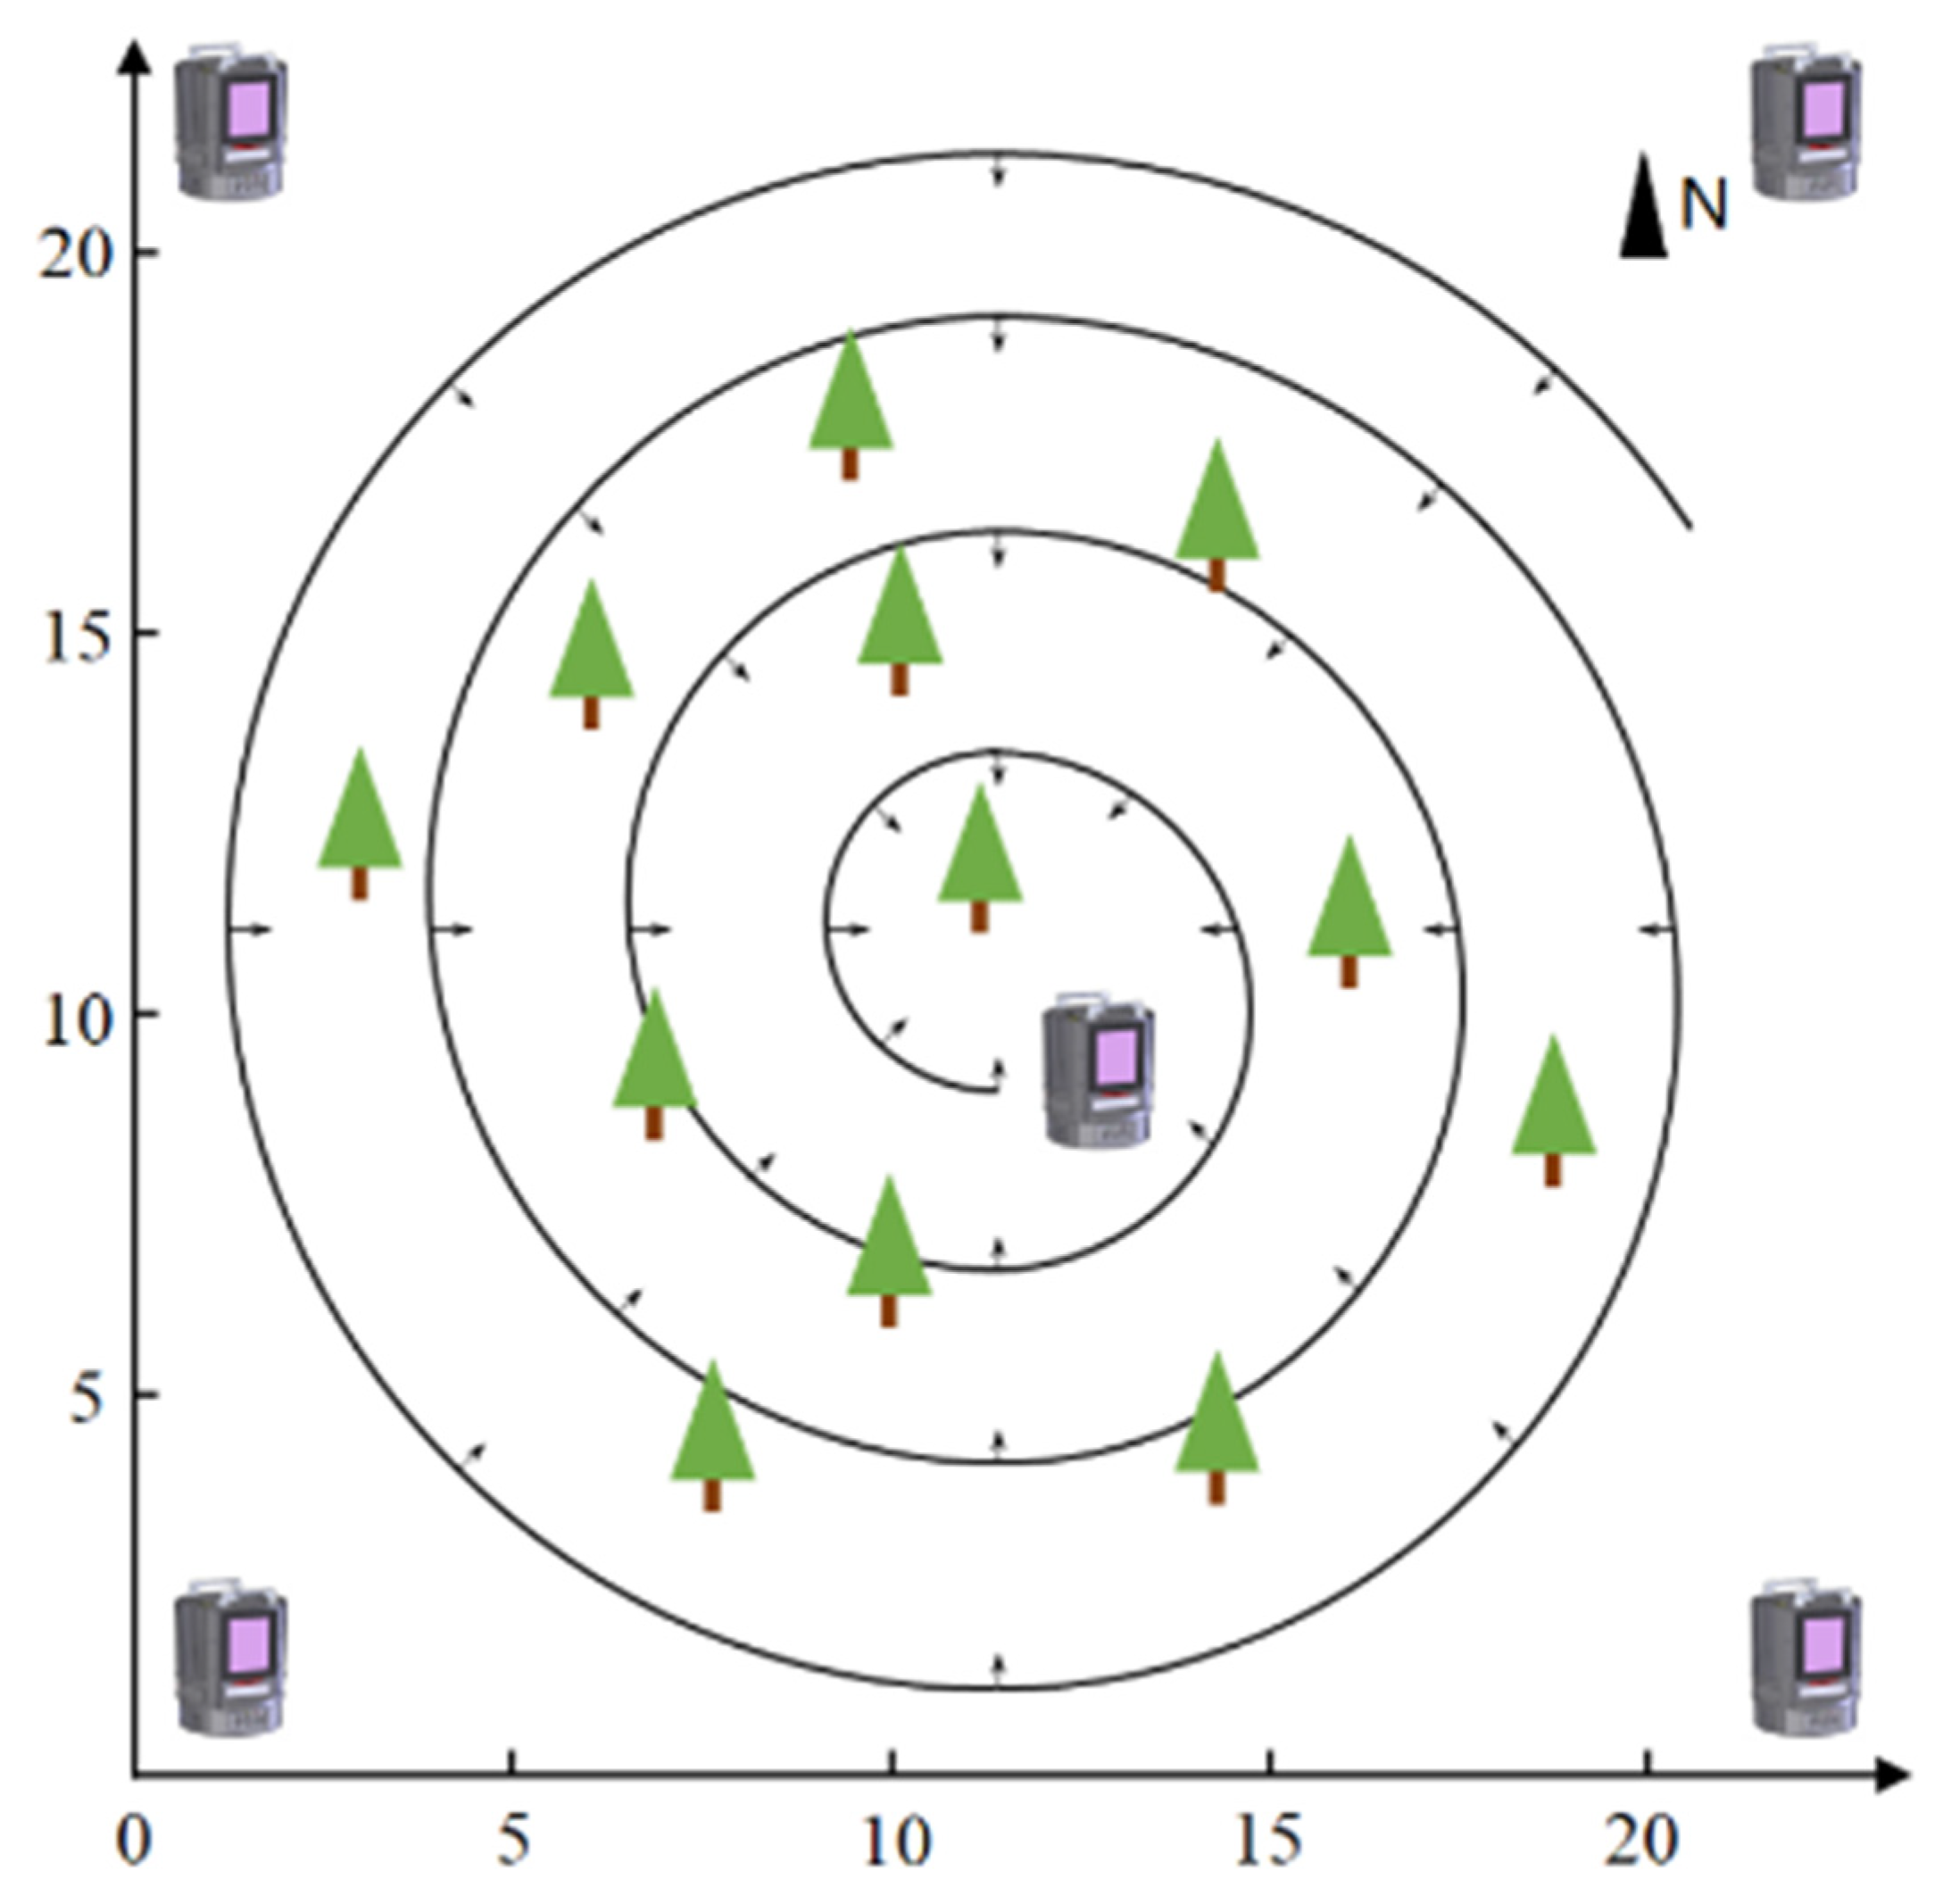
Figure 5.
Mean reprojection error per image.
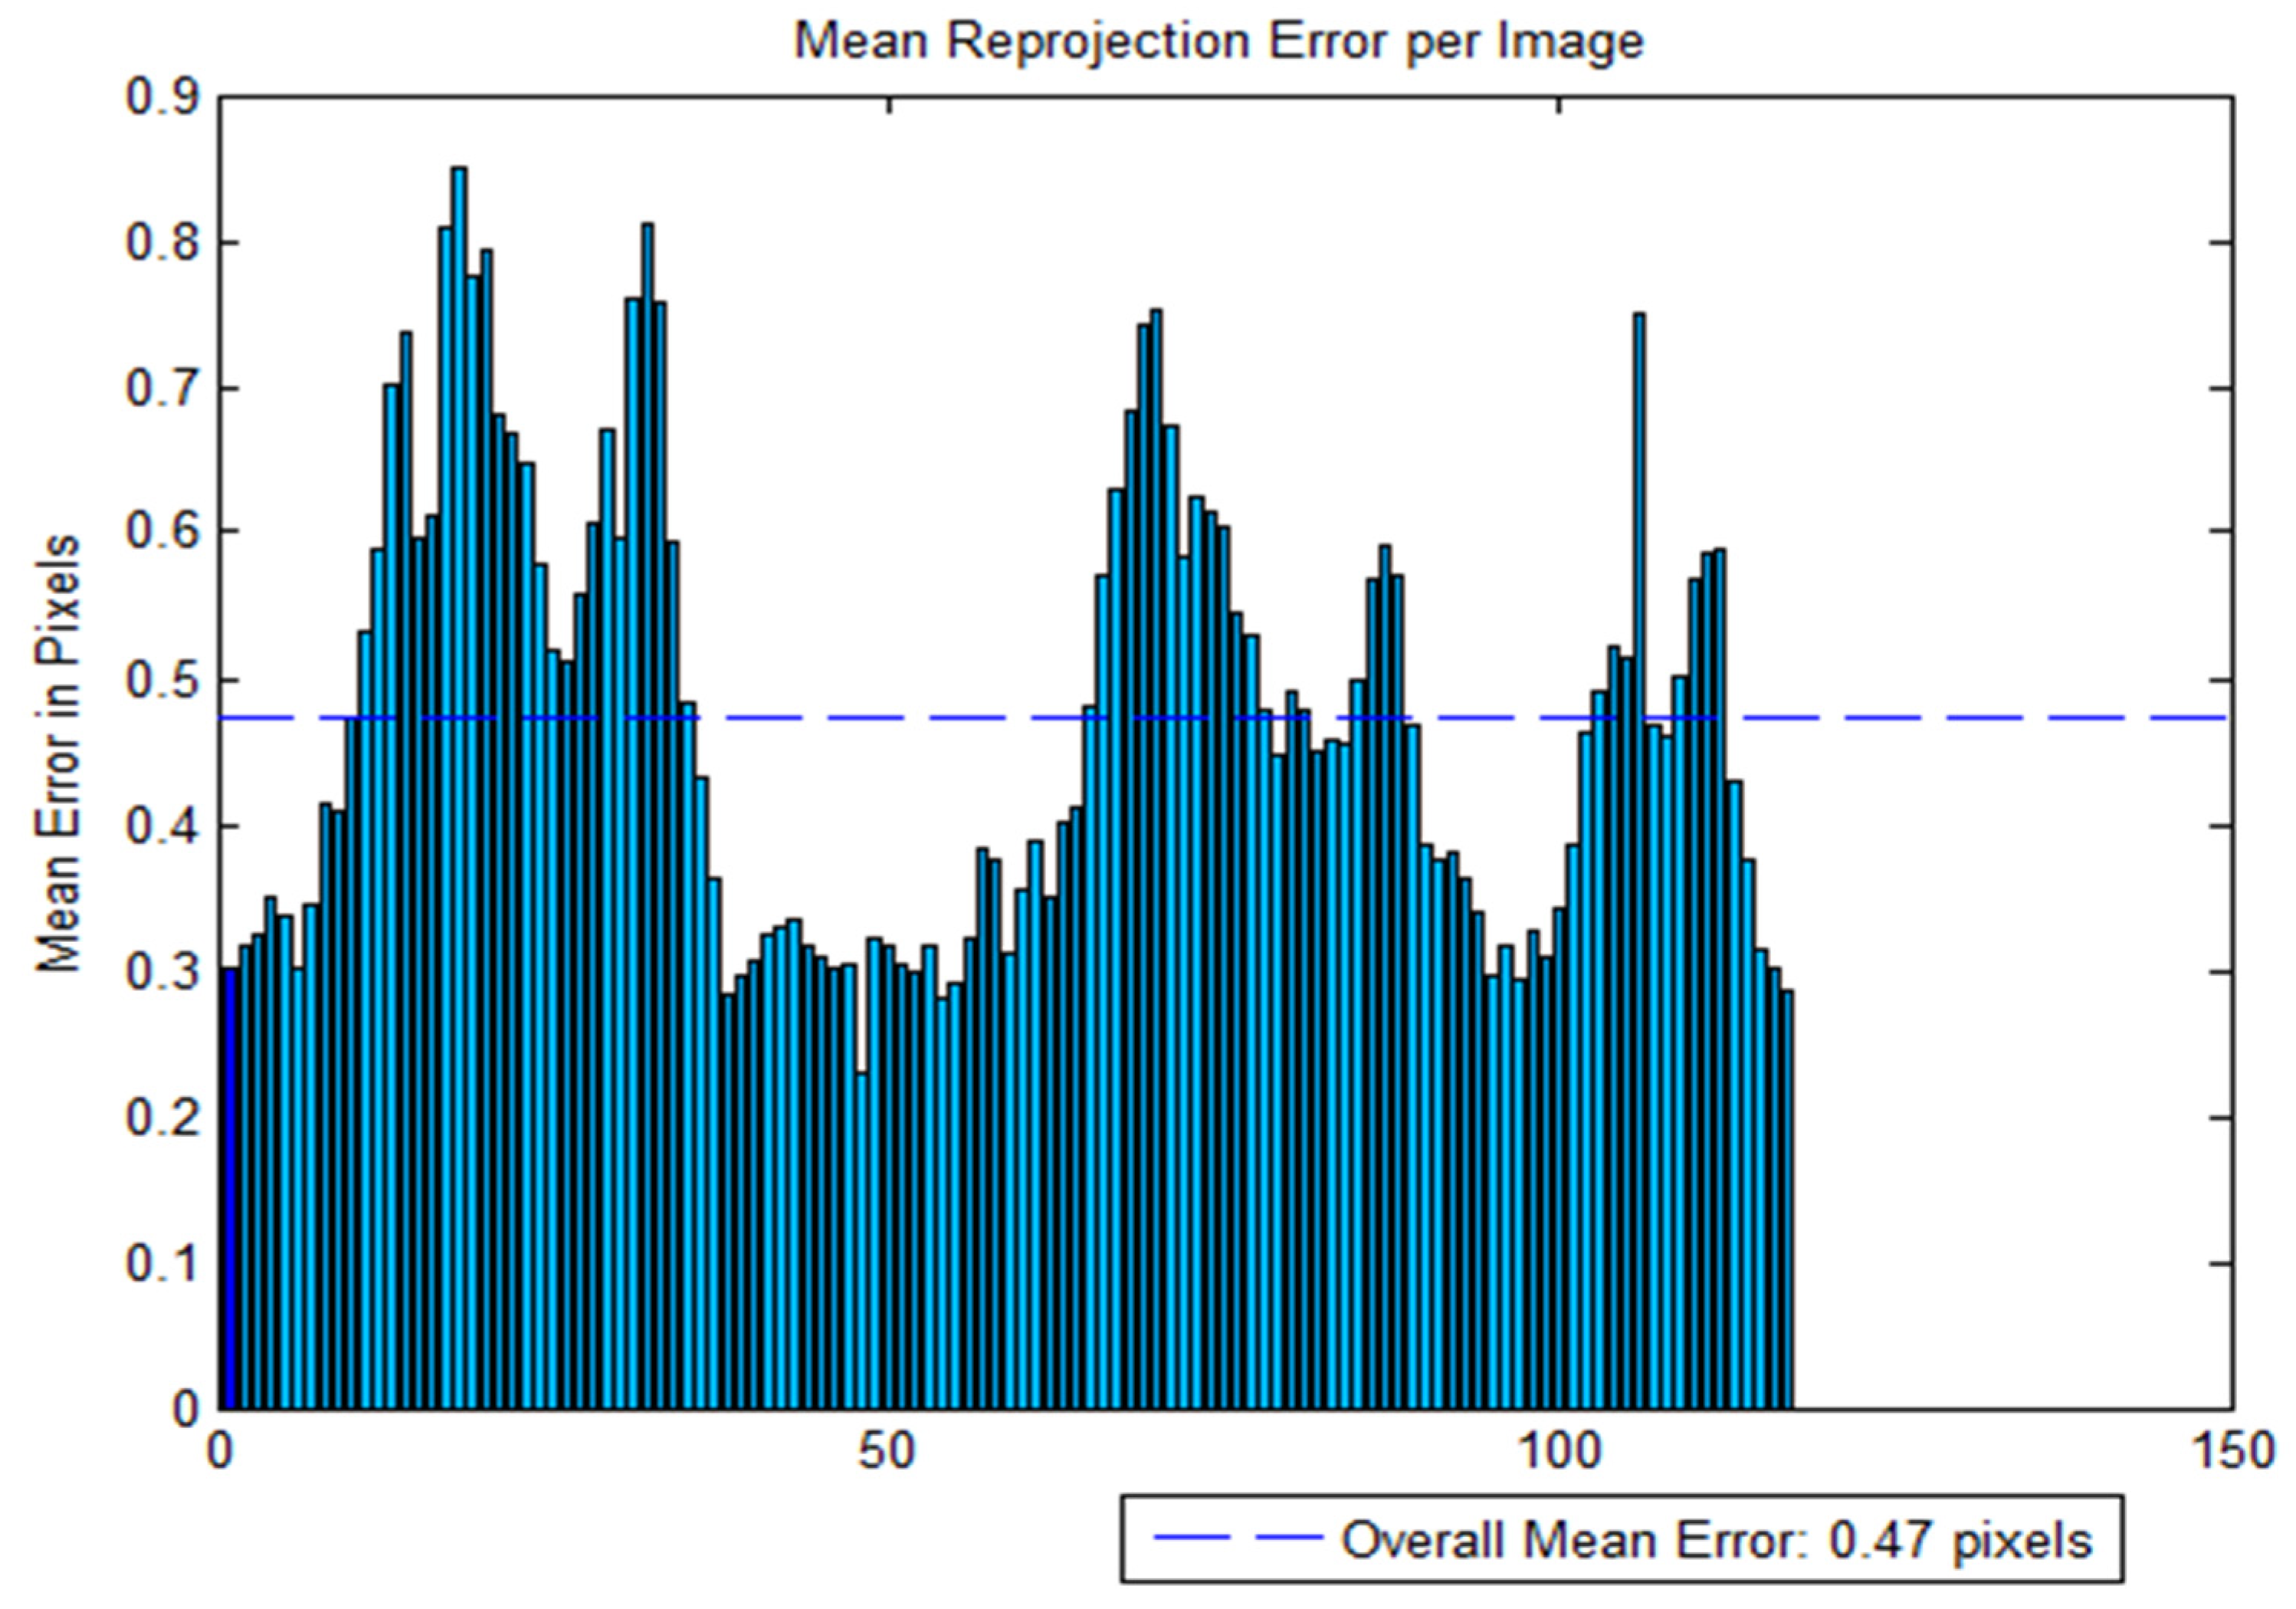
Figure 6.
3D point cloud of the observed plots.
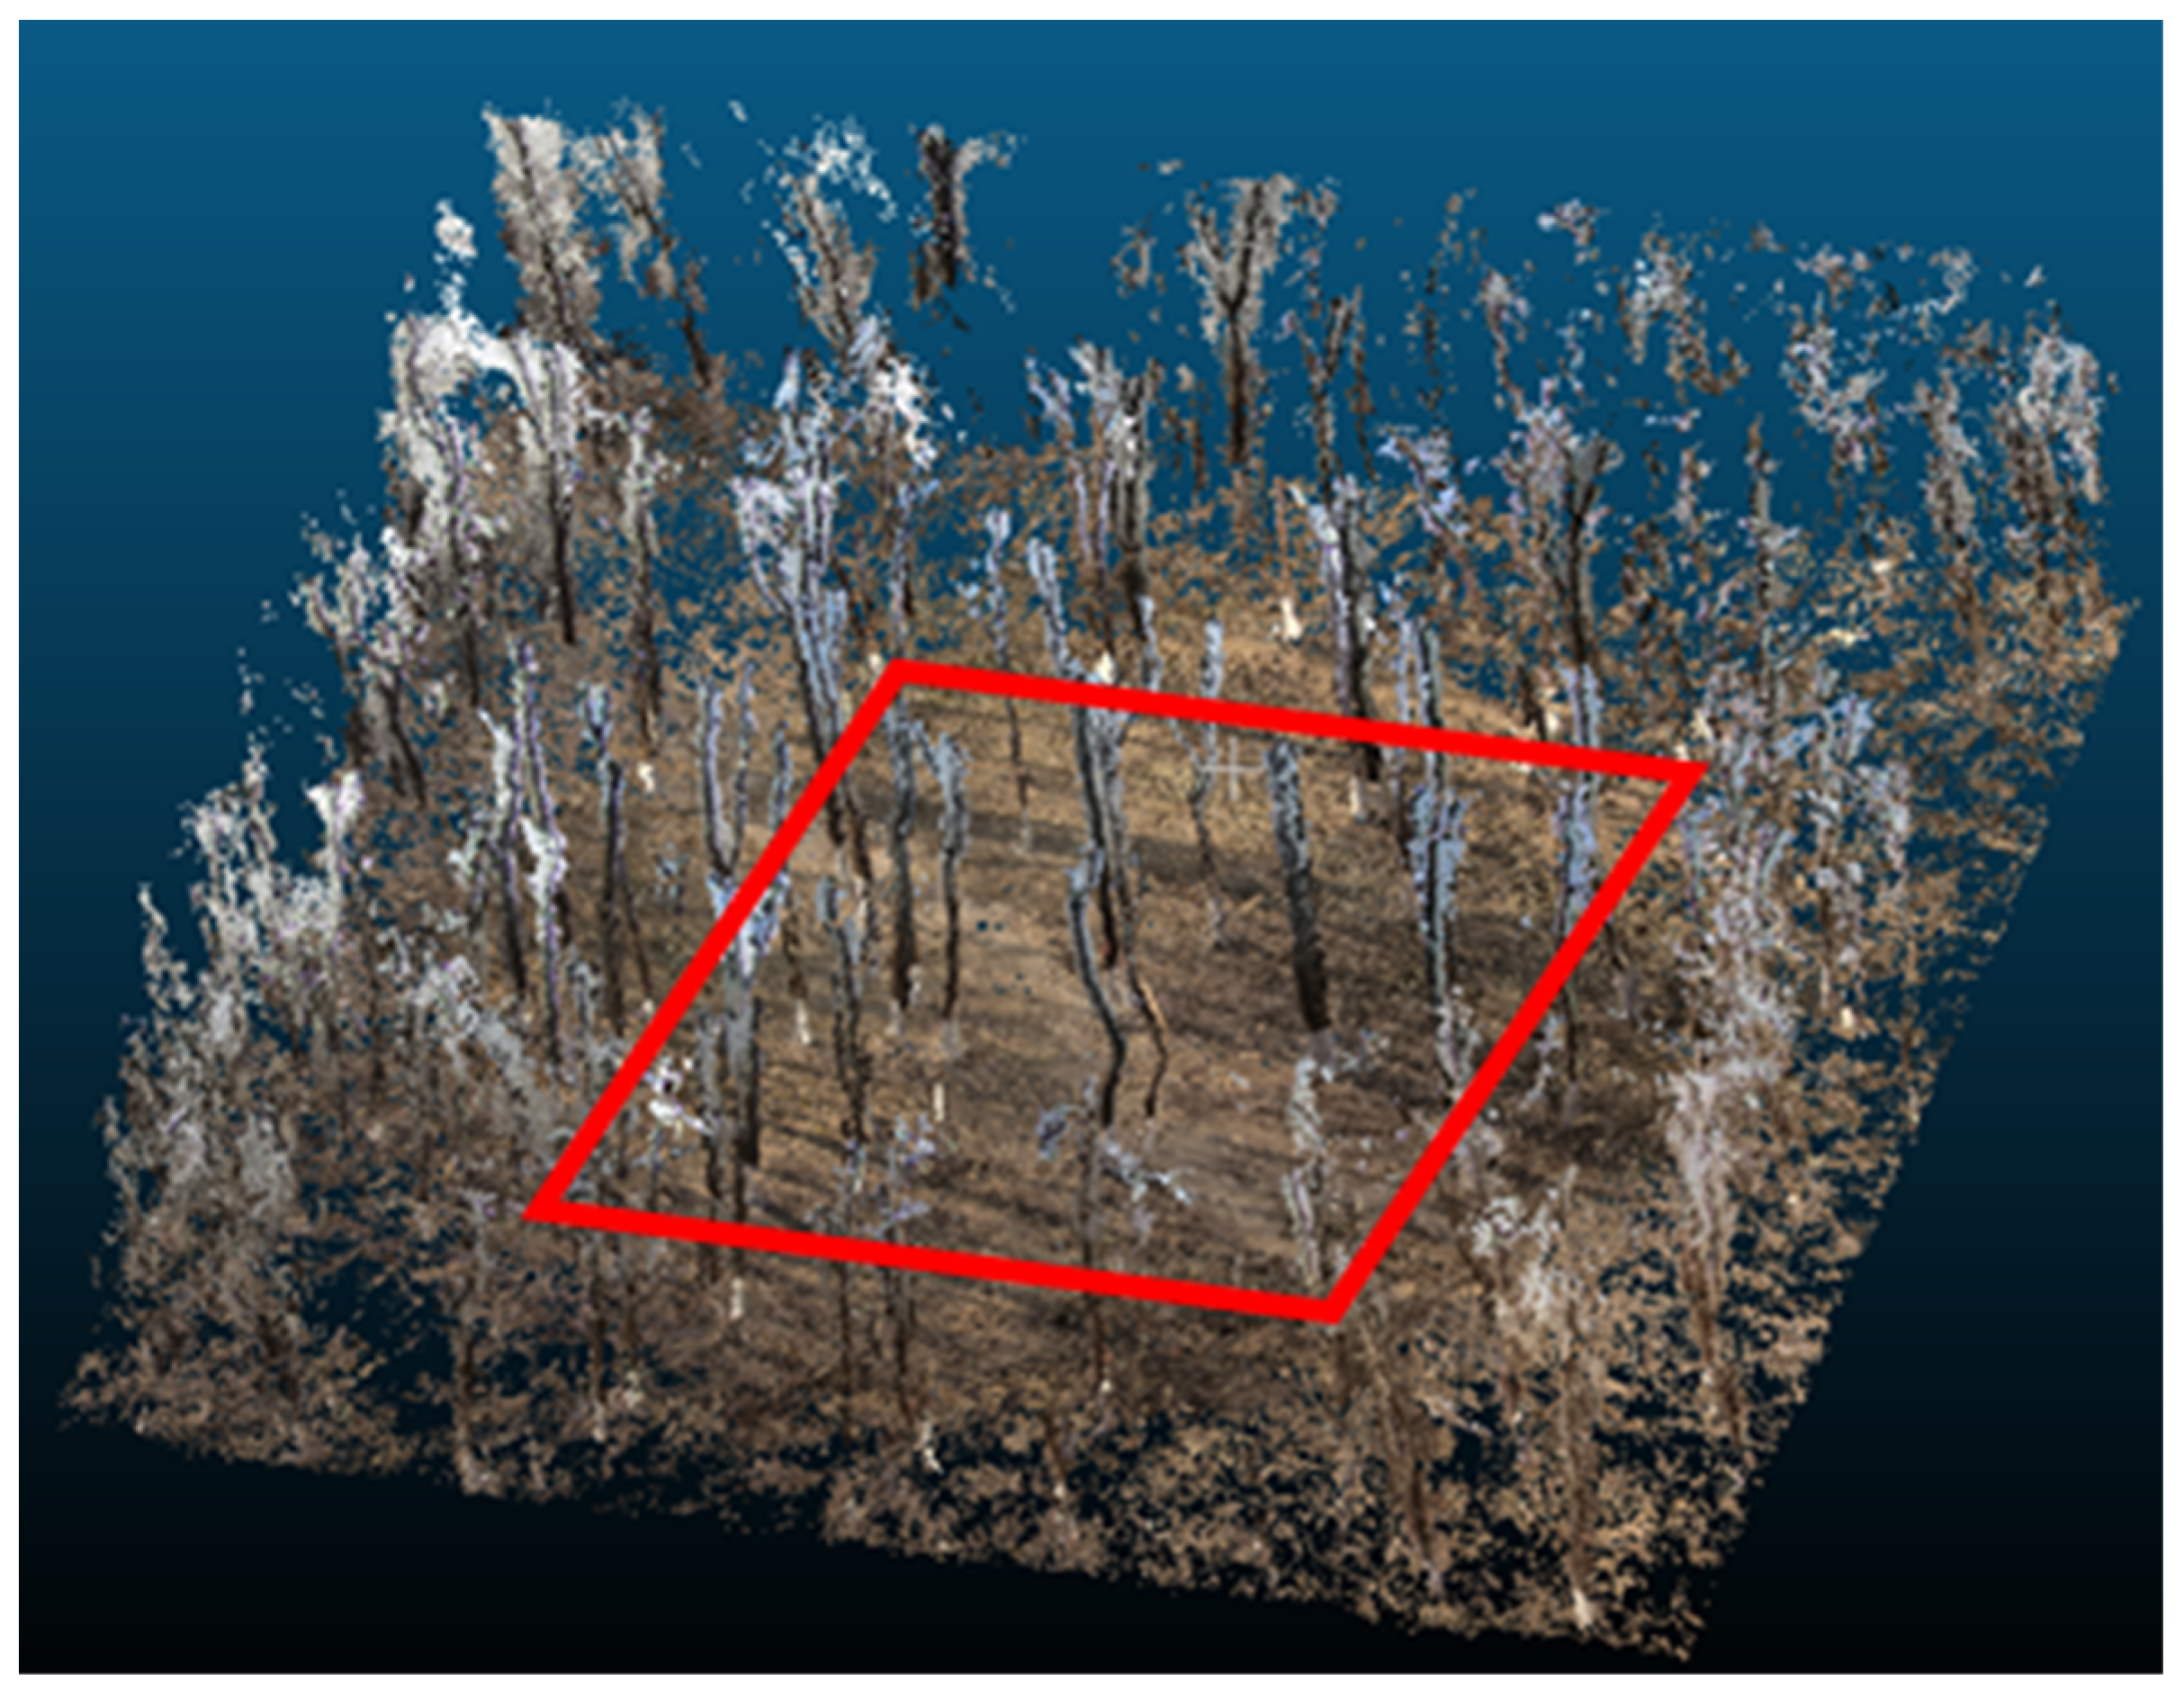
Figure 7.
DBH fitting based on point cloud data. (a) The point cloud data of all trees of one sample plot between 1.27 m and 1.32 m; (b) diagram of the trunk points in three-dimensional coordinates; (c) reconstructed cylinder model.
Figure 7.
DBH fitting based on point cloud data. (a) The point cloud data of all trees of one sample plot between 1.27 m and 1.32 m; (b) diagram of the trunk points in three-dimensional coordinates; (c) reconstructed cylinder model.

Figure 8.
The 3D point cloud from TLS.

Figure 9.
Comparison of the (DBH) from circle fitted data and field survey (reference DBH). (a) Comparison of the fitted DBH values of 134 trees with the reference values; (b) comparison of the TLS DBH values of 134 trees with the reference values; (c) comparison of the fitted DBH values of 134 trees with the TLS values; (d) residuals of DBHs from 134 trees. Comparison of the DBH data fitted with the data from survey; (e) residuals of DBHs from 134 trees. Comparison of the DBH data from TLS with the data from survey; (f) residuals of DBHs from 134 trees. Comparison of the DBH data fitted with the data from TLS.

Figure 10.
Cross-validation between videogrammetry and TLS. (a) Established linear regression model based 7 random plots. (b) Comparative analysis of the DBH based on videogrammetry and model prediction. Cross-validation between videogrammetry and survey. (c) Established linear regression model based 7 random plots. (d) Comparative analysis of the DBH based on videogrammetry and model prediction.
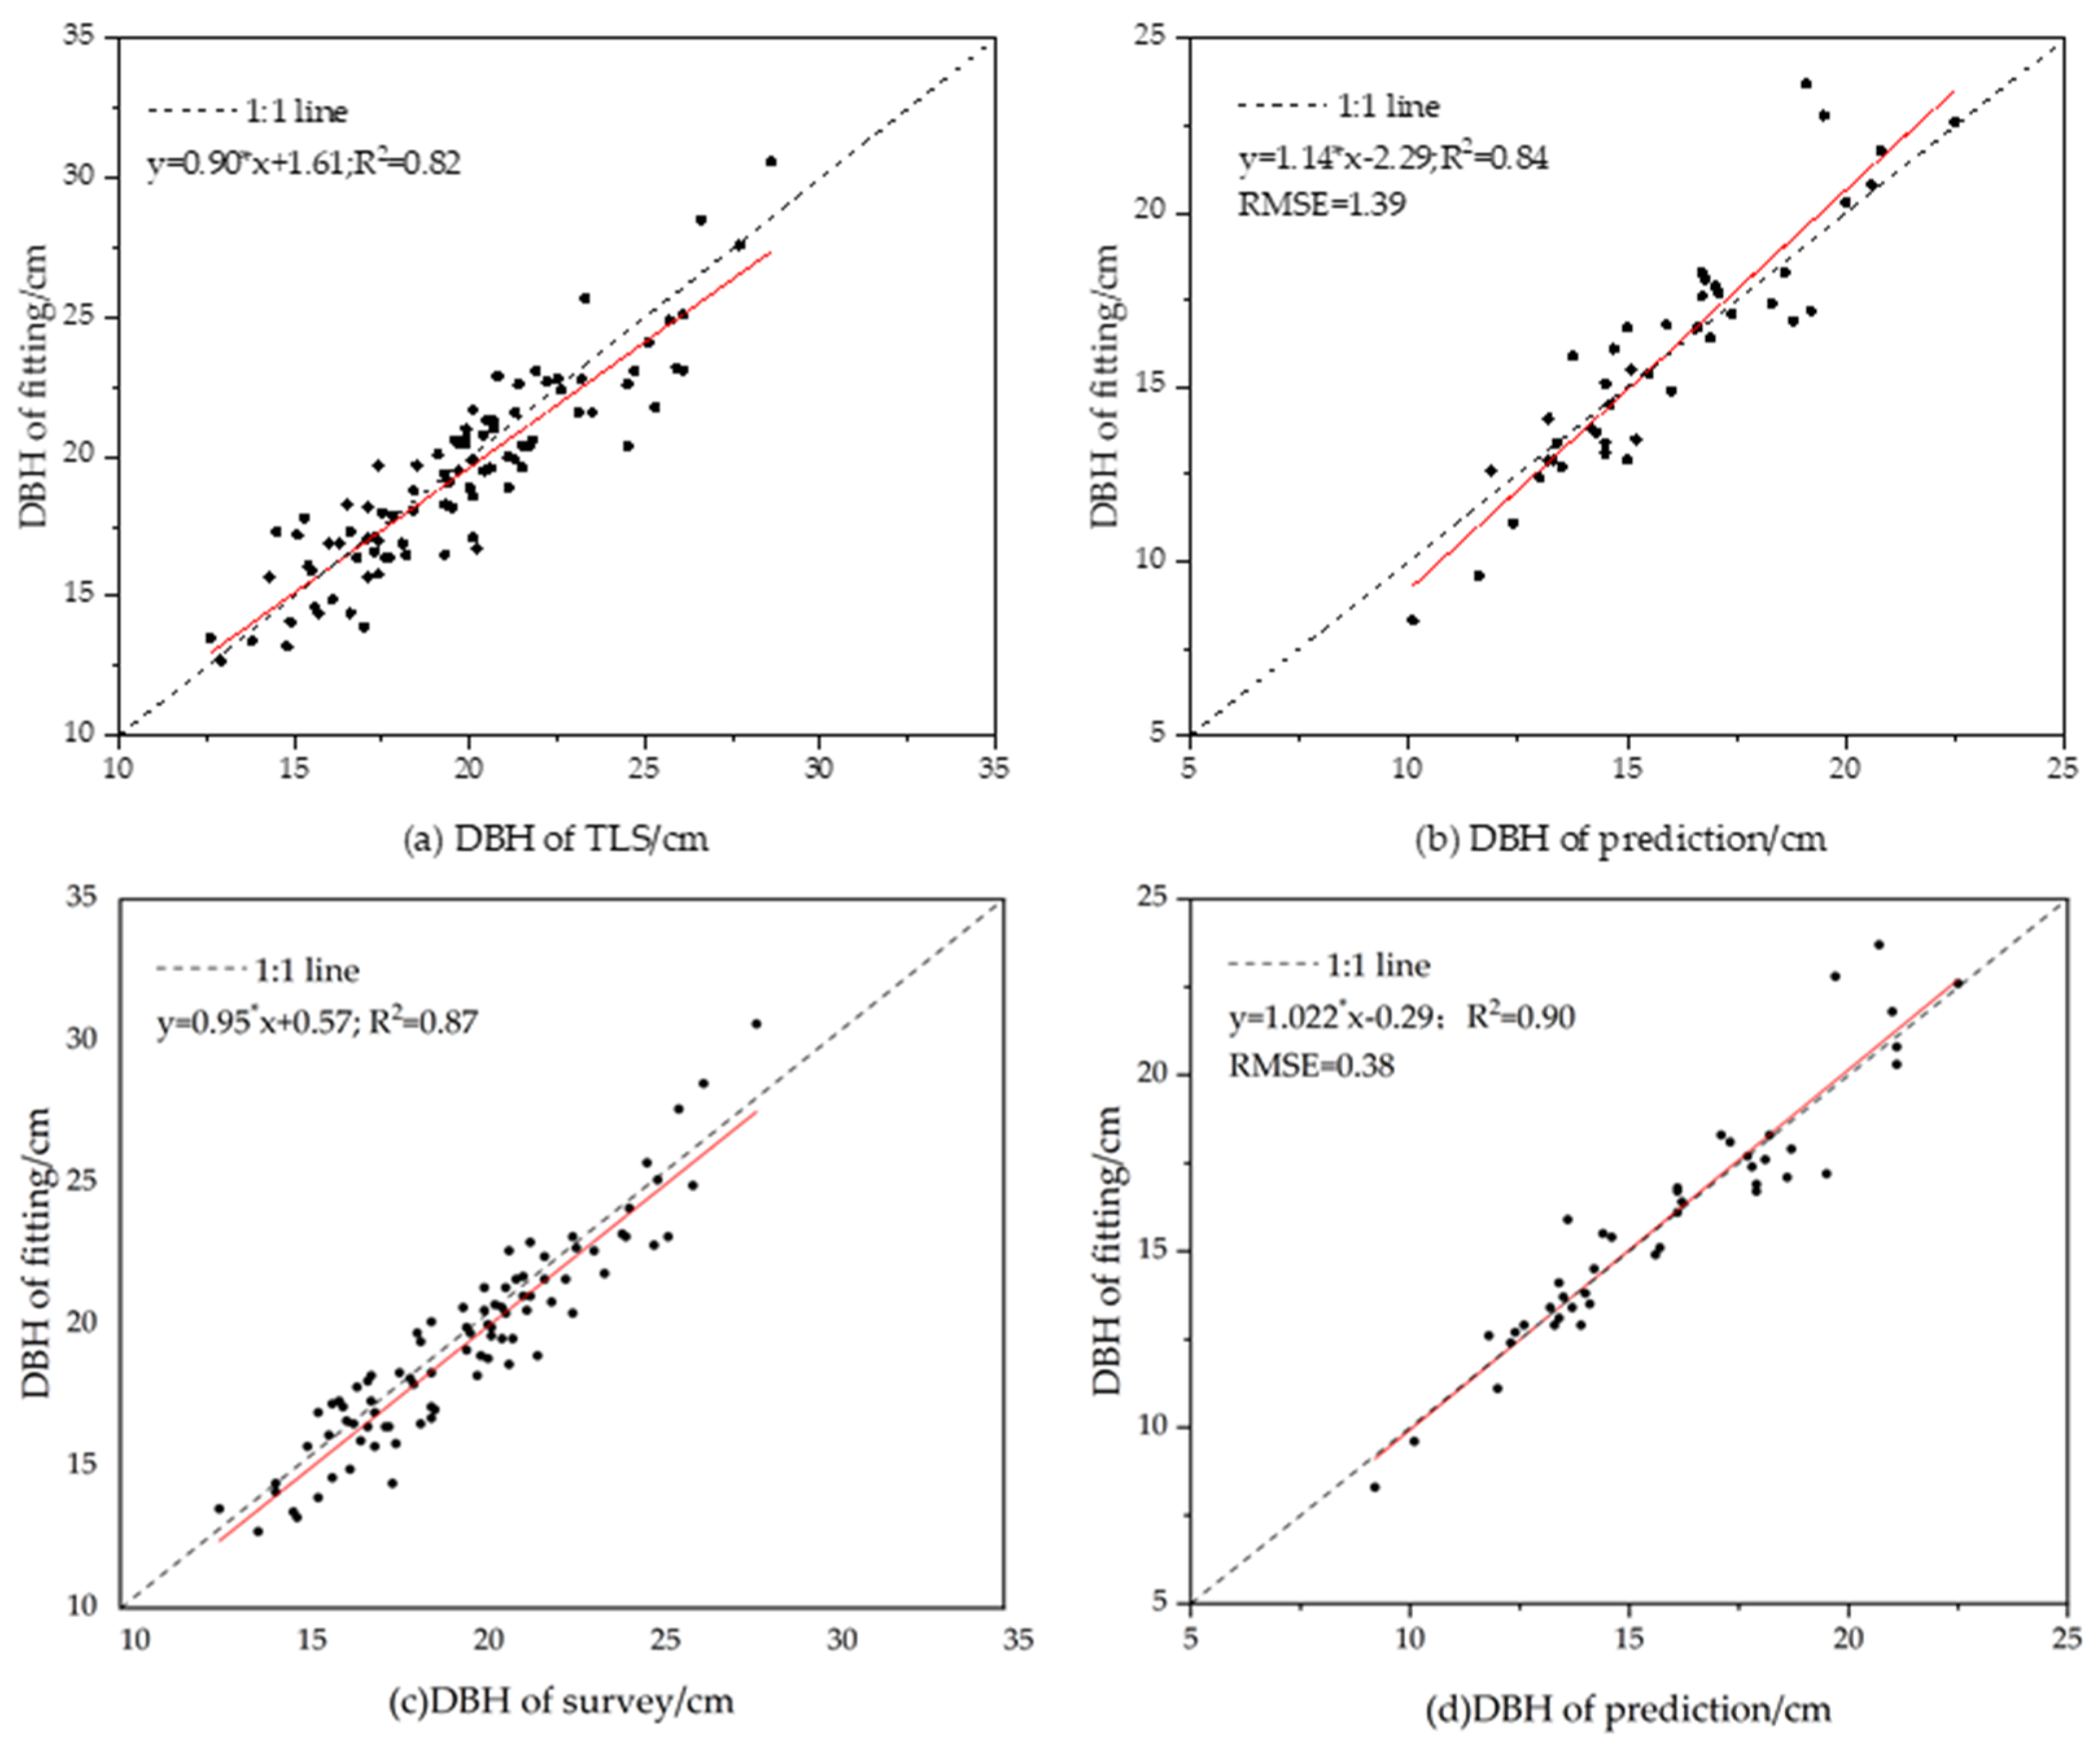
Figure 11.
Relative error with the DBH.

Figure 12.
Comparison of AGB obtained through videogrammetry and AGB derived from the survey. (a) Comparison of AGB and reference values for trees of different tree species; (b) residuals of AGB of trees of different species.
Figure 12.
Comparison of AGB obtained through videogrammetry and AGB derived from the survey. (a) Comparison of AGB and reference values for trees of different tree species; (b) residuals of AGB of trees of different species.
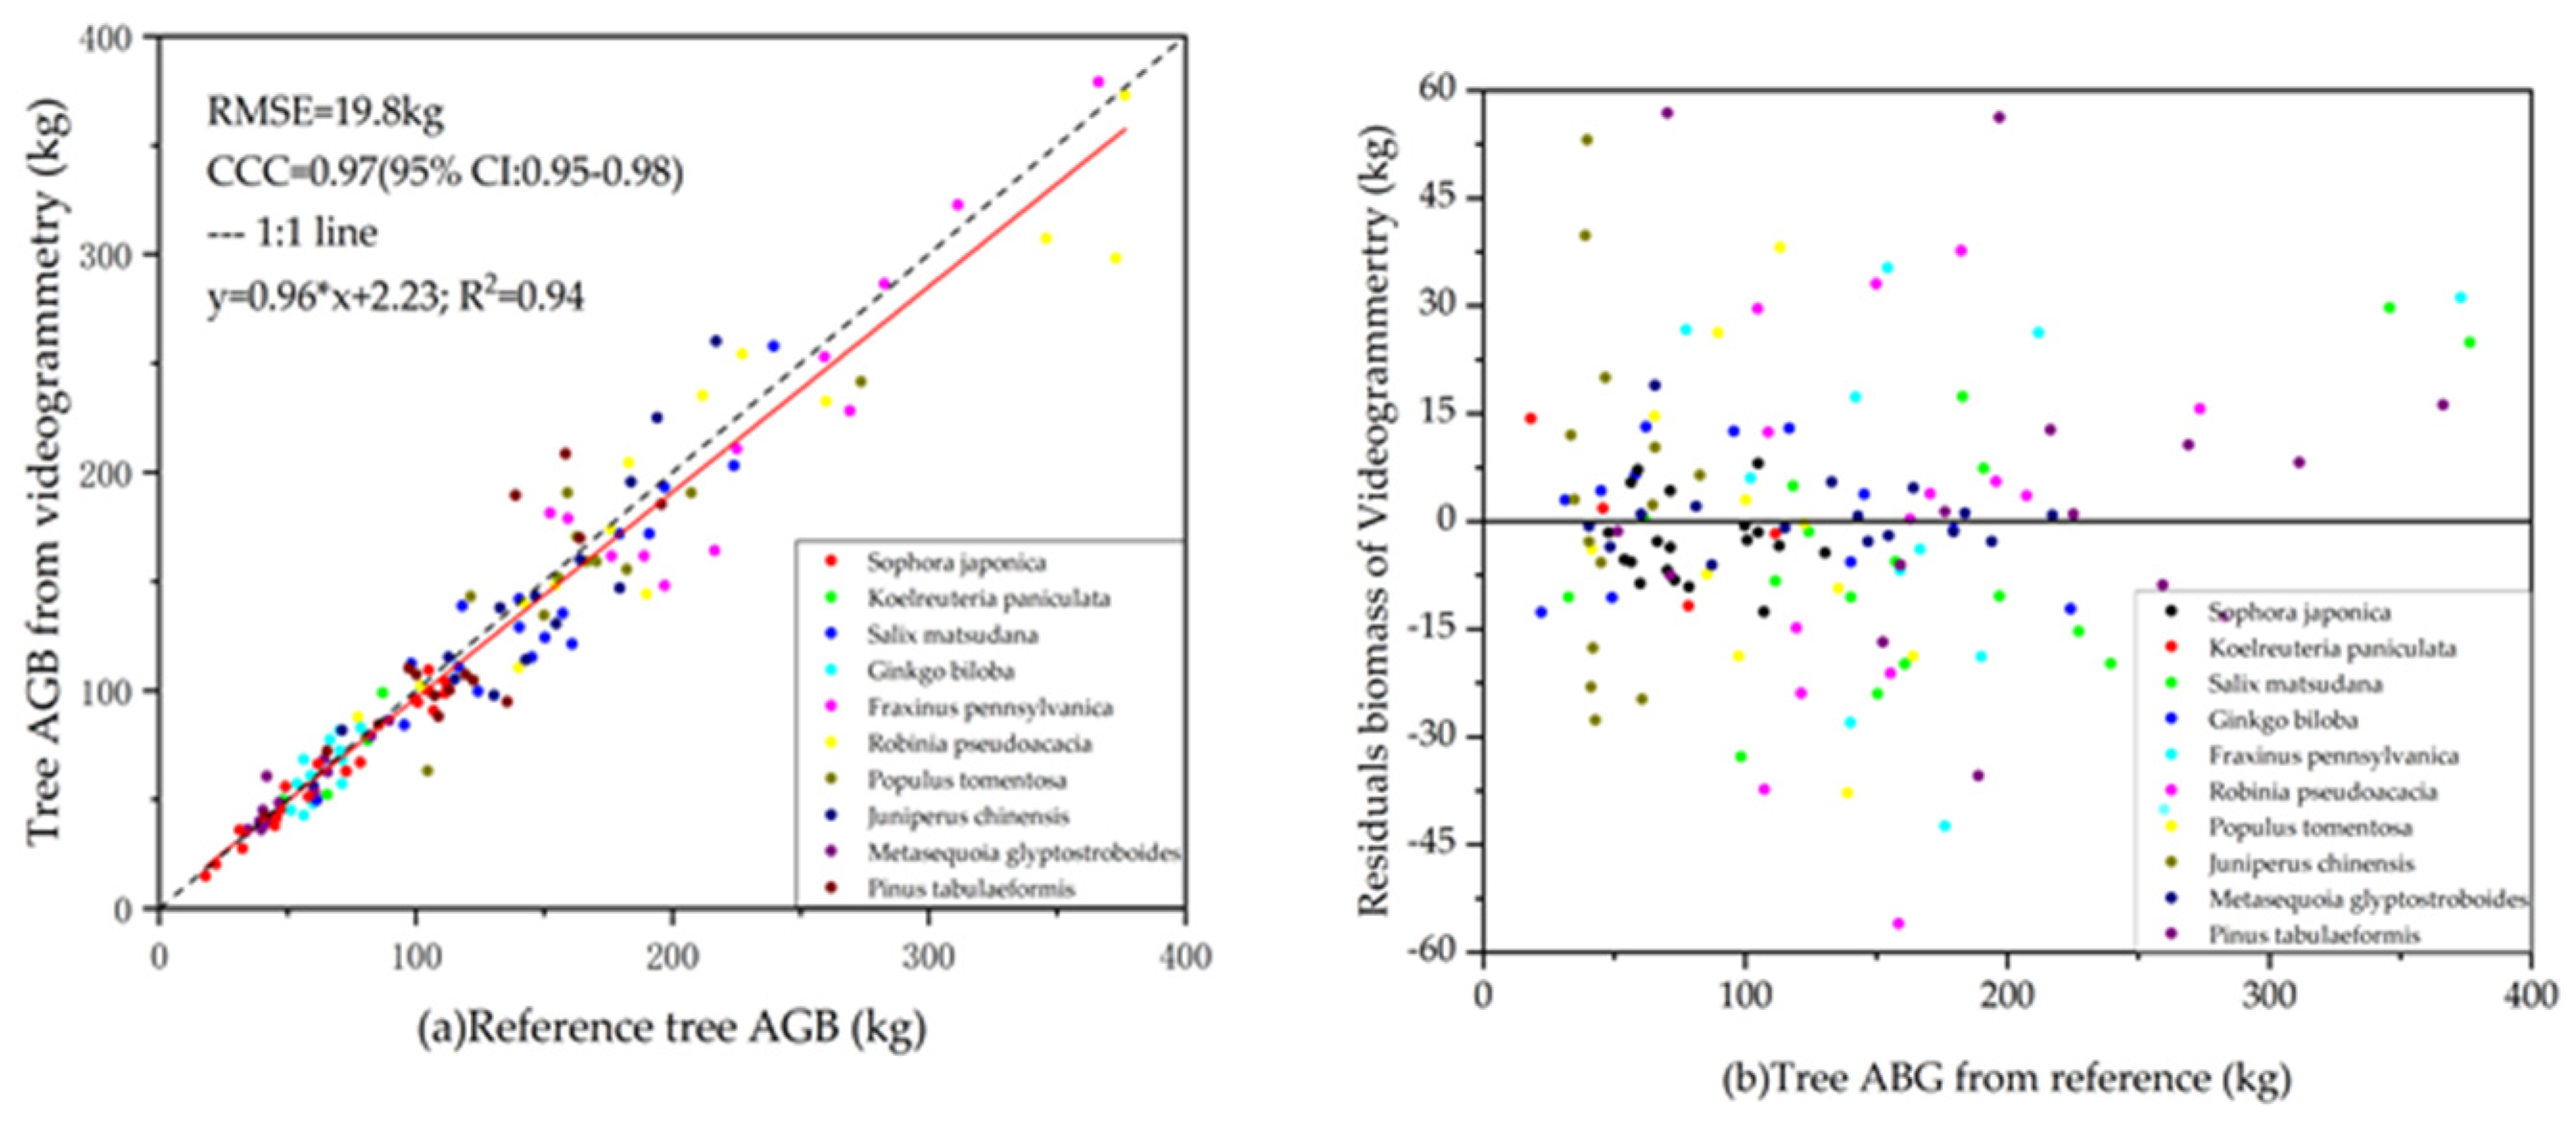
Figure 13.
Comparison of the tree AGB obtained through TLS data and AGB derived from the survey. (a) Comparison of tree AGB and references values for trees of different tree species; (b) residuals of AGB of trees of different tree species.
Figure 13.
Comparison of the tree AGB obtained through TLS data and AGB derived from the survey. (a) Comparison of tree AGB and references values for trees of different tree species; (b) residuals of AGB of trees of different tree species.

Table 1.
The camera parameters.
| Type | Parameter | Type | Parameter |
|---|---|---|---|
| Model | OT110 | Lens | FOV 80° F20 |
| Size | 121.9 × 36.9 × 28.6 mm | Battery life | 140 min |
| Weight | 116 g | Video resolution | 4K Ultra HD: 3840 × 2160 |
| Cradle head jitter suppression | ±0.005° | ISO range | Video: 100–3200 |
Table 2.
The calibration parameters of the Osmo Pocket camera.
| No. | Attribute | Parameter |
|---|---|---|
| 1 | Center x 0 | 1346.4 |
| 2 | Center y 0 | 10,262,000 |
| 4 | Radial distortion factor K1 | 0.0173 |
| 5 | Radial distortion factor K2 | 0.0099 |
| 6 | Radial distortion factor K3 | 00061 |
| 7 | Tangential distortion coefficient P1 | 0.0021 |
| 8 | Tangential distortion coefficient P2 | 0.00070178 |
Table 3.
Accuracies of the DBH estimation.
| Species | Model Source | Model | R2 |
|---|---|---|---|
| Sophora japonica | Wang et al. [33] | Wagb = 0.171D2.112 | - |
| Koelreuteria paniculata | Zhang et al. [34] | Wagb = 0.12238D2.13793 | 0.95 |
| Salix matsudana | Zeng [35] | Wagb = 0.1323D7/3 | - |
| Ginkgo biloba | Liu et al. [36] | Wagb = e(−2.56+2.40lnD) | 0.98 |
| Fraxinus pennsylvanica | Li et al. [32,37] | Wagb = 0.0495502(D2H)0.952453 | - |
| Robinia pseudoacacia | Zeng [35] | Wagb = 0.2022D7/3 | - |
| Populus tomentosa | Zeng [38] | Wagb = 0.09198D2.4490 | - |
| Juniperus chinensis | SFAC [39] | Wagb = 0.2479D2.0333 | - |
| Metasequoia glyptostroboides | Zhuang et al. [40] | Wagb = 0.06291D2.4841 | 0.972 |
| Pinus tabulaeformis | LY [41] | Wagb = 0.086112D2.46157 | 0.954 |
Table 4.
Detailed parameters of videogrammetry.
| Sample No. | Video Duration (min) | Number of Selected Frames | Number of 3D Points | Processing Time (min) |
|---|---|---|---|---|
| 1 | 4.6 | 701 | 3,466,149 | 201 |
| 2 | 3.7 | 630 | 3,214,592 | 206 |
| 3 | 4.3 | 583 | 4,965,126 | 254 |
| 4 | 3.9 | 519 | 3,158,812 | 218 |
| 5 | 4.1 | 625 | 4,215,669 | 221 |
| 6 | 3.8 | 532 | 3,120,035 | 237 |
| 7 | 3.5 | 571 | 3,694,914 | 212 |
| 8 | 4.7 | 679 | 5,789,210 | 251 |
| 9 | 3.5 | 561 | 5,248,952 | 203 |
| 10 | 3.9 | 496 | 4,329,894 | 237 |
Table 5.
Accuracies of the DBH estimation.
| Bias | Bias% | RMSE | RMSE% | |
|---|---|---|---|---|
| Cylinder fitting extracted DBH (cm) | −0.62 | −3.14 | 1.08 | 5.52 |
| Circular fitting extracted DBH (cm) | −0.01 | −0.04 | 0.79 | 4.03 |
Table 6.
The precision of the DBH from circle fitting and TLS point clouds.
| Sample No. | Circle Fitting vs. Survey | TLS vs. Survey | Circle Fitting vs. TLS | Number of Trees | |||||||||
|---|---|---|---|---|---|---|---|---|---|---|---|---|---|
| Bias | Bias% | RMSE | RMSE% | Bias | Bias% | RMSE | RMSE% | Bias | Bias% | RMSE | RMSE% | ||
| 1 | −0.62 | −3.14 | 1.08 | 5.52 | −0.05 | −0.27 | 0.94 | 4.80 | −0.61 | −2.88 | 1.26 | 5.96 | 13 |
| 2 | −0.17 | −1.02 | 1.121 | 6.81 | −0.38 | −2.34 | 0.84 | 5.16 | 0.22 | 1.35 | 1.58 | 9.87 | 12 |
| 3 | −0.64 | −3.19 | 1.24 | 6.20 | −0.3 | −1.50 | 1.1 | 5.47 | −0.34 | −1.72 | 1.48 | 7.47 | 15 |
| 4 | −0.42 | −2.20 | 1.07 | 5.68 | −0.15 | −0.79 | 0.85 | 4.49 | −0.27 | −1.42 | 1.58 | 8.41 | 12 |
| 5 | −0.59 | −3.08 | 1.45 | 7.53 | 0.26 | 1.37 | 1.04 | 5.42 | −0.86 | −4.40 | 1.51 | 7.74 | 14 |
| 6 | −0.51 | −2.39 | 1.38 | 6.47 | −0.25 | −1.19 | 0.98 | 4.59 | −0.25 | −1.21 | 1.19 | 5.63 | 11 |
| 7 | −0.32 | −1.43 | 1.74 | 7.70 | 0.21 | 0.95 | 1.19 | 5.26 | −0.54 | −2.35 | 2.07 | 9.12 | 14 |
| 8 | 0.42 | 2.87 | 1.07 | 7.36 | −0.12 | −1.46 | 0.91 | 6.23 | 0.24 | 1.78 | 1.02 | 7.55 | 16 |
| 9 | −0.48 | −3.19 | 0.88 | 5.91 | 0.23 | 1.68 | 0.74 | 4.94 | −0.73 | −4.78 | 1.33 | 8.80 | 12 |
| 10 | −0.12 | −0.65 | 1.43 | 7.76 | −0.55 | −2.96 | 1.05 | 5.70 | 0.43 | 2.38 | 1.64 | 9.15 | 15 |
Table 7.
SWOT analysis.
| Strengths | Weaknesses | Opportunities | Threats | |
|---|---|---|---|---|
| Videogrammetry | 1.Lightweight equipment; 2. Fast data collection; 3. Low labor costs. | 1. Indoors data processing takes more time; 2. Need a scale. | Provide new ideas for forest resource survey methods. | Data processing algorithms need to be further optimized. |
| TLS | High precision. | 1.Heavy equipment; 2. Well-designed collection plan; 3. Time-consuming. | Has been recognized by the industry. | - |
| Field survey | High precision. | 1.High labor cost; 2. Long time in the field. | - | - |
Publisher’s Note: MDPI stays neutral with regard to jurisdictional claims in published maps and institutional affiliations. |
© 2021 by the authors. Licensee MDPI, Basel, Switzerland. This article is an open access article distributed under the terms and conditions of the Creative Commons Attribution (CC BY) license (https://creativecommons.org/licenses/by/4.0/).
Share and Cite
MDPI and ACS Style
Lian, Y.; Feng, Z.; Huai, Y.; Lu, H.; Chen, S.; Li, N. Terrestrial Videogrammetry for Deriving Key Forest Inventory Data: A Case Study in Plantation. Remote Sens. 2021, 13, 3138. https://0-doi-org.brum.beds.ac.uk/10.3390/rs13163138
AMA Style
Lian Y, Feng Z, Huai Y, Lu H, Chen S, Li N. Terrestrial Videogrammetry for Deriving Key Forest Inventory Data: A Case Study in Plantation. Remote Sensing. 2021; 13(16):3138. https://0-doi-org.brum.beds.ac.uk/10.3390/rs13163138
Chicago/Turabian StyleLian, Yining, Zhongke Feng, Yongjian Huai, Hao Lu, Shilin Chen, and Niwen Li. 2021. "Terrestrial Videogrammetry for Deriving Key Forest Inventory Data: A Case Study in Plantation" Remote Sensing 13, no. 16: 3138. https://0-doi-org.brum.beds.ac.uk/10.3390/rs13163138
Note that from the first issue of 2016, this journal uses article numbers instead of page numbers. See further details here.