
Raindrop Size Distributions of North Indian Ocean Tropical Cyclones Observed at the Coastal and Inland Stations in South India

 , , , , ,
Abstract
:
1. Introduction
2. Data and Methods
2.1. Tropical Cyclones
2.2. Parsivel Disdrometer
2.3. Reanalysis Data
3. Results
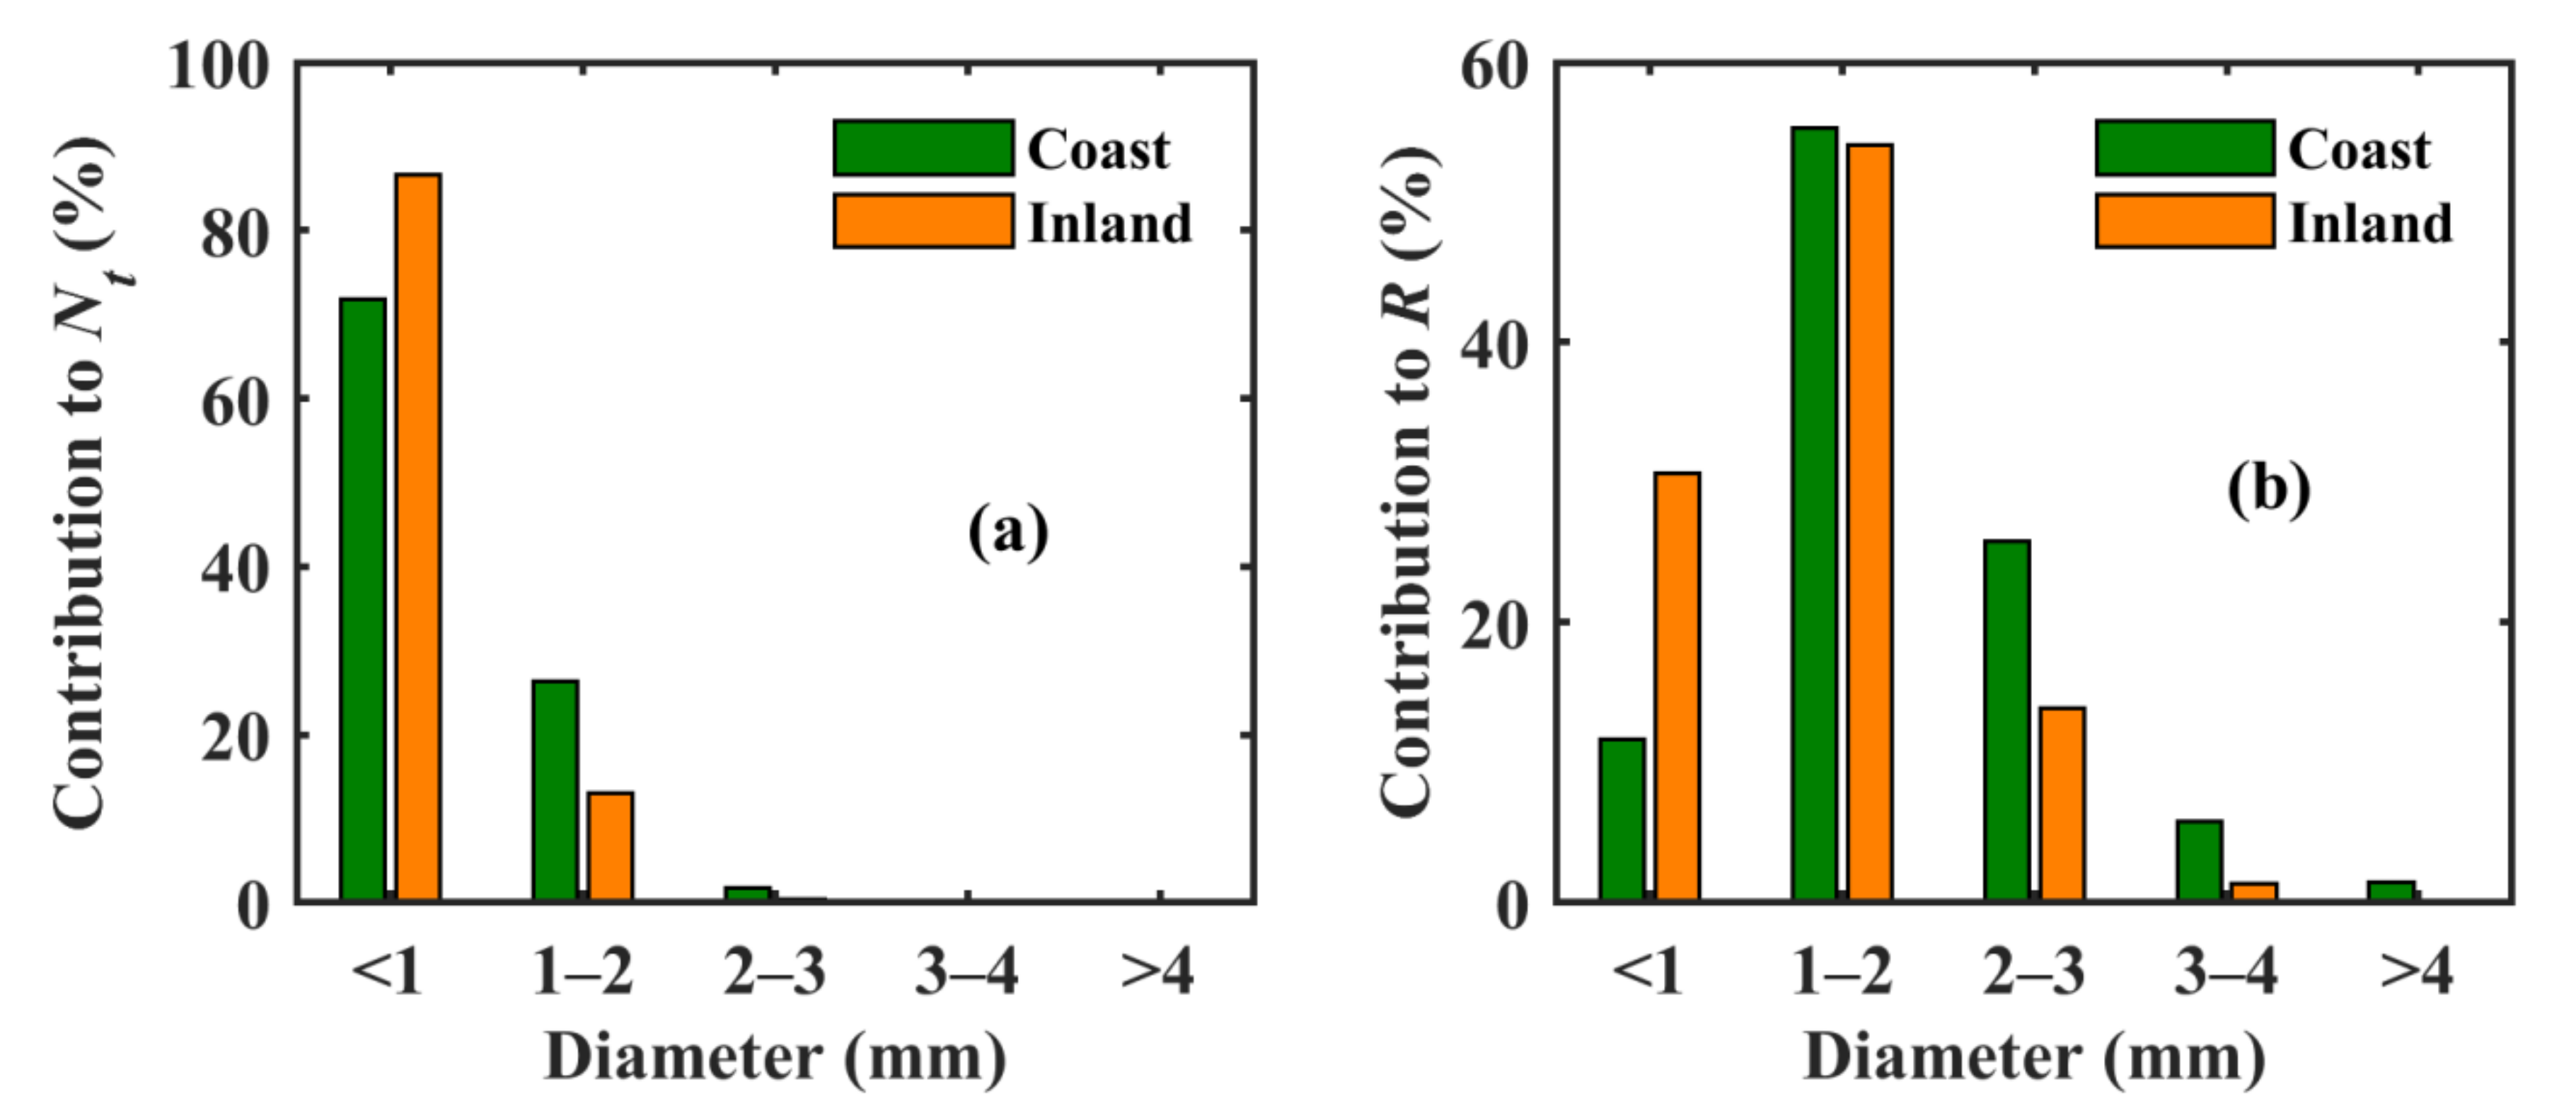
3.1. Contribution of Raindrop Diameters to Nt and R
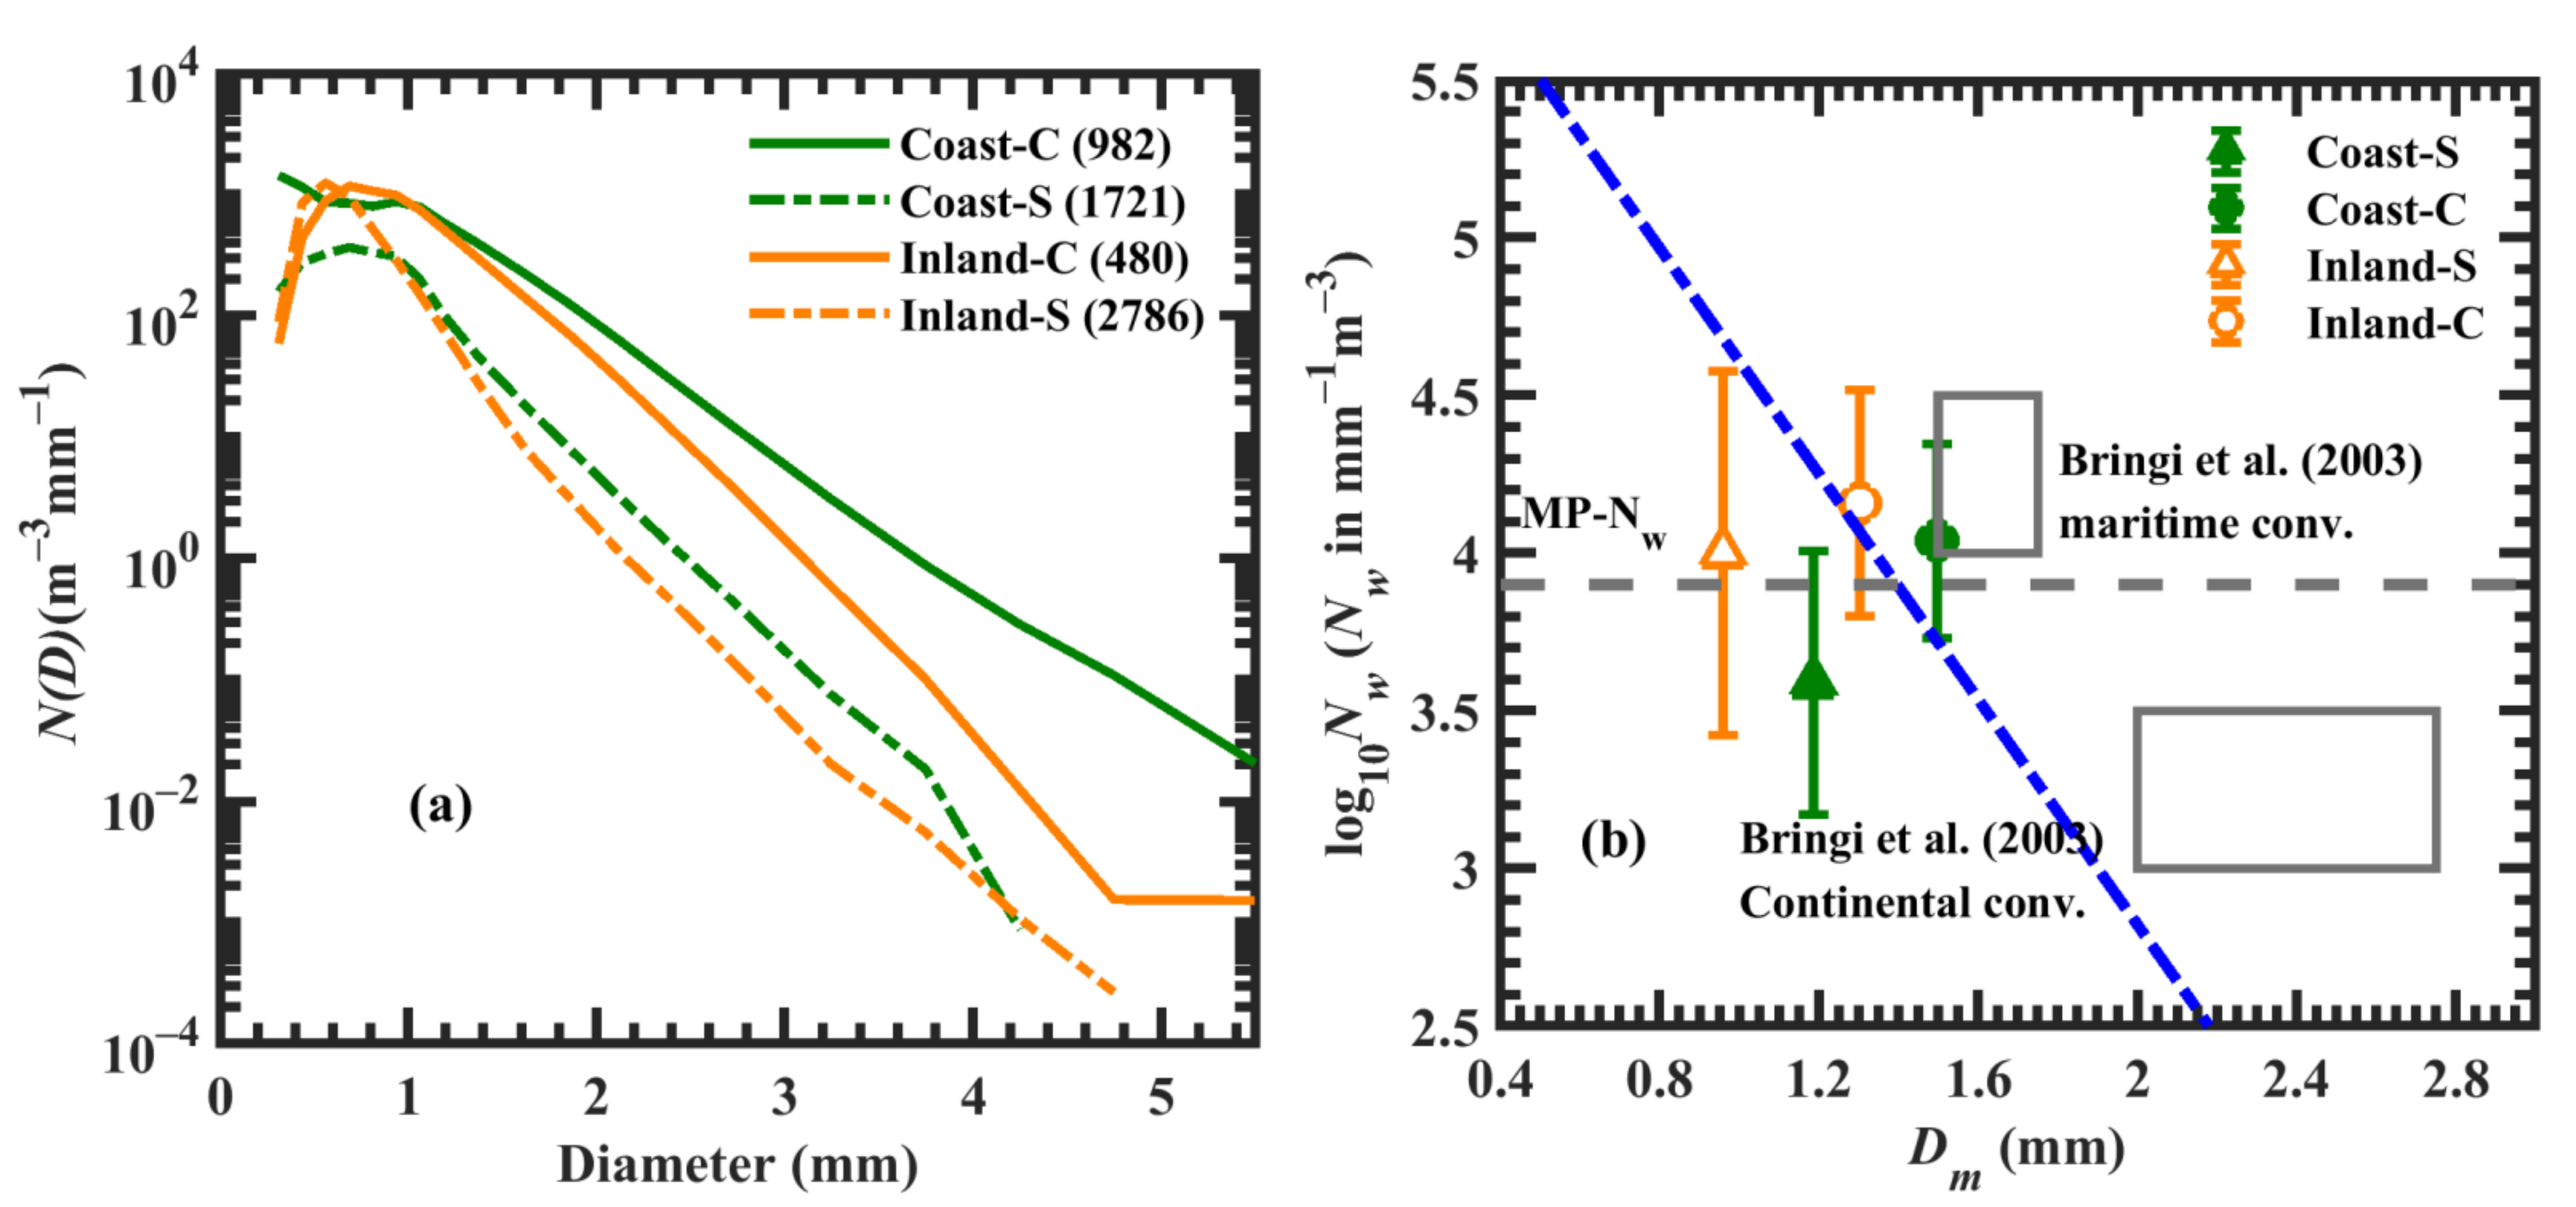
3.2. RSDs in Precipitation Types
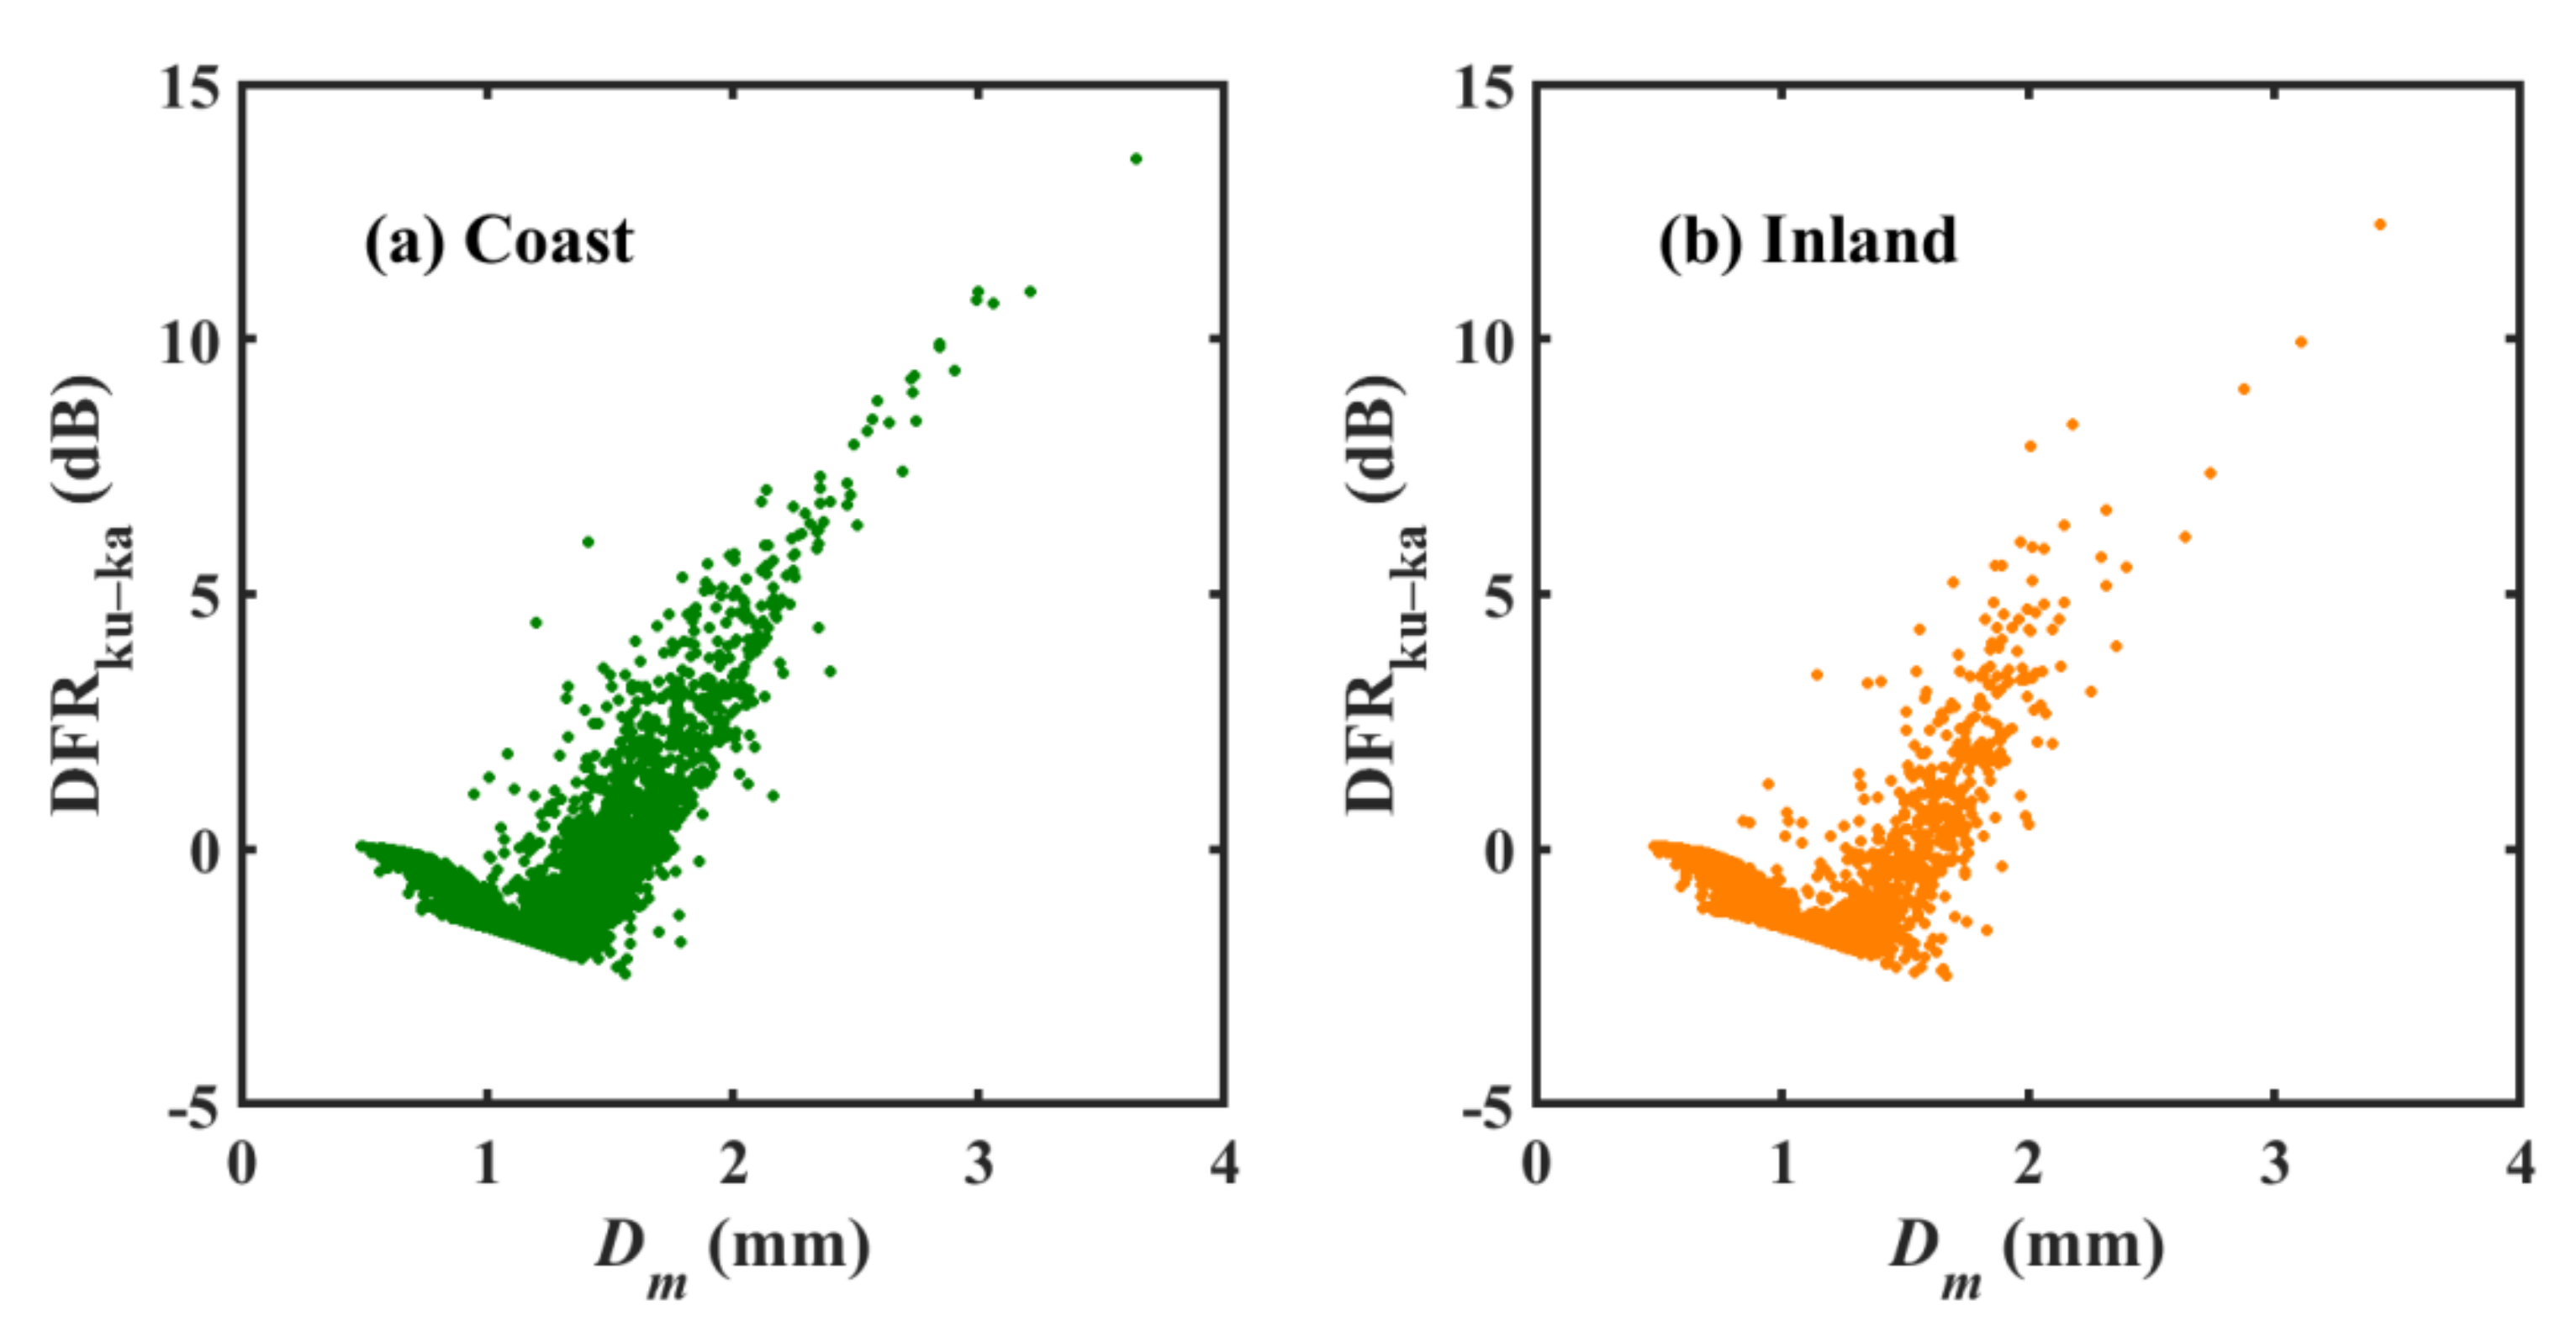
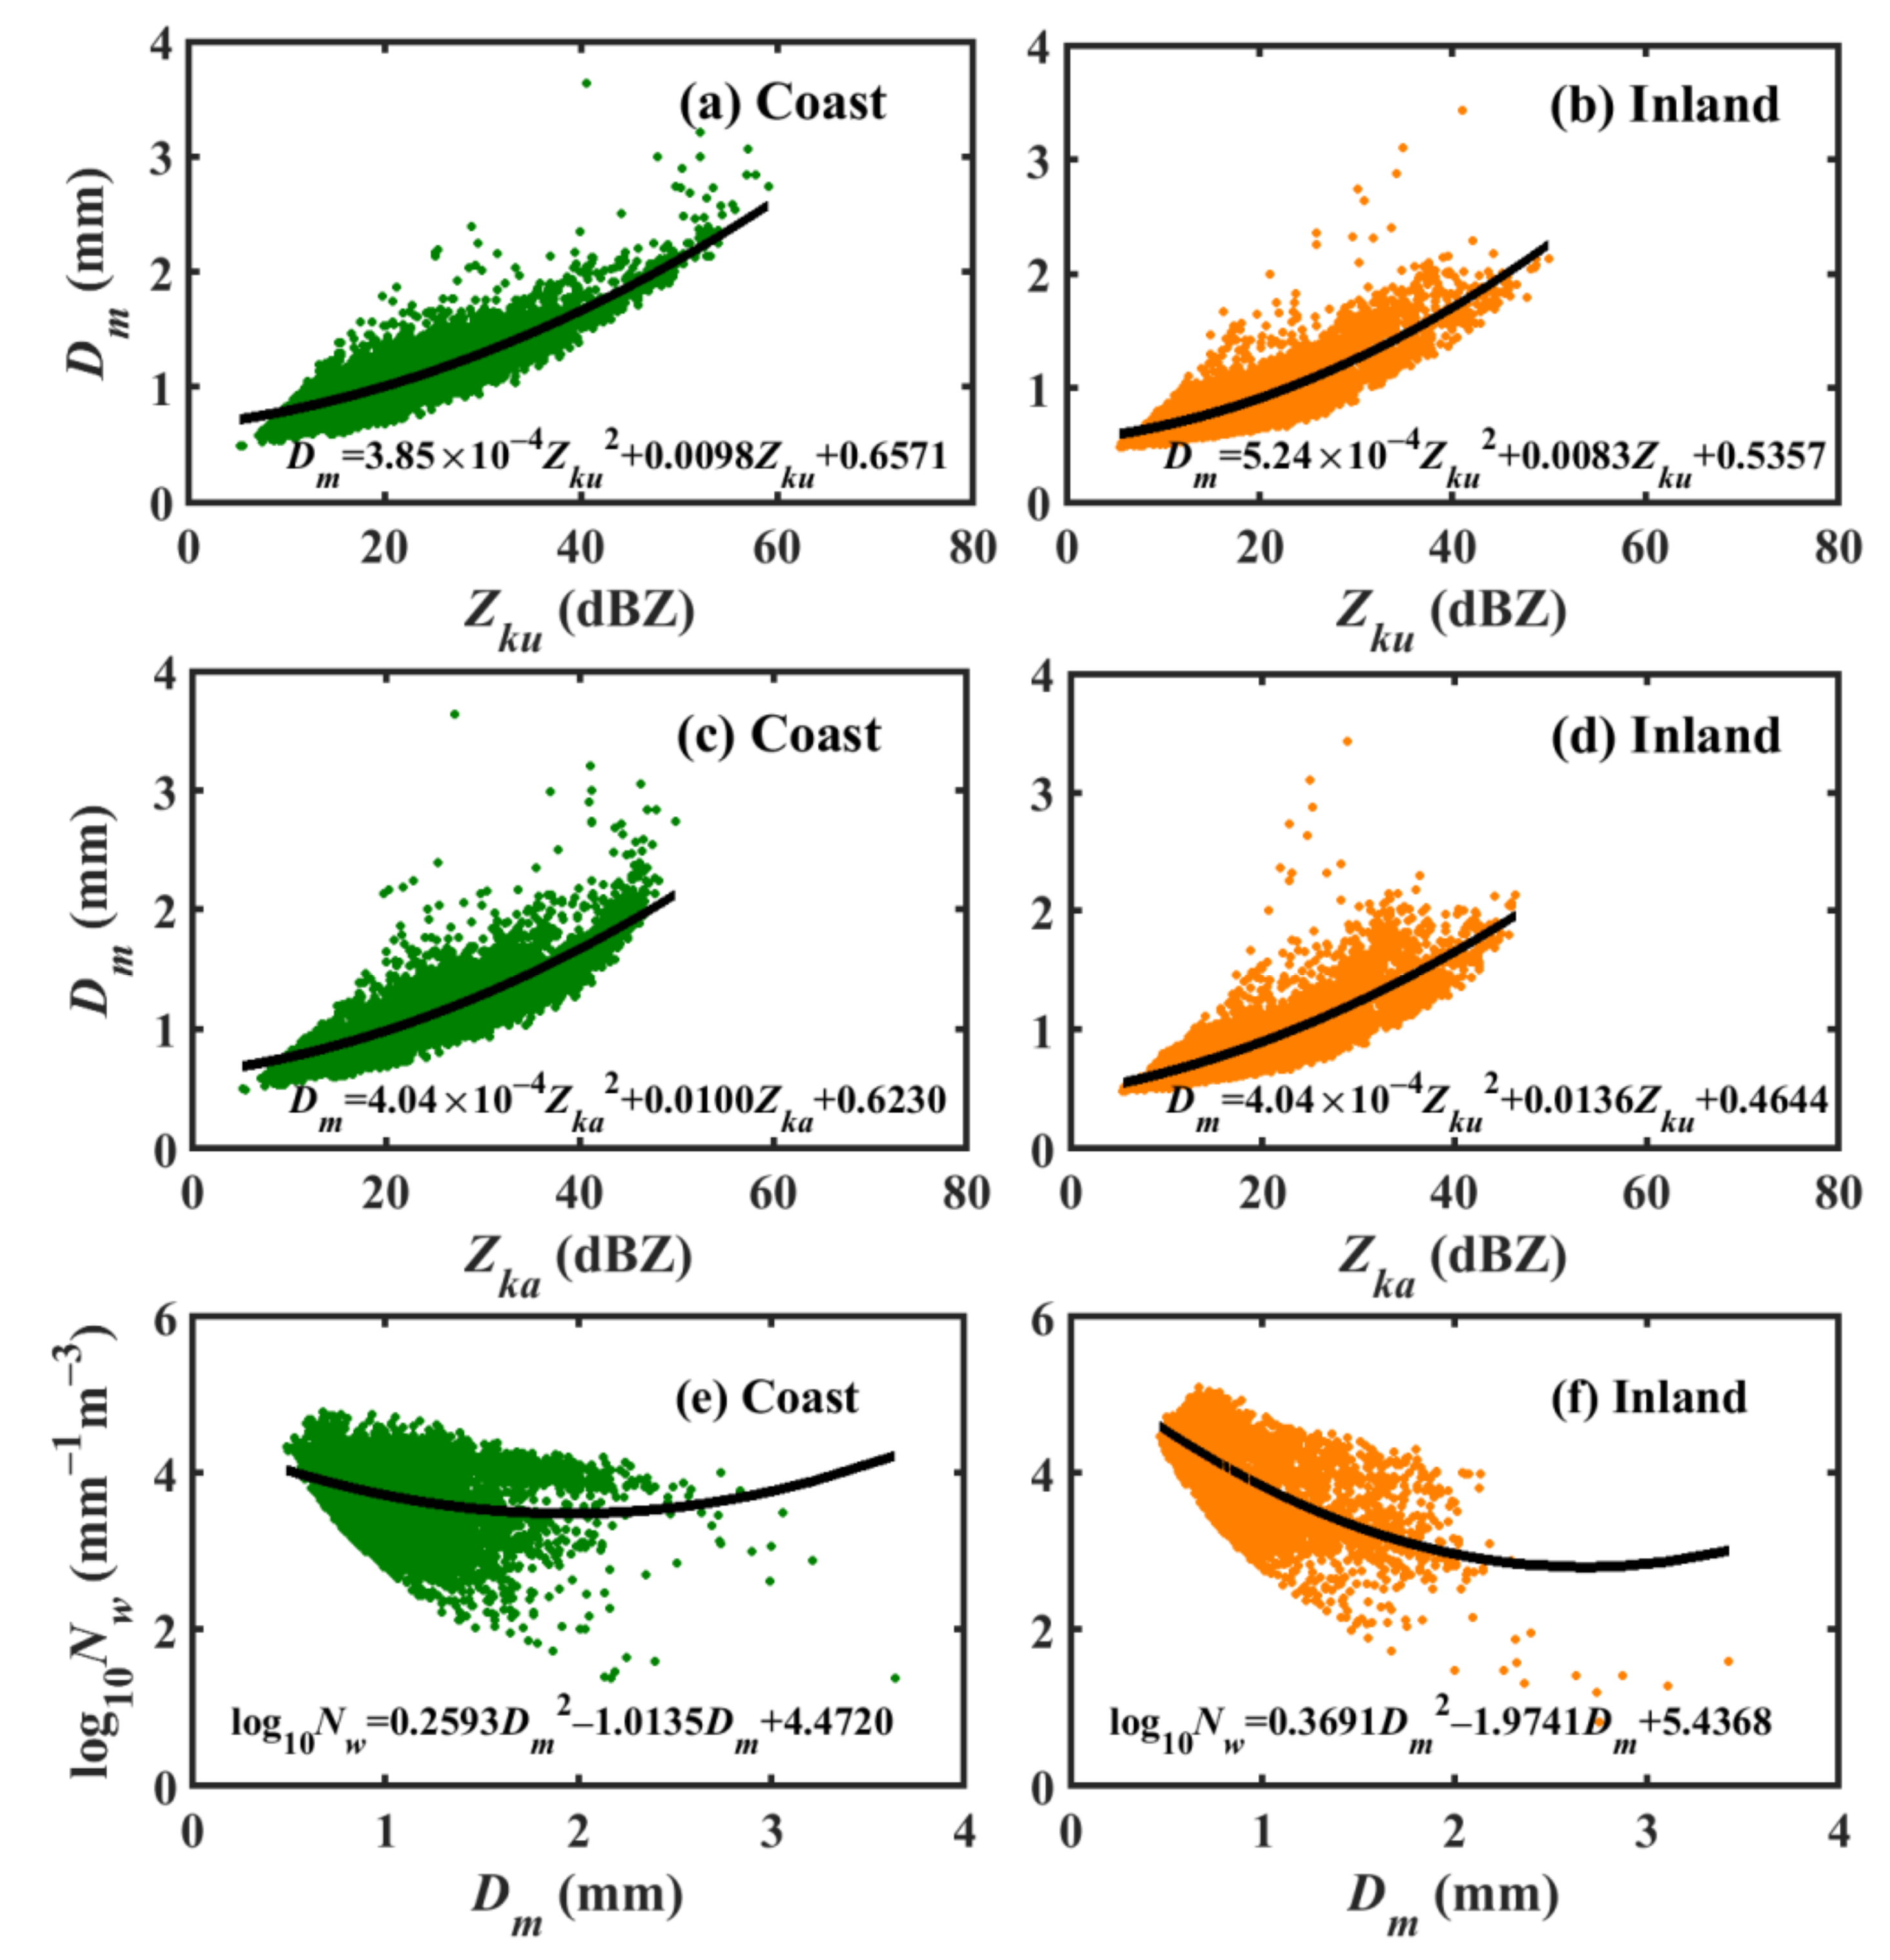
3.3. Dm−ZKu/ZKa and Dm−Nw Relations
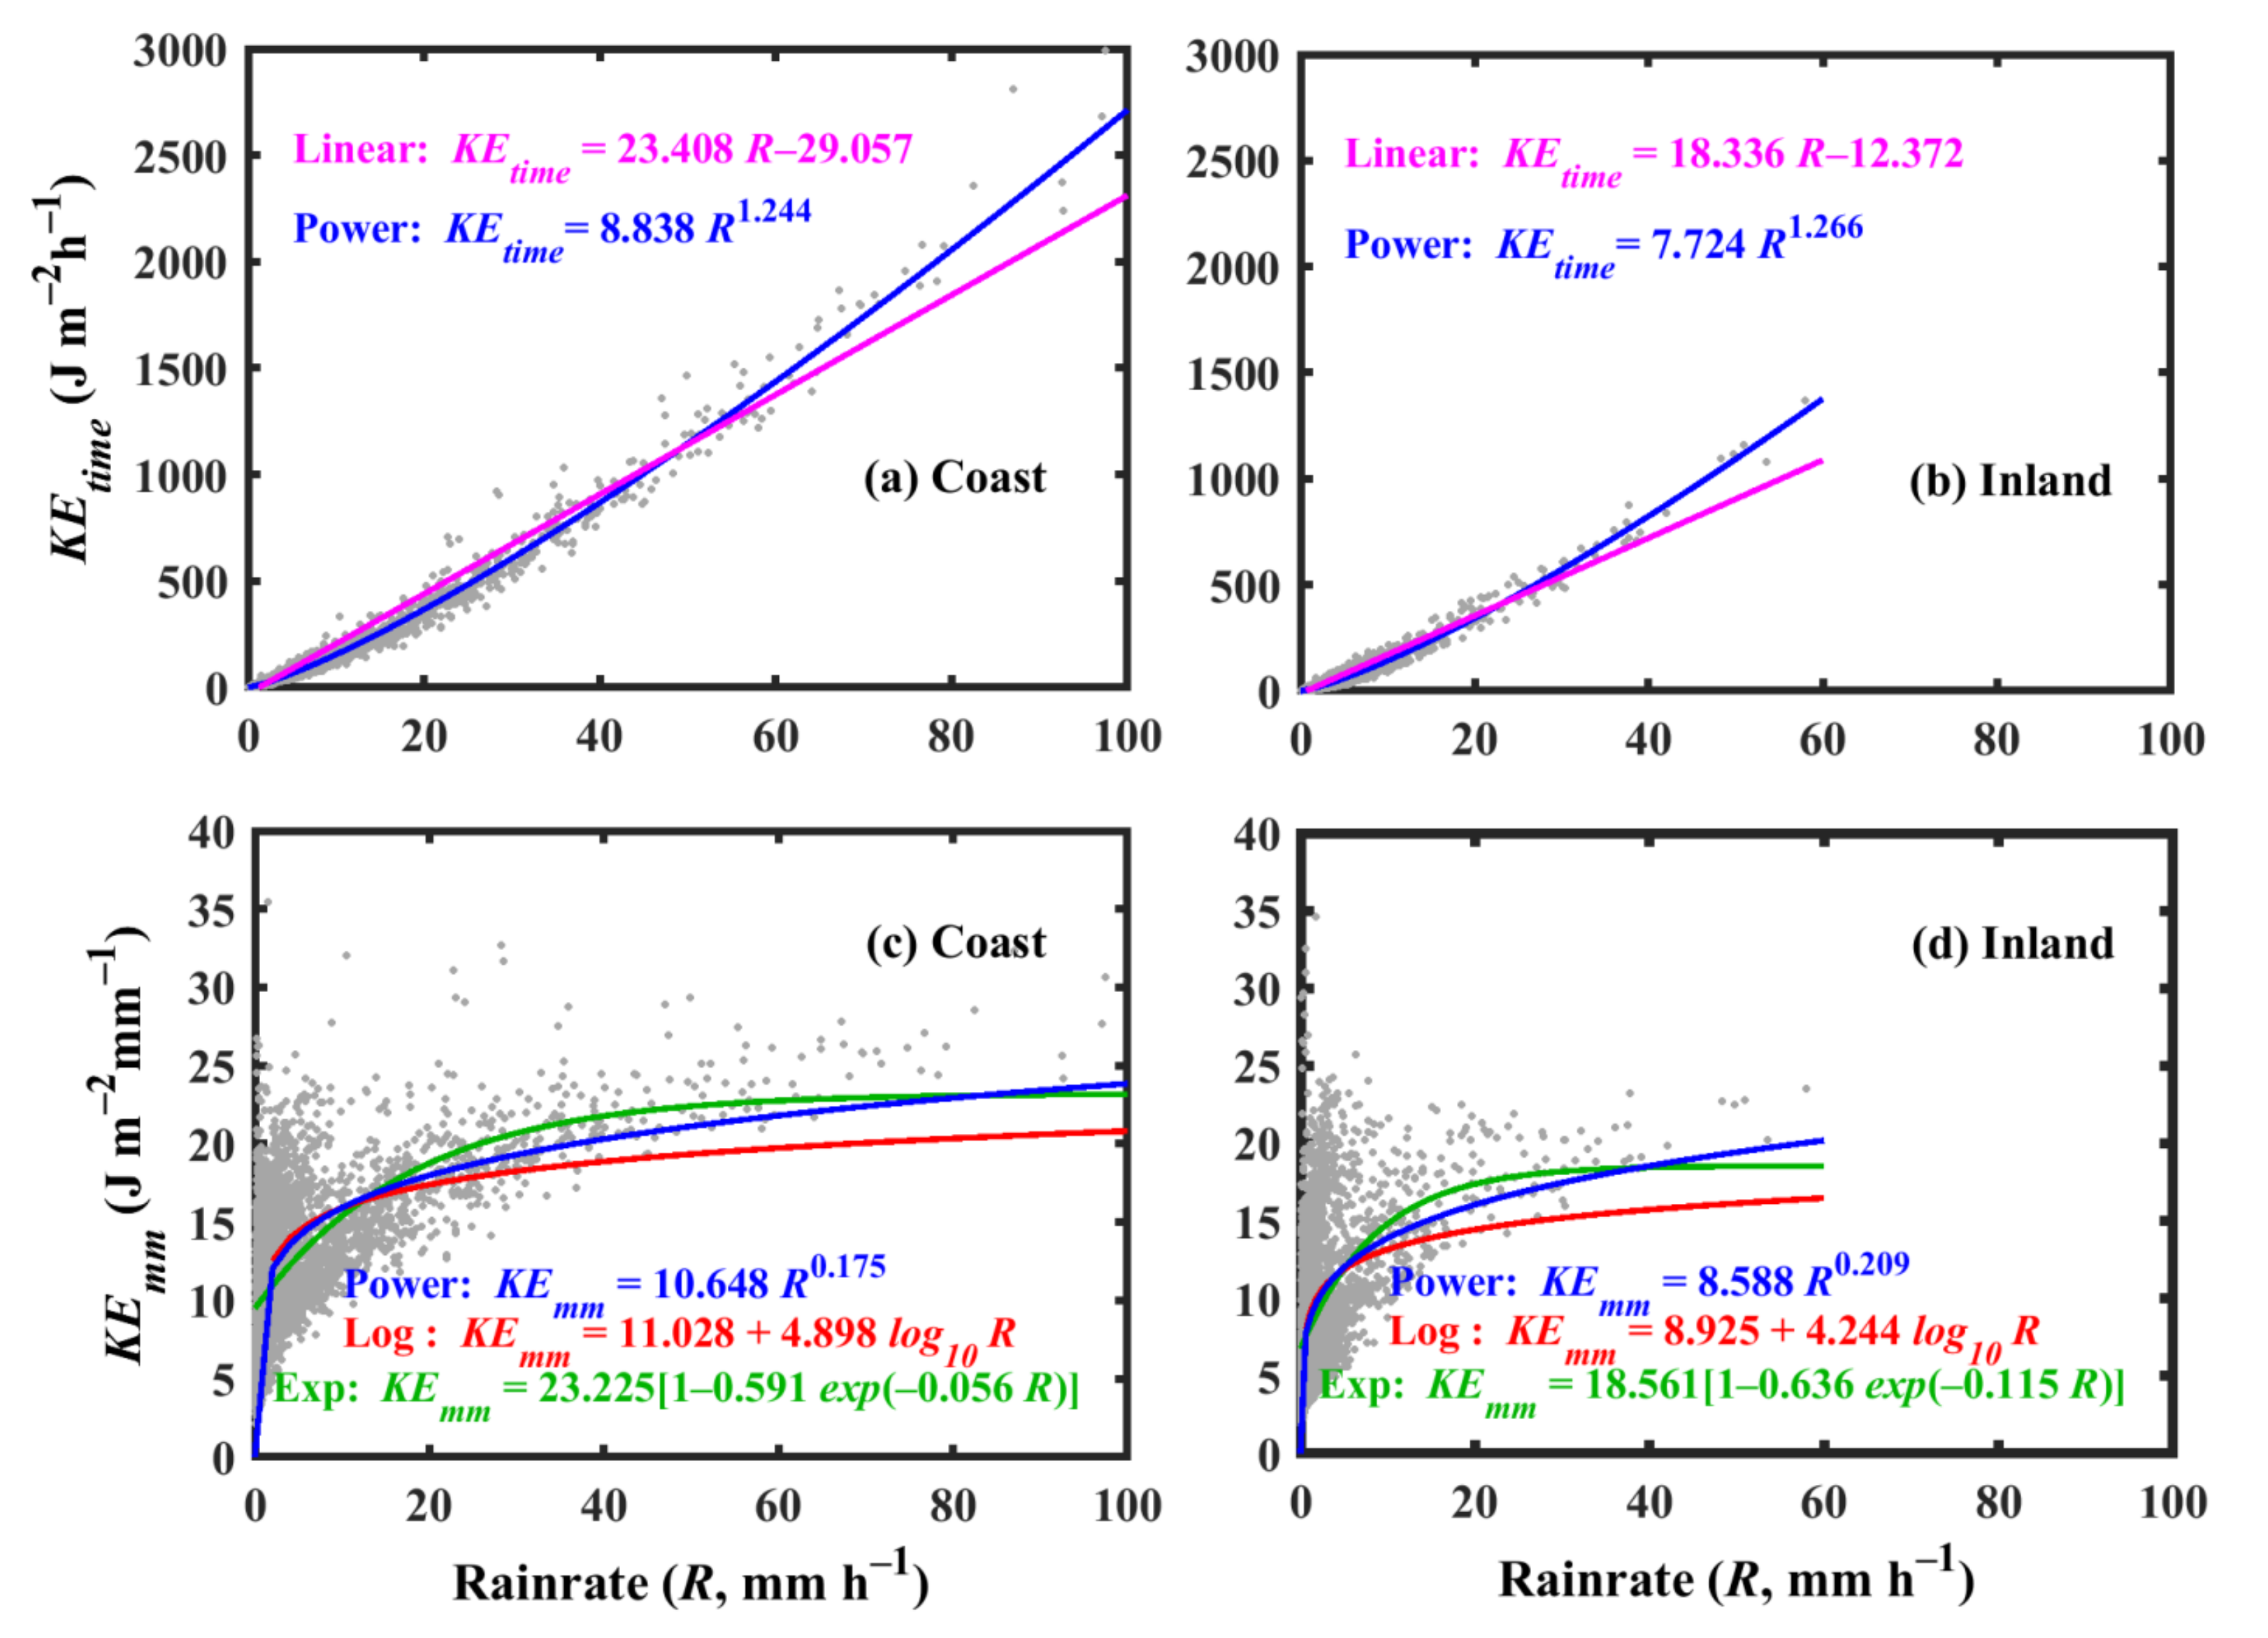
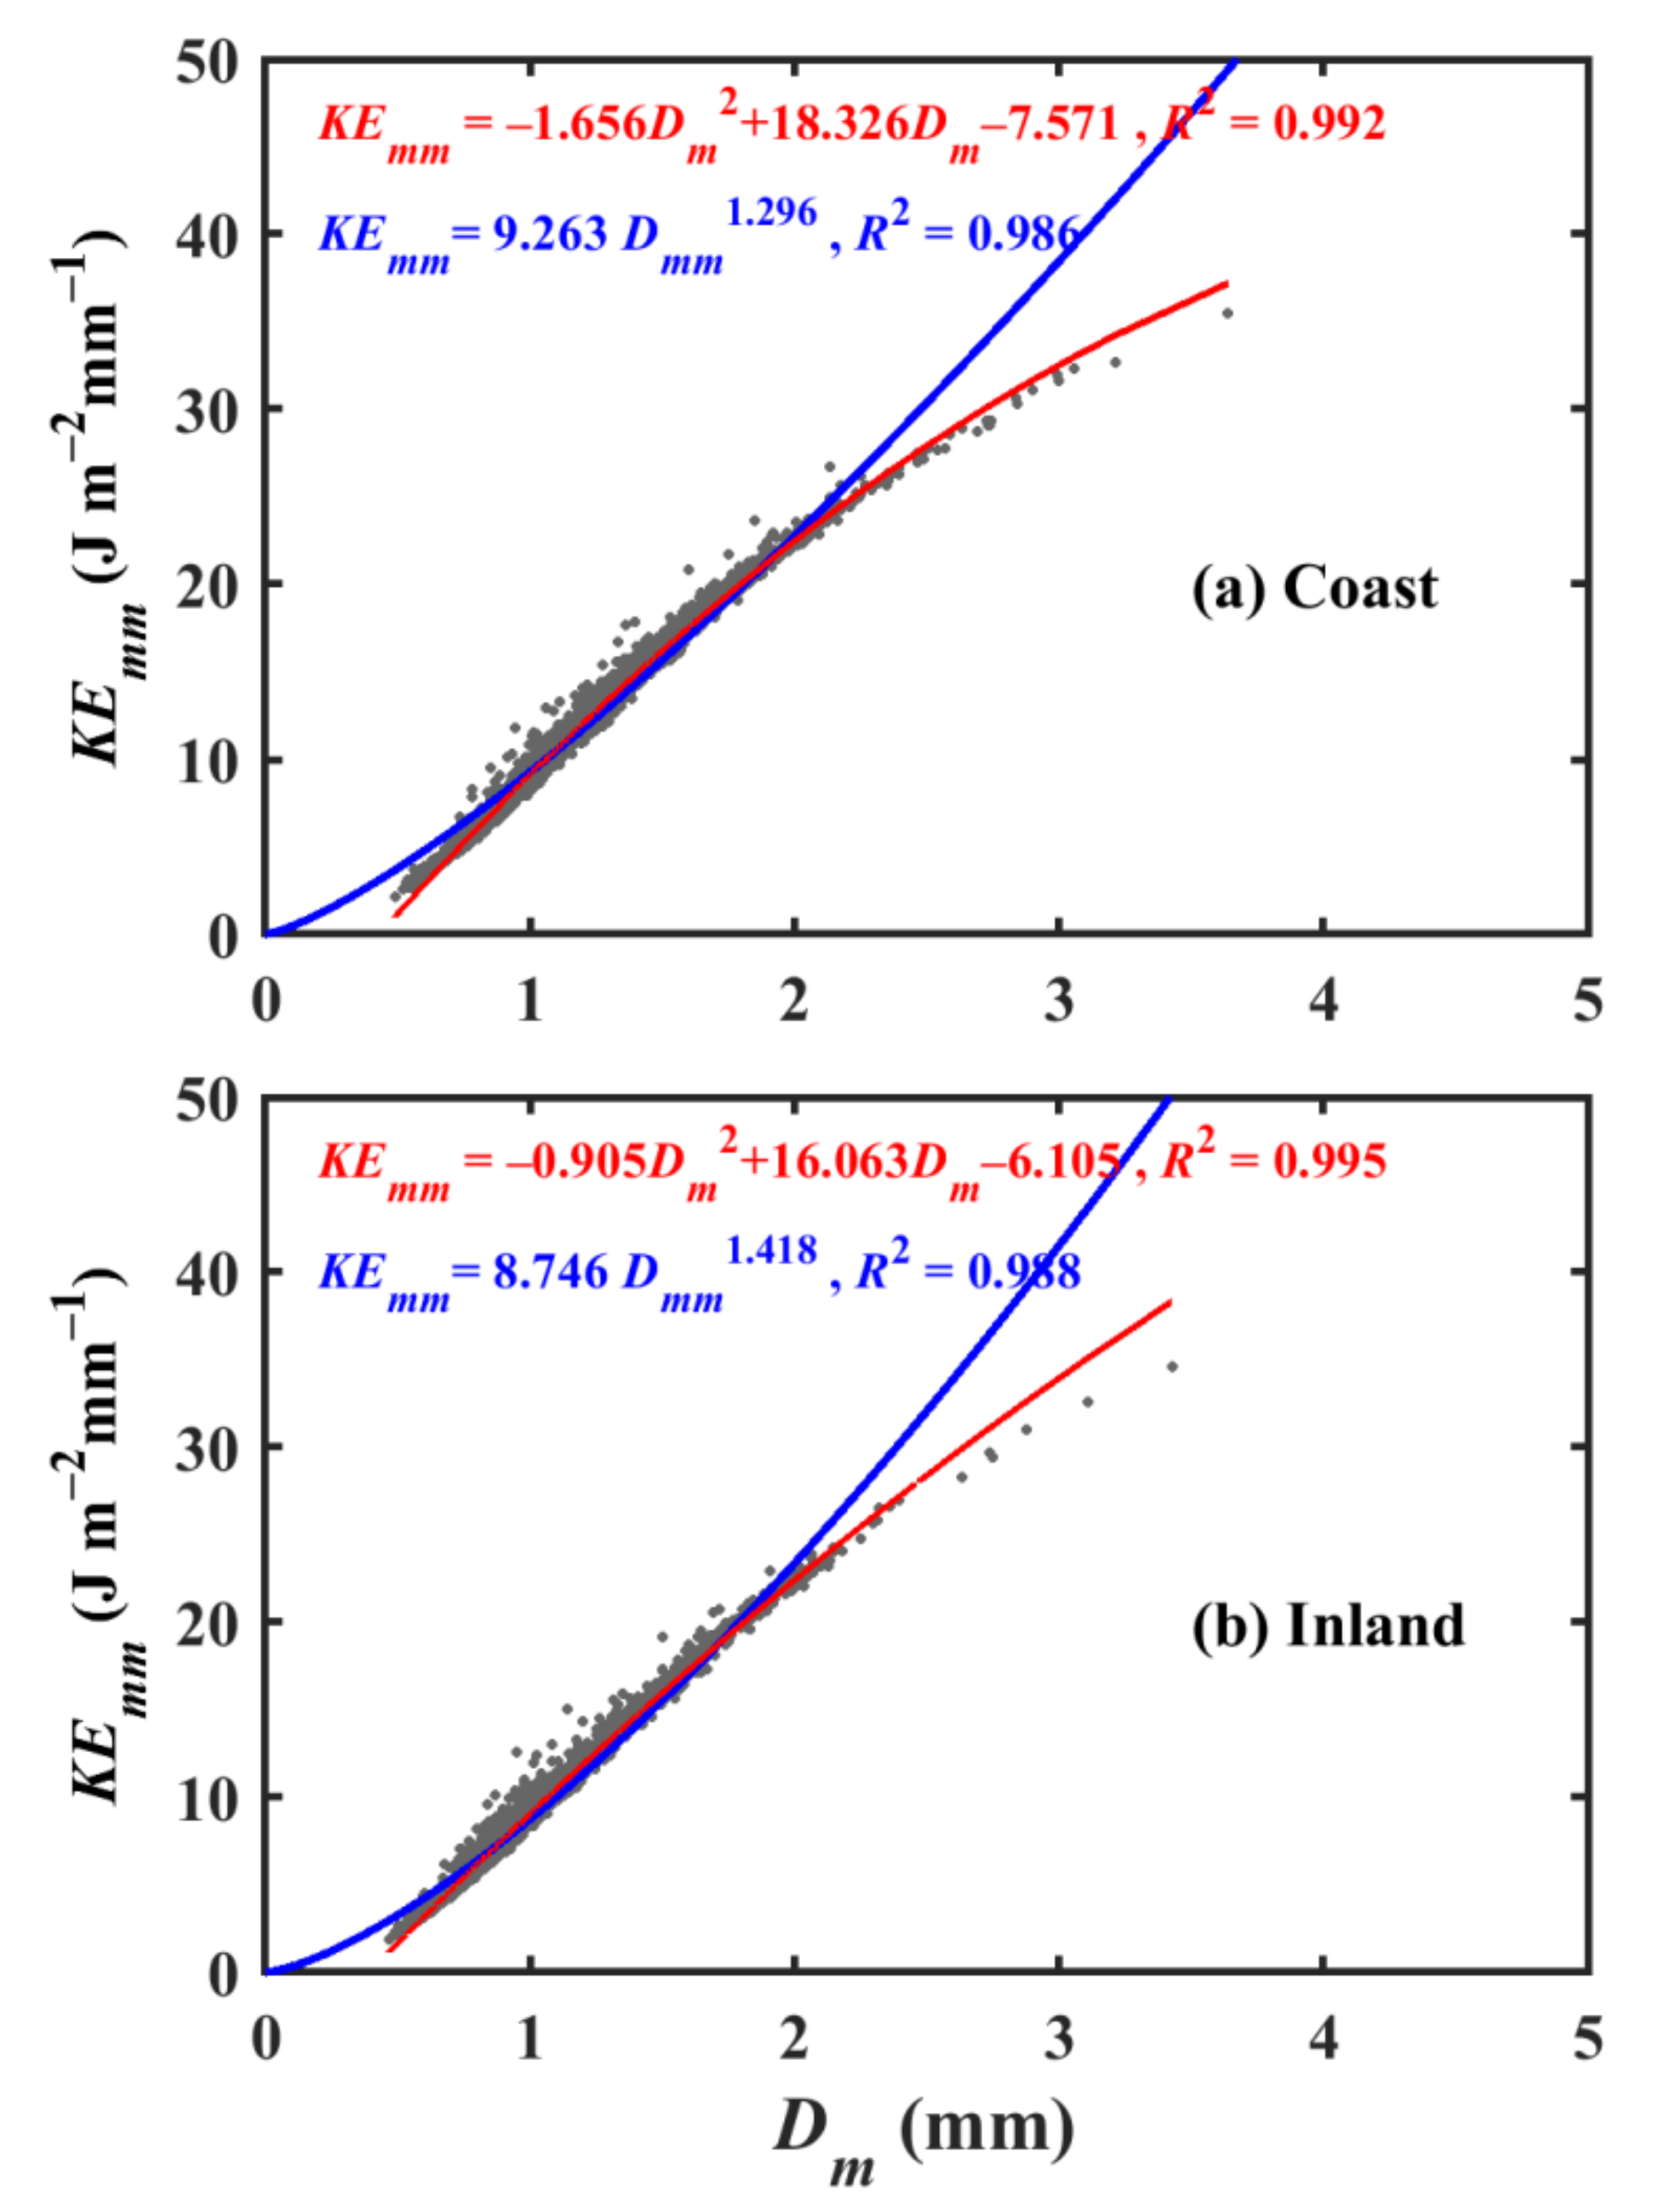
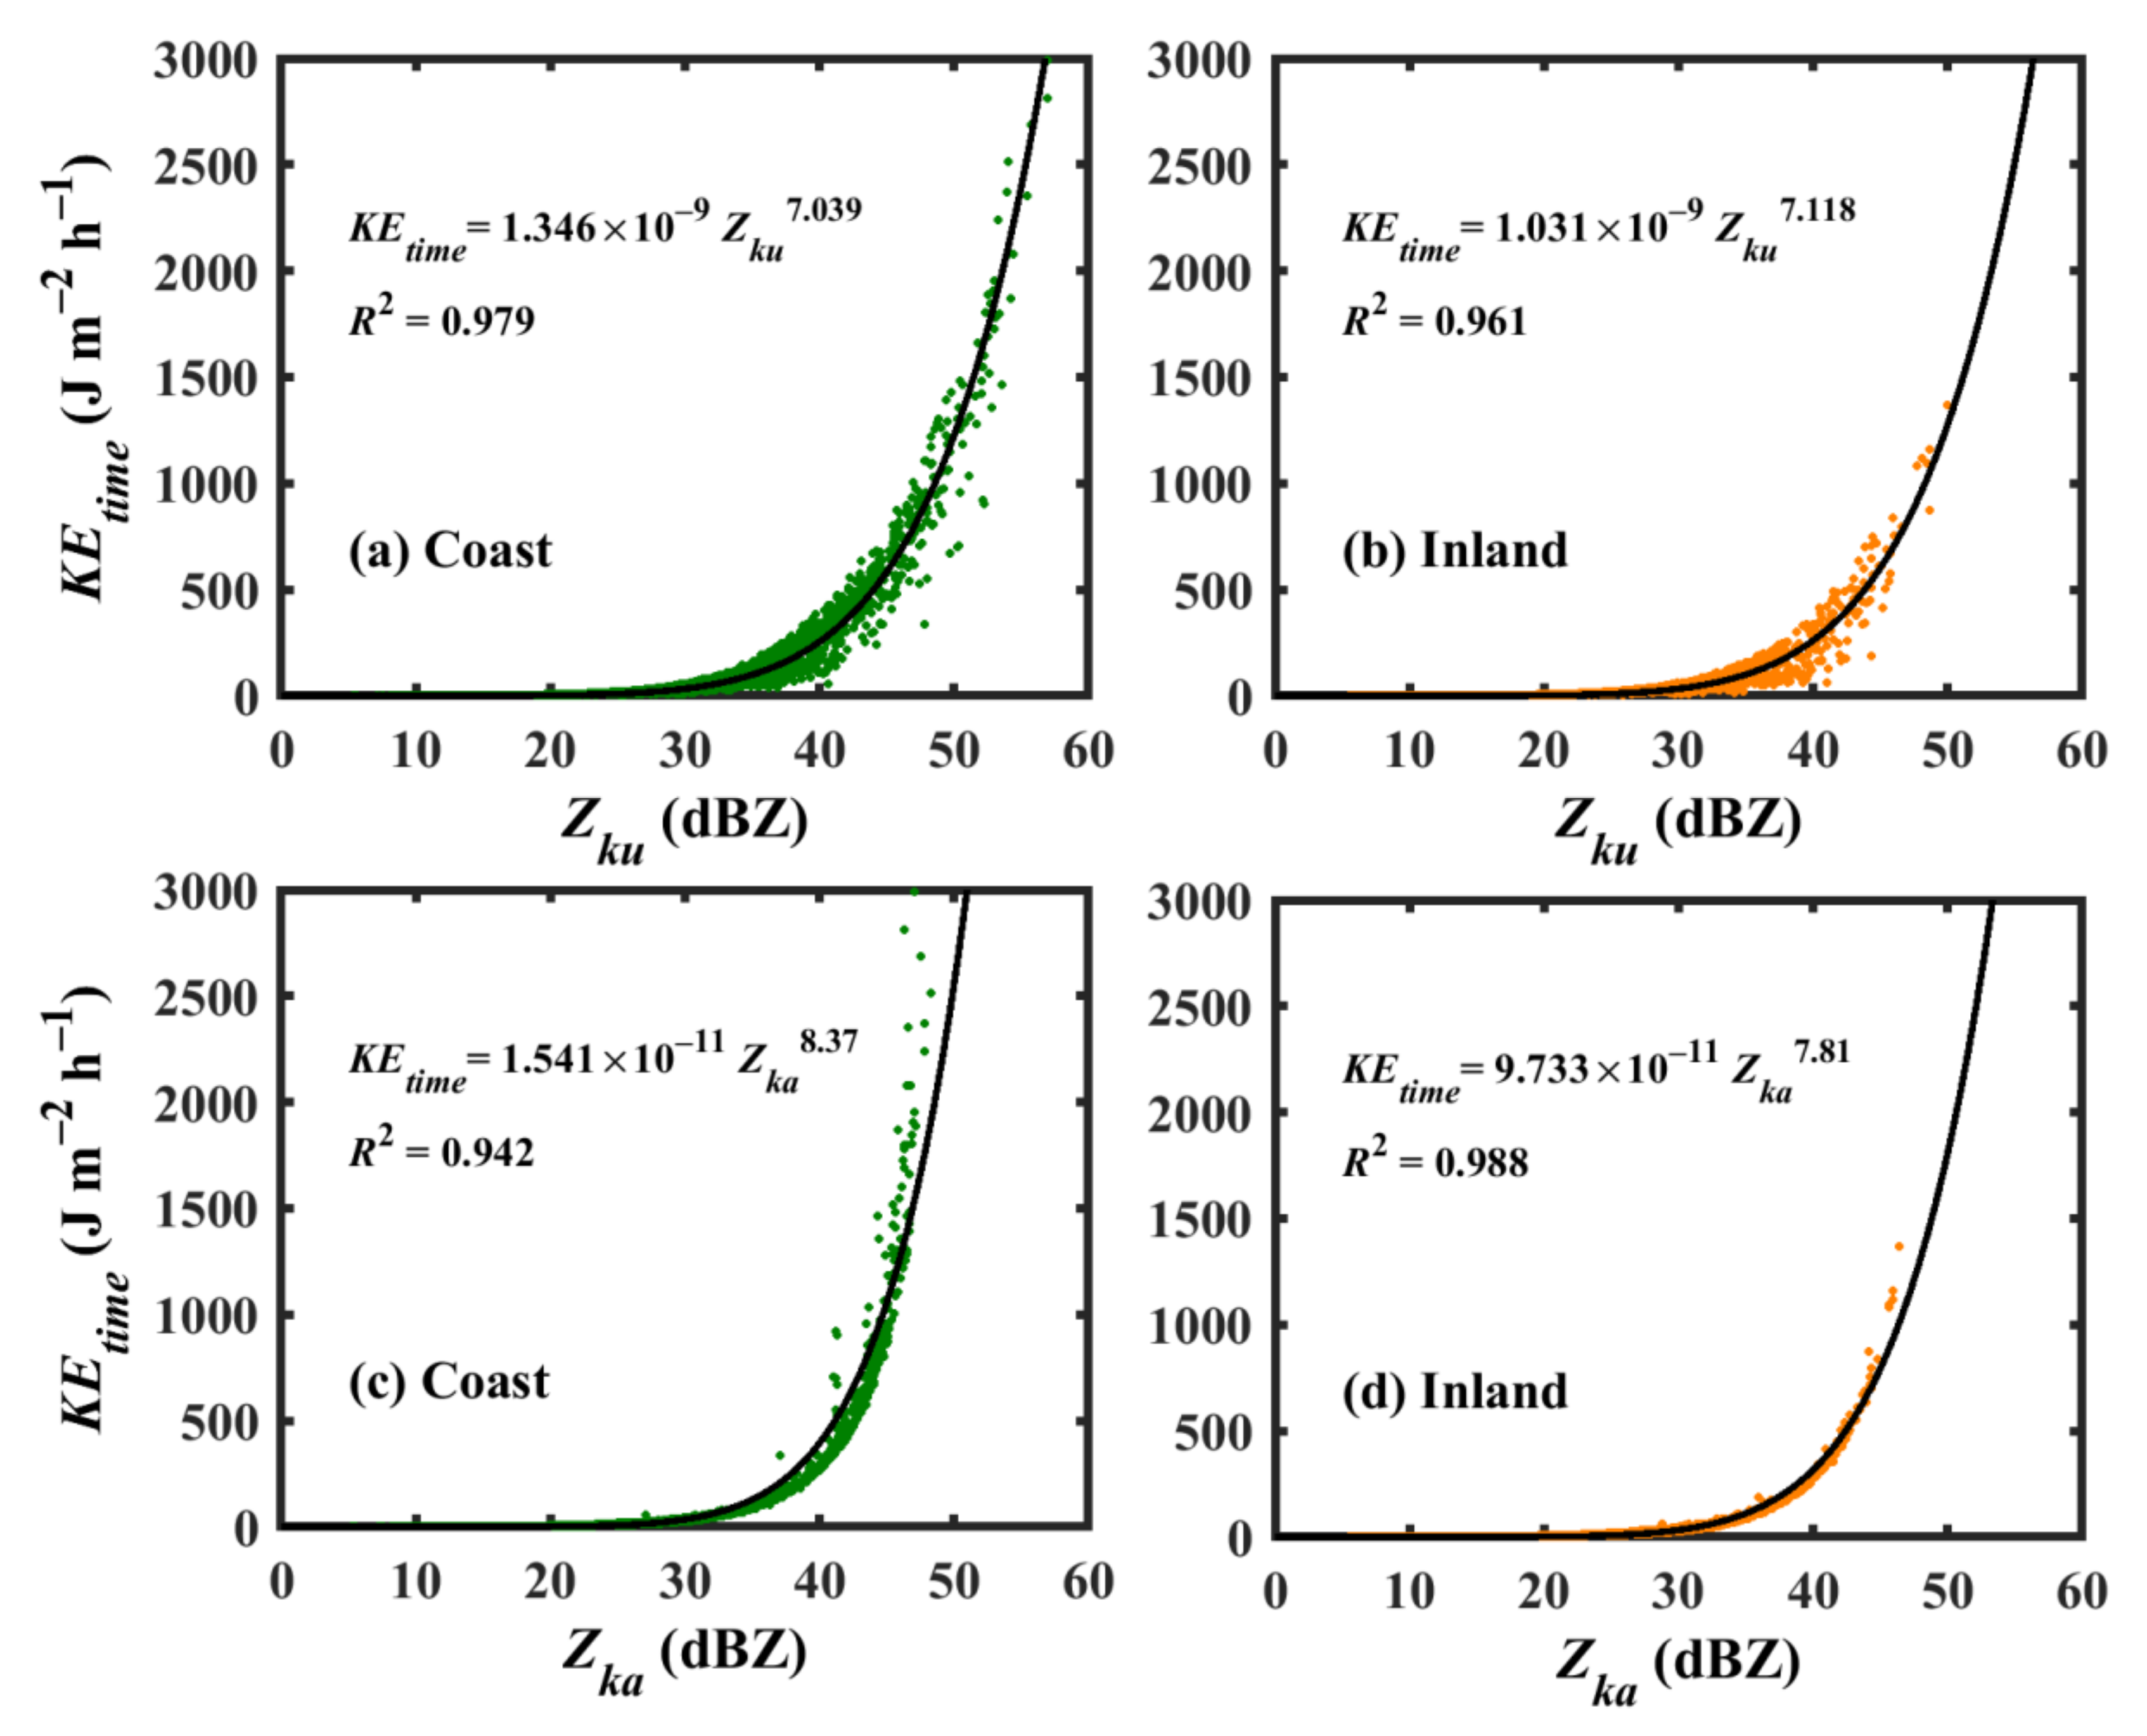
3.4. Rainfall Kinetic Energy Relations
4. Discussion
5. Summary and Conclusions
Author Contributions
Funding
Institutional Review Board Statement
Informed Consent Statement
Acknowledgments
Conflicts of Interest
References
- Liao, L.; Meneghini, R.; Tokay, A. Uncertainties of GPM DPR Rain Estimates Caused by DSD Parameterizations. J. Appl. Meteorol. Clim. 2014, 53, 2524–2537. [Google Scholar] [CrossRef] [Green Version]
- Wu, Z.; Zhang, Y.; Zhang, L.; Hao, X.; Lei, H.; Zheng, H. Validation of GPM Precipitation Products by Comparison with Ground-Based Parsivel Disdrometers over Jianghuai Region. Water 2019, 11, 1260. [Google Scholar] [CrossRef] [Green Version]
- Janapati, J.; Seela, B.K.; Lin, P.-L.; Wang, P.K.; Kumar, U. An assessment of tropical cyclones rainfall erosivity for Taiwan. Sci. Rep. 2019, 9, 15862–15864. [Google Scholar] [CrossRef] [Green Version]
- Steiner, M.; Smith, J.A. Reflectivity, Rain Rate, and Kinetic Energy Flux Relationships Based on Raindrop Spectra. J. Appl. Meteorol. 2000, 39, 1923–1940. [Google Scholar] [CrossRef]
- Jayalakshmi, J.; Reddy, K.K. Raindrop size distributions of southwest and northeast monsoon heavy precipitation observed over Kadapa (14°4′ N, 78°82′ E), a semi-arid region of India. Curr. Sci. 2014, 107, 1312–1320. [Google Scholar]
- Krishna, U.V.M.; Reddy, K.K.; Seela, B.K.; Shirooka, R.; Lin, P.-L.; Pan, C.-J. Raindrop size distribution of easterly and westerly monsoon precipitation observed over Palau islands in the Western Pacific Ocean. Atmospheric Res. 2016, 174, 41–51. [Google Scholar] [CrossRef]
- Seela, B.K.; Janapati, J.; Lin, P.-L.; Wang, P.K.; Lee, M.-T. Raindrop Size Distribution Characteristics of Summer and Winter Season Rainfall Over North Taiwan. J. Geophys. Res. Atmos. 2018, 123, 11–602. [Google Scholar] [CrossRef] [Green Version]
- Kumar, S.B.; Reddy, K.K. Rain drop size distribution characteristics of cyclonic and north east monsoon thunderstorm precipitating clouds observed over Kadapa (14.47° N, 78.82° E), tropical semi-arid region of India. Mausam 2013, 64, 35–48. [Google Scholar]
- Janapati, J.; Reddy, M.V.; Reddy, K.K.; Lin, P.-L.; Liu, C.-Y. A study on raindrop size distribution variability in before and after landfall precipitations of tropical cyclones observed over southern India. J. Atmospheric Solar-Terrestrial Phys. 2017, 159, 23–40. [Google Scholar] [CrossRef]
- Chen, Y.; Duan, J.; An, J.; Liu, H. Raindrop Size Distribution Characteristics for Tropical Cyclones and Meiyu-Baiu Fronts Impacting Tokyo, Japan. Atmosphere 2019, 10, 391. [Google Scholar] [CrossRef] [Green Version]
- Seela, B.K.; Janapati, J.; Lin, P.-L.; Reddy, K.K.; Shirooka, R.; Wang, P.K. A Comparison Study of Summer Season Raindrop Size Distribution Between Palau and Taiwan, Two Islands in Western Pacific. J. Geophys. Res. Atmos. 2017, 122, 11–787. [Google Scholar] [CrossRef]
- Le Loh, J.; Lee, D.-I.; You, C.-H. Inter-comparison of DSDs between Jincheon and Miryang at South Korea. Atmospheric Res. 2019, 227, 52–65. [Google Scholar] [CrossRef]
- Seela, B.K.; Reddy, K.K.; Jayalakshmi, J.; Rao, T.N.; Lin, P.-L.; Liu, C.-Y.; Kumar, U. Precipitation and cloud microstructure variations between two southern Indian stations. In Remote Sensing of the Atmosphere, Clouds, and Precipitation VI, Proceedings of SPIE Asia-Pacific Remote Sensing; SPIE: New Delhi, India, 2016; Volume 9876, p. 98761. [Google Scholar] [CrossRef]
- Tokay, A.; Short, D.A.; Williams, C.R.; Ecklund, W.L.; Gage, K.S. Tropical Rainfall Associated with Convective and Stratiform Clouds: Intercomparison of Disdrometer and Profiler Measurements. J. Appl. Meteorol. 1999, 38, 302–320. [Google Scholar] [CrossRef]
- Sumesh, R.; Resmi, E.; Unnikrishnan, C.; Jash, D.; Sreekanth, T.; Resmi, M.M.; Rajeevan, K.; Nita, S.; Ramachandran, K. Microphysical aspects of tropical rainfall during Bright Band events at mid and high-altitude regions over Southern Western Ghats, India. Atmospheric Res. 2019, 227, 178–197. [Google Scholar] [CrossRef]
- McFarquhar, G.M.; Hsieh, T.-L.; Freer, M.; Mascio, J.; Jewett, B.F. The characterization of ice hydrometeor gamma size distributions as volumes in N 0–λ–μ phase space: Implications for microphysical process modeling. J. Atmos. Sci. 2015, 72, 892–909. [Google Scholar] [CrossRef]
- Tokay, A.; Bashor, P.G.; Habib, E.; Kasparis, T. Raindrop Size Distribution Measurements in Tropical Cyclones. Mon. Weather. Rev. 2008, 136, 1669–1685. [Google Scholar] [CrossRef] [Green Version]
- Janapati, J.; Seela, B.K.; Lin, P.-L.; Wang, P.K.; Tseng, C.-H.; Reddy, K.K.; Hashiguchi, H.; Feng, L.; Das, S.K.; Unnikrishnan, C.K. Raindrop Size Distribution Characteristics of Indian and Pacific Ocean Tropical Cyclones Observed at India and Taiwan Sites. J. Meteorol. Soc. Jpn. 2020, 98, 299–317. [Google Scholar] [CrossRef] [Green Version]
- Bao, X.; Wu, L.; Tang, B.; Ma, L.; Wu, D.; Tang, J.; Chen, H.; Wu, L. Variable Raindrop Size Distributions in Different Rainbands Associated with Typhoon Fitow (2013). J. Geophys. Res. Atmos. 2019, 124, 12262–12281. [Google Scholar] [CrossRef]
- Chang, W.-Y.; Wang, T.-C.C.; Lin, P.-L. Characteristics of the Raindrop Size Distribution and Drop Shape Relation in Typhoon Systems in the Western Pacific from the 2D Video Disdrometer and NCU C-Band Polarimetric Radar. J. Atmospheric Ocean. Technol. 2009, 26, 1973–1993. [Google Scholar] [CrossRef]
- Janapati, J.; Seela, B.K.; Lin, P.-L.; Lee, M.-T.; Joseph, E. Microphysical features of typhoon and non-typhoon rainfall observed in Taiwan, an island in the northwestern Pacific. Hydrol. Earth Syst. Sci. 2021, 25, 4025–4040. [Google Scholar] [CrossRef]
- Deo, A.; Walsh, K.J.E. Contrasting tropical cyclone and non-tropical cyclone related rainfall drop size distribution at Darwin, Australia. Atmospheric Res. 2016, 181, 81–94. [Google Scholar] [CrossRef]
- Chen, B.-j.; Wang, Y.; Ming, J. Microphysical characteristics of the raindrop size distribution in Typhoon Morakot (2009). J. Trop. Meteorol. 2012, 18, 162–171. [Google Scholar]
- Radhakrishna, B.; Rao, T.N. Differences in cyclonic raindrop size distribution from southwest to northeast monsoon season and from that of noncyclonic rain. J. Geophys. Res. Space Phys. 2010, 115, 115. [Google Scholar] [CrossRef]
- Kumari, N.P.A.; Kumar, S.B.; Jayalakshmi, J.; Reddy, K.K. Raindrop size distribution variations in JAL and NILAM cyclones induced precipitation observed over Kadapa (14.47 o N, 78.82 o E), a tropical semi-arid region of India. Indian J. Radio Space Phys. 2014, 43, 57–66. [Google Scholar]
- Ramanujam, S.; Radhakrishnan, C.; Subramani, D.; Chakravarthy, B. On the Effect of Non-Raining Parameters in Retrieval of Surface Rain Rate Using TRMM PR and TMI Measurements. IEEE J. Sel. Top. Appl. Earth Obs. Remote Sens. 2012, 5, 735–743. [Google Scholar] [CrossRef]
- Balaji, C.; Krishnamoorthy, C.; Chandrasekar, R. On the possibility of retrieving near-surface rain rate from the microwave sounder SAPHIR of the Megha-Tropiques mission. Curr. Sci. 2014, 106, 587–593. [Google Scholar]
- Suh, S.-H.; Kim, H.-J.; Lee, D.-I.; Kim, T.-H. Geographical Characteristics of Raindrop Size Distribution in the Southern Parts of South Korea. J. Appl. Meteorol. Clim. 2021, 60, 157–169. [Google Scholar] [CrossRef]
- Harikumar, R. Orographic effect on tropical rain physics in the Asian monsoon region. Atmospheric Sci. Lett. 2016, 17, 556–563. [Google Scholar] [CrossRef] [Green Version]
- Sumesh, R.K.; Resmi, E.A.; Unnikrishnan, C.K.; Jash, D.; Ramachandran, K.K. Signatures of Shallow and Deep Clouds Inferred from Precipitation Microphysics Over Windward Side of Western Ghats. J. Geophys. Res. Atmos. 2021, 126. [Google Scholar] [CrossRef]
- Radhakrishna, B.; Rao, T.N.; Rao, D.N.; Rao, N.P.; Nakamura, K.; Sharma, A.K. Spatial and seasonal variability of raindrop size distributions in southeast India. J. Geophys. Res. Space Phys. 2009, 114, 114. [Google Scholar] [CrossRef]
- Yuter, S.E.; Kingsmill, D.; Nance, L.B.; Löffler-Mang, M. Observations of Precipitation Size and Fall Speed Characteristics within Coexisting Rain and Wet Snow. J. Appl. Meteorol. Clim. 2006, 45, 1450–1464. [Google Scholar] [CrossRef] [Green Version]
- Löffler-Mang, M.; Joss, J. An Optical Disdrometer for Measuring Size and Velocity of Hydrometeors. J. Atmospheric Ocean. Technol. 2000, 17, 130–139. [Google Scholar] [CrossRef]
- Battaglia, A.; Rustemeier, E.; Tokay, A.; Blahak, U.; Simmer, C. PARSIVEL Snow Observations: A Critical Assessment. J. Atmospheric Ocean. Technol. 2010, 27, 333–344. [Google Scholar] [CrossRef]
- Jaffrain, J.; Berne, A. Experimental Quantification of the Sampling Uncertainty Associated with Measurements from PARSIVEL Disdrometers. J. Hydrometeorol. 2011, 12, 352–370. [Google Scholar] [CrossRef]
- Friedrich, K.; Higgins, S.; Masters, F.J.; Lopez, C.R. Articulating and Stationary PARSIVEL Disdrometer Measurements in Conditions with Strong Winds and Heavy Rainfall. J. Atmospheric Ocean. Technol. 2013, 30, 2063–2080. [Google Scholar] [CrossRef]
- Tokay, A.; Wolff, D.B.; Petersen, W.A. Evaluation of the New Version of the Laser-Optical Disdrometer, OTT Parsivel2. J. Atmospheric Ocean. Technol. 2014, 31, 1276–1288. [Google Scholar] [CrossRef]
- Tokay, A.; Petersen, W.A.; Gatlin, P.; Wingo, M. Comparison of Raindrop Size Distribution Measurements by Collocated Disdrometers. J. Atmospheric Ocean. Technol. 2013, 30, 1672–1690. [Google Scholar] [CrossRef]
- Atlas, D.; Srivastava, R.C.; Sekhon, R.S. Doppler radar characteristics of precipitation at vertical incidence. Rev. Geophys. 1973, 11, 1–35. [Google Scholar] [CrossRef]
- Ulbrich, C.W. Natural Variations in the Analytical Form of the Raindrop Size Distribution. J. Clim. Appl. Meteorol. 1983, 22, 1764–1775. [Google Scholar] [CrossRef] [Green Version]
- Kozu, T.; Nakamura, K. Rainfall Parameter Estimation from Dual-Radar Measurements Combining Reflectivity Profile and Path-integrated Attenuation. J. Atmospheric Ocean. Technol. 1991, 8, 259–270. [Google Scholar] [CrossRef] [Green Version]
- Tokay, A.; Short, D.A. Evidence from Tropical Raindrop Spectra of the Origin of Rain from Stratiform versus Convective Clouds. J. Appl. Meteorol. 1996, 35, 355–371. [Google Scholar] [CrossRef] [Green Version]
- Bringi, V.N.; Chandrasekar, V.; Hubbert, J.; Gorgucci, E.; Randeu, W.L.; Schoenhuber, M. Raindrop Size Distribution in Different Climatic Regimes from Disdrometer and Dual-Polarized Radar Analysis. J. Atmospheric Sci. 2003, 60, 354–365. [Google Scholar] [CrossRef]
- Fornis, R.L.; Vermeulen, H.R.; Nieuwenhuis, J.D. Kinetic energy–rainfall intensity relationship for Central Cebu, Philippines for soil erosion studies. J. Hydrol. 2005, 300, 20–32. [Google Scholar] [CrossRef]
- Dee, D.P.; Uppala, S.M.; Simmons, A.J.; Berrisford, P.; Poli, P.; Kobayashi, S.; Andrae, U.; Balmaseda, M.A.; Balsamo, G.; Bauer, P.; et al. The ERA-Interim reanalysis: Configuration and performance of the data assimilation system. Q. J. R. Meteorol. Soc. 2011, 137, 553–597. [Google Scholar] [CrossRef]
- Wang, M.; Zhao, K.; Xue, M.; Zhang, G.; Liu, S.; Wen, L.; Chen, G. Precipitation microphysics characteristics of a Typhoon Matmo (2014) rainband after landfall over eastern China based on polarimetric radar observations. J. Geophys. Res. Atmos. 2016, 121, 12–415. [Google Scholar] [CrossRef]
- Wen, L.; Zhao, K.; Chen, G.; Wang, M.; Zhou, B.; Huang, H.; Hu, D.; Lee, W.-C.; Hu, H. Drop Size Distribution Characteristics of Seven Typhoons in China. J. Geophys. Res. Atmos. 2018, 123, 6529–6548. [Google Scholar] [CrossRef]
- Chen, B.; Yang, J.; Pu, J. Statistical Characteristics of Raindrop Size Distribution in the Meiyu Season Observed in Eastern China. J. Meteorol. Soc. Jpn. 2013, 91, 215–227. [Google Scholar] [CrossRef] [Green Version]
- Hu, Z.; Srivastava, R.C. Evolution of Raindrop Size Distribution by Coalescence, Breakup, and Evaporation: Theory and Observations. J. Atmospheric Sci. 1995, 52, 1761–1783. [Google Scholar] [CrossRef] [Green Version]
- Liao, L.; Meneghini, R. A study of air/space-borne dual-wavelength radar for estimation of rain profiles. Adv. Atmospheric Sci. 2005, 22, 841–851. [Google Scholar] [CrossRef]
- Mishchenko, M.; Travis, L.D.; Mackowski, D.W. T-matrix computations of light scattering by nonspherical particles: A review. J. Quant. Spectrosc. Radiat. Transf. 1996, 55, 535–575. [Google Scholar] [CrossRef]
- Brandes, E.A.; Zhang, G.; Vivekanandan, J. Experiments in Rainfall Estimation with a Polarimetric Radar in a Subtropical Environment. J. Appl. Meteorol. 2002, 41, 674–685. [Google Scholar] [CrossRef] [Green Version]
- Liao, L.; Meneghini, R.; Iguchi, T.; Tokay, A. Characteristics of DSD Bulk Parameters: Implication for Radar Rain Retrieval. Atmosphere 2020, 11, 670. [Google Scholar] [CrossRef]
- Zeng, Q.; Zhang, Y.; Lei, H.; Xie, Y.; Gao, T.; Zhang, L.; Wang, C.; Huang, Y. Microphysical Characteristics of Precipitation during Pre-monsoon, Monsoon, and Post-monsoon Periods over the South China Sea. Adv. Atmospheric Sci. 2019, 36, 1103–1120. [Google Scholar] [CrossRef]
- Wu, Z.; Zhang, Y.; Zhang, L.; Lei, H.; Xie, Y.; Wen, L.; Yang, J. Characteristics of Summer Season Raindrop Size Distribution in Three Typical Regions of Western Pacific. J. Geophys. Res. Atmos. 2019, 124, 4054–4073. [Google Scholar] [CrossRef] [Green Version]
- Wischmeier, W.H.; Smith, D.D. Rainfall energy and its relationship to soil loss. Trans. Am. Geophys. Union 1958, 39, 285–291. [Google Scholar] [CrossRef]
- Kinnell, P.I.A. Rainfall Intensity-Kinetic Energy Relationships for Soil Loss Prediction1. Soil Sci. Soc. Am. J. 1981, 45, 153. [Google Scholar] [CrossRef]
- Jayawardena, A.W.; Rezaur, R.B. Measuring drop size distribution and kinetic energy of rainfall using a force transducer. Hydrol. Process. 2000, 14, 37–49. [Google Scholar] [CrossRef]
- Verstraeten, G.; Poesen, J.; Demarée, G.; Salles, C. Long-term (105 years) variability in rain erosivity as derived from 10-min rainfall depth data for Ukkel (Brussels, Belgium): Implications for assessing soil erosion rates. J. Geophys. Res. Space Phys. 2006, 111, 111. [Google Scholar] [CrossRef]
- Nanko, K.; Moskalski, S.M.; Torres, R. Rainfall erosivity–intensity relationships for normal rainfall events and a tropical cyclone on the US southeast coast. J. Hydrol. 2016, 534, 440–450. [Google Scholar] [CrossRef] [Green Version]
- Van Dijk, A.I.J.M.; Meesters, A.G.C.A.; Schellekens, J.; Bruijnzeel, L. A two-parameter exponential rainfall depth-intensity distribution applied to runoff and erosion modelling. J. Hydrol. 2005, 300, 155–171. [Google Scholar] [CrossRef]
- Mondal, A.; Khare, D.; Kundu, S. Change in rainfall erosivity in the past and future due to climate change in the central part of India. Int. Soil Water Conserv. Res. 2016, 4, 186–194. [Google Scholar] [CrossRef] [Green Version]
- Sanchez-Moreno, J.F.; Mannaerts, C.M.; Jetten, V.; Löffler-Mang, M. Rainfall kinetic energy–intensity and rainfall momentum–intensity relationships for Cape Verde. J. Hydrol. 2012, 454–455, 131–140. [Google Scholar] [CrossRef]
- Lim, Y.S.; Kim, J.K.; Kim, J.W.; Park, B.I.; Kim, M.S. Analysis of the relationship between the kinetic energy and intensity of rainfall in Daejeon, Korea. Quat. Int. 2015, 384, 107–117. [Google Scholar] [CrossRef]
- Iguchi, T.; Seto, S.; Meneghini, R.; Yoshida, N.; Awaka, J.; Kubota, T. GPM/DPR Level-2 Algorithm Theoretical Basis Document; NASA Goddard Space Flight Center: Greenbelt, MD, USA, 2010. [Google Scholar]
- Skofronick-Jackson, G.; Petersen, W.A.; Berg, W.; Kidd, C.; Stocker, E.F.; Kirschbaum, D.B.; Kakar, R.; Braun, S.A.; Huffman, G.J.; Iguchi, T.; et al. The Global Precipitation Measurement (GPM) Mission for Science and Society. Bull. Am. Meteorol. Soc. 2017, 98, 1679–1695. [Google Scholar] [CrossRef] [PubMed]
- Rosenfeld, D.; Ulbrich, C.W. Cloud Microphysical Properties, Processes, and Rainfall Estimation Opportunities. Meteorol. Monogr. 2003, 52, 237–258. [Google Scholar] [CrossRef]
- Atlas, D.; Ulbrich, C.W.; Marks, F.D., Jr.; Black, R.A.; Amitai, E.; Willis, P.T.; Samsury, C.E. Partitioning tropical oceanic convective and stratiform rains by draft strength. J. Geophys. Res. Space Phys. 2000, 105, 2259–2267. [Google Scholar] [CrossRef]


| Ocean | Studies | Observational Location | Instrument | TCs Number | Dm (mm) | log10Nw (mm−1 m−3) |
|---|---|---|---|---|---|---|
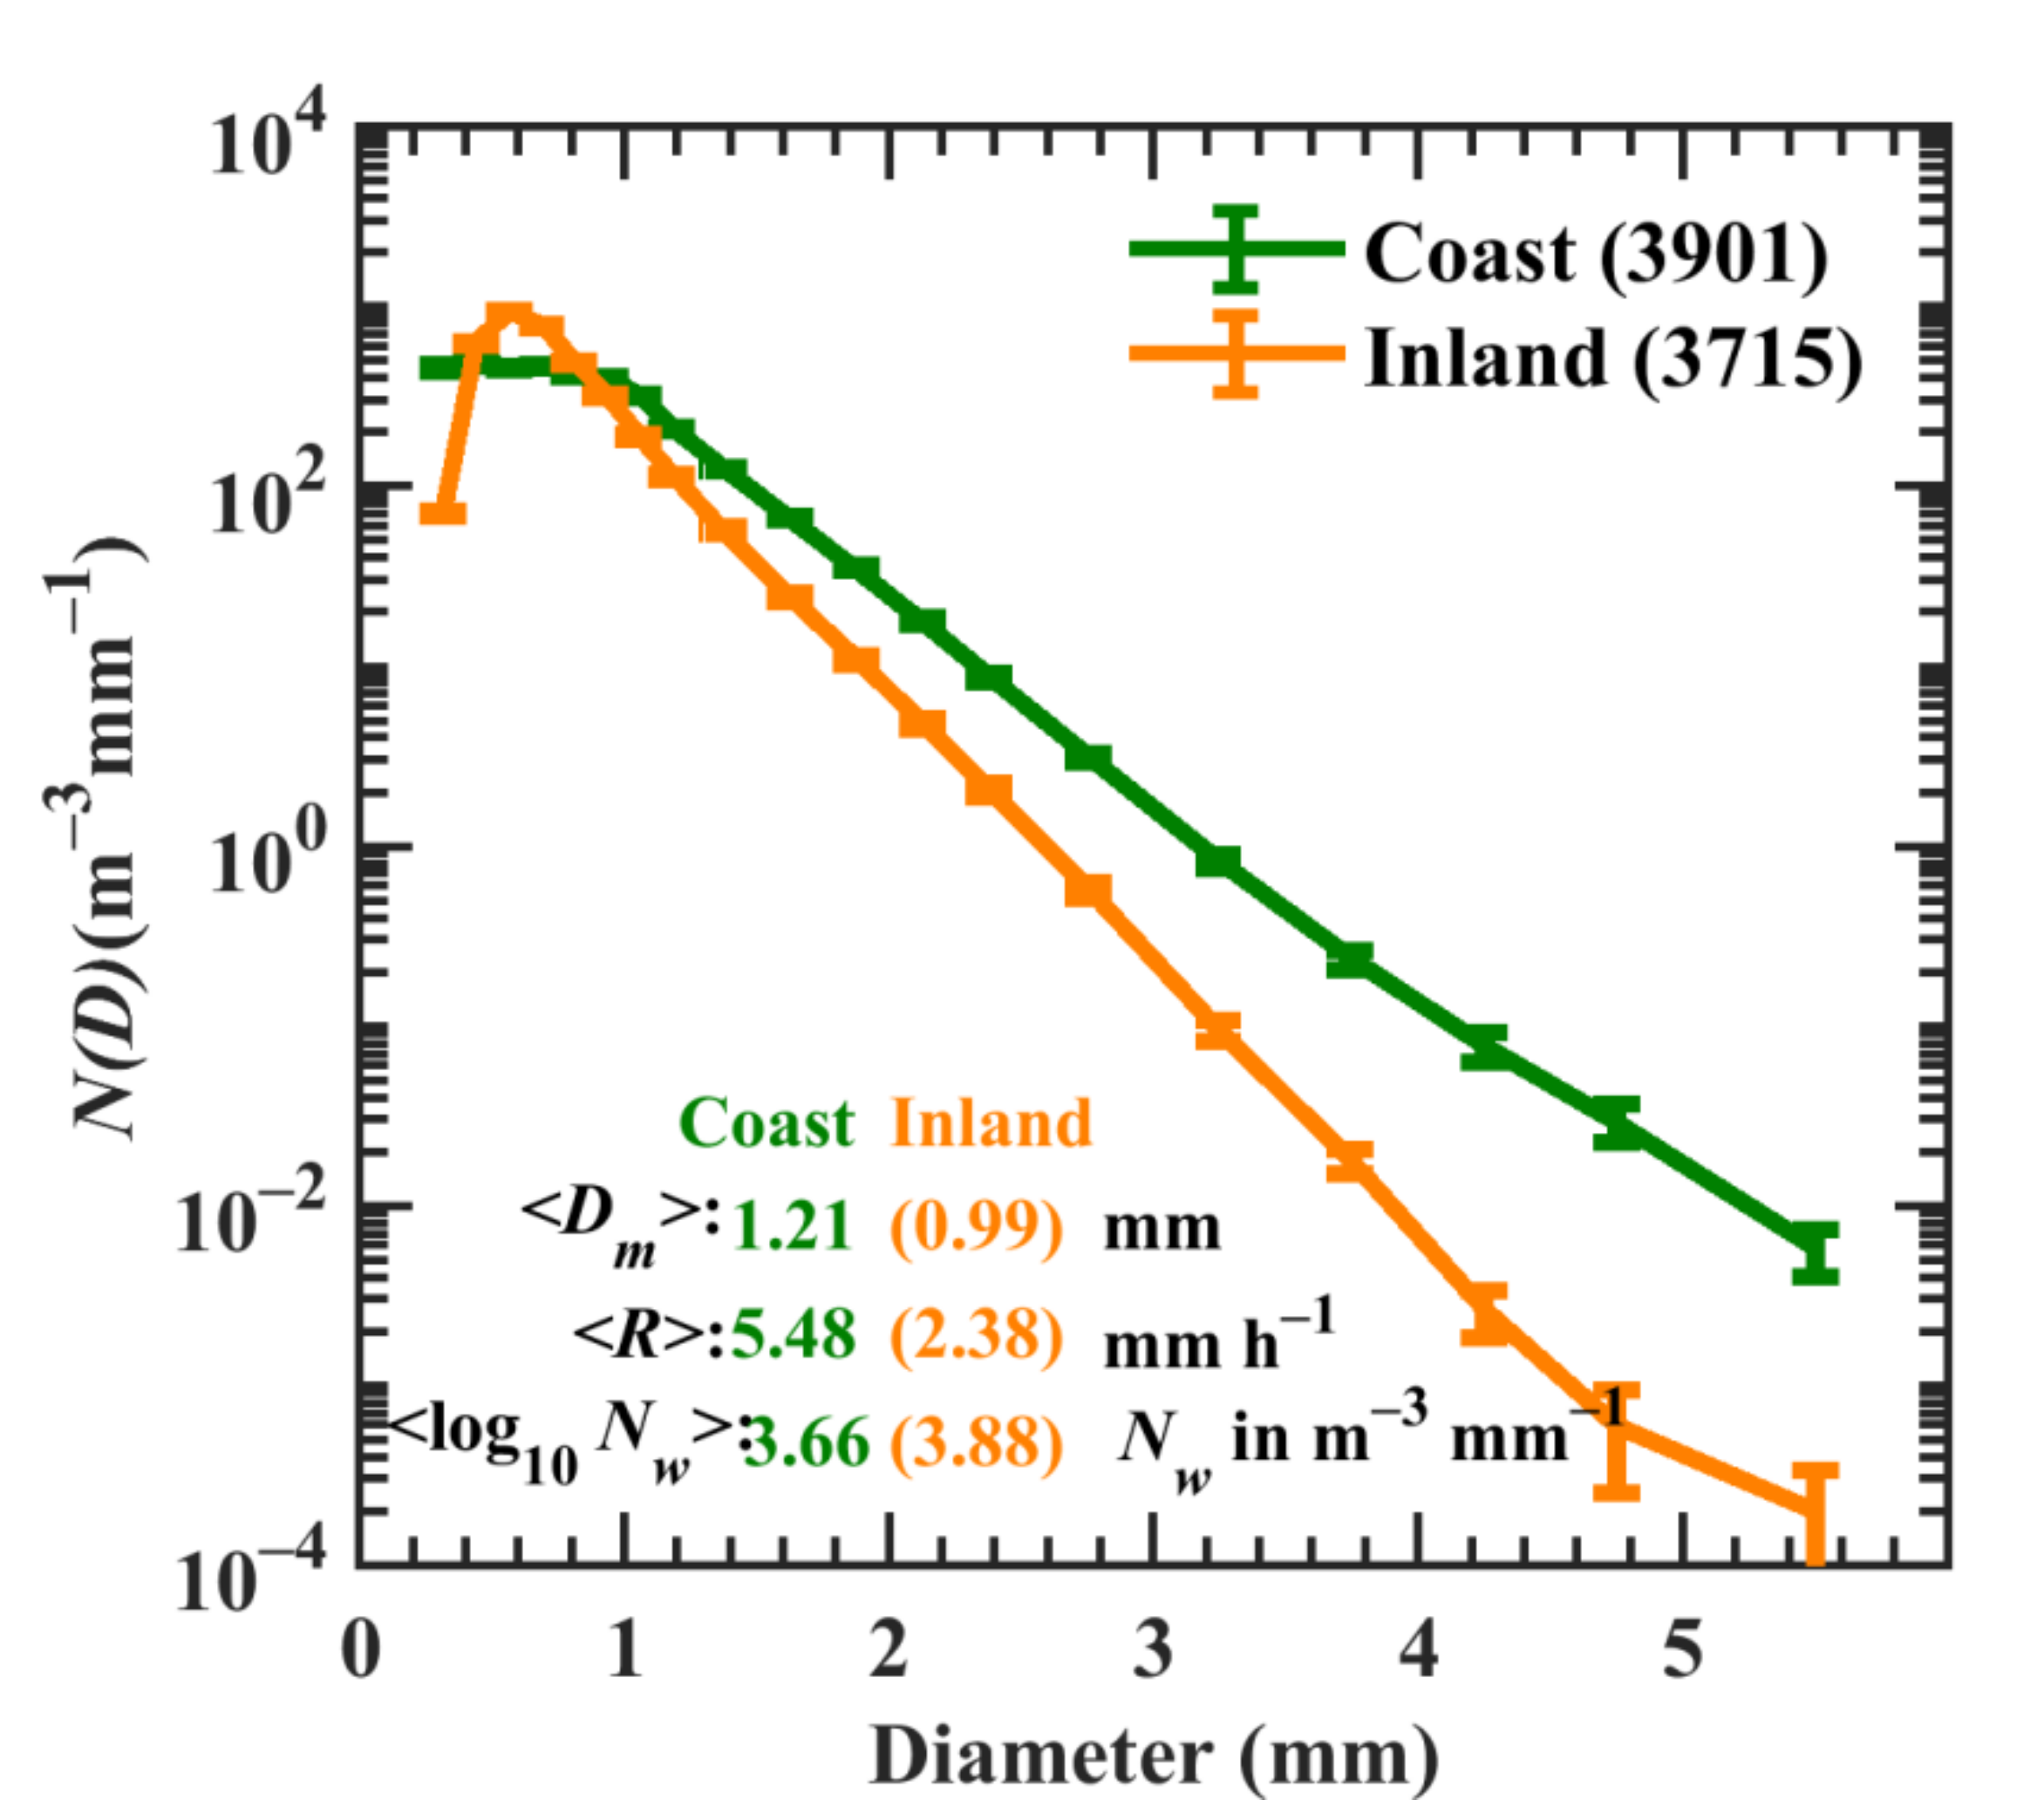
| NIO | Present study | Coast | Parsivel | Four | 1.21 ± 0.36 | 3.66 ± 0.51 |
| NIO | Present study | Inland | Parsivel | Four | 0.99 ± 0.34 | 3.88 ± 0.57 |
| SIO | Deo and Walsh [22] | Darwin, Australia | JWD | Seven | 1.75 | - |
| NWP | Chang et al. [20] | Zhongli, north Taiwan | 2DVD | Fourteen | 2 | 3.8 |
| Janapati et al. [18] | Kaohsiung, south Taiwan | Parsivel | Six | 1.33 ± 0.39 | 3.42 ± 0.47 | |
| Chen et al. [23] | Fujian, east China | Parsivel | One | 1.30 | - | |
| Wang et al. [46] | Jiangning, eastern China | 2DVD | One | 1.41 | 4.67 | |
| Wen et al. [47] | East and south China. | 2-DVD | Seven | 1.13 ± 0.24 | - | |
| Chen et al. [10] | Tokyo, Japan | JWD | Four | 1.25 ± 0.36 | 3.74 ± 0.47 | |
| Le Loh et al. [12] | Miryang, South Korea | Parsivel | Two | 1.19 | 3.44 | |
| AO | Tokay et al. [17] | USA | JWD | Eight | 1.67 ± 0.30 | - |
| Region | Fitting | a | b | c | R2 | RMSE | NRMSE | |
|---|---|---|---|---|---|---|---|---|
| Coast | KEtime−R | linear | 23.408 | -29.057 | - | 0.979 | 53.831 | 0.296 |
| power | 8.838 | 1.244 | - | 0.993 | 30.771 | 0.169 | ||
| KEmm−R | power | 10.648 | 0.175 | - | 0.694 | 3.535 | 0.019 | |
| logarithmic | 11.028 | 4.898 | - | 0.678 | 3.609 | 0.02 | ||
| exponential | 23.225 | 0.591 | 0.056 | 0.678 | 12.225 | 0.067 | ||
| KEmm−Dm | power | 9.263 | 1.296 | - | 0.986 | 0.845 | 0.268 | |
| polynomial | −1.656 | 18.326 | −7.571 | 0.992 | 11.745 | 3.729 | ||
| KEtime−Zku | power | 1.346 × 10⁻⁹ | 7.039 | - | 0.979 | 53.719 | 0.997 | |
| KEtime−Zka | power | 1.541 × 10⁻¹¹ | 8.370 | - | 0.942 | 89.286 | 1.999 | |
| Inland | KEtime−R | linear | 18.336 | -12.372 | - | 0.973 | 20.088 | 0.347 |
| power | 7.724 | 1.266 | - | 0.987 | 13.904 | 0.24 | ||
| KEmm−R | power | 8.588 | 0.209 | - | 0.52 | 4.027 | 0.07 | |
| logarithmic | 8.925 | 4.244 | - | 0.5 | 4.081 | 0.07 | ||
| exponential | 18.561 | 0.636 | 0.115 | 0.5 | 10.685 | 0.185 | ||
| KEmm−Dm | power | 8.746 | 1.418 | - | 0.988 | 0.766 | 0.258 | |
| polynomial | −0.905 | 16.063 | −6.105 | 0.995 | 9.023 | 3.046 | ||
| KEtime−Zku | power | 1.031 × 10⁻⁹ | 7.118 | - | 0.961 | 24.197 | 0.544 | |
| KEtime−Zka | power | 9.733 × 10⁻¹¹ | 7.810 | - | 0.988 | 24.197 | 0.591 | |
Publisher’s Note: MDPI stays neutral with regard to jurisdictional claims in published maps and institutional affiliations. |
© 2021 by the authors. Licensee MDPI, Basel, Switzerland. This article is an open access article distributed under the terms and conditions of the Creative Commons Attribution (CC BY) license (https://creativecommons.org/licenses/by/4.0/).
Share and Cite
Seela, B.K.; Janapati, J.; Kalath Unnikrishnan, C.; Lin, P.-L.; Le Loh, J.; Chang, W.-Y.; Kumar, U.; Reddy, K.K.; Lee, D.-I.; Venkatrami Reddy, M. Raindrop Size Distributions of North Indian Ocean Tropical Cyclones Observed at the Coastal and Inland Stations in South India. Remote Sens. 2021, 13, 3178. https://0-doi-org.brum.beds.ac.uk/10.3390/rs13163178
Seela BK, Janapati J, Kalath Unnikrishnan C, Lin P-L, Le Loh J, Chang W-Y, Kumar U, Reddy KK, Lee D-I, Venkatrami Reddy M. Raindrop Size Distributions of North Indian Ocean Tropical Cyclones Observed at the Coastal and Inland Stations in South India. Remote Sensing. 2021; 13(16):3178. https://0-doi-org.brum.beds.ac.uk/10.3390/rs13163178
Chicago/Turabian StyleSeela, Balaji Kumar, Jayalakshmi Janapati, Chirikandath Kalath Unnikrishnan, Pay-Liam Lin, Jui Le Loh, Wei-Yu Chang, Utpal Kumar, K. Krishna Reddy, Dong-In Lee, and Mannem Venkatrami Reddy. 2021. "Raindrop Size Distributions of North Indian Ocean Tropical Cyclones Observed at the Coastal and Inland Stations in South India" Remote Sensing 13, no. 16: 3178. https://0-doi-org.brum.beds.ac.uk/10.3390/rs13163178