
Studying a Subsiding Urbanized Area from a Multidisciplinary Perspective: The Inner Sector of the Sarno Plain (Southern Apennines, Italy)

 ,
,  ,
,
Abstract
:
1. Introduction
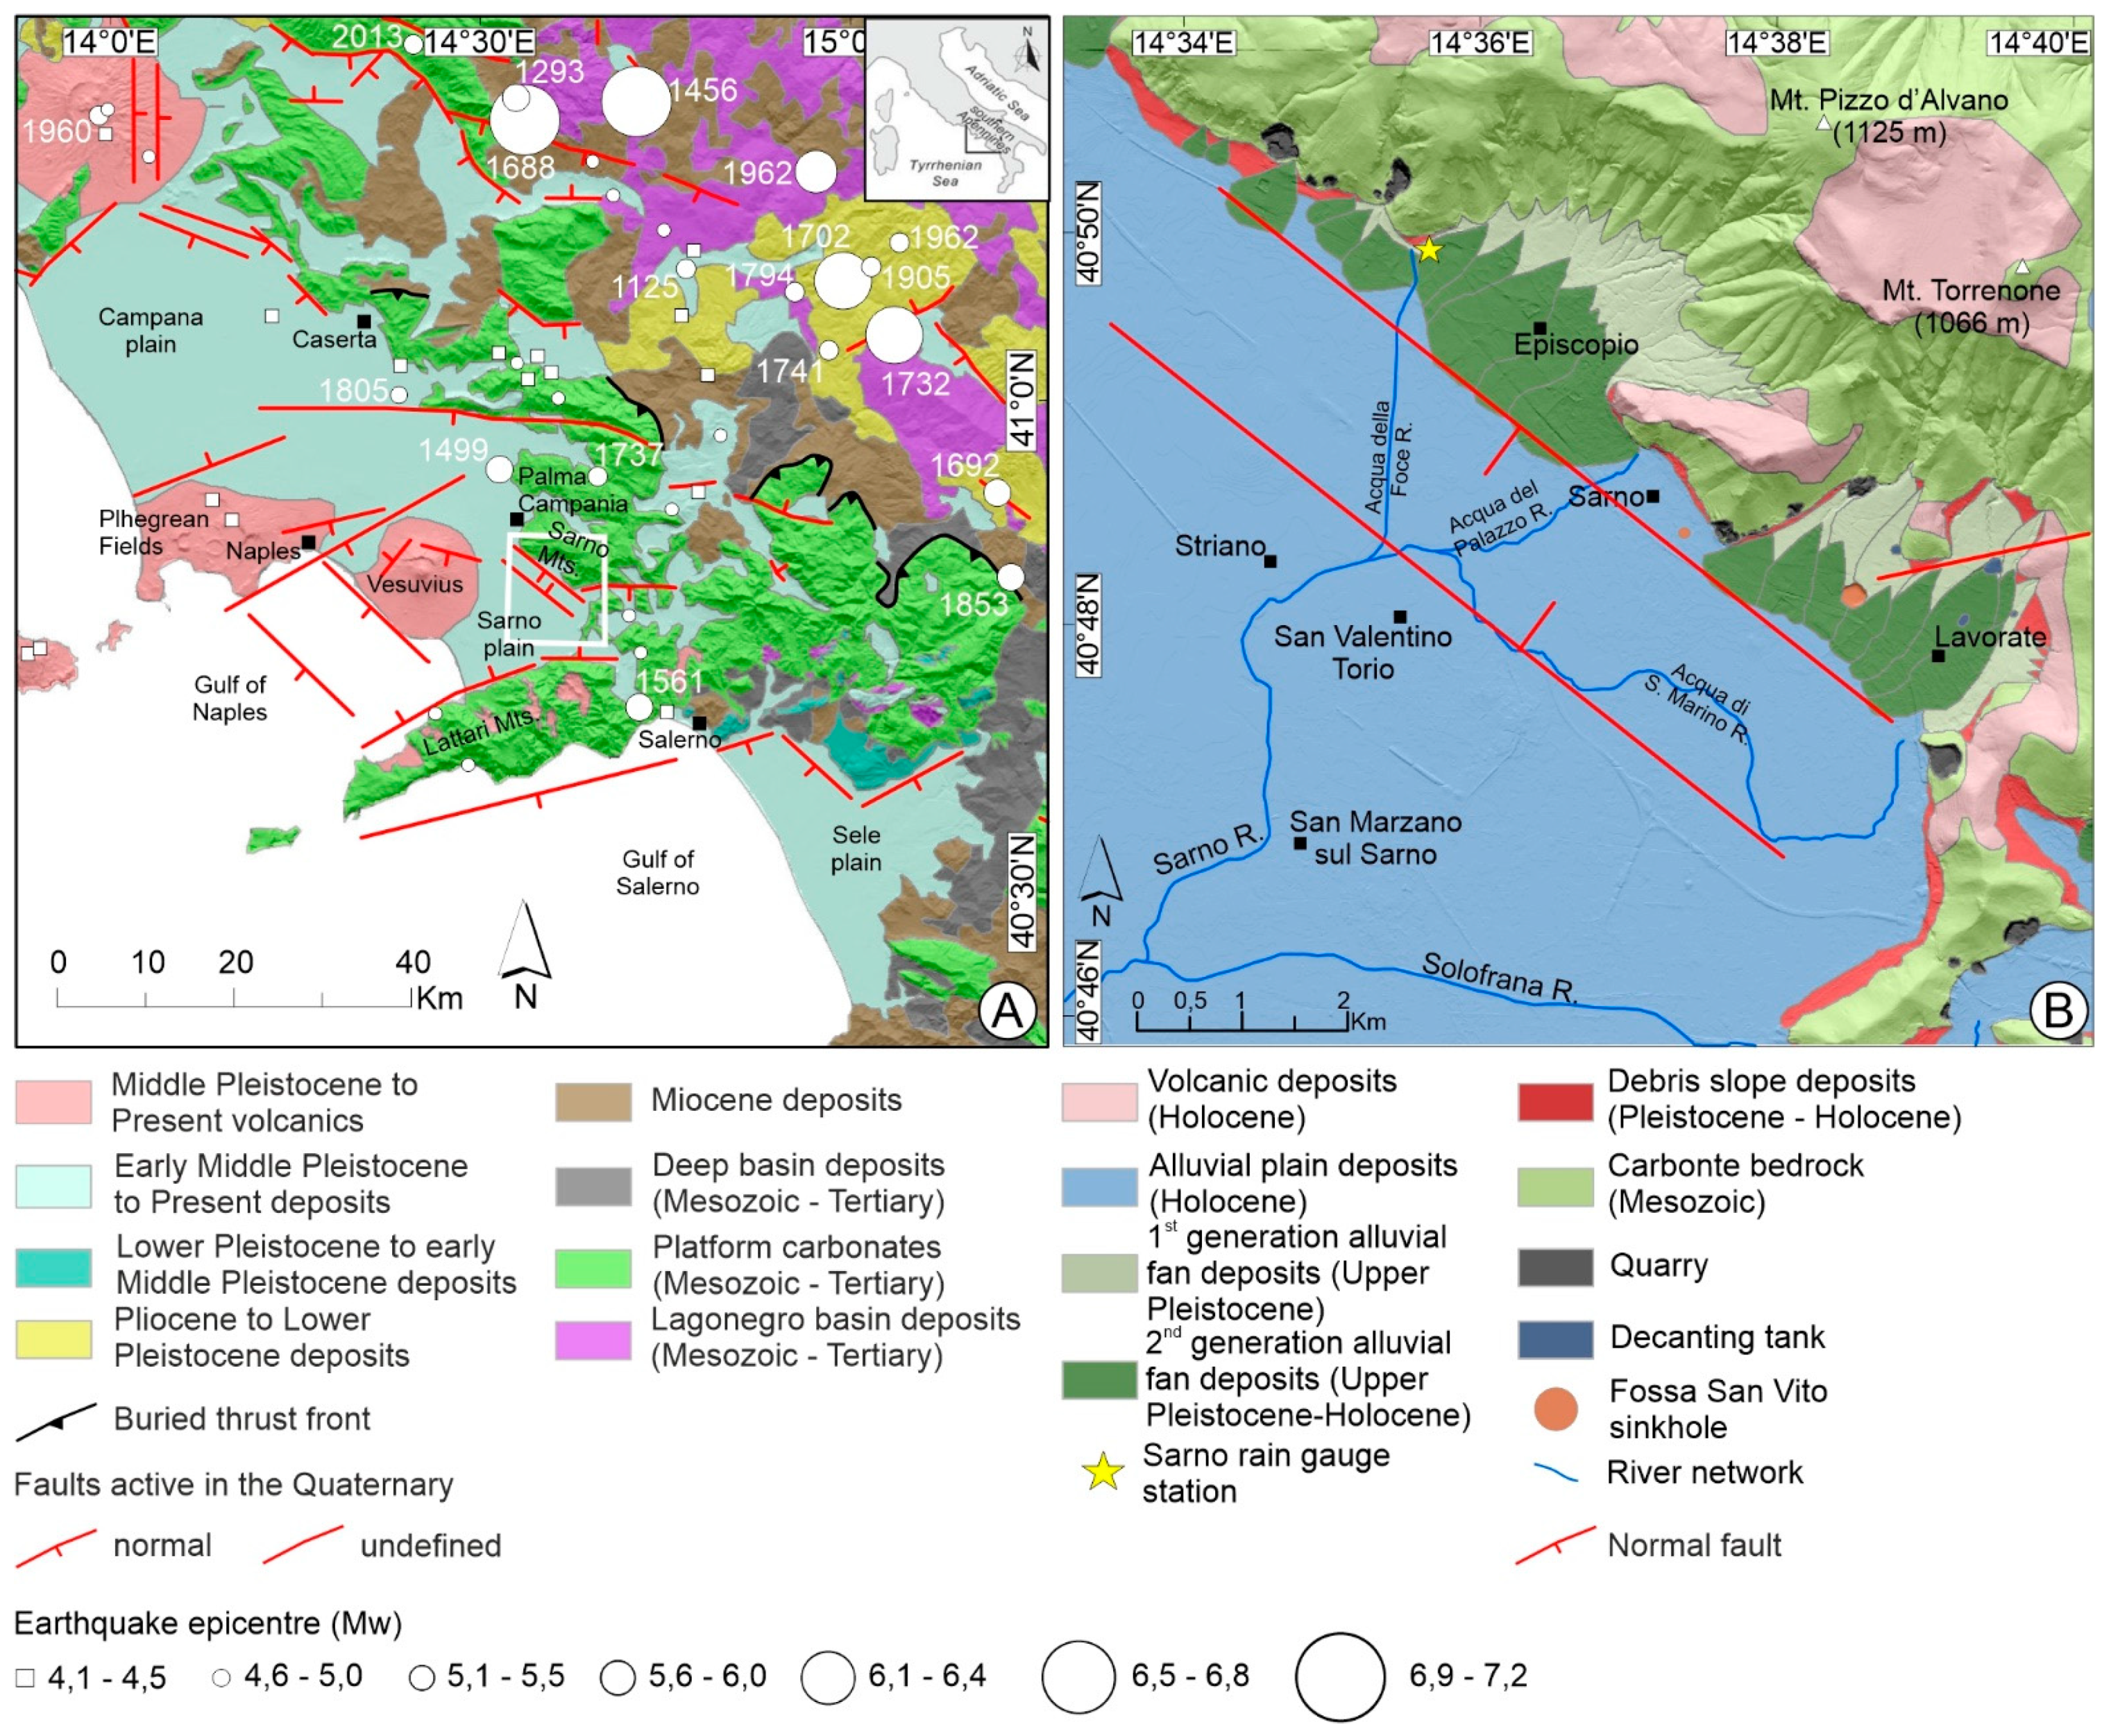
2. Study Area
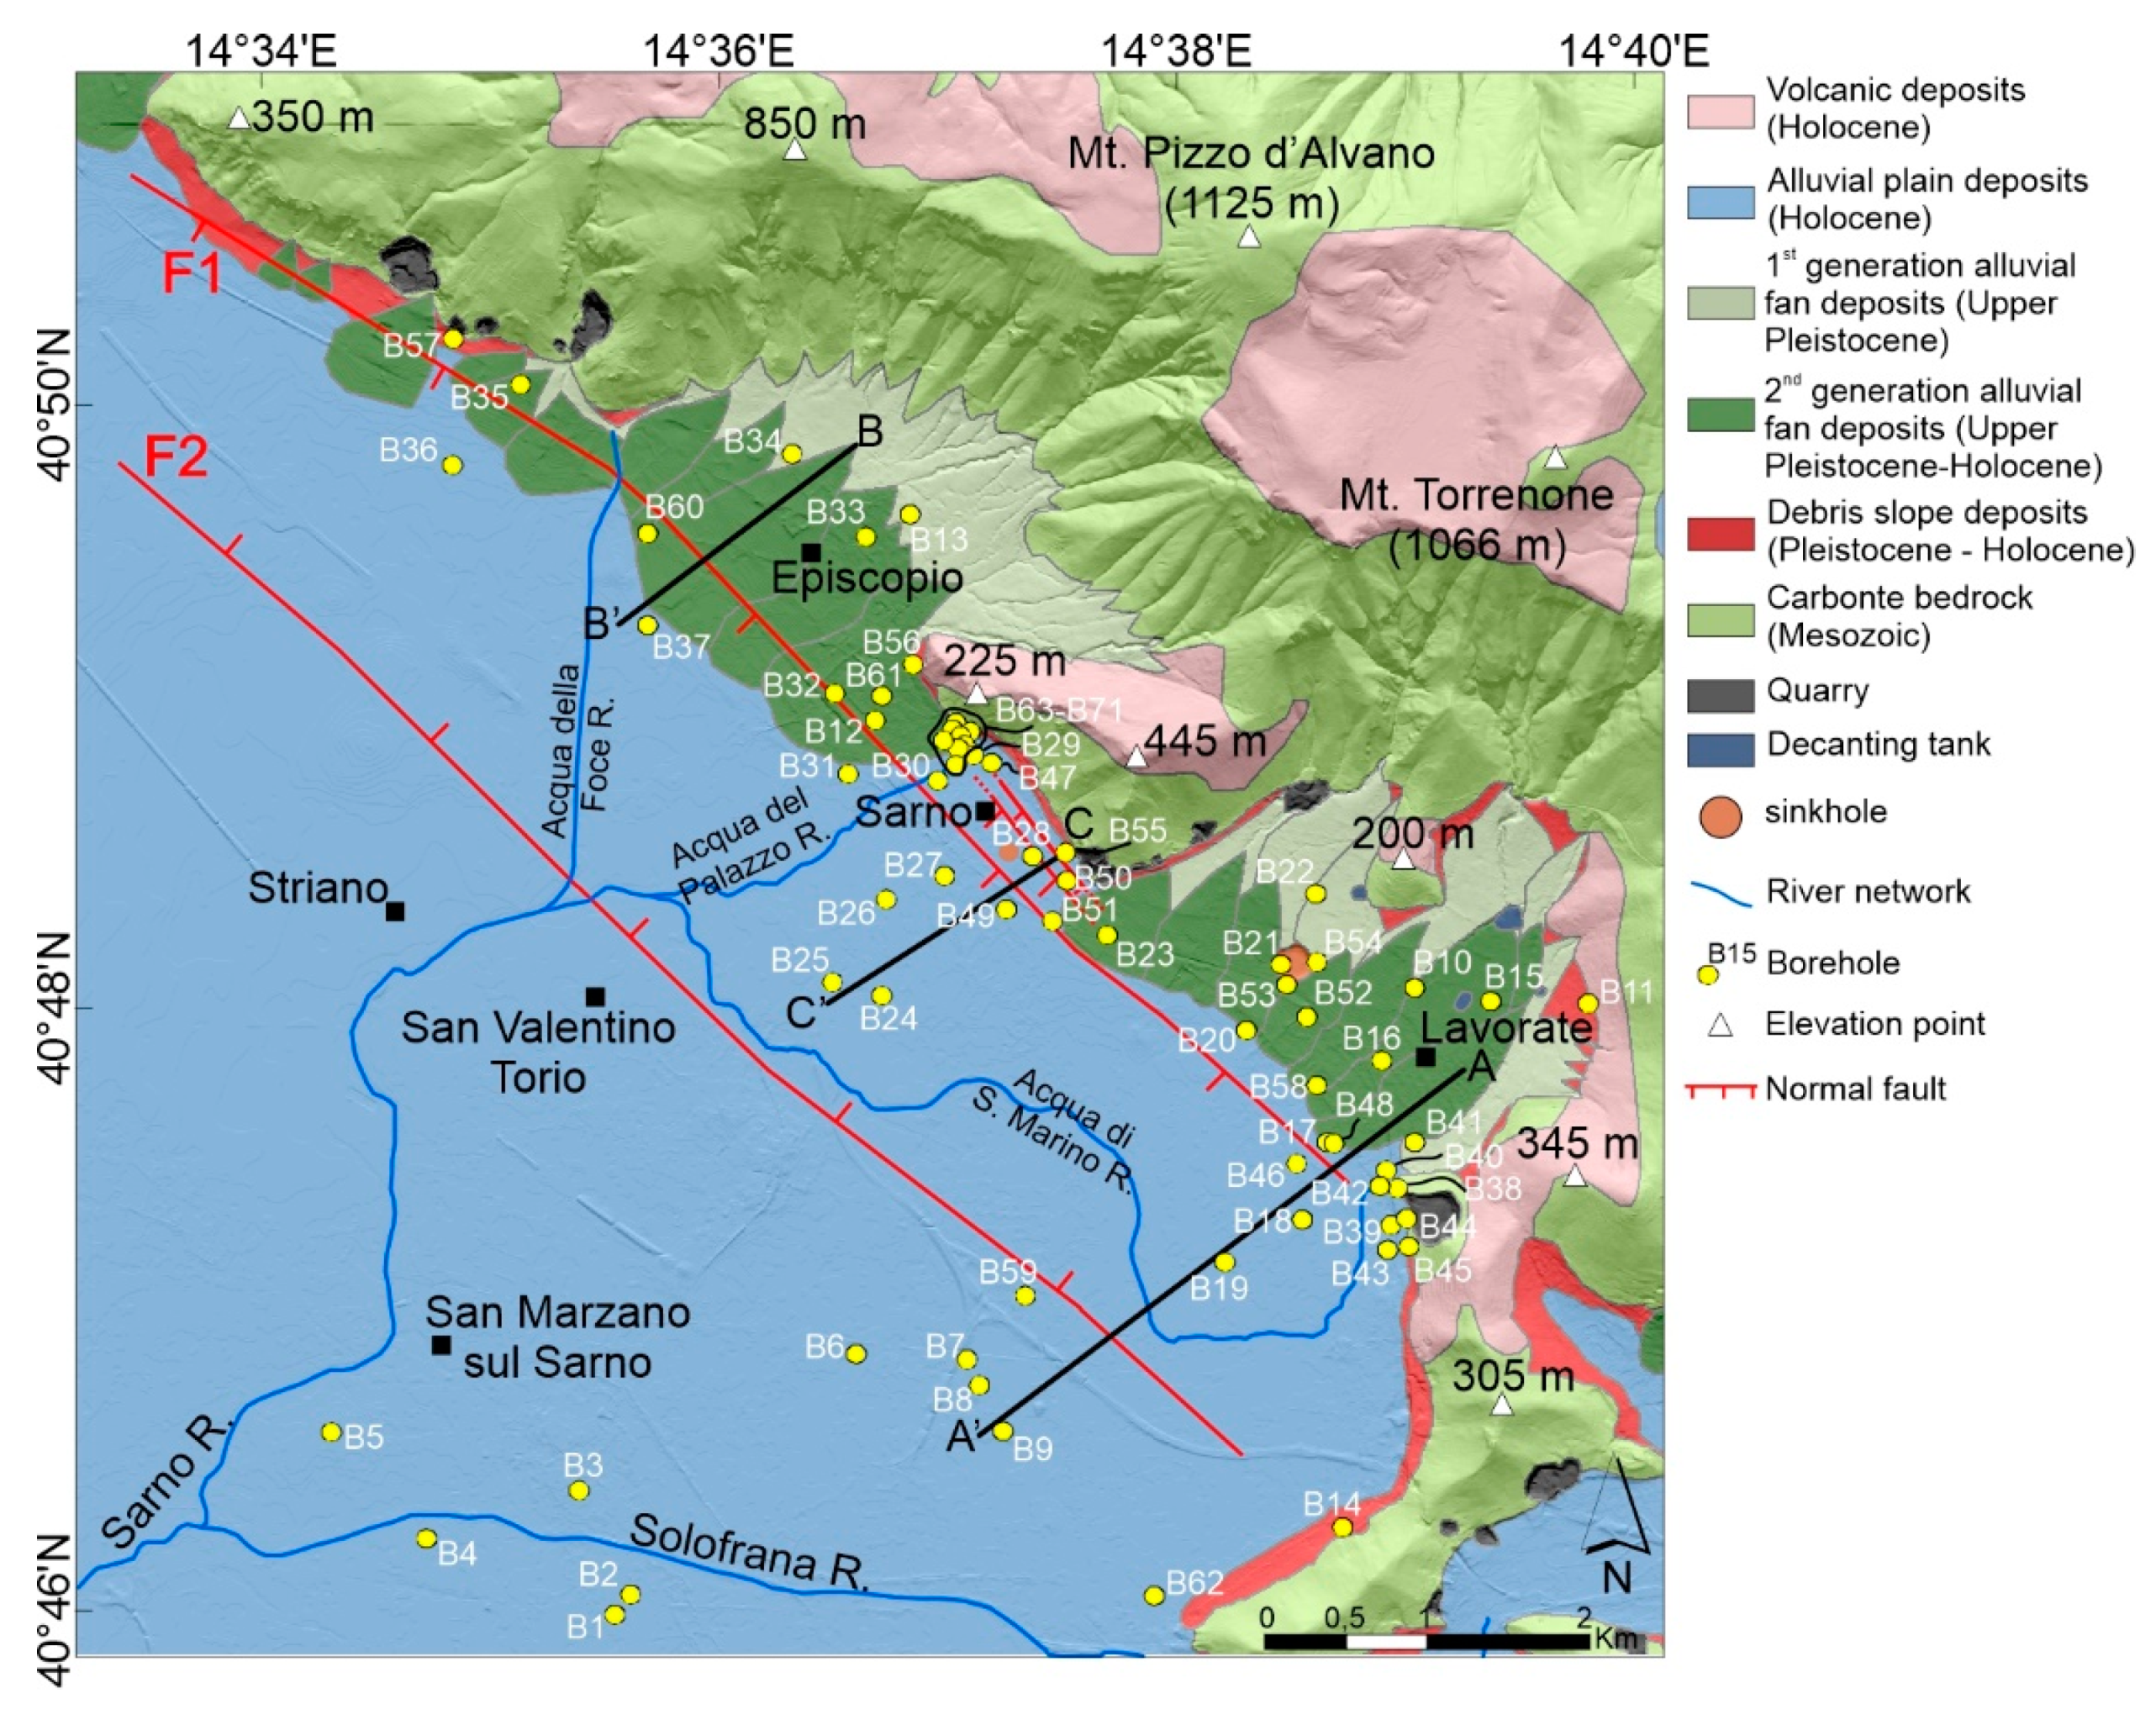
2.1. Geological Setting
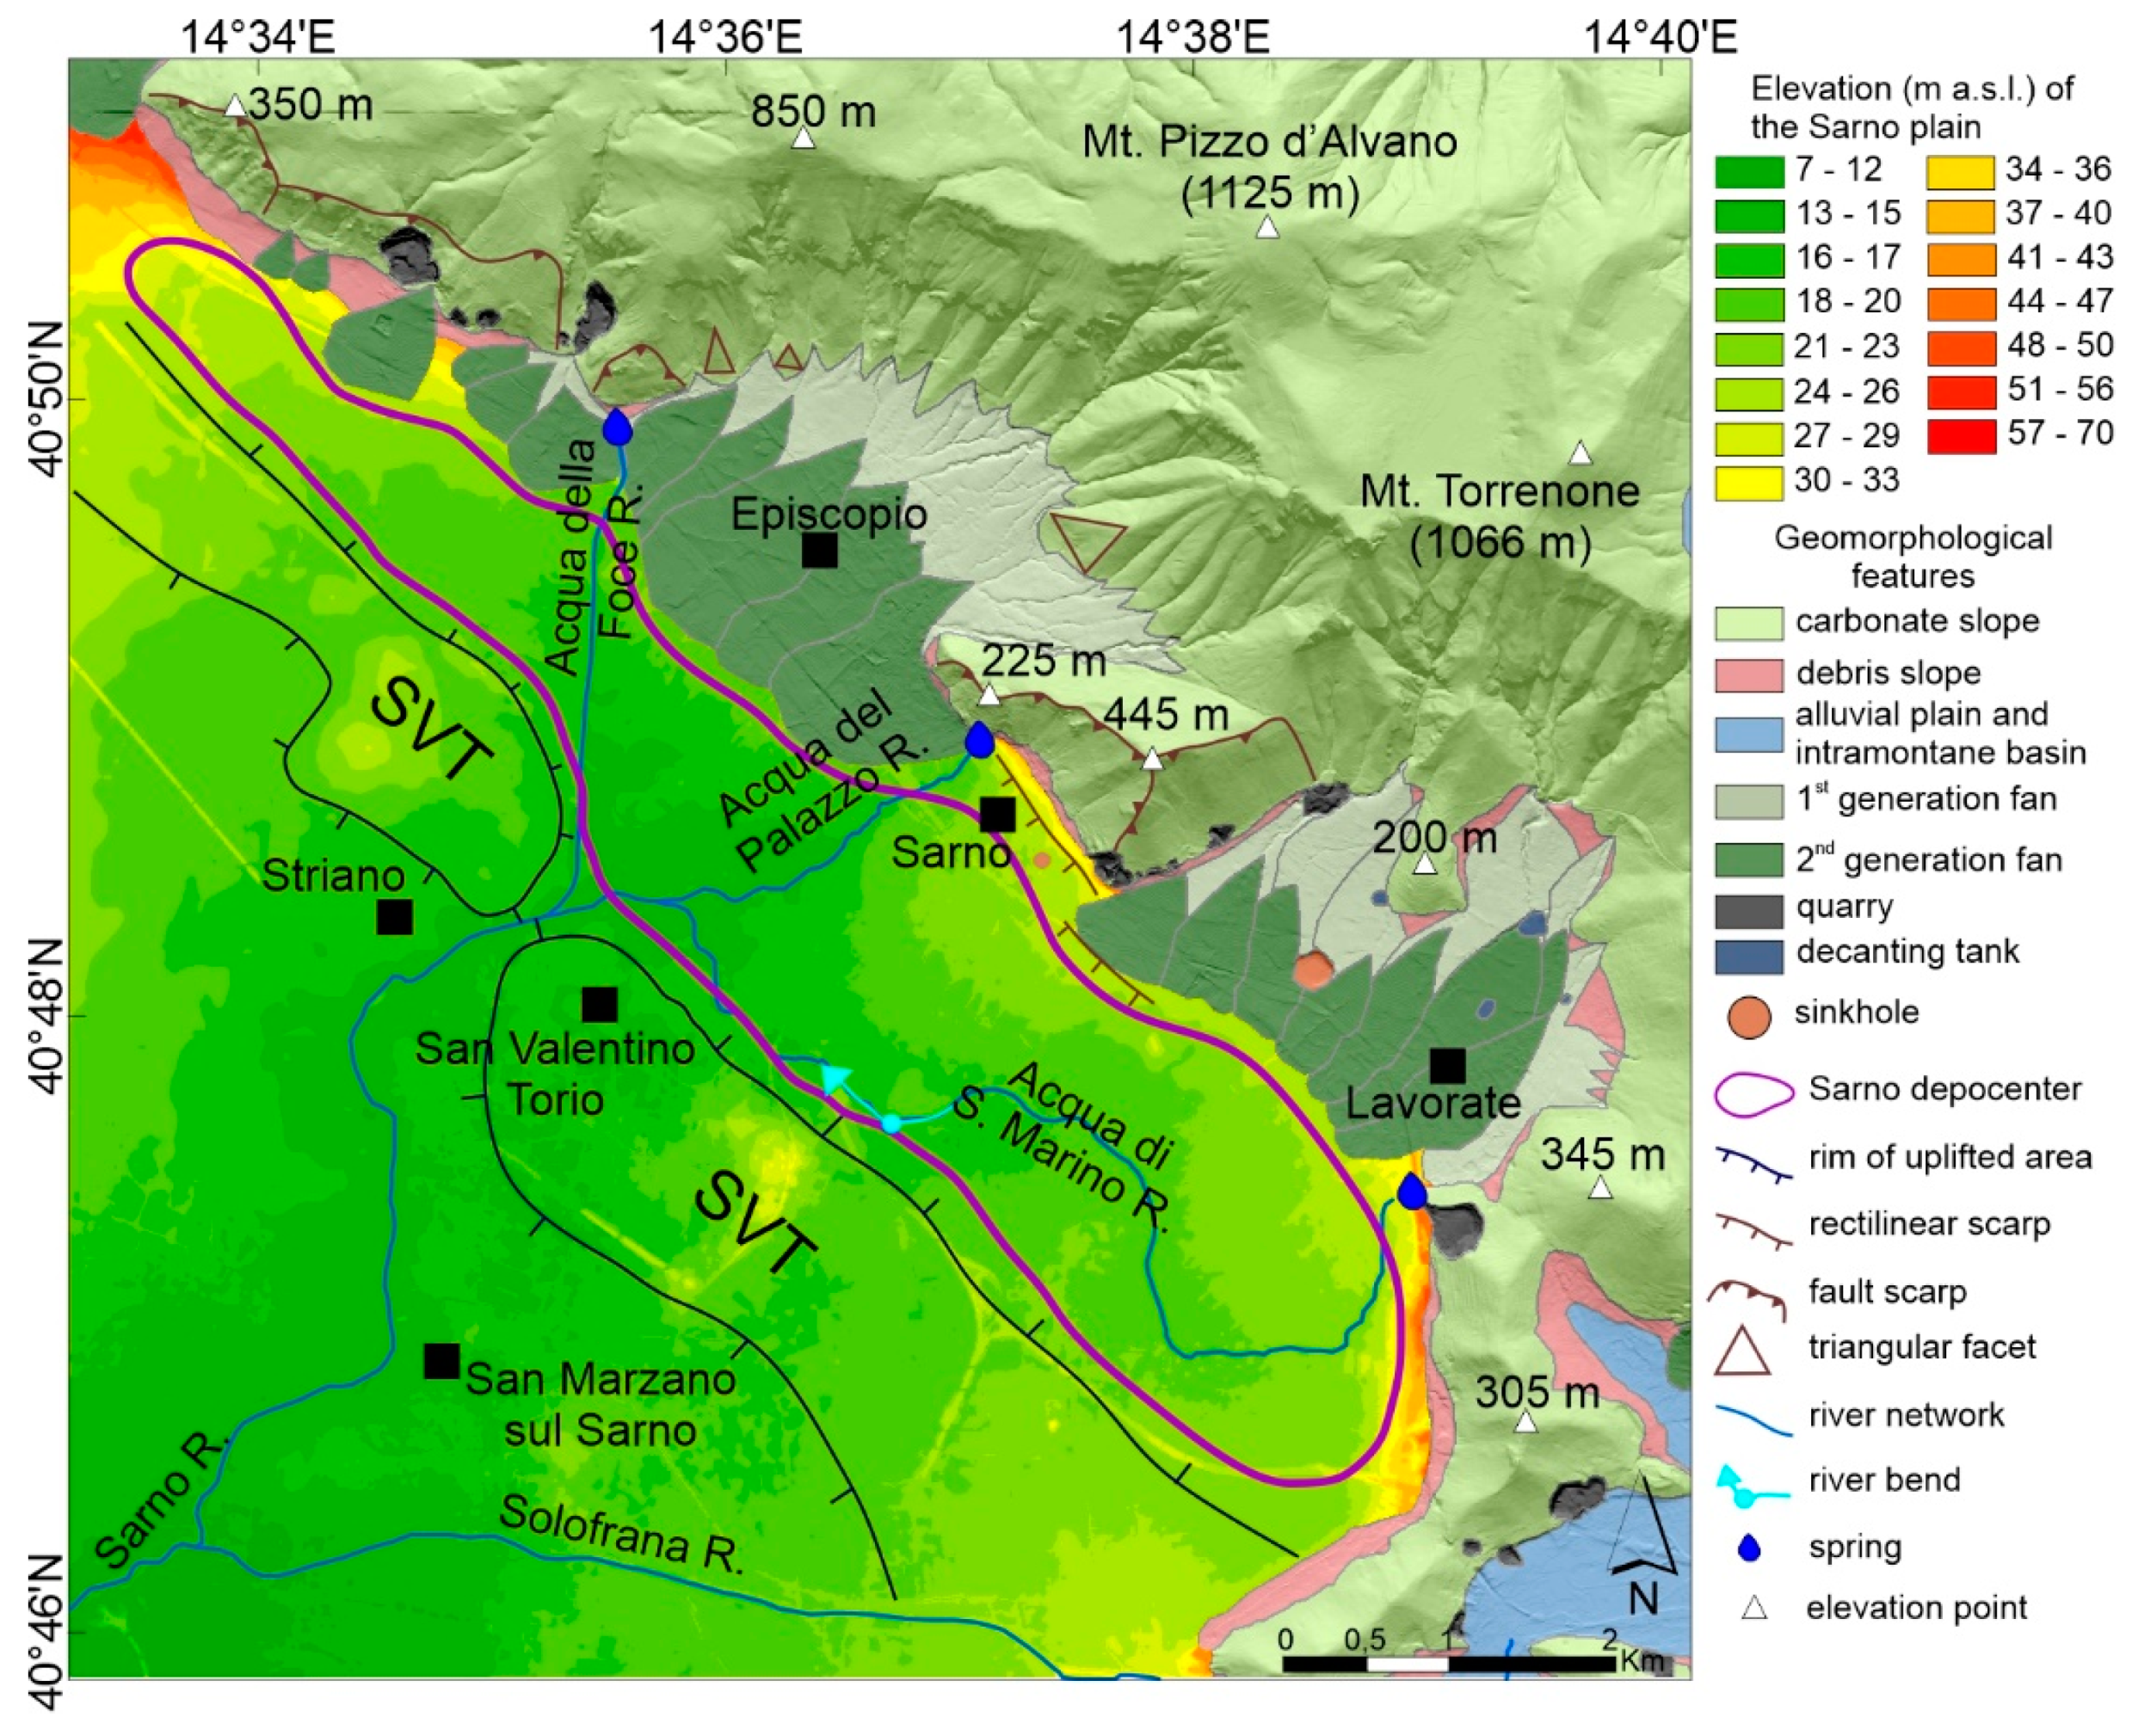
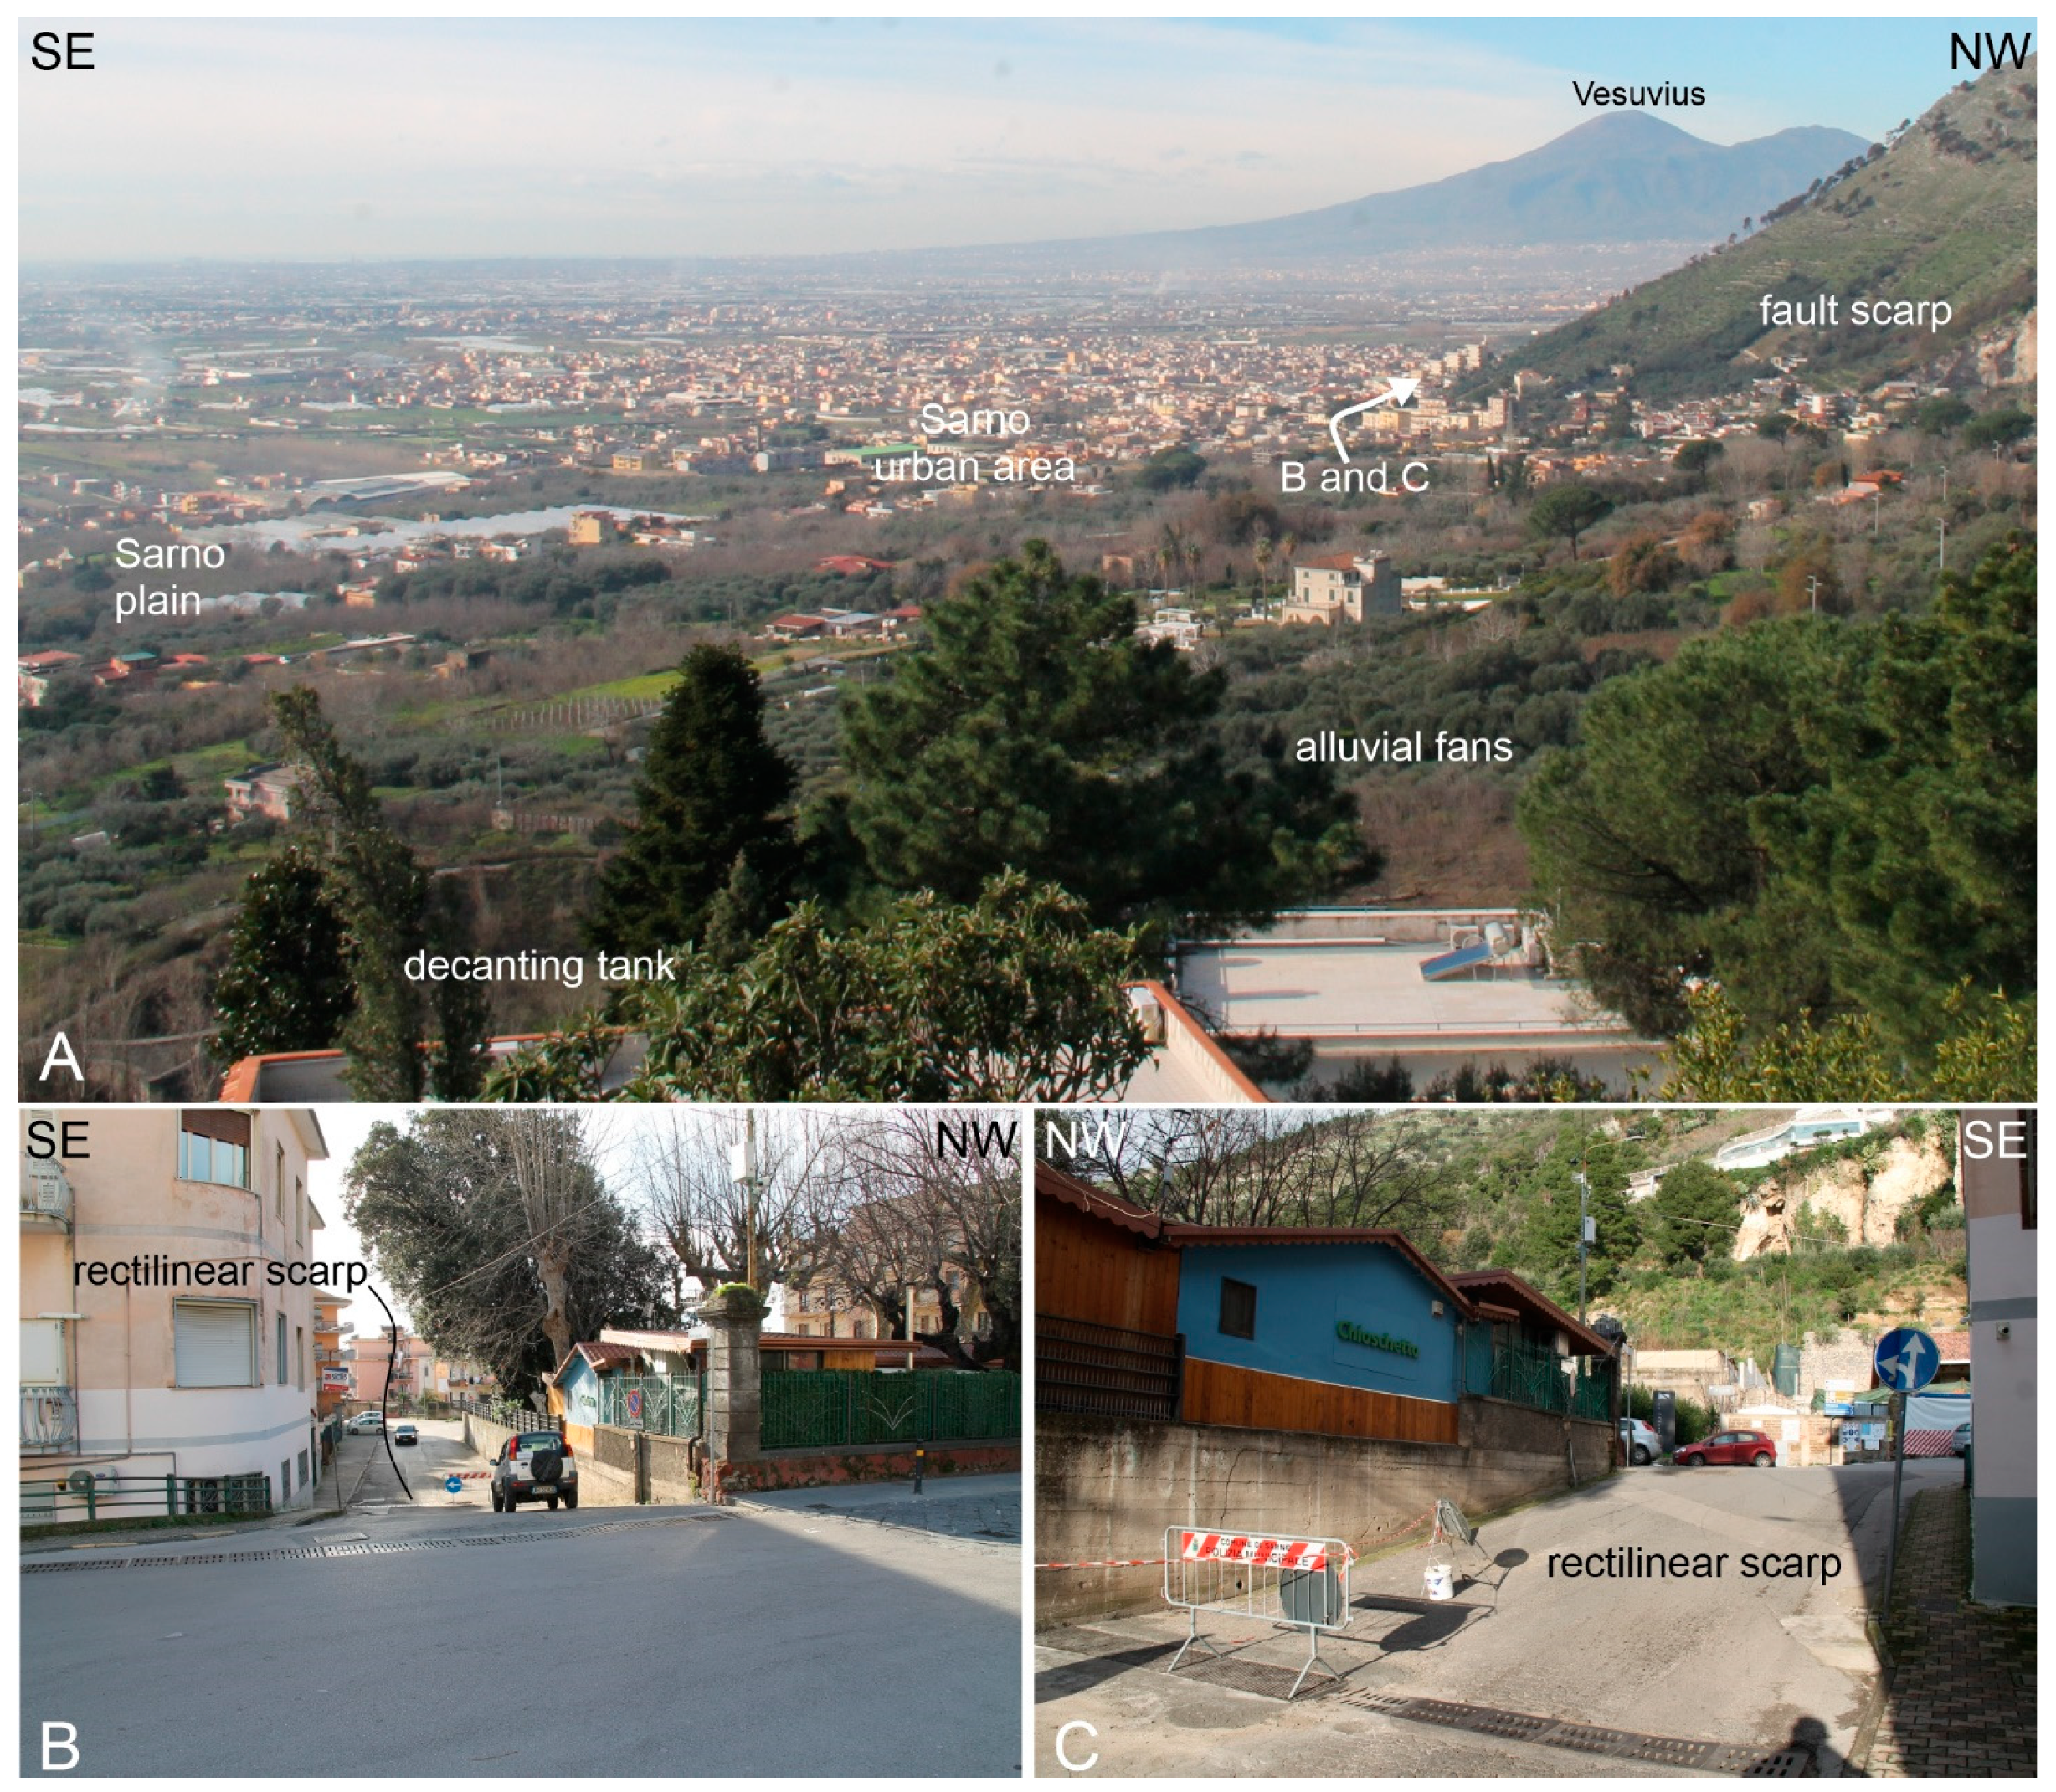
2.2. Geomorphological Setting
3. Materials and Methods
3.1. Geomorphological Analysis
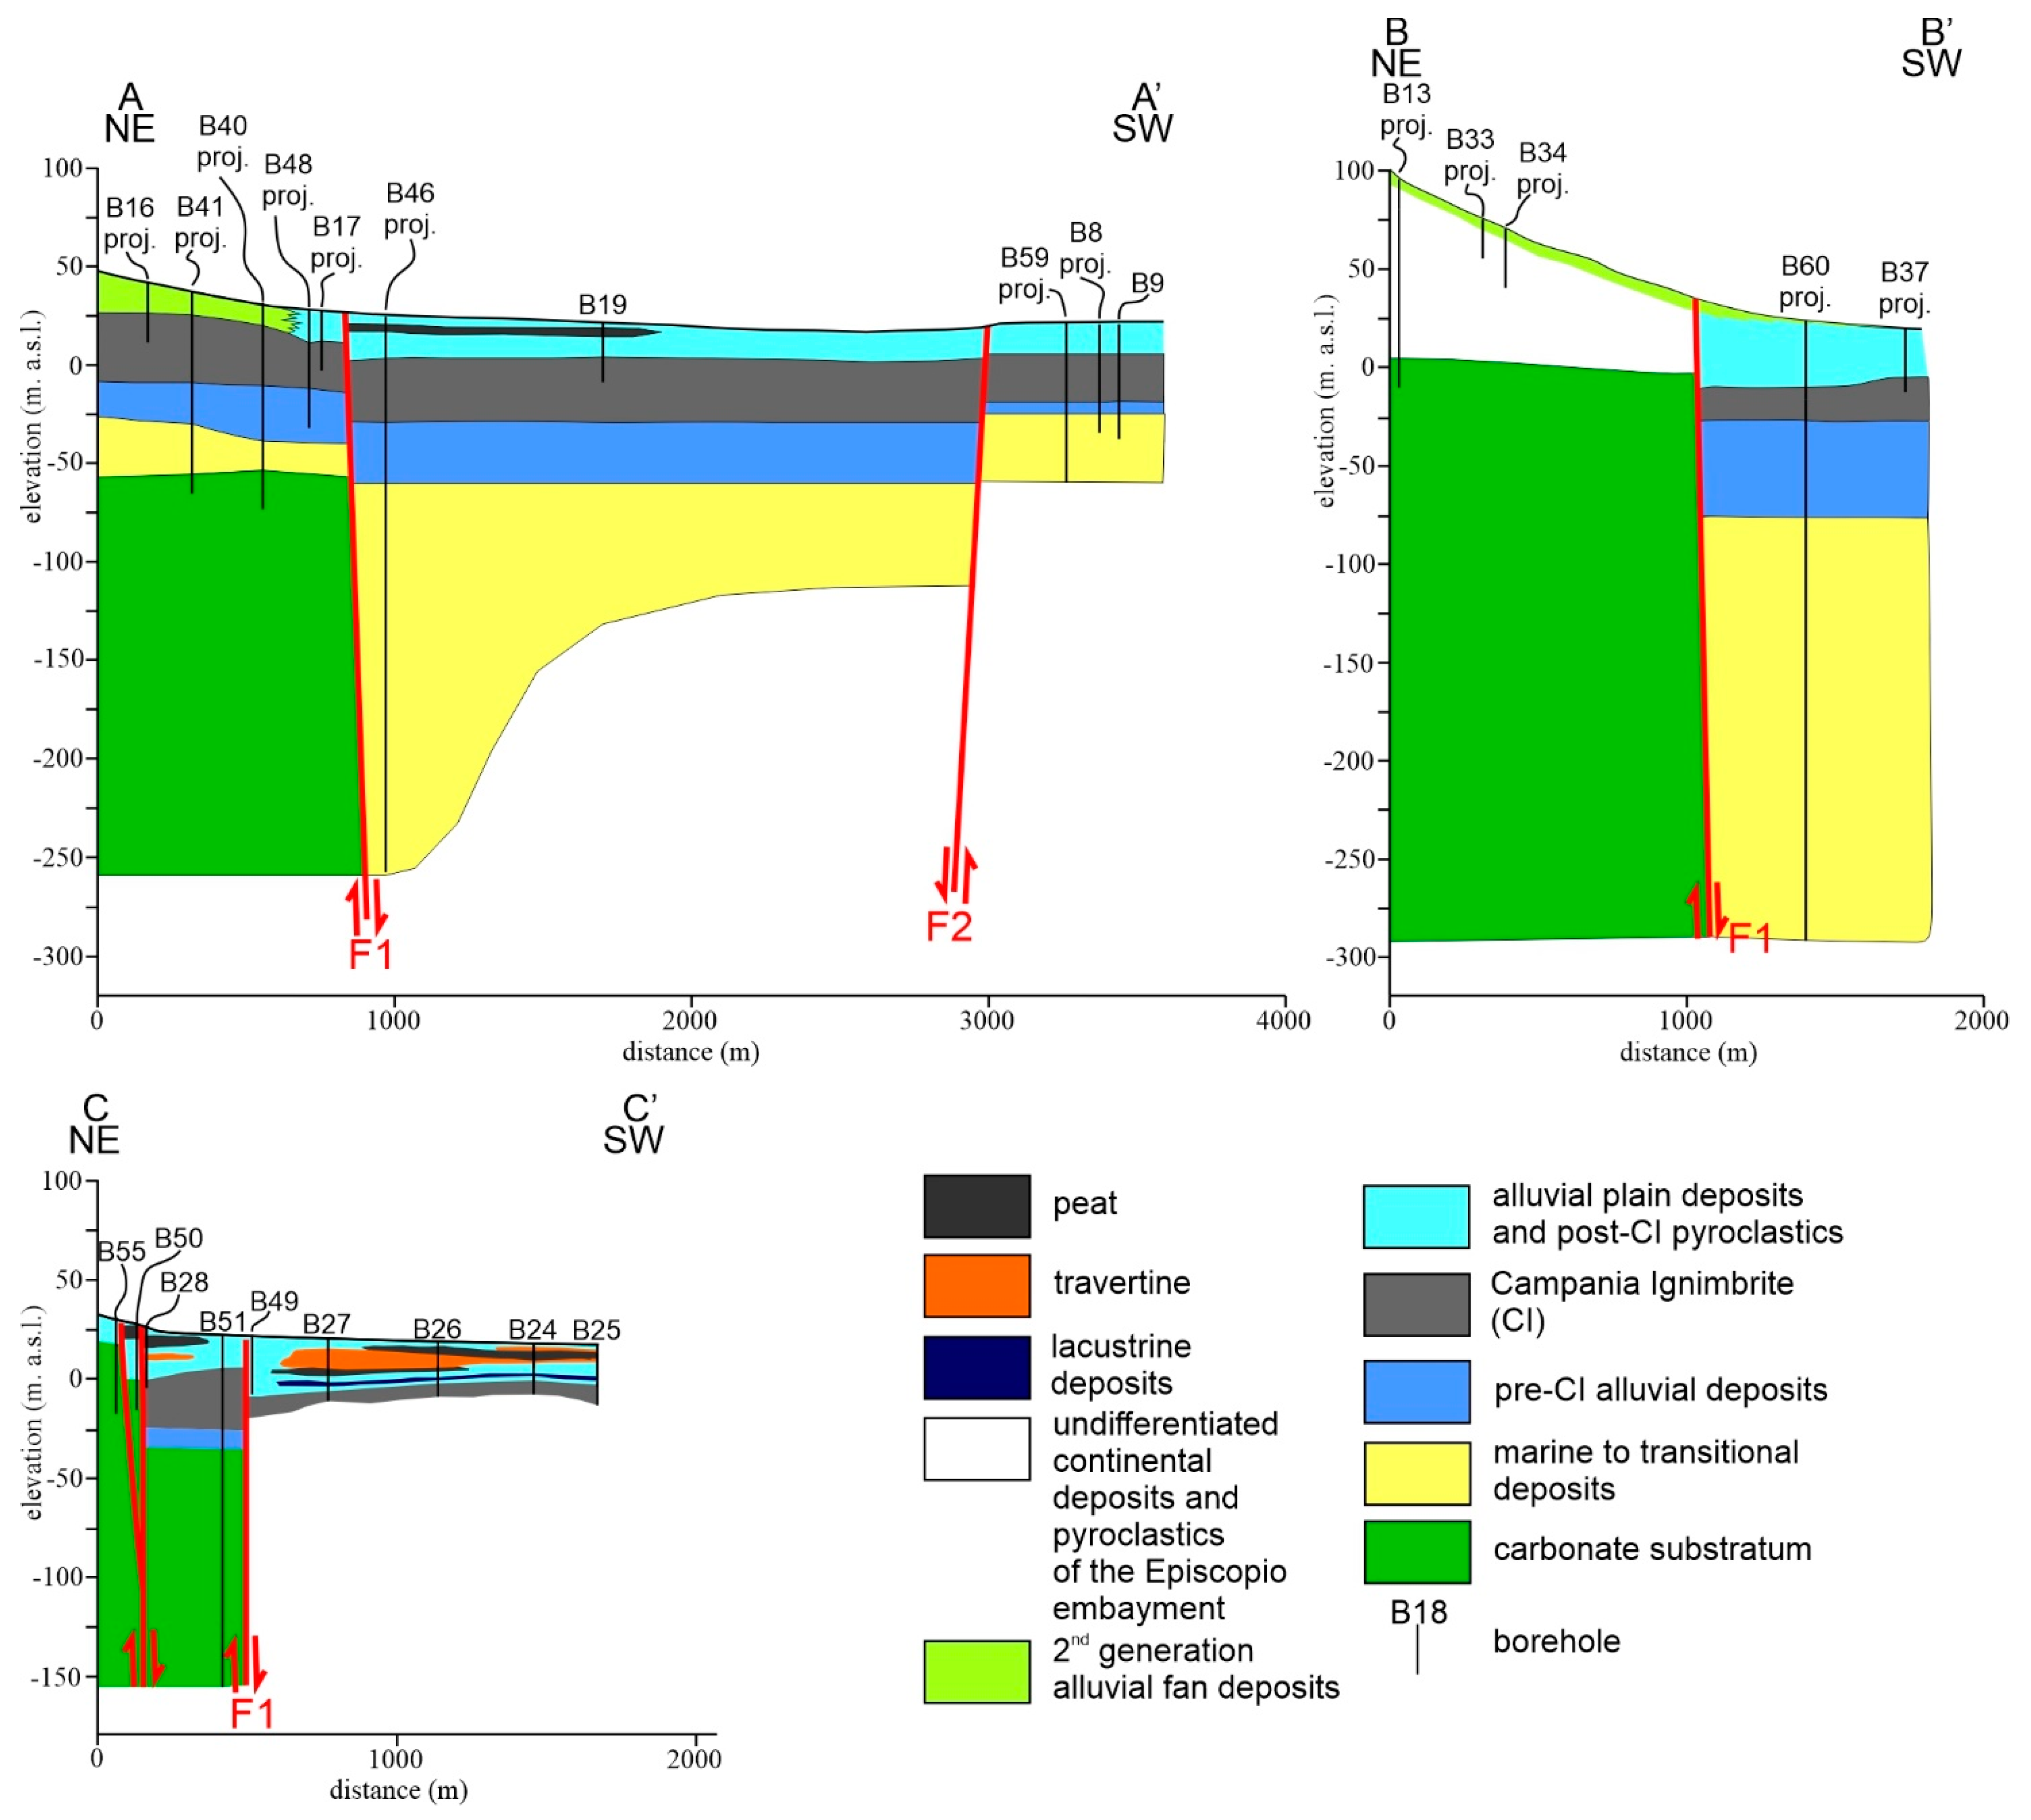
3.2. Stratigraphic Analysis
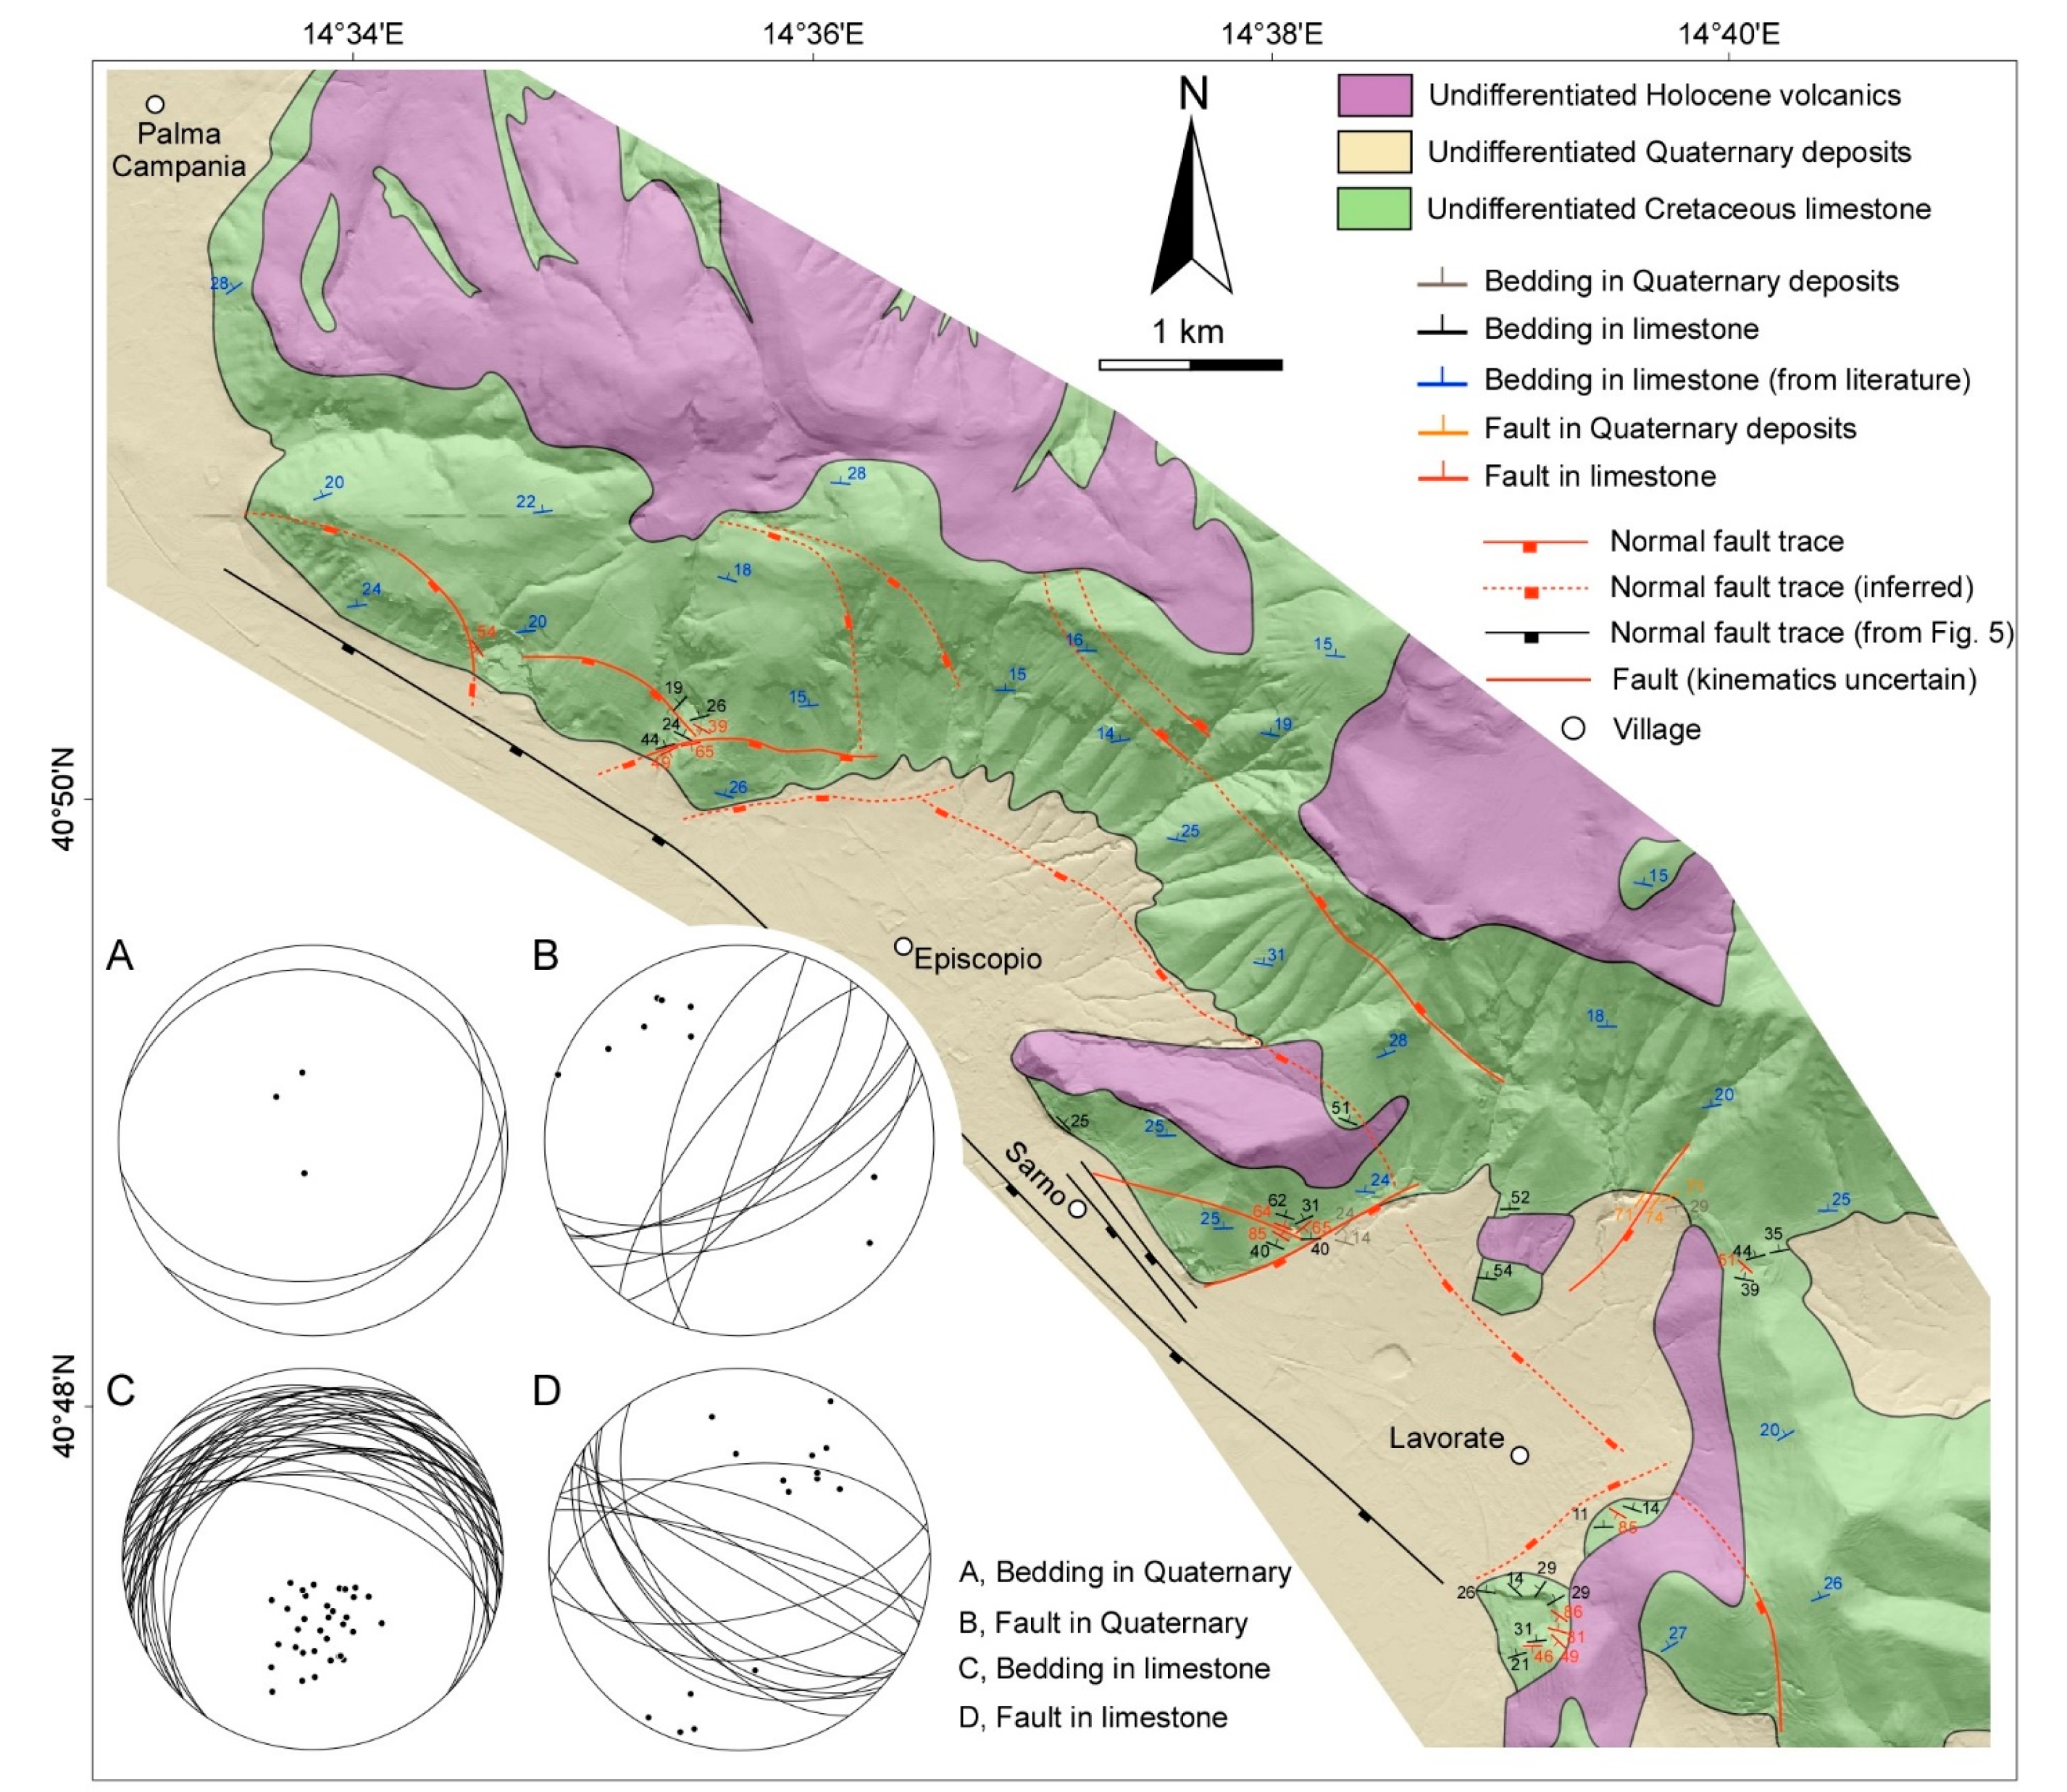
3.3. Structural Geology Analysis
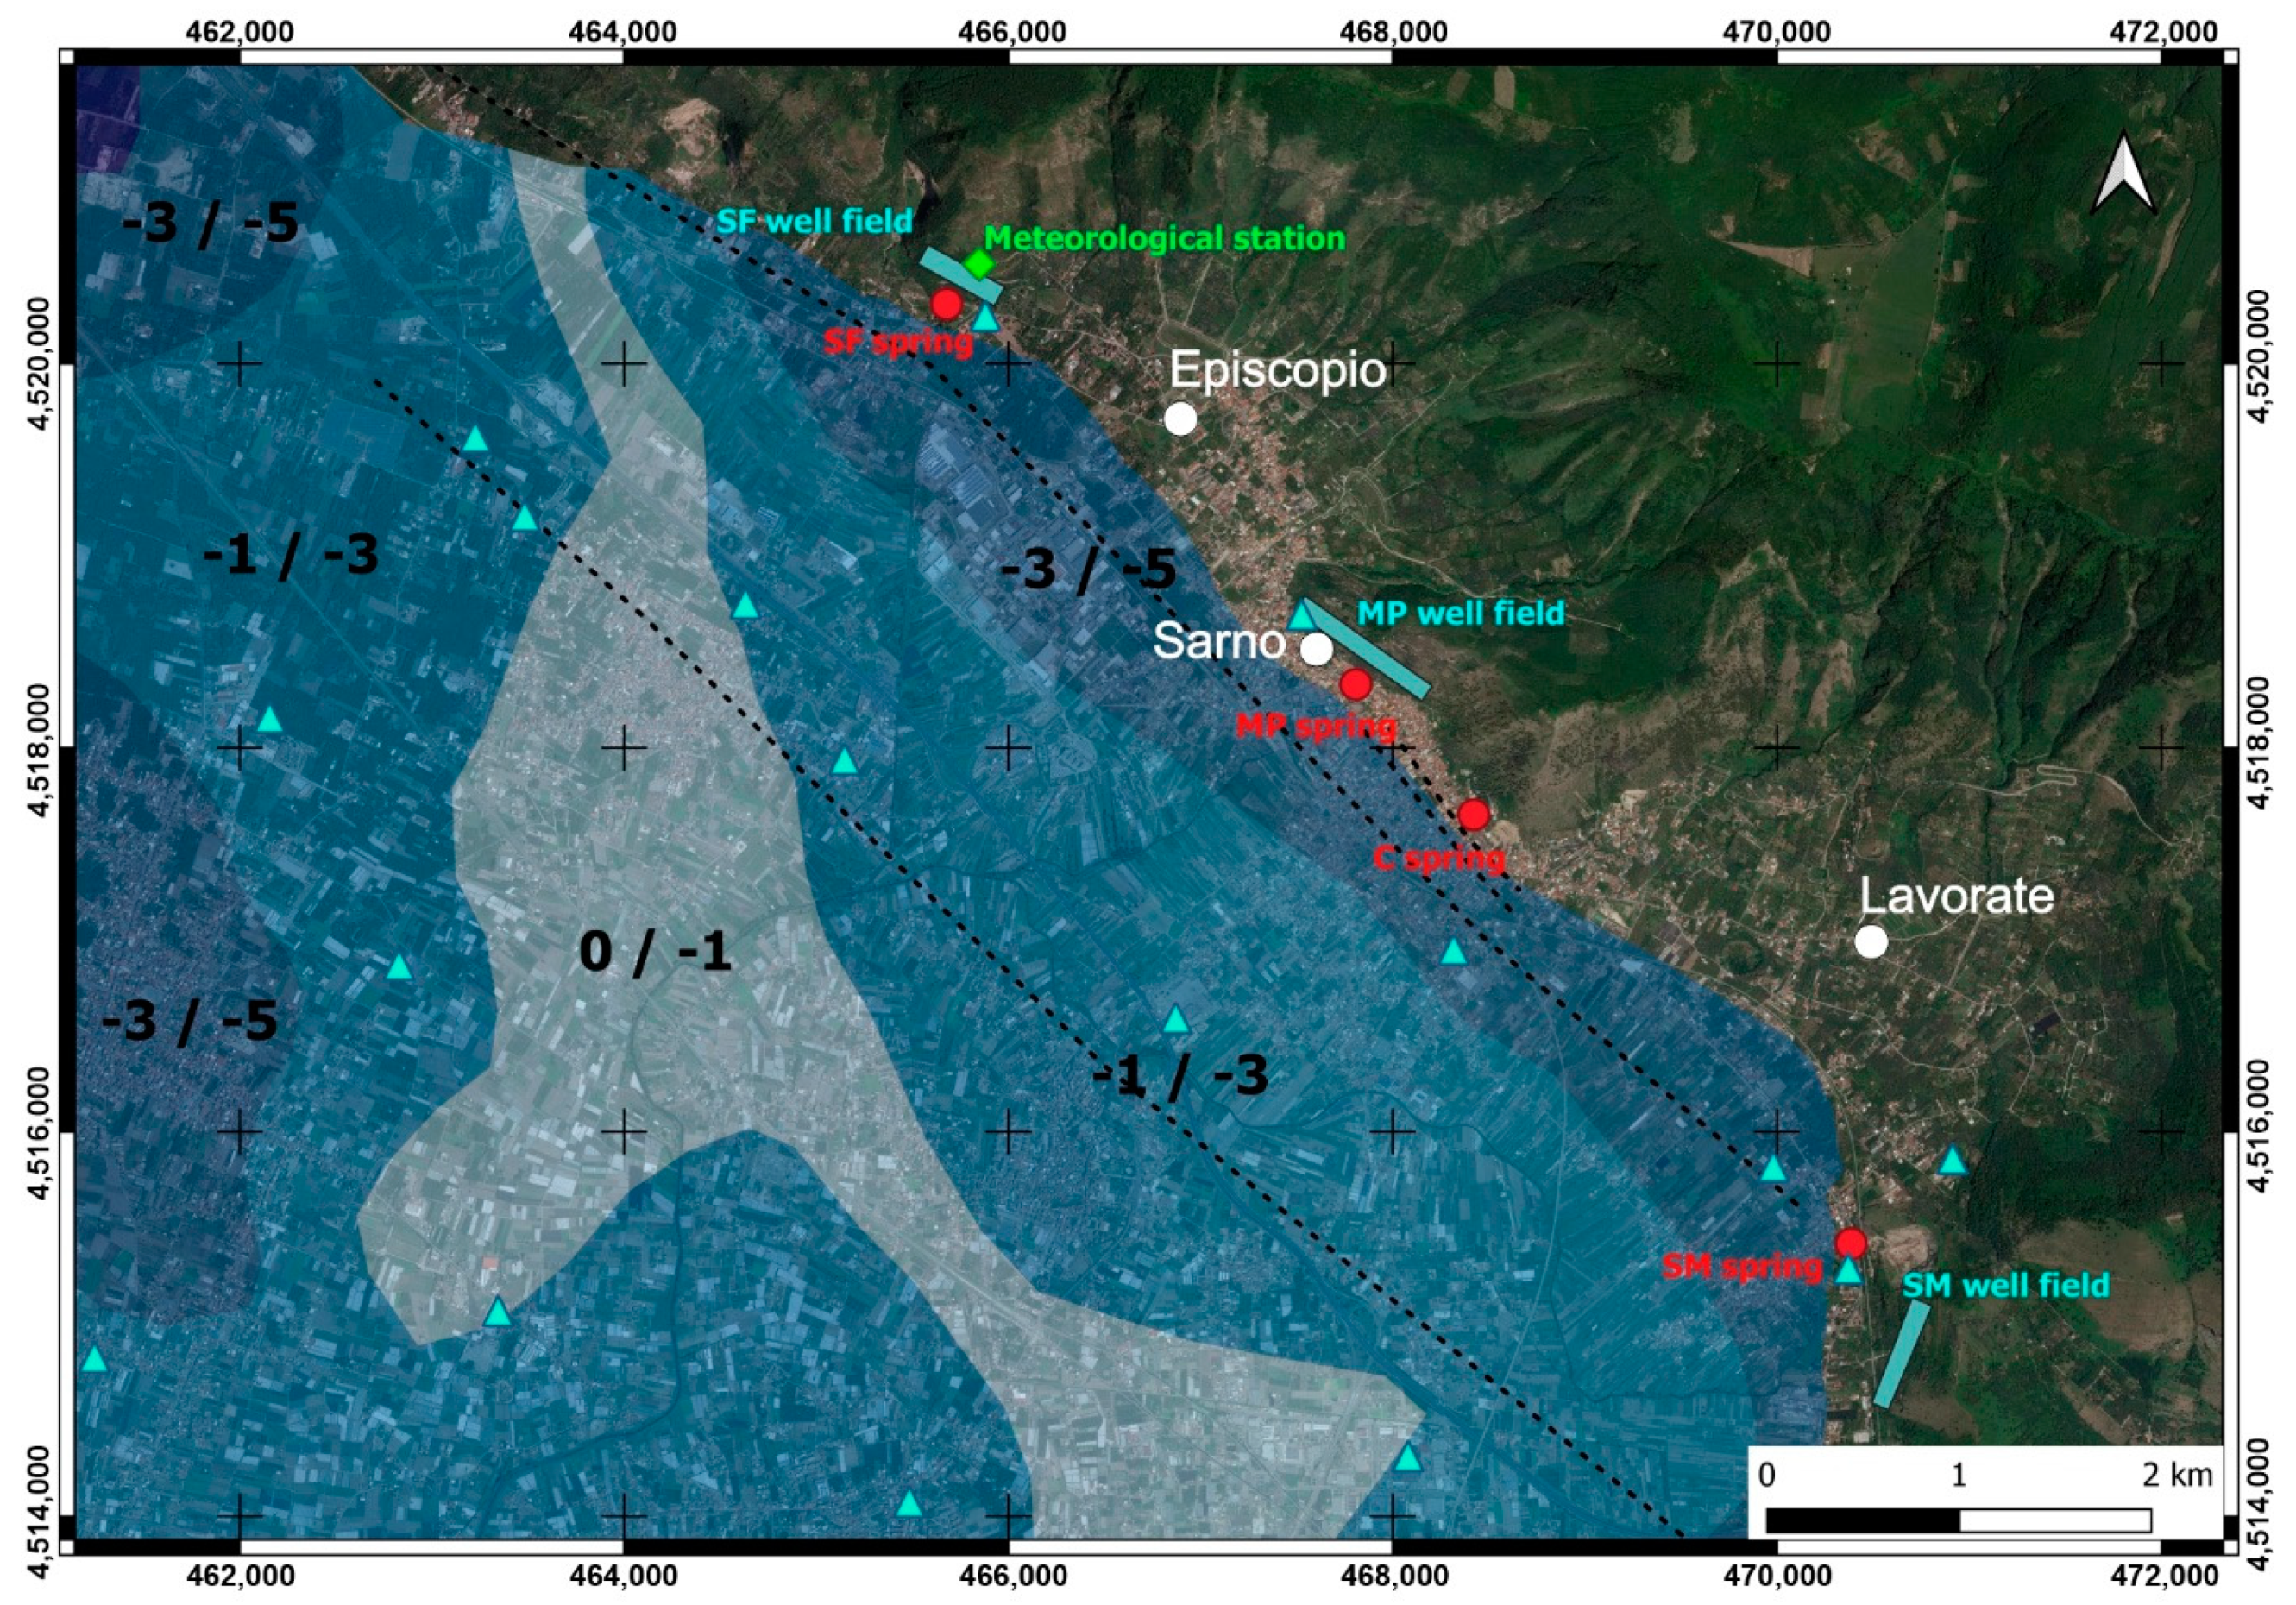
3.4. Hydrogeological Analysis
3.5. Geodetic Analysis
3.5.1. GNSS 2003–2020
3.5.2. DInSAR 1993–2020
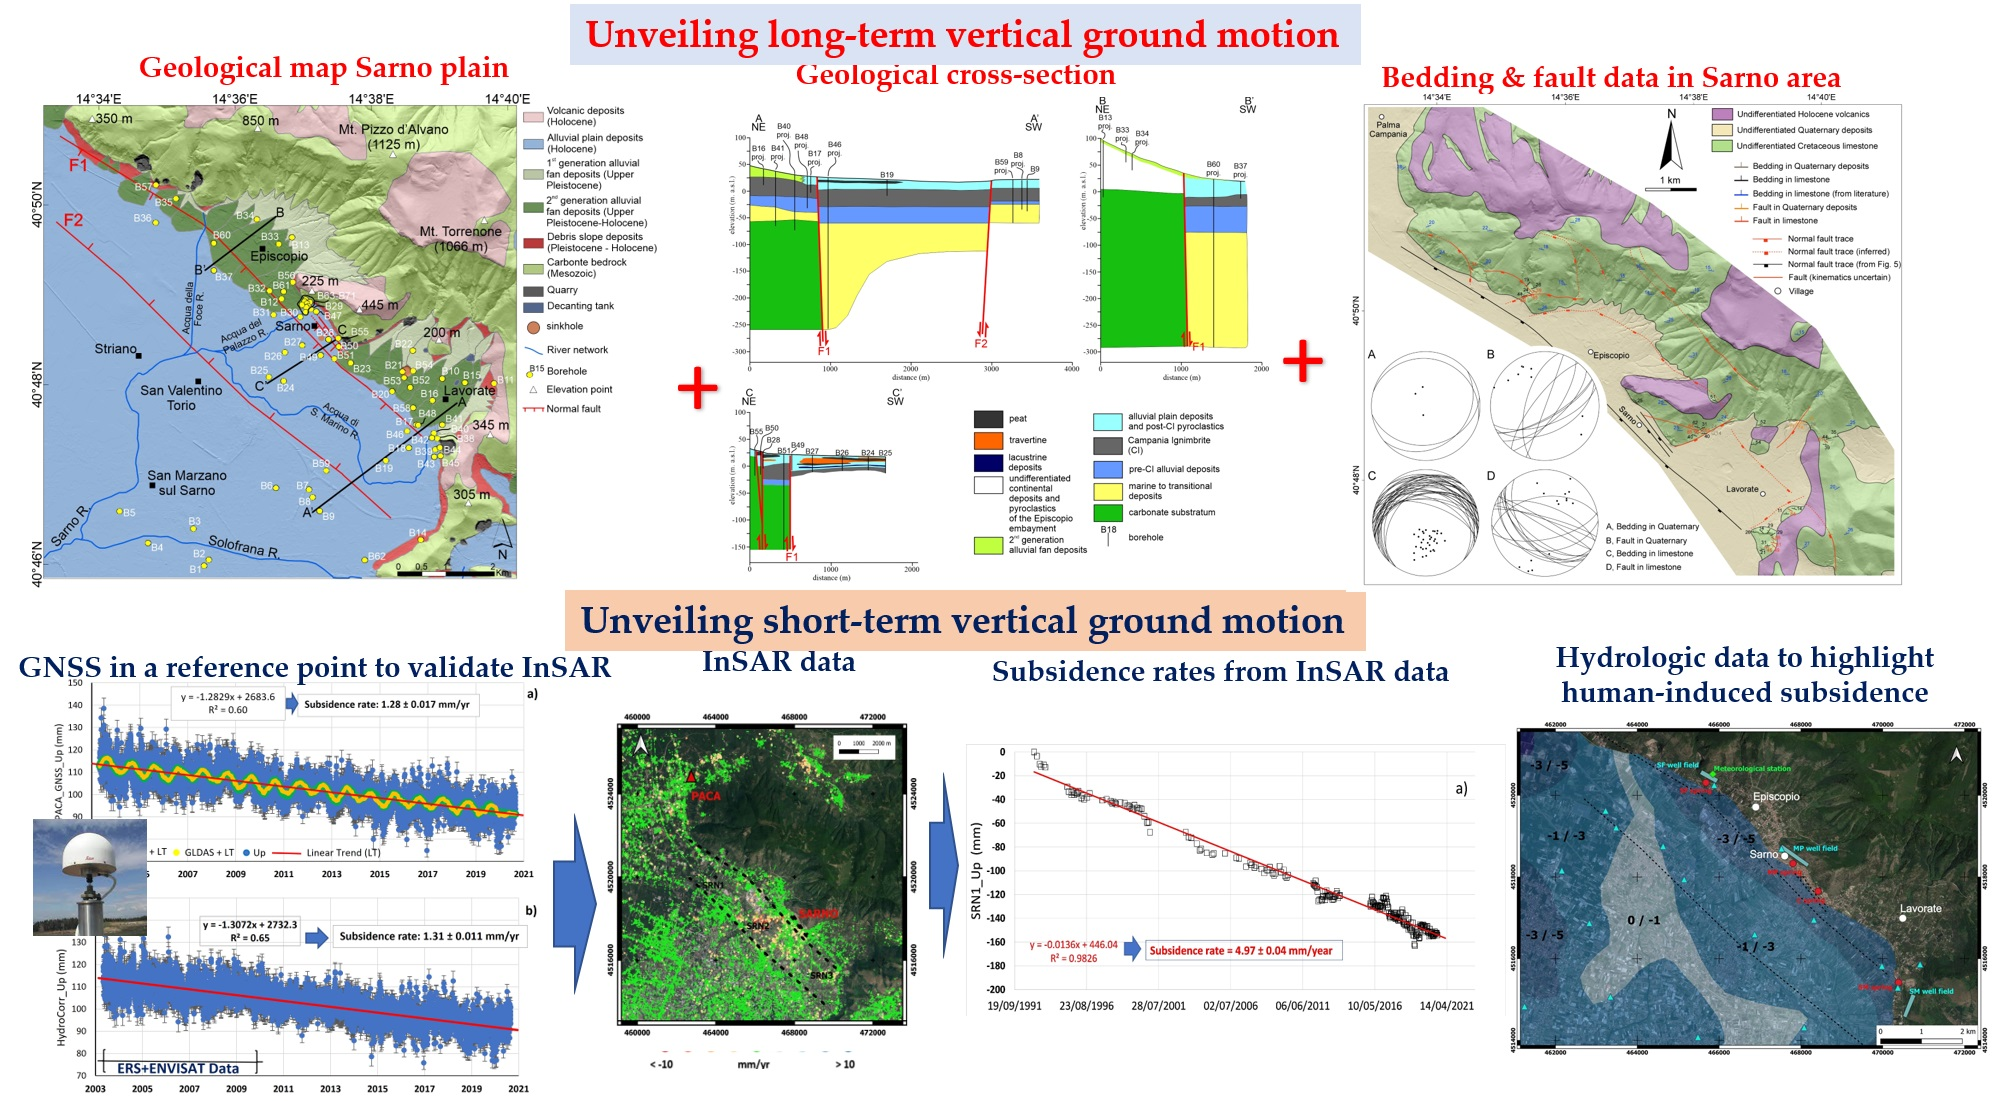
4. Results
4.1. Geomorphological Analysis
4.2. Tectonostratigraphy of the Sarno Plain
4.3. Structural Geology of the Sarno Mountains
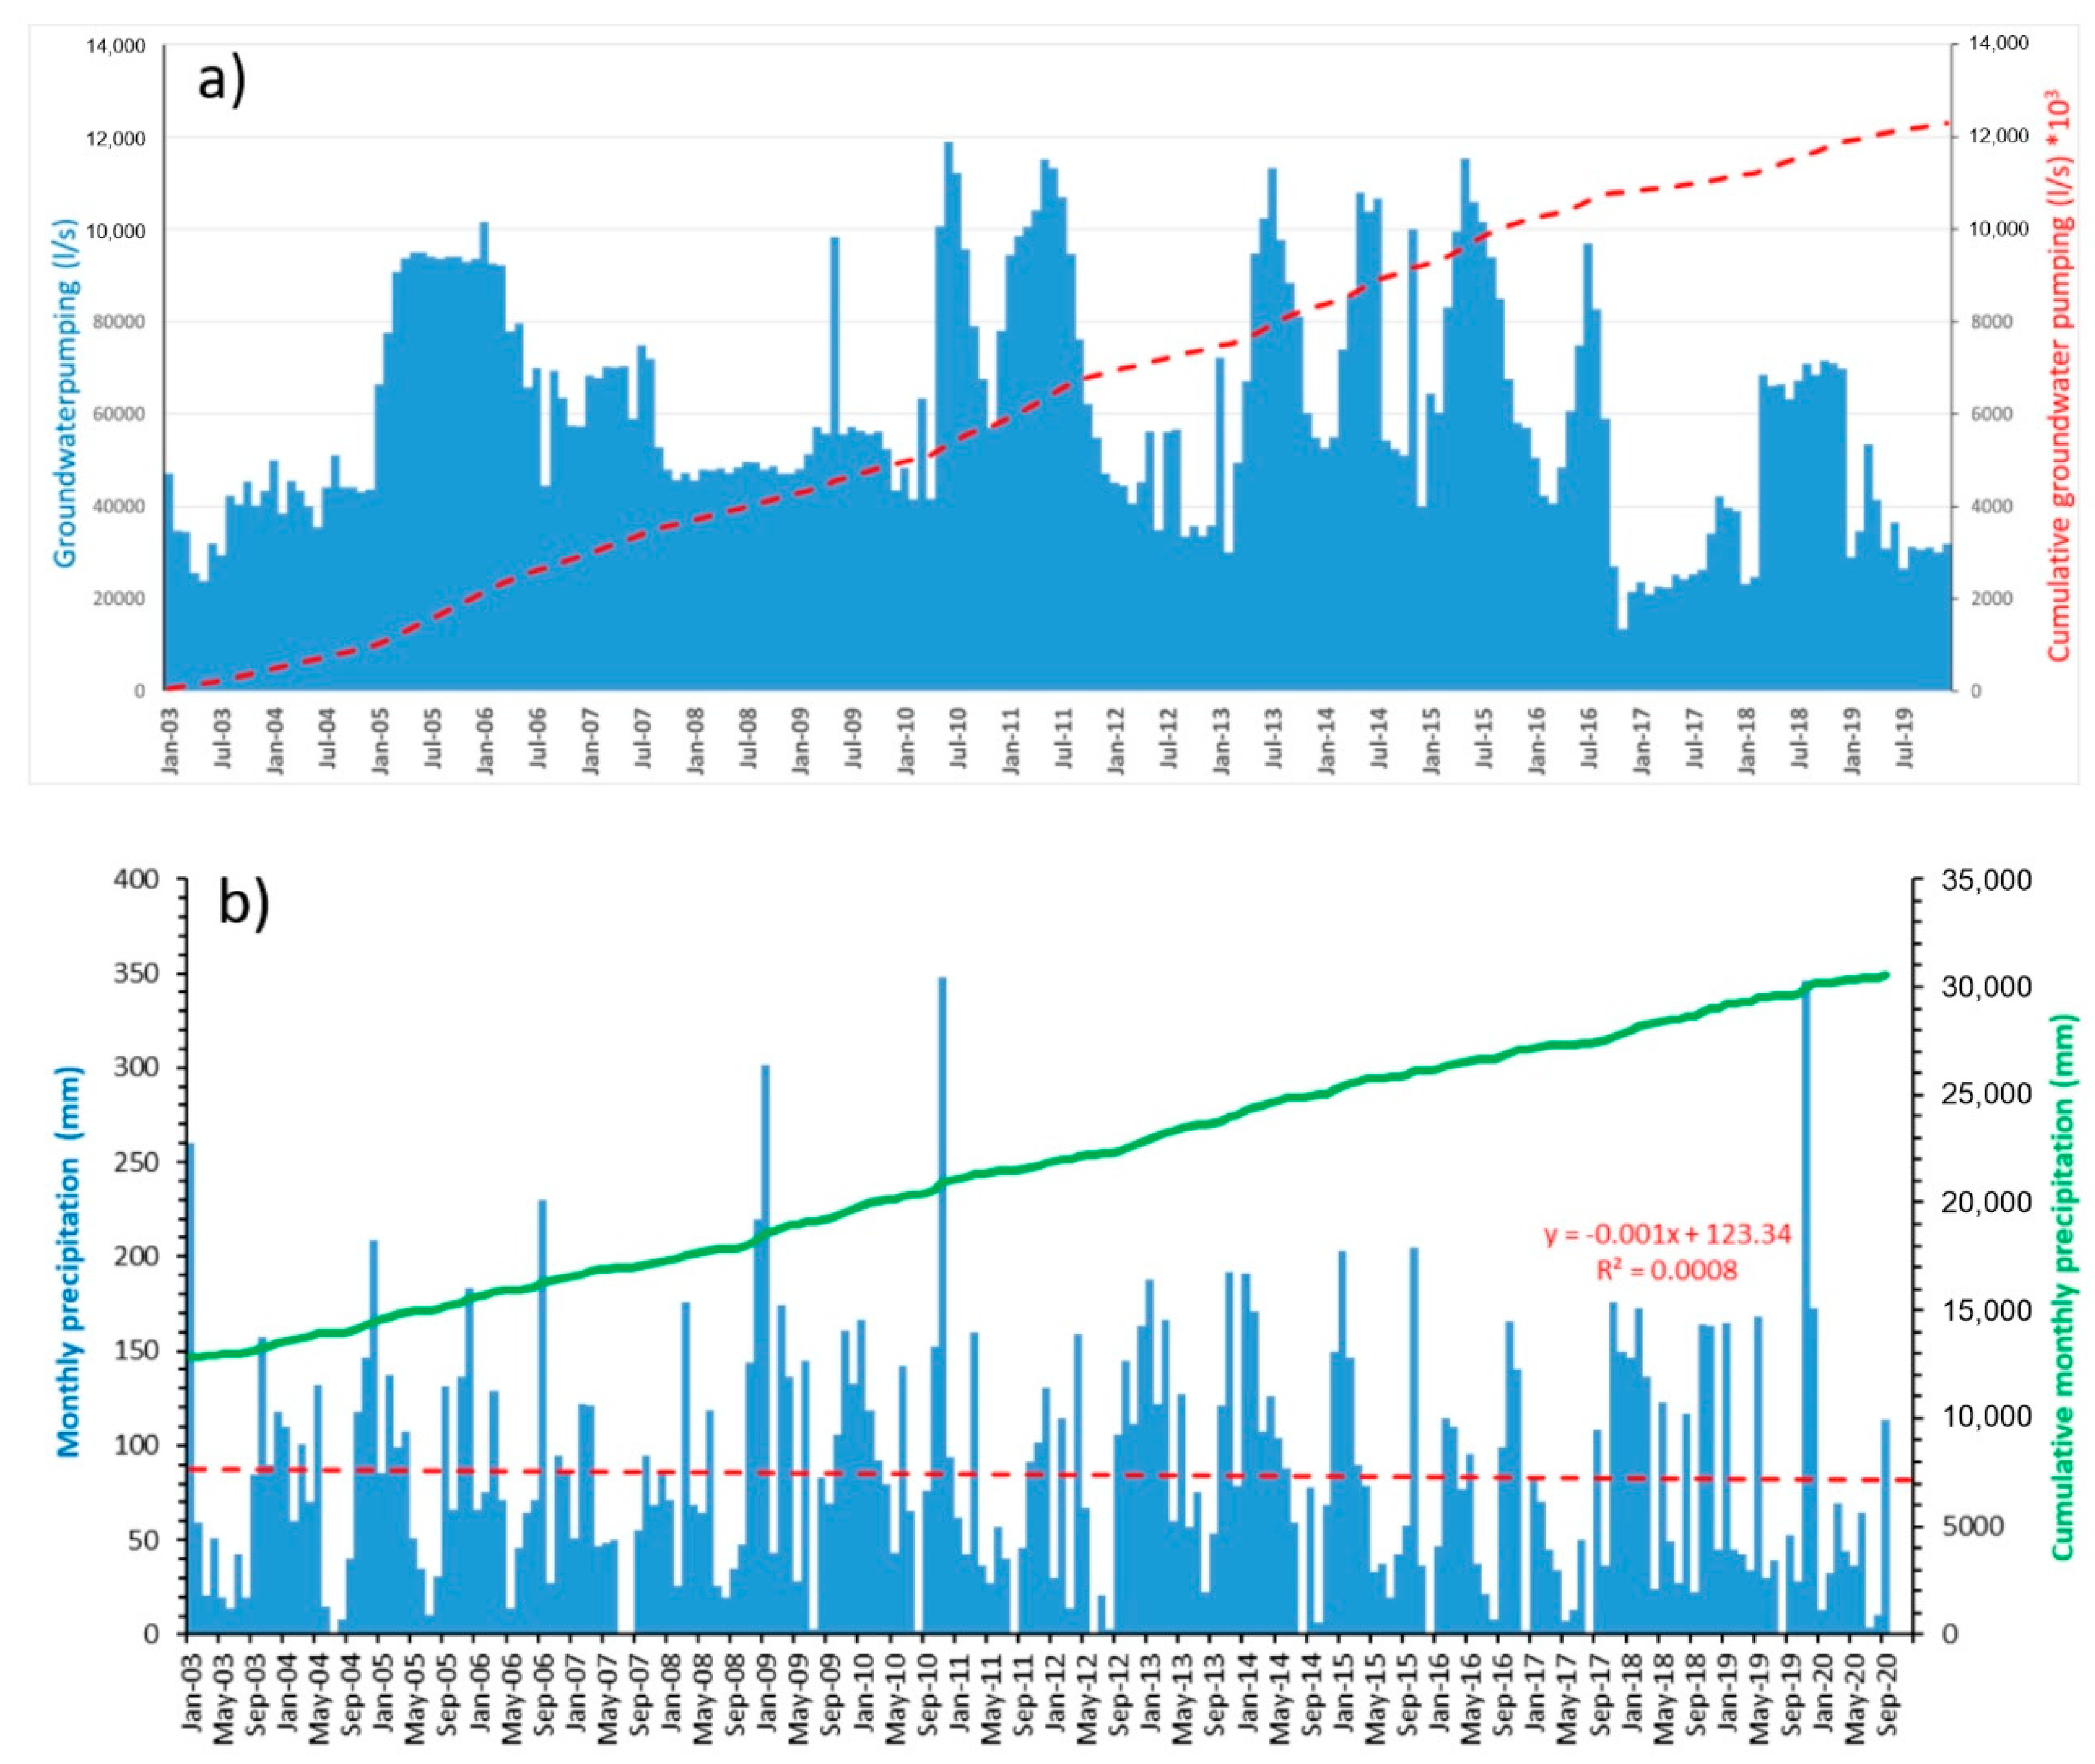
4.4. Hydrogeological Analysis
4.5. Geodetic Data (GNSS and DInSAR) Analysis
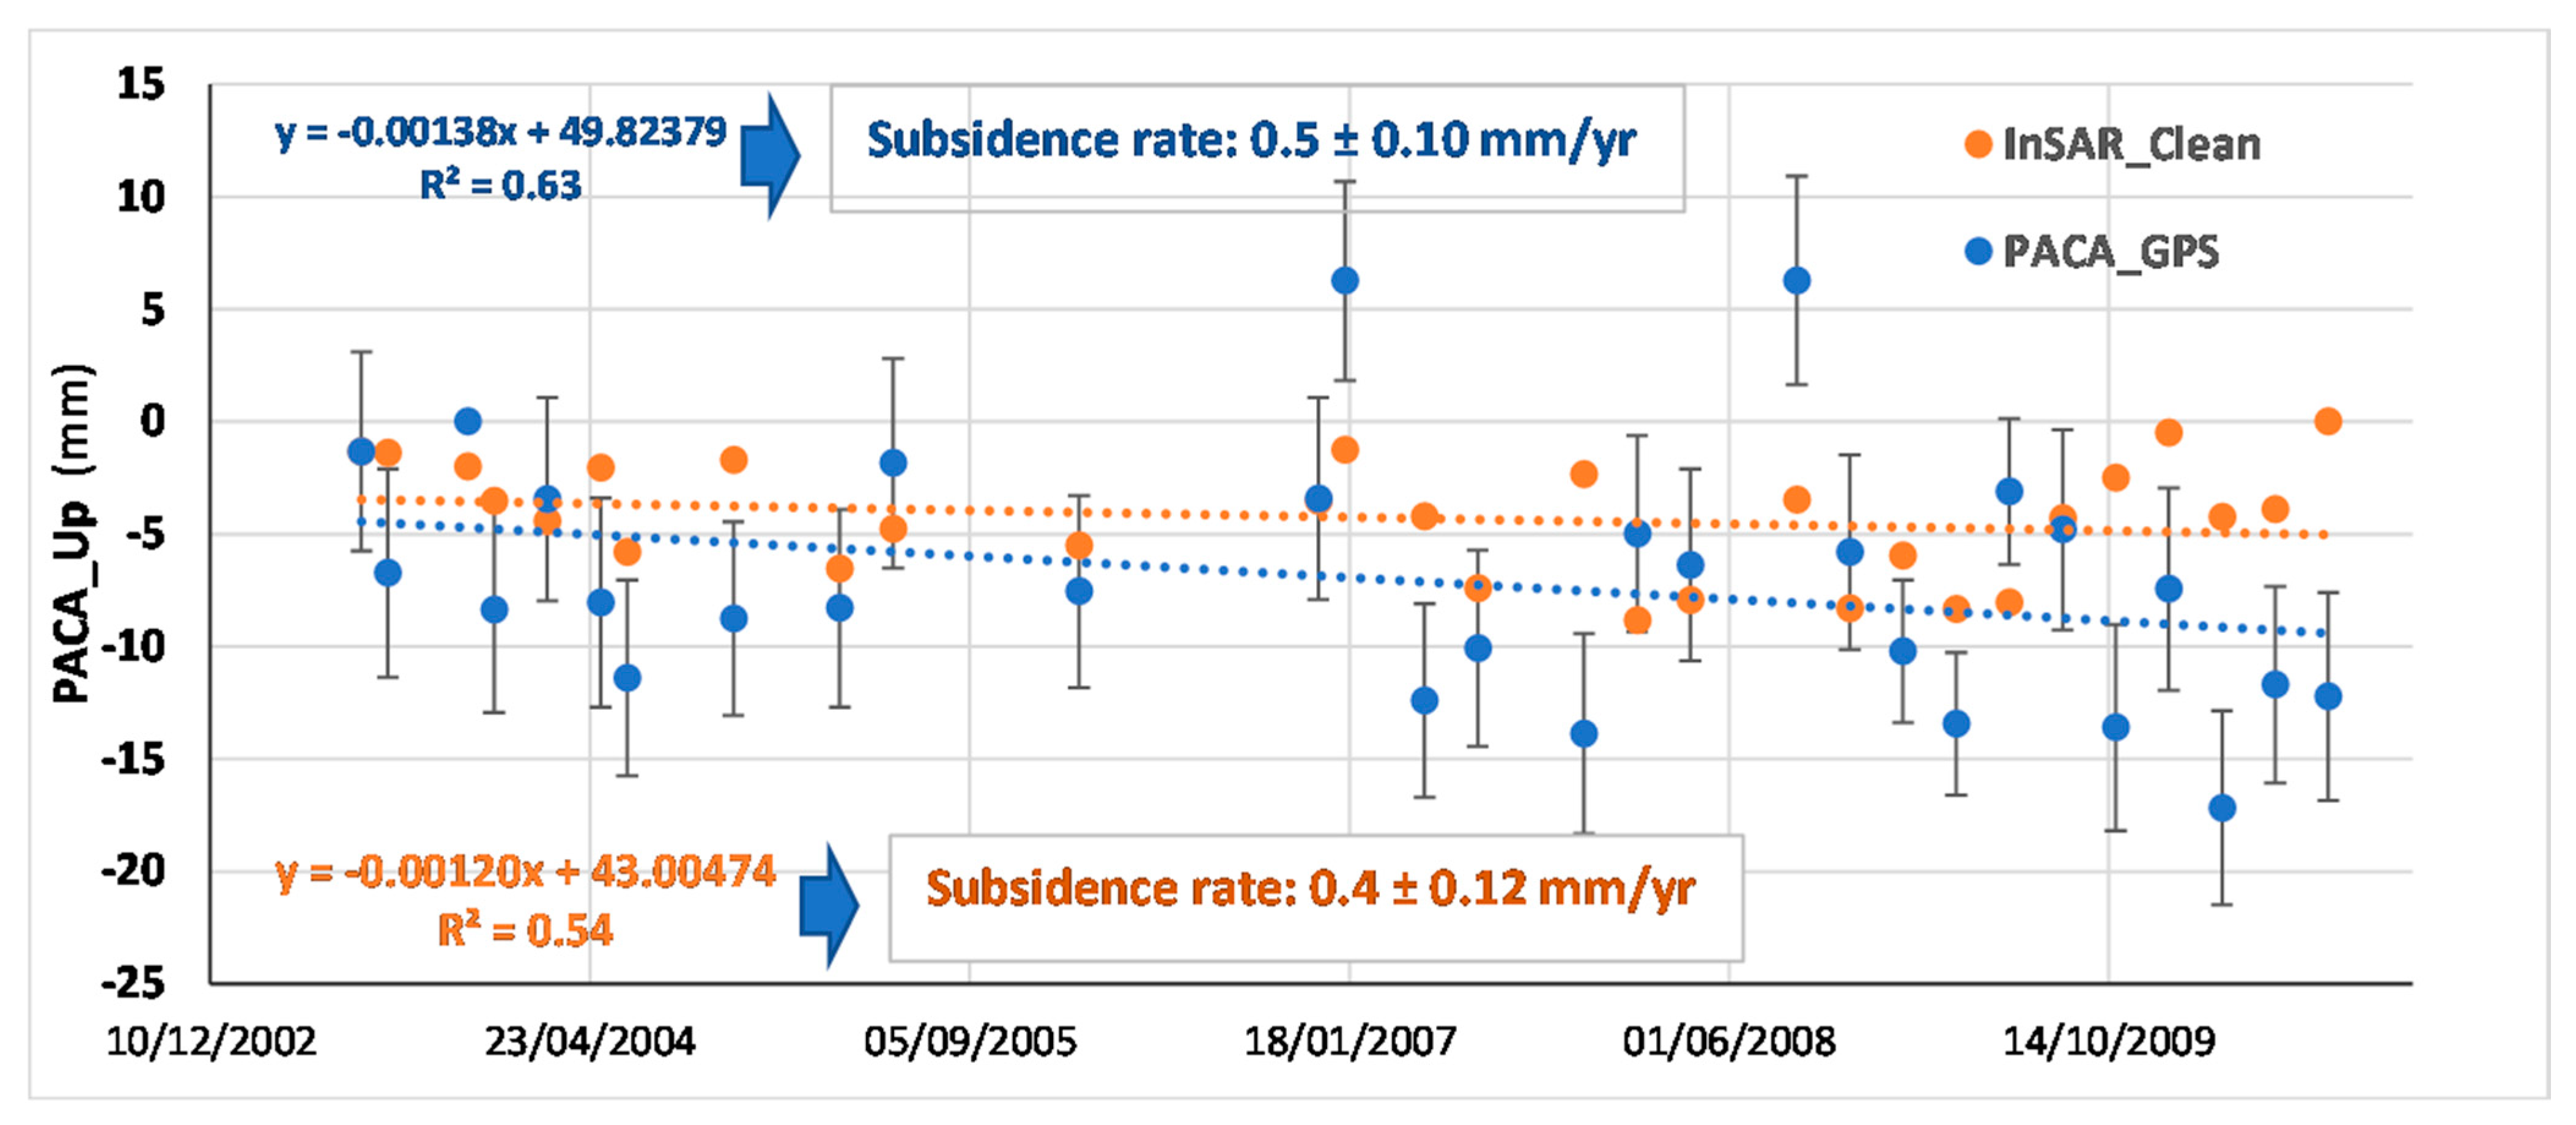
4.5.1. GNSS Analysis for the Period 2003–2020
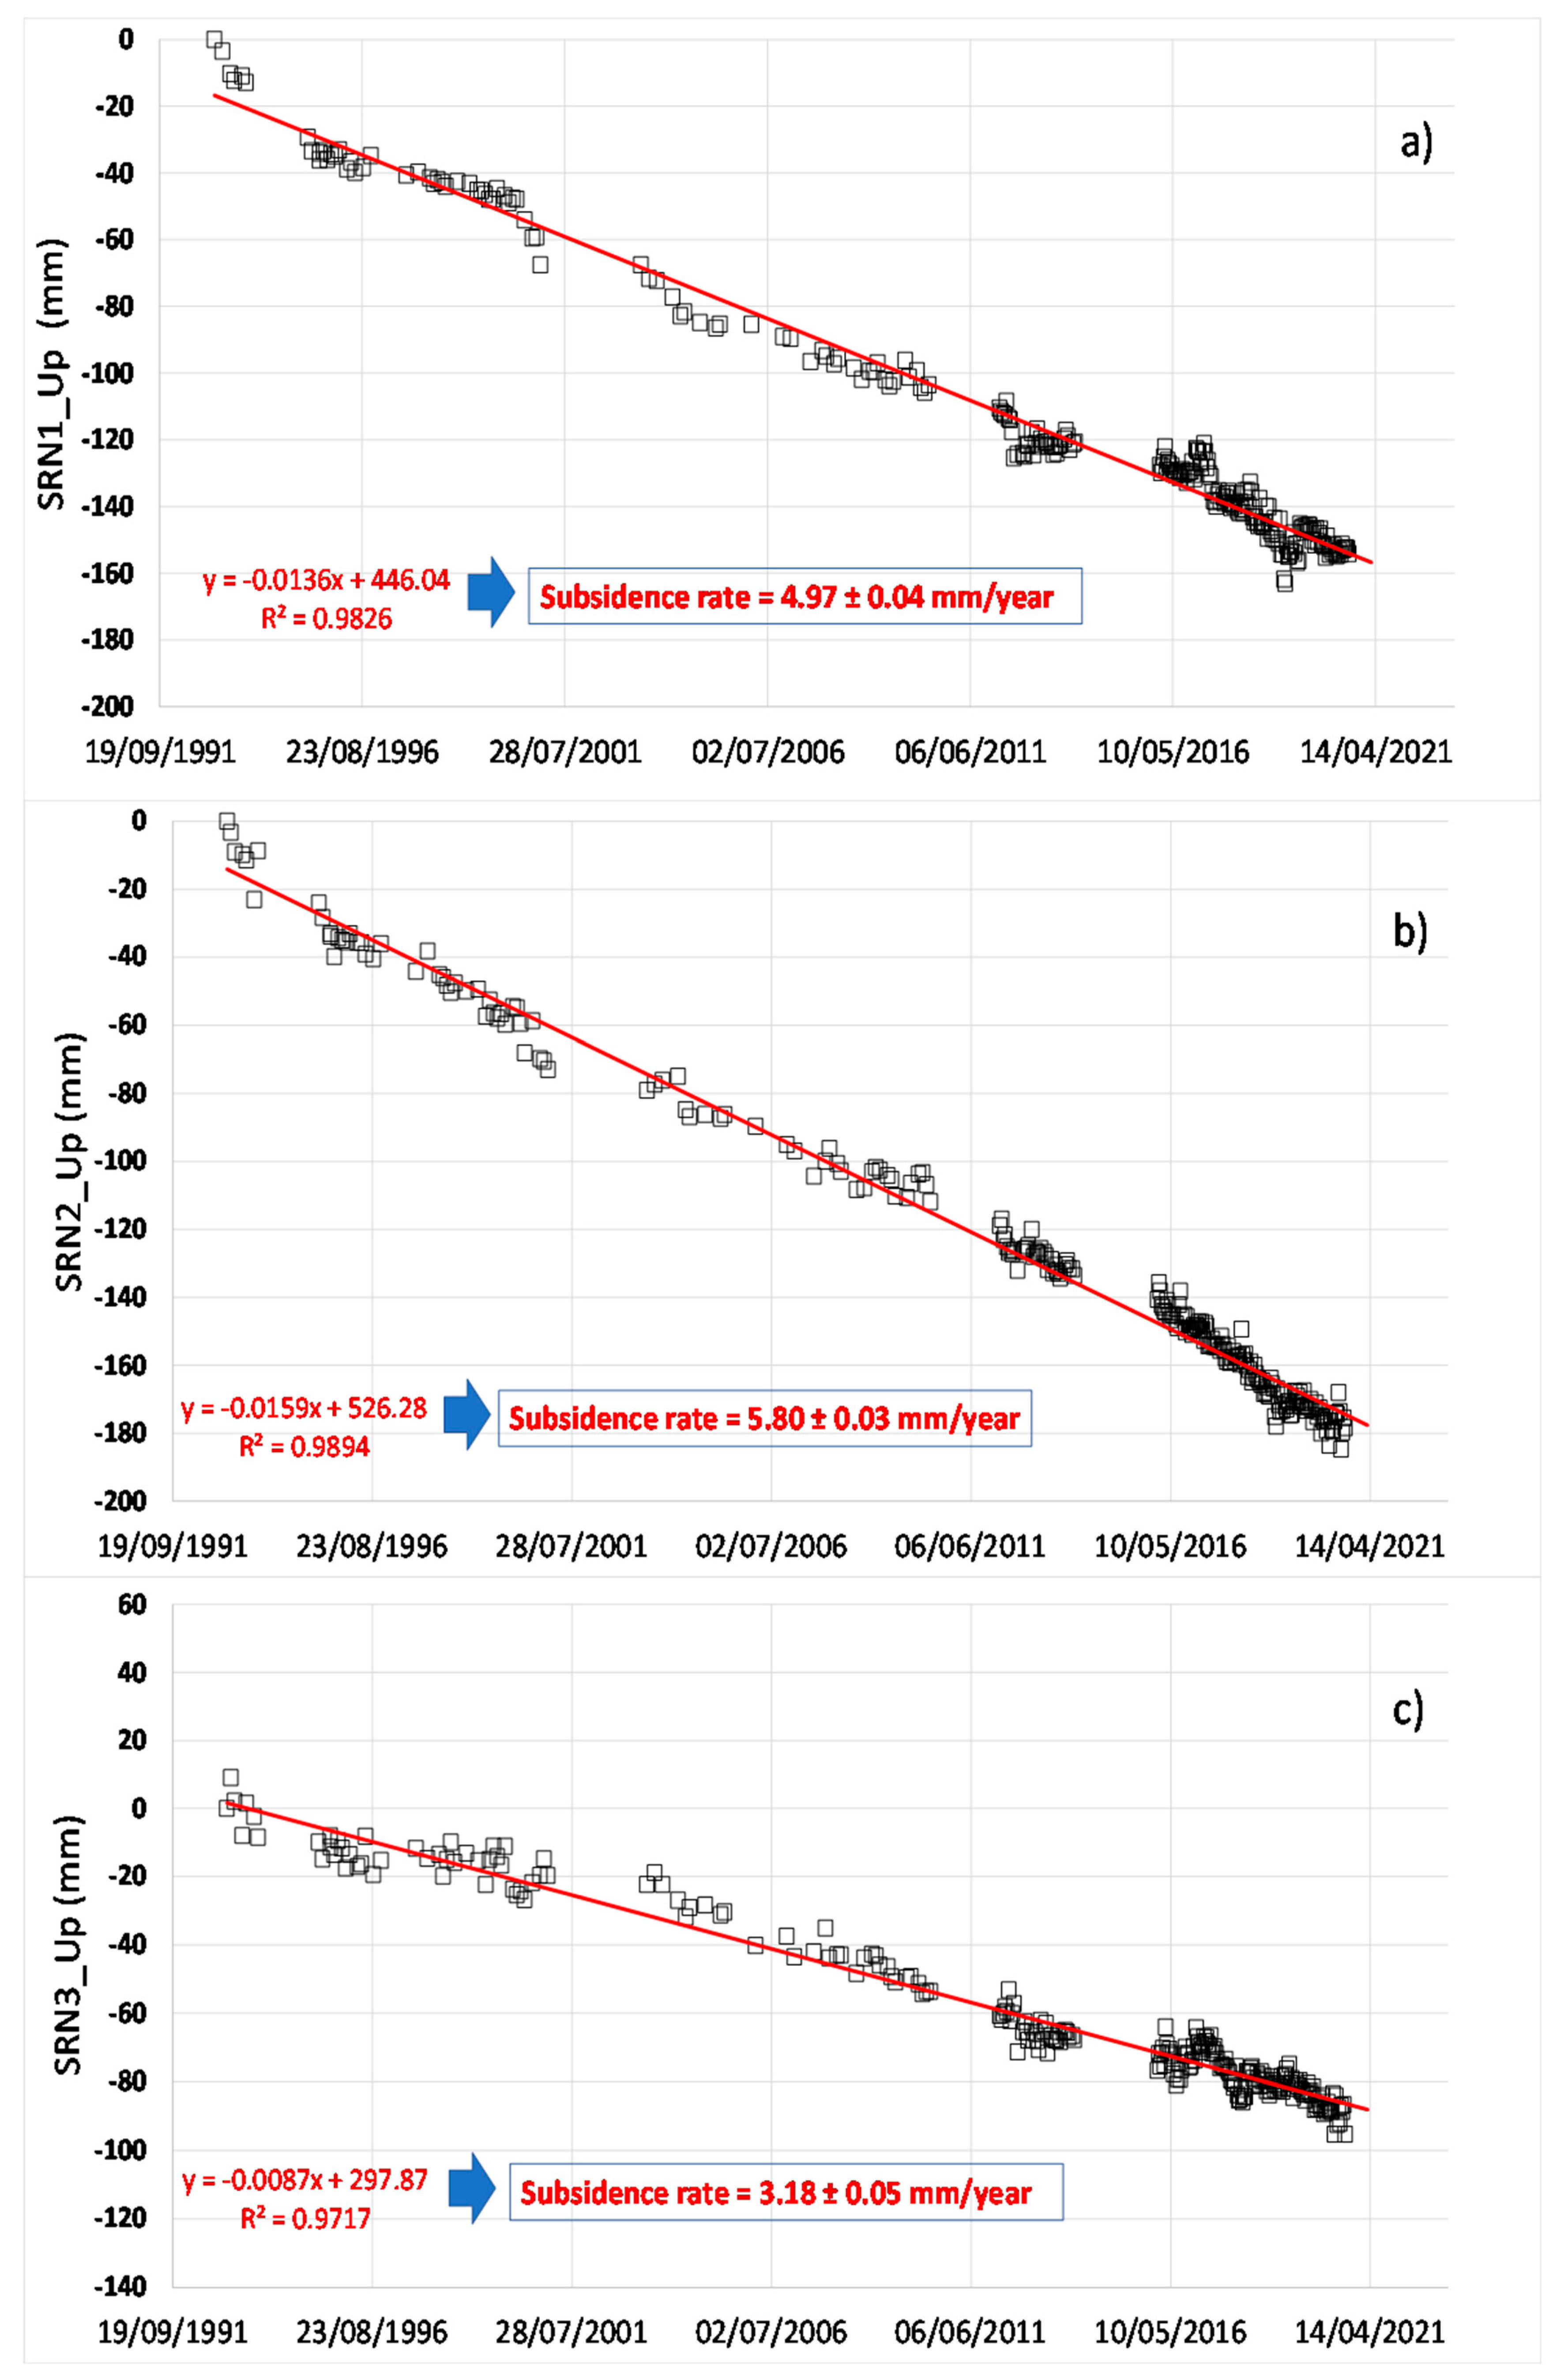
4.5.2. DInSAR Analysis for the Period 1993–2020
4.5.3. Combination of GNSS and DInSAR datasets
5. Discussion
6. Conclusions
Supplementary Materials
Author Contributions
Funding
Acknowledgments
Conflicts of Interest
References
- Matano, F. Analysis and Classification of Natural and Human-Induced Ground Deformations at Regional Scale (Campania, Italy) Detected by Satellite Synthetic-Aperture Radar Interferometry Archive Datasets. Remote Sens. 2019, 11, 2822. [Google Scholar] [CrossRef] [Green Version]
- Motagh, M.; Djamour, Y.; Walter, T.R.; Wetzel, H.U.; Zschau, J.; Arabi, S. Land subsidence in Mashhad Valley, northeast Iran: Results from InSAR, levelling and GPS. Geophys. J. Int. 2007, 168, 518–526. [Google Scholar] [CrossRef]
- Amelung, F.; Galloway, D.L.; Bell, J.W.; Zebker, H.A.; Laczniak, R.J. Sensing the ups and downs of Las Vegas: InSAR reveal structural control on land subsidence and aquifer-system deformation. Geology 1999, 27, 483–486. [Google Scholar] [CrossRef]
- Amato, V.; Aucelli, P.P.C.; Bellucci Sessa, E.; Cesarano, M.; Incontri, P.; Pappone, G.; Valente, E.; Vilardo, G. Multidisciplinary approach for fault detection: Integration of PS-InSAR, geomorphological, stratigraphic and structural data in the Venafro intermontane basin (Central-Southern Apennines, Italy). Geomorphology 2017, 283, 80–101. [Google Scholar] [CrossRef]
- Coda, S.; Tessitore, S.; Di Martire, D.; Calcaterra, D.; De Vita, P.; Allocca, V. Coupled ground uplift and groundwater rebound in the metropolitan city of Naples (Southern Italy). J. Hydrol. 2019, 569, 470–482. [Google Scholar] [CrossRef]
- Wang, Y.; Zhang, B.; Hou, J.; Xub, X. Structure and tectonic geomorphology of the Qujiang fault at the intersection of the Ailao Shan–Red River fault and the Xianshuihe–Xiaojiang fault system, China. Tectonophysics 2014, 634, 156–170. [Google Scholar] [CrossRef]
- Baize, S.; Audin, L.; Winter, T.; Alvarado, A.; Moreno, L.P.; Taipe, M.; Reyes, P.; Kauffmann, P.; Yepes, H. Paleoseismology and tectonic geomorphology of the Pallatanga fault (Central Ecuador), a major structure of the South-American crust. Geomorphology 2015, 237, 14–28. [Google Scholar] [CrossRef]
- Van der Wal, J.L.N.; Nottebaum, V.C.; Stauch, G.; Binnie, S.A.; Batkhishig, O.; Lehmkuhl, F.; Reicherter, K. Geomorphological Evidence of Active Faulting in Low Seismicity Regions—Examples from the Valley of Gobi Lakes, Southern Mongolia. Front. Earth Sci. 2021, 8, 589814. [Google Scholar] [CrossRef]
- Hreinsdóttir, S.; Bennett, R.A. Active aseismic creep on the Alto Tiberina low-angle normal fault, Italy. Geology 2009, 37, 683–686. [Google Scholar] [CrossRef]
- Nocquet, J.-M.; Villegas-Lanza, J.C.; Chlieh, M.; Mothes, P.A.; Rolandone, F.; Jarrin, P.; Cisneros, D.; Alvarado, A.; Audin, L.; Bondoux, F.; et al. Motion of continental slivers and creeping subduction in the northern Andes. Nat. Geosci. 2014, 7, 287–291. [Google Scholar] [CrossRef]
- Kuebler, S.; Streich, R.; Luck, E.; Hoffmann, M.; Friedrich, A.M.; Strecker, M.R. Active faulting in a populated low-strain setting (Lower Rhine Graben, Central Europe) identified by geomorphic, geophysical and geological analysis. In Seismicity, Fault Rupture and Earthquake Hazards in Slowly Deforming Regions; Special Publications 432; Landgraf, A., Kuebler, S., Hintersberger, E., Stein, S., Eds.; Geological Society: London, UK, 2016. [Google Scholar] [CrossRef]
- Grützner, C.; Fischer, P.; Reicherter, K. Holocene surface ruptures of the Rurrand Fault, Germany—insights from palaeoseismology, remote sensing and shallow geophysics. Geophys. J. Int. 2016, 204, 1662–1677. [Google Scholar] [CrossRef]
- Mohadjer, S.; Ehlers, T.A.; Bendick, R.; Mutz, S.G. Review of GPS and Quaternary fault slip rates in the Himalaya-Tibet orogen. Earth Sci. Rev. 2017, 174, 39–52. [Google Scholar] [CrossRef]
- Papanikolaou, I.D.; Roberts, G.P.; Michetti, A.M. Fault scarps and deformation rates in Lazio–Abruzzo, Central Italy: Comparison between geological fault slip-rate and GPS data. Tectoniphysics 2005, 408, 147–176. [Google Scholar] [CrossRef]
- Mazzoli, S.; Nardò, S.; Ascione, A.; Di Donato, V.; Terranova, C.; Vilardo, G. Fault motion reversals predating the Mw 6.3 2009 L’Aquila earthquake: Insights from synthetic aperture radar data. J. Geol. Soc. Lond. 2021, 178, jgs2020-016. [Google Scholar] [CrossRef]
- Ferranti, L.; Oldow, J.S.; D’Argenio, B.; Catalano, R.; Lewis, D.; Marsella, E.; Avellone, G.; Maschio, L.; Pappone, G.; Pepe, F.; et al. Active deformation in Southern Italy, Sicily and southern Sardinia from GPS velocities of the Peri-Tyrrhenian Geodetic Array (PTGA). Ital. J. Geosci. 2008, 127, 299–316. [Google Scholar]
- Machette, M.N. Active, capable and potentially active faults—A paleoseismic perspective. J. Geodyn. 2000, 29, 387–392. [Google Scholar] [CrossRef]
- Italian Civil Protection Department. Linee Guida per la Gestione del Territorio in Aree Interessate da Faglie Attive e Capaci (FAC). Version 1.0. Available online: http://governancerischio.protezionecivile.gov.it/documents/20182/206005/MS+Linee+Guida+Faglie+Attive+e+Capaci/48b6a905-df3b-4212-a618-651c4771d5c9 (accessed on 1 March 2021).
- Santo, A.; Santangelo, N.; De Falco, M.; Forte, G.; Valente, E. Cover collapse sinkhole over a deep buried carbonate bedrock: The case study of Fossa San Vito (Sarno—Southern Italy). Geomorphology 2019, 345, 106838. [Google Scholar] [CrossRef]
- Valente, E.; Ascione, A.; Santangelo, N.; Santo, A. Late quaternary geomorphological evolution and evidence of post-Campania Ignimbrite (40 ka) fault activity in the inner sector of the Sarno plain (Southern Apennines, Italy). Alp. Mediterr. Quat. 2019, 32, 185–197. [Google Scholar] [CrossRef]
- Cascini, L.; Peduto, D.; Reale, D.; Arena, L.; Ferlisi, S.; Verde, S.; Fornaro, G. Detection and monitoring of facilities exposed to subsidence phenomena via past and current generation SAR sensors. J. Geophys. Eng. 2013, 10, 064001. [Google Scholar] [CrossRef]
- Cinque, A.; Patacca, E.; Scandone, P.; Tozzi, M. Quaternary kinematic evolution of the Southern Apennines. Relationships between surface geological features and deep lithospheric structures. Ann. Geophys. 1993, 36, 249–259. [Google Scholar]
- Cello, G.; Mazzoli, S. Apennine tectonics in southern Italy: A review. J. Geodyn. 1999, 27, 191–211. [Google Scholar] [CrossRef]
- Turco, E.; Macchiavelli, C.; Mazzoli, S.; Schettino, A.; Pierantoni, P.P. Kinematic evolution of Alpine Corsica in the framework of Mediterranean mountain belts. Tectonophysics 2012, 579, 193–206. [Google Scholar] [CrossRef]
- Malinverno, A.; Ryan, W.B. Extension in the Tyrrhenian Sea and shortening in the Apennines as result of arc migration driven by sinking of the lithosphere. Tectonics 1986, 5, 227–245. [Google Scholar] [CrossRef]
- Jolivet, L.; Faccenna, C. Mediterranean extension and the Africa-Eurasia collision. Tectonics 2000, 19, 1095–1106. [Google Scholar] [CrossRef]
- Santangelo, N.; Romano, P.; Ascione, A.; Russo Ermolli, E. Quaternary evolution of the Southern Apennines coastal plains: A review. Geol. Carpath. 2017, 68, 43–56. [Google Scholar] [CrossRef] [Green Version]
- Cella, F.; Fedi, M.; Florio, G.; Grimaldi, M.; Rapolla, A. Shallow structure of the Somma-Vesuvius volcano from 3D inversion of gravity data. J. Volcanol. Geoth. Res. 2007, 161, 303–317. [Google Scholar] [CrossRef]
- Brocchini, D.; Principe, C.; Castradori, D.; Laurenzi, M.A.; Gorla, L. Quaternary evolution of the southern sector of the Campania Plain and early Somma-Vesuvius activity: Insights from the Trecase 1 well. Mineral. Petrol. 2001, 73, 67–91. [Google Scholar] [CrossRef]
- Ascione, A.; Ciotoli, G.; Bigi, S.; Buscher, J.; Mazzoli, L.; Ruggiero, L.; Sciarra, A.; Tartarello, M.C.; Valente, E. Assessing mantle versus crustal sources for non-volcanic degassing along fault zones in the actively extending southern Apennines mountain belt (Italy). Geol. Soc. Am. Bull. 2018, 130, 1697–1722. [Google Scholar] [CrossRef]
- Milia, A.; Torrente, M. Tectono-stratigraphic signature of a rapid multistage subsiding rift basin in the Tyrrhenian-Apennine hinge zone (Italy): A possible interaction of upper plate with subducting slab. J. Geodyn. 2015, 86, 42–60. [Google Scholar] [CrossRef]
- Bernasconi, A.; Bruni, P.; Gorla, L.; Principe, C.; Sbrana, A. Preliminary results of deep geothermal exploration in the Somma-Vesuvius volcanic area. Rendiconti Online Della Società Geologica Italiana 1981, 4, 237–240. [Google Scholar]
- Aprile, F.; Toccaceli, R.M. New knowledge about stratigraphy and the distribution of Quaternary ignimbrite deposits in the subsurface of the Sarno Plain (Salerno-Campania, Southern Italy). Il Quaternario 2002, 15, 169–174. [Google Scholar]
- Valente, E.; Buscher, J.T.; Jourdan, F.; Petrosino, P.; Reddy, S.M.; Tavani, S.; Corradetti, A.; Ascione, A. Constraining mountain front tectonic activity in extensional setting from geomorphology and Quaternary stratigraphy: A case study from the Matese ridge, southern Apennines. Quat. Sci. Rev. 2019, 219, 47–67. [Google Scholar] [CrossRef]
- Map of Active and Capable Faults in Italy. Available online: http://sgi2.isprambiente.it/ithacaweb/viewer/ (accessed on 10 March 2021).
- Cinque, A.; Ascione, A.; Caiazzo, C. Distribuzione spazio-temporale e caratterizzazione della fagliazione quaternaria in Appennino meridionale. In Le ricerche del GNDT nel campo della pericolosità sismica; Galadini, F., Ed.; CNR-GNDT: Rome, Italy, 2000; pp. 203–218. [Google Scholar]
- Rovida, A.; Locati, M.; Camassi, R.; Lolli, B.; Gasperini, P. The Italian earthquake catalogue CPTI15. Bull. Earthq. Eng. 2020, 18, 2953–2984. [Google Scholar] [CrossRef]
- Fabbrocino, S.; Lanari, R.; Celico, P.; Termolini, G.; Zeni, G. Groundwater pumping and land subsidence in the Sarno River plain. Memorie Descrittive della Carta Geologica d’Italia 2007, 76, 163–174. [Google Scholar]
- Ducci, D.; De Simone, S.; Sellerino, M. Modello litostratigrafico 3D propedeutico allo sviluppo di un modello di flusso sotterraneo: Caso di studio, la piana del Sarno (Italia). Ital. J. Eng. Geol. Environ. 2012, 1, 41–58. [Google Scholar] [CrossRef]
- De Vita, P.; Allocca, V.; Celico, F.; Fabbrocino, S.; Mattia, C.; Monacelli, G.; Musilli, I.; Piscopo, V.; Scalise, A.R.; Summa, G.; et al. Hydrogeology of continental southern Italy. J. Maps 2018, 14, 230–241. [Google Scholar] [CrossRef] [Green Version]
- Lidar Data of the Metropolitan Area of Naples. Available online: http://sit.cittametropolitana.na.it/lidar.html (accessed on 10 January 2021).
- Webgis of the ISPRA with Borehole in the Italian Territory. Available online: http://sgi2.isprambiente.it/mapviewer/ (accessed on 10 January 2021).
- Civita, M.; de Riso, R.; Vallario, A.; de Masi, R. Idrogeologia del massiccio del Taburno-Camposauro (Campania). Mem. Soc. Geol. Ital. 1971, 10, 65–120. [Google Scholar]
- Guarino, P.M.; Nisio, S. I sinkholes del settore nord-orientale della piana del F. Sarno: Ulteriori dati relativi all’assetto litostratigrafico del sottosuolo. In Atti 2° Workshop Internazionale “I Sinkholes: Gli Sprofondamenti Catastrofici nell’Ambiente Naturale ed in Quello Antropizzato”; ISPRA Servizio Geologico d’Italia: Rome, Italy, 2009; pp. 541–551. [Google Scholar]
- Nicotera, P.; Civita, M. Indagini idrogeologiche per la captazione delle sorgenti S. Maria di Lavorate (Sarno). Mem. E Note Dell’istituto Di Geol. Appl. Dell’università Di Napoli 1969, 11, 1–50. [Google Scholar]
- Sheet 448—Ercolano of the Geological Map of Italy at Scale 1:50,000. Available online: https://www.isprambiente.gov.it/Media/carg/448_ERCOLANO/Foglio.html (accessed on 20 January 2021).
- Celico, P. Idrogeologia dei massicci carbonatici, delle piane quaternarie e delle aree vulcaniche dell’Italia cen-tro-meridionale (Marche e Lazio meridionale, Abruzzo, Molise e Campania). Cassa del Mezzogiorno 1983, 4, 1–203. [Google Scholar]
- Celico, F.; Piscopo, V. Idrodinamica sotterranea e vulnerabilità all’inquinamento delle piane del Sarno e del Solofrana (Campania). Quad. Geol. Appl. 1995, 2, 407–414. [Google Scholar]
- Corniello, A.; Trifuoggi, M.; Ruggier, G.; Sellerino, M. The Sarno River plain (Campania): Piezometric and hydrochemical observations. Rend. Online Soc. Geol. Ital. 2013, 24, 61–63. [Google Scholar]
- Italian Civil Protection. Available online: www.protezionecivile.gov.it (accessed on 20 January 2021).
- Field, E.H.; Arrowsmith, R.J.; Biasi, G.P.; Bird, P.; Dawson, T.E.; Felzer, K.R.; Jackson, D.D.; Johnson, K.M.; Jordan, T.H.; Madden, C.; et al. Uniform California earthquake rupture forecast, version 3 (UCERF3)—The time- independent model. Bull. Seism. Soc. Am. 2014, 104, 1122–1180. [Google Scholar] [CrossRef]
- Dzurisin, D. Volcano Deformation Geodetic Monitoring Techniques, 1st ed.; Springer: Chichester, UK, 2007; pp. 111–151. [Google Scholar]
- Di Paola, G.; Alberico, I.; Aucelli, P.P.C.; Matano, F.; Rizzo, A.; Vilardo, G. Coastal subsidence detected by Synthetic Aperture Radar interferometry and its effects coupled with future sea-level rise: The case of the Sele Plain (Southern Italy). J. Flood Risk Manag. 2018, 11, 191–206. [Google Scholar] [CrossRef] [Green Version]
- Riccardi, U.; Arnoso, J.; Benavent, M.; Velez, E.; Montesinos, F.G. Exploring deformation scenarios in Timanfaya volcanic area (Lanzarote, Canary Islands) from GNSS and ground based geodetic observations. J. Volcanol. Geotherm. Res. 2018, 357, 14–24. [Google Scholar] [CrossRef]
- Pappalardo, G.; Mineo, S.; Angrisani, A.C.; Di Martire, D.; Calcaterra, D. Combining field data with infrared thermography and DInSAR surveys to evaluate the activity of landslides: The case study of Randazzo Landslide (NE Sicily). Landslides 2018, 15, 2173–2193. [Google Scholar] [CrossRef]
- Tessitore, S.; Fernández-Merodo, J.A.; Herrera, G.; Tomás, R.; Ramondini, M.; Sanabria, M.; Duro, J.; Mulas, J.; Calcaterra, D. Comparison of water-level, extensometric, DInSAR and simulation data for quantification of subsidence in Murcia City (SE Spain). Hydrogeol. J. 2016, 24, 727–747. [Google Scholar] [CrossRef]
- Amato, V.; Aucelli, P.P.C.; Corrado, G.; Di Paola, G.; Matano, F.; Pappone, G.; Schiattarella, M. Comparing geological and Persistent Scatterer Interferometry data of the Sele River coastal plain, southern Italy: Implications for recent subsidence trends. Geomorphology 2020, 351, 106953. [Google Scholar] [CrossRef]
- Vitagliano, E.; Riccardi, U.; Piegari, E.; Boy, J.-P.; Di Maio, R. Multi-Component and Multi-Source Approach for Studying Land Subsidence in Deltas. Remote Sens. 2020, 12, 1465. [Google Scholar] [CrossRef]
- Bock, Y.; Melgar, D. Physical applications of GPS geodesy: A review. Rep. Progr. Phys. 2016, 79, 106801. [Google Scholar] [CrossRef]
- Gens, R.; Van Genderen, J.L. Review article SAR interferometry—Issues, techniques, applications. Int. J. Remote Sens. 1996, 17, 1803–1835. [Google Scholar] [CrossRef]
- Blewitt, G.; Hammond, W.C.; Kreemer, C. Harnessing the GPS Data Explosion for Interdisciplinary Science. Eos 2018, 99, 485. [Google Scholar] [CrossRef]
- Luzum, B.; Petit, G. The IERS Conventions (2010): Reference systems and new models. Proc. Int. Astron. Union 2012, 10, 227–228. [Google Scholar] [CrossRef] [Green Version]
- Lyard, F.; Lefevre, F.; Letellier, T.; Francis, O. Modelling the global ocean tides: Modern insights from FES2004. Ocean. Dyn. 2006, 56, 394–415. [Google Scholar] [CrossRef]
- Altamimi, Z.; Rebischung, P.; Métivier, L.; Collilieux, X. ITRF2014: A new release of the International Terrestrial Reference Frame modeling nonlinear station motions. J. Geophys. Res. Solid Earth 2016, 121, 6109–6613. [Google Scholar] [CrossRef] [Green Version]
- Costantini, M.; Ferretti, A.; Minati, F.; Falco, S.; Trillo, F.; Colombo, D.; Novali, F.; Malvarosa, F.; Mammone, F.; Vecchioli, F.; et al. Analysis of surface deformations over the whole Italian territory by interferometric processing of ERS, Envisat and COSMO-SkyMed radar data. Remote Sens. Environ. 2017, 202, 250–275. [Google Scholar] [CrossRef]
- Di Martire, D.; Paci, M.; Confuorto, P.; Costabile, S.; Guastaferro, F.; Verta, A.; Calcaterra, D. A nation-wide system for landslide mapping and risk management in Italy: The second Not-ordinary Plan of Environmental Remote Sensing. Int. J. Appl. Earth Obs. 2017, 63, 143–157. [Google Scholar] [CrossRef]
- Mora, O.; Mallorqui, J.J.; Broquetas, A. Linear and nonlinear terrain deformation maps from a reduced set of interferometric SAR images. IEEE Trans. Geosci. Remote Sens. 2003, 41, 2243–2253. [Google Scholar] [CrossRef]
- Iglesias, R.; Mallorqui, J.J.; Monells, D.; López-Martínez, C.; Fabregas, X.; Aguasca, A.; Gili, J.A.; Corominas, J. PSI deformation map retrieval by means of temporal sublook coherence on reduced sets of SAR images. Remote Sens. 2015, 7, 530–563. [Google Scholar] [CrossRef] [Green Version]
- Tosi, L.; Da Lio, C.; Strozzi, T.; Teatini, P. Combining L- and X-Band SAR interferometry to assess ground displacements in heterogeneous coastal environments: The Po River Delta and Venice Lagoon, Italy. Remote Sens. 2016, 8, 308. [Google Scholar] [CrossRef] [Green Version]
- Camanni, G.; Roche, V.; Childs, C.; Manzocchi, T.; Walsh, J.; Conneally, J.; Saqab, M.M.; Delogkos, E. The three-dimensional geometry of relay zones within segmented normal faults. J. Struct. Geol. 2019, 129, 103895. [Google Scholar] [CrossRef]
- Caiazzo, C.; Ascione, A.; Cinque, C. Late Tertiary–Quaternary tectonics of the Southern Apennines (Italy): New evidences from the Tyrrhenian slope. Tectonophysics 2006, 421, 23–51. [Google Scholar] [CrossRef]
- Cascini, L.; Di Maio, C. Emungimento delle acque sotterranee e cedimenti nell’abitato di Sarno: Analisi preliminare. Rivista Italiana di Geotecnica 1994, 3, 217–231. [Google Scholar]
- Williams, S.D.P. The effect of coloured noise on the uncertainties of rates estimated from geodetic time series. J. Geod. 2003, 76, 483–494. [Google Scholar] [CrossRef]
- Mémin, A.; Boy, J.-P.; Santamaria-Gomez, A. Correcting GPS measurements for non-tidal loading. GPS Solut. 2020, 24, 45. [Google Scholar] [CrossRef]
- Gelaro, R.; McCarty, W.; Suárez, M.J.; Todling, R.; Molod, A.; Takacs, L.; Randles, C.A.; Darmenov, A.; Bosilovich, M.G.; Reichle, R.; et al. The Modern-Era Retrospective Analysis for Research and Applications, Version 2 (MERRA-2). J. Clim. 2017, 30, 5419–5454. [Google Scholar] [CrossRef] [PubMed]
- Rodell, M.; Houser, P.R.; Jambor, U.; Gottschalck, J.; Mitchell, K.; Meng, C.J.; Arsenault, K.; Cosgrove, B.; Radakovich, J.; Bosilovich, M.; et al. The Global Land Data Assimilation System. Bull. Am. Meteorolog. Soc. 2004, 85, 381–394. [Google Scholar] [CrossRef] [Green Version]
- EOST Loading Service. Available online: http://loading.u-strasbg.fr/ (accessed on 30 September 2020).
- Cascini, L.; Fornaro, G.; Peduto, D. Advanced low-and full-resolution DInSAR map generation for slow-moving landslide analysis at different scales. Eng. Geol. 2010, 112, 29–42. [Google Scholar] [CrossRef]
- Di Martire, D.; Novellino, A.; Tessitore, S.; Ramondini, M.; Calcaterra, D. Application of DInSAR techniques to engineering geology studies in southern Italy. Rend. Online Soc. Geol. Ital. 2013, 24, 95–97. [Google Scholar]
- Giaccio, B.; Hajdas, I.; Isaia, R.; Deino, A.; Nomade, S. High-precision 14C and 40Ar/39Ar dating of the Campanian Ignimbrite (Y-5) reconciles the time-scales of climatic-cultural processes at 40 ka. Sci. Rep. 2017, 7, 45940. [Google Scholar] [CrossRef] [PubMed] [Green Version]
- Delokgos, E.; Manzocchi, T.; Childs, C.; Camanni, G.; Roche, V. The 3D structure of a normal fault from multiple outcrop observations. J. Struct. Geol. 2020, 136, 104009. [Google Scholar] [CrossRef]
- Ferranti, L.; Palano, M.; Cannavò, F.; Mazzella, M.E.; Oldow, J.; Gueguen, E.; Mattia, M.; Monaco, C. Rates of geodetic deformation across active faults in southern Italy. Tectonophysics 2014, 621, 101–122. [Google Scholar] [CrossRef]
- Cascini, L.; Ferlisi, S.; Fornaro, G.; Lanari, R.; Peduto, D.; Zeni, G. Subsidence monitoring in Sarno urban area via multitemporal DInSAR technique. Int. J. Remote Sens. 2006, 27, 1709–1716. [Google Scholar] [CrossRef]
- Database of Individual Seismogenic Sources. Available online: http://diss.rm.ingv.it/dissmap/dissmap.phtml (accessed on 10 March 2021).


| Data Type | Aquifer Type | Total Number | Density (No./km2) | Use Type | Monitoring Period | Depth Range (m) | Screen Type | Reference |
|---|---|---|---|---|---|---|---|---|
| Private wells | Alluvial plain | \ | \ | Agricultural | September 1978 | 10–50 | Open at bottom | [47] |
| Private wells | Alluvial plain | 19 | 0.47 | Agricultural | March 1992 | 10–50 | Open at bottom | [48] |
| Private wells | Alluvial plain | 17 | 0.42 | Agricultural | March 2003 | 10–50 | Open at bottom | [38] |
| Piezometers | Alluvial plain | 6 | \ | Monitoring network | 2015–2017 | 35–70 | Open at bottom | [19] |
| Public well fields | Karst aquifer | 11 + 16 + 633 | \ | Drinking | 1992–2020 | 100–120 | Open at bottom | GORI SpA (unpublished data) |
| Meteorological station | \ | 1 | \ | \ | 1992–2020 | \ | \ | [50] |
| Geometry of Acquisition | Period | No. of Images | |
|---|---|---|---|
| GNSS | 3D topocentric (north, east, up) | 01 May 2003 29 August 2020 | n/a |
| ERS1/2 | Ascending/descending | 10 January 1993 13 December 2000 | 66/72 |
| ENVISAT | Ascending/descending | 13 December 2002 14 July 2010 | 65/40 |
| Cosmo-SkyMed | Descending | 20 February2012 23 December 2013 | 35 |
| SENTINEL-1 | Descending | 13 January 2016 31 August 2020 | 138 |
Publisher’s Note: MDPI stays neutral with regard to jurisdictional claims in published maps and institutional affiliations. |
© 2021 by the authors. Licensee MDPI, Basel, Switzerland. This article is an open access article distributed under the terms and conditions of the Creative Commons Attribution (CC BY) license (https://creativecommons.org/licenses/by/4.0/).
Share and Cite
Valente, E.; Allocca, V.; Riccardi, U.; Camanni, G.; Di Martire, D. Studying a Subsiding Urbanized Area from a Multidisciplinary Perspective: The Inner Sector of the Sarno Plain (Southern Apennines, Italy). Remote Sens. 2021, 13, 3323. https://0-doi-org.brum.beds.ac.uk/10.3390/rs13163323
Valente E, Allocca V, Riccardi U, Camanni G, Di Martire D. Studying a Subsiding Urbanized Area from a Multidisciplinary Perspective: The Inner Sector of the Sarno Plain (Southern Apennines, Italy). Remote Sensing. 2021; 13(16):3323. https://0-doi-org.brum.beds.ac.uk/10.3390/rs13163323
Chicago/Turabian StyleValente, Ettore, Vincenzo Allocca, Umberto Riccardi, Giovanni Camanni, and Diego Di Martire. 2021. "Studying a Subsiding Urbanized Area from a Multidisciplinary Perspective: The Inner Sector of the Sarno Plain (Southern Apennines, Italy)" Remote Sensing 13, no. 16: 3323. https://0-doi-org.brum.beds.ac.uk/10.3390/rs13163323