
3DRIED: A High-Resolution 3-D Millimeter-Wave Radar Dataset Dedicated to Imaging and Evaluation

 , , , , and
Abstract
:
1. Introduction
- 1.
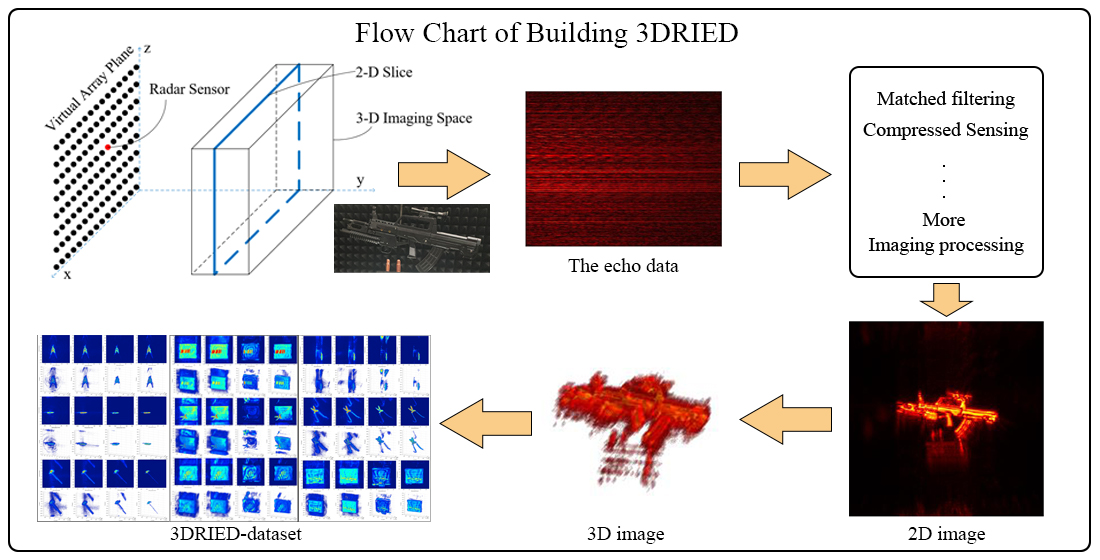
- Sharing the same principle with SAR, an experimental system with MMW radar is constructed, which works in the mono-static scanning mode.
- 2.
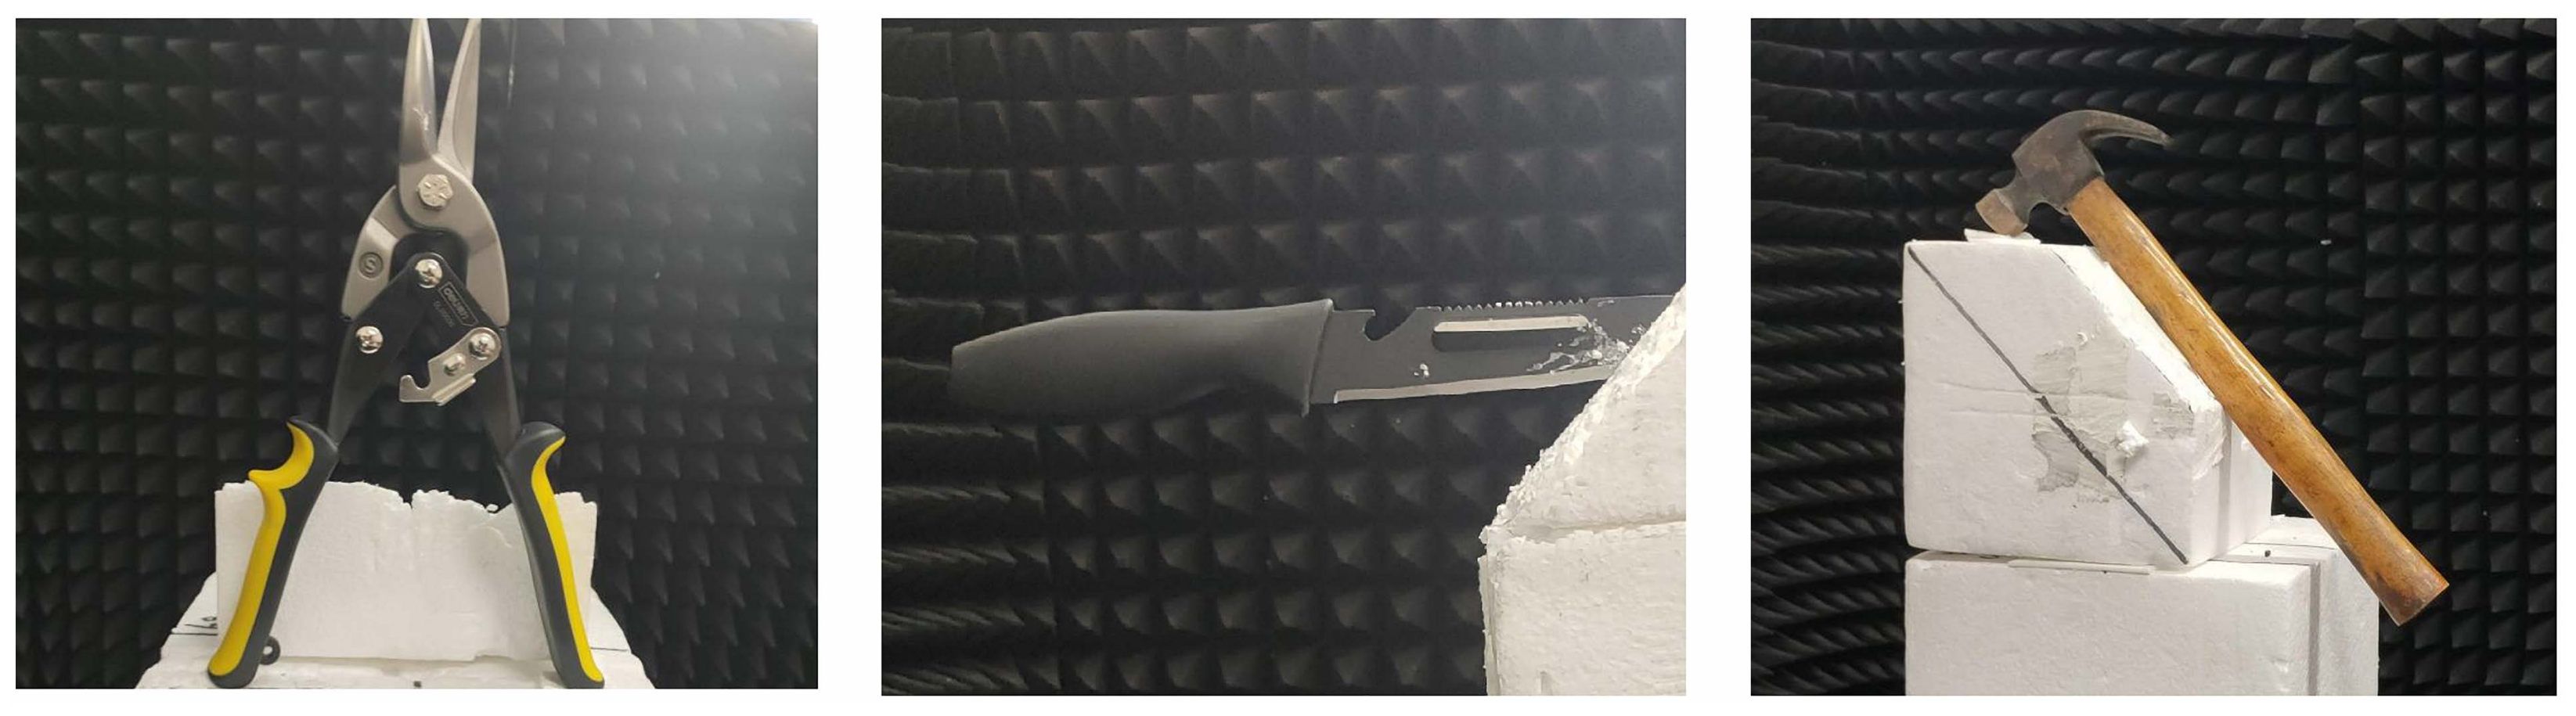
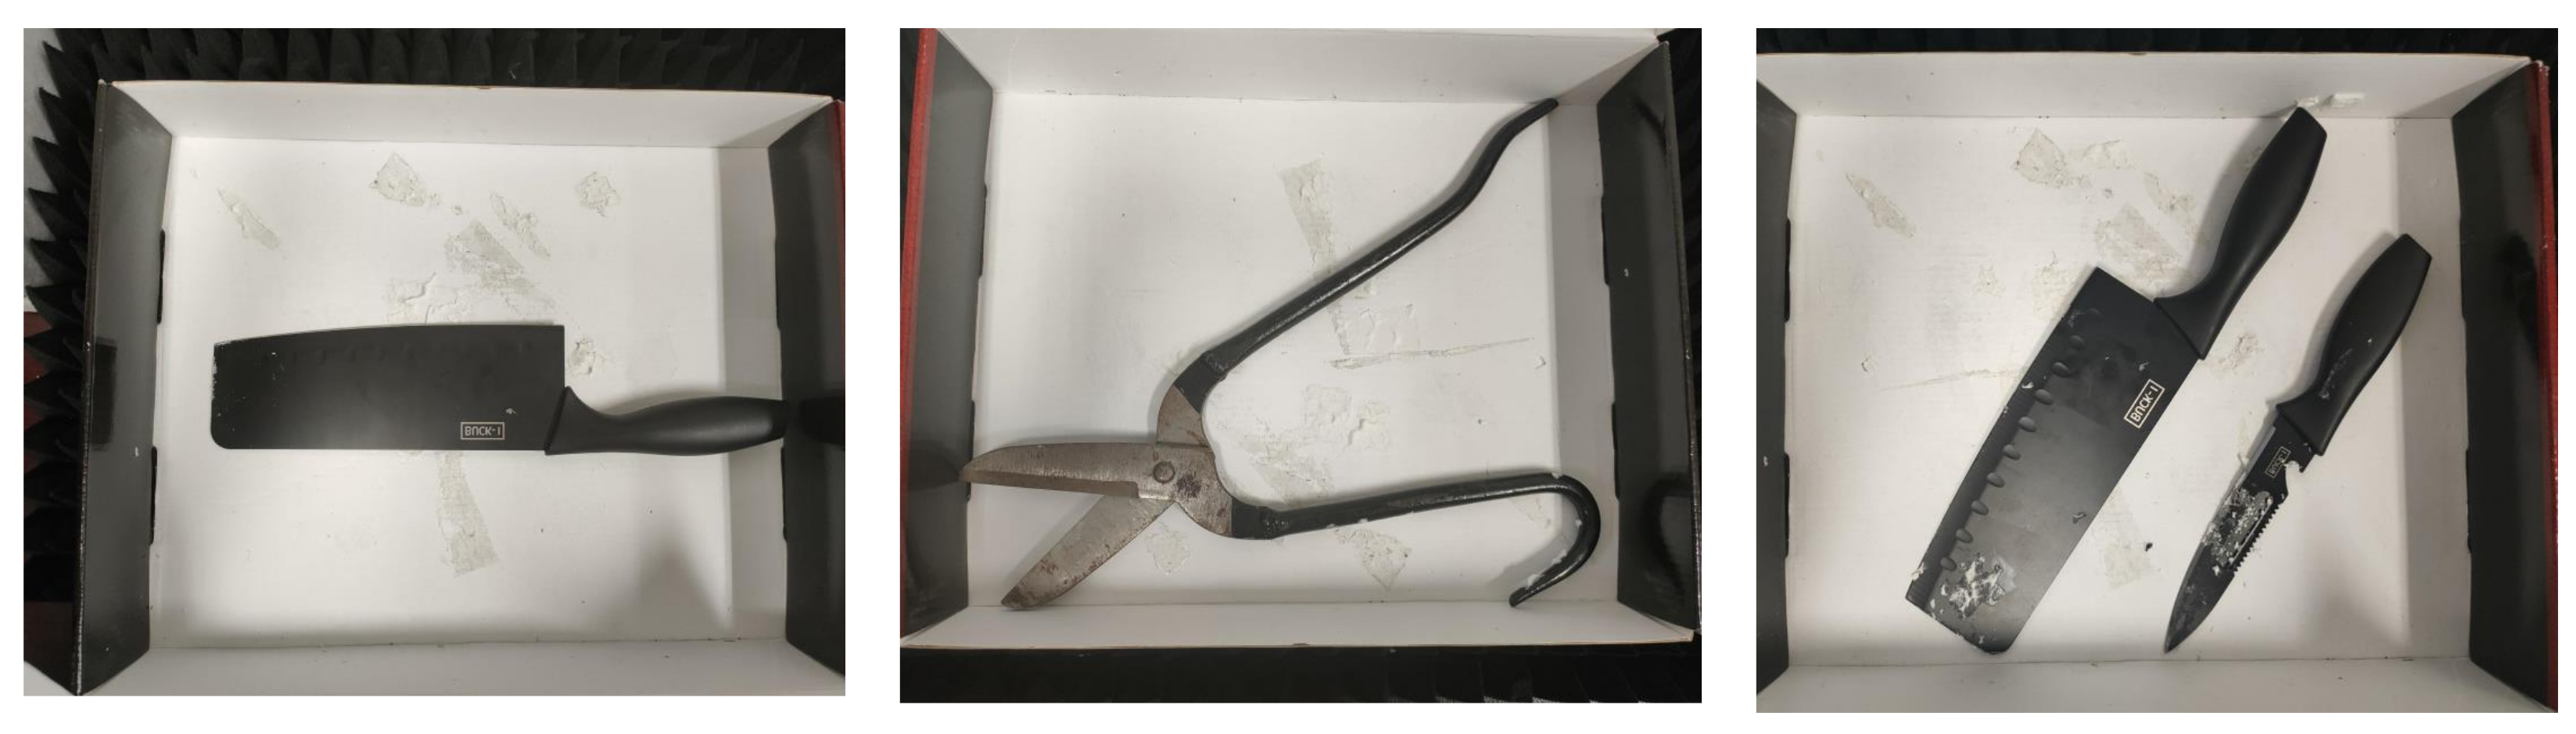
- 3DRIED contains 9 types of targets, with a total of 81 near-field radar data. Target types are complete; environments conditions are diverse; and applications are extensive.
- 3.
- The proposed dataset is used to evaluate several widely used MMW imaging algorithms to obtain 2-D and 3-D imaging results, and different numerical evaluation indexes are given as a baseline.
2. Related Theory
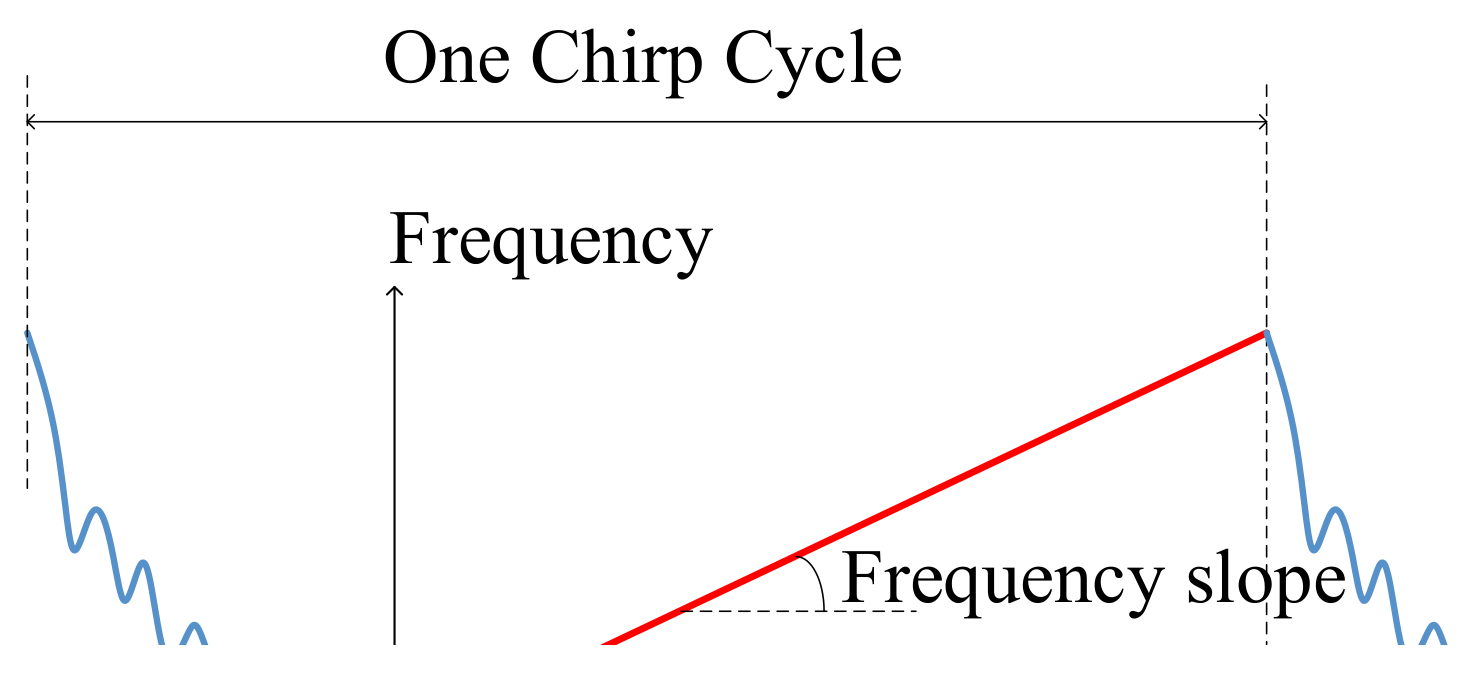
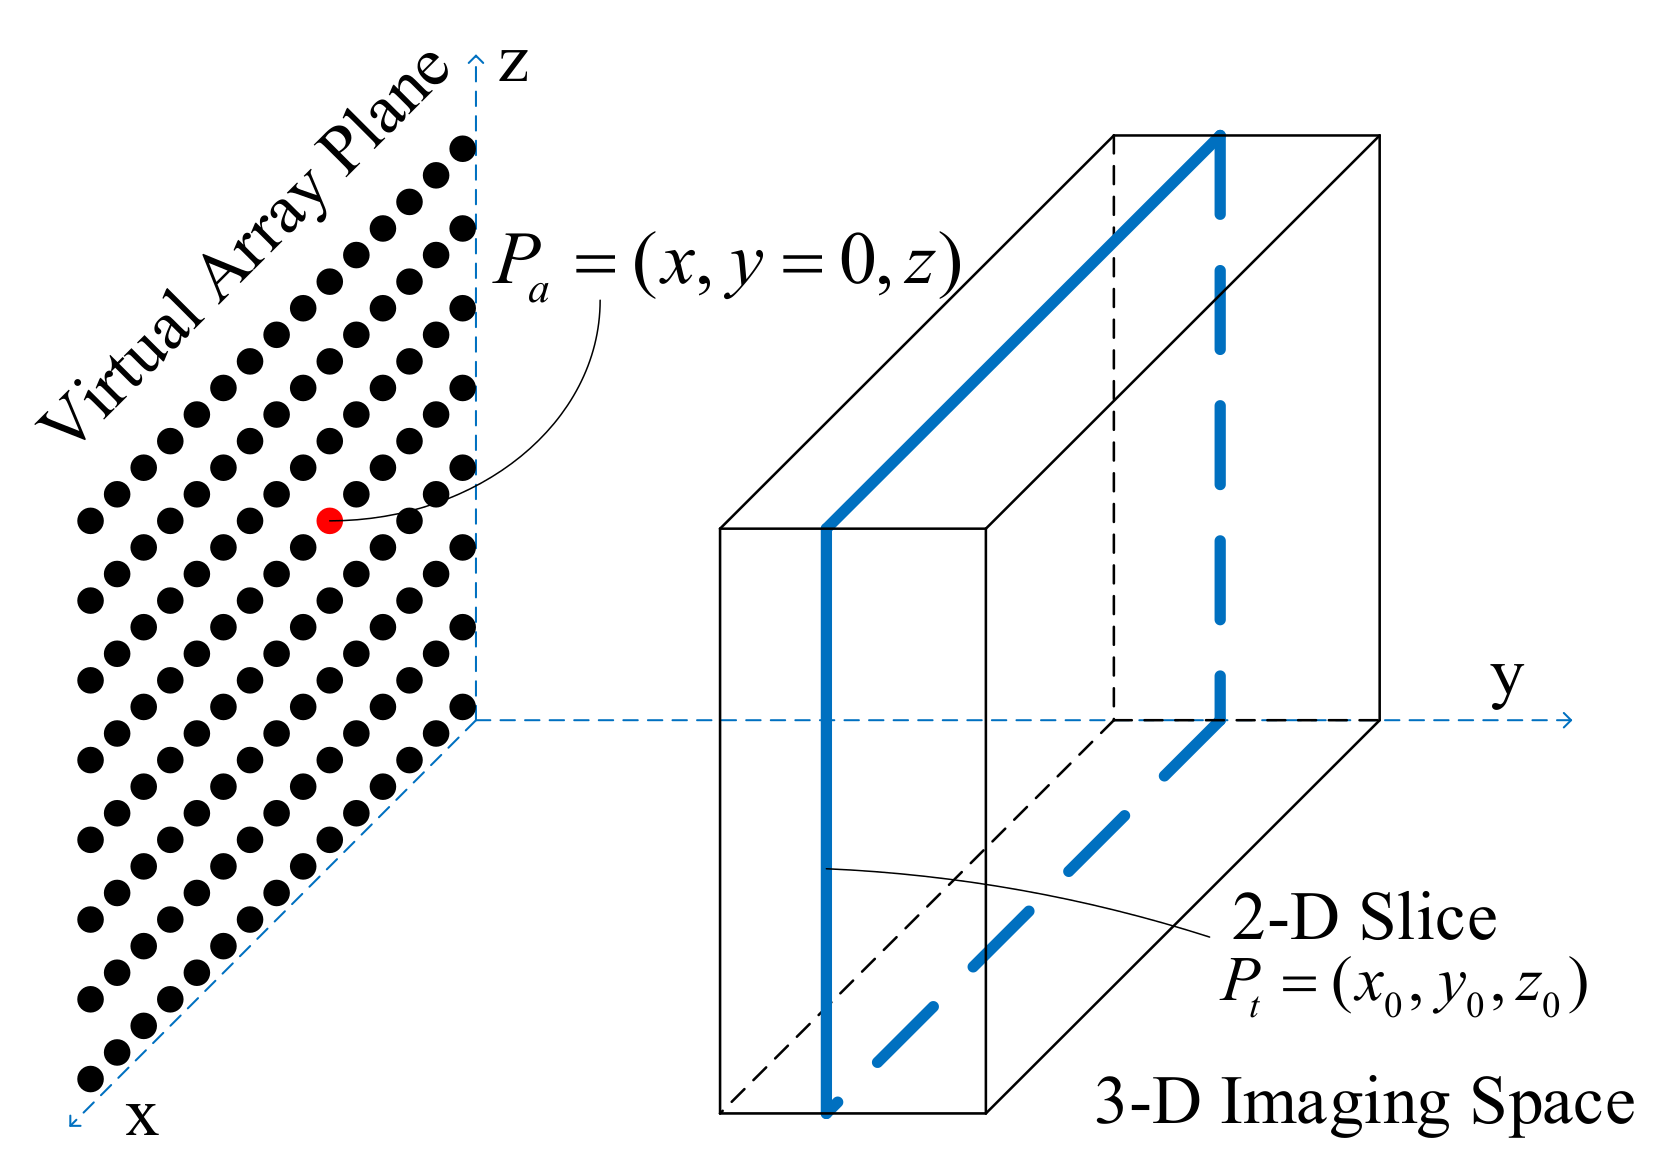
2.1. Signal Model
2.2. 3-D Imaging Algorithm
2.2.1. Range Migration Algorithm
2.2.2. Compressed Sensing Algorithm
| Algorithm 1: Compressed Sensing Algorithm (CSA) |
| Given: Raw echo , measurement matrix ; Output: 3-D imaging result cube Initialize: Parameters , p,and , iterative threshold ; 1: , , set ; 2: 3: Diagonal matrix : ; 4: ; 5: ; 6: ; 7: 8: = . |
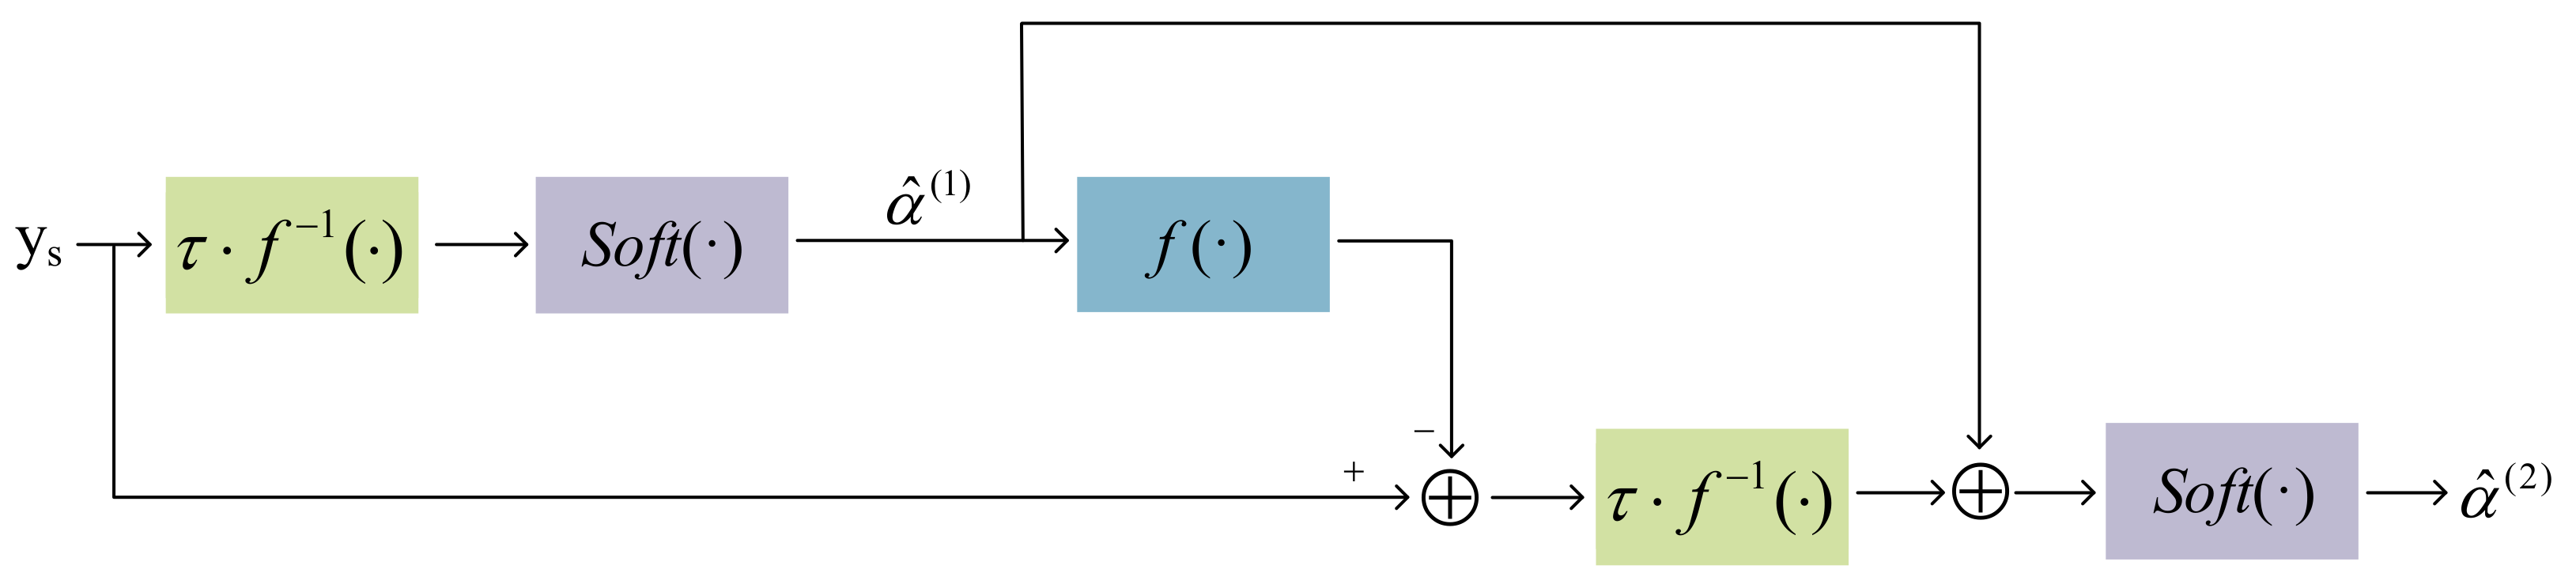
2.2.3. Rmist-Net
3. Dataset
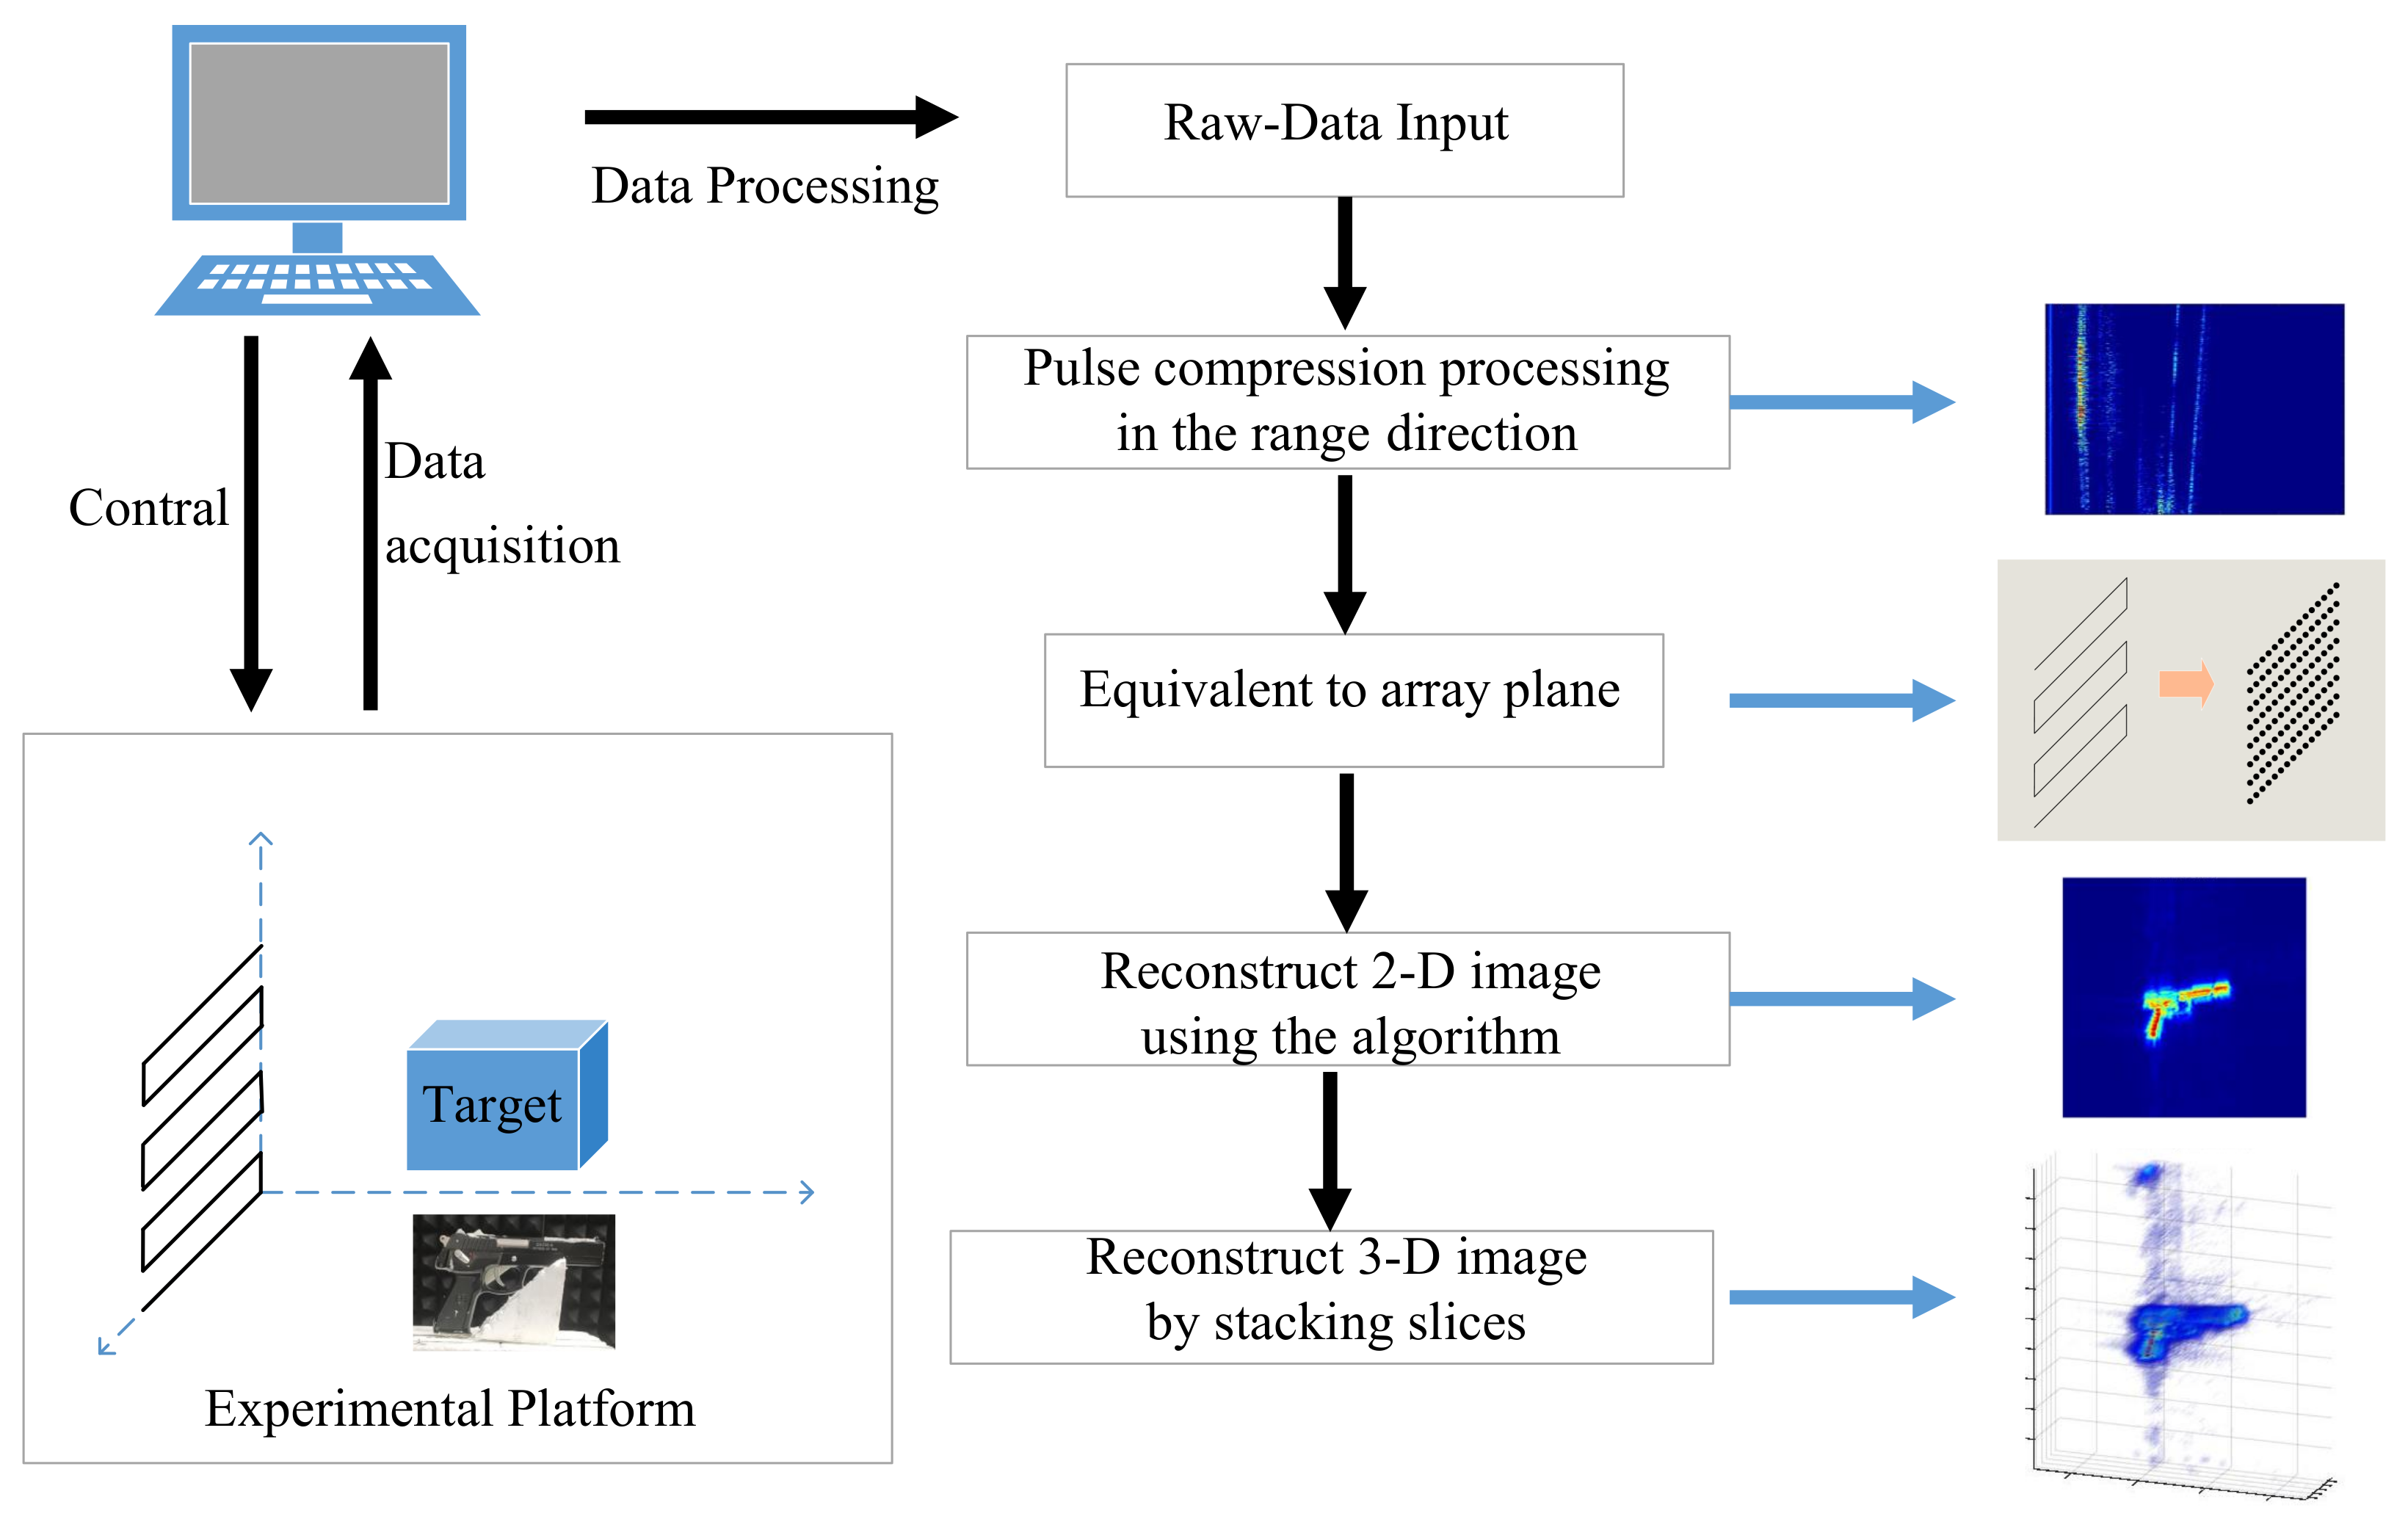
3.1. The System of Date Acquisition
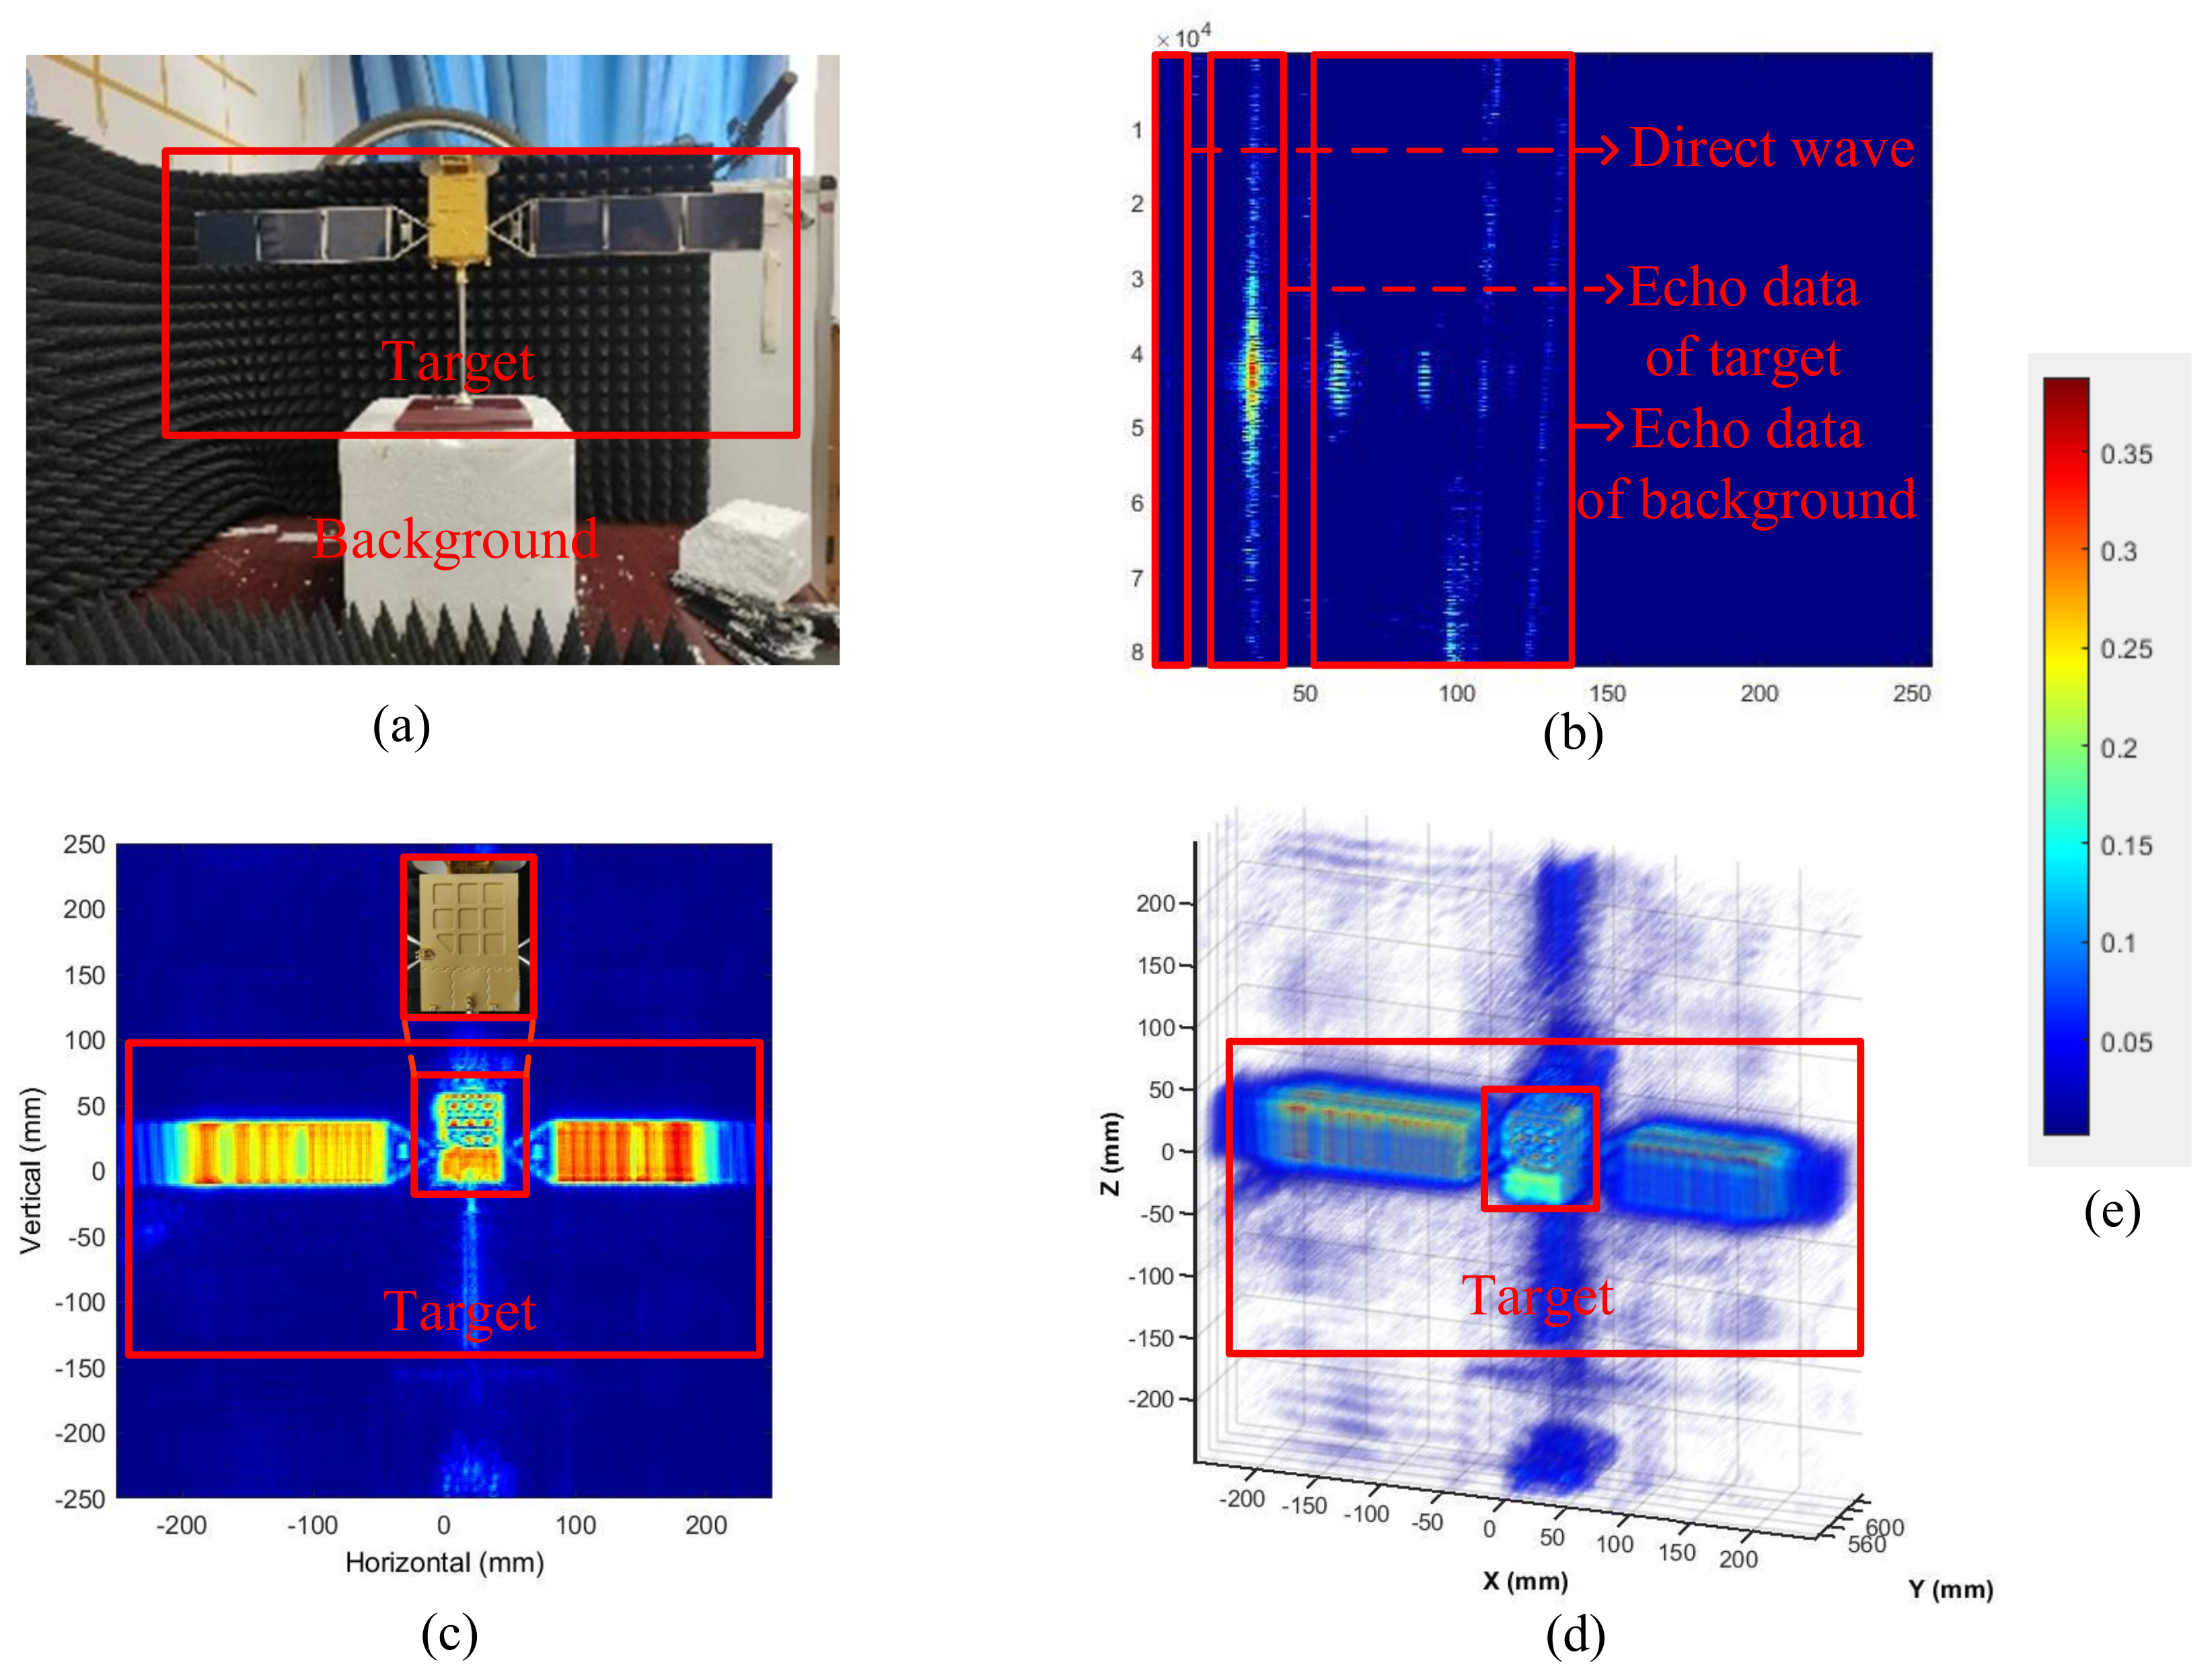
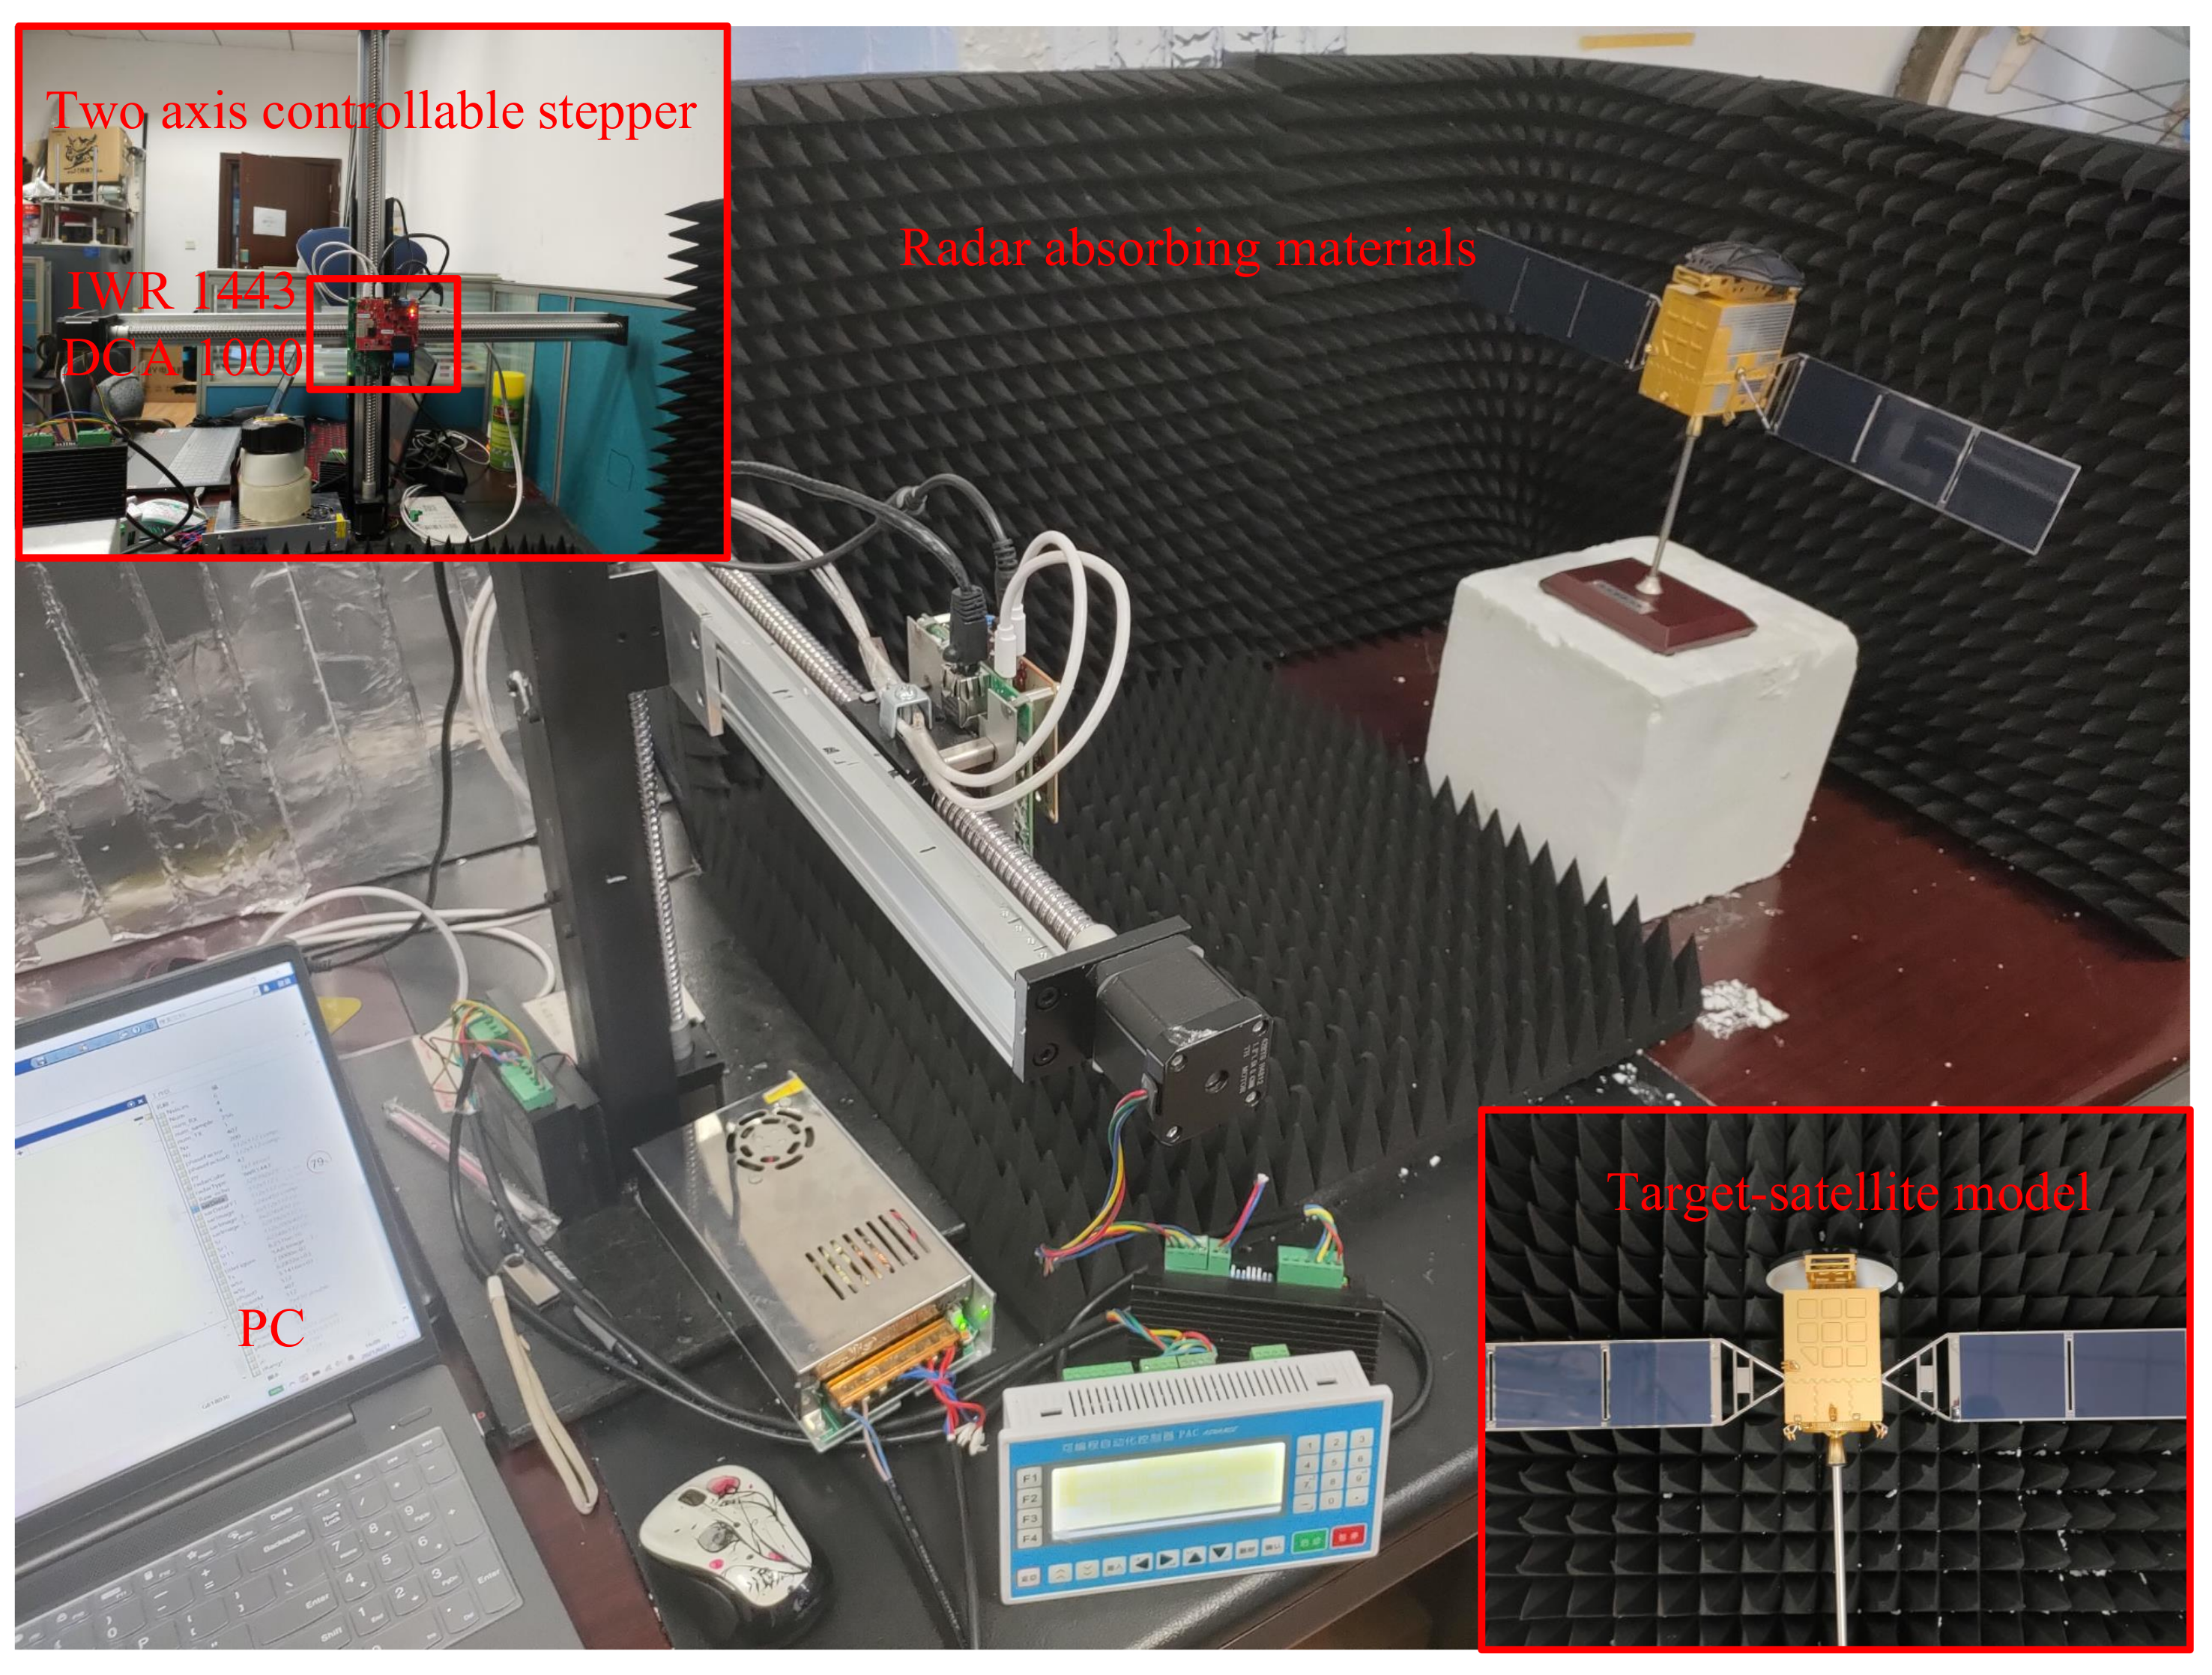
3.1.1. Experimental Equipment
3.1.2. Experimental Results
3.2. Description of Dataset
3.2.1. Imaging Evaluation under Different Environments
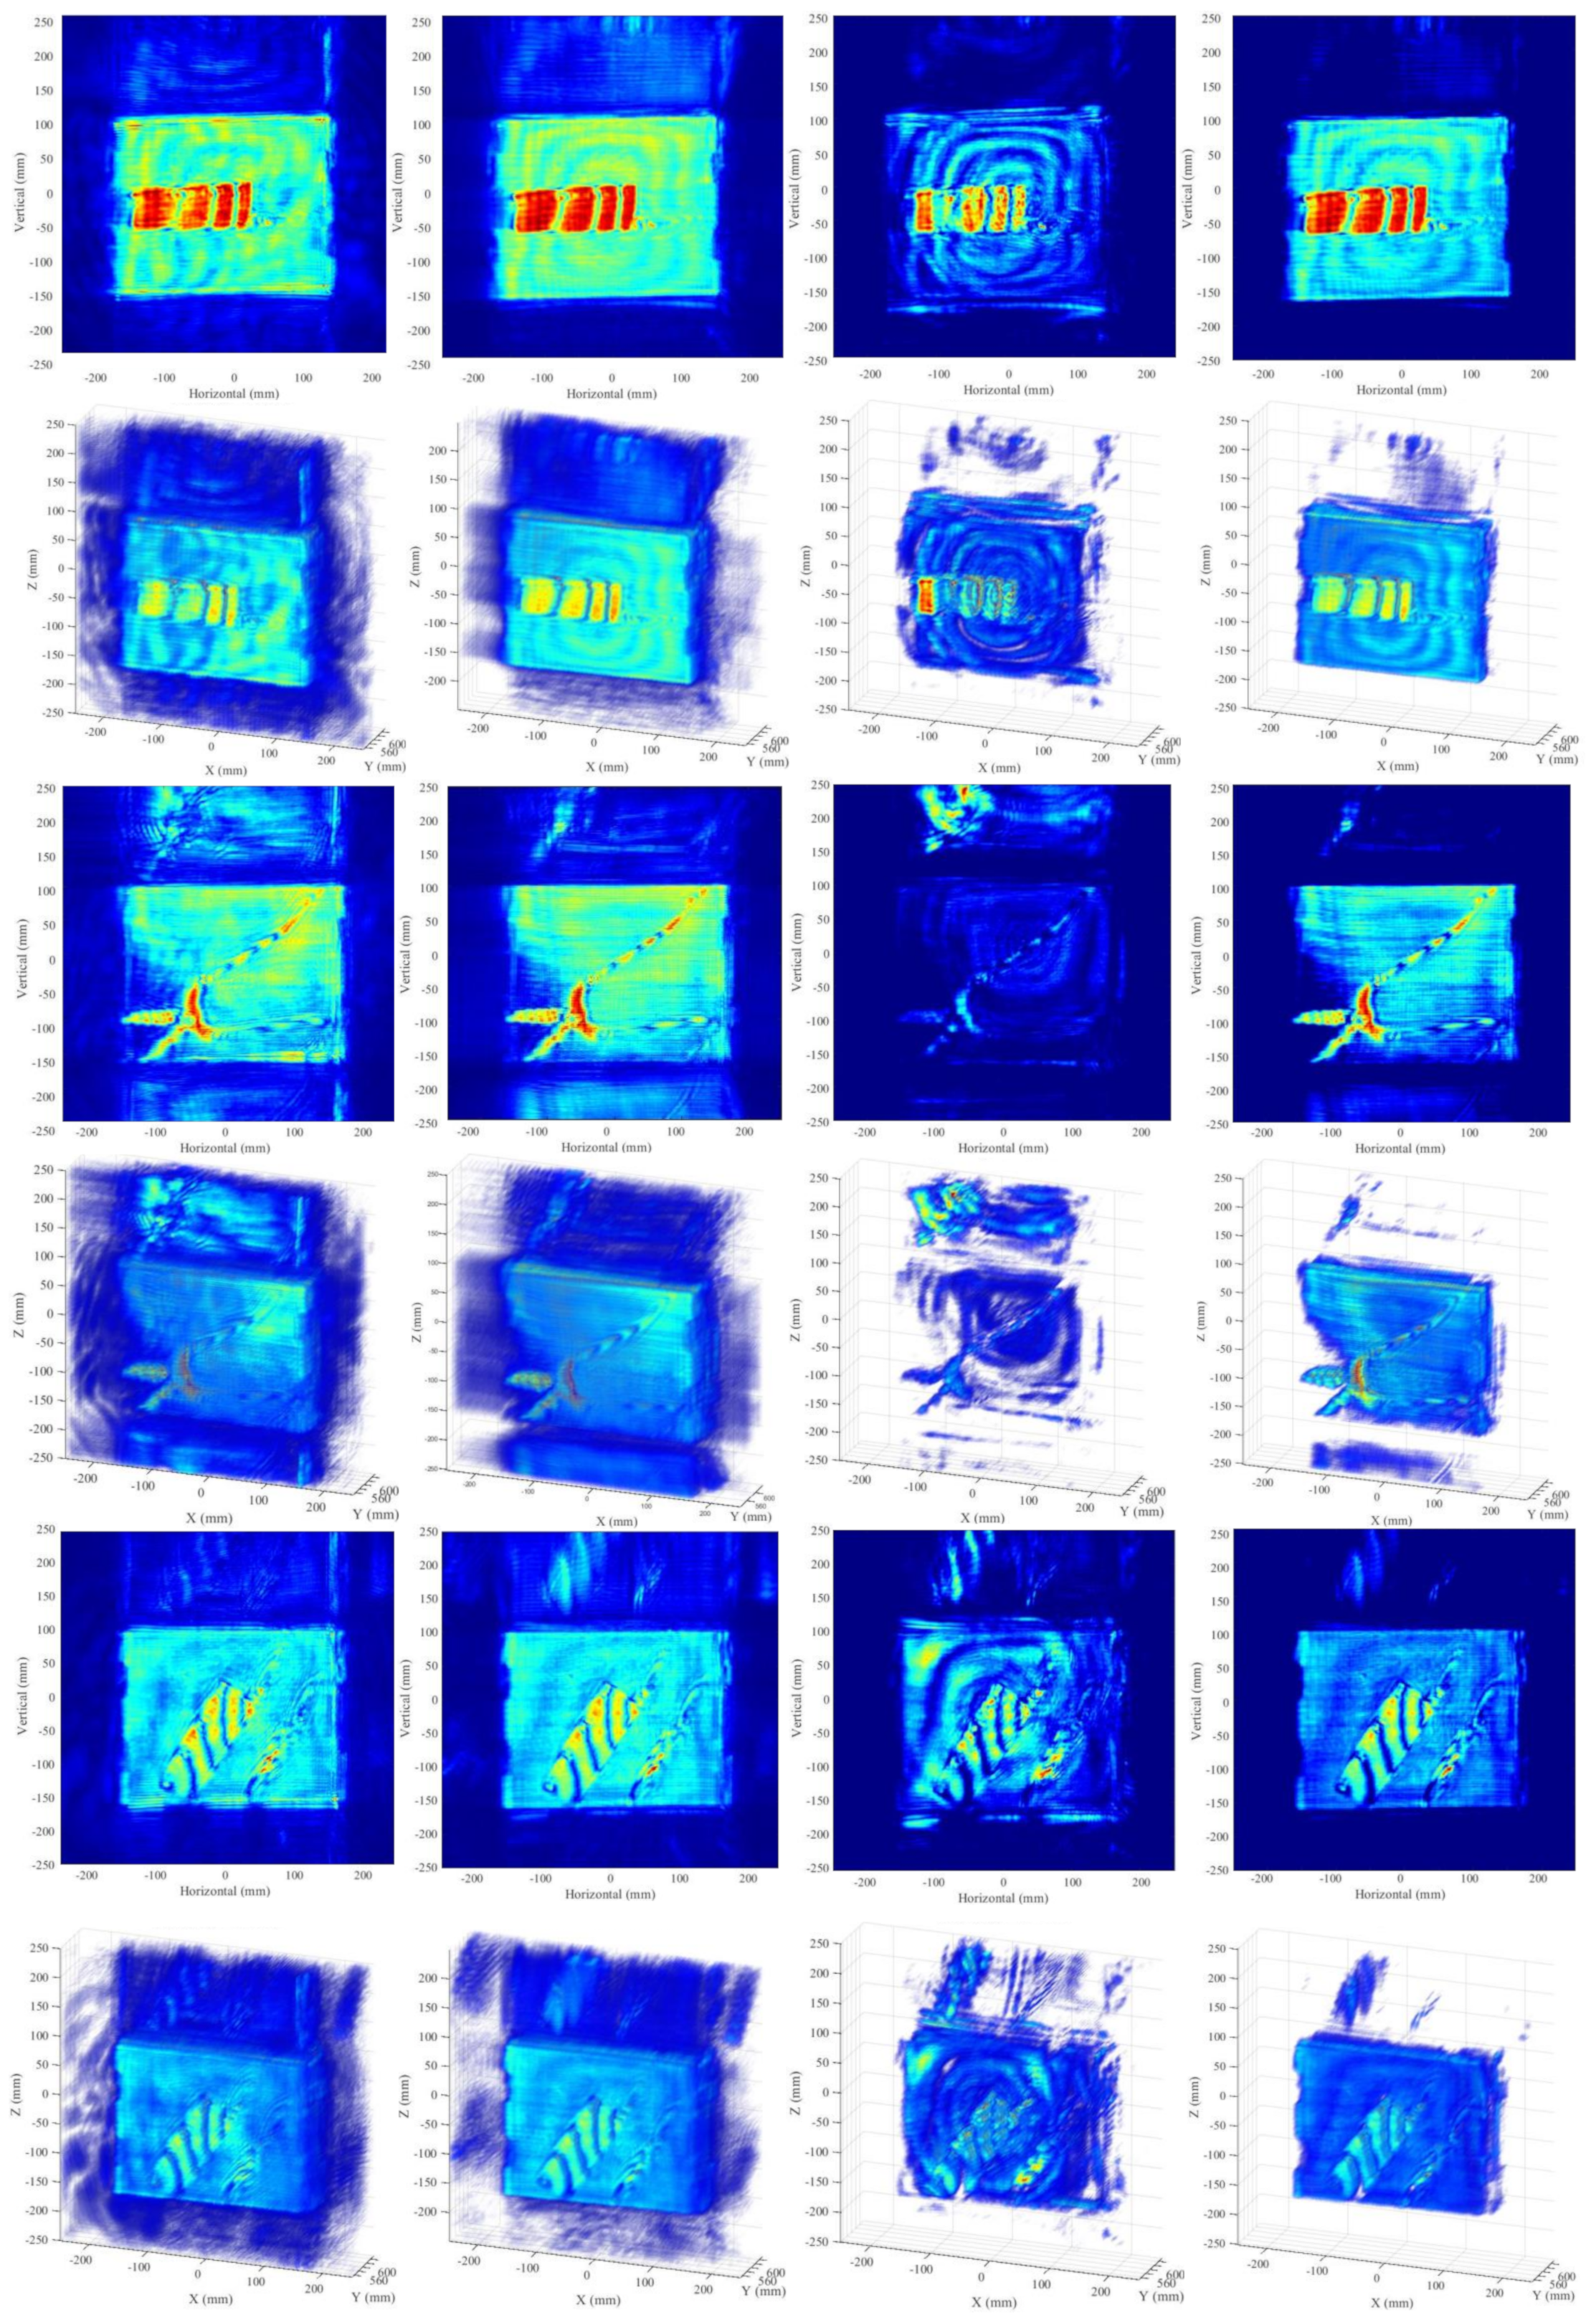
3.2.2. Imaging Evaluation Using Different Algorithms
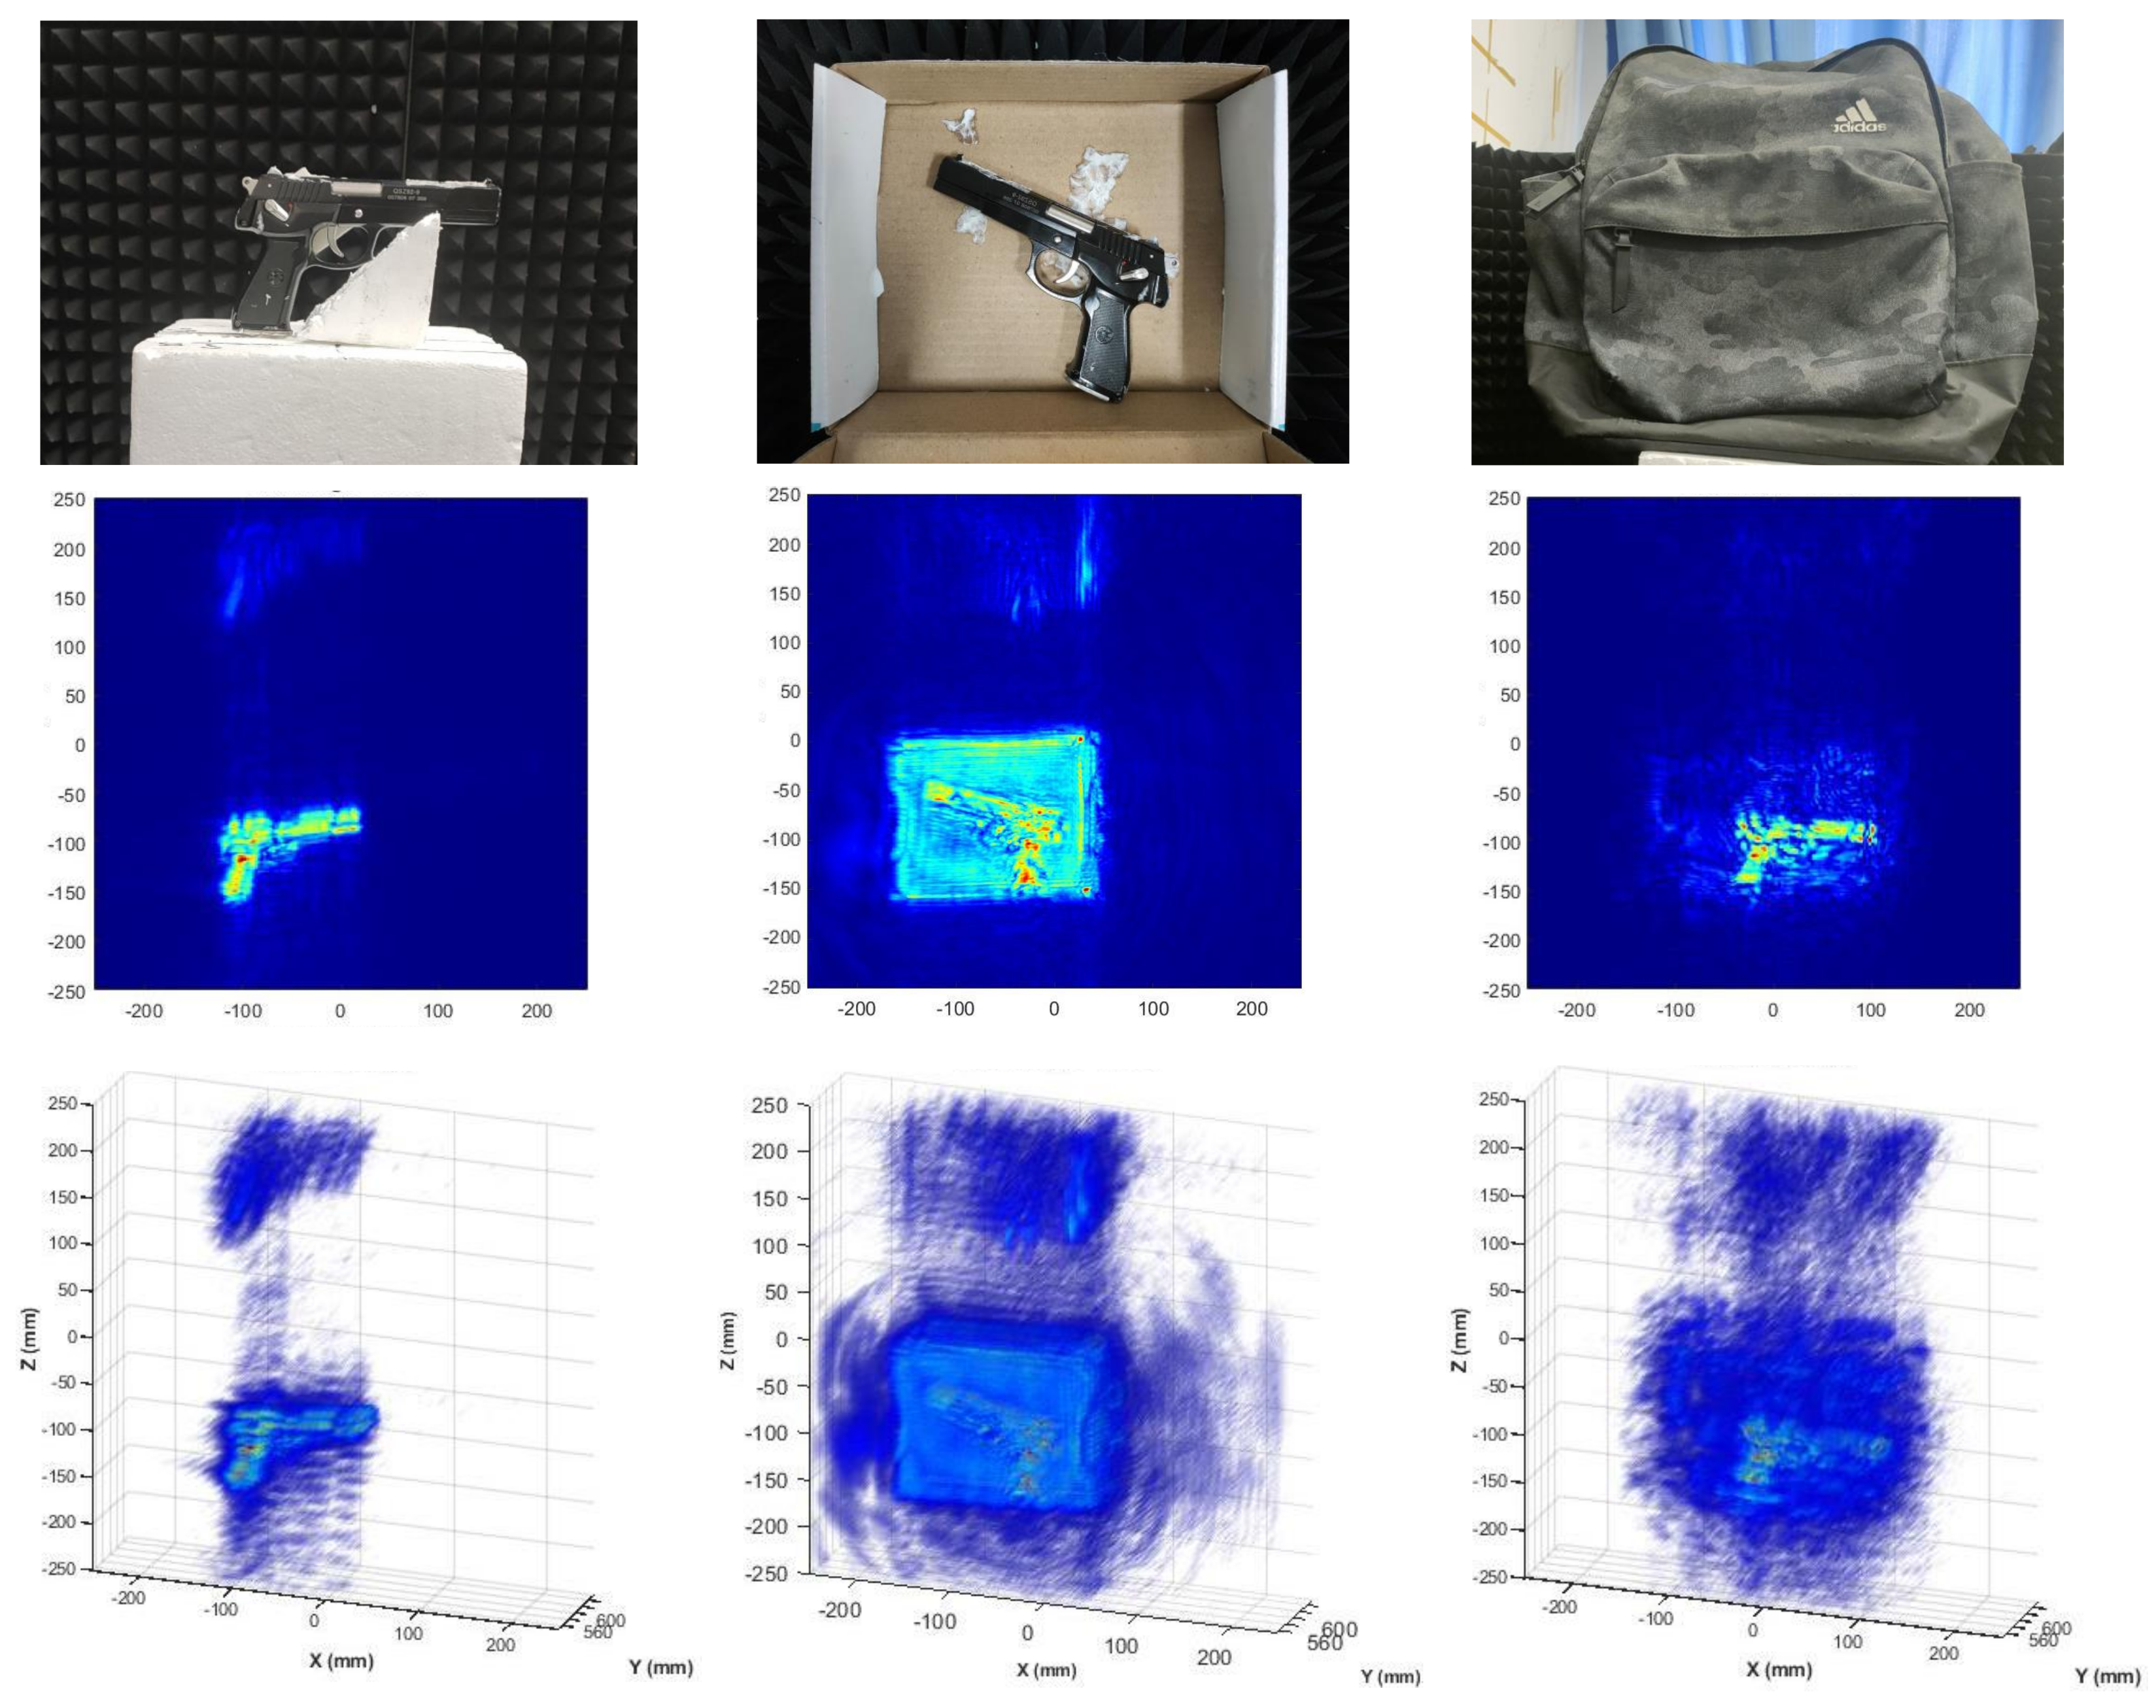
3.2.3. Imaging Evaluation with Different Targets
3.3. Analysis of Running Time
3.4. Discussion
4. Conclusions
Author Contributions
Funding
Institutional Review Board Statement
Informed Consent Statement
Data Availability Statement
Acknowledgments
Conflicts of Interest
References
- Gu, S.; Li, C.; Gao, X.; Sun, Z.; Fang, G. Three-dimensional image reconstruction of targets under the illumination of terahertz Gaussian beam—Theory and experiment. IEEE Trans. Geosci. Remote. Sens. 2012, 51, 2241–2249. [Google Scholar] [CrossRef]
- Gao, J.; Deng, B.; Qin, Y.; Li, X.; Wang, H. Point cloud and 3-D surface reconstruction using cylindrical millimeter-wave holography. IEEE Trans. Instrum. Meas. 2019, 68, 4765–4778. [Google Scholar] [CrossRef]
- Guo, Q.; Wang, Z.; Chang, T.; Cui, H.L. Millimeter-wave 3-D imaging testbed with MIMO array. IEEE Trans. Microw. Theory Tech. 2019, 68, 1164–1174. [Google Scholar] [CrossRef]
- Zhu, Z.; Xu, F. Demonstration of 3-D Security Imaging at 24 GHz With a 1-D Sparse MIMO Array. IEEE Geosci. Remote. Sens. Lett. 2020, 17, 2090–2094. [Google Scholar] [CrossRef]
- Zhuge, X.; Yarovoy, A.G. A sparse aperture MIMO-SAR-based UWB imaging system for concealed weapon detection. IEEE Trans. Geosci. Remote. Sens. 2010, 49, 509–518. [Google Scholar] [CrossRef]
- Sheen, D.M.; McMakin, D.L.; Hall, T.E. Three-dimensional mmW imaging for concealed weapon detection. IEEE Trans. Microw. Theory Tech. 2001, 49, 1581–1592. [Google Scholar] [CrossRef]
- Yarovoy, A.G.; Savelyev, T.G.; Aubry, P.J.; Lys, P.E.; Ligthart, L.P. UWB array-based sensor for near-field imaging. IEEE Trans. Microw. Theory Tech. 2007, 55, 1288–1295. [Google Scholar] [CrossRef]
- Ren, Z.; Boybay, M.S.; Ramahi, O.M. Near-field probes for subsurface detection using split-ring resonators. IEEE Trans. Microw. Theory Tech. 2010, 59, 488–495. [Google Scholar] [CrossRef]
- Klemm, M.; Leendertz, J.A.; Gibbins, D.; Craddock, I.J.; Preece, A.; Benjamin, R. Microwave radar-based differential breast cancer imaging: Imaging in homogeneous breast phantoms and low contrast scenarios. IEEE Trans. Antennas Propag. 2010, 58, 2337–2344. [Google Scholar] [CrossRef]
- Chao, L.; Afsar, M.N.; Korolev, K.A. Millimeter wave dielectric spectroscopy and breast cancer imaging. In Proceedings of the 2012 7th European Microwave Integrated Circuit Conference, Amsterdam, The Netherlands, 29–30 October 2012; pp. 572–575. [Google Scholar]
- Di Meo, S.; Matrone, G.; Pasian, M.; Bozzi, M.; Perregrini, L.; Magenes, G.; Mazzanti, A.; Svetlo, F.; Summers, P.E.; Renne, G.; et al. High-resolution mm-wave imaging techniques and systems for breast cancer detection. In Proceedings of the 2017 IEEE MTT-S International MicrowaveWorkshop Series on Advanced Materials and Processes for RF and THz Applications (IMWS-AMP), Pavia, Italy, 20–22 September 2017; pp. 1–3. [Google Scholar]
- Tokoro, S. Automotive application systems of a millimeter-wave radar. In Proceedings of the Conference on Intelligent Vehicles, Tokyo, Japan, 19–20 September 1996; pp. 260–265. [Google Scholar]
- Ihara, T.; Fujimura, K. Research and development trends of mmW short-range application systems. IEICE Trans. Commun. 1996, 79, 1741–1753. [Google Scholar]
- Kharkovsky, S.; Zoughi, R. Microwave and millimeter wave nondestructive testing and evaluation-Overview and recent advances. IEEE Instrum. Meas. Mag. 2007, 10, 26–38. [Google Scholar] [CrossRef]
- Cutrona, L.J. Synthetic aperture radar. Radar Handb. 1990, 2, 2333–2346. [Google Scholar]
- Yanik, M.E.; Wang, D.; Torlak, M. Development and demonstration of MIMO-SAR mmWave imaging testbeds. IEEE Access 2020, 8, 126019–126038. [Google Scholar] [CrossRef]
- Yegulalp, A.F. Fast backprojection algorithm for synthetic aperture radar. In Proceedings of the 1999 IEEE Radar Conference. Radar into the Next Millennium (Cat. No. 99CH36249), Waltham, MA, USA, 22 April 1999; pp. 60–65. [Google Scholar]
- Mohammadian, N.; Furxhi, O.; Short, R.; Driggers, R. SAR millimeter wave imaging systems. Passive and Active Millimeter-Wave Imaging XXII. Int. Soc. Opt. Photonics 2019, 10994, 109940A. [Google Scholar]
- Moll, J.; Schops, P.; Krozer, V. Towards three-dimensional millimeter-wave radar with the bistatic fast-factorized back-projection algorithm—Potential and limitations. IEEE Trans. Terahertz Sci. Technol. 2012, 2, 432–440. [Google Scholar] [CrossRef]
- Lopez-Sanchez, J.M.; Fortuny-Guasch, J. 3-D radar imaging using range migration techniques. IEEE Trans. Antennas Propag. 2000, 48, 728–737. [Google Scholar] [CrossRef]
- Wang, Z.; Guo, Q.; Tian, X.; Chang, T.; Cui, H.L. Near-field 3-D millimeter-wave imaging using MIMO RMA with range compensation. IEEE Trans. Microw. Theory Tech. 2018, 67, 1157–1166. [Google Scholar] [CrossRef]
- Candes, E.J.; Tao, T. Near-optimal signal recovery from random projections: Universal encoding strategies? IEEE Trans. Inf. Theory 2006, 52, 5406–5425. [Google Scholar] [CrossRef] [Green Version]
- Candes, E.J.; Romberg, J.K.; Tao, T. Stable signal recovery from incomplete and inaccurate measurements. Commun. Pure Appl. Math. J. Issued Courant Inst. Math. Sci. 2006, 59, 1207–1223. [Google Scholar]
- Baraniuk, R.G. Compressive sensing [lecture notes]. IEEE Signal Process. Mag. 2007, 24, 118–121. [Google Scholar] [CrossRef]
- Baron, D.; Sarvotham, S.; Baraniuk, R.G. Bayesian compressive sensing via belief propagation. IEEE Trans. Signal Process. 2009, 58, 269–280. [Google Scholar] [CrossRef] [Green Version]
- Bobin, J.; Starck, J.L.; Ottensamer, R. Compressed sensing in astronomy. IEEE J. Sel. Top. Signal Process. 2008, 2, 718–726. [Google Scholar] [CrossRef] [Green Version]
- Lustig, M.; Donoho, D.L.; Santos, J.M.; Pauly, J.M. Compressed sensing MRI. IEEE Signal Process. Mag. 2008, 25, 72–82. [Google Scholar] [CrossRef]
- Zhang, J.; Ghanem, B. ISTA-Net: Interpretable optimization-inspired deep network for image compressive sensing. In Proceedings of the IEEE Conference on Computer Vision and Pattern Recognition, Salt Lake City, UT, USA, 18–22 June 2018; pp. 1828–1837. [Google Scholar]
- Zhang, Z.; Liu, Y.; Liu, J.; Wen, F.; Zhu, C. AMP-Net: Denoising-based deep unfolding for compressive image sensing. IEEE Trans. Image Process. 2020, 30, 1487–1500. [Google Scholar] [CrossRef] [PubMed]
- Wang, M.; Wei, S.; Shi, J.; Wu, Y.; Qu, Q.; Zhou, Y.; Zeng, X.; Tian, B. CSR-Net: A novel complex-valued network for fast and precise 3-D microwave sparse reconstruction. IEEE J. Sel. Top. Appl. Earth Obs. Remote Sens. 2020, 13, 4476–4492. [Google Scholar] [CrossRef]
- Wang, M.; Wei, S.; Liang, J.; Zeng, X.; Wang, C.; Shi, J.; Zhang, X. RMIST-Net: Joint Range Migration and Sparse Reconstruction Network for 3-D mmW Imaging. IEEE Trans. Geosci. Remote. Sens. 2021. [Google Scholar] [CrossRef]
- Wang, M.; Wei, S.; Liang, J.; Liu, S.; Shi, J.; Zhang, X. Lightweight FISTA-Inspired Sparse Reconstruction Network for mmW 3-D Holography. IEEE Trans. Geosci. Remote. Sens. 2021. [Google Scholar] [CrossRef]
- Wang, Z.; Miao, X.; Huang, Z.; Luo, H. Research of Target Detection and Classification Techniques Using Millimeter-Wave Radar and Vision Sensors. Remote Sens. 2021, 13, 1064. [Google Scholar] [CrossRef]
- Cui, J.; Ding, Z.; Fan, P.; Al-Dhahir, N. Unsupervised machine learning-based user clustering in millimeter-wave-NOMA systems. IEEE Trans. Wirel. Commun. 2018, 17, 7425–7440. [Google Scholar] [CrossRef]
- Lien, J.; Gillian, N.; Karagozler, M.E.; Amihood, P.; Schwesig, C.; Olson, E.; Raja, H.; Poupyrev, I. Soli: Ubiquitous gesture sensing with millimeter wave radar. ACM Trans. Graph. (TOG) 2016, 35, 1–19. [Google Scholar] [CrossRef] [Green Version]
- Long, N.; Wang, K.; Cheng, R.; Hu, W.; Yang, K. Unifying obstacle detection, recognition, and fusion based on millimeter wave radar and RGB-depth sensors for the visually impaired. Rev. Sci. Instrum. 2019, 90, 044102. [Google Scholar] [CrossRef]
- Zhao, K.; Wang, J. Improved wiener filter super-resolution algorithm for passive millimeter wave imaging. In Proceedings of the 2011 IEEE CIE International Conference on Radar, Chengdu, China, 24–27 October 2011; Volume 2, pp. 1768–1771. [Google Scholar]
- Li, H.; Liang, X.; Zhang, F.; Wu, Y. 3D imaging for array InSAR based on Gaussian mixture model clustering. J. Radars 2017, 6, 630–639. [Google Scholar]
- Shi, J.; Que, Y.; Zhou, Z.; Zhou, Y.; Zhang, X.; Sun, M. Near-field Millimeter Wave 3D Imaging and Object Detection Method. J. Radars 2019, 8, 578–588. [Google Scholar]
- Kramer, A.; Harlow, K.; Williams, C.; Heckman, C. ColoRadar: The Direct 3D Millimeter Wave Radar Dataset. arXiv 2021, arXiv:2103.04510. [Google Scholar]
- Zhuge, X.; Yarovoy, A.G. Three-dimensional near-field MIMO array imaging using range migration techniques. IEEE Trans. Image Process. 2012, 21, 3026–3033. [Google Scholar] [CrossRef]
- Gao, J.; Qin, Y.; Deng, B.; Wang, H.; Li, X. Novel efficient 3D short-range imaging algorithms for a scanning 1D-MIMO array. IEEE Trans. Image Process. 2018, 27, 3631–3643. [Google Scholar] [CrossRef] [PubMed]
- Wei, S.J.; Zhang, X.L.; Shi, J. Sparse autofocus via Bayesian learning iterative maximum and applied for LASAR 3-D imaging. In Proceedings of the 2014 IEEE Radar Conference, Cincinnati, OH, USA, 19–23 May 2014. [Google Scholar]
- Building Cascade Radar Using TI’s mmwave Sensors, Texas Instruments. Available online: Https://training.ti.com/build-cascadedradar-usingtis-mmwave-sensors (accessed on 9 April 2018).
- Gumbmann, F.; Schmidt, L.P. Millimeter-wave imaging with optimized sparse periodic array for short-range applications. IEEE Trans. Geosci. Remote. Sens. 2011, 49, 3629–3638. [Google Scholar] [CrossRef]
- Zhang, S.; Liu, Y.; Li, X. Fast entropy minimization based autofocusing technique for ISAR imaging. IEEE Trans. Signal Process. 2015, 63, 3425–3434. [Google Scholar] [CrossRef]
- Qiao, L.; Wang, Y.; Zhao, Z.; Chen, Z. Range resolution enhancement for three-dimensional millimeter-wave Wholographic imaging. IEEE Antennas Wirel. Propag. Lett. 2015, 15, 1422–1425. [Google Scholar] [CrossRef]
- Gao, J.; Qin, Y.; Deng, B.; Wang, H.; Li, X. A novel method for 3-D millimeter-wave holographic reconstruction based on frequency interferometry techniques. IEEE Trans. Microw. Theory Tech. 2017, 66, 1579–1596. [Google Scholar] [CrossRef]
- Appleby, R.; Anderton, R.N. Millimeter-wave and submillimeter-wave imaging for security and surveillance. Proc. IEEE 2007, 95, 1683–1690. [Google Scholar] [CrossRef]
- McMakin, D.L.; Sheen, D.M.; Collins, H.D. Remote concealed weapons and explosive detection on people using mmW holography. In Proceedings of the 1996 30th Annual International Carnahan Conference on Security Technology, Lexington, KY, USA, 2–4 October 1996; pp. 19–25. [Google Scholar]


| Item | Parameter |
|---|---|
| Radar Sensor | ‘IWR 1443’ |
| Data Acquistion Card | ‘DCA 1000’ |
| Frecquency Range | 77–81 |
| Frequency Slope | 70.295 MHz/s |
| ADC Samples | 256 |
| Virtual Aperture | 0.4 m × 0.4 m |
| Sampling interval (x-axis) | |
| Sampling interval (z-axis) |
| Target | Size | Sampling Points | Scene | |||||
|---|---|---|---|---|---|---|---|---|
| Free Space | Concealed Targets | |||||||
| [Weight, Height, Thickness] | Nx | Ny | Nz | Carton | Backpack | |||
| Single | Pistol | [15, 9, 2] | 407 | 256 | 200 | ✓ | ✓ | ✓ |
| Rifle | [26, 12, 2] | ✓ | ✓ | ✓ | ||||
| stiletto | [23, 3, 1.5] | ✓ | ✓ | ✓ | ||||
| Knife | [29, 7, 0.2] | ✓ | ✓ | ✓ | ||||
| Wrench | [15, 5, 1] | ✓ | ✓ | |||||
| Plier | [24, 8, 3] | ✓ | ✓ | |||||
| Hammer | [30, 9.8, 2.5] | ✓ | ||||||
| Snips | [36, 16, 1] | ✓ | ✓ | ✓ | ||||
| Satellite | [6.1, 4.9, 6.8] | ✓ | ||||||
| Multiple | Steel ball | diameter = 0.8 cm | ✓ | |||||
| Pistol+Rifle | ✓ | ✓ | ||||||
| Knife+Stiletto | ✓ | ✓ | ||||||
| Pistol+Stiletto | ✓ | ✓ | ||||||
| Pistol+Knife | ✓ | ✓ | ||||||
| Echo Data | The raw data at the transceivers is a complex matrix of four channels, which size is . The distances between targets and radar are in 55–60 cm. | |||||||
| Imaging Results | The 2-D imaging results have 512 × 512 pixels, the number of slices in the y direction is 6. The size of imaging space is 50 cm × 10 cm × 50 cm. | |||||||
| BPA | Entropy | Contrast |
|---|---|---|
| In free space | ||
| In the carton | ||
| In the backpack |
| Rifle Model | Entropy | Contrast |
|---|---|---|
| BPA | ||
| RMA() | ||
| CSA | ||
| RMA() | ||
| RMIST-Net |
| Plier | Stiletto | Hammer | ||||
|---|---|---|---|---|---|---|
| Entropy | Contrast | Entropy | Contrast | Entropy | Contrast | |
| BPA | 0.8850 | 0.4722 | 2.2505 | 0.7734 | 0.8094 | 0.4211 |
| RMA | 0.7957 | 0.4153 | 1.7017 | 0.6840 | 0.7553 | 0.4093 |
| CSA | 0.3957 | 0.2549 | 0.4488 | 0.3225 | 0.5008 | 0.2755 |
| RMIST-Net | 0.5985 | 0.2957 | 0.1511 | 3.8106 | 0.1567 | 0.9153 |
| Concealed Knife | Concealed Snips | Concealed Knives | ||||
| Entropy | Contrast | Entropy | Contrast | Entropy | Contrast | |
| BPA | 4.2053 | 0.8190 | 3.8394 | 0.9441 | 0.6627 | 0.3974 |
| RMA | 4.7477 | 0.7626 | 3.8728 | 0.8600 | 0.6731 | 0.3737 |
| CSA | 2.2383 | 0.6440 | 1.0525 | 0.5208 | 0.4715 | 0.2727 |
| RMIST-Net | 3.3787 | 0.8037 | 2.0939 | 0.7179 | 2.0529 | 0.8732 |
| Knives | Snips | Concealed Rifle | ||||
| Entropy | Contrast | Entropy | Contrast | Entropy | Contrast | |
| BPA | 0.6627 | 0.3974 | 0.9077 | 0.4201 | 3.7789 | 0.8442 |
| RMA | 0.6731 | 0.3737 | 0.8704 | 0.3633 | 4.1620 | 0.7984 |
| CSA | 0.4715 | 0.2727 | 0.5945 | 0.2760 | 2.0847 | 0.6618 |
| RMIST-Net | 0.2395 | 0.4331 | 0.4906 | 0.3965 | 2.9893 | 0.8015 |
| Methods | BPA | RMA | CSA | RMIST-Net |
|---|---|---|---|---|
| Time(s) (CPU/GPU) |
Publisher’s Note: MDPI stays neutral with regard to jurisdictional claims in published maps and institutional affiliations. |
© 2021 by the authors. Licensee MDPI, Basel, Switzerland. This article is an open access article distributed under the terms and conditions of the Creative Commons Attribution (CC BY) license (https://creativecommons.org/licenses/by/4.0/).
Share and Cite
Wei, S.; Zhou, Z.; Wang, M.; Wei, J.; Liu, S.; Shi, J.; Zhang, X.; Fan, F. 3DRIED: A High-Resolution 3-D Millimeter-Wave Radar Dataset Dedicated to Imaging and Evaluation. Remote Sens. 2021, 13, 3366. https://0-doi-org.brum.beds.ac.uk/10.3390/rs13173366
Wei S, Zhou Z, Wang M, Wei J, Liu S, Shi J, Zhang X, Fan F. 3DRIED: A High-Resolution 3-D Millimeter-Wave Radar Dataset Dedicated to Imaging and Evaluation. Remote Sensing. 2021; 13(17):3366. https://0-doi-org.brum.beds.ac.uk/10.3390/rs13173366
Chicago/Turabian StyleWei, Shunjun, Zichen Zhou, Mou Wang, Jinshan Wei, Shan Liu, Jun Shi, Xiaoling Zhang, and Fan Fan. 2021. "3DRIED: A High-Resolution 3-D Millimeter-Wave Radar Dataset Dedicated to Imaging and Evaluation" Remote Sensing 13, no. 17: 3366. https://0-doi-org.brum.beds.ac.uk/10.3390/rs13173366