
Combining Optical and Radar Satellite Imagery to Investigate the Surface Properties and Evolution of the Lordsburg Playa, New Mexico, USA


Abstract
:1. Introduction
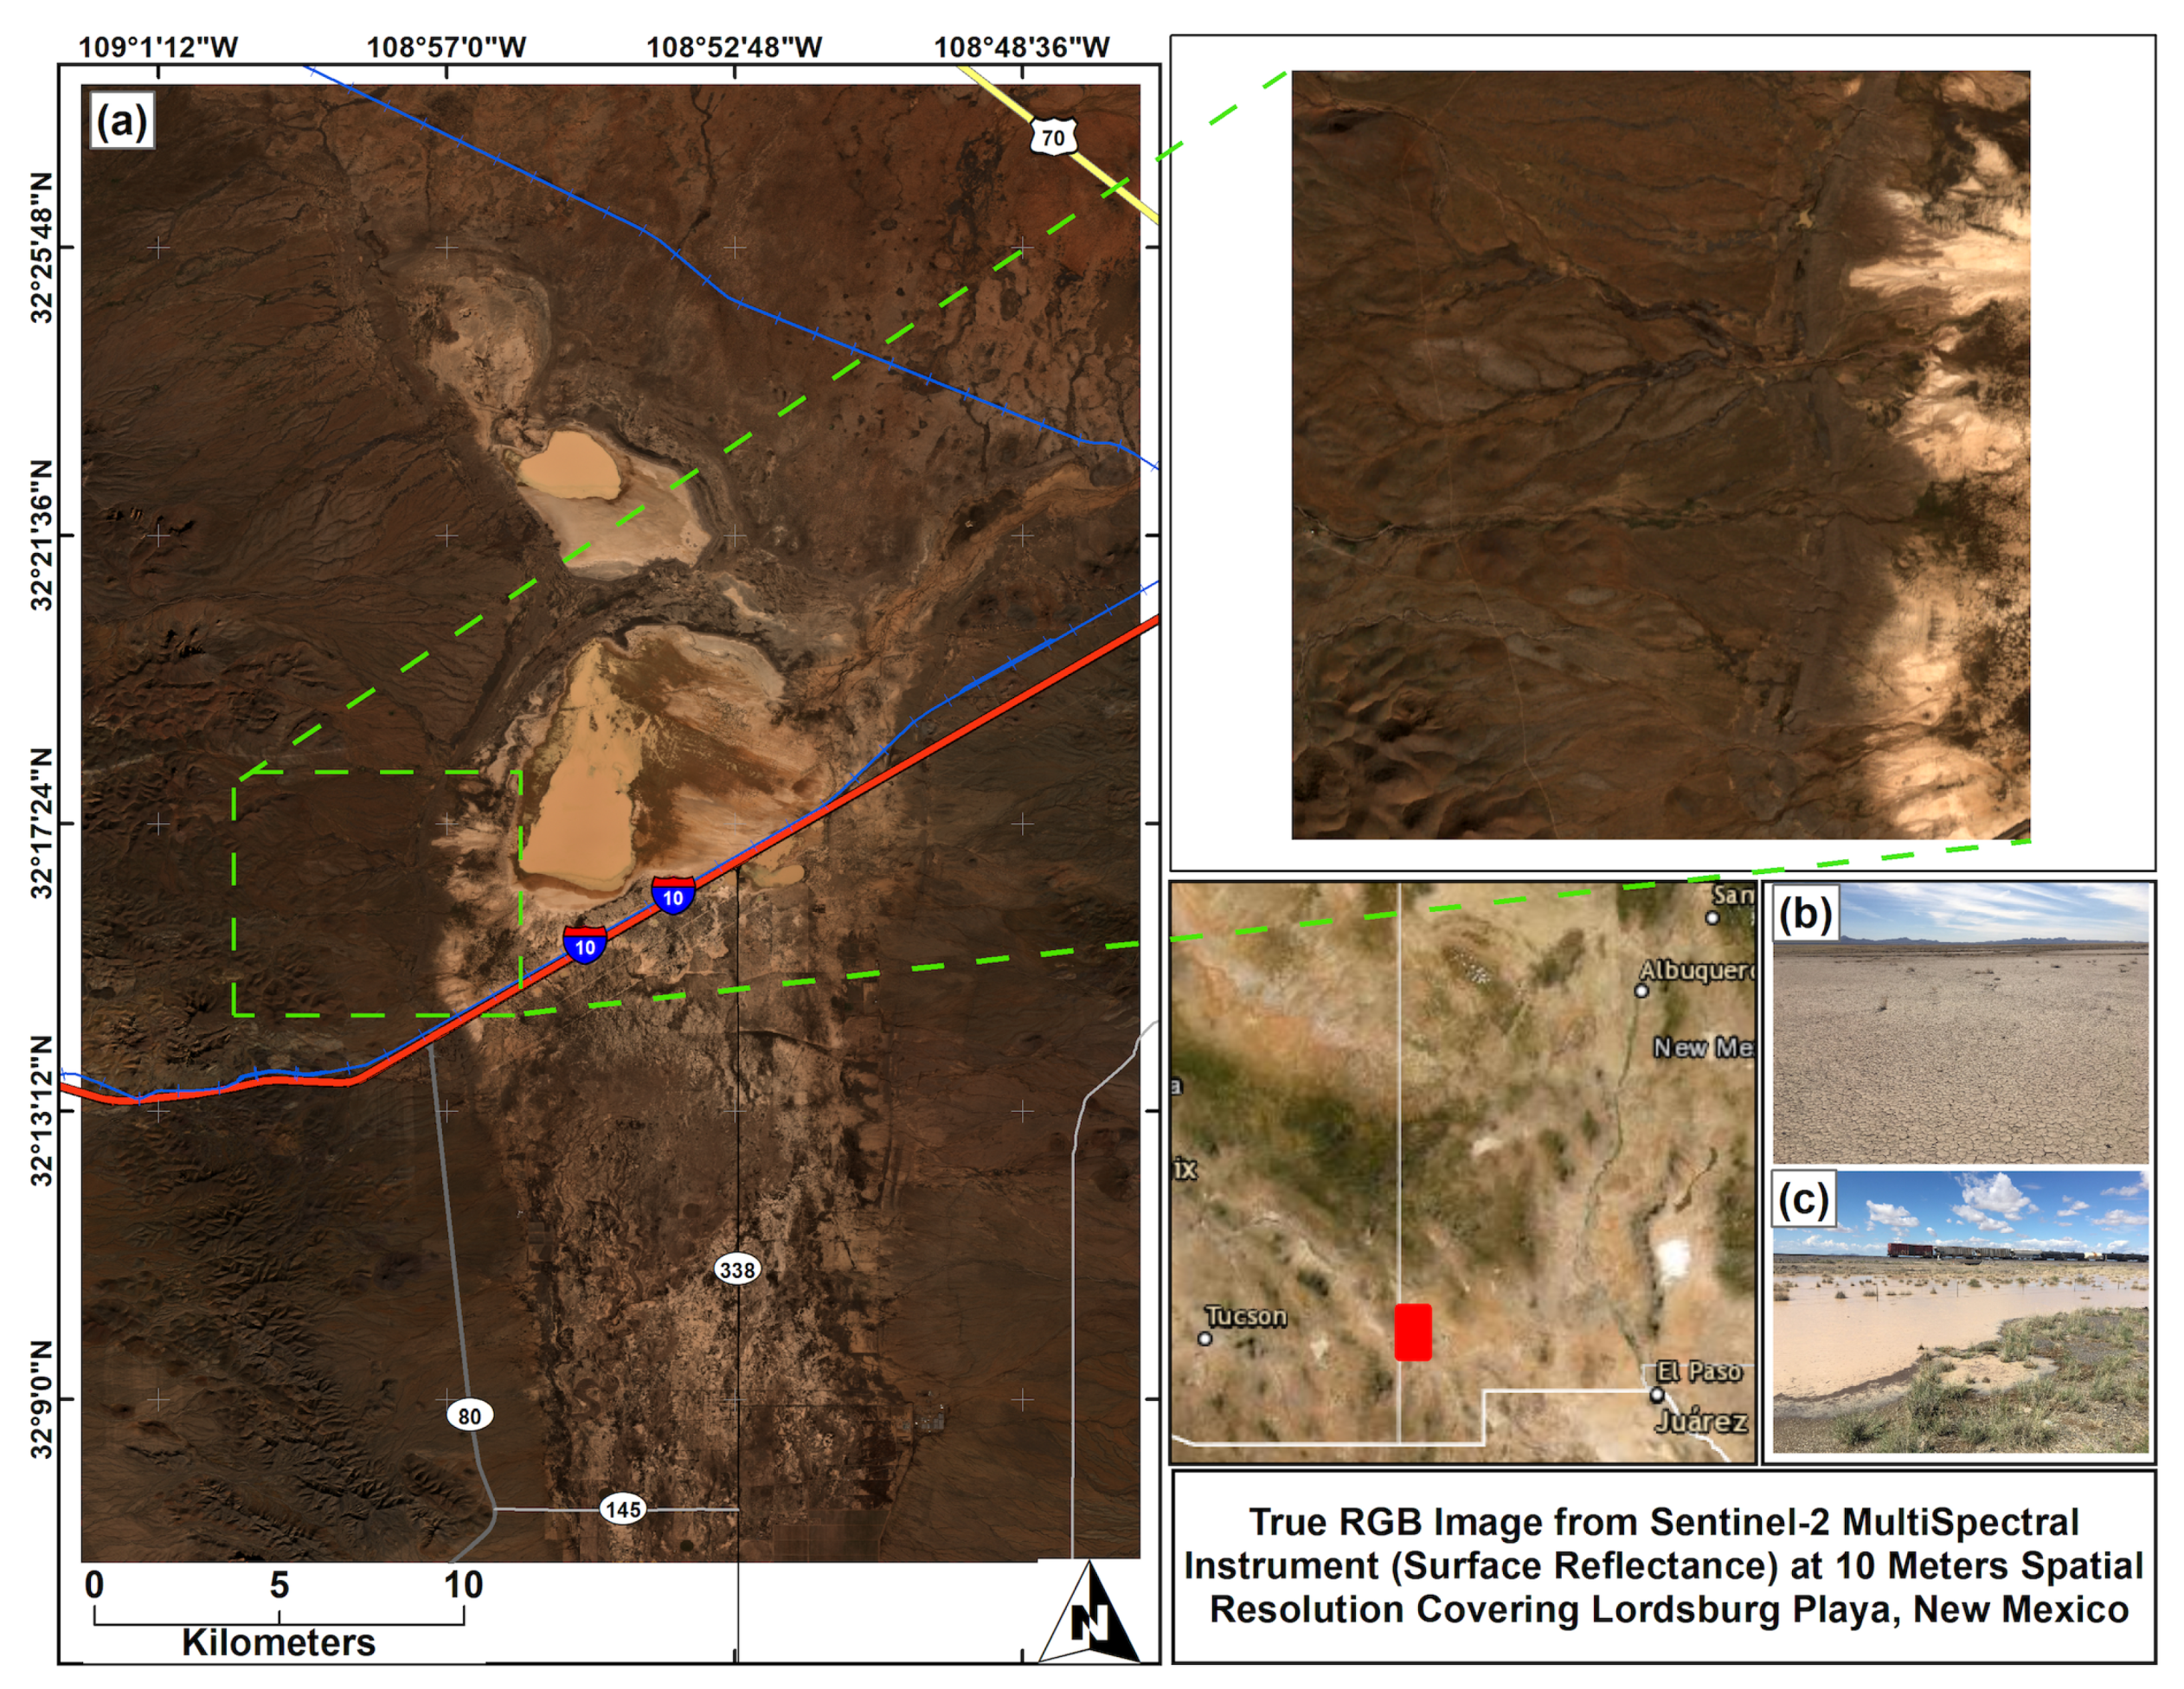
2. Study Area
3. Data
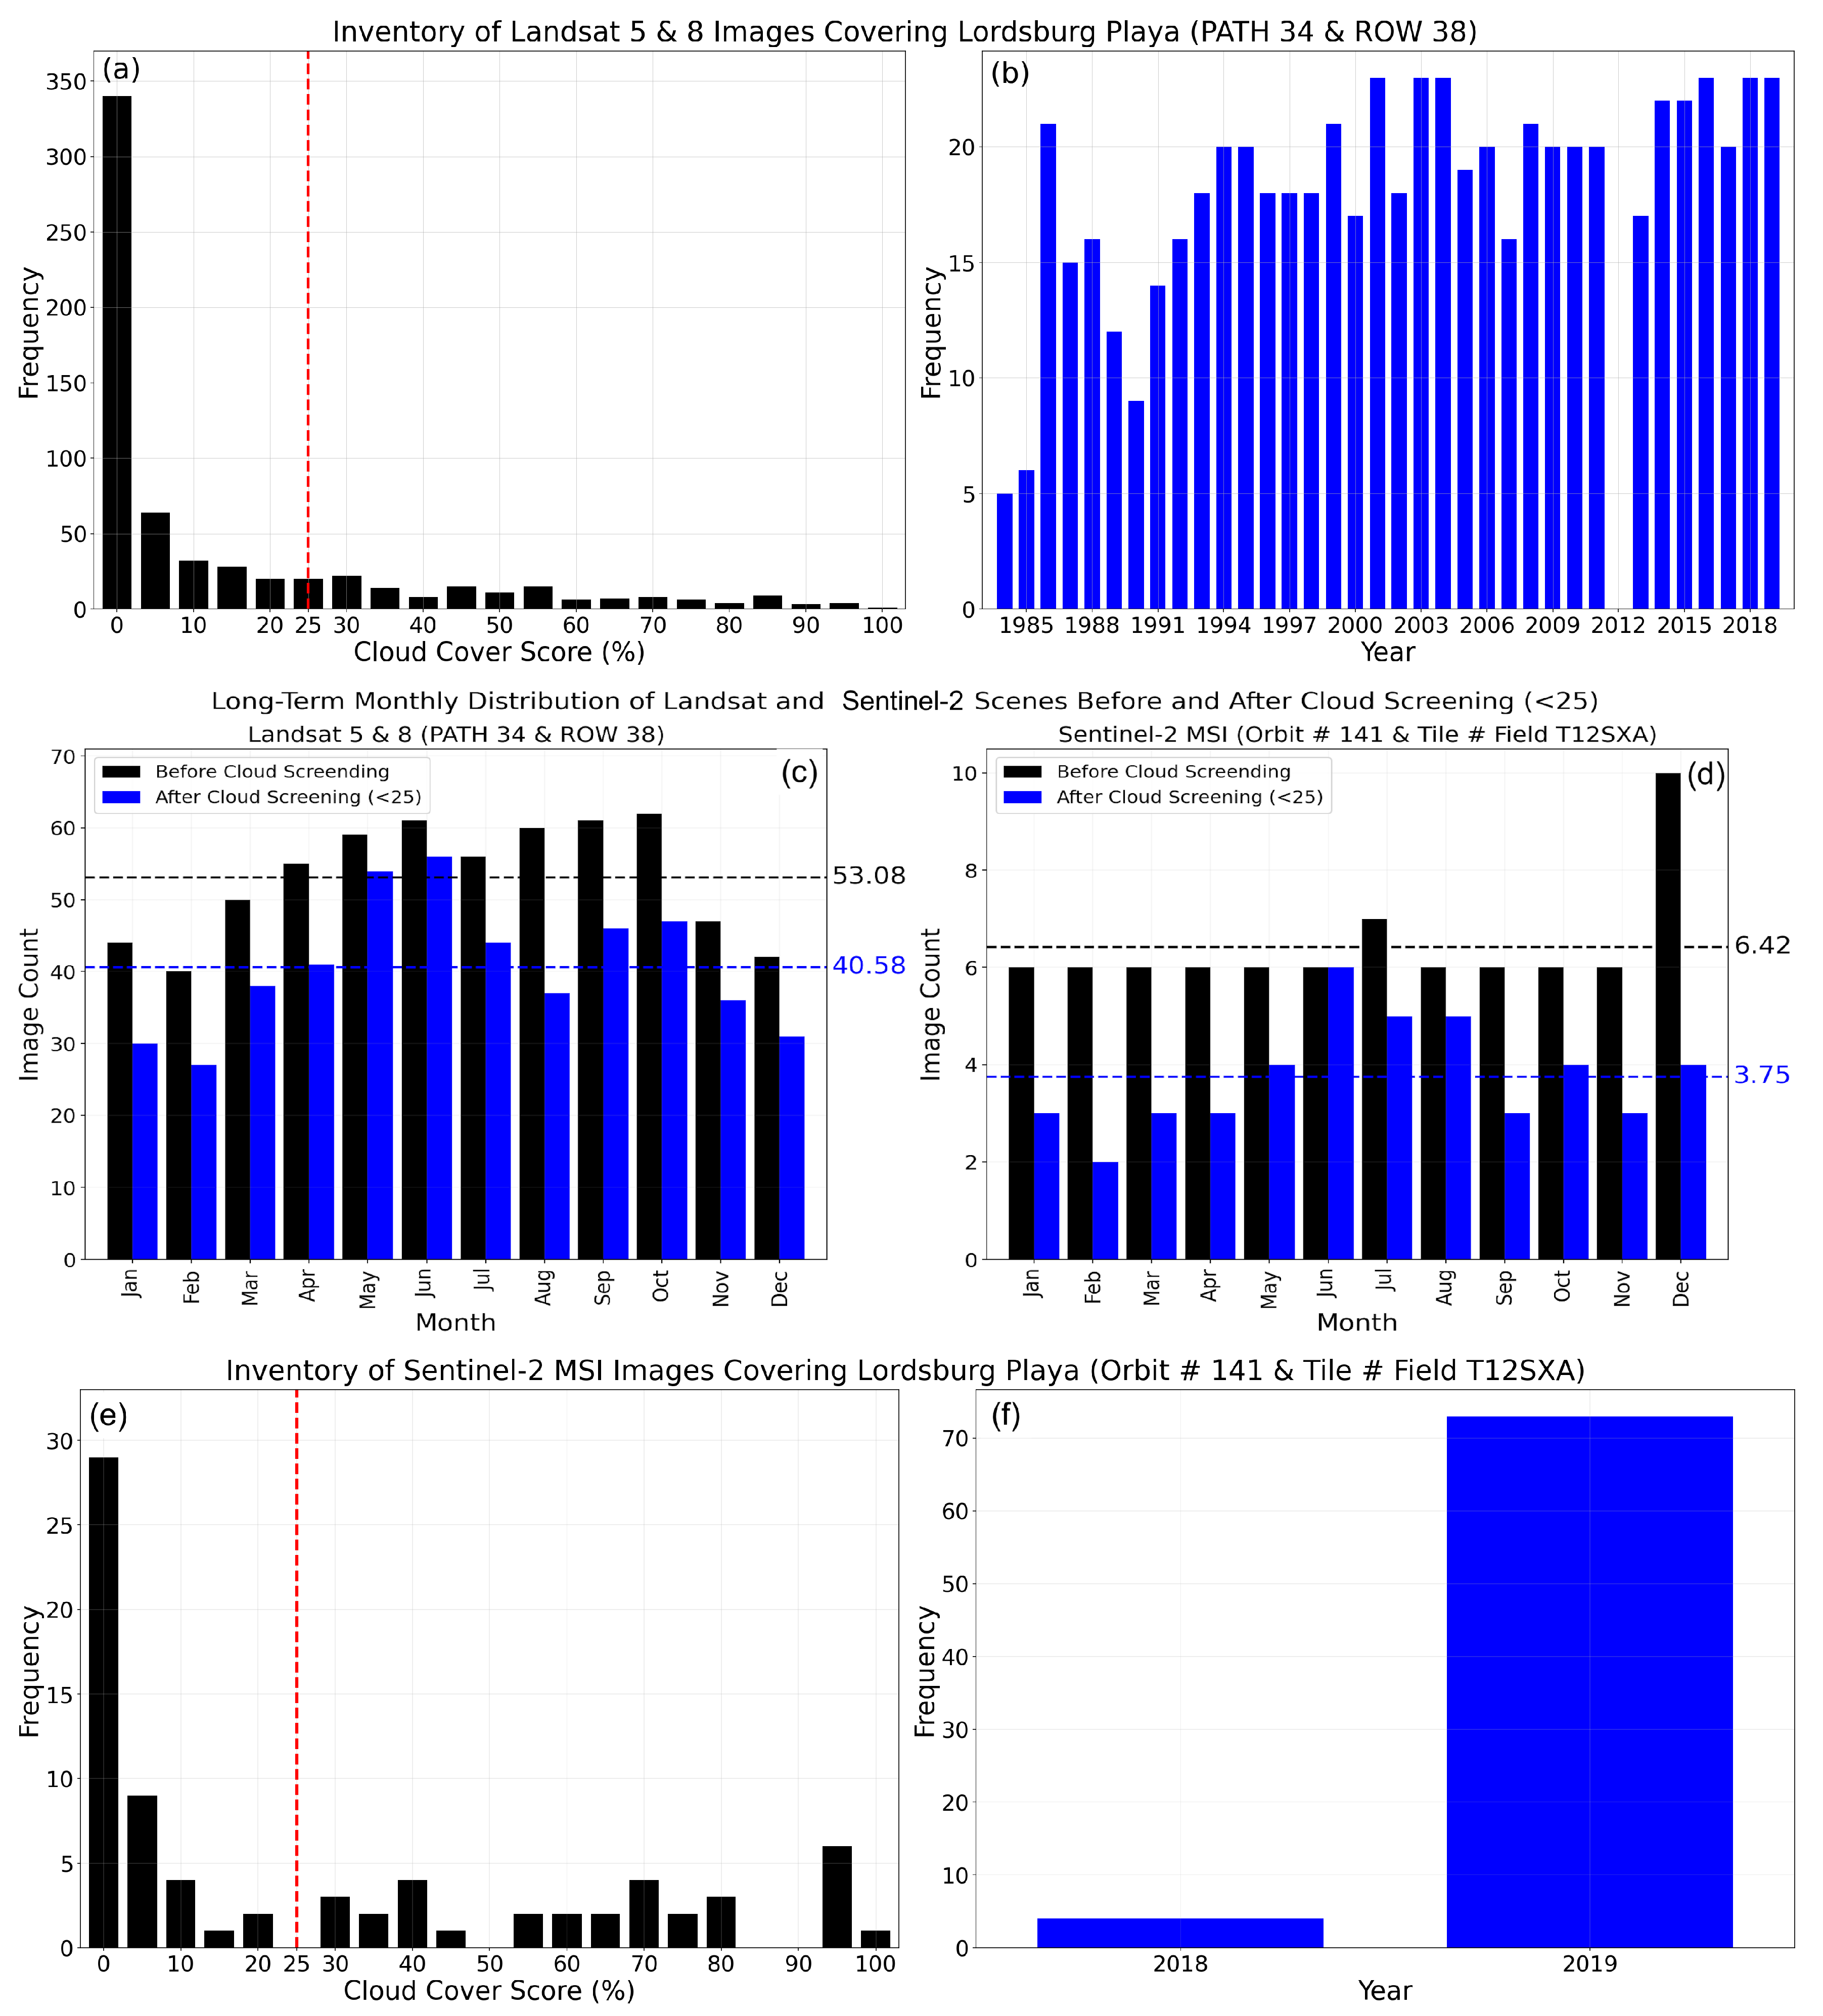
3.1. Optical Satellite Remote Sensing Imagery, Inventory, and Preprocessing
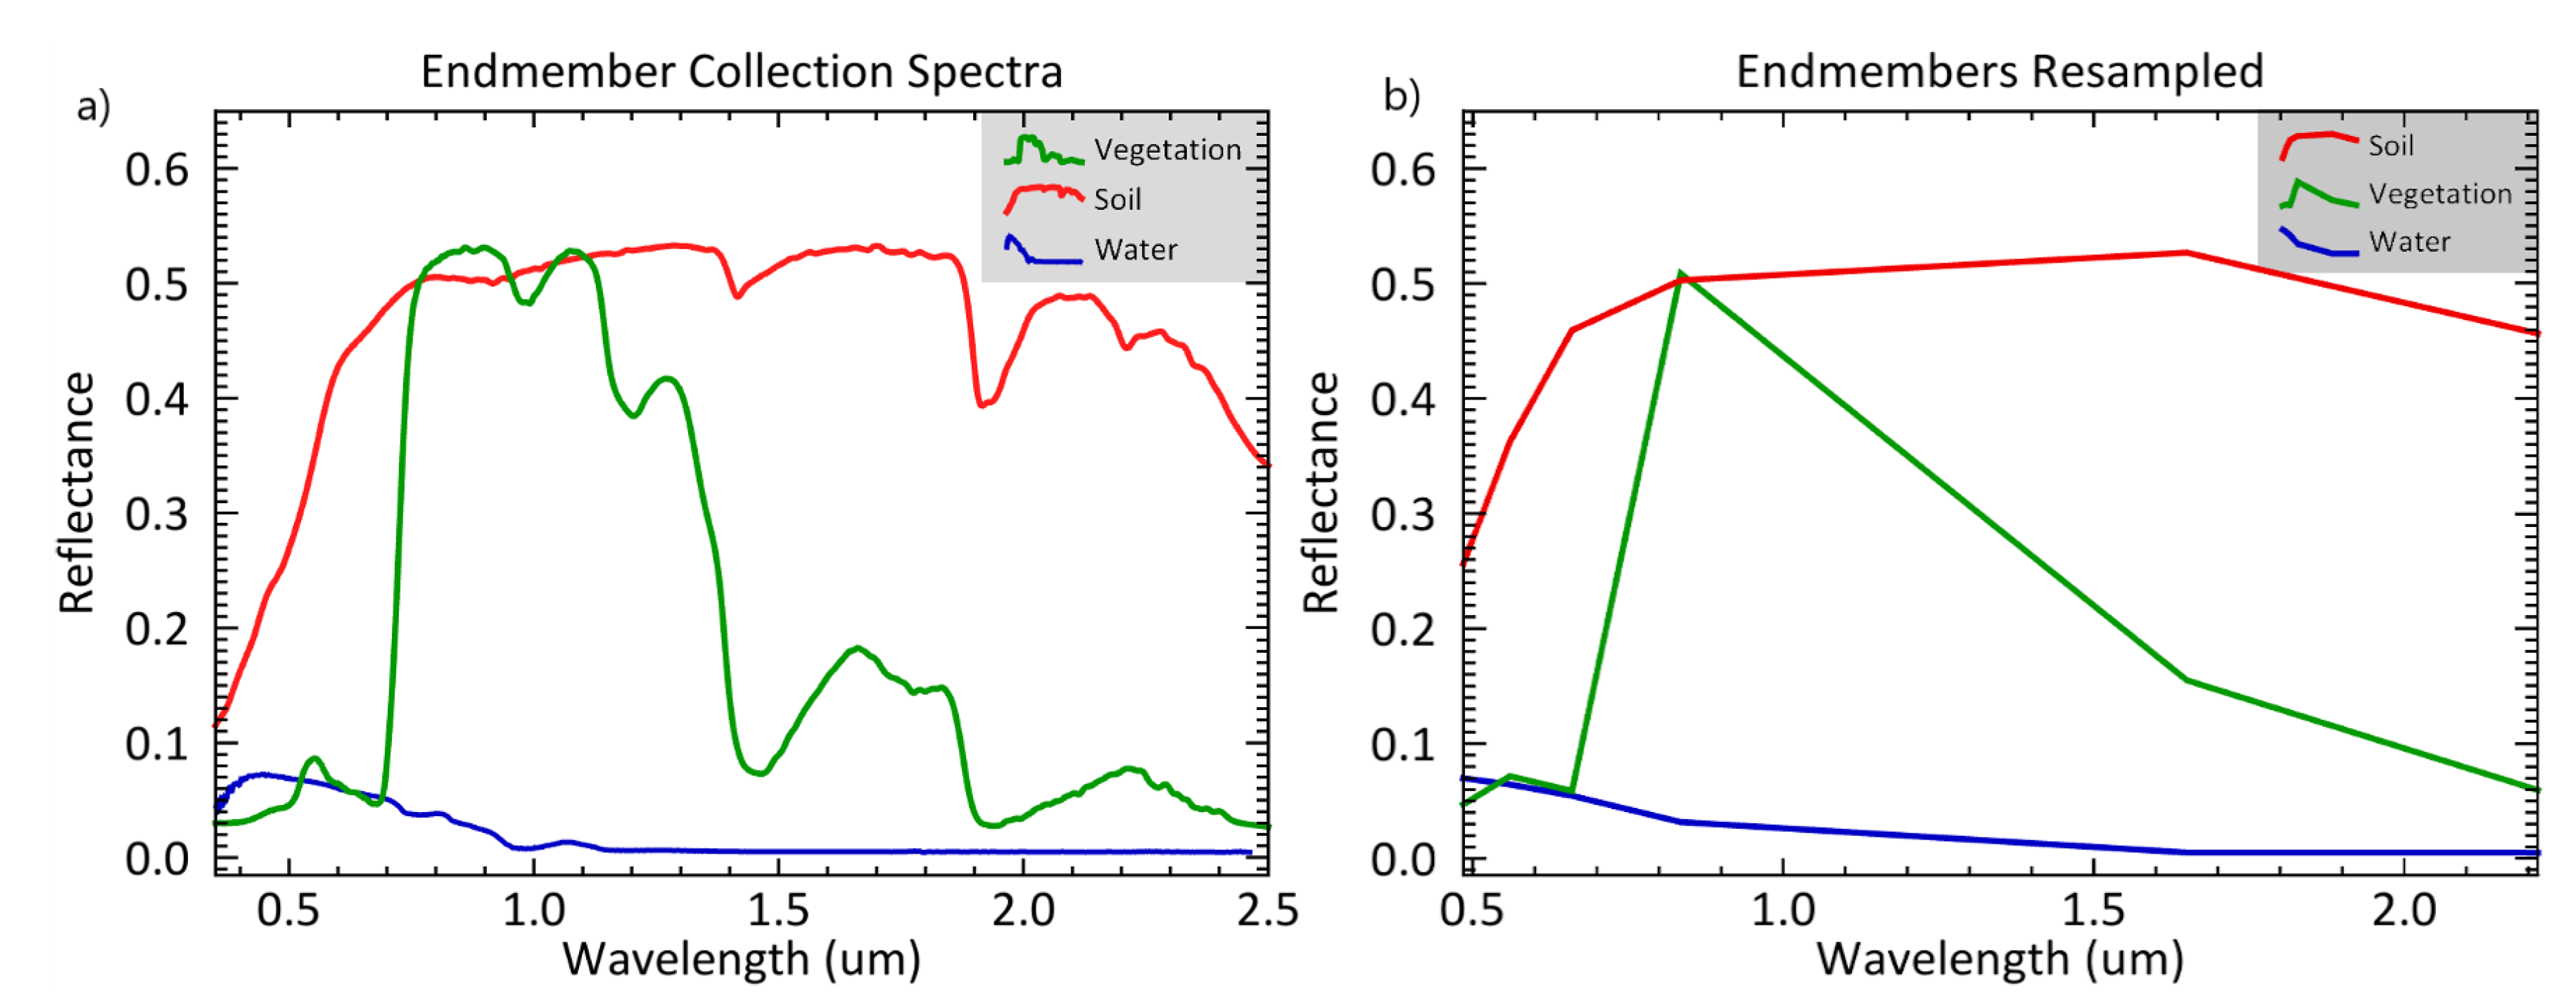
3.2. Spectral Signatures of Endmembers and Spectral Resampling
3.3. Radar Satellite Remote Sensing Imagery and Preprocessing
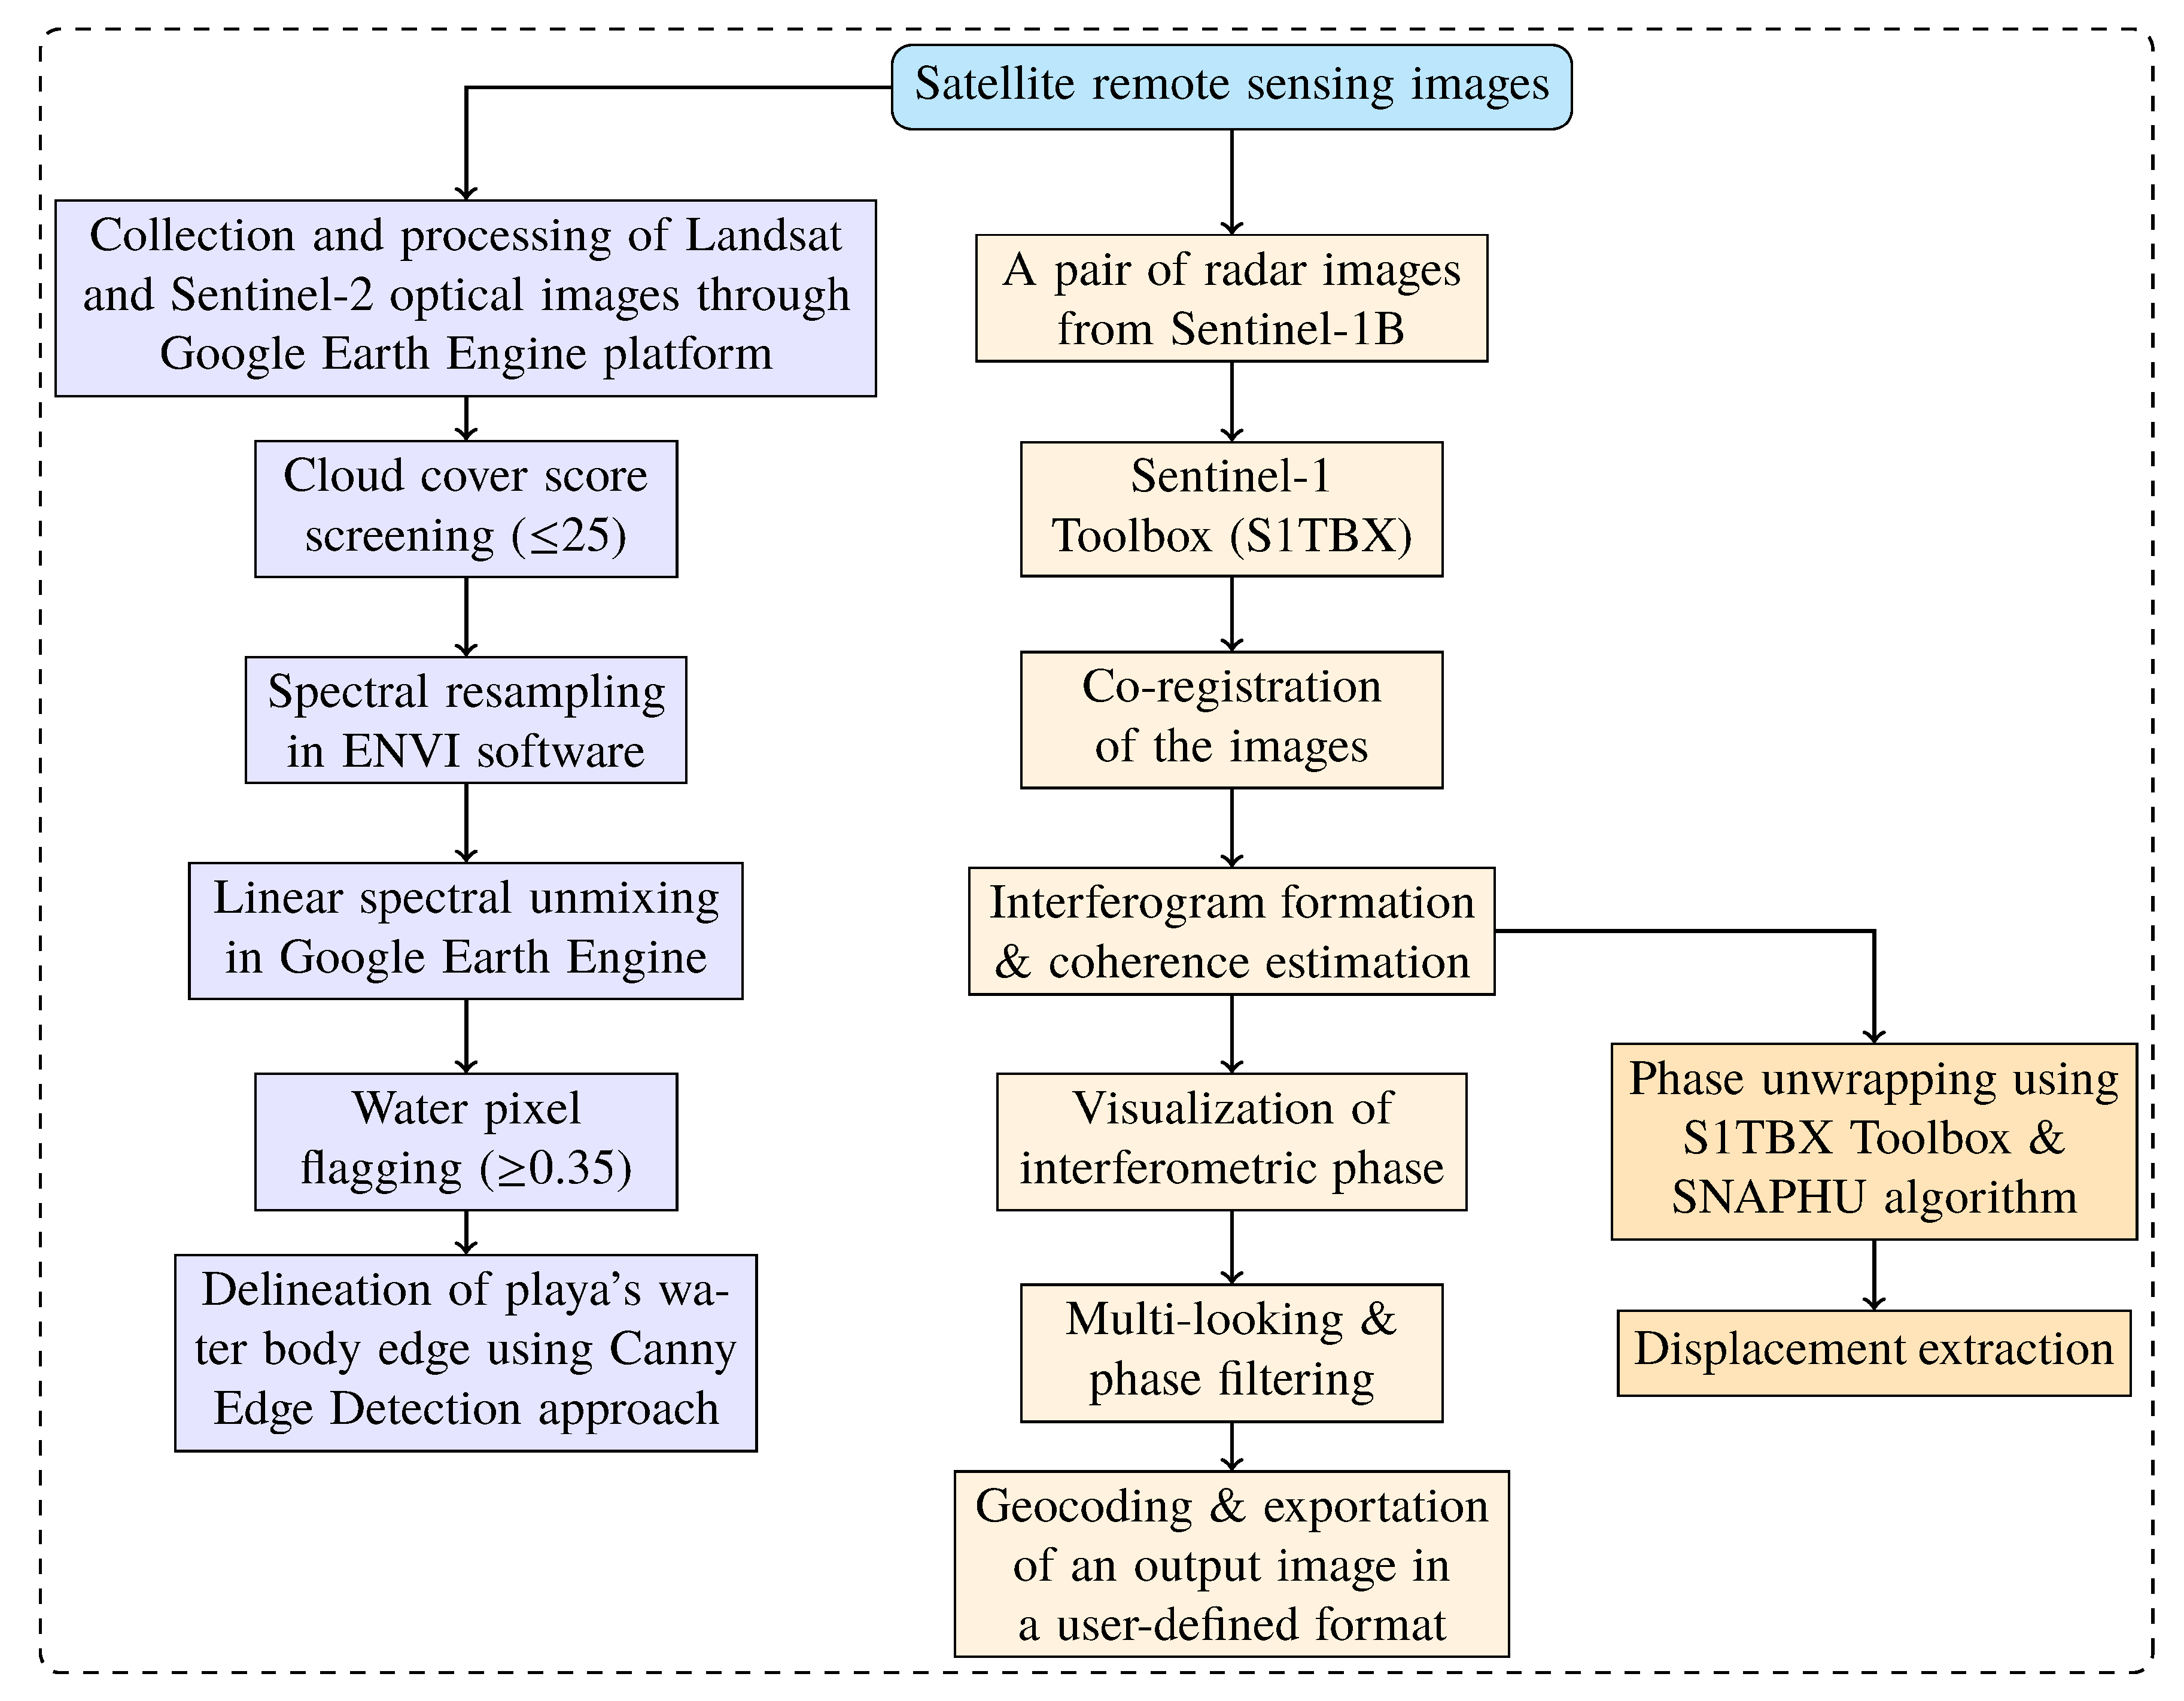
4. Methods
4.1. Linear Spectral Unmixing, Water Pixel Flagging, and Edge Detection
4.2. Deformation and Displacement Estimation
5. Results
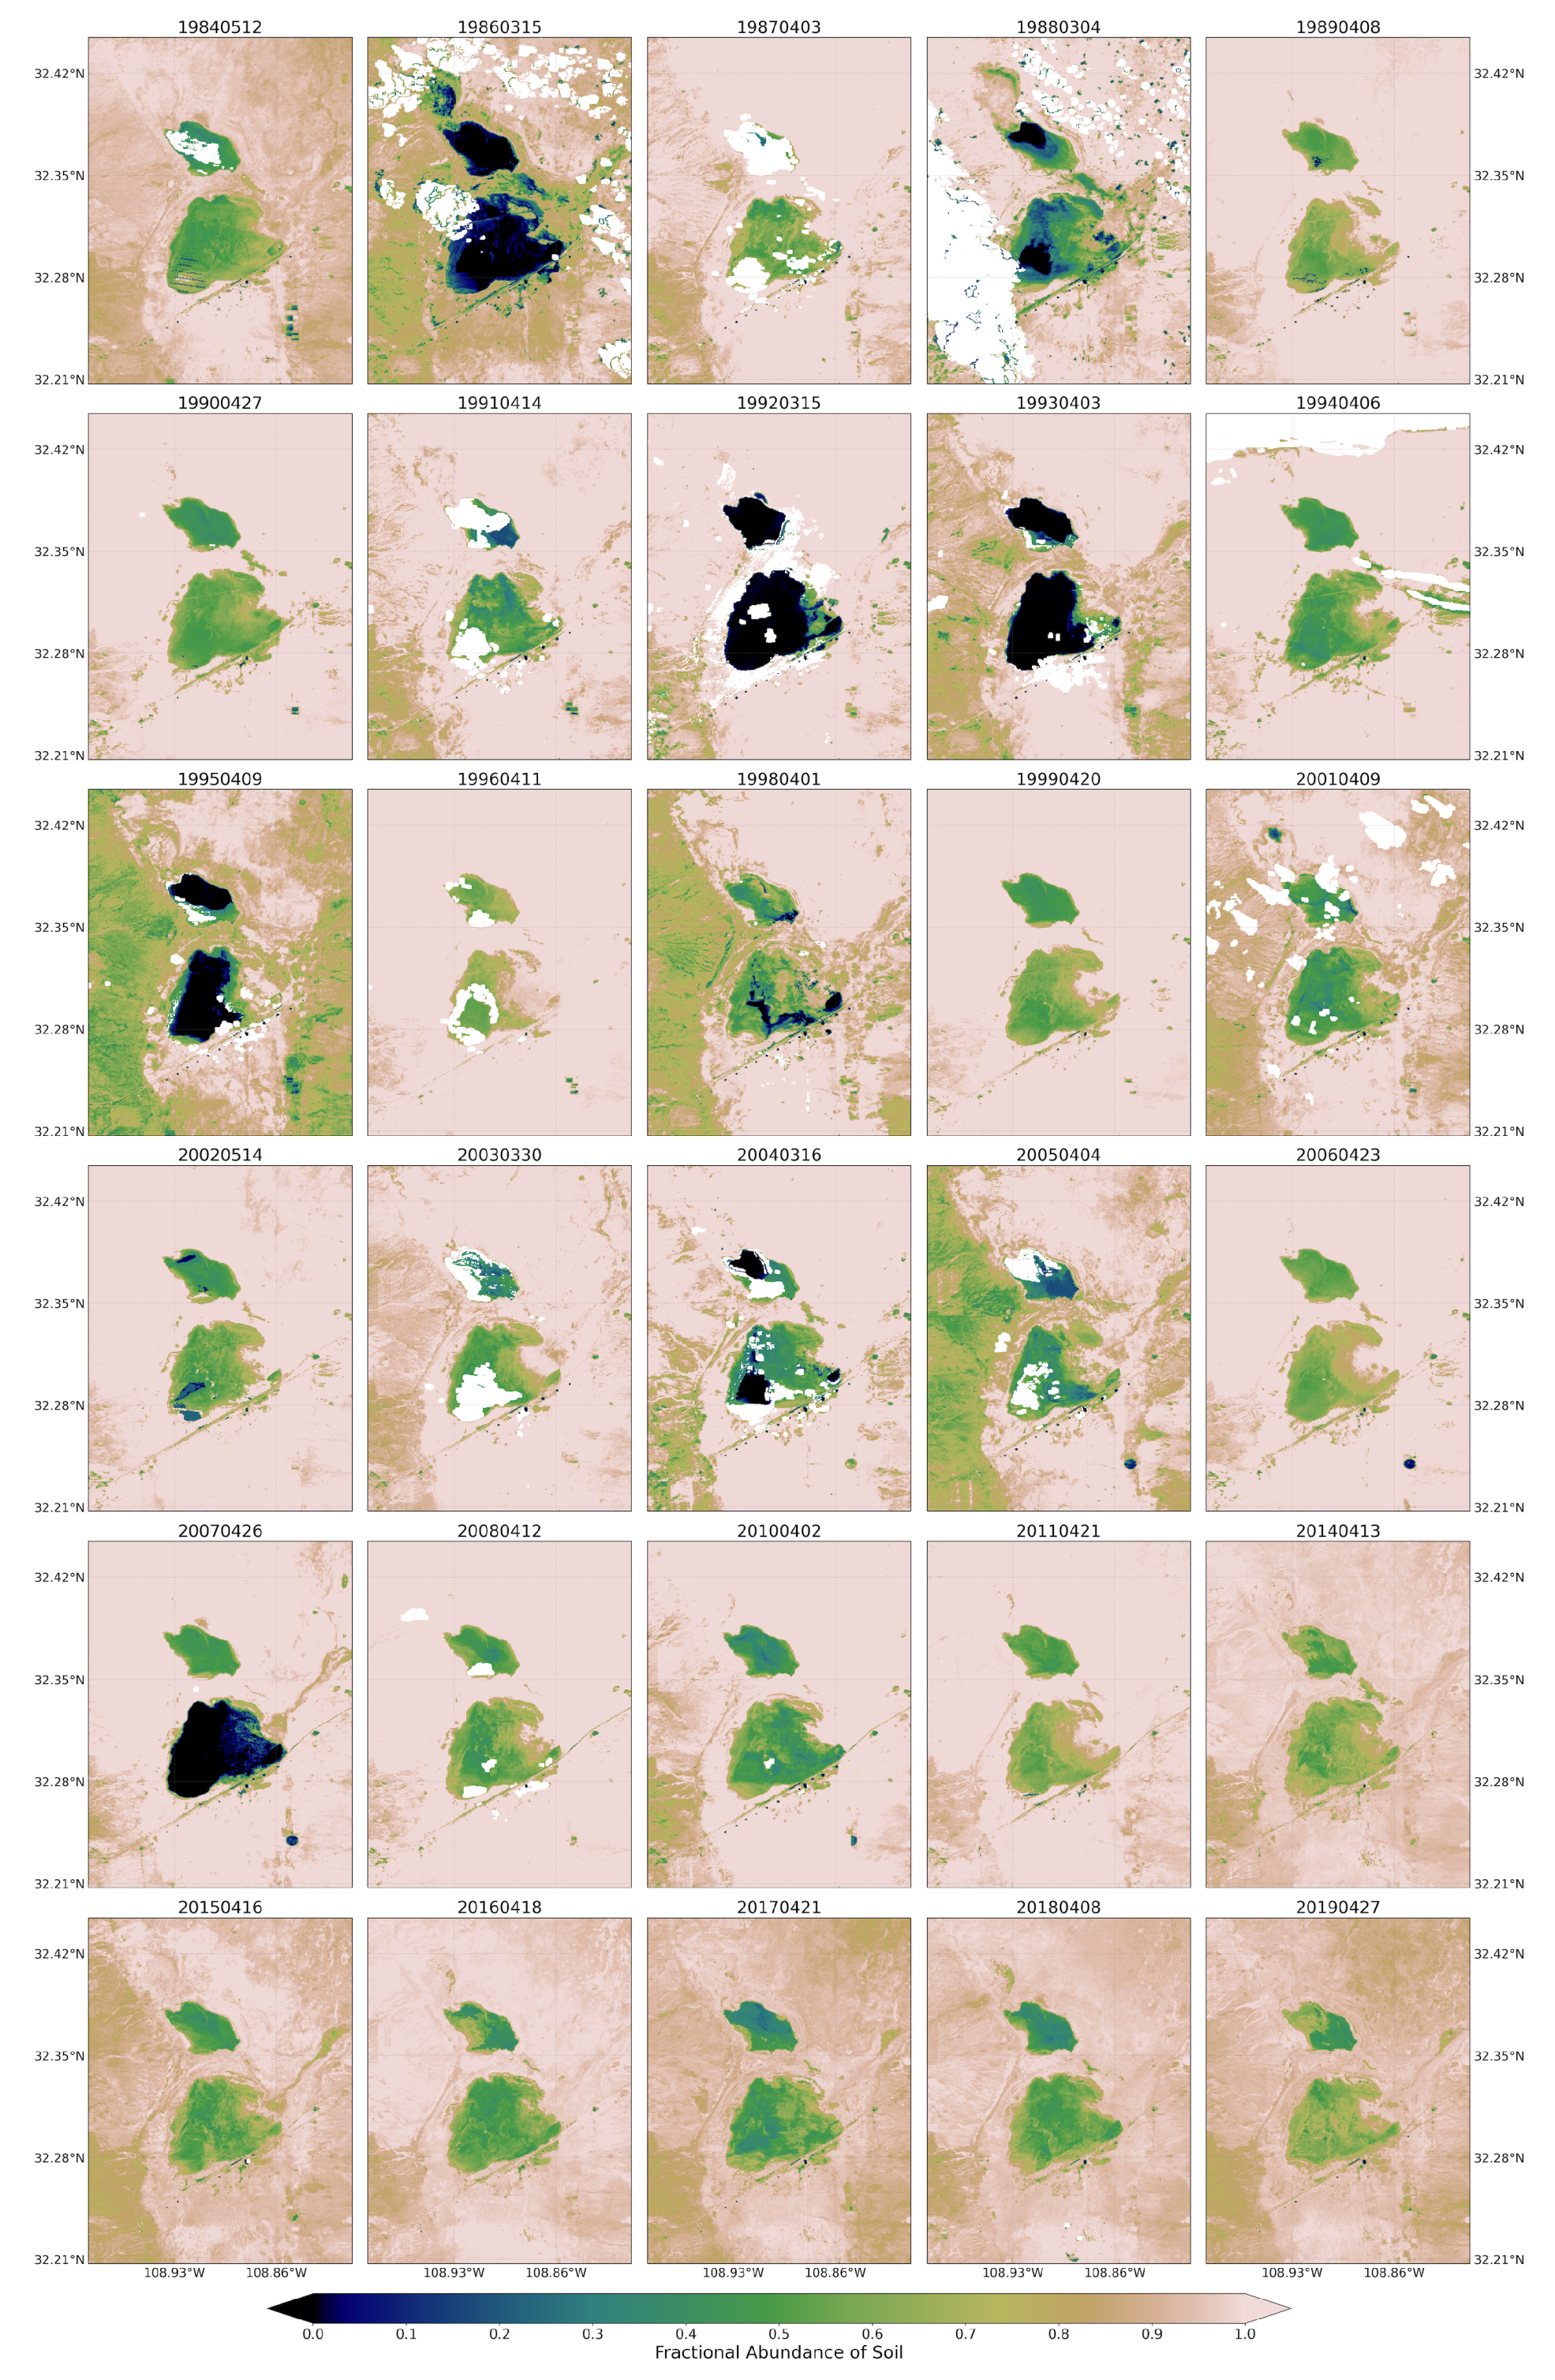
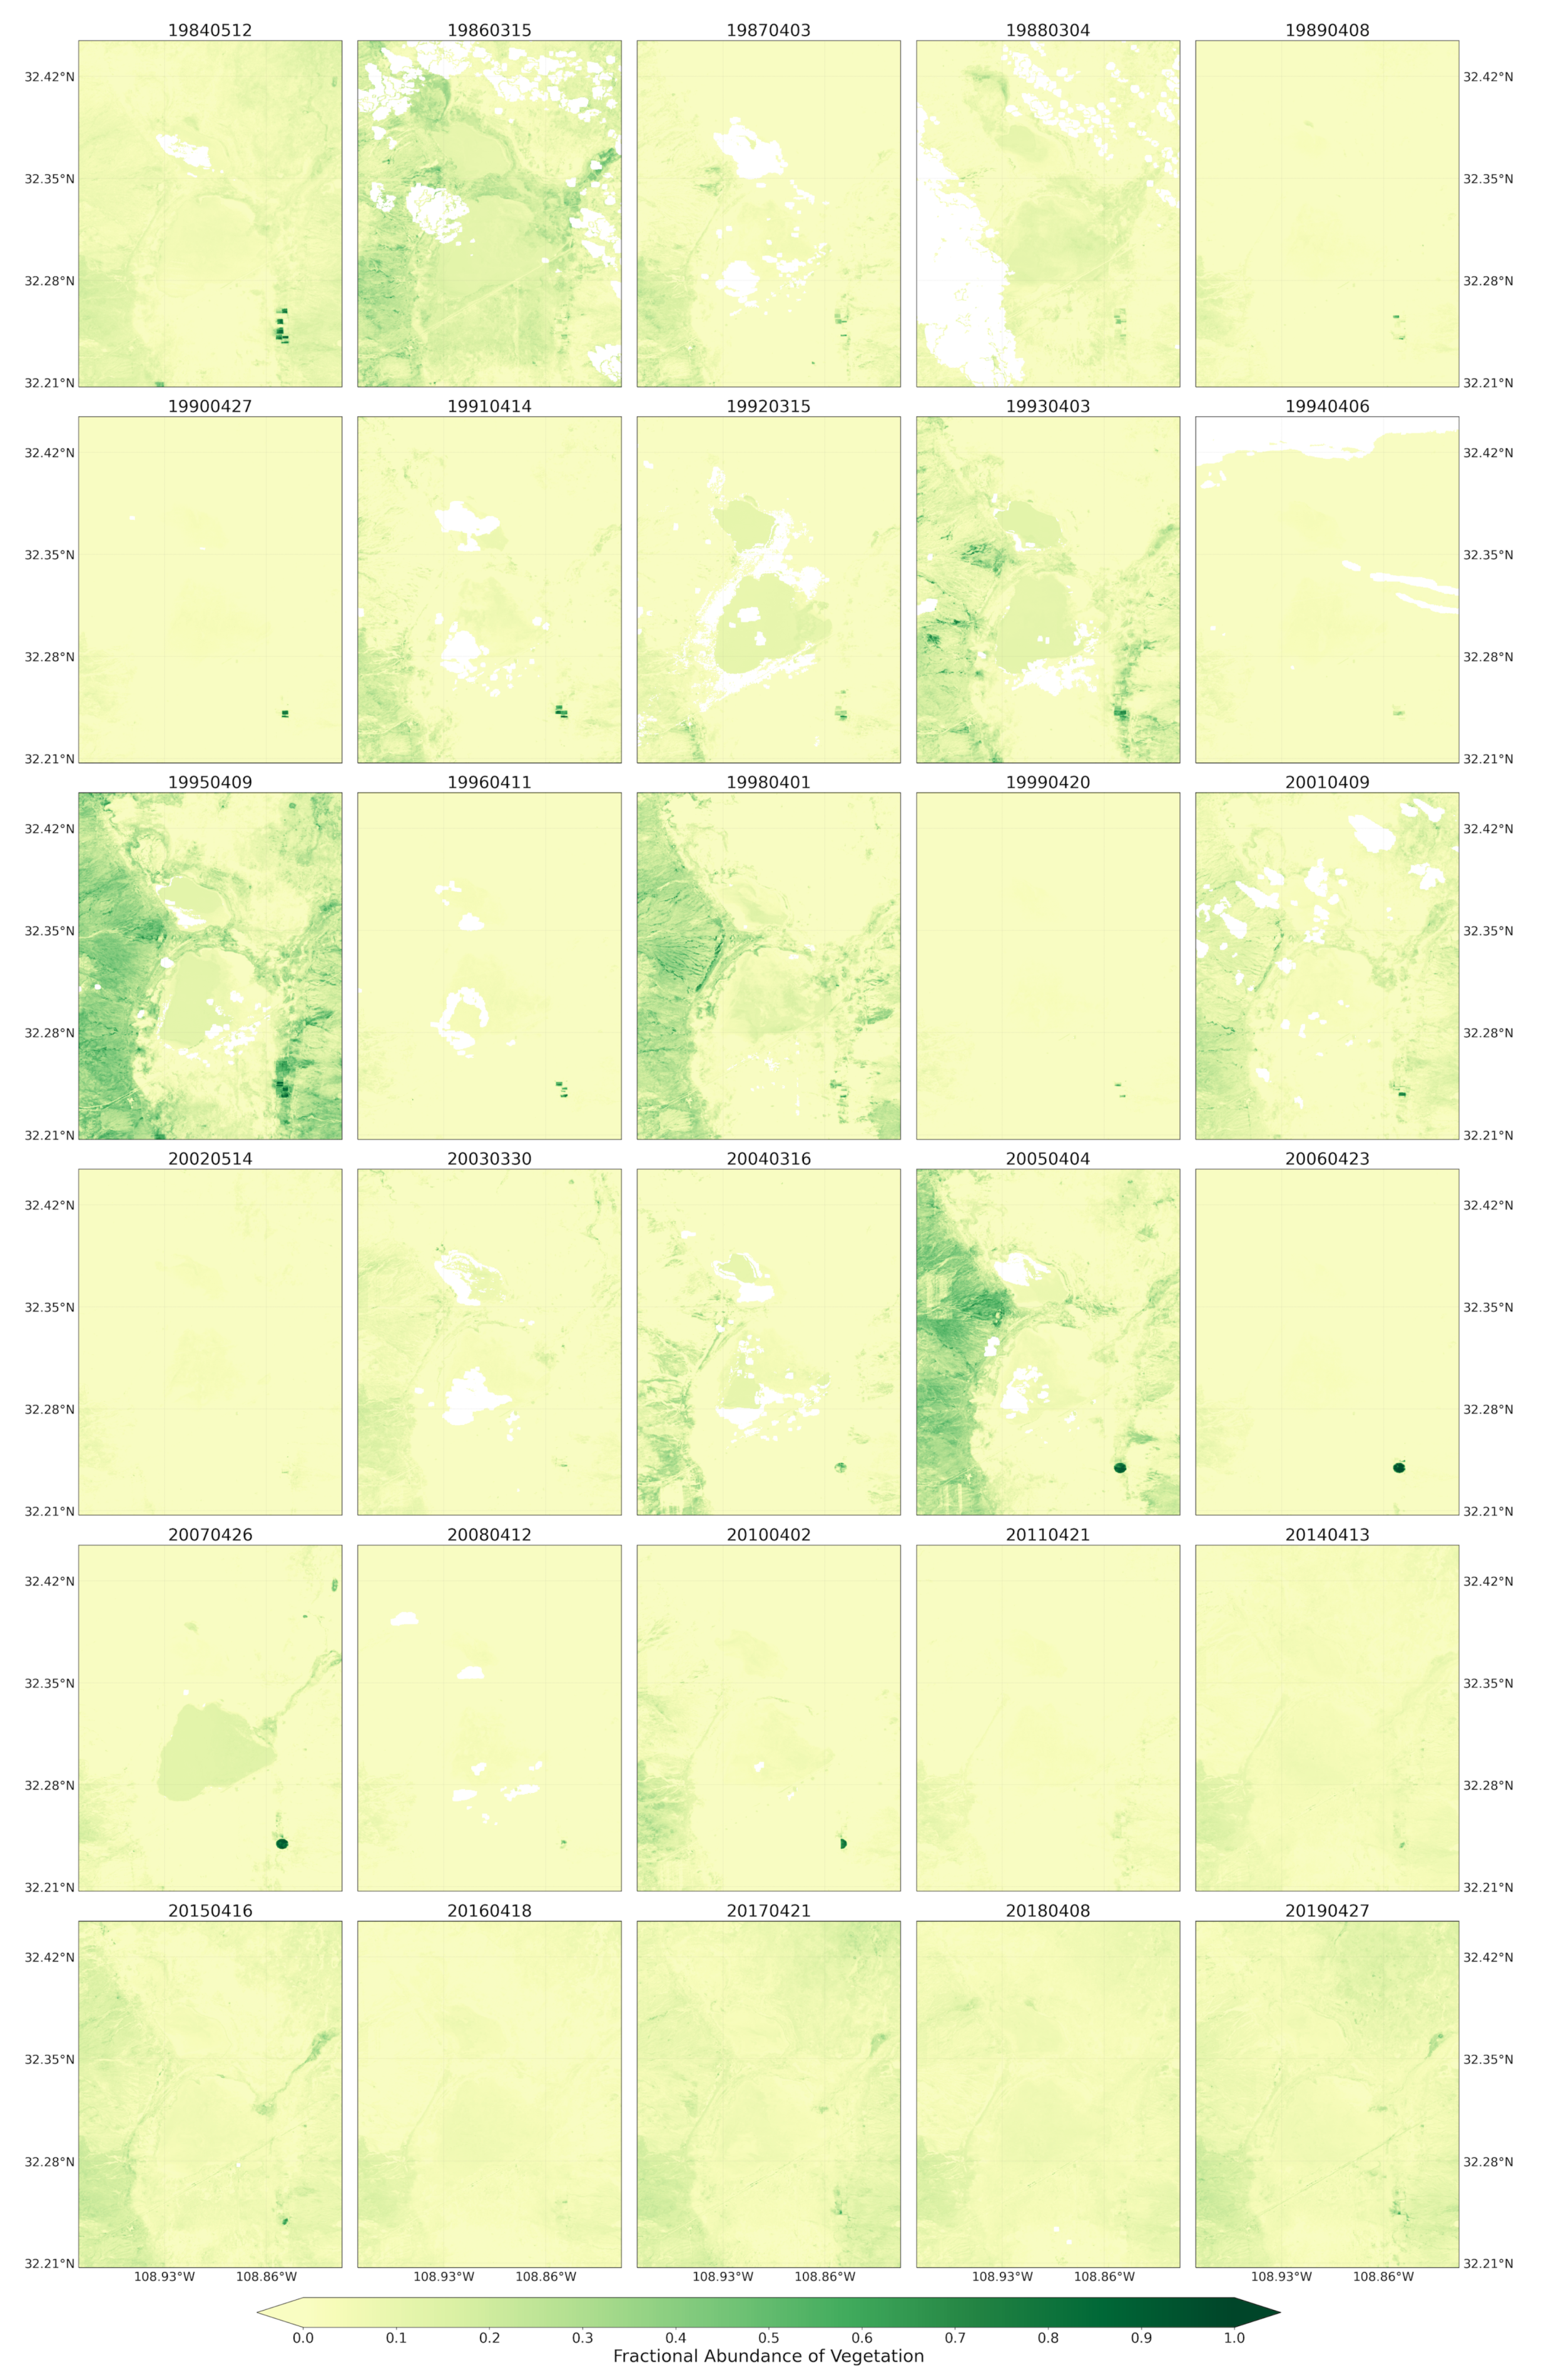
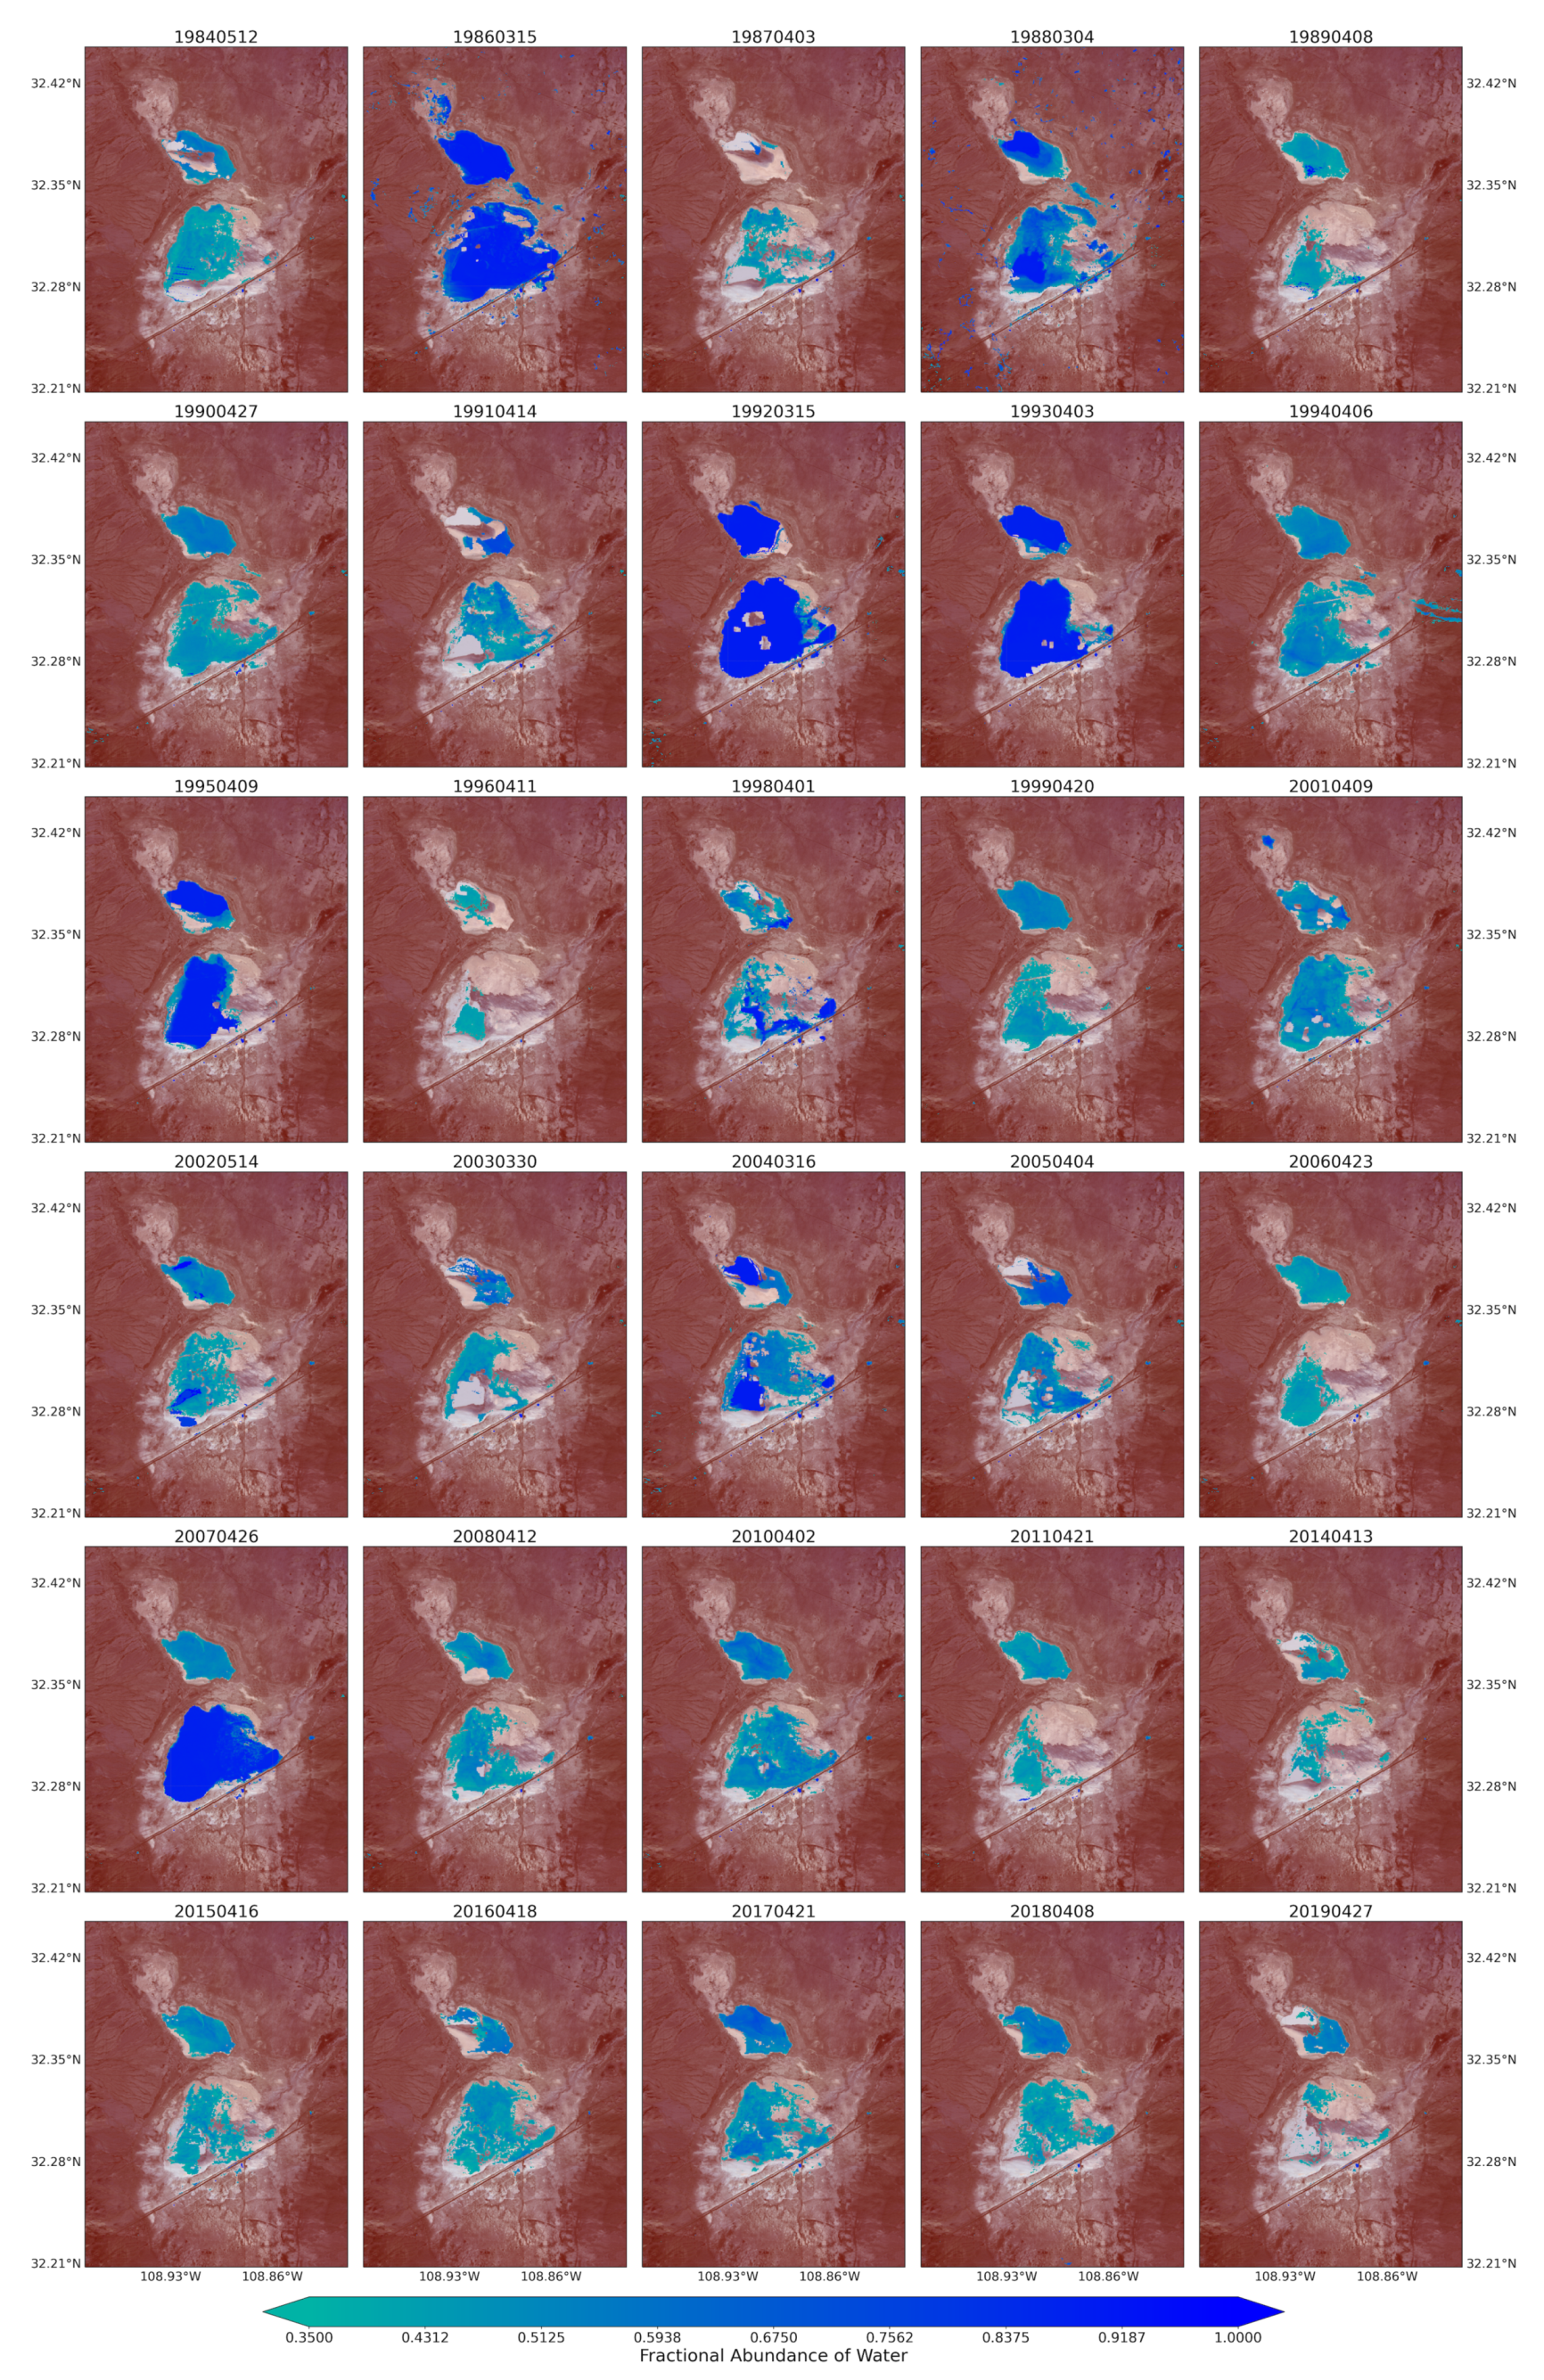
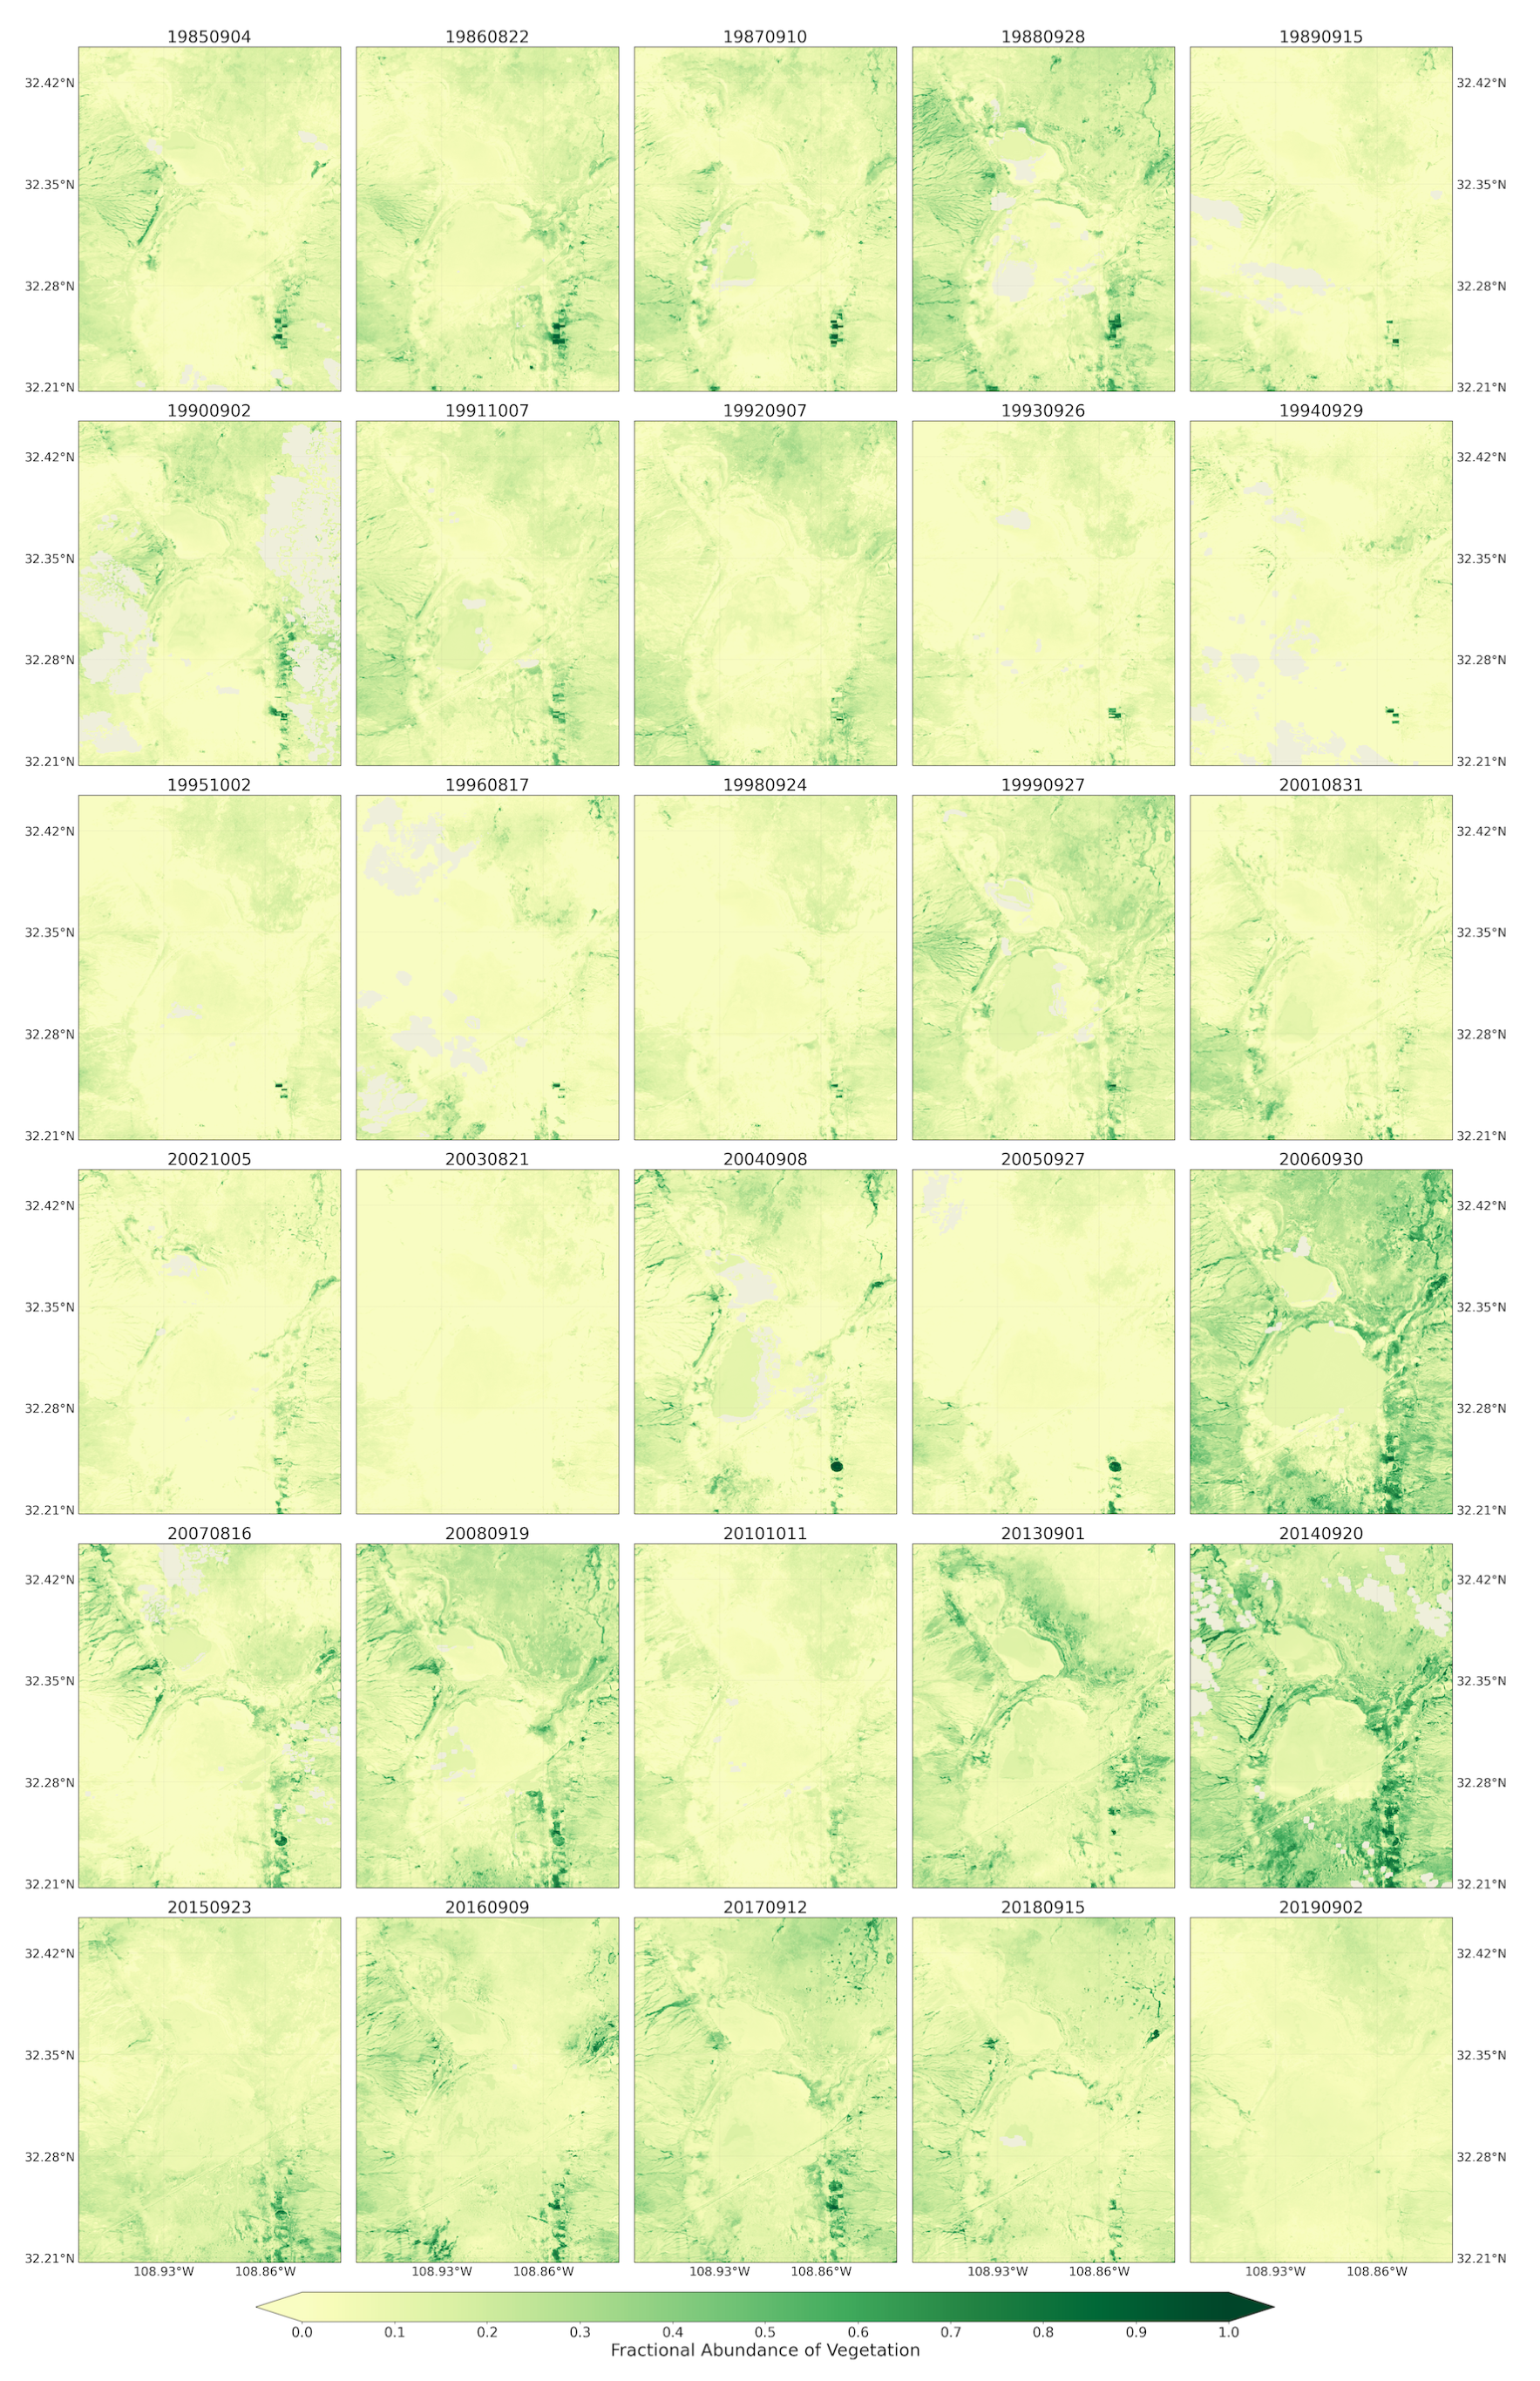
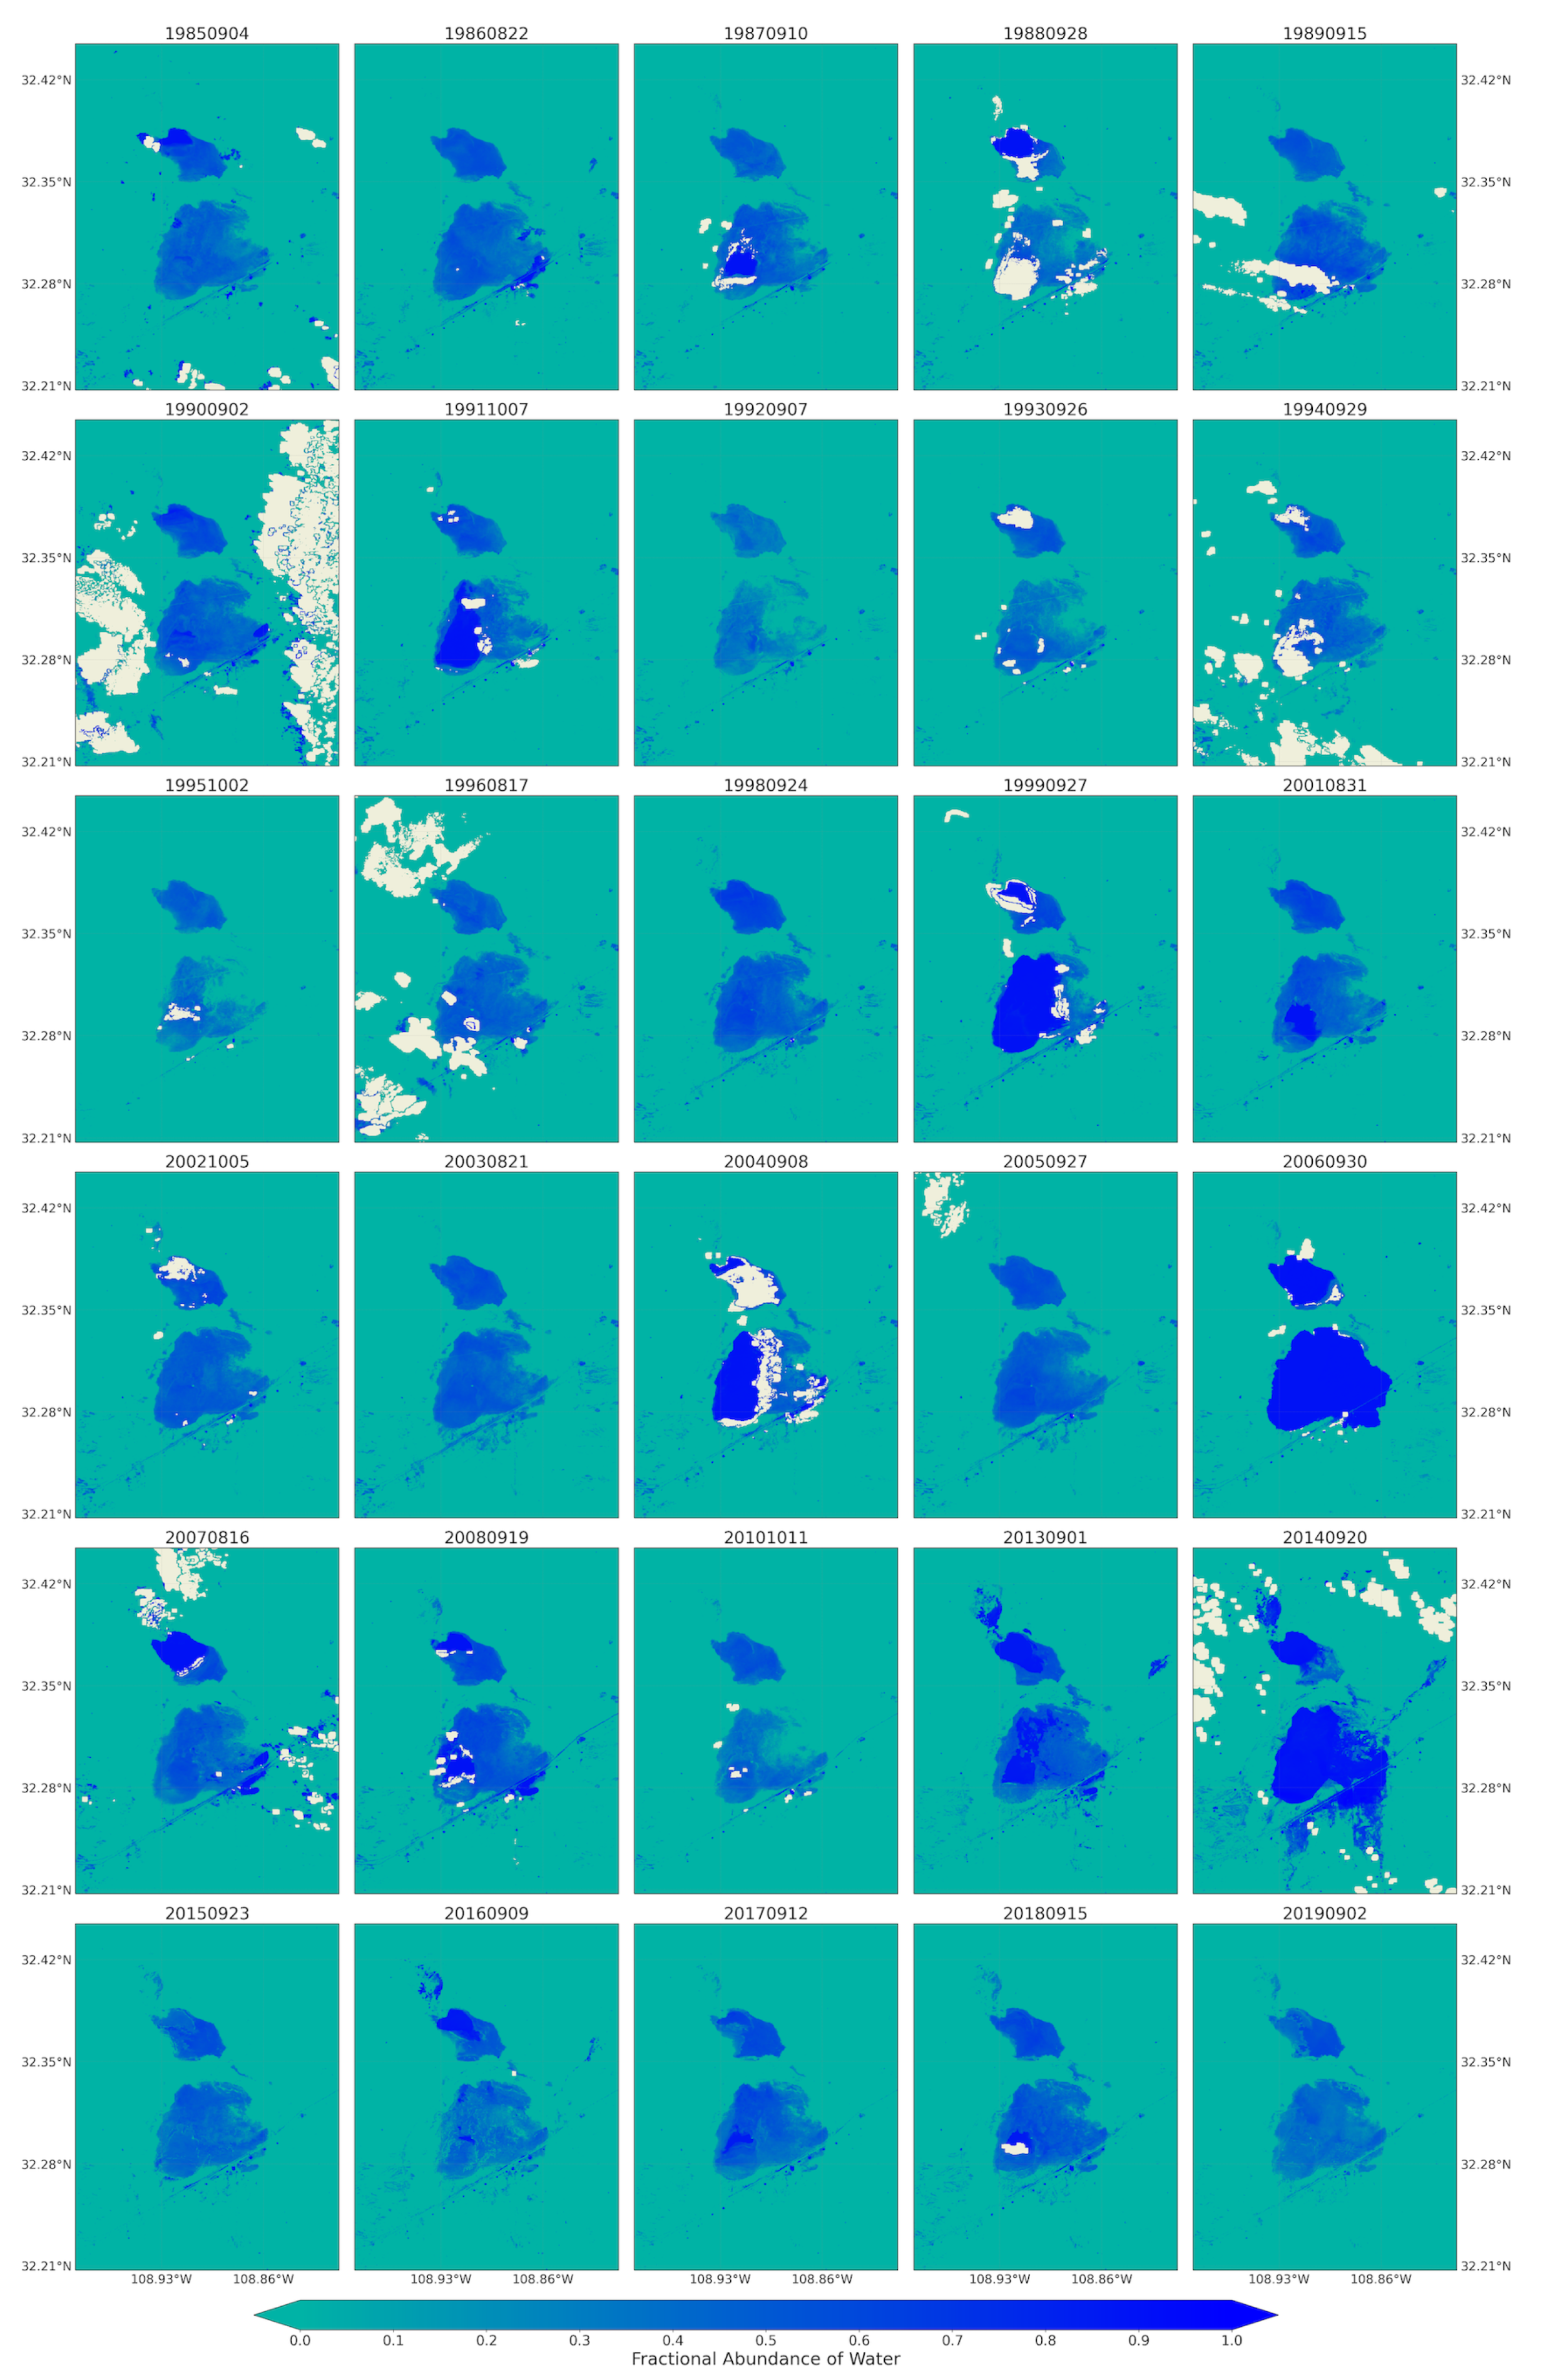
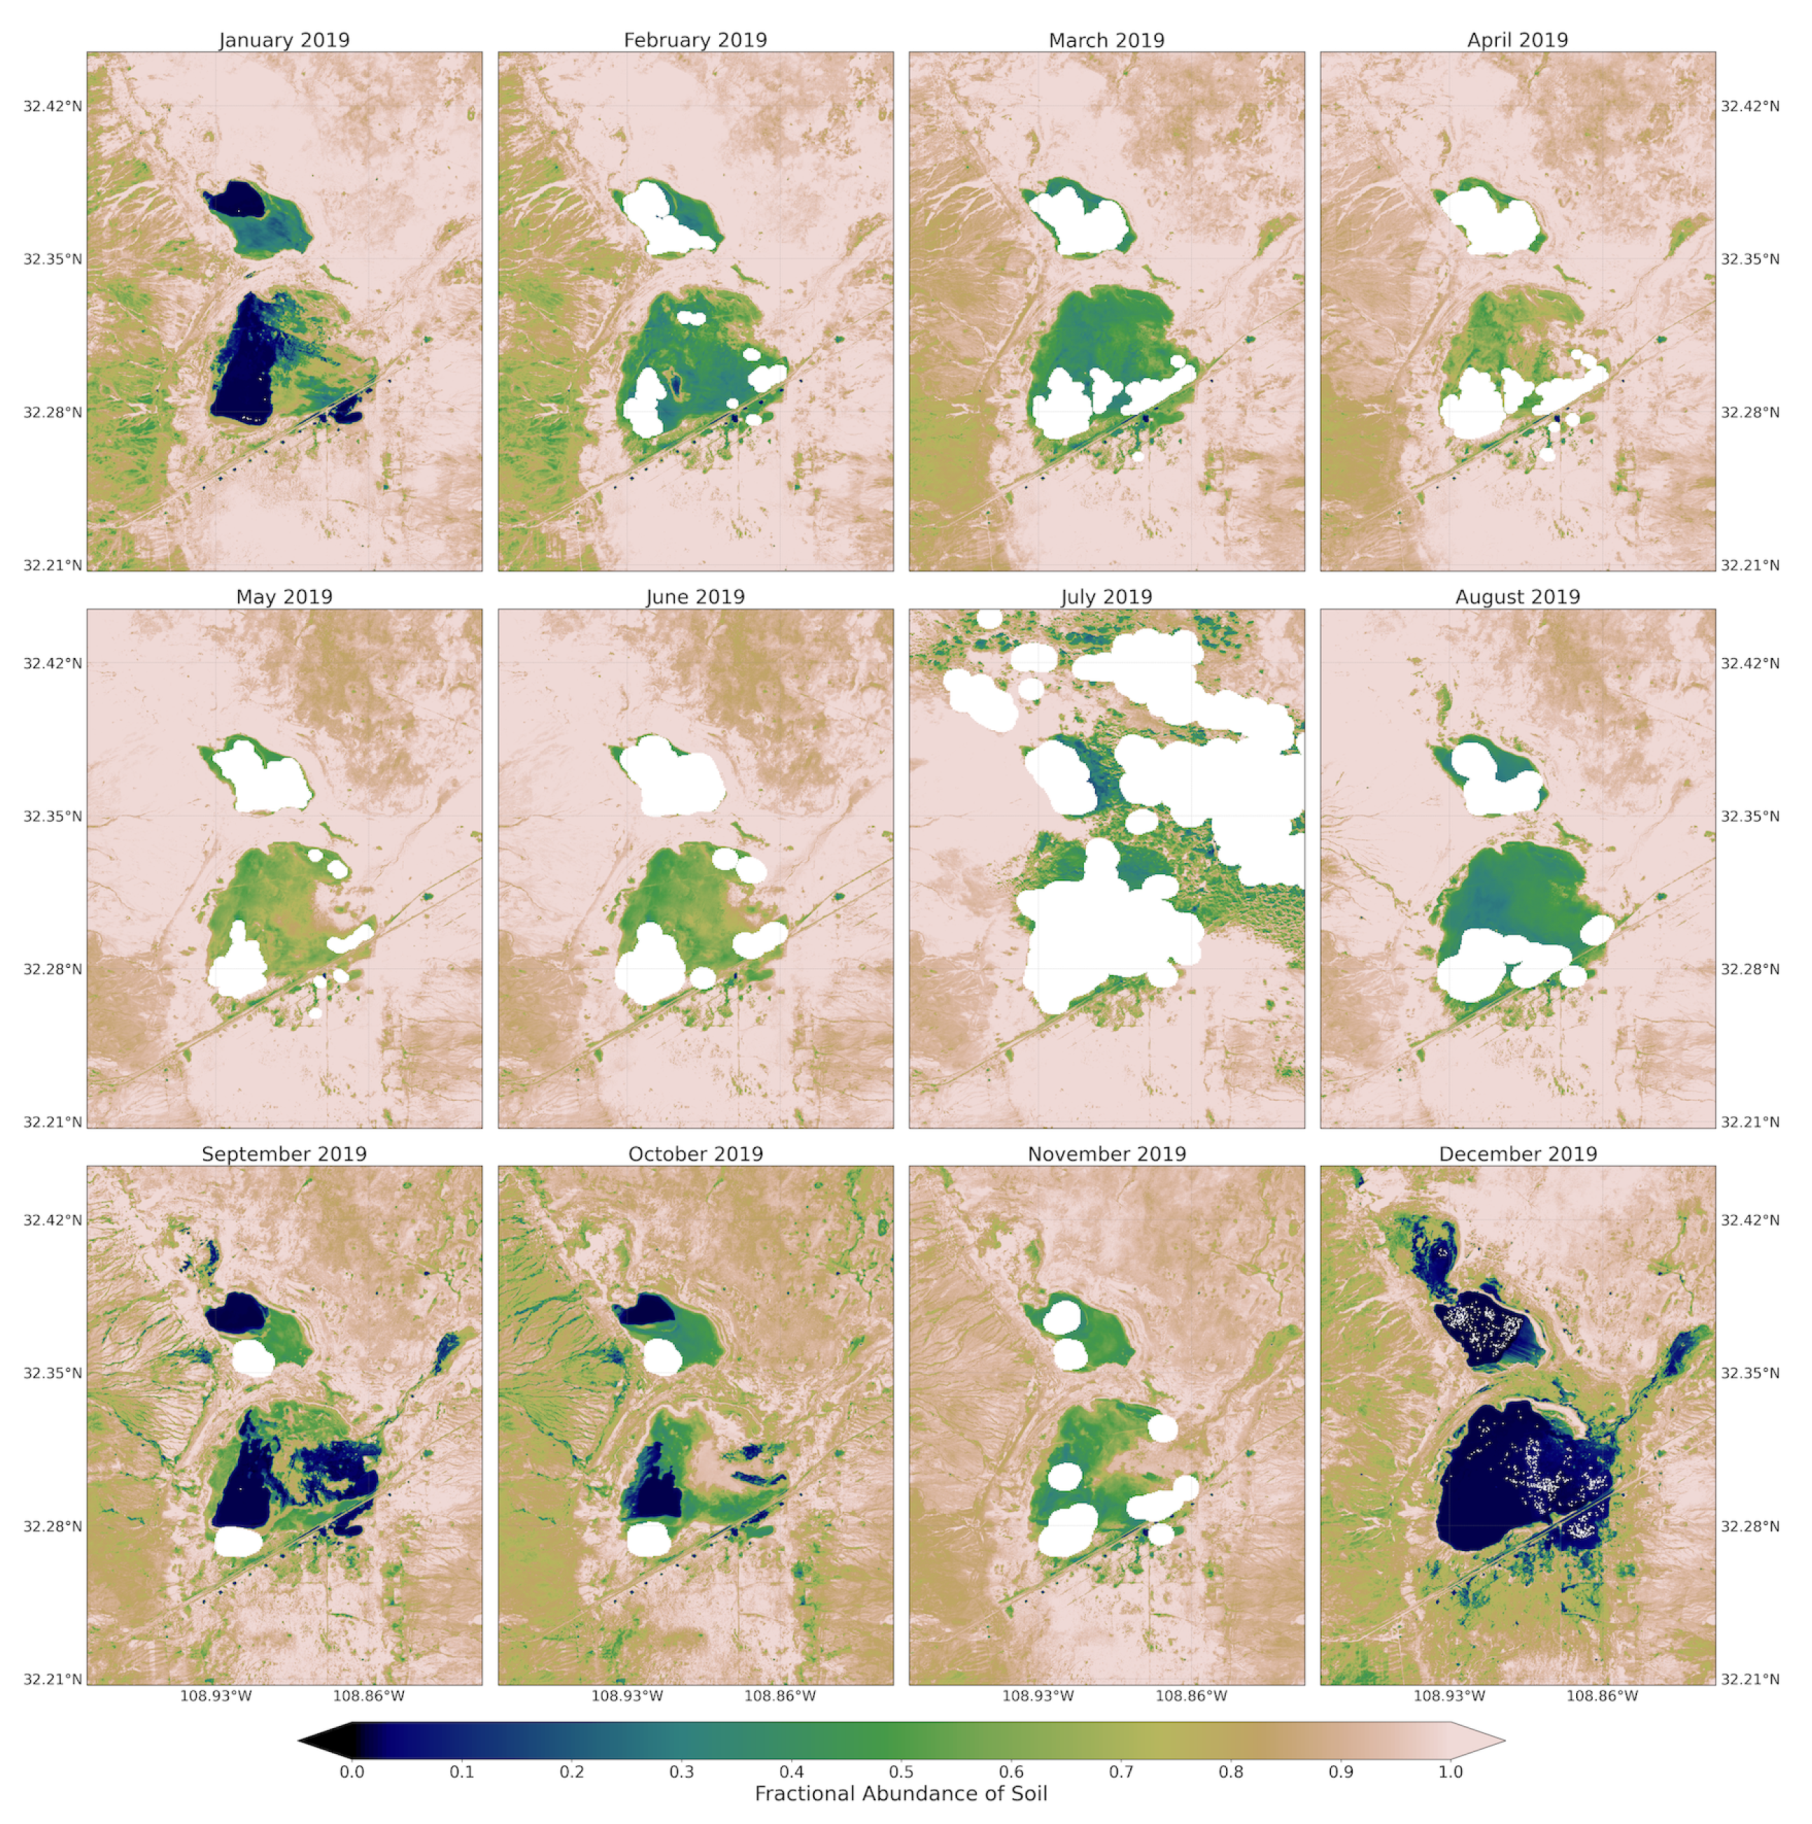
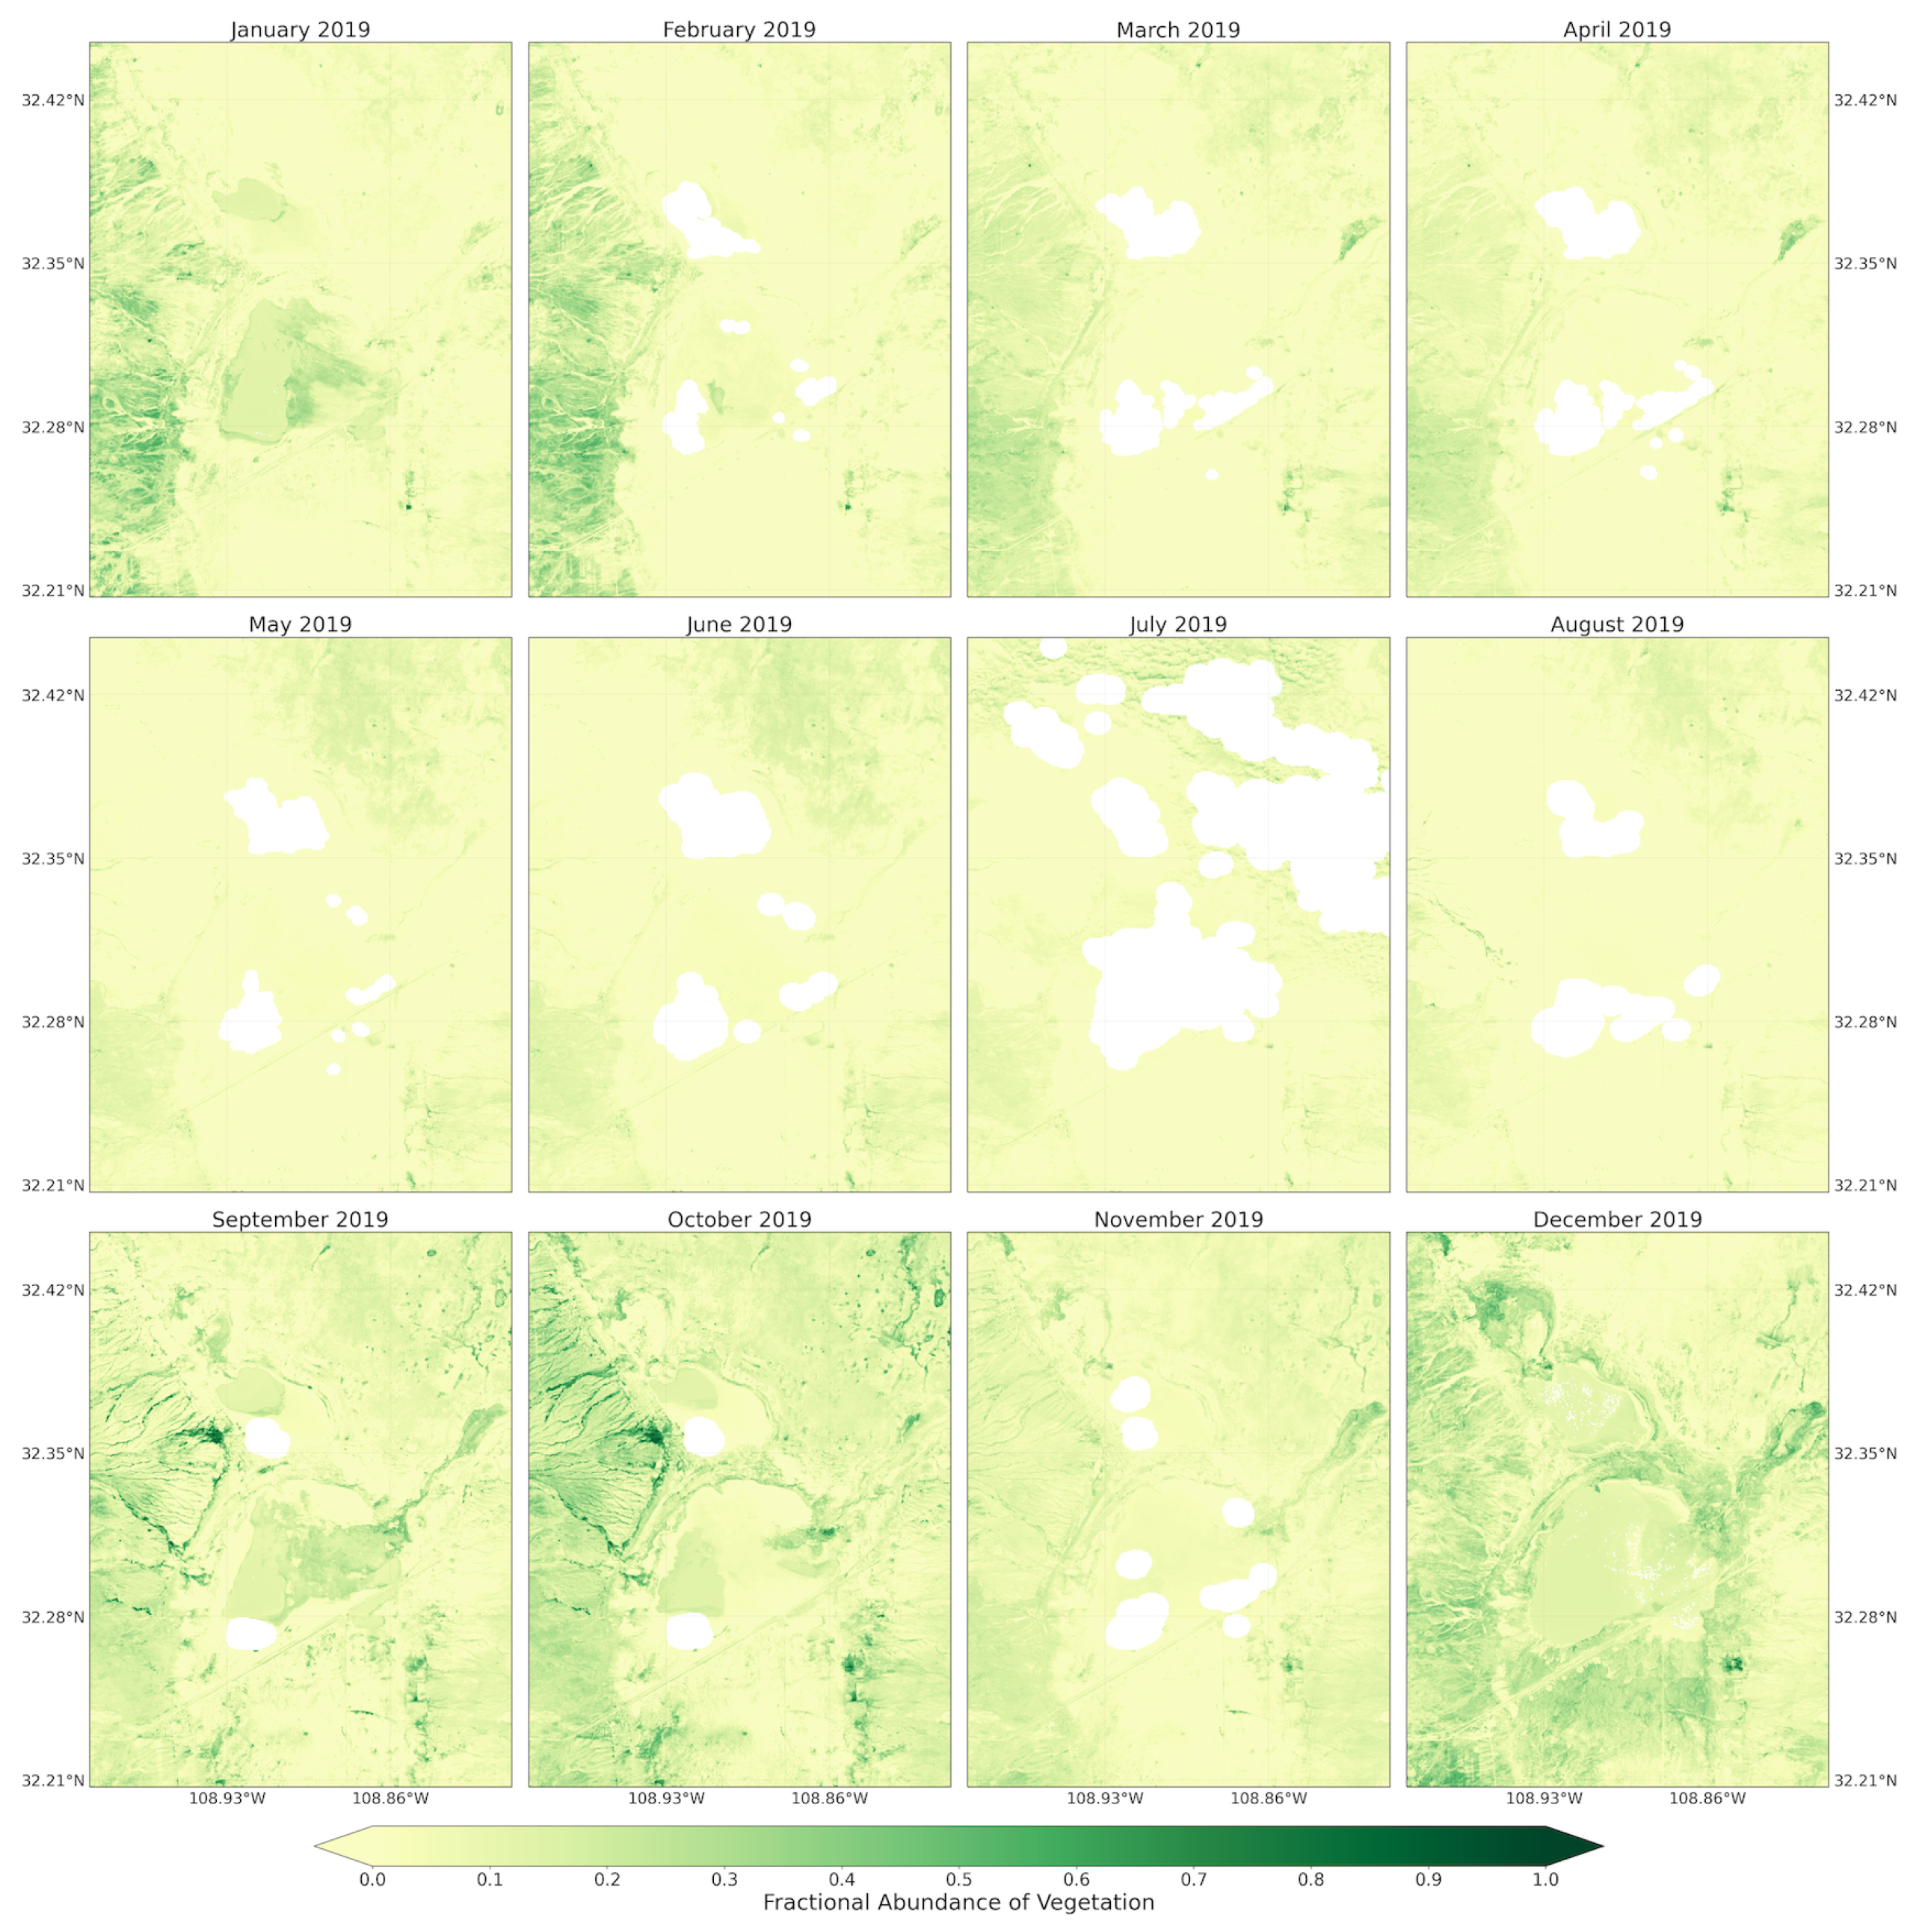
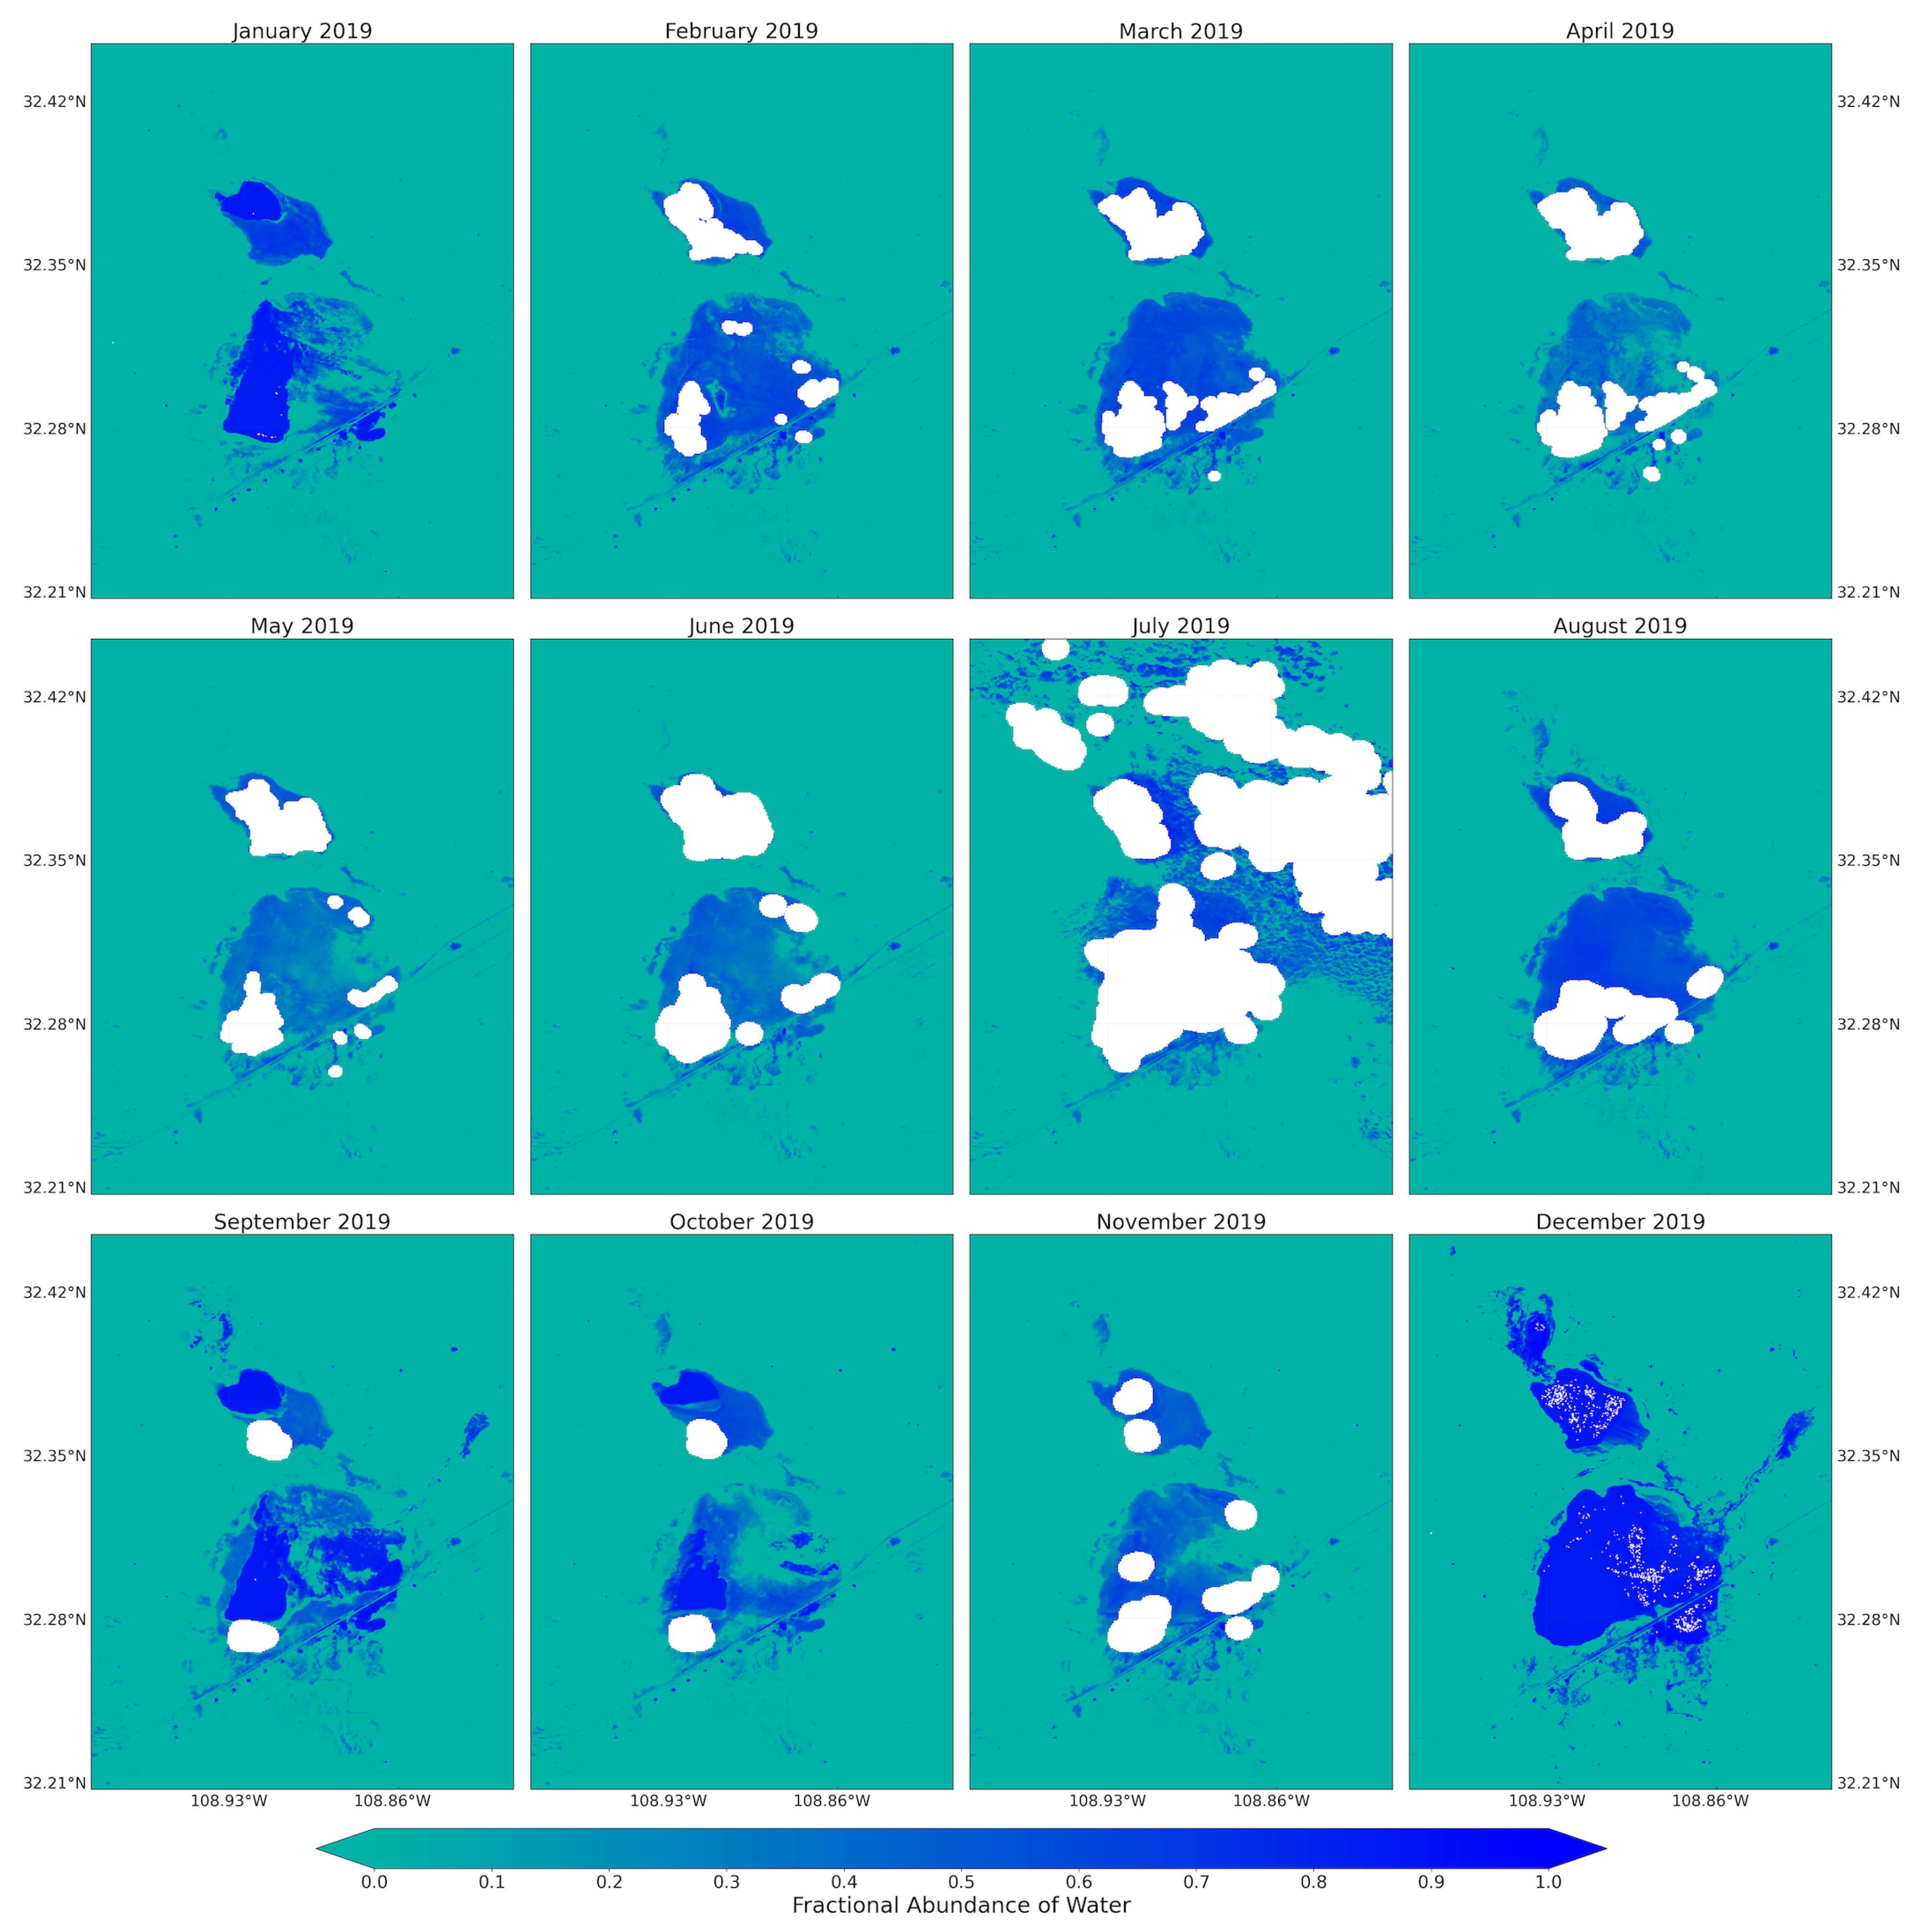
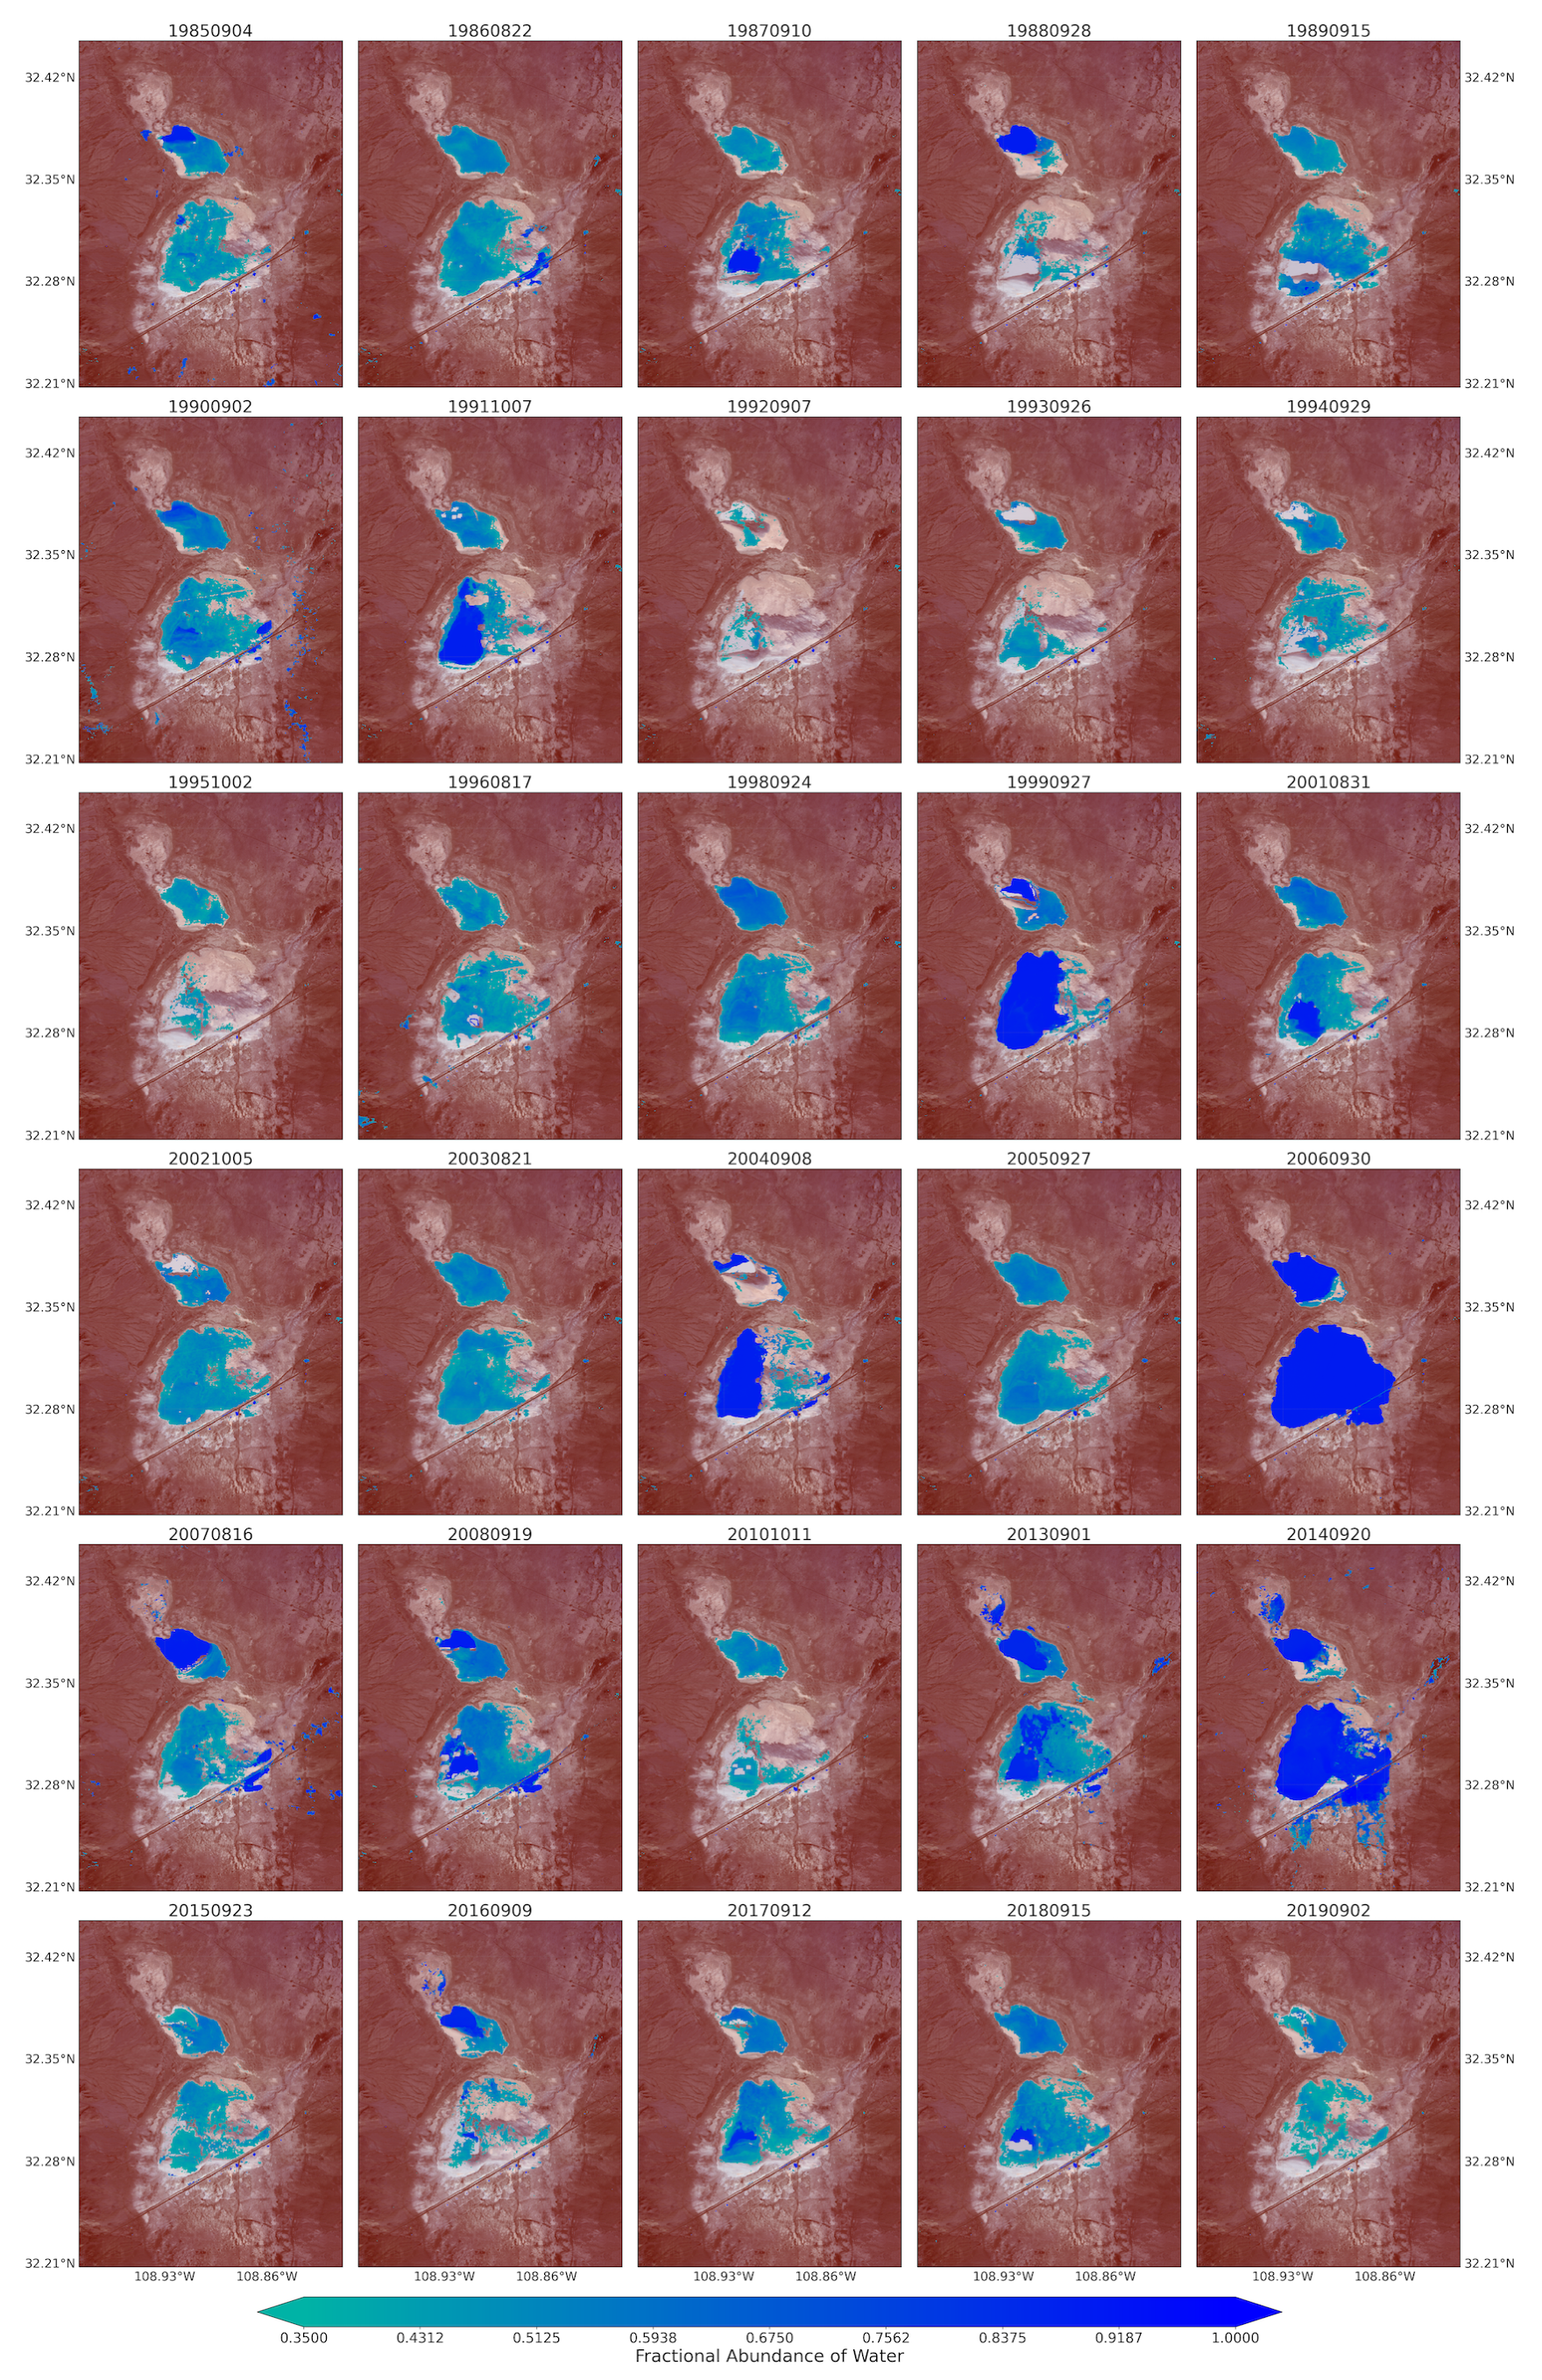
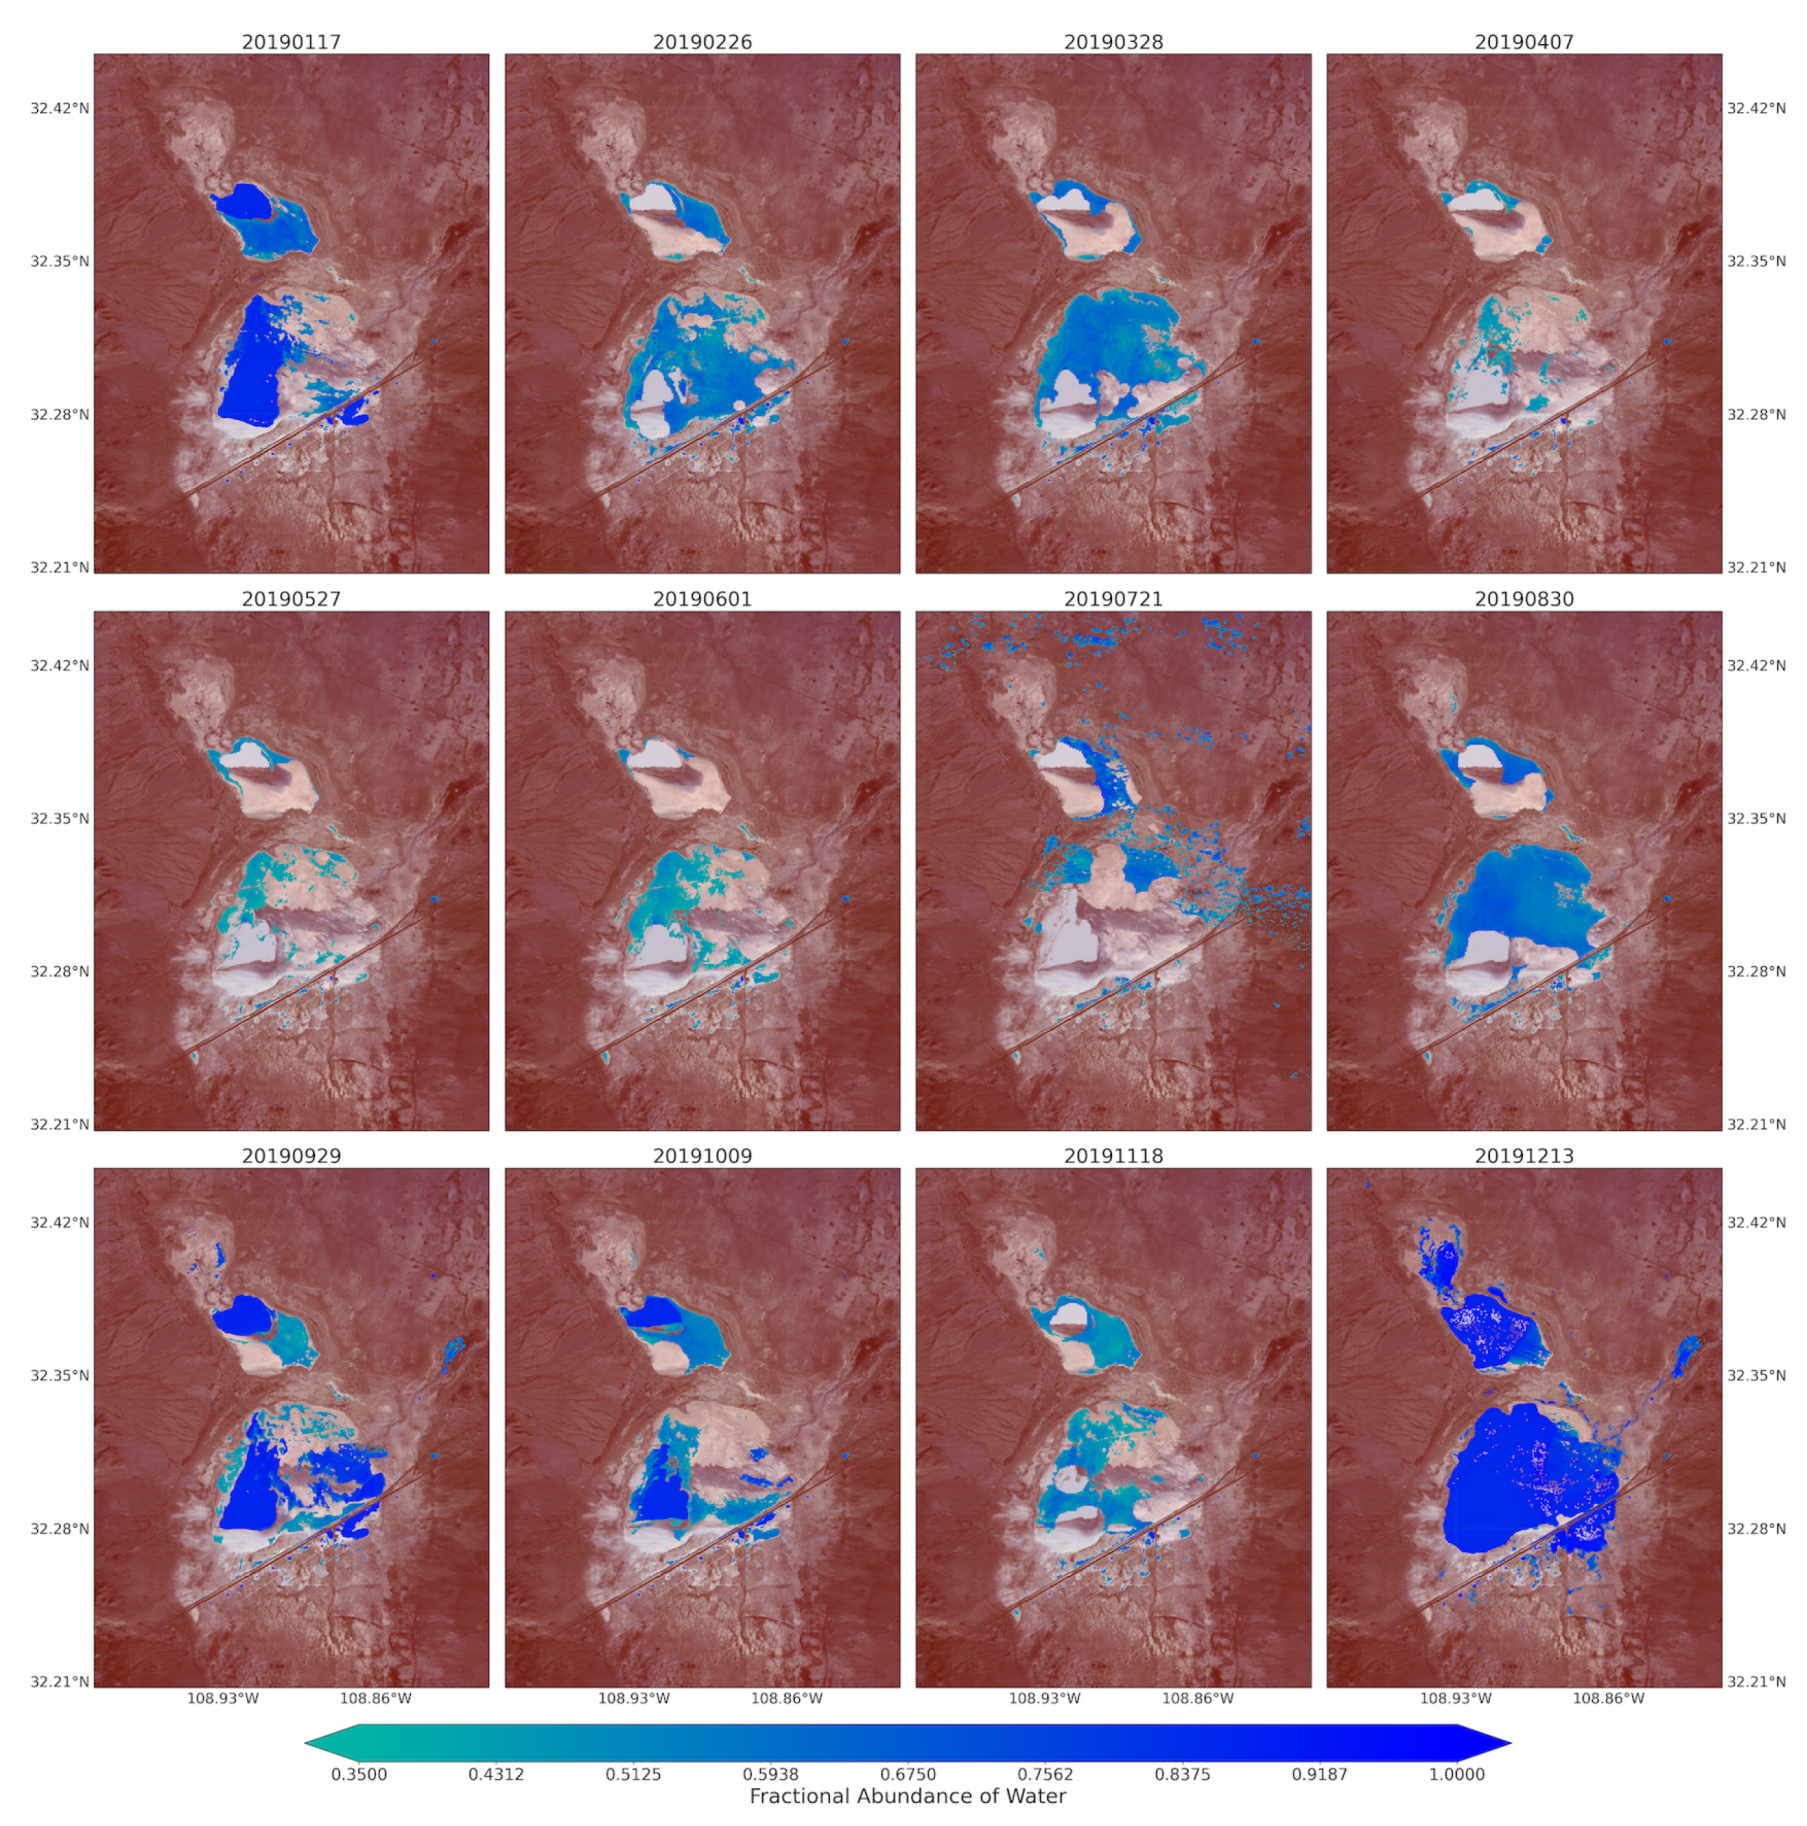
5.1. Fractional Abundance of the Endmembers
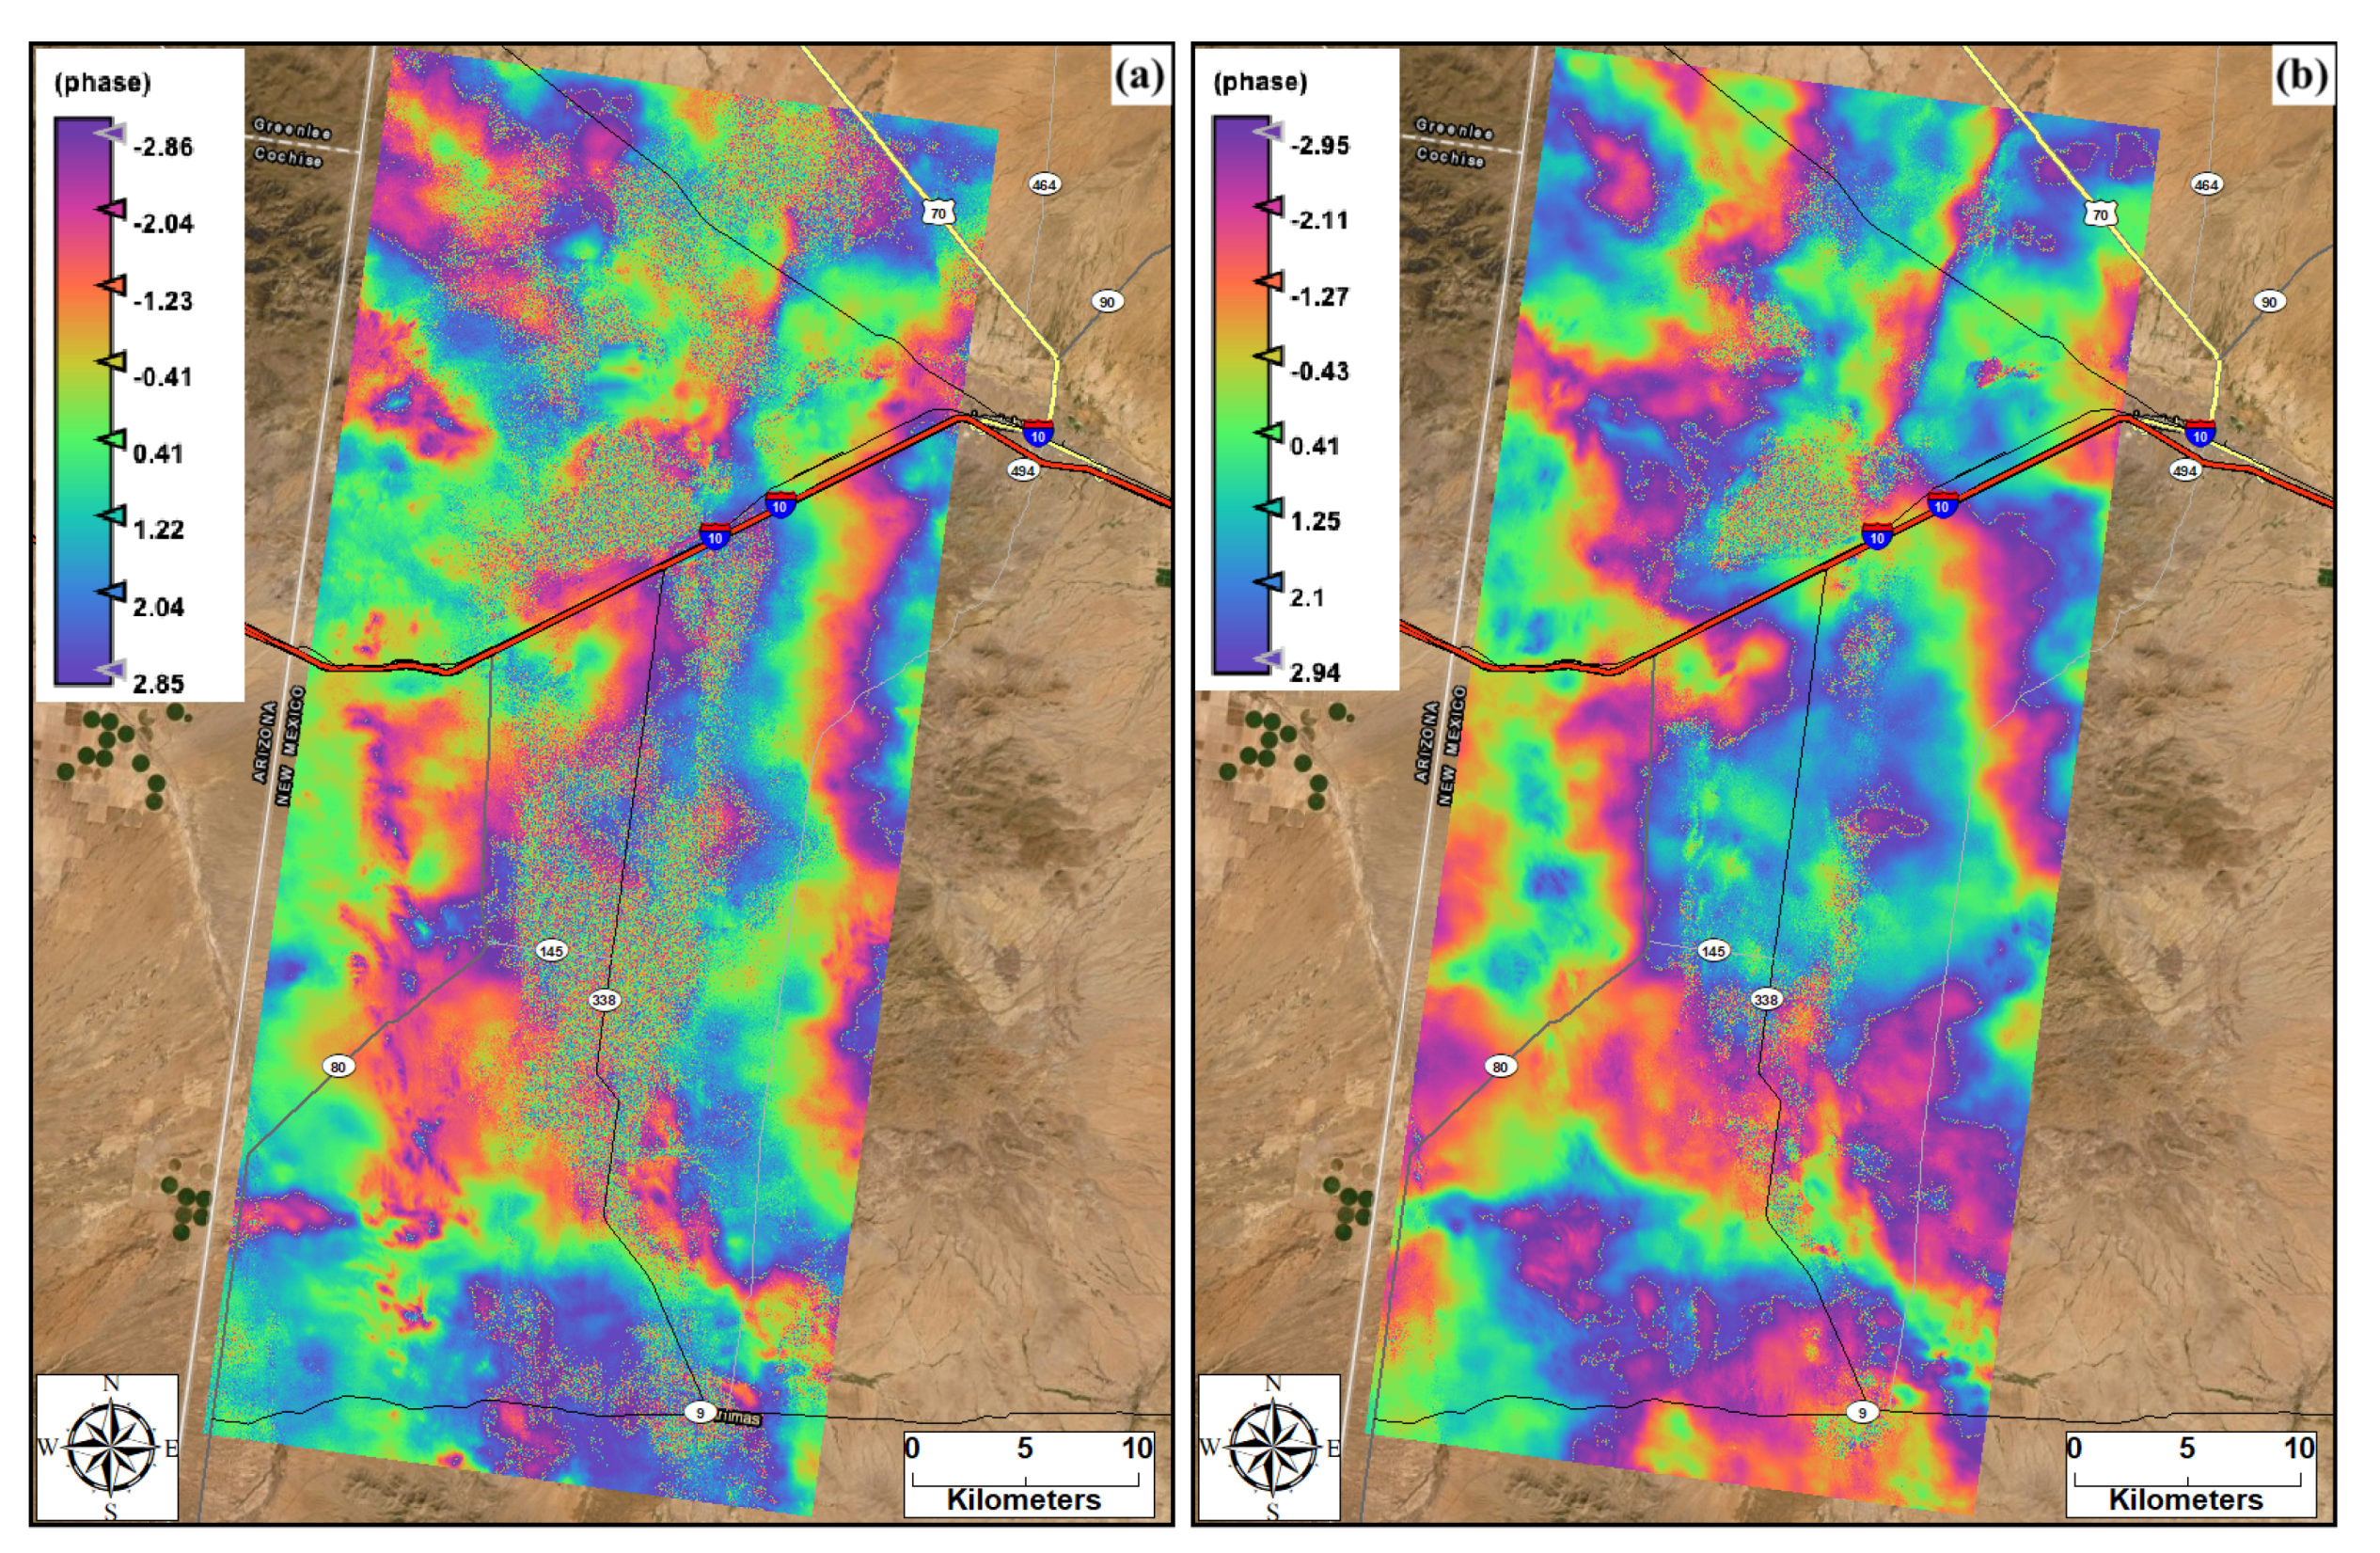
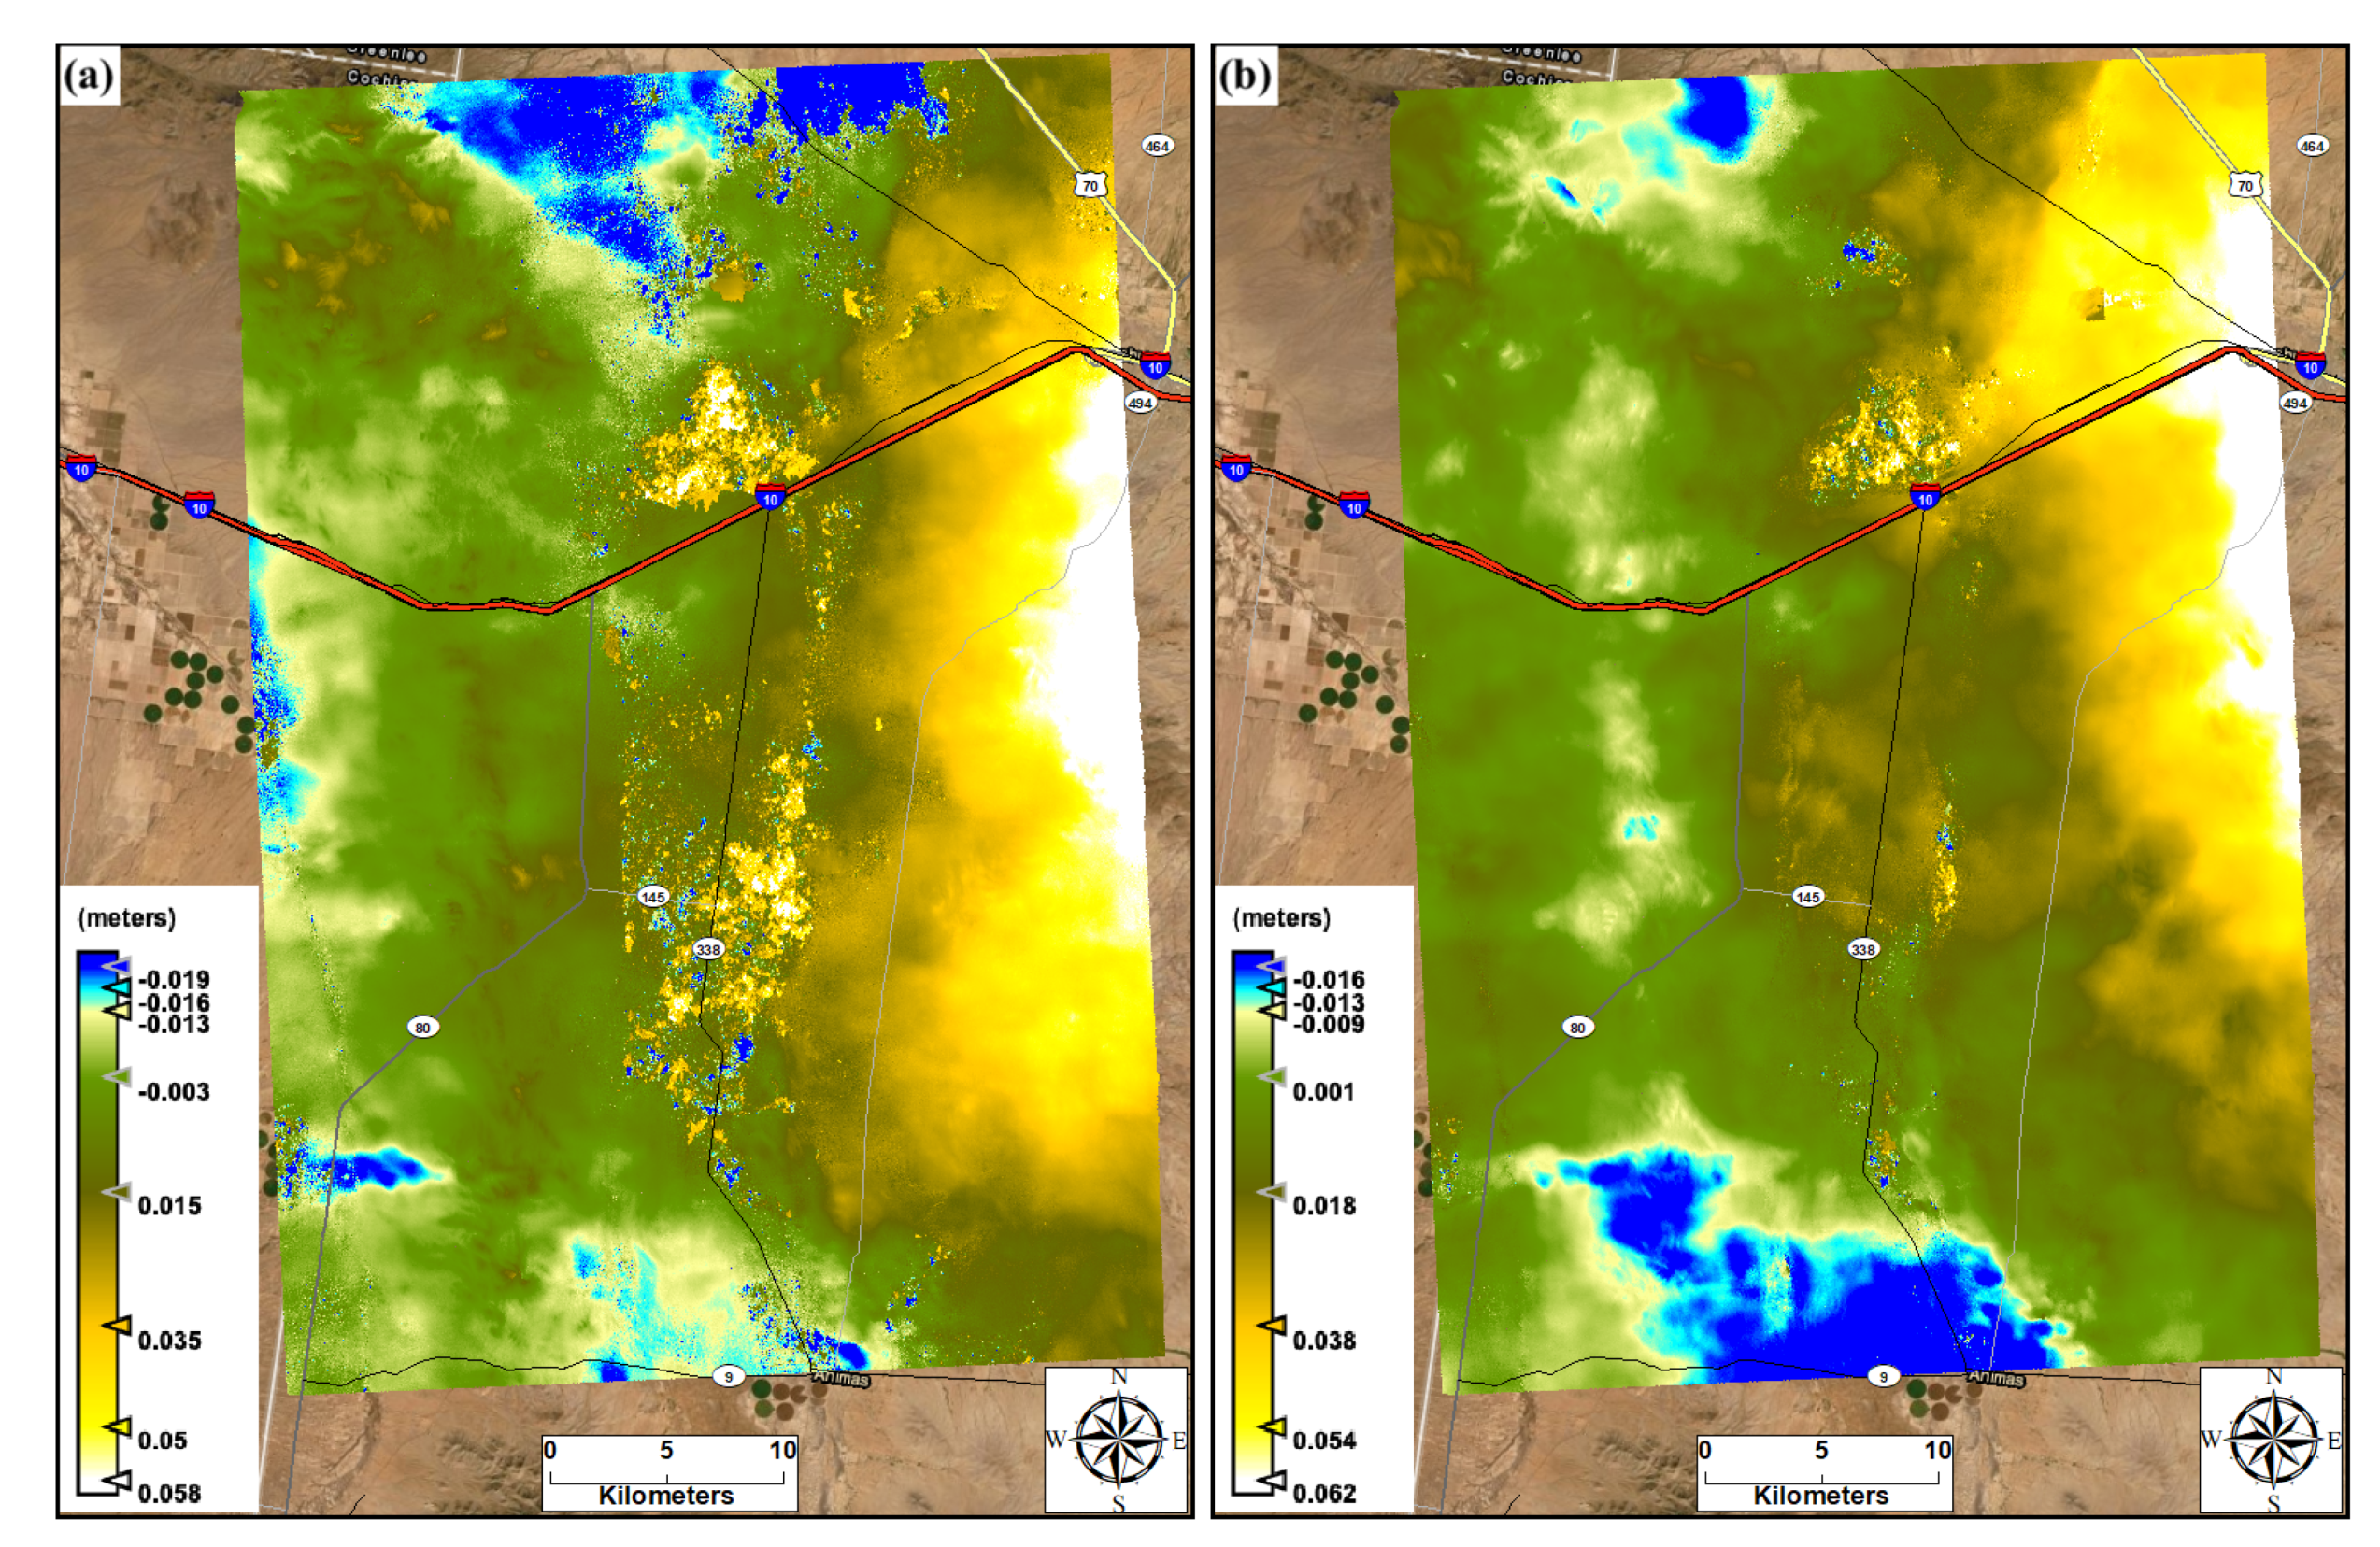
5.2. Synthetic Aperture Radar (SAR) Images
6. Discussion
7. Conclusions
Author Contributions
Funding
Institutional Review Board Statement
Informed Consent Statement
Data Availability Statement
Acknowledgments
Conflicts of Interest
Abbreviations
| GEE | Google Earth Engine |
| LULC | Land Use/Land Cover |
| SAR | Synthetic Aperture Radar |
| InSAR | Interferometric Synthetic Aperture Radar |
| NMDOT | New Mexico Department of Transportation |
| USDA | United States Department of Agriculture |
| USGS | United States Geological Survey |
| NASA | National Aeronautics and Space Administration |
| ETM | Enhanced Thematic Mapper |
| OLI | Operational Land Imager |
| TIRS | Thermal Infrared Sensor |
| WRS | Worldwide Reference System |
| UTC | Universal Time Coordinated |
| ESA | European Space Agency |
| ENVI | Environment for Visualizing Images |
| S1TBX | Sentinel-1 Toolbox |
| SNAPHU | Statistical-Cost, Network-Flow Algorithm for Phase Unwrapping |
| NDWI | Normalized Difference Water Index |
| NDVI | Normalized Difference Vegetation Index |
Appendix A


References
- Gill, T. Eolian sediments generated by anthropogenic disturbance of playas: Human impacts on the geomorphic system and geomorphic impacts on the human system. Geomorphology 1996, 17, 207–228. [Google Scholar] [CrossRef]
- Goudie, A. Dust storms and ephemeral lakes. Desert 2018, 23, 153–164. [Google Scholar] [CrossRef]
- Hahnenberger, M.; Nicoll, K. Geomorphic and land cover identification of dust sources in the eastern Great Basin of Utah, U.S.A. Geomorphology 2014, 204, 657–672. [Google Scholar] [CrossRef]
- Lee, J.A.; Baddock, M.C.; Mbuh, M.J.; Gill, T.E. Geomorphic and land cover characteristics of aeolian dust sources in West Texas and eastern New Mexico, USA. Aeolian Res. 2012, 3, 459–466. [Google Scholar] [CrossRef]
- Warren, A.; Chappell, A.; Todd, M.C.; Bristow, C.; Drake, N.; Engelstaedter, S.; Martins, V.; M’bainayel, S.; Washington, R. Dust-raising in the dustiest place on earth. Geomorphology 2007, 92, 25–37. [Google Scholar] [CrossRef]
- Prospero, J.M.; Ginoux, P.; Torres, O.; Nicholson, S.E.; Gill, T.E. Environmental characterization of global sources of atmospheric soil dust identified with the Nimbus 7 Total Ozone Mapping Spectrometer (TOMS) absorbing aerosol product. Rev. Geophys. 2002, 40, 2-1–2-31. [Google Scholar] [CrossRef]
- Floyd, K.W.; Gill, T.E. The association of land cover with aeolian sediment production at Jornada Basin, New Mexico, USA. Aeolian Res. 2011, 3, 55–66. [Google Scholar] [CrossRef]
- Rezaei, M.; Sameni, A.; Shamsi, S.R.F.; Bartholomeus, H. Remote sensing of land use/cover changes and its effect on wind erosion potential in southern Iran. PeerJ 2016, 2016, e1948. [Google Scholar] [CrossRef] [PubMed]
- Gitz, D.; Brauer, D. Trends in Playa Inundation and Water Storage in the Ogallala Aquifer on the Texas High Plains. Hydrology 2016, 3, 31. [Google Scholar] [CrossRef] [Green Version]
- Osterkamp, W.R.; Wood, W.W. Playa-lake basins on the Southern High Plains of Texas and New Mexico: Part I. Hydrologic, geomorphic, and geologic evidence for their development. GSA Bull. 1987, 99, 215–223. [Google Scholar] [CrossRef]
- Ginoux, P.; Prospero, J.M.; Gill, T.E.; Hsu, N.C.; Zhao, M. Global-scale attribution of anthropogenic and natural dust sources and their emission rates based on MODIS Deep Blue aerosol products. Rev. Geophys. 2012, 50. [Google Scholar] [CrossRef]
- Todd, M.C.; Washington, R.; Martins, J.V.; Dubovik, O.; Lizcano, G.; M’Bainayel, S.; Engelstaedter, S. Mineral dust emission from the Bodélé Depression nothern Chad, during BoDEx 2005. J. Geophys. Res. Atmos. 2007, 112, D06207. [Google Scholar] [CrossRef]
- Vickery, K.J.; Eckardt, F.D.; Bryant, R.G. A sub-basin scale dust plume source frequency inventory for southern Africa, 2005–2008. Geophys. Res. Lett. 2013, 40, 5274–5279. [Google Scholar] [CrossRef] [Green Version]
- Cahill, T.A.; Gill, T.E.; Reid, J.S.; Gearhart, E.A.; Gillette, D.A. Saltating Particles, Playa Crusts and Dust Aerosols at Owens (Dry) Lake, California. Earth Surf. Process. Landforms 1996, 21, 621–639. [Google Scholar] [CrossRef]
- Gillette, D.A. Sand flux in the northern Chihuahuan desert, New Mexico, USA, and the influence of mesquite-dominated landscapes. J. Geophys. Res. 2004, 109. [Google Scholar] [CrossRef]
- Baddock, M.C.; Gill, T.E.; Bullard, J.E.; Acosta, M.D.; Rivera Rivera, N.I. Geomorphology of the Chihuahuan Desert based on potential dust emissions. J. Maps 2011, 7, 249–259. [Google Scholar] [CrossRef] [Green Version]
- Lu, H.; Shao, Y. Toward quantitative prediction of dust storms: An integrated wind erosion modelling system and its applications. Environ. Model. Softw. 2001, 16, 233–249. [Google Scholar] [CrossRef]
- Rashki, A.; Kaskaoutis, D.G.; Goudie, A.S.; Kahn, R.A. Dryness of ephemeral lakes and consequences for dust activity: The case of the Hamoun drainage basin, Southeastern Iran. Sci. Total Environ. 2013, 463–464, 552–564. [Google Scholar] [CrossRef] [PubMed]
- Reynolds, R.; Bogle, R.; Vogel, J.; Goldstein, H.; Yount, J. Dust emission at Franklin Lake Playa, Mojave Desert (USA): Response to meteorological and hydrologic changes 2005–2008. Nat. Resour. Environ. Issues 2009, 15, 18. [Google Scholar]
- Sweeney, M.R.; McDonald, E.V.; Etyemezian, V. Quantifying dust emissions from desert landforms, eastern Mojave Desert, USA. Geomorphology 2011, 135, 21–34. [Google Scholar] [CrossRef]
- Webb, N.P.; Strong, C.L. Soil erodibility dynamics and its representation for wind erosion and dust emission models. Aeolian Res. 2011, 3, 165–179. [Google Scholar] [CrossRef]
- Scheidt, S.; Ramsey, M.; Lancaster, N. Determining soil moisture and sediment availability at White Sands Dune Field, New Mexico, from apparent thermal inertia data. J. Geophys. Res. Earth Surf. 2010, 115. [Google Scholar] [CrossRef]
- Whitney, J.W.; Breit, G.N.; Buckingham, S.E.; Reynolds, R.L.; Bogle, R.C.; Luo, L.; Goldstein, H.L.; Vogel, J.M. Aeolian responses to climate variability during the past century on Mesquite Lake Playa, Mojave Desert. Geomorphology 2015, 230, 13–25. [Google Scholar] [CrossRef]
- Raupach, M.R.; Gillette, D.A.; Leys, J.F. The effect of roughness elements on wind erosion threshold. J. Geophys. Res. 1993, 98, 3023–3029. [Google Scholar] [CrossRef]
- Webb, N.P.; Okin, G.S.; Brown, S. The effect of roughness elements on wind erosion: The importance of surface shear stress distribution. J. Geophys. Res. 2014, 119, 6066–6084. [Google Scholar] [CrossRef] [Green Version]
- Li, J.; Okin, G.S.; Alvarez, L.; Epstein, H. Quantitative effects of vegetation cover on wind erosion and soil nutrient loss in a desert grassland of southern New Mexico, USA. Biogeochemistry 2007, 85, 317–332. [Google Scholar] [CrossRef]
- Munson, S.M.; Belnap, J.; Okin, G.S. Responses of wind erosion to climate-induced vegetation changes on the Colorado Plateau. Proc. Natl. Acad. Sci. USA 2011, 108, 3854–3859. [Google Scholar] [CrossRef] [Green Version]
- Miri, A.; Dragovich, D.; Dong, Z. Vegetation morphologic and aerodynamic characteristics reduce aeolian erosion. Sci. Rep. 2017, 7. [Google Scholar] [CrossRef]
- Okin, G.S. A new model of wind erosion in the presence of vegetation. J. Geophys. Res. Earth Surf. 2008, 113. [Google Scholar] [CrossRef] [Green Version]
- Suter-Burri, K.; Gromke, C.; Leonard, K.C.; Graf, F. Spatial patterns of aeolian sediment deposition in vegetation canopies: Observations from wind tunnel experiments using colored sand. Aeolian Res. 2013, 8, 65–73. [Google Scholar] [CrossRef]
- Bryant, R.G. Monitoring hydrological controls on dust emissions: Preliminary observations from Etosha Pan, Namibia. Geogr. J. 2003, 169, 131–141. [Google Scholar] [CrossRef]
- Pelletier, J.D.; Cook, J.P. Deposition of playa windblown dust over geologic time scales. Geology 2005, 33, 909–912. [Google Scholar] [CrossRef]
- Mahowald, N.M.; Bryant, R.G.; del Corral, J.; Steinberger, L. Ephemeral lakes and desert dust sources. Geophys. Res. Lett. 2003, 30. [Google Scholar] [CrossRef]
- Stout, J.E. Seasonal variations of saltation activity on a high plains saline playa: Yellow lake, Texas. Phys. Geogr. 2003, 24, 61–76. [Google Scholar] [CrossRef] [Green Version]
- Torgersen, T. Wind effects on water and salt loss in playa lakes. J. Hydrol. 1984, 74, 137–149. [Google Scholar] [CrossRef]
- Luo, H.R.; Smith, L.M.; Haukos, D.A.; Allen, B.L. Sources of recently deposited sediments in playa wetlands. Wetlands 1999, 19, 176–181. [Google Scholar] [CrossRef]
- Kok, J.F.; Parteli, E.J.R.; Michaels, T.I.; Karam, D.B. The physics of wind-blown sand and dust. Rep. Prog. Phys. 2012, 75, 106901. [Google Scholar] [CrossRef] [Green Version]
- Shao, Y.; Raupach, M.R.; Findlater, P.A. Effect of Saltation Bombardment on the Entrainment of Dust by Wind. Geophys. Res. Atmos. 1993, 98, 12719–12726. [Google Scholar] [CrossRef] [Green Version]
- Gill, T.; Dubois, D.; Eibedingil, I.; Fuentes, J.; Jin, L.; Li, J.; Mendez, M.; Tatarko, J.; Scott Van Pelt, R.; Webb, N. Assessing the Acute Safety Hazard to Highway Transportation from Blowing Dust at Lordsburg Playa, New Mexico. In Proceedings of the Transportation, Air Quality, and Health Symposium, Austin, TX, USA, 18–20 February 2019. [Google Scholar]
- Botkin, T.; Hutchinson, B. 2020 Lordsburg Playa Dust Storm Mitigation Update; In Proceedings of the Southern Arizona Dust Storm Workshop. Coolidge, AZ, USA, 3 March 2020. Available online: https://www.weather.gov/media/psr/Dust/2020/9_BOTKIN_DustMitigation_AZ_2020.pdf (accessed on 16 July 2021).
- U.S. Department of the Interior, Bureau of Land Management. Road Forks Dust Mitigation Project; Technical Report; U.S. Department of the Interior: Las Cruses, NM, USA, 2008.
- Van Pelt, R.S.; Tatarko, J.; Gill, T.E.; Chang, C.; Li, J.; Eibedingil, I.G.; Mendez, M. Dust emission source characterization for visibility hazard assessment on Lordsburg Playa in Southwestern New Mexico, USA. Geoenviron. Disasters 2020, 7, 34. [Google Scholar] [CrossRef] [PubMed]
- Rivera Rivera, N.I.; Gill, T.E.; Bleiweiss, M.P.; Hand, J.L. Source characteristics of hazardous Chihuahuan Desert dust outbreaks. Atmos. Environ. 2010, 44, 2457–2468. [Google Scholar] [CrossRef]
- Arizona Department of Transportation. U.S. 70, Safford to New Mexico State Line Interstate Detour Needs Study (Final Report); Technical Report; Arizona Department of Transportation: Phoenix, AZ, USA, 2019. [Google Scholar]
- Alexakis, D.D.; Hadjimitsis, D.G.; Agapiou, A. Integrated use of remote sensing, GIS and precipitation data for the assessment of soil erosion rate in the catchment area of “Yialias” in Cyprus. Atmos. Res. 2013, 131, 108–124. [Google Scholar] [CrossRef]
- El-Jazouli, A.; Barakat, A.; Ghafiri, A.; El Moutaki, S.; Ettaqy, A.; Khellouk, R. Soil Erosion Modeled with USLE, GIS, and Remote Sensing: A Case Study of Ikkour Watershed in Middle Atlas (Morocco). Geosci. Lett. 2017, 4, 25. [Google Scholar] [CrossRef] [Green Version]
- Garg, V.; Nikam, B.R.; Thakur, P.K.; Aggarwal, S.P.; Gupta, P.K.; Srivastav, S.K. Human-induced land use land cover change and its impact on hydrology. HydroResearch 2019, 1, 48–56. [Google Scholar] [CrossRef]
- Phinzi, K.; Ngetar, N.S. The Assessment of Water-Borne Erosion at Catchment Level Using GIS-Based RUSLE and Remote Sensing: A Review. Int. Soil Water Conserv. Res. 2019, 7, 27–46. [Google Scholar] [CrossRef]
- Birkett, C.M. Synergistic remote sensing of Lake Chad: Variability of basin inundation. Remote Sens. Environ. 2000, 72, 218–236. [Google Scholar] [CrossRef]
- Bryant, R.G.; Rainey, M.P. Investigation of flood inundation on playas within the Zone of Chotts, using a time-series of AVHRR. Remote Sens. Environ. 2002, 82, 360–375. [Google Scholar] [CrossRef]
- Johnson, W.P.; Rice, M.B.; Haukos, D.A.; Thorpe, P.P. Factors influencing the occurrence of inundated playa wetlands during winter on the texas high plains. Wetlands 2011, 31, 1287–1296. [Google Scholar] [CrossRef]
- Buma, W.G.; Lee, S.I.; Seo, J.Y. Recent surface water extent of lake Chad from multispectral sensors and GRACE. Sensors 2018, 18, 2082. [Google Scholar] [CrossRef] [Green Version]
- Herndon, K.; Muench, R.; Cherrington, E.; Griffin, R. An assessment of surface water detection methods for water resource management in the Nigerien Sahel. Sensors 2020, 20, 431. [Google Scholar] [CrossRef] [Green Version]
- Tulbure, M.G.; Broich, M.; Stehman, S.V.; Kommareddy, A. Surface water extent dynamics from three decades of seasonally continuous Landsat time series at subcontinental scale in a semi-arid region. Remote Sens. Environ. 2016, 178, 142–157. [Google Scholar] [CrossRef]
- Reis, S.; Yilmaz, H.M. Temporal monitoring of water level changes in Seyfe Lake using remote sensing. Hydrol. Process. 2008, 22, 4448–4454. [Google Scholar] [CrossRef]
- Zhu, W.; Jia, S.; Lv, A. Monitoring the Fluctuation of Lake Qinghai Using Multi-Source Remote Sensing Data. Remote Sens. 2014, 6, 10457–10482. [Google Scholar] [CrossRef] [Green Version]
- Bastawesy, M.A.; Khalaf, F.I.; Arafat, S.M. The use of remote sensing and GIS for the estimation of water loss from Tushka lakes, southwestern desert, Egypt. J. Afr. Earth Sci. 2008, 52, 73–80. [Google Scholar] [CrossRef]
- Chappell, A.; Strong, C.; McTainsh, G.; Leys, J. Detecting induced in situ erodibility of a dust-producing playa in Australia using a bi-directional soil spectral reflectance model. Remote Sens. Environ. 2007, 106, 508–524. [Google Scholar] [CrossRef]
- Chappell, A.; Webb, N.P.; Guerschman, J.P.; Thomas, D.T.; Mata, G.; Handcock, R.N.; Leys, J.F.; Butler, H.J. Improving ground cover monitoring for wind erosion assessment using MODIS BRDF parameters. Remote Sens. Environ. 2018, 204, 756–768. [Google Scholar] [CrossRef]
- Parajuli, S.P.; Yang, Z.L.; Kocurek, G. Mapping erodibility in dust source regions based on geomorphology, meteorology, and remote sensing. J. Geophys. Res. Earth Surf. 2014, 119, 1977–1994. [Google Scholar] [CrossRef]
- Ibarrola-Ulzurrun, E.; Drumetz, L.; Marcello, J.; Gonzalo-Martin, C.; Chanussot, J. Hyperspectral Classification Through Unmixing Abundance Maps Addressing Spectral Variability. IEEE Trans. Geosci. Remote Sens. 2019, 57, 4775–4788. [Google Scholar] [CrossRef]
- Villa, A.; Member, S.; Chanussot, J.; Member, S.; Atli Benediktsson, J.; Jutten, C. Spectral Unmixing for the Classification of Hyperspectral Images at a Finer Spatial Resolution. IEEE J. Sel. Top. Signal Process. 2011, 5, 521. [Google Scholar] [CrossRef] [Green Version]
- Orlovsky, L.; Kaplan, S.; Orlovsky, N.; Blumberg, D.; Mamedov, E. Monitoring land use and land cover changes in Turkmenistan using remote sensing Management of Natural Resources, Sustainable Development and Ecological Hazards 463. Trans. Ecol. Environ. 2006, 99, 1743–3541. [Google Scholar] [CrossRef] [Green Version]
- Keshava, N.; Mustard, J.F. Spectral unmixing. IEEE Signal Process. Mag. 2002, 19, 44–57. [Google Scholar] [CrossRef]
- Krider, P.R. Paleoclimatic significance of late Quaternary Lacustrine and alluvial stratigraphy, Animas Valley, New Mexico. Quat. Res. 1998, 50, 283–289. [Google Scholar] [CrossRef]
- Scuderi, L.A.; Laudadio, C.K.; Fawcett, P.J. Monitoring playa lake inundation in the western United States: Modern analogues to late-Holocene lake level change. Quat. Res. 2010, 73, 48–58. [Google Scholar] [CrossRef]
- Allen, B.D. Ice age lakes in New Mexico. New Mex. Mus. Nat. Hist. Sci. Bull. 2005, 28, 107–113. [Google Scholar]
- Cox, D.N. Soil Survey of Hidalgo County, New Mexico; US Soil Conservation Service: Washington, DC, USA, 1973. [Google Scholar]
- Botkin, T.; Hutchinson, B. Dust Storm Mitigation Update; In Proceedings of the Southern Arizona Dust Storm Workshop, Coolidge, AZ, USA, 5 March, 2019.
- Soil Survey Staff, Natural Resources Conservation Service, USDA. Web Soil Survey. 2019. Available online: http://websoilsurvey.sc.egov.usda.gov/ (accessed on 27 March 2020).
- Gascon, F.; Bouzinac, C.; Thépaut, O.; Jung, M.; Francesconi, B.; Louis, J.; Lonjou, V.; Lafrance, B.; Massera, S.; Gaudel-Vacaresse, A.; et al. Copernicus Sentinel-2A Calibration and Products Validation Status. Remote Sens. 2017, 9, 584. [Google Scholar] [CrossRef] [Green Version]
- Joshi, N.; Baumann, M.; Ehammer, A.; Fensholt, R.; Grogan, K.; Hostert, P.; Jepsen, M.; Kuemmerle, T.; Meyfroidt, P.; Mitchard, E.; et al. A Review of the Application of Optical and Radar Remote Sensing Data Fusion to Land Use Mapping and Monitoring. Remote Sens. 2016, 8, 70. [Google Scholar] [CrossRef] [Green Version]
- Dusseux, P.; Corpetti, T.; Hubert-Moy, L.; Corgne, S. Combined Use of Multi-Temporal Optical and Radar Satellite Images for Grassland Monitoring. Remote Sens. 2014, 6, 6163–6182. [Google Scholar] [CrossRef] [Green Version]
- Erasmi, S.; Twele, A. Regional land cover mapping in the humid tropics using combined optical and SAR satellite data—A case study from Central Sulawesi, Indonesia. Int. J. Remote Sens. 2009, 30, 2465–2478. [Google Scholar] [CrossRef]
- Wijedasa, L.S.; Sloan, S.; Michelakis, D.G.; Clements, G.R. Overcoming Limitations with Landsat Imagery for Mapping of Peat Swamp Forests in Sundaland. Remote Sens. 2012, 4, 2595–2618. [Google Scholar] [CrossRef] [Green Version]
- Gorelick, N.; Hancher, M.; Dixon, M.; Ilyushchenko, S.; Thau, D.; Moore, R. Google Earth Engine: Planetary-scale geospatial analysis for everyone. Remote Sens. Environ. 2017, 202, 18–27. [Google Scholar] [CrossRef]
- U.S. Geological Survey. Tracking Change Over Time-Understanding Remote Sensing Landsat Uses; Technical Report; U.S. Geological Survey: Reston, VA, USA, 2016.
- U.S. Geological Survey. Landsat Missions. 2020. Available online: https://www.usgs.gov/core-science-systems/nli/landsat/landsat-satellite-missions?qt-science_support_page_related_con=2#qt-science_support_page_related_con (accessed on 1 April 2020).
- European Space Agency. Sentinel-2 User Handbook Issue 1 Revision 1 SENTINEL-2 User Handbook; Technical Report; European Space Agency: Paris, France, 2013. [Google Scholar]
- Kokaly, R.F.; Clark, R.N.; Swayze, G.A.; Livo, K.E.; Hoefen, T.M.; Pearson, N.C.; Wise, R.A.; Benzel, W.M.; Lowers, H.A.; Driscoll, R.L.; et al. USGS Spectral Library Version 7; Technical Report; U.S. Geological Survey: Reston, VA, USA, 2017. [Google Scholar] [CrossRef]
- Torres, R.; Snoeij, P.; Geudtner, D.; Bibby, D.; Davidson, M.; Attema, E.; Potin, P.; Rommen, B.Ö.; Floury, N.; Brown, M.; et al. GMES Sentinel-1 mission. Remote Sens. Environ. 2012, 120, 9–24. [Google Scholar] [CrossRef]
- European Space Agency. Copernicus Sentinel Data. 2017. Available online: https://search.asf.alaska.edu/#/ (accessed on 9 April 2020).
- Bangira, T.; Alfieri, S.; Menenti, M.; van Niekerk, A.; Vekerdy, Z. A Spectral Unmixing Method with Ensemble Estimation of Endmembers: Application to Flood Mapping in the Caprivi Floodplain. Remote Sens. 2017, 9, 1013. [Google Scholar] [CrossRef] [Green Version]
- Du, Y.; Zhang, Y.; Ling, F.; Wang, Q.; Li, W.; Li, X. Water bodies’ mapping from Sentinel-2 imagery with Modified Normalized Difference Water Index at 10-m spatial resolution produced by sharpening the swir band. Remote Sens. 2016, 8, 354. [Google Scholar] [CrossRef] [Green Version]
- Rong, W.; Li, Z.; Zhang, W.; Sun, L. An improved Canny edge detection algorithm. In Proceedings of the 2014 IEEE International Conference on Mechatronics and Automation, Tianjin, China, 3–6 August 2014; pp. 577–582. [Google Scholar] [CrossRef]
- Rosen, P.A.; Hensley, S.; Joughin, I.R.; Li, F.K.; Madsen, S.N.; Rodriguez, E.; Goldstein, R.M. Synthetic aperture radar interferometry. Proc. IEEE 2000, 88, 333–382. [Google Scholar] [CrossRef]
- Chen, C.W.; Zebker, H.A. Two-dimensional phase unwrapping with use of statistical models for cost functions in nonlinear optimization. JOSA A 2001, 18, 338–351. [Google Scholar] [CrossRef] [PubMed] [Green Version]
- Acharya, T.D.; Subedi, A.; Lee, D.H. Evaluation of water indices for surface water extraction in a landsat 8 scene of Nepal. Sensors 2018, 18, 2580. [Google Scholar] [CrossRef] [Green Version]
- García-Haro, F.J.; Gilabert, M.A.; Meliá, J. Linear spectral mixture modelling to estimate vegetation amount from optical spectral data. Int. J. Remote Sens. 1996, 17, 3373–3400. [Google Scholar] [CrossRef]
- Boukabara, S.A.; Krasnopolsky, V.; Penny, S.G.; Stewart, J.Q.; McGovern, A.; Hall, D.; Hoeve, J.E.T.; Hickey, J.; Huang, H.L.A.; Hoffman, R.N.; et al. Outlook for Exploiting Artificial Intelligence in the Earth and Environmental Sciences. Bull. Am. Meteorol. Soc. 2021, 102, E1016–E1032. [Google Scholar] [CrossRef]


Publisher’s Note: MDPI stays neutral with regard to jurisdictional claims in published maps and institutional affiliations. |
© 2021 by the authors. Licensee MDPI, Basel, Switzerland. This article is an open access article distributed under the terms and conditions of the Creative Commons Attribution (CC BY) license (https://creativecommons.org/licenses/by/4.0/).
Share and Cite
Eibedingil, I.G.; Gill, T.E.; Van Pelt, R.S.; Tong, D.Q. Combining Optical and Radar Satellite Imagery to Investigate the Surface Properties and Evolution of the Lordsburg Playa, New Mexico, USA. Remote Sens. 2021, 13, 3402. https://0-doi-org.brum.beds.ac.uk/10.3390/rs13173402
Eibedingil IG, Gill TE, Van Pelt RS, Tong DQ. Combining Optical and Radar Satellite Imagery to Investigate the Surface Properties and Evolution of the Lordsburg Playa, New Mexico, USA. Remote Sensing. 2021; 13(17):3402. https://0-doi-org.brum.beds.ac.uk/10.3390/rs13173402
Chicago/Turabian StyleEibedingil, Iyasu G., Thomas E. Gill, R. Scott Van Pelt, and Daniel Q. Tong. 2021. "Combining Optical and Radar Satellite Imagery to Investigate the Surface Properties and Evolution of the Lordsburg Playa, New Mexico, USA" Remote Sensing 13, no. 17: 3402. https://0-doi-org.brum.beds.ac.uk/10.3390/rs13173402