Article

Estimation and Analysis of the Nighttime PM2.5 Concentration Based on LJ1-01 Images: A Case Study in the Pearl River Delta Urban Agglomeration of China

1
Hunan Provincial Key Laboratory of Geo-Information Engineering in Surveying, Mapping and Remote Sensing, Hunan University of Science and Technology, Xiangtan 411201, China
2
National-Local Joint Engineering Laboratory of Geo-Spatial Information Technology, Hunan University of Science and Technology, Xiangtan 411201, China
3
School of Resource Environment and Safety Engineering, Hunan University of Science and Technology, Xiangtan 411201, China
4
Department of Geography and Resource Management, The Chinese University of Hong Kong, Hong Kong 999077, China
*
Author to whom correspondence should be addressed.
Remote Sens. 2021, 13(17), 3405; https://0-doi-org.brum.beds.ac.uk/10.3390/rs13173405
Submission received: 12 July 2021 / Revised: 21 August 2021 / Accepted: 26 August 2021 / Published: 27 August 2021
(This article belongs to the Special Issue Applications of Remote Sensing Imagery for Urban Areas)

Abstract

:
At present, fine particulate matter (PM2.5) has become an important pollutant in regard to air pollution and has seriously harmed the ecological environment and human health. In the face of increasingly serious PM2.5 air pollution problems, feasible large-scale continuous spatial PM2.5 concentration monitoring provides great practical value and potential. Based on radiative transfer theory, a correlation model of the nighttime light radiance and ground PM2.5 concentration is established. A multiple linear regression model is proposed with the light radiance, meteorological elements (temperature, relative humidity, and wind speed) and terrain elements (elevation, slope, and terrain relief) as variables to estimate the ground PM2.5 concentration at 56 air quality monitoring stations in the Pearl River Delta (PRD) urban agglomeration from 2018 to 2019, and the accuracy of model estimation is tested. The results indicate that the R2 value between the model-estimated and measured values is 0.82 in the PRD region, and the model attains a high estimation accuracy. Moreover, the estimation accuracy of the model exhibits notable temporal and spatial heterogeneity. This study, to a certain extent, mitigates the shortcomings of traditional ground PM2.5 concentration monitoring methods with a high cost and low spatial resolution and complements satellite remote sensing technology. This study extends the use of LJ1-01 nighttime light remote sensing images to estimate nighttime PM2.5 concentrations. This yields a certain practical value and potential in nighttime ground PM2.5 concentration inversion.

1. Introduction

Air pollution has become an important environmental pollution problem. In 2012, the concentration of fine particulate matter (PM2.5) was listed as an important pollution source indicator in China’s National Ambient Air Quality Standard [1,2]. PM2.5 can remain in the atmosphere for a long time, which not only seriously affects visibility but also causes environmental and meteorological problems such as haze and temperature and precipitation anomalies [3,4,5,6,7] and endangers human health [8,9,10,11,12,13,14], thus impacting normal economic and social activities. Therefore, it is urgent to control PM2.5, and accurate monitoring and estimation of the temporal and spatial distributions of the PM2.5 concentration are essential.
Traditional PM2.5 concentration monitoring methods include the manual particle sample weighting method, micro-oscillation balance method and β-ray absorption method. These three ground monitoring methods achieve a high accuracy and notable real-time performance. These techniques are commonly adopted PM2.5 long-term monitoring methods, but the monitoring cost is very high, and only observation data obtained at limited monitoring sites can be considered to characterize the PM2.5 concentration in the entire area. It is difficult to accurately monitor a wide range of geographic scenes. At present, the rapid development of satellite remote sensing technology has provided a feasible method for large-scale continuous spatial PM2.5 monitoring [15,16,17,18,19,20]. For example, Kahn et al. [15] found that the particle size corresponding to the aerosol optical depth (AOD) obtained via inversion of multiangle imaging spectrometer (MISR) data was similar to the PM2.5 particle size, which verified the establishment of a correlation model between the AOD and PM2.5. In terms of feasibility, Lee et al. [18], based on a correlation regression model between the AOD and PM2.5 concentration, proposed the AOD daily calibration mixed-effect model method, combined with ground monitoring data, which overcame the low-temporal resolution shortcomings of PM2.5 concentration prediction to a certain extent. Lin et al. [20] proposed an urban air quality monitoring program based on limited ground stations and developed a physical model that integrated ground-based meteorological observations and radiosonde observations. They first obtained satellite remote sensing images to estimate the PM2.5 concentration and then calibrated the PM2.5 concentration estimation error derived from satellite remote sensing images against ground sensor network observations to obtain a higher model accuracy. At the same time, a series of satellite images such as Landsat are also used in PM2.5 concentration estimation [21,22].
According to the abovementioned research, the application of satellite remote sensing technology in daytime PM2.5 concentration estimation is becoming increasingly mature, but AOD products based on visible light observations do not directly monitor the nighttime PM2.5 concentration in real time. Therefore, the use of satellite remote sensing technology to estimate the nighttime PM2.5 concentration should be further explored.
In recent years, nighttime light images have been widely employed to study the spatial distribution of socioeconomic parameters and estimate their values [23,24,25,26,27], among which the importance of nighttime PM2.5 concentration estimation has increasingly attracted the attention of scholars [28,29,30,31,32]. For example, Johnson et al. [28] used day/night band (DNB) observations of the visible/infrared imager/radiometer suite (VIIRS) onboard the Suomi National Polar-Orbiting Partnership (S-NPP) satellite, and a new method was proposed for the retrieval of the nighttime AOD (τ) considering the contrast between regions with and without artificial surface lights. Wang et al. [30] analyzed DNB radiation data retrieved from the VIIRS onboard the S-NPP satellite to estimate the particle concentration in Atlanta, Georgia. Data measured on moonless and cloudless nights from August to October 2012 were tested, and it was found that the nighttime light intensity reflected the PM2.5 concentration to a certain extent. Fu et al. [31], based on the correlation between nighttime light data, VIIRS/DNB observations and PM2.5 concentration, constructed a mixed-effect estimation model of the nighttime PM2.5 concentration. Xu et al. [32] extracted the nighttime light index from Defense Meteorological Satellite Program-Operational Linescan System (DMSP-OLS) images as a socioeconomic factor, analyzed the correlation between the nighttime light index and spatial distribution of the PM2.5 concentration, and found that the nighttime light index was the main influencing factor of the spatial distribution of the PM2.5 concentration. Based on the theory of radiant transmission, the relationship model between nighttime light radiance and PM2.5 concentration can be established. Therefore, the use of nighttime light images can realize the roughly estimation of nighttime PM2.5 concentration, which extends the use of remote sensing images to estimate PM2.5 concentration. PM2.5 has become the main air pollution in the Pearl River Delta (PRD) urban agglomeration, which has caused great harm to people’s health. PM2.5 output outside the PRD is the main source of PM2.5 in the PRD, especially in autumn and winter [33]. The estimation of nighttime PM2.5 concentration in the PRD still needs further exploration.
Accurate estimation of the nighttime PM2.5 concentration based on nighttime light images overcomes the limitations of satellite remote sensing technology. However, considering the complicated temporal and spatial distributions of PM2.5 and its influencing factors, a given PM2.5 concentration estimation model must also incorporate factors such as meteorology and topography. In addition, the spatial distribution of the PM2.5 concentration exhibits obvious seasonality, and the temporal characteristics of PM2.5 concentration estimation should be further explored in depth. This paper relies on the radiation transmission theory to analyze the correlation between the LJ1-01 nighttime light radiance and PM2.5 concentration and introduces factors such as weather and terrain conditions to construct a multiple linear and machine learning-based regression model to estimate the nighttime PM2.5 concentration in the PRD. We combined ground monitoring site data to evaluate the accuracy of the model results and performed a sensitivity analysis.

2. Study Areas and Data Sources
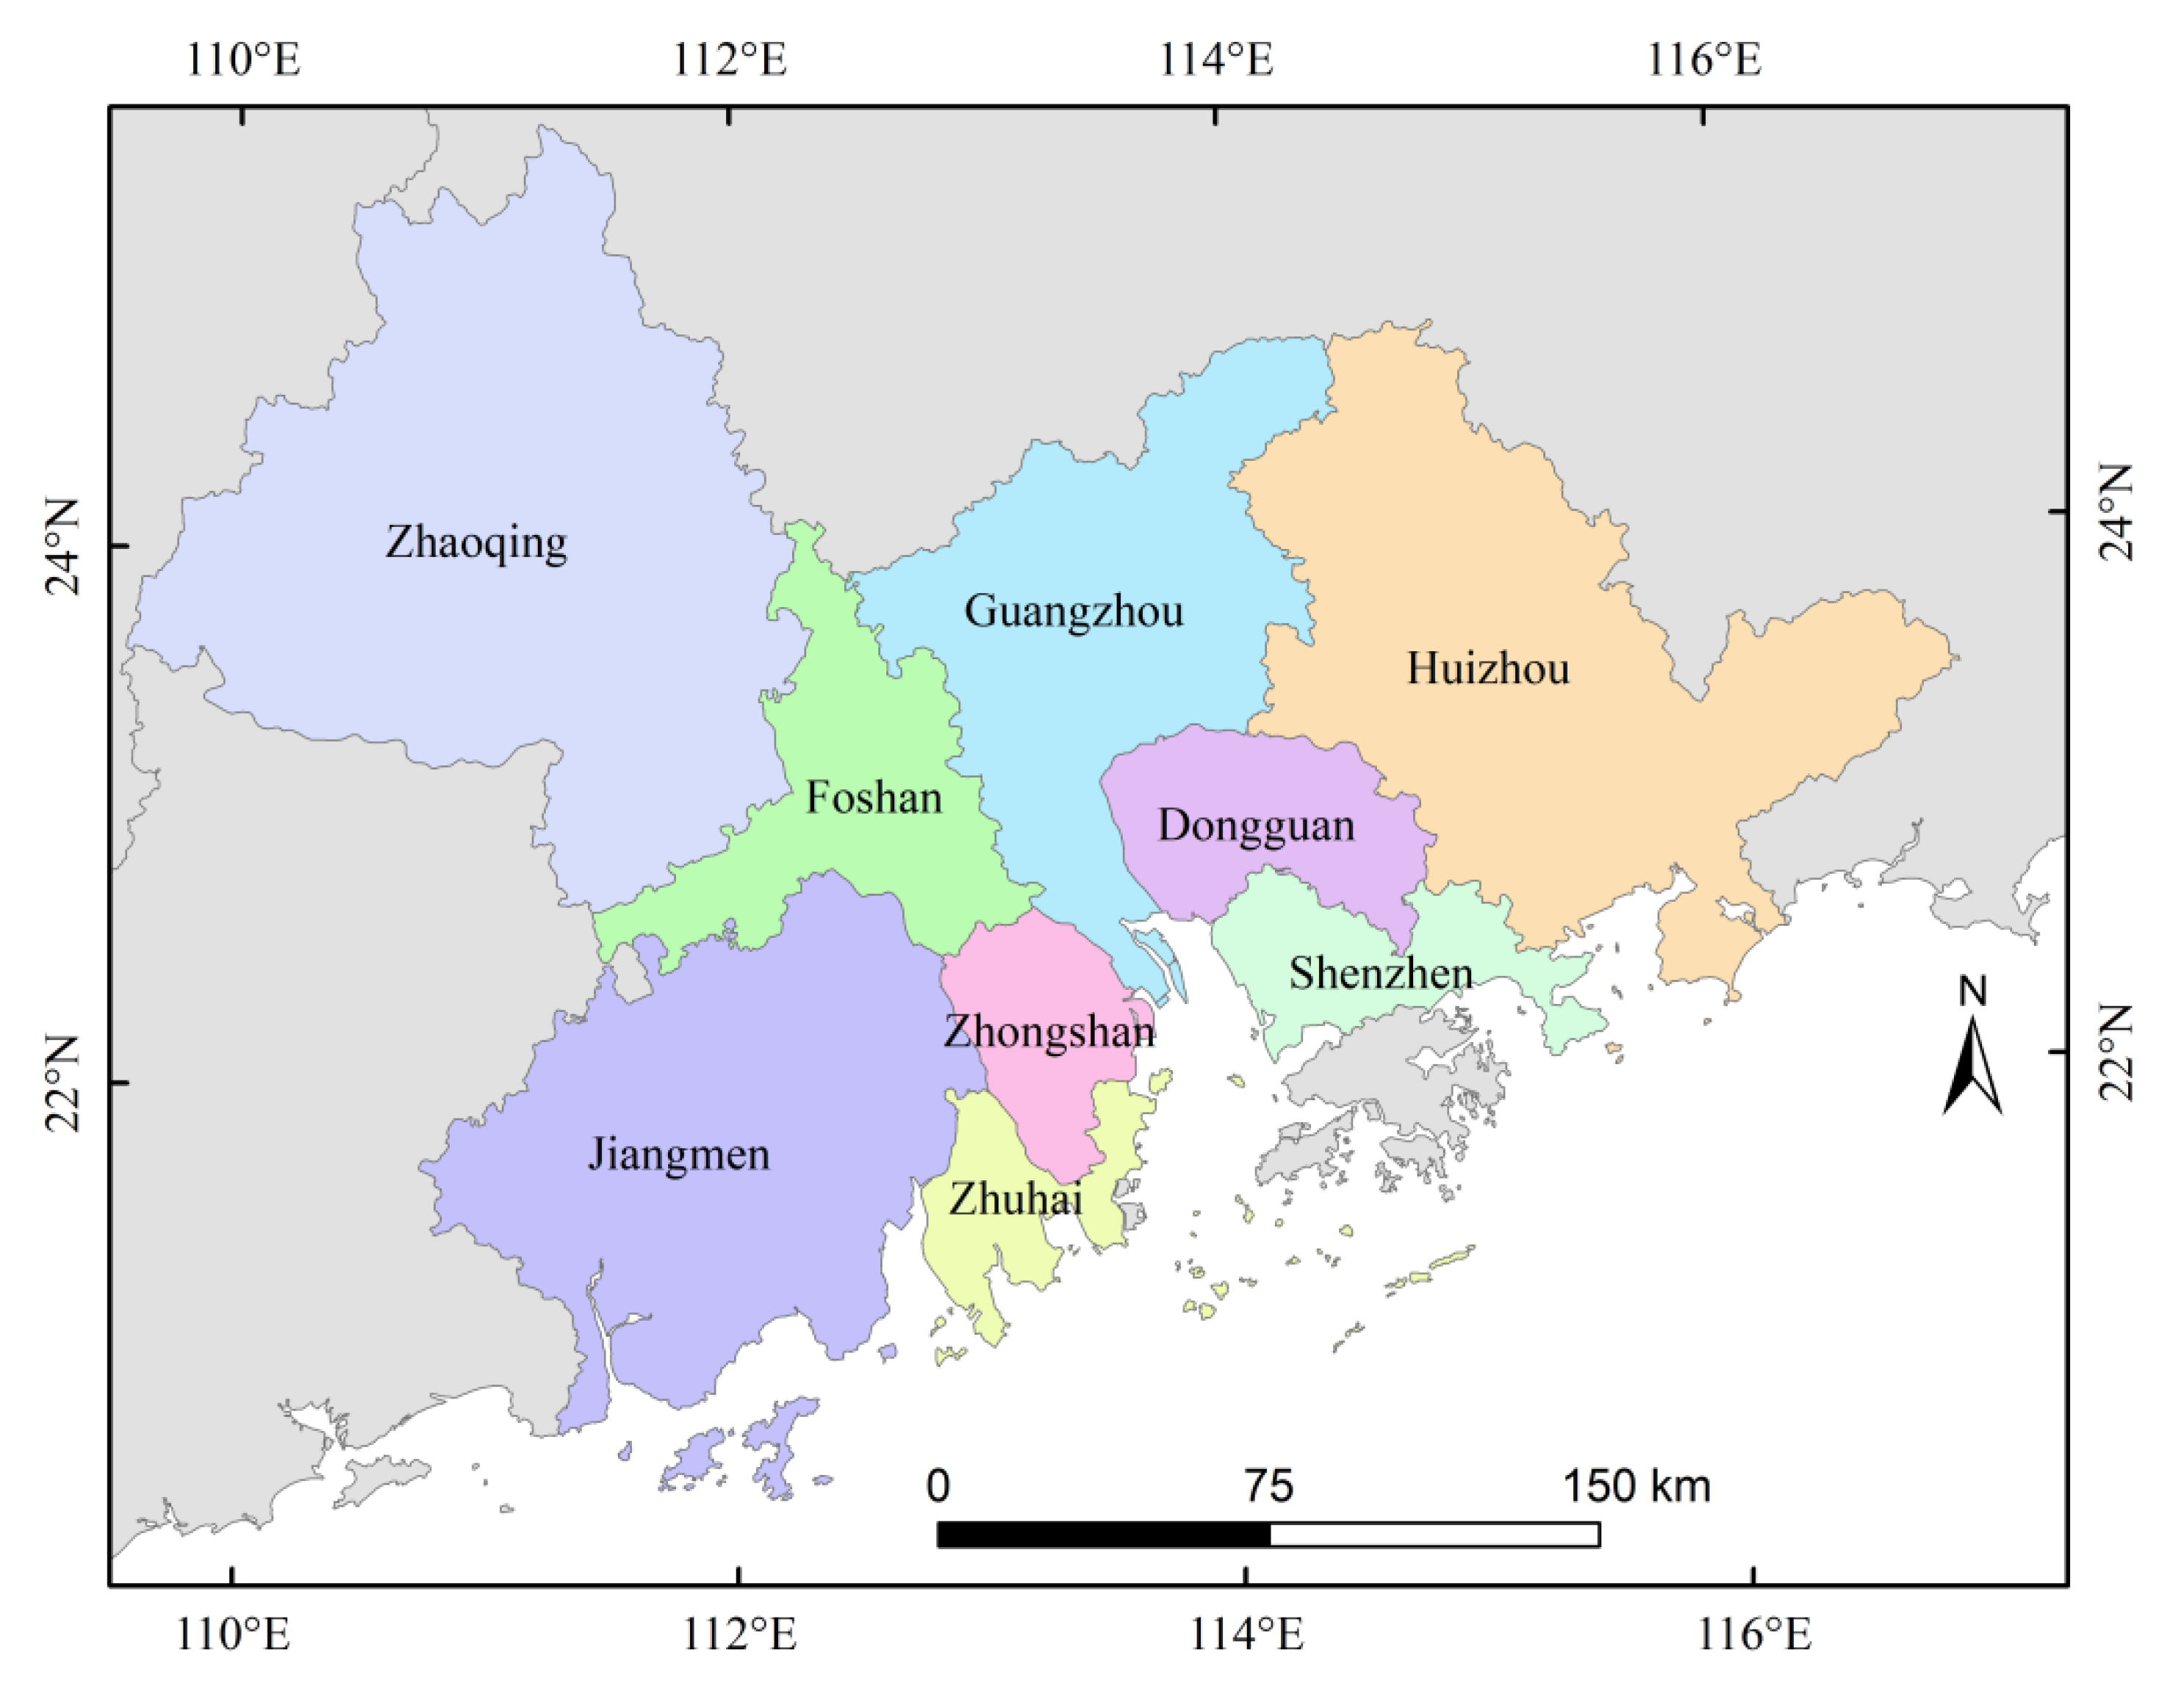
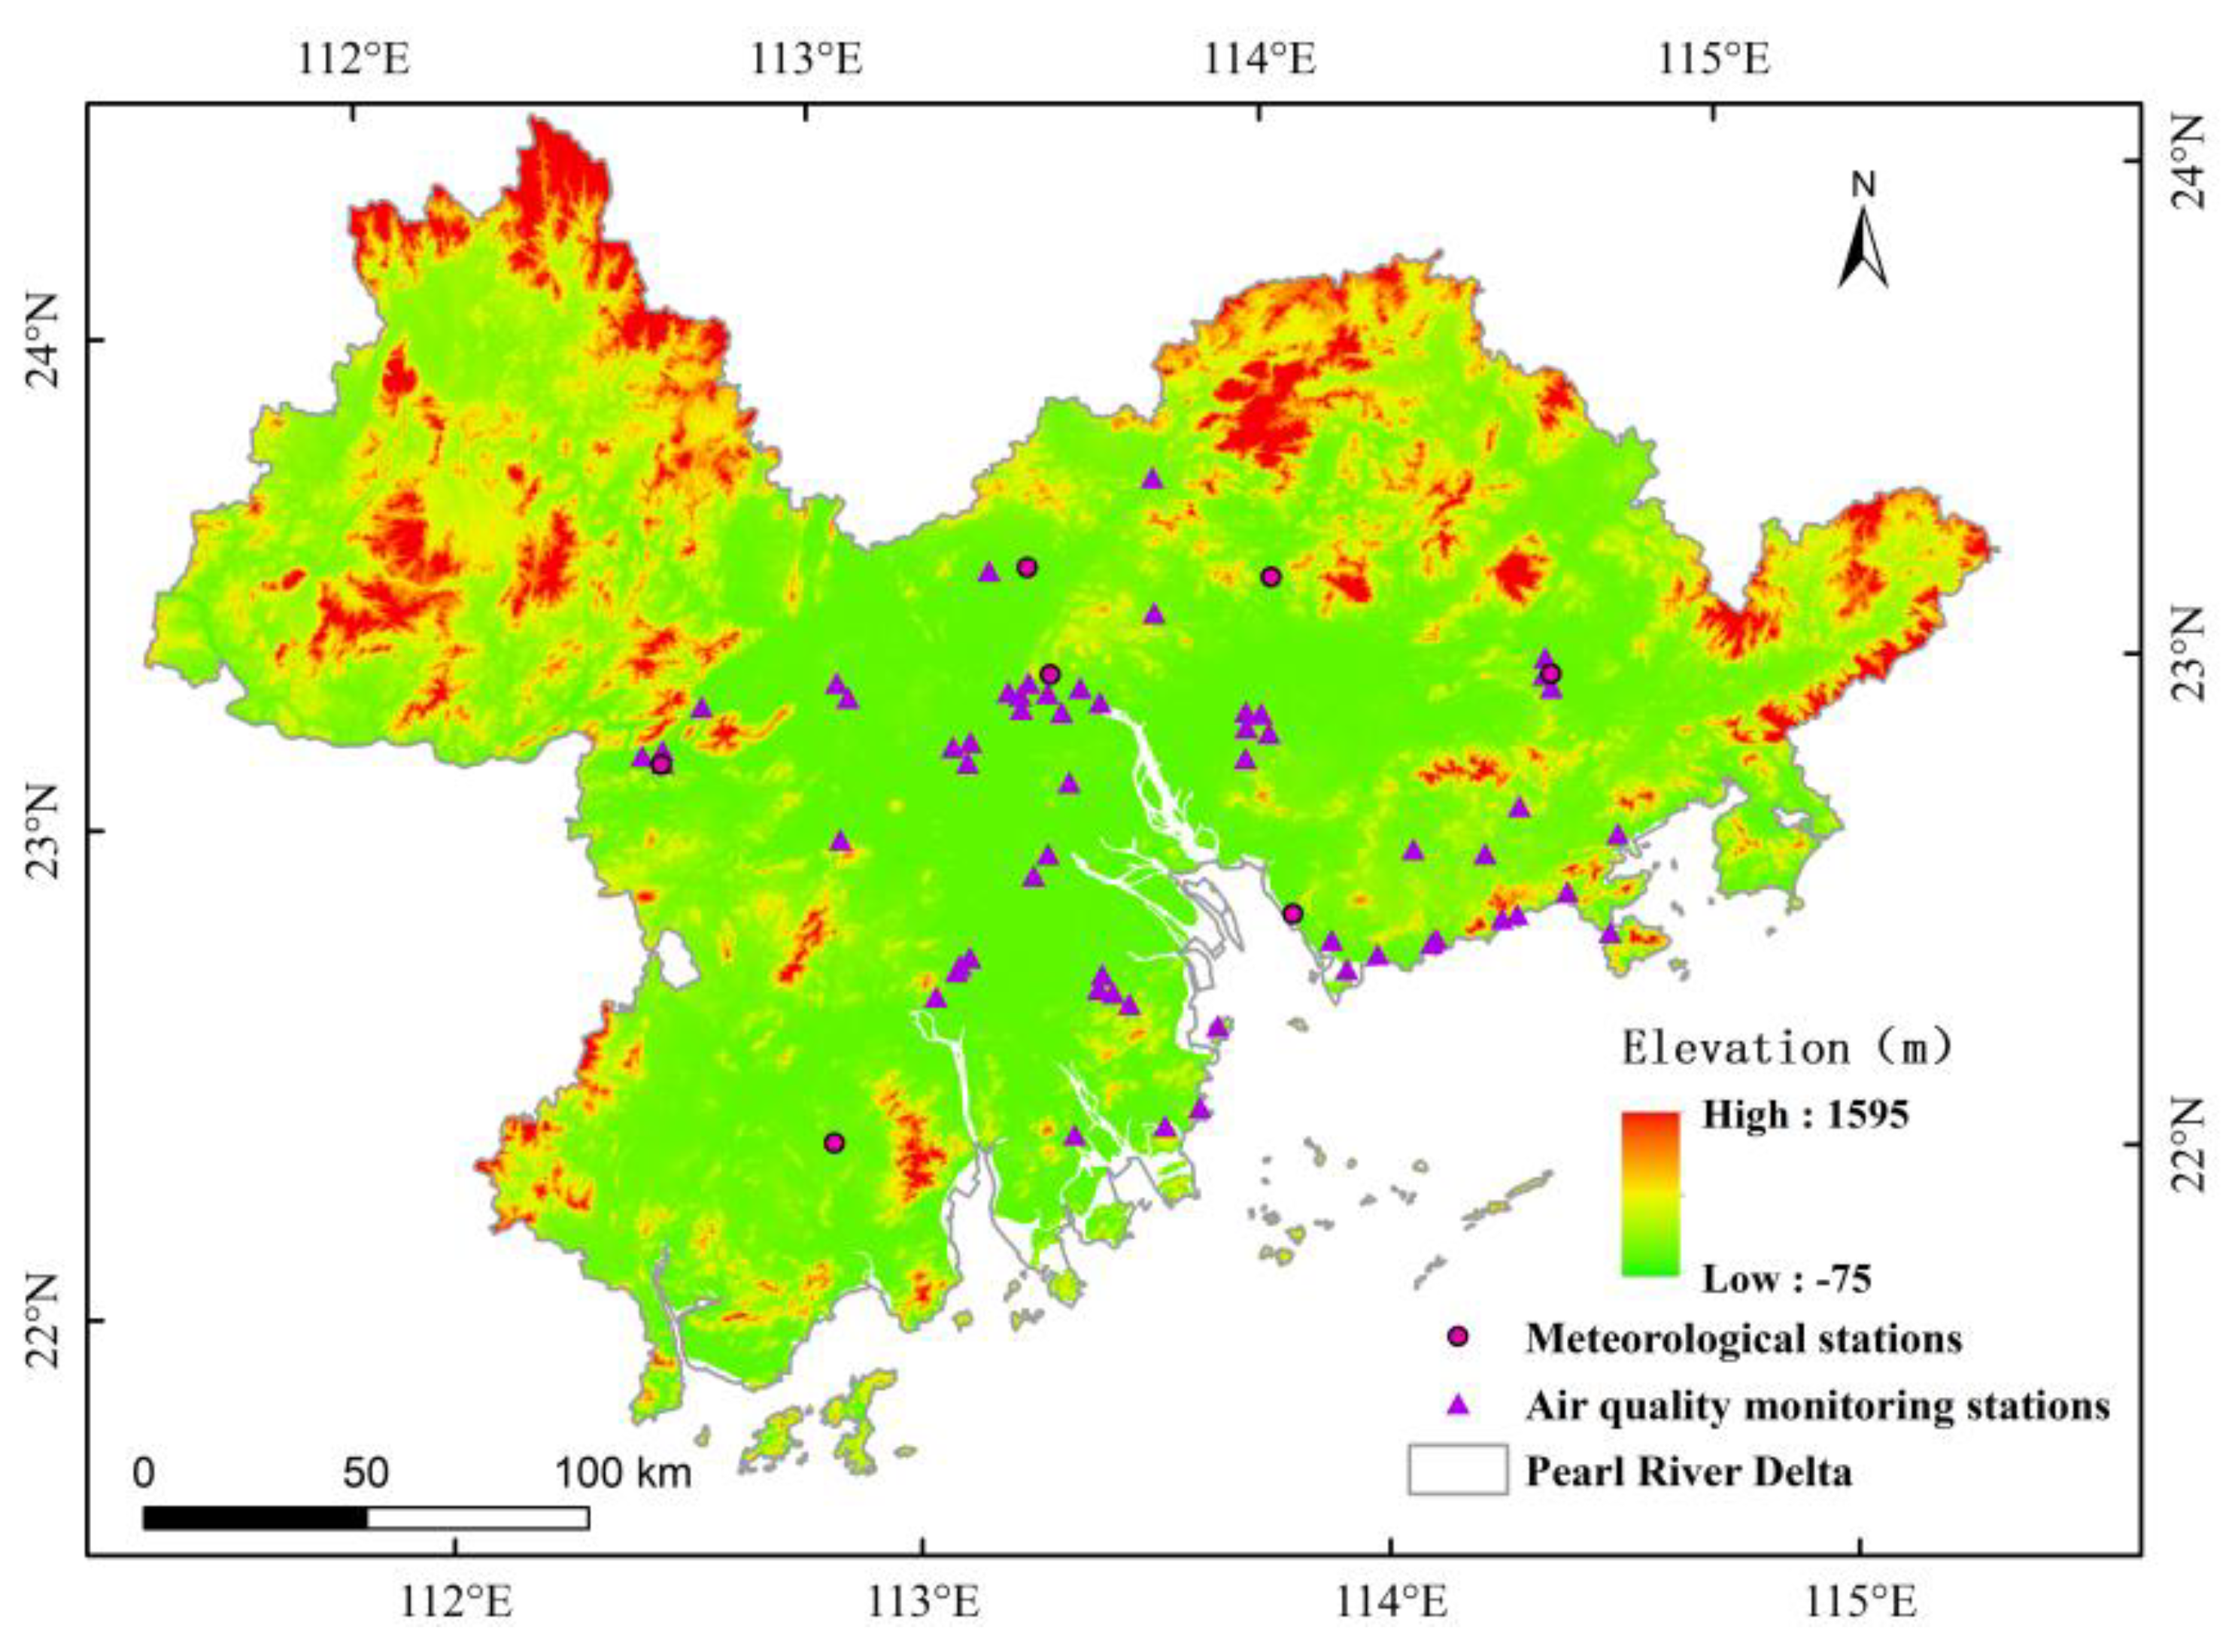
2.1. Study Areas

The study area is the PRD, which is located in the south-central part of Guangdong Province, China (as shown in Figure 1) and the lower reaches of the Pearl River, bordering the South China Sea, and most of them are located south of the Tropic of Cancer. The region experiences a subtropical marine monsoon climate. It covers nine prefecture-level cities, including Guangzhou, Shenzhen, Foshan, Dongguan, Zhuhai, Huizhou, Zhaoqing, Jiangmen and Zhongshan, with a total area of 55368.7 square kilometers. The PRD is one of the most economically well-developed regions in China and one of the four major industrial bases. Serious air pollution problems occur and could be attributed to automobile exhaust and industrial exhaust emissions [33]. Among them, the concentrations of PM2.5 has risen to a large extent in the past period of time, which has caused great harm to human health [34,35]. At the same time, the Chinese Government has also realized that PM2.5 and other air pollutants has caused serious harm to the development of society and economy. Therefore, it has introduced and implemented relevant pollution gas emission reduction policies, resulting in decrease of the PM2.5 concentration in the PRD [33,36,37]. Although the PM2.5 concentration in the PRD is up to standard in recent years, the area is still facing the challenge of air pollution control. As an important indicator of the air quality, continuous improvement, monitoring and estimation of the PM2.5 concentration are increasingly crucial.

2.2. Data Sources

The experimental data in this article include PM2.5 ground monitoring data, LJ1-01 nighttime light remote sensing images, weather data and digital elevation model (DEM) data pertaining to the PRD at 22:00 on 3 September, 26 October, 24 November 2018, and 11 March 2019.
The hourly PM2.5 concentration monitoring data of the PRD originate from the national real-time air quality reporting platform of the China Environmental Monitoring Station, which includes 56 ground monitoring stations (as shown in Figure 2). The spatial distribution is relatively uniform and basically covers the PRD area.
LJ1-01 nighttime light remote sensing images are obtained from the Hubei Data and Application Center of the High-Resolution Earth Observation System. In this paper, the provided Geocoded ellipsoid corrected system geometric correction products are selected. The LJ1-01 Starlight Remote Sensing Satellite is equipped with a complementary metal oxide semiconductor (CMOS) sensor. It was launched on 2 June 2018. Under ideal conditions, global nighttime images can be obtained within 15 days. The image resolution is 130 m, the width is 250 km, and the wavelength ranges from 0.5–0.9 μm. LJ1-01 nighttime light remote sensing images are currently high-resolution and radiometrically calibrated nighttime light data [38,39]. It has great application potential in the recognition of built-up areas and the modeling of social-economic parameters [40,41,42,43,44]. This article adopts the radiance equation provided by the Hubei Data and Application Center of the High-Resolution Earth Observation System to convert the radiance. Then, road data for 2015 provided by the National Geographic Information Resource Catalog Service System are applied for geo-reference purposes. A given original nighttime light image is projected onto the coordinate system of Krasovsky_1940_Albers. Based on spatial autocorrelation and existing research results [30], the total value of the nighttime light radiance within a radius of 500 m around the ground station is adopted as the nighttime light radiance value of the ground station.
The hourly meteorological data of the PRD obtained from the National Oceanic and Atmospheric Administration (NOAA), including seven meteorological stations, which basically cover most of the Pearl River Delta. The meteorological data in this experiment mainly include three meteorological elements, i.e., the temperature, wind speed and relative humidity. According to the spatial correlation and stability of the distribution of meteorological elements within a small area, hourly meteorological data at 56 PM2.5 ground monitoring stations in the PRD are generated based on seven meteorological stations according to the kriging interpolation method.
DEM data pertaining to the experimental area originate are retrieved from US Shuttle Radar Topography Mission (SRTM) data, which is a 90-m resolution DEM data set generated through collating and splicing based on the latest SRTM V4.1 data. The slope, topographic undulation and other terrain elements in this paper are all derived from DEM data.

3. Methods

3.1. Correlation Analysis of the Nighttime Light Radiance and PM2.5 Concentration

Based on the theory of radiation transmission, a relationship model between the nighttime light radiance and PM2.5 concentration in the near-surface layer can be established. Based on this model, this paper analyzes the correlation between the LJ1-01 nighttime light radiance and PM2.5 concentration.
First, assuming that no change occurs in the distribution of surface features (especially buildings and city lights) around a certain PM2.5 ground monitoring site, there exists light radiance I 0 , where the light emitted upward from a Lambertian body is reflected/scattered by various physical media. Therefore, I 0 can be considered constant with spatial differences at the same night time level [29,30]. Assuming that the multiple scattering effect of aerosols is negligible, the nighttime light radiance reaching the LJ1-01 CMOS sensor follows Beer’s law, which can be expressed as Equation (1):
I = I 0 e τ u ,
where I is the nighttime light radiance of the LJ1-01 image, τ is the optical thickness of the observed atmosphere, and u is the cosine of the zenith angle of the satellite observation.
Assuming that the boundary layer at night exhibits a good and stable aerosol extinction coefficient profile structure and PM2.5 is uniformly mixed at the effective height [30], the atmospheric optical thickness at night is:
τ = PM 2.5 f R H Q m H + τ R a y + τ g a s ,
where f R H is the moisture absorption factor that describes the aerosol size and refractive index according to the relative humidity, Q m is the extinction efficiency under dry conditions, H is the effective height of the aerosol mixed layer, and τ R a y is the first-order Rayleigh scattering optical thickness. The proportional relationship with the atmospheric pressure P is a linear relationship of a p , where τ g a s is the influence of atmospheric absorption on the optical thickness, and the proportional relationship with atmospheric water vapor W is a linear relationship involving a w .
Due to the hygroscopic growth characteristics of PM2.5, the relative humidity imposes a greater influence on the PM2.5 particle size. Therefore, it is necessary to correct the PM2.5 ground station data for the relative humidity to obtain the actual PM2.5 concentration at each ground station. This paper chooses an exponential moisture absorption growth factor model to explain the moisture absorption growth characteristics of PM2.5 in the PRD [45,46]. The model expression is as follows:
f R H = 0.68 × 1 R H 100 0.56 .
In the above equation, R H is the relative humidity. Combining Equations (1)–(3), we can obtain:
P M 2.5 f R H Q m H u = ln I 0 ln I a p P a w W .
There exists a linear relationship between the atmospheric water vapor volume W and near-surface water vapor pressure e :
W = b e + a e e ,
where b e and a e are coefficients. Moreover, the relative humidity R H can be obtained from the near-surface water vapor pressure e and saturated water vapor pressure E :
R H = e E × 100 % .
Equation (4) can be rewritten as:
P M 2.5 f R H Q m H u = ln I 0 ln I a p P a e R H   E .
On-site Q m and H measurements are difficult to perform in real time, and these two parameters do not contribute significantly to the estimation accuracy of the model [30]. If it is assumed that these two variables remain constant, errors will accumulate in the model estimation results. If the elevation change between the various PM2.5 ground monitoring sites is small, the atmospheric pressure difference between the sites is not large, and the corresponding impact on the accuracy of the model results is negligible [30]. Therefore, Equation (7) can be roughly simplified as:
P M 2.5 f R H u ln I 0 ln I a e R H   E .
Since the saturated vapor pressure E is a function of the air temperature C , the three variables in P M 2.5 f R H u can be obtained, namely, ln I , ln I 0 , C and R H .
Through the above analysis, a correlation model between the nighttime light radiance and PM2.5 concentration is preliminarily established. Considering the complicated processes determining the temporal and spatial distributions of the PM2.5 concentration and the difficulty of data acquisition, the results directly estimated with the above relationship contain large errors [30]. It is also necessary to construct an accurate model in conjunction with other factors related to the PM2.5 concentration.

3.2. PM2.5 Concentration Estimation Model Based on Nighttime Light Images

Zhang et al. [47] found that simple models exhibit limitations in the simulation of complex geographic phenomena considering multiple factors with a high accuracy. Among these factors, meteorological elements are important factors that influence the temporal and spatial distributions of PM2.5 [48,49,50,51,52,53]. In addition, topographical elements affect the spatial distribution of PM2.5 to a certain extent [54,55,56]. Therefore, a PM2.5 concentration estimation model that considers the influences of multiple factors simultaneously, such as weather and topography, can provide high-precision PM2.5 concentration simulation results.
In this paper, referring to the research results of Wang et al. [30], a multiple linear regression model is applied to construct a nighttime PM2.5 concentration estimation model suitable for the PRD. On the basis of the three variables of the LJ1-01 nighttime light radiance ln I , temperature C and relative humidity R H , the wind speed V is separately added to establish Model I. Certain terrain elements including the elevation H , slope S , and terrain undulation T are separately added to build Model II. Subsequently, all elements are added to compile Model III. These three nighttime PM2.5 concentration estimation models are detailed in Equations (9)–(11).
P M 2.5 f R H u = β 0 + β 1 ln I + β 2 C + β 3 R H + β 4 V + ln I 0 ,
P M 2.5 f R H u = β 0 + β 1 ln I + β 2 C + β 3 R H + β 5 H + β 6 S + β 7 T + ln I 0 ,
P M 2.5 f R H u = β 0 + β 1 ln I + β 2 C + β 3 R H + β 4 V + β 5 H + β 6 S + β 7 T + ln I 0 .
In the above equations, β 0 is the constant term of each model, and β 1 , β 2 , β 3 , β 4 , β 5 , β 6 and β 7 are the regression coefficients of each model.

3.3. PM2.5 Concentration Estimation Model Based on Machine Learning

When there is no definite estimation method of the PM2.5 concentration, the application of machine learning can extract key feature information to determine the relationship between known data sets, and the machine model trained with a large amount of data can be applied to realize accurate prediction. Machine learning is increasingly adopted to solve the inversion problem of geographic phenomena, and studies have been performed on PM2.5 concentration inversion [57,58,59]. However, machine learning models and feature selection remain to be studied in depth. Based on the PM2.5 concentration data obtained at ground stations and known data of the nighttime light radiance ln I , air temperature C , relative humidity R H , wind speed V , elevation H , slope S , and terrain undulation T , we construct nighttime PM2.5 concentration estimation Models IV, V, VI, and VII with the four machine learning algorithms of the regression tree, support vector machine, Gaussian process regression and ensemble tree, respectively.
In terms of the parameters of the above four machine learning models, the important parameters with a higher goodness of fit are selected according to the model principle and training results (please refer to Table 1). Among the important parameters, the parameters of regression tree Model IV and ensemble tree Model VII includes minimum leaf size, while the parameters of support vector machine Model V and Gaussian process regression Model VI include the kernel function.

4. Results

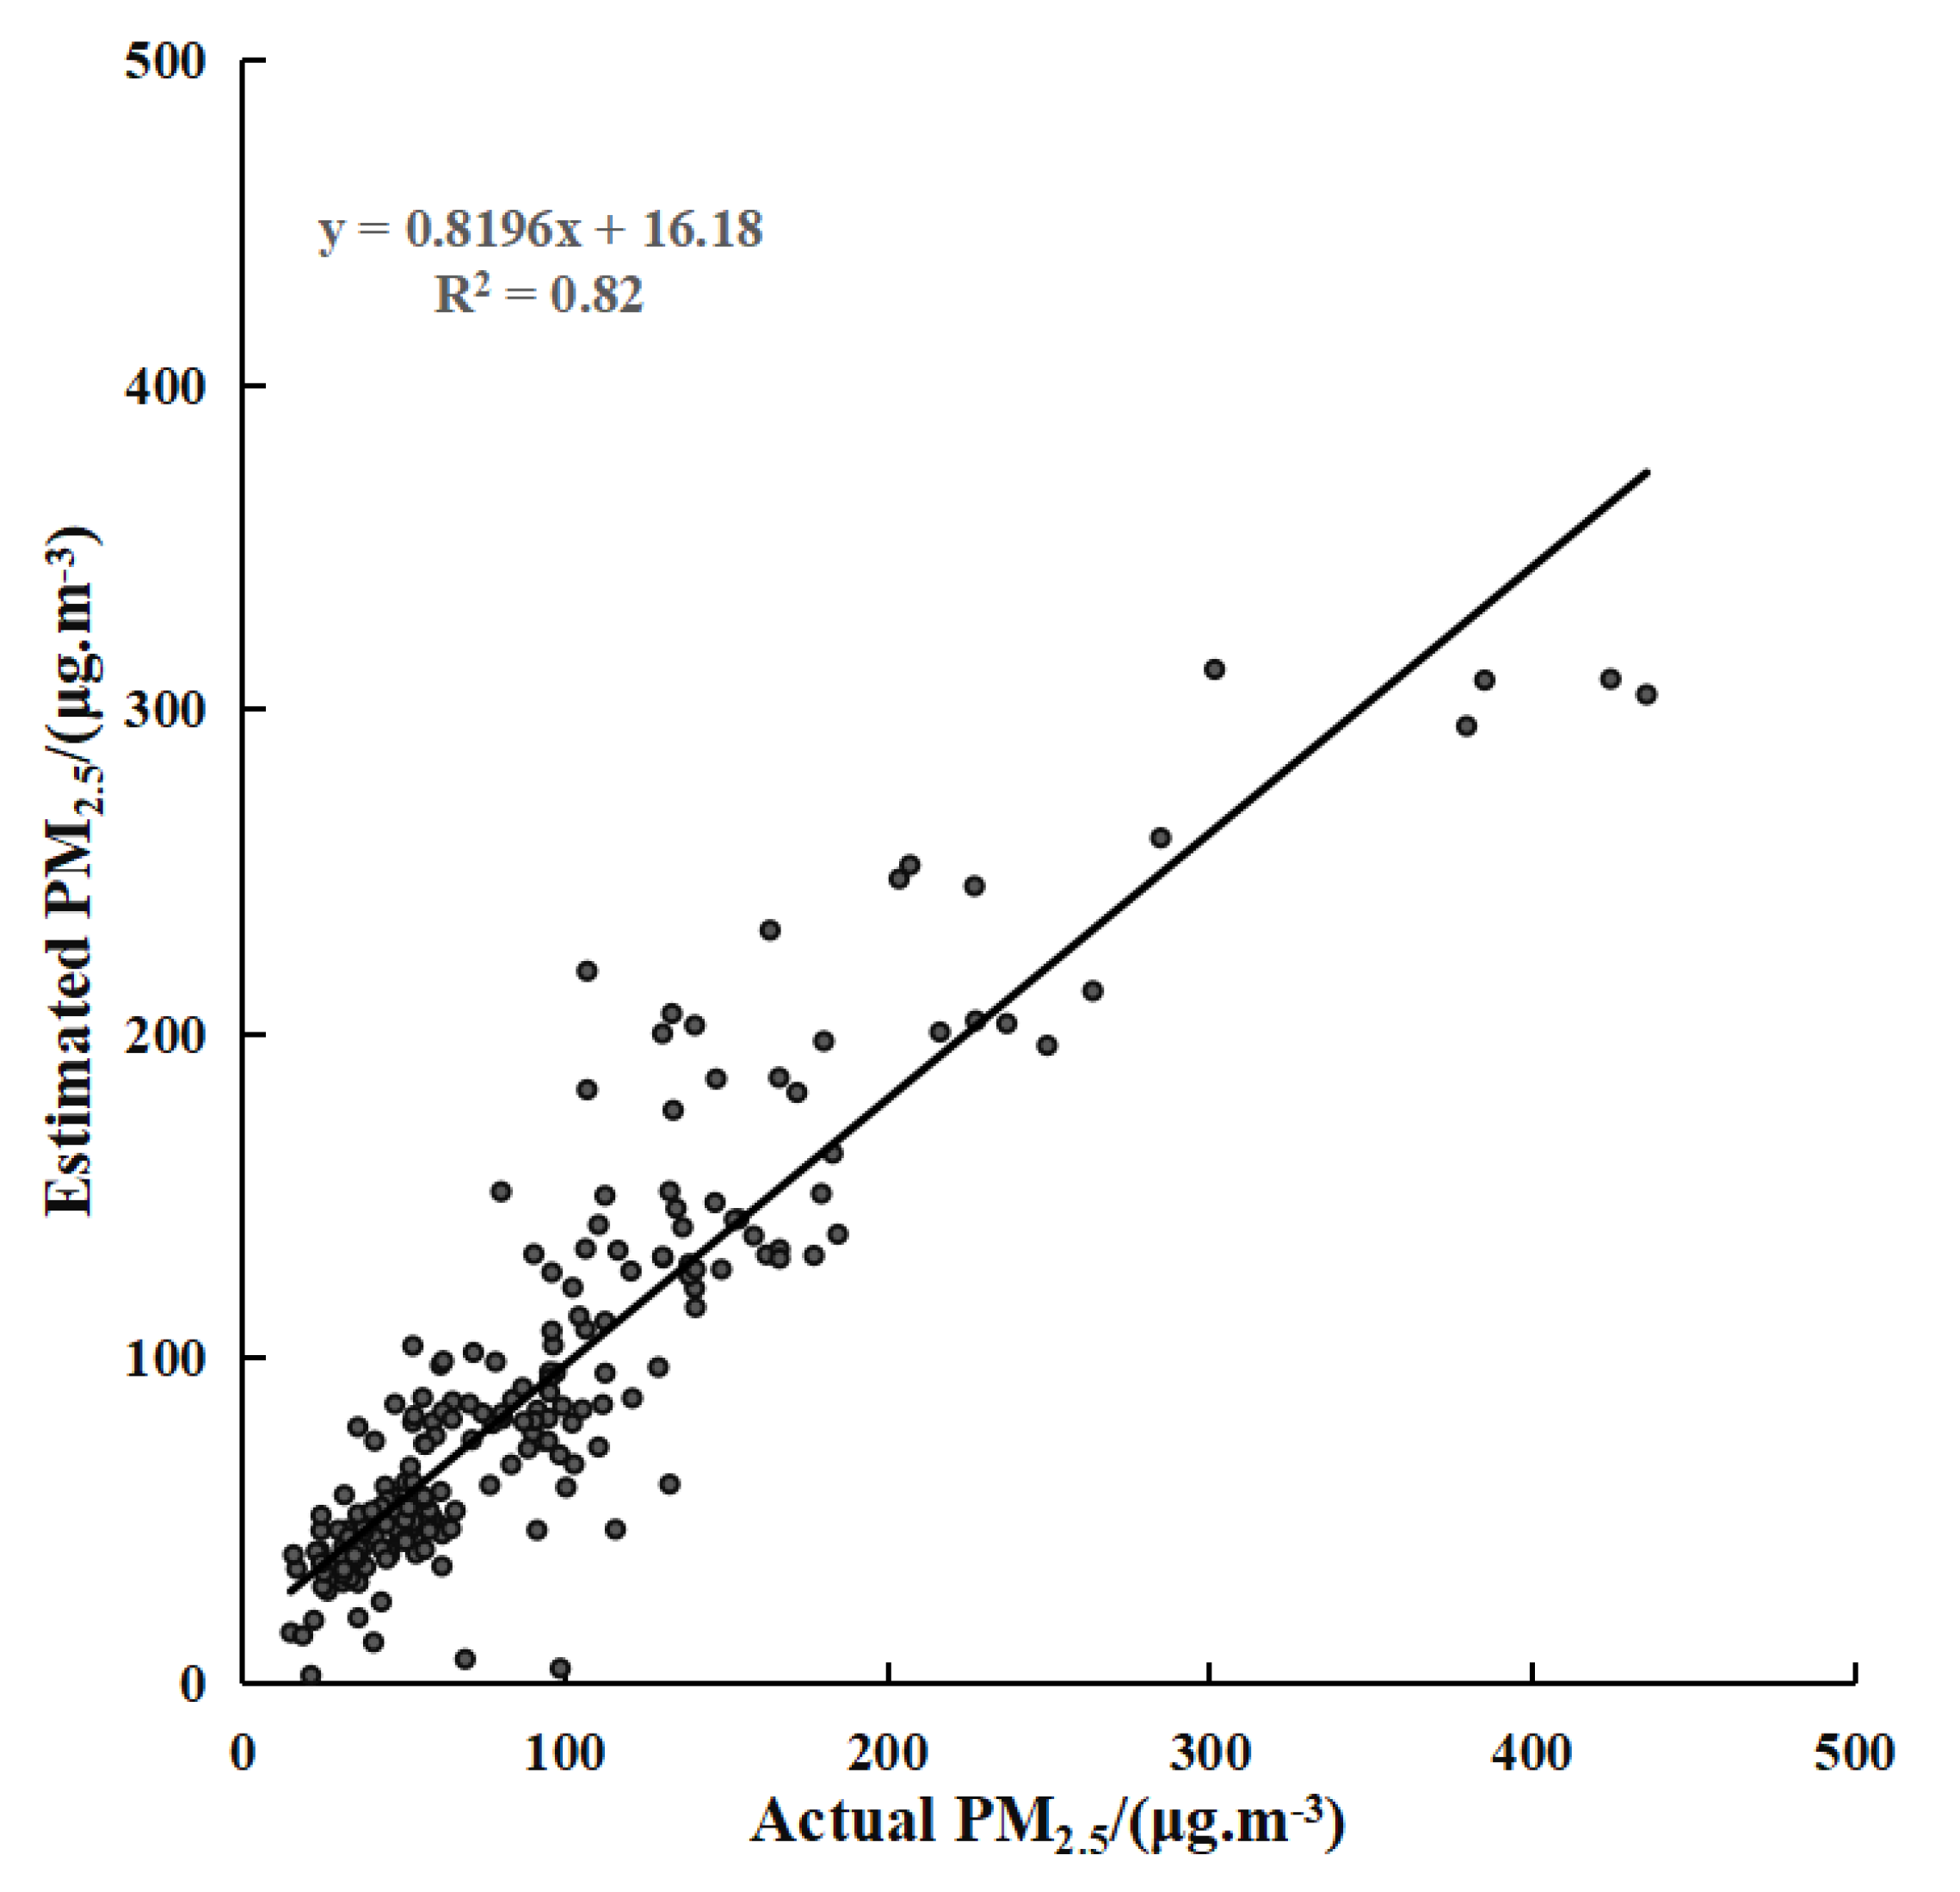
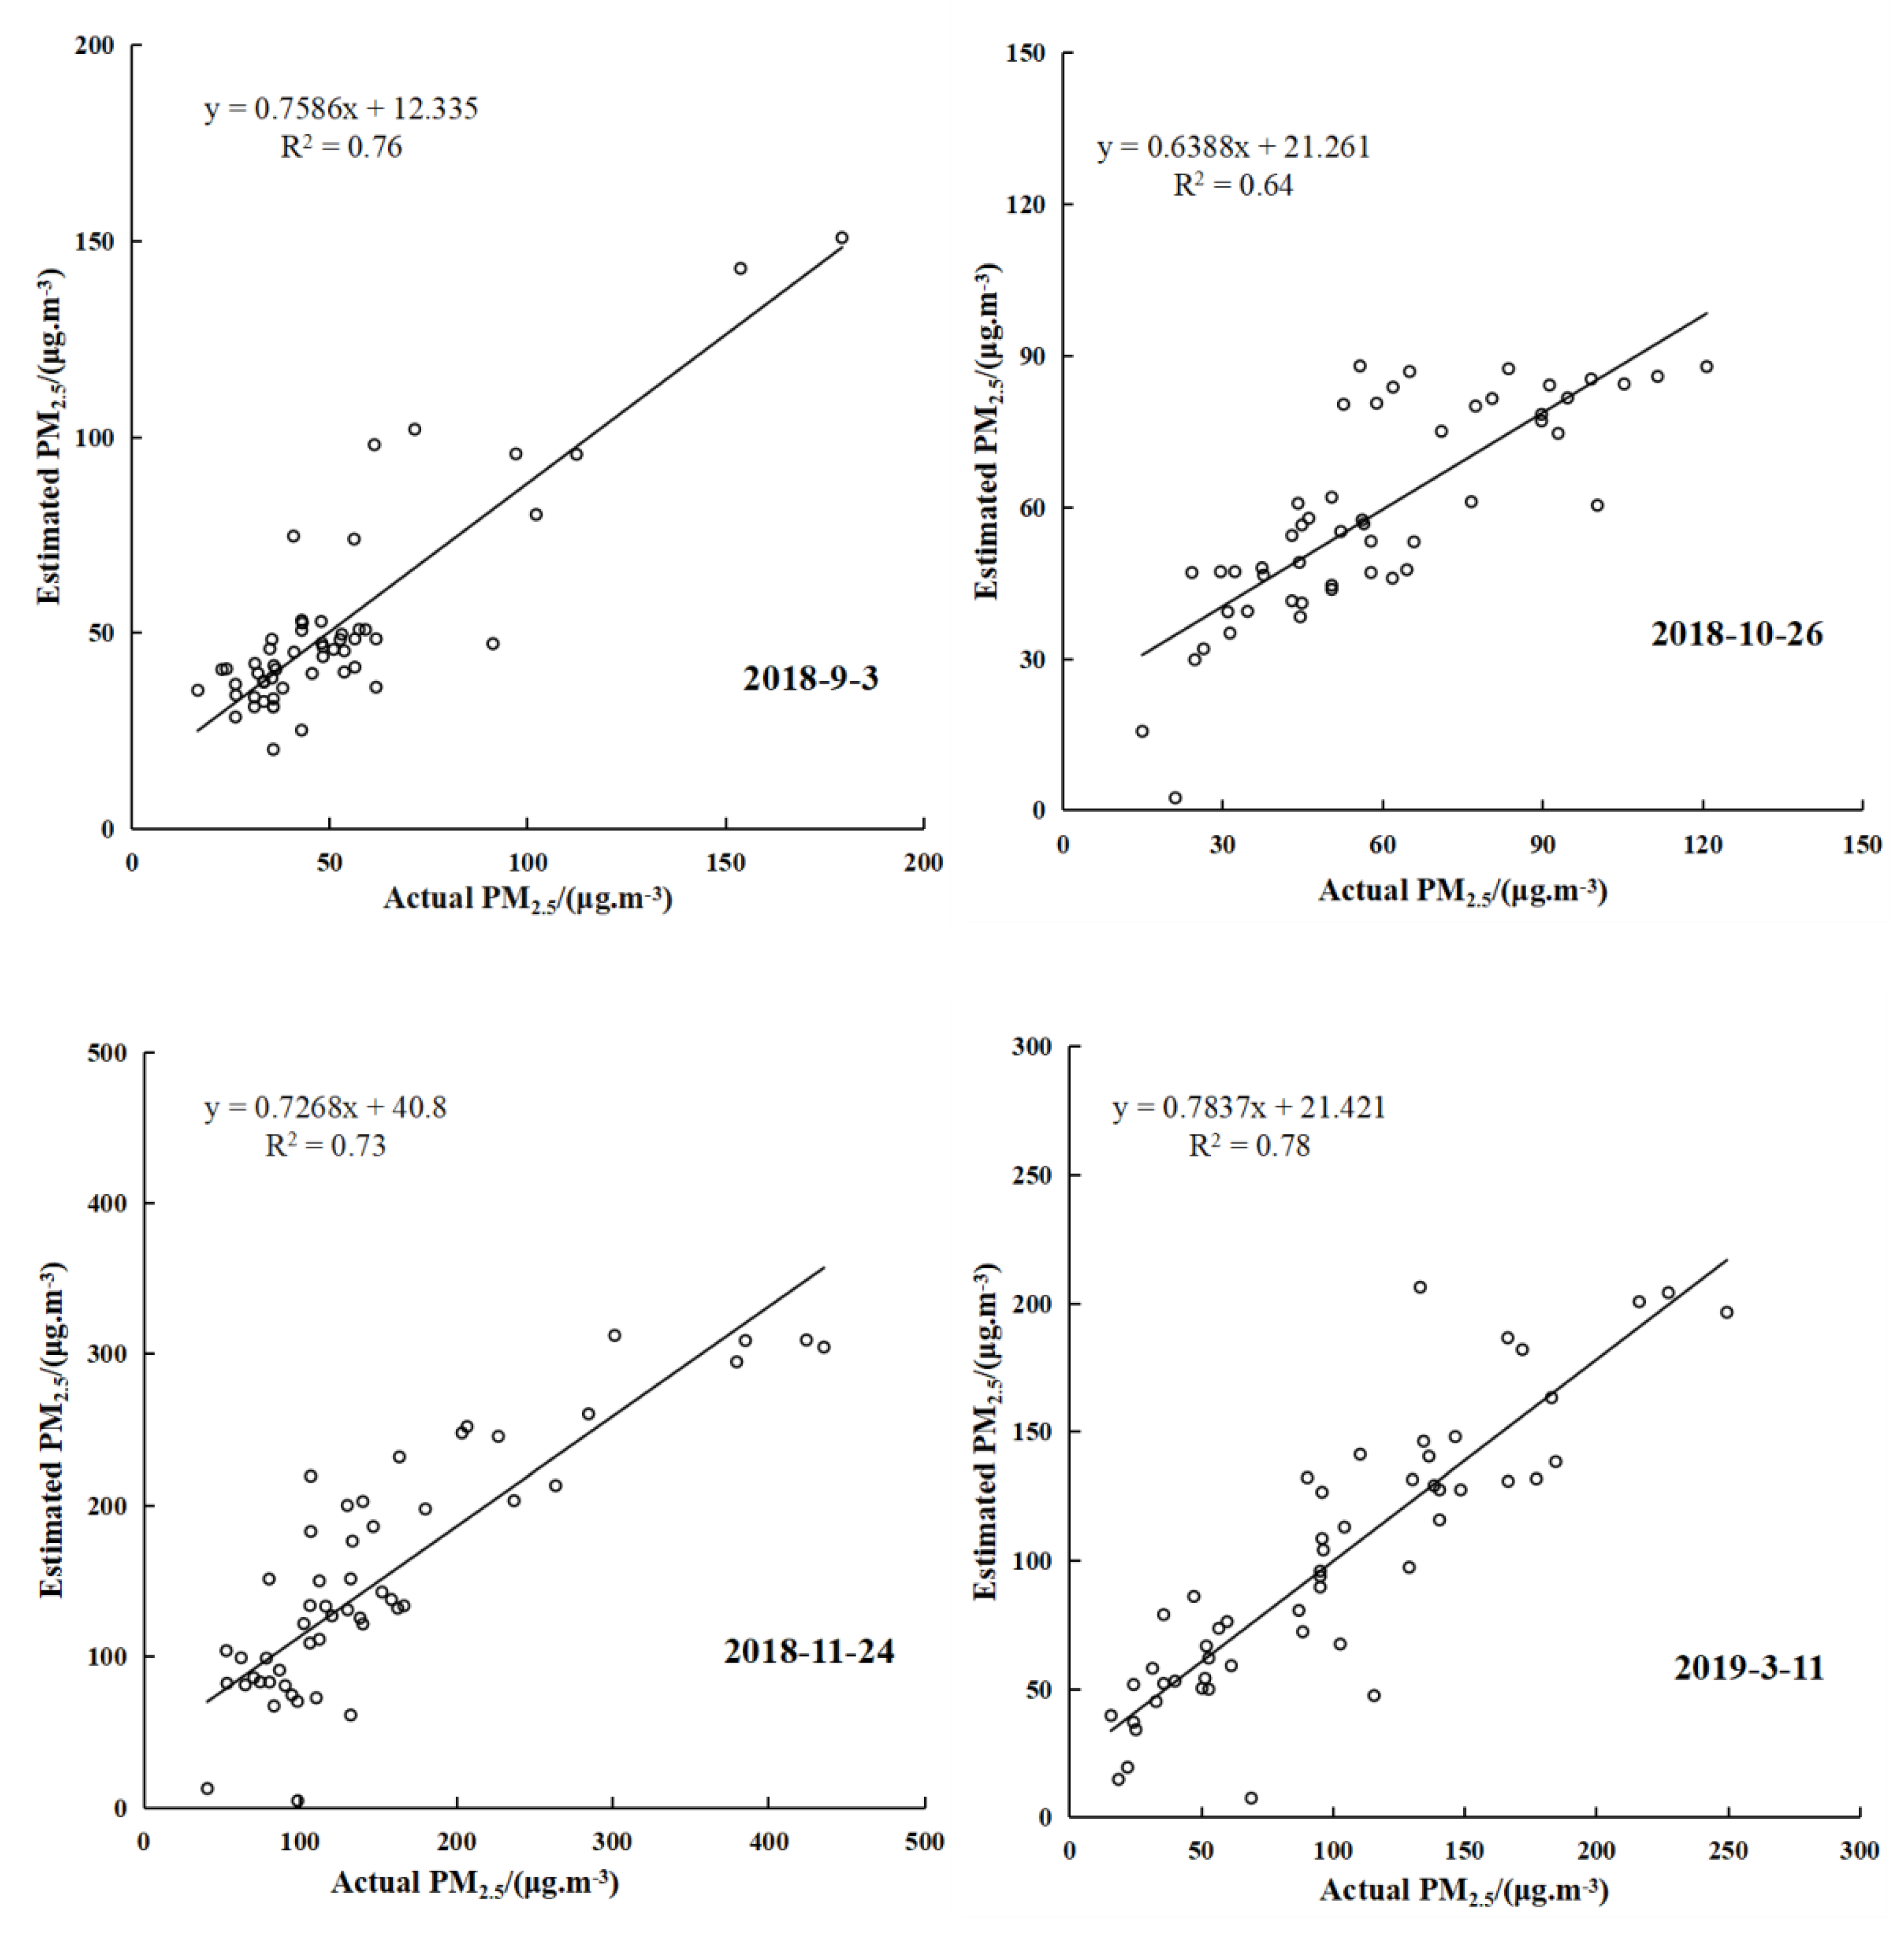
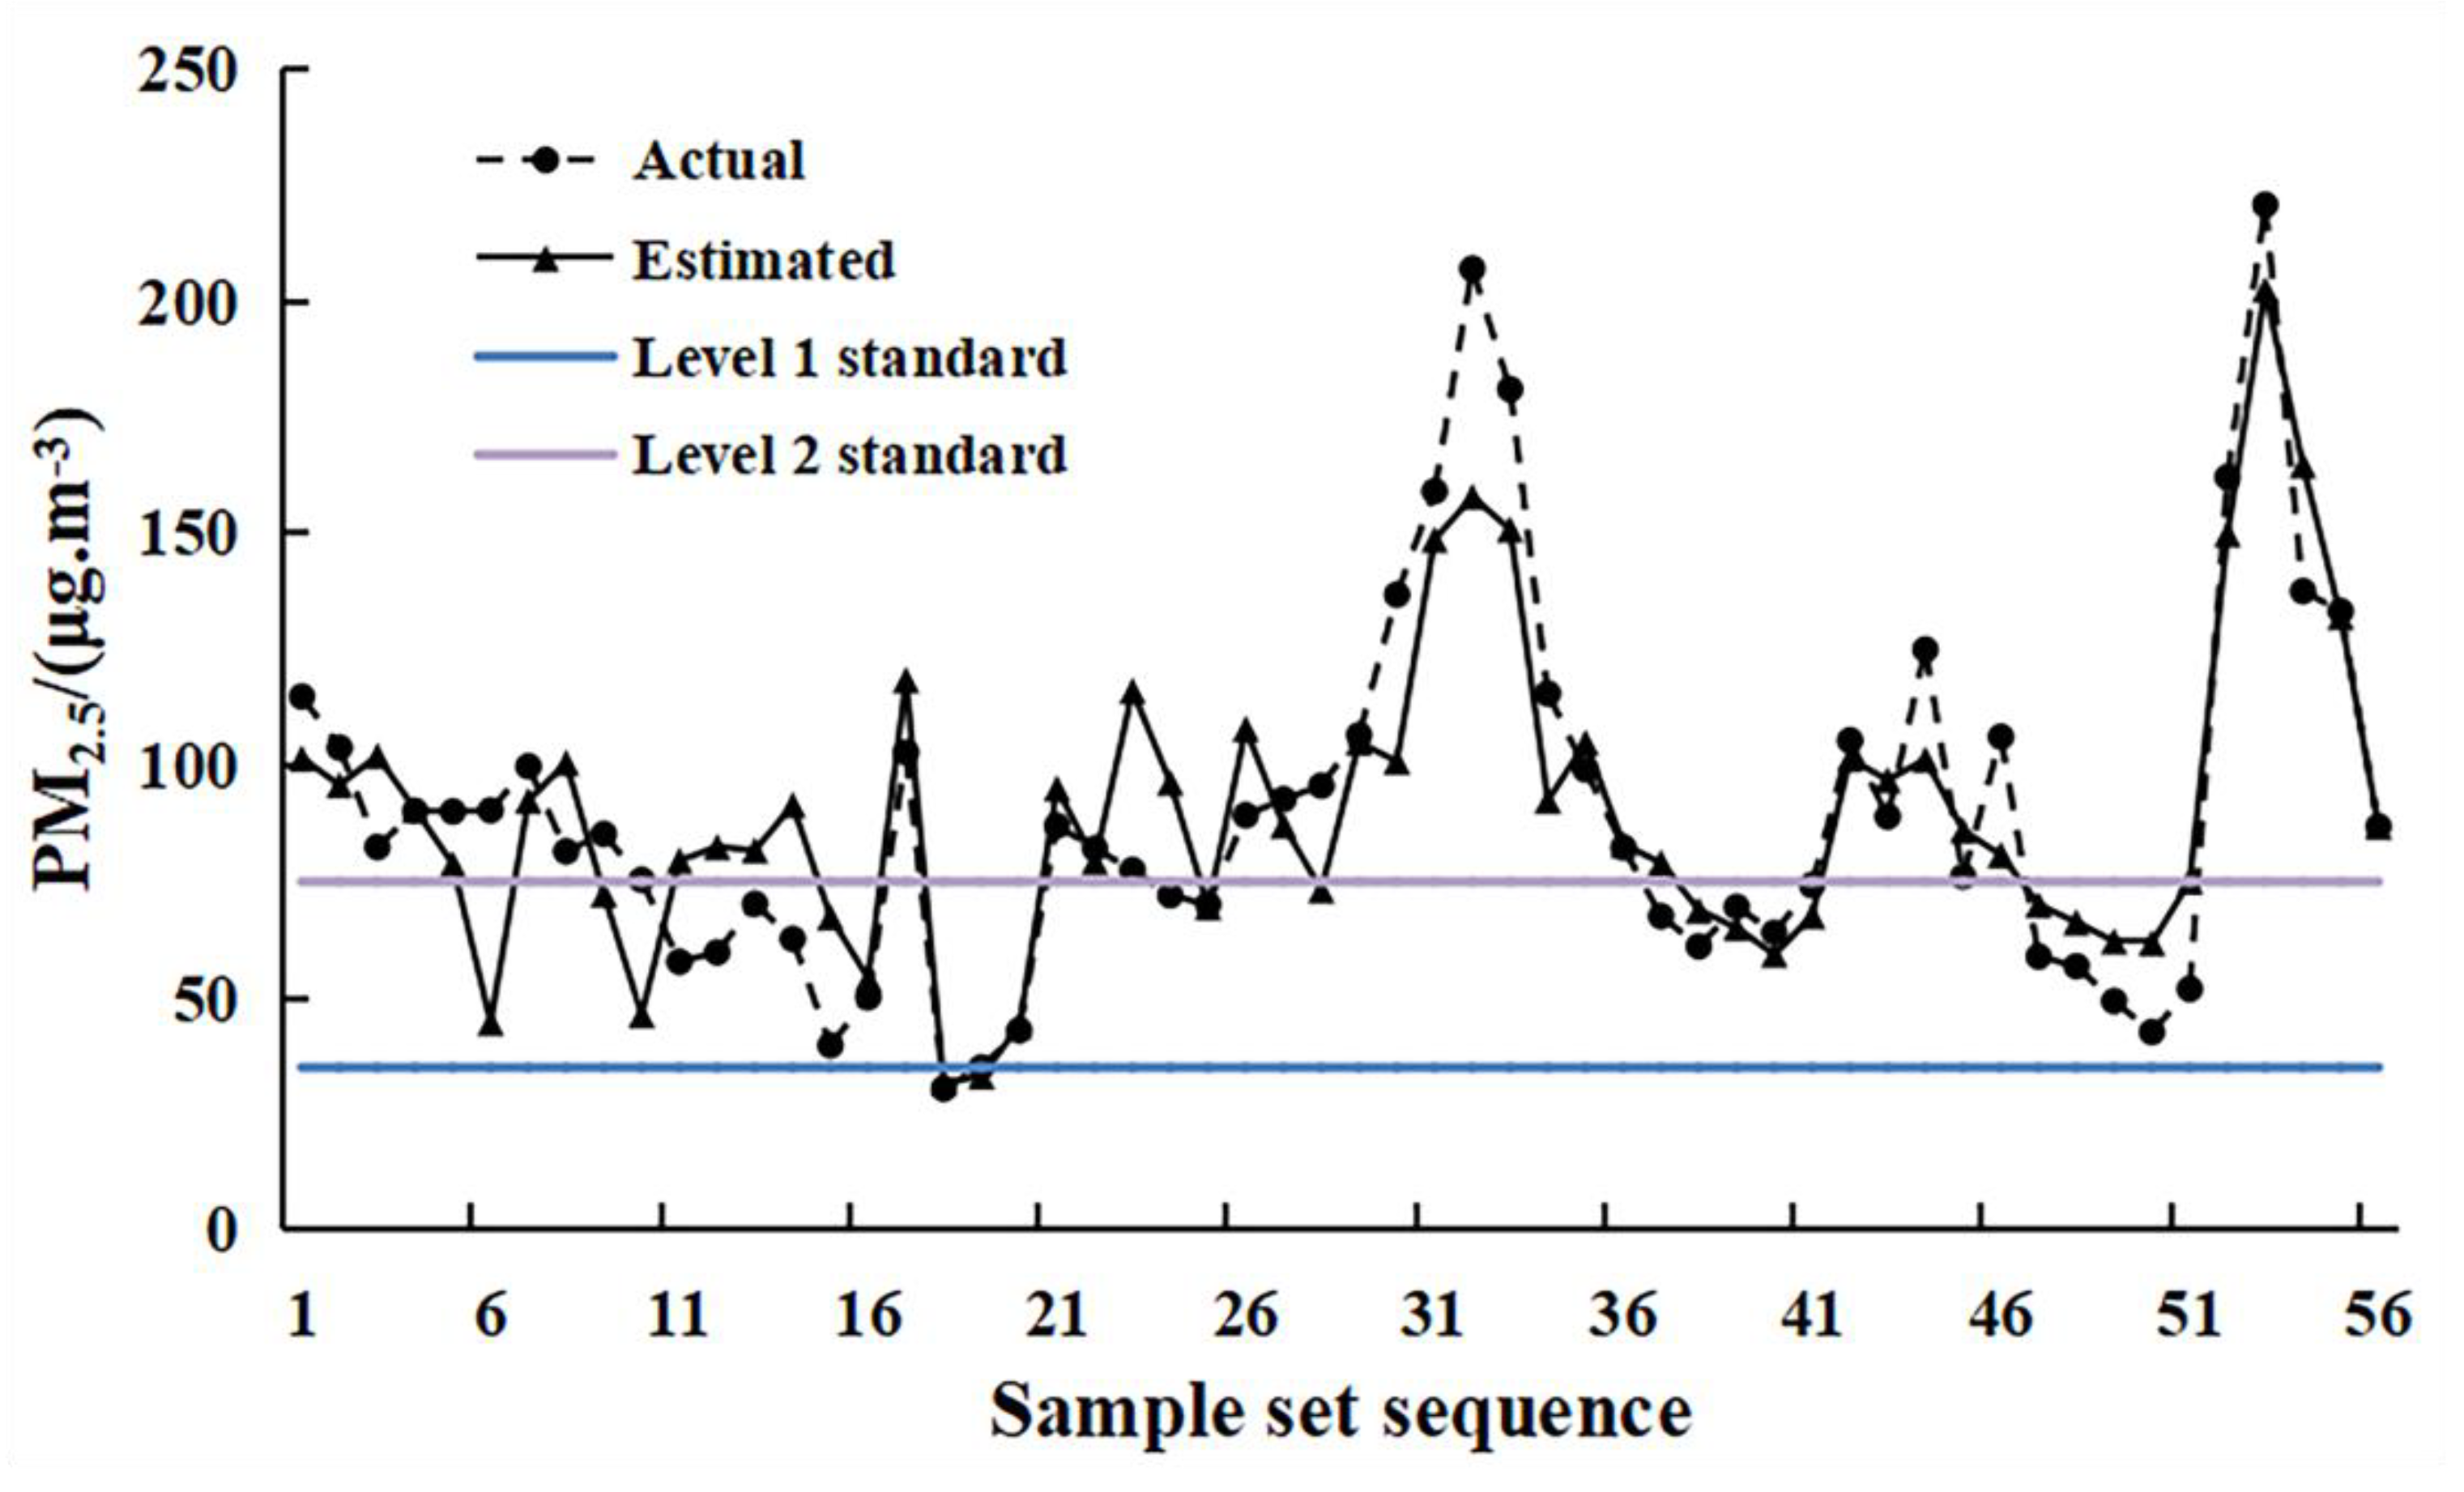
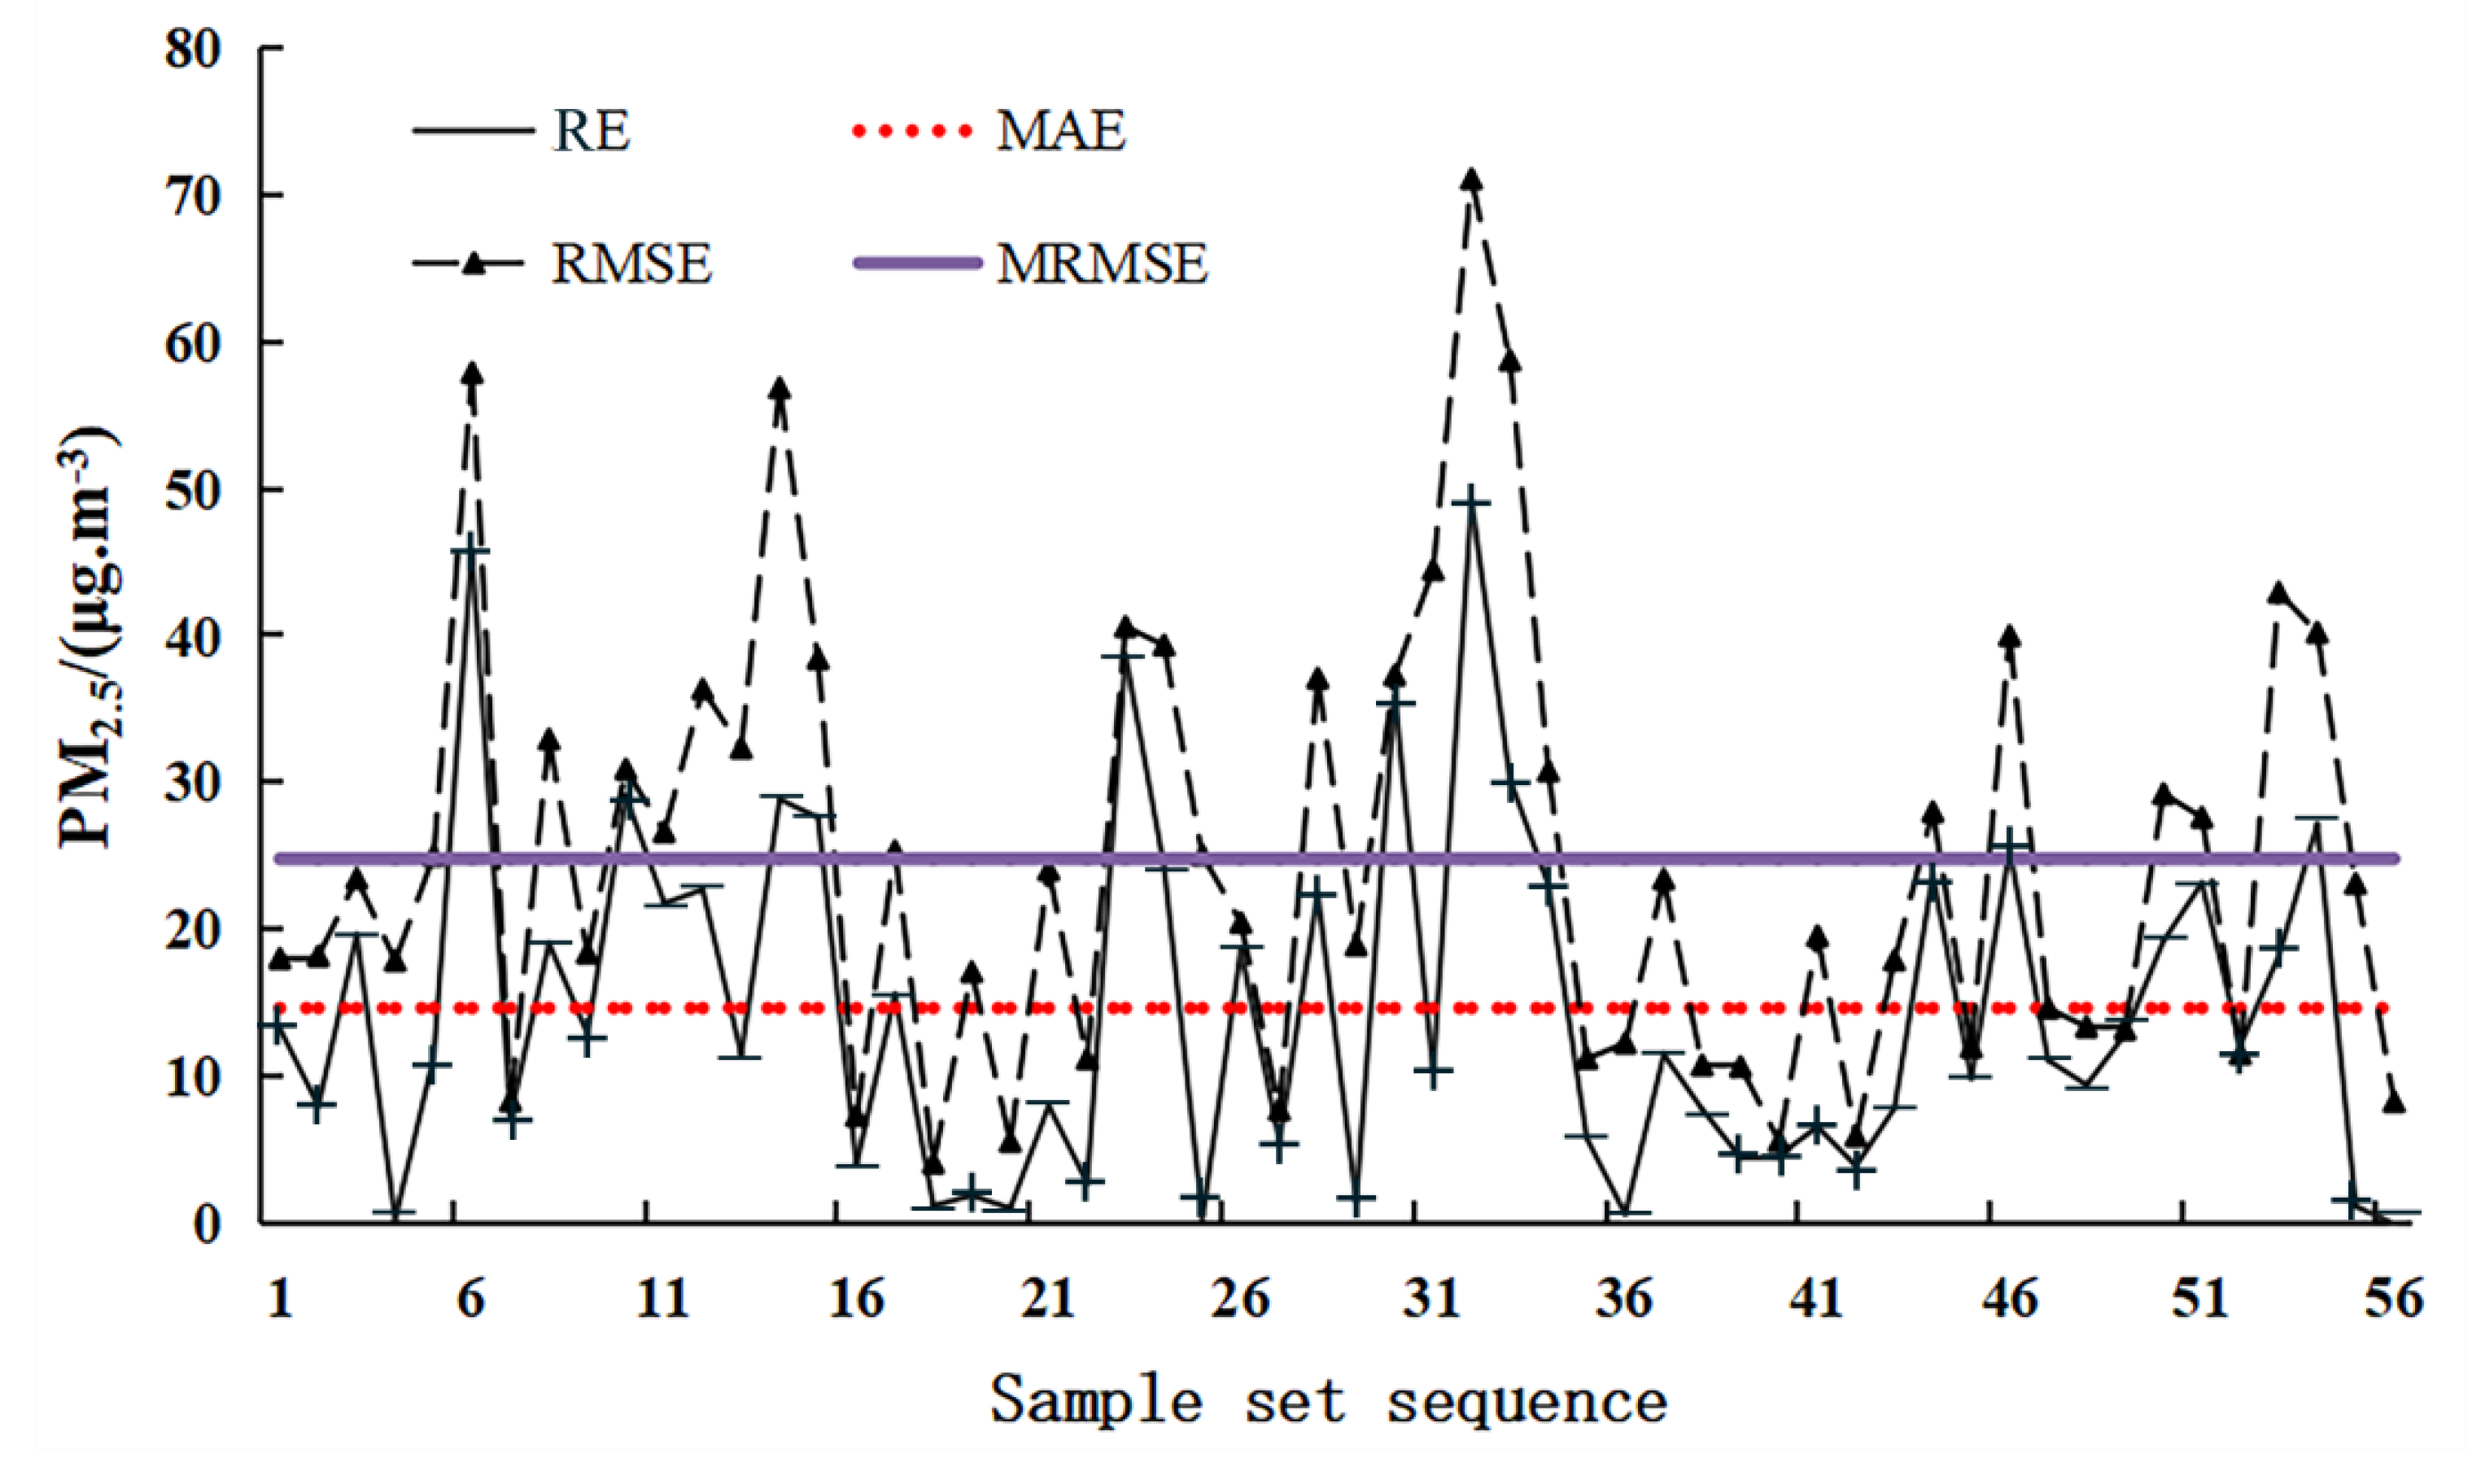
4.1. Results and Accuracy Evaluation of the PM2.5 Concentration Estimation Models at Night

Based on the above three multiple linear regression models and four machine learning regression models, combined with the data of the 56 ground monitoring stations at four time points in the PRD, the various models were constructed. In regard to the multiple linear regression models, all data at each time point were considered for model construction, and the model-predicted value was then compared to the ground monitoring value. For the machine learning models, all data samples at each time point were subjected to the fivefold cross-validation method. As a result, the goodness of fit (R2) of each PM2.5 concentration estimation model suitable for the PRD was determined, as listed in Table 2. The results indicated that the estimation effect of multiple linear regression Model III is better. The four research time points exhibited high R2 values, and the P value was less than 1%, which passed the 1% significance test.
Comparing the estimated values of Model III to the measured values at the four time points (as shown in Figure 3), the values exhibit a good linear relationship, and the overall goodness of fit reaches 0.82. Model III constructed in this paper achieves a high accuracy and can be applied to roughly estimate the nighttime PM2.5 concentration at four time points in the PRD urban agglomeration.
Based on the constructed multiple linear regression model and ordinary kriging interpolation method, the spatial distribution of the inverted PM2.5 concentration in the PRD can be obtained, as shown in Figure 4. The results show that there are large spatial distribution differences in the PM2.5 concentration at the four time points. The PM2.5 concentration in the surrounding area of the Pearl River estuary on 3 September 2018, and 11 March 2019, was lower than that in other regions, while in 2018 on 26 October and 24 November 2018, the PM2.5 concentration is higher than other regions. The concentration of PM2.5 in the northwestern PRD has always been high. On the whole, the PM2.5 concentration on 3 September 2018 and 26 October 2018 was significantly lower than the other two time points. On 24 November 2018, the PM2.5 concentration in the PRD was the highest at the four time points.

4.2. Sensitivity Analysis of the Model Factors for Nighttime PM2.5 Concentration Estimation

To explore the correlation between the PM2.5 concentration and the different model factors, regression coefficient analysis of the PM2.5 concentration and the 7 variables of Model III is carried out. Table 3 provides the regression coefficient results for the PM2.5 concentration at the four time points and the different variables. The regression coefficient of the nighttime light radiance ln I factor is relatively high, and the average regression coefficient over the four time points is 2.96. Three meteorological factors (temperature C , relative humidity R H and wind speed V ) and the PM2.5 concentration attain a high correlation, and the average regression coefficient values are 36.11, 8.12 and 18.40, respectively. The regression coefficients for the correlation between the three topographic factors (elevation H , slope S and topographic undulation T ) and the PM2.5 concentration are quite different, and the average regression coefficient values are 0.28, 12.60 and 0.64, respectively.

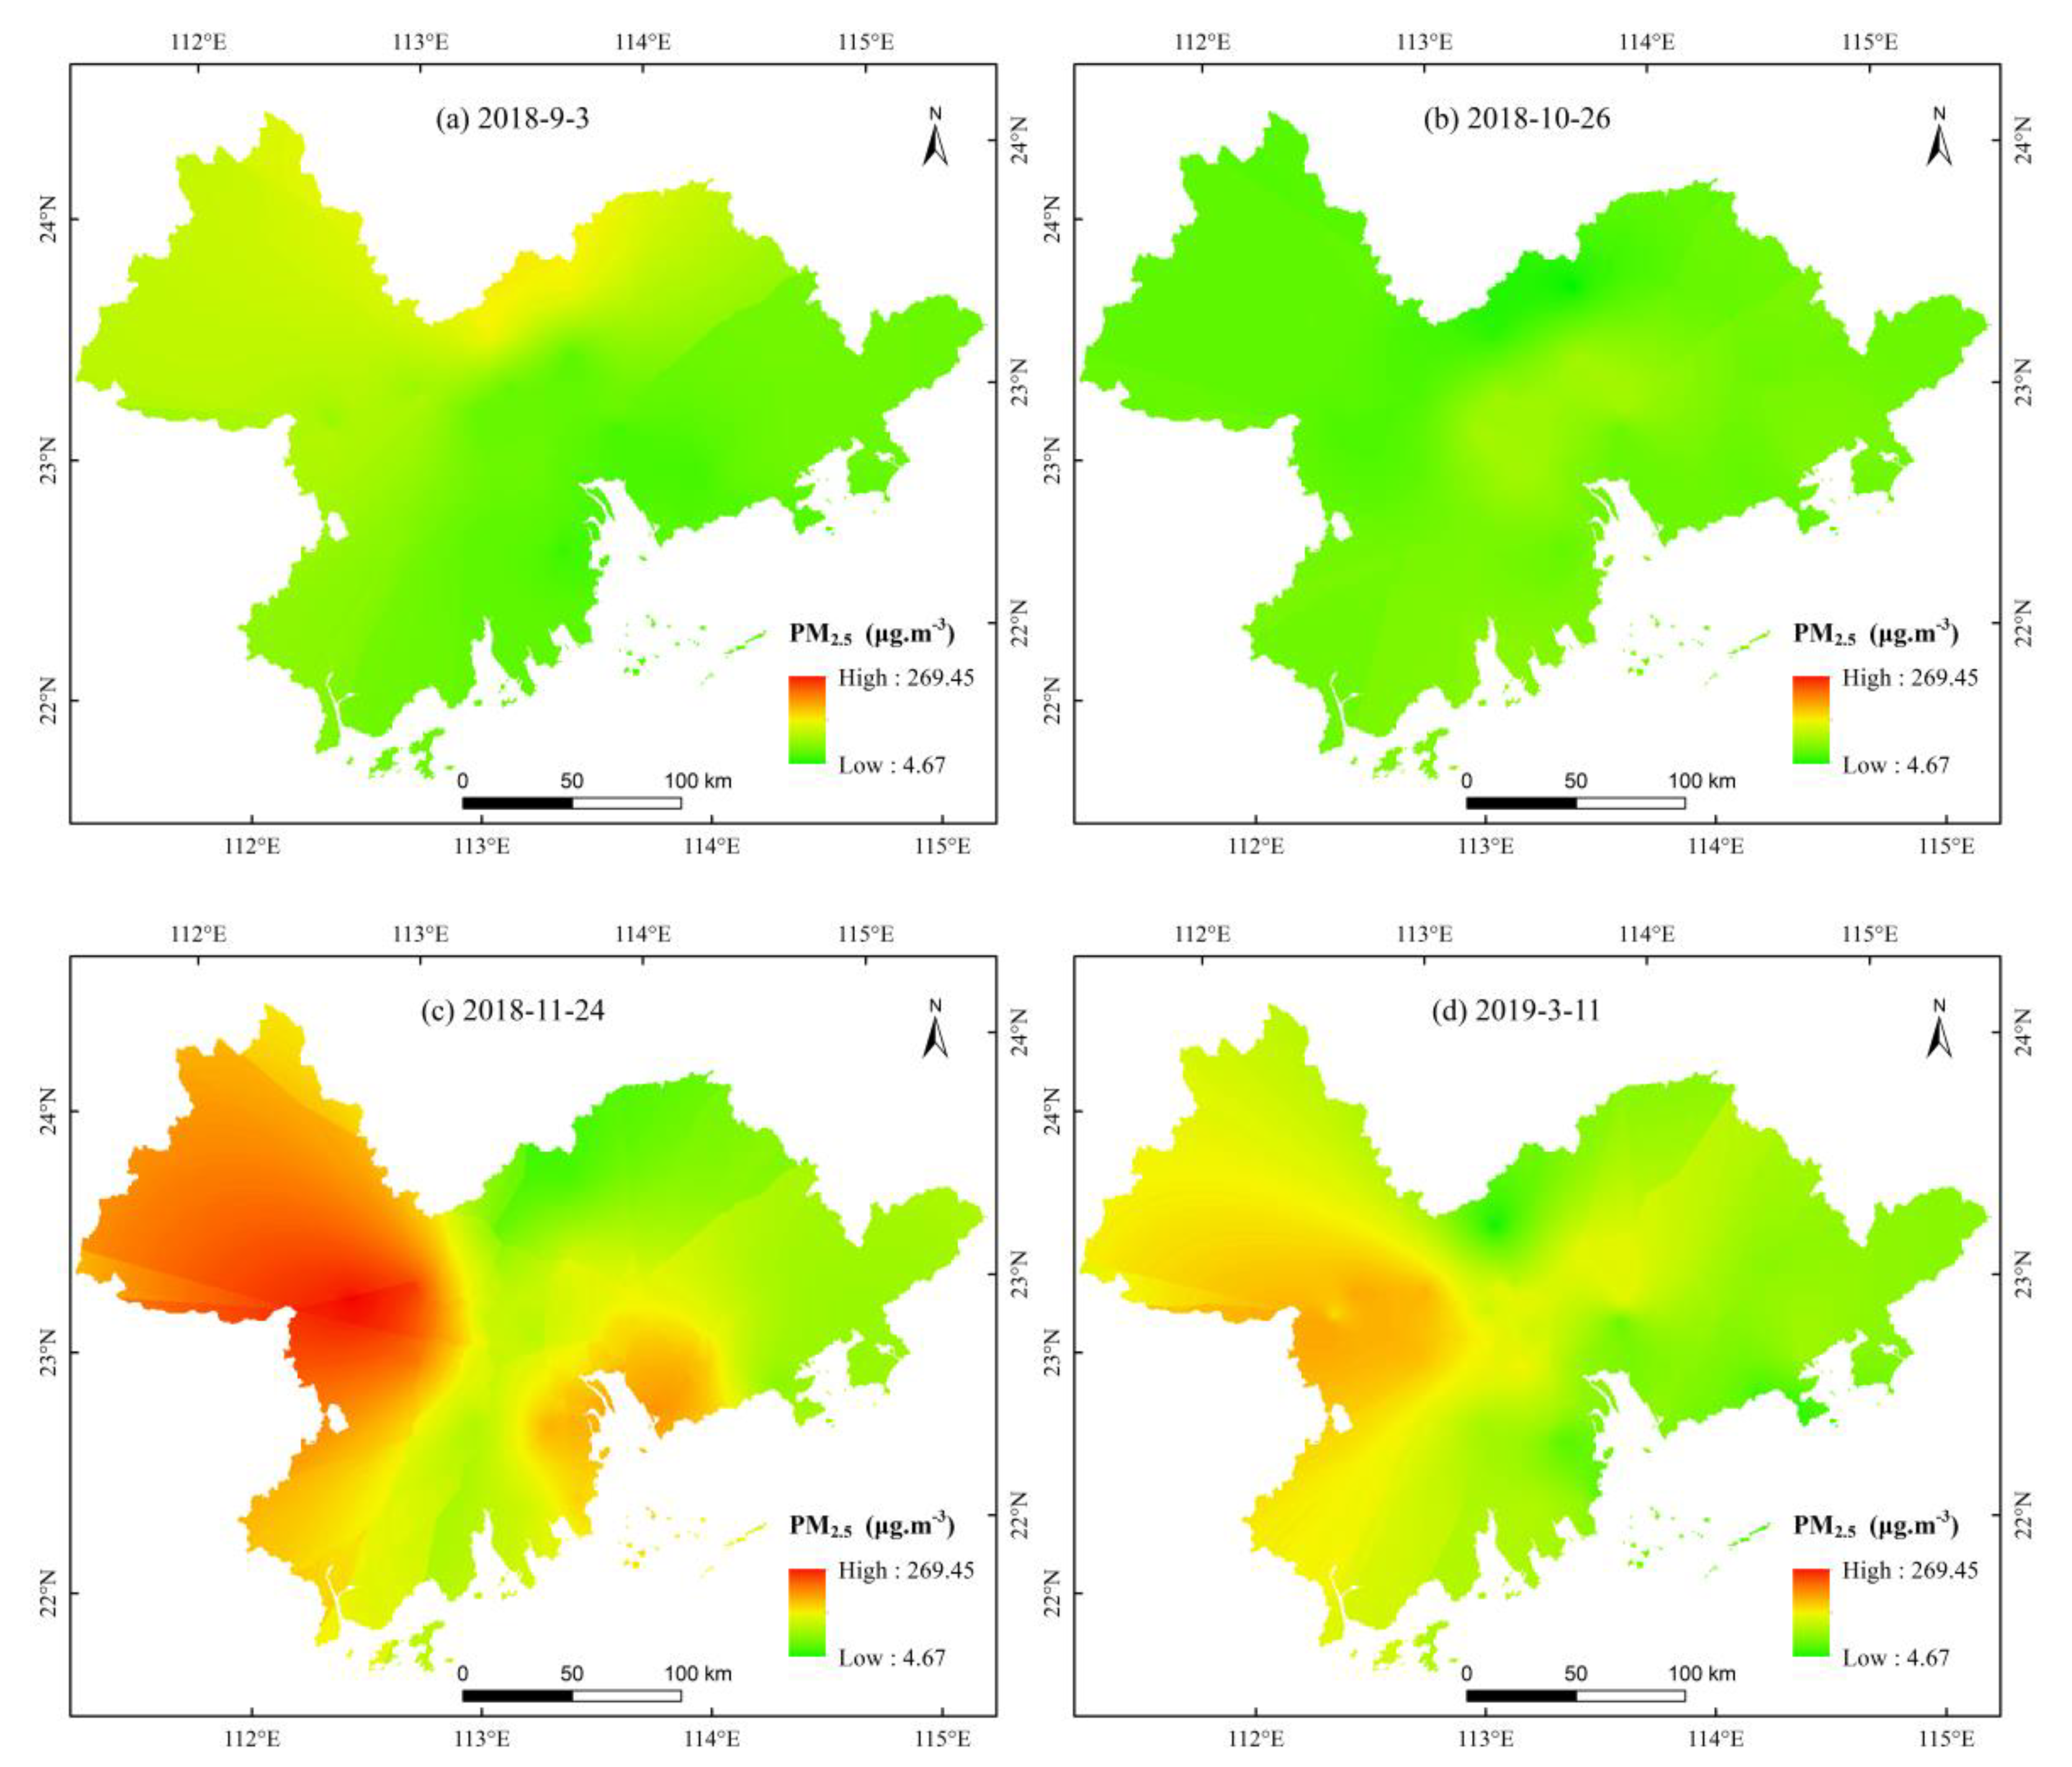
4.3. Remote Sensing Retrieval Analysis of the Nighttime PM2.5 Concentration

4.3.1. Time Sensitivity Analysis of the Model

This paper compares and analyzes the measured and model-estimated PM2.5 concentration values at the 56 ground monitoring stations and four time points and constructs scatter plots of the PM2.5 concentrations at the four research time points in the PRD (as shown in Figure 5). The results reveal that the estimated values obtained with the PM2.5 concentration model and the measured values attain a good linear relationship, the goodness of fit R2 at the four research time points is high, and the model goodness of fit remains stable at four time points.
Moreover, error analysis of the PM2.5 concentration estimation model at the four time points is carried out (please refer to Table 4). Based on the results, the two time points with a smaller root mean square error are 3 September 2018 and 26 October 2018, which remains stable at 14.35 ± 0.1 μg/m−3. The time points with a larger root mean square error are 24 November 2018 and 11 March 2019, and the former time point produces the largest root mean square error, at 46.99 μg/m−3, indicating that the model estimation error is time sensitive. In addition, the study determines that the model errors at a very small number of ground monitoring sites exert a greater impact on the overall results. Among the four time points, the five sites with the largest model estimation errors account for nearly half of the errors.
On 3 September 2018, and 26 October 2018, the average temperatures at the 56 surface stations in the PRD are 27.19 and 24.96 °C, respectively, while southerly winds prevail. Certain meteorological conditions are conducive to the diffusion of PM2.5 and other particles. During a given period, meteorological elements can exert a greater impact on the PM2.5 concentration, the nighttime light transmission conditions are better, and the estimation accuracy is correspondingly improved. On 24 November 2018 and 11 March 2019, the average temperature is 18.23 and 17.34 °C, respectively. Northerly winds prevail, the atmospheric structure remains stable, the meteorological conditions do not facilitate the diffusion of PM2.5 and other particulates [33]. Furthermore, the increase in PM2.5 emissions originating from emission sources such as automobile exhaust in winter and spring makes the prediction process of the PM2.5 concentration more complicated, resulting in a reduced model estimation accuracy. Therefore, the estimation accuracy of the model, which in summer and autumn is higher than in winter and spring, reveals a certain time sensitivity.

4.3.2. Spatial Sensitivity Analysis of the Model

The spatial distribution of the PM2.5 concentration is a complex geographic phenomenon, and the unique spatial characteristics of ground stations in different natural or social environments may affect the accuracy of model estimation. This paper compares the average model-estimated PM2.5 concentration and the average measured PM2.5 concentration at the 56 ground stations (as shown in Figure 6) to analyze the regionality and stability of the model. These two data exhibit similar change trends as a whole, and there are obvious local differences. In-depth analysis of the ground station error and error spatial characteristics can be performed. Among the PM2.5 concentrations detected by ground stations in the PRD, only 38% reached the Level 2 standard. China regards the PM2.5 concentration as reaching the Level 2 standard as meeting the standard.
The real error and root mean square error results of PM2.5 concentration estimates at 56 ground stations are shown in Figure 7. The average absolute error at these stations reaches 14.68 μg/m−3, of which the minimum deviation is only 0.02 μg/m−3, and the maximum deviation reaches 49.13 μg/m−3. The real error difference between the stations is large, indicating that the spatial distribution of the real error is obviously uneven. In terms of the proportion of the real error at the local sites, the five sites with the largest real error account for 24.33% of all sites, indicating that the average model estimation error at a few sites exerts a greater impact on the overall model error. Further analysis reveals that the root mean square error and real error at the 56 ground stations exhibit a similar change trend, and the mean value of the root mean square error is 24.82 μg/m−3. The model estimation error distribution considering the 56 ground stations in the PRD exhibits obvious differences, and the estimation results indicate a certain spatial sensitivity.
To further explore the spatial distribution of the model estimation errors, we focused on the analysis of the 24 ground stations with root mean square errors larger than the mean value. The results demonstrate that there are ten ground stations located in the southeastern coastal zone of the PRD, and the model-estimated average values at nine stations are all higher than the measured average values, which further confirms the research results of Liao et al. [60]: the impact of sea and land breezes on PM2.5 diffusion in coastal areas is relatively obvious, generally resulting in a relatively low PM2.5 concentration in coastal areas. The model in this paper may ignore the meteorological complexities of coastal areas, leading to obvious overestimation errors in the coastal area model. The other 14 ground stations are mostly distributed in areas with a low light intensity. The estimated average values at 11 stations are all lower than the measured average values, which also validates the findings of Wang et al. [30]. Affected by PM2.5, areas with brighter surface lights such as urban centers can observe the disappearance of a large number of lights than areas with darker surface lights such as rural areas, making it easier to detect PM2.5 concentration changes in urban areas from the brightness of lights [30]. The accuracy of this model for the nighttime PM2.5 concentration estimation in rural areas is lower, because the model underestimates the actual PM2.5 concentration. The results indicate that the estimation model accuracy in coastal areas and areas with weak nighttime lights is low, which roughly compensates for the determined spatial sensitivity of the PM2.5 concentration estimation model to a certain extent.

5. Discussion

As a major air pollutant, PM2.5 has attracted global attention. The monitoring of its temporal and spatial changes comprises an important part of PM2.5 air pollution control. With the development of remote sensing technology, daytime remote sensing images have been widely applied in PM2.5 concentration estimation, and large-scale low-cost monitoring of the PM2.5 concentration has been achieved. However, due to the temporal resolution of daytime remote sensing images, the application of remote sensing images for nighttime PM2.5 concentration estimation remains to be studied. Based on the theory of radiation transmission, a correlation model between the radiance in nighttime light images and the PM2.5 concentration can be established. To a certain extent, remote sensing images can be employed to estimate the nighttime PM2.5 concentration, i.e., nighttime light images can be obtained to estimate the nighttime PM2.5 concentration. Related research remains at the preliminary stage and is limited by the resolution of nighttime light images. The more commonly adopted DMSP/OLS and NPP-VIIRS nighttime light images exhibit spatial resolutions of 1000 and 500 m, respectively, and relevant spatial details may be missing. This article considers LJ1-01 nighttime light images with a spatial resolution of 130 m, which is greatly improved. In the future, we should compare the accuracy of the three most common types of nighttime light images to estimate the nighttime PM2.5 concentration and examine their ability to estimate the nighttime PM2.5 concentration. In addition, the satellite transit time in the area may coincide with times when the light intensity in the area is low, so the resultant nighttime light images do not suitably reflect the intensity of human activities in the area. The transit time of the LJ1-01 satellite providing the images used in this article is 10 pm. At this time, the light intensity can reflect the intensity of human activities to a greater extent.
The estimated PM2.5 in this paper is correlated with the measured PM2.5 concentration, with R2 reaching 0.82. Wang et al. [30] extracted the NPP-VIIRS nighttime light images information to establish a PM2.5 concentration estimation model. Further, the results show that the estimated PM2.5 concentration is correlated with the measured PM2.5 concentration, with R2 reaching 0.67. Zhang et al. [61] studied the accuracy of nighttime light images of LJ1-01 and NPP-VIIRS to estimate PM2.5 concentration. The results show that the information of the two nighttime light images has the potential to roughly estimate PM2.5 concentration. However, compared to the PM2.5 concentration estimation model with NPP-VIIRS nighttime light images information, the accuracy of the PM2.5 concentration estimation model with the LJ1-01 nighttime light images information has been improved. In addition, in terms of socio-economic parameter modeling, the accuracy of the model added to LJ1-01 nighttime light images information is also higher [62].
Machine learning models have high requirements regarding the number of samples, so the estimation accuracy is lower than that of the commonly adopted multiple linear regression models when there are fewer samples. Moreover, the estimation accuracy of the model exhibits obvious temporal and spatial differences. In terms of time, among the four time points, the estimation error on 24 November 2018 was the largest, while the estimation error on 3 September and 26 October 2018 was small. In terms of space, the estimation error of the model in the coastal area is larger than that in the inland area, and the model tends to overestimate the PM2.5 concentration in the coastal area. In addition, if the light intensity in the area is low, the ability of nighttime light images to reflect the PM2.5 concentration is limited. As such, the model tends to underestimate the PM2.5 concentration in areas with weaker lights such as rural areas.

6. Conclusions

This paper focuses on the problem of PM2.5 concentration estimation at night in the PRD and relies on radiation transmission theory to analyze the correlation between the nighttime light radiance and PM2.5 concentration. A correlation model is constructed based on LJ1-01 nighttime light images and meteorological and topographic factors. The PM2.5 concentration estimation model is combined with measured PM2.5 concentration values at four time points from 2018 to 2019. The results indicate that R2 reaches 0.82. Through remote sensing inversion analysis of the model factors and time/space sensitivity, it is found that the nighttime PM2.5 concentration estimation model provides a certain reference value and can expand the application of satellite remote sensing technology in the field of PM2.5 concentration estimation.
Moreover, the nighttime PM2.5 concentration estimation and machine learning-based methods considering LJ1-01 images proposed in this paper can be applied in strict radiation transmission theory-related applications, multisource observation data fusion and large-scale continuous spatial PM2.5 concentration inversion mechanisms, but other aspects should be further explored.

Author Contributions

Conceptualization, Y.W., M.W. and B.H.; methodology, Y.W., M.W. and B.H.; software, Y.W. and M.W.; validation, Y.W. and M.W.; formal analysis, Y.W. and M.W.; investigation, M.W. and S.L.; resources, Y.W. and M.W.; data curation, M.W. and S.L.; writing—original draft preparation, M.W., S.L. and Y.L.; writing—review and editing, Y.W. and B.H.; visualization, S.L. and Y.L.; supervision, Y.W. and B.H.; and project administration, Y.W. All authors have read and agreed to the published version of the manuscript.

Funding

This research was funded by the National Natural Science Foundation of China (Nos. 41971423, 31972951, and 41771462), the Natural Science Foundation of Hunan Province (No. 2020JJ3020), the Science and Technology Program of Hunan Province (Nos. 2019RS2043 and 2019GK2132), and the Outstanding Youth Project of the Education Department of Hunan Province (No. 18B224).

Institutional Review Board Statement

Not applicable.

Informed Consent Statement

Not applicable.

Data Availability Statement

No new data were created or analyzed in this study. Data sharing is not applicable to this article.

Conflicts of Interest

The authors declare no conflict of interest.

References

  1. You, M. Addition of PM 2.5 into the national ambient air quality standards of China and the contribution to air pollution control: The case study of Wuhan, China. Sci. World J. 2014, 2014, 768405. [Google Scholar] [CrossRef] [PubMed] [Green Version]
  2. Guan, T.; Xue, T.; Guo, J.; Wang, X.; Zheng, Y.; Chao, B.; Kang, Y.; Chen, Z.; Zhang, L.; Zheng, C.; et al. How protective is China’s National Ambient Air Quality Standards on short-term PM2.5? Findings from blood pressure measurements of 1 million adults. Environ. Res. Lett. 2020, 15, 125014. [Google Scholar] [CrossRef]
  3. Wu, W.; Zhang, M.; Ding, Y. Exploring the effect of economic and environment factors on PM2.5 concentration: A case study of the Beijing-Tianjin-Hebei region. J. Environ. Manag. 2020, 268, 110703. [Google Scholar] [CrossRef]
  4. Song, Y.; Li, Z.; Yang, T.; Xia, Q. Does the expansion of the joint prevention and control area improve the air quality?-Evidence from China’s Jing-Jin-Ji region and surrounding areas. Sci. Total Environ. 2020, 706, 136034. [Google Scholar] [CrossRef] [PubMed]
  5. Lelieveld, J.; Evans, J.S.; Fnais, M.; Giannadaki, D.; Pozzer, A. The contribution of outdoor air pollution sources to premature mortality on a global scale. Nature 2015, 525, 367–371. [Google Scholar] [CrossRef] [PubMed]
  6. Gautam, S.; Patra, A.K.; Kumar, P. Status and chemical characteristics of ambient PM2.5 pollutions in China: A review. Environ. Dev. Sustain. 2018, 21, 1649–1674. [Google Scholar] [CrossRef]
  7. Wang, X.; Zhang, R.; Yu, W. The Effects of PM 2.5 Concentrations and Relative Humidity on Atmospheric Visibility in Beijing. J. Geophys. Res. Atmos. 2019, 124, 2235–2259. [Google Scholar] [CrossRef]
  8. Cohen, A.J.; Brauer, M.; Burnett, R.; Anderson, H.R.; Frostad, J.; Estep, K.; Balakrishnan, K.; Brunekreef, B.; Dandona, L.; Dandona, R.; et al. Estimates and 25-year trends of the global burden of disease attributable to ambient air pollution: An analysis of data from the Global Burden of Diseases Study 2015. Lancet 2017, 389, 1907–1918. [Google Scholar] [CrossRef] [Green Version]
  9. Liu, C.; Chen, R.; Zhao, Y.; Ma, Z.; Bi, J.; Liu, Y.; Meng, X.; Wang, Y.; Chen, X.; Li, W.; et al. Associations between ambient fine particulate air pollution and hypertension: A nationwide cross-sectional study in China. Sci. Total Environ. 2017, 584–585, 869–874. [Google Scholar] [CrossRef] [PubMed]
  10. Lin, H.; Guo, Y.; Zheng, Y.; Di, Q.; Liu, T.; Xiao, J.; Li, X.; Zeng, W.; Cummings-Vaughn, L.A.; Howard, S.W.; et al. Long-Term Effects of Ambient PM2.5 on Hypertension and Blood Pressure and Attributable Risk Among Older Chinese Adults. Hypertension 2017, 69, 806–812. [Google Scholar] [CrossRef] [Green Version]
  11. Xing, Y.F.; Xu, Y.H.; Shi, M.H.; Lian, Y.X. The impact of PM2.5 on the human respiratory system. J. Thorac. Dis. 2016, 8, E69–E74. [Google Scholar] [CrossRef]
  12. Apte, J.S.; Brauer, M.; Cohen, A.J.; Ezzati, M.; Pope, C.A. Ambient PM2.5 Reduces Global and Regional Life Expectancy. Environ. Sci. Technol. Lett. 2018, 5, 546–551. [Google Scholar] [CrossRef] [Green Version]
  13. Shou, Y.; Huang, Y.; Zhu, X.; Liu, C.; Hu, Y.; Wang, H. A review of the possible associations between ambient PM2.5 exposures and the development of Alzheimer’s disease. Ecotoxicol. Environ. Saf. 2019, 174, 344–352. [Google Scholar] [CrossRef]
  14. Wang, H.; Li, J.; Gao, M.; Chan, T.C.; Gao, Z.; Zhang, M.; Li, Y.; Gu, Y.; Chen, A.; Yang, Y.; et al. Spatiotemporal variability in long-term population exposure to PM2.5 and lung cancer mortality attributable to PM2.5 across the Yangtze River Delta (YRD) region over 2010-2016: A multistage approach. Chemosphere 2020, 257, 127153. [Google Scholar] [CrossRef] [PubMed]
  15. Kahn, R.; Banerjee, P.; McDonald, D.; Diner, D.J. Sensitivity of multiangle imaging to aerosol optical depth and to pure-particle size distribution and composition over ocean. J. Geophys. Res. Atmos. 1998, 103, 32195–32213. [Google Scholar] [CrossRef]
  16. Liu, Y. Estimating Ground-Level PM2.5 in the Eastern United States Using Satellite Remote Sensing. Environ. Sci. Technol. 2005, 39, 3269–3278. [Google Scholar] [CrossRef] [Green Version]
  17. Tian, J.; Chen, D. A semi-empirical model for predicting hourly ground-level fine particulate matter (PM2.5) concentration in southern Ontario from satellite remote sensing and ground-based meteorological measurements. Remote Sens. Environ. 2010, 114, 221–229. [Google Scholar] [CrossRef]
  18. Lee, H.J.; Coull, B.A.; Bell, M.L.; Koutrakis, P. Use of satellite-based aerosol optical depth and spatial clustering to predict ambient PM2.5 concentrations. Environ. Res. 2012, 118, 8–15. [Google Scholar] [CrossRef] [PubMed] [Green Version]
  19. Li, Z.; Zhang, Y.; Shao, J.; Li, B.; Hong, J.; Liu, D.; Li, D.; Wei, P.; Li, W.; Li, L.; et al. Remote sensing of atmospheric particulate mass of dry PM2.5 near the ground: Method validation using ground-based measurements. Remote Sens. Environ. 2016, 173, 59–68. [Google Scholar] [CrossRef]
  20. Lin, C.; Labzovskii, L.D.; Leung Mak, H.W.; Fung, J.C.H.; Lau, A.K.H.; Kenea, S.T.; Bilal, M.; Vande Hey, J.D.; Lu, X.; Ma, J. Observation of PM2.5 using a combination of satellite remote sensing and low-cost sensor network in Siberian urban areas with limited reference monitoring. Atmos. Environ. 2020, 227, 117410. [Google Scholar] [CrossRef]
  21. Chen, Y.; Han, W.; Chen, S.; Tong, L. Estimating ground-level PM2.5 Concentration Using Landsat 8 in Chengdu, China. In Proceedings of the Remote Sensing of the Atmosphere Clouds, and Precipitation V, Beijing, China, 13–16 October 2014. [Google Scholar]
  22. Yang, L. A novel approach of Landsat 8 imagery to predict PM2.5 concentrations in a south-eastern coastal city of China. IOP Conf. Ser. Earth Environ. Sci. 2020, 619, 012046. [Google Scholar] [CrossRef]
  23. Yu, B.; Shi, K.; Hu, Y.; Huang, C.; Chen, Z.; Wu, J. Poverty Evaluation Using NPP-VIIRS Nighttime Light Composite Data at the County Level in China. IEEE J. Sel. Top. Appl. Earth Obs. Remote Sens. 2015, 8, 1217–1229. [Google Scholar] [CrossRef]
  24. Wang, C.; Chen, Z.; Yang, C.; Li, Q.; Wu, Q.; Wu, J.; Zhang, G.; Yu, B. Analyzing parcel-level relationships between Luojia 1-01 nighttime light intensity and artificial surface features across Shanghai, China: A comparison with NPP-VIIRS data. Int. J. Appl. Earth Obs. Geoinf. 2020, 85, 101989. [Google Scholar] [CrossRef]
  25. Levin, N.; Kyba, C.C.M.; Zhang, Q.; Sánchez de Miguel, A.; Román, M.O.; Li, X.; Portnov, B.A.; Molthan, A.L.; Jechow, A.; Miller, S.D.; et al. Remote sensing of night lights: A review and an outlook for the future. Remote Sens. Environ. 2020, 237, 111443. [Google Scholar] [CrossRef]
  26. Li, X.; Li, D. Can night-time light images play a role in evaluating the Syrian Crisis? Int. J. Remote Sens. 2014, 35, 6648–6661. [Google Scholar] [CrossRef]
  27. Shi, K.; Xu, T.; Li, Y.; Chen, Z.; Gong, W.; Wu, J.; Yu, B. Effects of urban forms on CO2 emissions in China from a multi-perspective analysis. J. Environ. Manag. 2020, 262, 110300. [Google Scholar] [CrossRef]
  28. Johnson, R.S.; Zhang, J.; Hyer, E.J.; Miller, S.D.; Reid, J.S. Preliminary investigations toward nighttime aerosol optical depth retrievals from the VIIRS Day/Night Band. Atmos. Meas. Tech. 2013, 6, 1245–1255. [Google Scholar] [CrossRef] [Green Version]
  29. Zhang, J.; Reid, J.S.; Miller, S.D.; Turk, F.J. Strategy for studying nocturnal aerosol optical depth using artificial lights. Int. J. Remote Sens. 2008, 29, 4599–4613. [Google Scholar] [CrossRef]
  30. Wang, J.; Aegerter, C.; Xu, X.; Szykman, J.J. Potential application of VIIRS Day/Night Band for monitoring nighttime surface PM 2.5 air quality from space. Atmos. Environ. 2016, 124, 55–63. [Google Scholar] [CrossRef] [Green Version]
  31. Fu, D.; Xia, X.; Duan, M.; Zhang, X.; Li, X.; Wang, J.; Liu, J. Mapping nighttime PM2.5 from VIIRS DNB using a linear mixed-effect model. Atmos. Environ. 2018, 178, 214–222. [Google Scholar] [CrossRef]
  32. Xu, G.; Ren, X.; Xiong, K.; Li, L.; Bi, X.; Wu, Q. Analysis of the driving factors of PM2.5 concentration in the air: A case study of the Yangtze River Delta, China. Ecol. Indic. 2020, 110, 105889. [Google Scholar] [CrossRef]
  33. Hou, X.; Chan, C.K.; Dong, G.H.; Yim, S.H.L. Impacts of transboundary air pollution and local emissions on PM 2.5 pollution in the Pearl River Delta region of China and the public health, and the policy implications. Environ. Res. Lett. 2019, 14, 034005. [Google Scholar] [CrossRef]
  34. Lin, H.; Ratnapradipa, K.; Wang, X.; Zhang, Y.; Xu, Y.; Yao, Z.; Dong, G.; Liu, T.; Clark, J.; Dick, R.; et al. Hourly peak concentration measuring the PM 2.5 -mortality association: Results from six cities in the Pearl River Delta study. Atmos. Environ. 2017, 161, 27–33. [Google Scholar] [CrossRef]
  35. Tao, J.; Zhang, L.; Cao, J.; Zhong, L.; Chen, D.; Yang, Y.; Chen, D.; Chen, L.; Zhang, Z.; Wu, Y.; et al. Source apportionment of PM2.5 at urban and suburban areas of the Pearl River Delta region, south China - With emphasis on ship emissions. Sci. Total Environ. 2017, 574, 1559–1570. [Google Scholar] [CrossRef] [PubMed]
  36. Li, J.; Zhu, Y.; Kelly, J.T.; Jang, C.J.; Wang, S.; Hanna, A.; Xing, J.; Lin, C.-J.; Long, S.; Yu, L. Health benefit assessment of PM2.5 reduction in Pearl River Delta region of China using a model-monitor data fusion approach. J. Environ. Manag. 2019, 233, 489–498. [Google Scholar] [CrossRef]
  37. Lu, X.; Chen, Y.; Huang, Y.; Chen, D.; Shen, J.; Lin, C.; Li, Z.; Fung, J.C.H.; Lau, A.K.H. Exposure and mortality apportionment of PM2.5 between 2006 and 2015 over the Pearl River Delta region in southern China. Atmos. Environ. 2020, 231, 117512. [Google Scholar] [CrossRef]
  38. Zhang, G.; Wang, J.; Jiang, Y.; Zhou, P.; Zhao, Y.; Xu, Y. On-Orbit Geometric Calibration and Validation of Luojia 1-01 Night-Light Satellite. Remote Sens. 2019, 11, 264. [Google Scholar] [CrossRef] [Green Version]
  39. Li, X.; Liu, Z.; Chen, X.; Sun, J. Assessing the Ability of Luojia 1-01 Imagery to Detect Feeble Nighttime Lights. Sensors 2019, 19, 3708. [Google Scholar] [CrossRef] [PubMed] [Green Version]
  40. Zhai, W.; Han, B.; Cheng, C. Evaluation of Luojia 1–01 Nighttime Light Imagery for Built-Up Urban Area Extraction: A Case Study of 16 Cities in China. IEEE Geosci. Remote Sens. Lett. 2020, 17, 1802–1806. [Google Scholar] [CrossRef]
  41. Zhang, G.; Guo, X.; Li, D.; Jiang, B. Evaluating the Potential of LJ1-01 Nighttime Light Data for Modeling Socio-Economic Parameters. Sensors 2019, 19, 1465. [Google Scholar] [CrossRef] [PubMed] [Green Version]
  42. Yang, Y.; Ma, M.; Zhu, X.; Ge, W. Research on spatial characteristics of metropolis development using nighttime light data: NTL based spatial characteristics of Beijing. PLoS ONE 2020, 15, e0242663. [Google Scholar] [CrossRef] [PubMed]
  43. Zhang, C.; Pei, Y.; Li, J.; Qin, Q.; Yue, J. Application of Luojia 1-01 Nighttime Images for Detecting the Light Changes for the 2019 Spring Festival in Western Cities, China. Remote Sens. 2020, 12, 1416. [Google Scholar] [CrossRef]
  44. Tan, Z.; Wei, D.; Yin, Z. Housing Vacancy Rate in Major Cities in China: Perspectives from Nighttime Light Data. Complexity 2020, 2020, 5104578. [Google Scholar] [CrossRef]
  45. Lin, Z.J.; Zhang, Z.S.; Zhang, L.; Tao, J.; Zhang, R.J.; Cao, J.J.; Fan, S.J.; Zhang, Y.H. An alternative method for estimating hygroscopic growth factor of aerosol light-scattering coefficient: A case study in an urban area of Guangzhou, South China. Atmos. Chem. Phys. 2014, 14, 7631–7644. [Google Scholar] [CrossRef] [Green Version]
  46. Biskos, G.; Russell, L.M.; Buseck, P.R.; Martin, S.T. Nanosize effect on the hygroscopic growth factor of aerosol particles. Geophys. Res. Lett. 2006, 33, L07801. [Google Scholar] [CrossRef] [Green Version]
  47. Zhang, Z.; Wu, L.; Chen, Y. Forecasting PM2.5 and PM10 concentrations using GMCN(1,N) model with the similar meteorological condition: Case of Shijiazhuang in China. Ecol. Indic. 2020, 119, 106871. [Google Scholar] [CrossRef]
  48. Wang, J.; Wang, Y.; Liu, H.; Yang, Y.; Zhang, X.; Li, Y.; Zhang, Y.; Deng, G. Diagnostic identification of the impact of meteorological conditions on PM2.5 concentrations in Beijing. Atmos. Environ. 2013, 81, 158–165. [Google Scholar] [CrossRef]
  49. Li, X.; Feng, Y.J.; Liang, H.Y. The Impact of Meteorological Factors on PM2.5 Variations in Hong Kong. IOP Conf. Ser. Earth Environ. Sci. 2017, 78, 012003. [Google Scholar] [CrossRef]
  50. Chen, T.; He, J.; Lu, X.; She, J.; Guan, Z. Spatial and Temporal Variations of PM2.5 and Its Relation to Meteorological Factors in the Urban Area of Nanjing, China. Int J. Environ. Res. Public Health 2016, 13, 921. [Google Scholar] [CrossRef] [PubMed]
  51. Zhang, W.; Hai, S.; Zhao, Y.; Sheng, L.; Zhou, Y.; Wang, W.; Li, W. Numerical modeling of regional transport of PM2.5 during a severe pollution event in the Beijing–Tianjin–Hebei region in November 2015. Atmos. Environ. 2021, 254, 118393. [Google Scholar] [CrossRef]
  52. Liu, Q.; Wu, R.; Zhang, W.; Li, W.; Wang, S. The varying driving forces of PM2.5 concentrations in Chinese cities: Insights from a geographically and temporally weighted regression model. Environ. Int. 2020, 145, 106168. [Google Scholar] [CrossRef] [PubMed]
  53. Chen, Y.; Fung, J.C.H.; Chen, D.; Shen, J.; Lu, X. Source and exposure apportionments of ambient PM2.5 under different synoptic patterns in the Pearl River Delta region. Chemosphere 2019, 236, 124266. [Google Scholar] [CrossRef]
  54. Hu, W.; Zhao, T.; Bai, Y.; Shen, L.; Sun, X.; Gu, Y. Contribution of Regional PM2.5 Transport to Air Pollution Enhanced by Sub-Basin Topography: A Modeling Case over Central China. Atmosphere 2020, 11, 1258. [Google Scholar] [CrossRef]
  55. Yang, Q.; Yuan, Q.; Yue, L.; Li, T. Investigation of the spatially varying relationships of PM2.5 with meteorology, topography, and emissions over China in 2015 by using modified geographically weighted regression. Environ. Pollut. 2020, 262, 114257. [Google Scholar] [CrossRef] [PubMed]
  56. He, Q.; Huang, B. Satellite-based high-resolution PM2.5 estimation over the Beijing-Tianjin-Hebei region of China using an improved geographically and temporally weighted regression model. Environ. Pollut. 2018, 236, 1027–1037. [Google Scholar] [CrossRef] [PubMed]
  57. Hu, X.; Belle, J.H.; Meng, X.; Wildani, A.; Waller, L.A.; Strickland, M.J.; Liu, Y. Estimating PM2.5 Concentrations in the Conterminous United States Using the Random Forest Approach. Environ. Sci. Technol. 2017, 51, 6936–6944. [Google Scholar] [CrossRef] [PubMed]
  58. Tian, H.; Zhao, Y.; Luo, M.; He, Q.; Han, Y.; Zeng, Z. Estimating PM2.5 from multisource data: A comparison of different machine learning models in the Pearl River Delta of China. Urban Clim. 2021, 35, 100740. [Google Scholar] [CrossRef]
  59. Chen, Y. Prediction algorithm of PM2.5 mass concentration based on adaptive BP neural network. Computing 2018, 100, 825–838. [Google Scholar] [CrossRef]
  60. Liao, Z.; Xie, J.; Fang, X.; Wang, Y.; Zhang, Y.; Xu, X.; Fan, S. Modulation of synoptic circulation to dry season PM2.5 pollution over the Pearl River Delta region: An investigation based on self-organizing maps. Atmos. Environ. 2020, 230, 117482. [Google Scholar] [CrossRef]
  61. Zhang, G.; Shi, Y.; Xu, M. Evaluation of LJ1-01 Nighttime Light Imagery for Estimating Monthly PM2.5 Concentration: A Comparison With NPP-VIIRS Nighttime Light Data. IEEE J. Sel. Top. Appl. Earth Obs. Remote Sens. 2020, 13, 3618–3632. [Google Scholar] [CrossRef]
  62. Liu, H.; Luo, N.; Hu, C. Detection of County Economic Development Using LJ1-01 Nighttime Light Imagery: A Comparison with NPP-VIIRS Data. Sensors 2020, 20, 6633. [Google Scholar] [CrossRef] [PubMed]
Figure 1. Location of the Pearl River Delta (PRD) urban agglomeration.
Remotesensing 13 03405 g001
Figure 2. Spatial distribution of the monitoring stations in the PRD.
Remotesensing 13 03405 g002
Figure 3. Scatter plot of the estimated and measured PM2.5 concentrations.
Remotesensing 13 03405 g003
Figure 4. Spatial distribution of the PM2.5 concentration determined via inversion at the four time points in the PRD.
Remotesensing 13 03405 g004
Figure 5. Scatter plot of the estimated and measured PM2.5 concentrations during the four time periods.
Remotesensing 13 03405 g005
Figure 6. Comparison of the estimated and measured PM2.5 concentrations given the sample set sequence. The blue line represents the Level 1 standard, and the purple line represents the Level 2 standard. The Level 1 standard refers to the 24-h average PM2.5 concentration lower than 35 µg/m2. The Level 2 standard refers to the 24-h average PM2.5 concentration lower than 75 µg/m2.
Remotesensing 13 03405 g006
Figure 7. Error distribution of the estimated PM2.5 concentration given the sample set sequence. RE refers to the real error of each site at four time points, where “+” means that the model underestimates the actual PM2.5 concentration, “−” means that the model overestimates the actual PM2.5 concentration. MAE refers to the average absolute error of 56 sites at four time points. RMSE refers to the root mean square error of each site at four time points, and MRMSE refers to the average root mean square error of 56 sites at four time points.
Remotesensing 13 03405 g007
Table 1. Important parameters of the various PM2.5 concentration estimation models based on machine learning.
ModelParameter3 September 201826 October 201824 November 201811 March 2019
Model IVMinimum leaf size41244
Model VKernel functionLinearGaussianLinearGaussian
Model VIKernel functionSquare indexSquare indexIndexMatern 5/2
Model VIIMinimum leaf size8888
Table 2. Fitting results (R2) of the various PM2.5 concentration estimation models in the PRD.
Model3 September 201826 October 201824 November 201811 March 2019
Model I0.750.590.610.76
Model II0.690.590.710.76
Model III0.760.640.730.78
Model IV0.440.360.790.65
Model V0.590.390.420.66
Model VI0.680.510.520.7
Model VII0.520.530.550.64
Table 3. Correlation coefficients between the PM2.5 concentration and the different variables at the four time points.
Variable3 September 201826 October 201824 November 201811 March 2019
ln I 4.642.693.740.79
C 29.0213.6588.8912.88
R H 3.474.8517.037.15
V 13.6511.2118.4930.25
H 0.150.320.210.45
S 2.712.2331.3414.13
T 0.070.141.700.65
Table 4. Estimation error of the PM2.5 concentration during the four time periods.
Time Series3 September 201826 October 201824 November 201811 March 2019
Root mean square error (μg/m−3)14.2514.4546.9926.12
Proportion of stations with the five largest errors (%)53.2943.1846.7848.14
Publisher’s Note: MDPI stays neutral with regard to jurisdictional claims in published maps and institutional affiliations.

