
Urban Building Extraction and Modeling Using GF-7 DLC and MUX Images
by
 , and
, and
Heng Luo
1,2,3, 
Biao He
1,2,*,
Renzhong Guo
1,2,4,
Weixi Wang
1,2,4,
Xi Kuai
1,2,4,
Bilu Xia
5,
Yuan Wan
2,6,
Ding Ma
1,2,4 and
Linfu Xie
1,2,4 1
Research Institute for Smart Cities, School of Architecture and Urban Planning, Shenzhen University, Shenzhen 518060, China
2
Key Laboratory of Urban Land Resources Monitoring and Simulation, Ministry of Nature Resources, Shenzhen 518034, China
3
Guangxi Zhuang Autonomous Region Institute of Natural Resources Remote Sensing, Nanning 530023, China
4
Guangdong–Hong Kong-Macau Joint Laboratory for Smart Cities, Shenzhen 518060, China
5
Traffic Information Engineering Institute, Guangxi Vocational and Technical College of Communications, Nanning 530023, China
6
College of Urban and Environmental Science, Hubei Normal University, Huangshi 435002, China
*
Author to whom correspondence should be addressed.
Remote Sens. 2021, 13(17), 3414; https://0-doi-org.brum.beds.ac.uk/10.3390/rs13173414
Submission received: 30 June 2021
/
Revised: 5 August 2021
/
Accepted: 16 August 2021
/
Published: 27 August 2021
(This article belongs to the Special Issue Applications of Remote Sensing Imagery for Urban Areas)
Abstract
:Urban modeling and visualization are highly useful in the development of smart cities. Buildings are the most prominent features in the urban environment, and are necessary for urban decision support; thus, buildings should be modeled effectively and efficiently in three dimensions (3D). In this study, with the help of Gaofen-7 (GF-7) high-resolution stereo mapping satellite double-line camera (DLC) images and multispectral (MUX) images, the boundary of a building is segmented via a multilevel features fusion network (MFFN). A digital surface model (DSM) is generated to obtain the elevation of buildings. The building vector with height information is processed using a 3D modeling tool to create a white building model. The building model, DSM, and multispectral fused image are then imported into the Unreal Engine 4 (UE4) to complete the urban scene level, vividly rendered with environmental effects for urban visualization. The results of this study show that high accuracy of 95.29% is achieved in building extraction using our proposed method. Based on the extracted building vector and elevation information from the DSM, building 3D models can be efficiently created in Level of Details 1 (LOD1). Finally, the urban scene is produced for realistic 3D visualization. This study shows that high-resolution stereo mapping satellite images are useful in 3D modeling for urban buildings and can support the generation and visualization of urban scenes in a large area for different applications.
1. Introduction
In applying digital twins to smart cities, modeling and visualization of the urban area are of great importance [1]. The techniques of virtual reality (VR) facilities, urban digital twins, and visualization are highly useful for supporting urban planning, urban design, and decision support [2]. Urban modeling is the basis for the techniques mentioned above. In the field of photogrammetry, generating an urban landscape model (ULM) to show the objects and landcover of an urban area in three dimensions (3D) is the ultimate goal [3].
Among all the ground objects in the urban area, buildings are the most prominent feature and have the most extensive distribution in an urban environment [4]. Thus, information about the building and its model is necessary for urban applications and is considered to be indicator for evaluating the development of cities. In this case, using photogrammetry methods to attain up-to-date building information and model building objects is one of the most important tasks in constructing smart cities.
It is necessary to complete building modeling in both the panel dimension and height dimension in a large urban area. For example, in the Shenzhen Visualization Urban Digital Platform project in Shenzhen, China, a 3D urban scene at an urban scale of 1997.47 km2 should be built and displayed for government applications, such as urban planning and cadastral management. In this project, the rough building model in the Level of Details 1 (LOD1) is a basic requirement for representing the urban scene. A man-made building model was used in this project. In fact, manual building model production is quite common for most of the current tasks. Since modeling manually in such a large area has high costs and is time-consuming, an effective and efficient approach for urban building modeling is needed.
The rapid development and increasing availability of high-resolution satellite (HRS) images provide increased opportunities to support the urban monitoring task. The high-resolution stereo mapping satellite provides stereo images at different angles. For example, the Gaofen-7 (GF-7) high-resolution stereo mapping satellite is equipped with double-line cameras (DLC) in which images can generate digital surface models (DSM) along with the multispectral camera (MUX). In this way, the surface and terrain conditions can be represented in three-dimensional space. According to the design objective, the GF-7 satellite should satisfy the 1:10,000 scale stereo mapping and topographic mapping with 0.65 m and 0.8 m resolution DLC images, respectively, and a 2.6 m multispectral image [5]. With these advancements, the spectral information and elevation information attained from GF-7 images enable us to use only satellite images for modeling the urban building in three dimensions, while aerial images normally completed this task with higher resolution and greater quantity.
Building extraction and modeling methods are needed for the above task, including extracting building information, which detects the object of interest and extracts its geometric boundary from remote sensed data [4], then obtains the building’s height information and generates the 3D model.
1.1. Building Extraction
As the most prominent feature in an urban environment, acquiring accurate extraction data from building objects has great significance in urban planning, cartographic mapping, civilian and military emergency response [4]. Remote sensing is one of the most effective and efficient approaches by which building information can be extracted. Owing to the satellite camera’s wide field of view (FOV), the high-resolution satellite image provides abundant visible building information in a much greater area than any other data source.
Full automation of extracting buildings has been regarded as an active research topic in the photogrammetry and computer vision communities [6]. Roof shapes and building footprints are recorded at the required level of detail and accuracy; this information is then used to generate a geometric representation of the building in a subsequent step [7]. With the rapid development of satellite remote sensing techniques, different types of satellite optical sensors and images are becoming available, such as multispectral/hyperspectral images, stereo images, and SAR images. The high-resolution optical multispectral satellite image is quite useful for attaining surface visual information, and its multispectral bands, which contain blue, green, red, and near-infrared red, facilitate distinguishing building and other ground objects. A considerable number of studies and applications for urban building monitoring are based on this type of image. Although the temporal resolution and spatial resolution are greatly enhanced, and there appears to be more information regarding building extraction than before. The limitation of the extraction algorithm in terms of effect and efficiency is emphasized by users. Thus, the challenge still exists in the field of building extraction.
Researchers contributed many approaches for building extraction [8,9]. Most of these studies focused on the pixel-based (PB) method, the object-oriented (OO) method, and the deep learning (DL) method.
The pixel-based method and object-oriented method are two traditional approaches to object classification and extraction. The former is based on the data value (DN) distinction derived from the spectral difference between objects and uses complex rules to classify ground features. The maximum likelihood method (MLM) [10], support vector machine (SVM) [11], decision tree (DT) [12], random forest (RF) [13], and artificial neural network (ANN) [14] are some examples of classical algorithms for the object classification method. The above methods are mature and operatable. However, they lack spatial and textural information. The object-oriented method [8], which takes full advantage of spatial and textural characteristics [9], has become popular over the last decade. The object-oriented method is suitable for high-resolution images. However, the object-oriented method requires the input of complex rules and is limited by the effect of segmentation. The great workload, low efficiency, and poor generalization ability considerably limit the usability of the object-oriented method.
Recently, DL [15] has become the focus of the image and graphic research field and welcomed by the remote sensing community. For urban remote sensing research, building extraction has entered the era of the DL approach, including the image block-based method [16,17] and fully convolutional networks (FCNs) [18,19]. The former assesses the small blocks around pixels to classify each pixel, and with a low-level spatial characteristic and convolutional neural network (CNN) in the neighboring area, the building’s completeness can be achieved by the extraction process. FCN-based end-to-end segmentation can directly classify each pixel and greatly improve efficiency and accuracy compared with the above method. Several methods propose the use of FCN-based building extraction approaches, including deep residual learning [20], the deconvolution network [21], new activation functions [22], the larger convolutional kernel [23], and dilated convolution [24]. However, some disadvantages exist in the FCN-based method. The first is the small object information loss and insufficient use of characteristics of low-level details during high-resolution feature upsampling. The second is that the simple convolution between feature layers cannot fully use different feature levels. In order to solve this problem, a high-resolution net (HRNet) was proposed by the authors of [25]. This network can maintain a high resolution for the feature map and the low-level feature when the deep-level feature is attained. Thus, the deep-level feature in the network can be facilitated to improve the ability of small building object extraction [26]. To further obtain detailed information and raise segmentation accuracy, the DensNet was proposed [27]. This network draws the feature in different layers, enhancing the reusability of features.
1.2. Building Modeling
Building 3D models can improve information management, aid decision making [28], and be widely used by various urban applications. 3D building models are a digital representation of three-dimensional objects. 3D building models are created, viewed, and modified using specialized software referred to as 3D modeling software. There are different LODs in the CityGML modeling standard: LOD0 is the digital terrain model, LOD1 is the geometry of a building represented as a prismatic model; LOD2 is the outer facade of the building modeled in greater detail, and LOD3 and LOD4 provide even further detailed visual information on the objects. Due to the scale of the high-resolution satellite, the limitation in the camera ground sampling distance, and the single nearly-ortho angle, the image can only satisfy the modeling requirements of LOD1 or below.
There are some studies on surface modeling and building 3D modeling with different data sources, mainly aerial or onboard Lidar [29,30,31]. Owing to the limitations in generating 3D building models, there are fewer studies on using satellite images in generating building models than aerial images. Only some studies focus on terrain 3D modeling with stereo mapping satellite images.
With the help of a stereo mapping satellite, after attaining elevation information via the DSM, as well as the building extraction results, the panel and height information for the building are available; this can be achieved via commercial or open-access modeling software such as Blender. Visualization is the purpose of building a 3D model. In particular, in the urban scene, the urban area with the white model of the 3D building can be used in many applications. Thus, there should be a workflow or approach to exploit stereo mapping satellite images fully; for example, GF-7 DLC images to complete the 3D building dataset and using a 3D engine for rendering the urban scene. Currently, there are some 3D engines available for different kinds of urban applications; notably, game engines are enjoyed by users, such as Unreal Engine 4 (UE4), Unity3D, CryEngine, and so on. These engines provide physically based rendering (PBR) materials, environment simulation, and 3D visualization abilities for users. Through these game engines, 3D modeling, rendering, and simulation application can be developed for the urban area.
1.3. Stereo Mapping Satellite
Compared with regular remote sensing optical satellites, besides spectral information, the stereo mapping satellite can provide us with elevation information from the Earth. For example, the ALOS satellite can generate a 10 m DEM with stereo images [32], the ZY-3 series satellites are equipped with three-line cameras (TLC) that provide forward, nadir, and backward images to complete the 1:50,000 topographical mapping [33] and DEM generation [34], and WorldView series satellites can maneuver their 0.3 m-resolution cameras to obtain stereo images at different angles and survey at a ground sample distance (GSD) of 0.5 m or greater [35]. On 3 December 2019, the GF-7 (Gaofen-7) satellite was launched from Taiyuan, China. The GF-7 satellite is a Chinese second-generation civil high-resolution stereo mapping satellite equipped with double-line cameras (DLCs) to acquire a 0.65 m backward image and 0.8 m forward image, as well as a backward multispectral camera (MUX) to acquire a 2.6 m four-band multispectral image [36]. The images mentioned above have high geometric accuracy and an image quality suitable for 1:10,000 scale mapping [5]. The detailed parameters of GF-7 can be observed in Table 1. The main user of the GF-7 satellite is the Land Satellite Remote Sensing Application Center (LASAC), Ministry of Natural Resources of the People’s Republic of China (MNR), with the aims of land resource surveying, topographical mapping, environmental monitoring, and so on. In this study, we attempted to exploit the stereoscopic information that GF-7 DLC images provide and the MUX image to complete building modeling and generate an urban 3D scene.
The remainder of this paper is structured as follows: Section 2 presents the method of this study, including building extraction, DSM generation, and 3D building modeling. In Section 3, the result and accuracy of the building extraction are revealed, and the effect of the building model is presented. Section 4 discusses the results of this study, including the advantages and limitations of our method. Finally, conclusions from this study are drawn in Section 5.
2. Methods
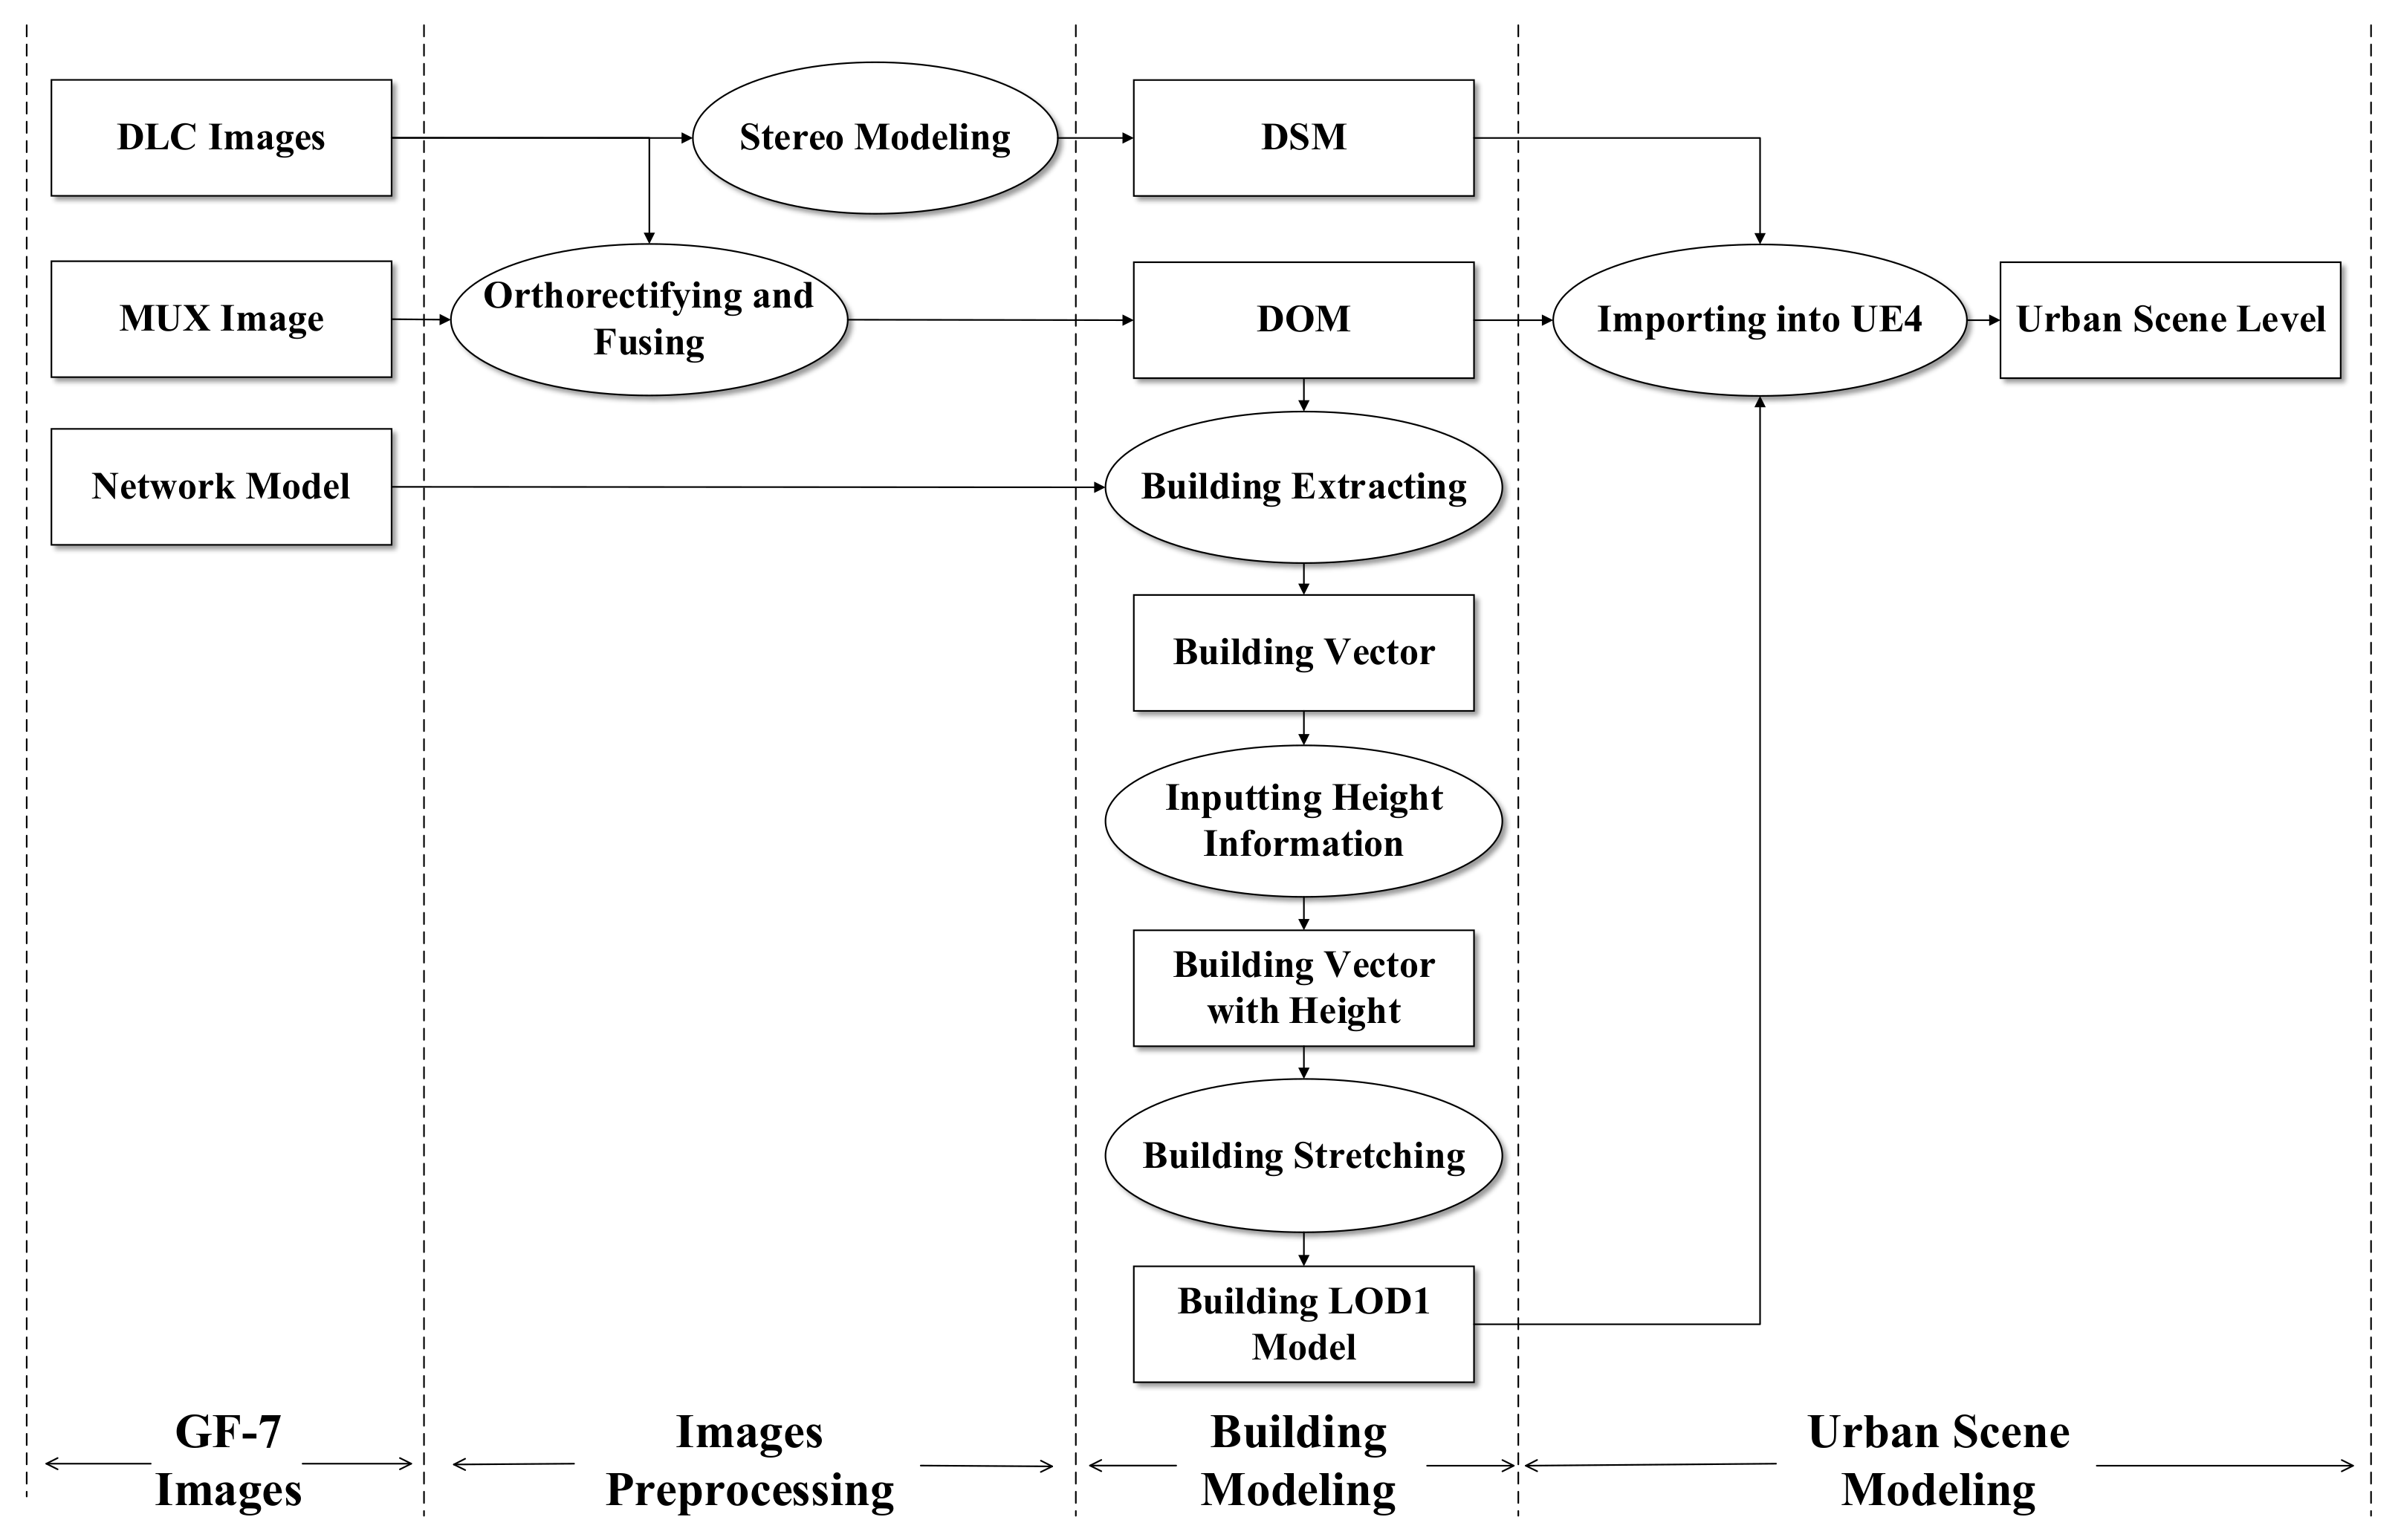
In this study, we used DLC images and a MUX image to achieve the building modeling. Methods in this study include the multilevel features fusion network, DSM generation with stereo images in two main parts. The workflow can be seen in Figure 1. In this study, Microsoft Visual Studio 2019 was used for program developing, TensorFlow 1.14 was used for network training, PCI Geomatica 2018 SP1 was used for DSM generation, ArcGIS 10.2 was used to input height information for the building shapefile, Blender was used to stretch the building with height information, and UE4 with the version of 4.25 was used for generating the 3D urban building scene.
2.1. Multilevel Features Fusion Network
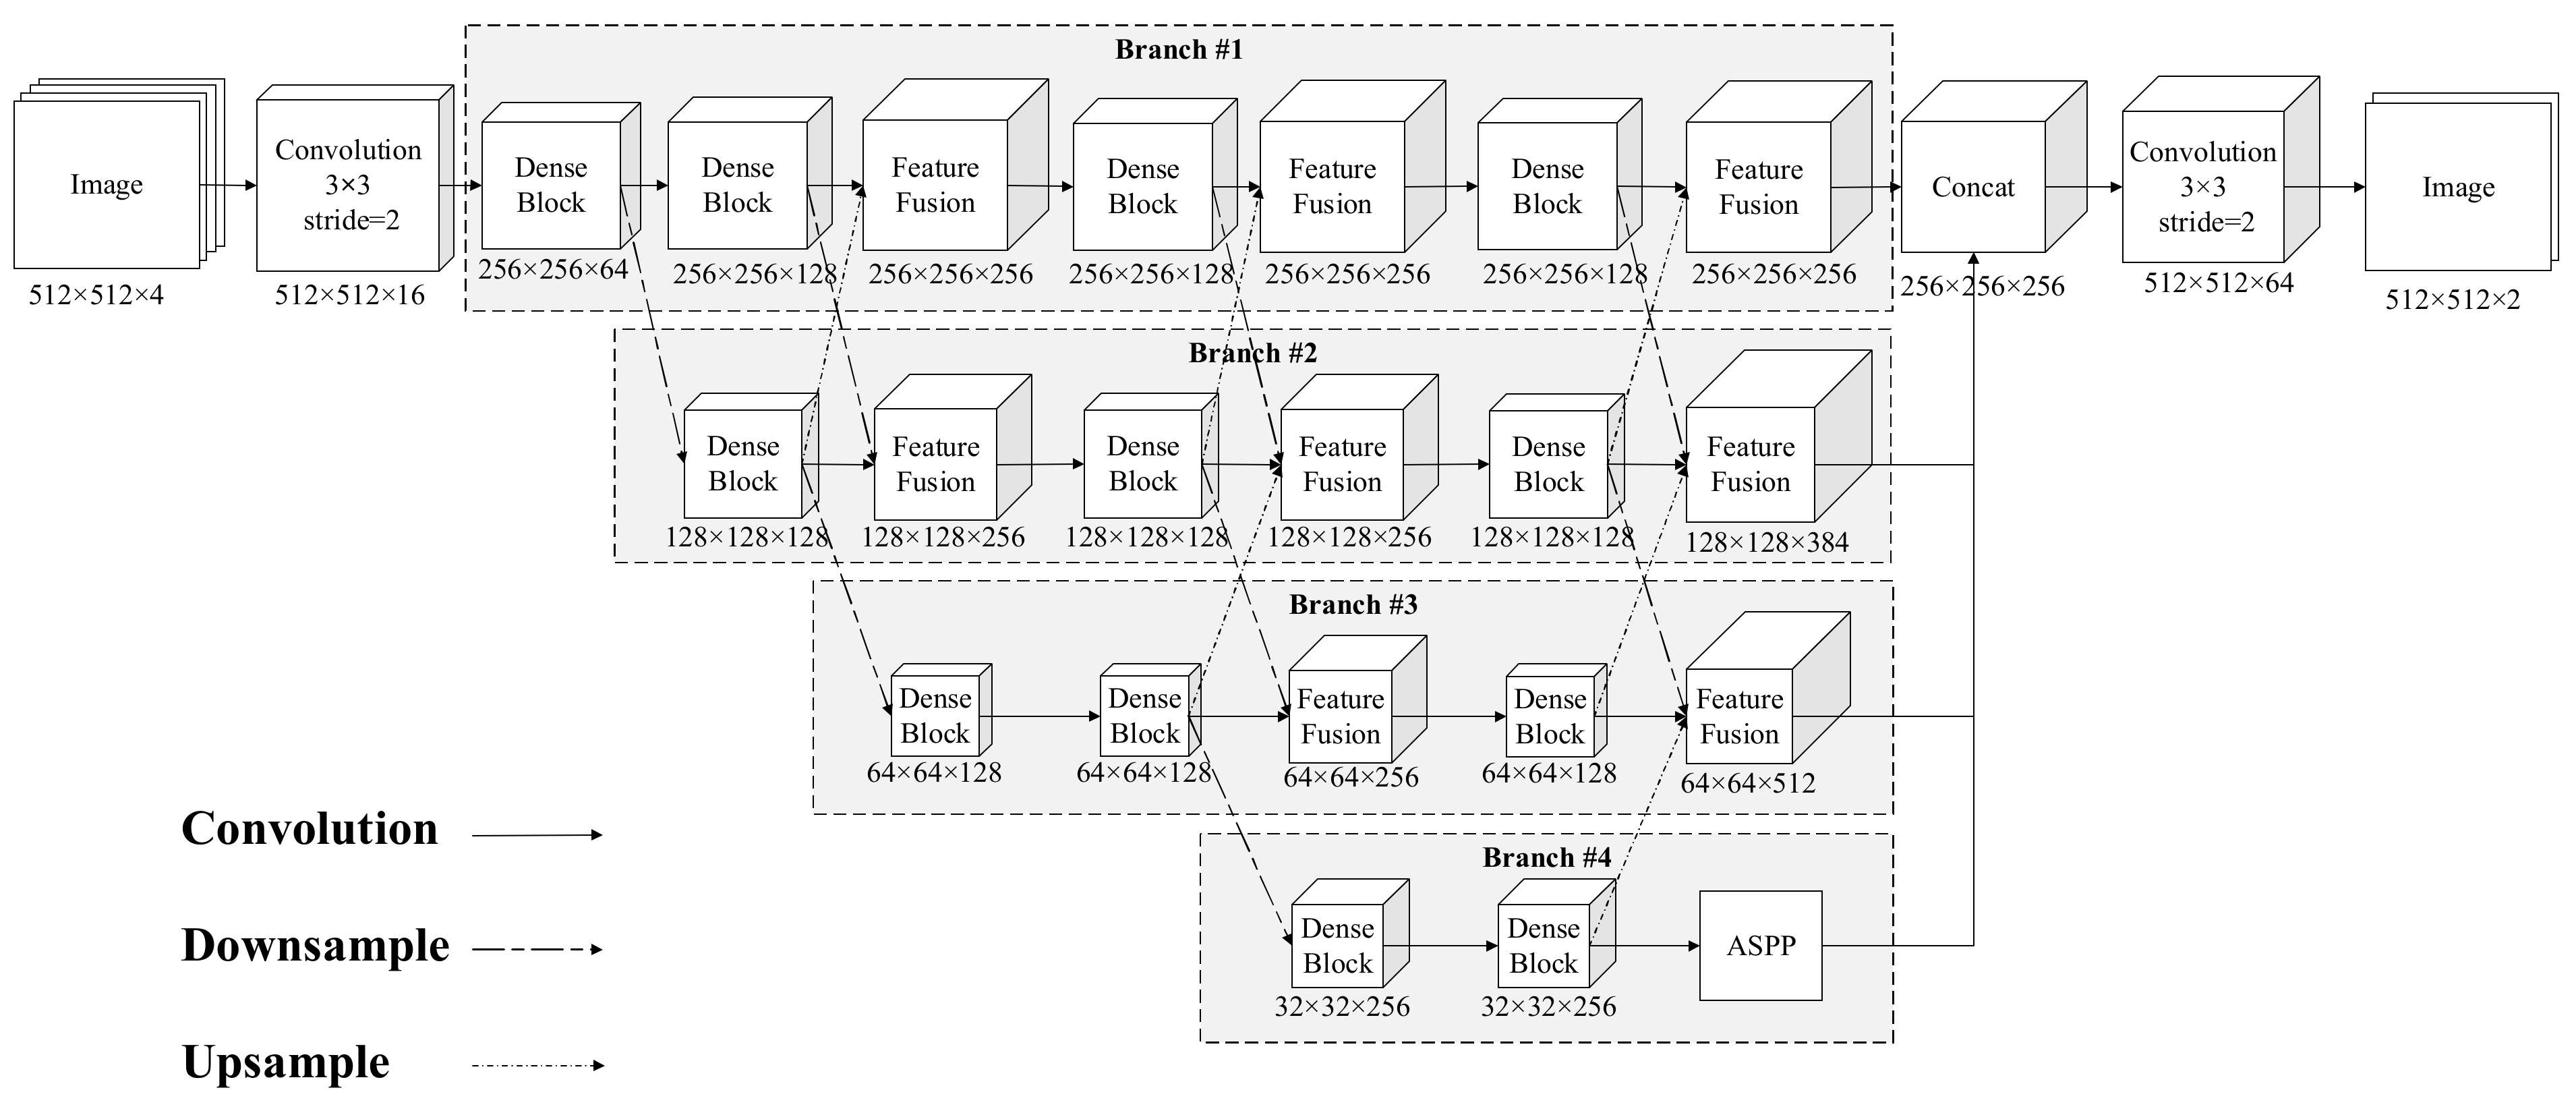
According to the limitation of CNN in the losses of feature resolution and spatial accuracy, this study attempted to create a multilevel features fusion network (MFFN) structure with parallel nets and feature fusion, which could effectively connect the high- and low-resolution features. In this structure, multiple parallel nets can retain feature information with different resolutions, whereas organic fusion for feature information at different levels can be satisfied; thus, the loss of spatial information decreases. Moreover, each net enhances the information transfer among the convolutional layers via dense blocks, and, as a result, the usability of the feature information improves. When considering the distinction of the scale for different objects, this structure draws information from the deep multiple-scale features’ receptive fields with the help of a pyramid structure of atrous convolution in the bottom layer. Thus, to extract building information effectively, this study proposes a MFFN structure, which can use feature information with different resolutions, capture multiple-scale object information, and improve segmentation accuracy. This network structure can be seen in Figure 2.
As shown in Figure 2, when the image is input into the network, the downsampling via convolution with a step of two is implemented to decrease the size of the feature map and ensure high calculation efficiency. The feature map is then downsampled when processed through a dense block each time. During the downsampling process, the size of the feature map is maintained via a branched net. Furthermore, with the help of a dense block, the features’ information is obtained, and four branch nets are divided and realize features at four different resolutions. These four branch nets can be listed as the first, second, third, and fourth branches in sequence. Each branch combines features from different branch nets in multiple layers via the feature fusion module. Meanwhile, to gain multiple-scale information on the deep features of a building, the atrous spatial pyramid pooling (ASPP) module is added after the fourth branch net in the network. In the course of recovering feature information, the second, third, and fourth branch nets adjust the size of the feature map to the same size as the first branch via constant upsampling. After combining the feature maps of the above four branch nets, the size of the feature map is upsampled to the same size as the input image. The SoftMax function is then used to realize the accurate segmentation for the building.
2.1.1. Dense Block
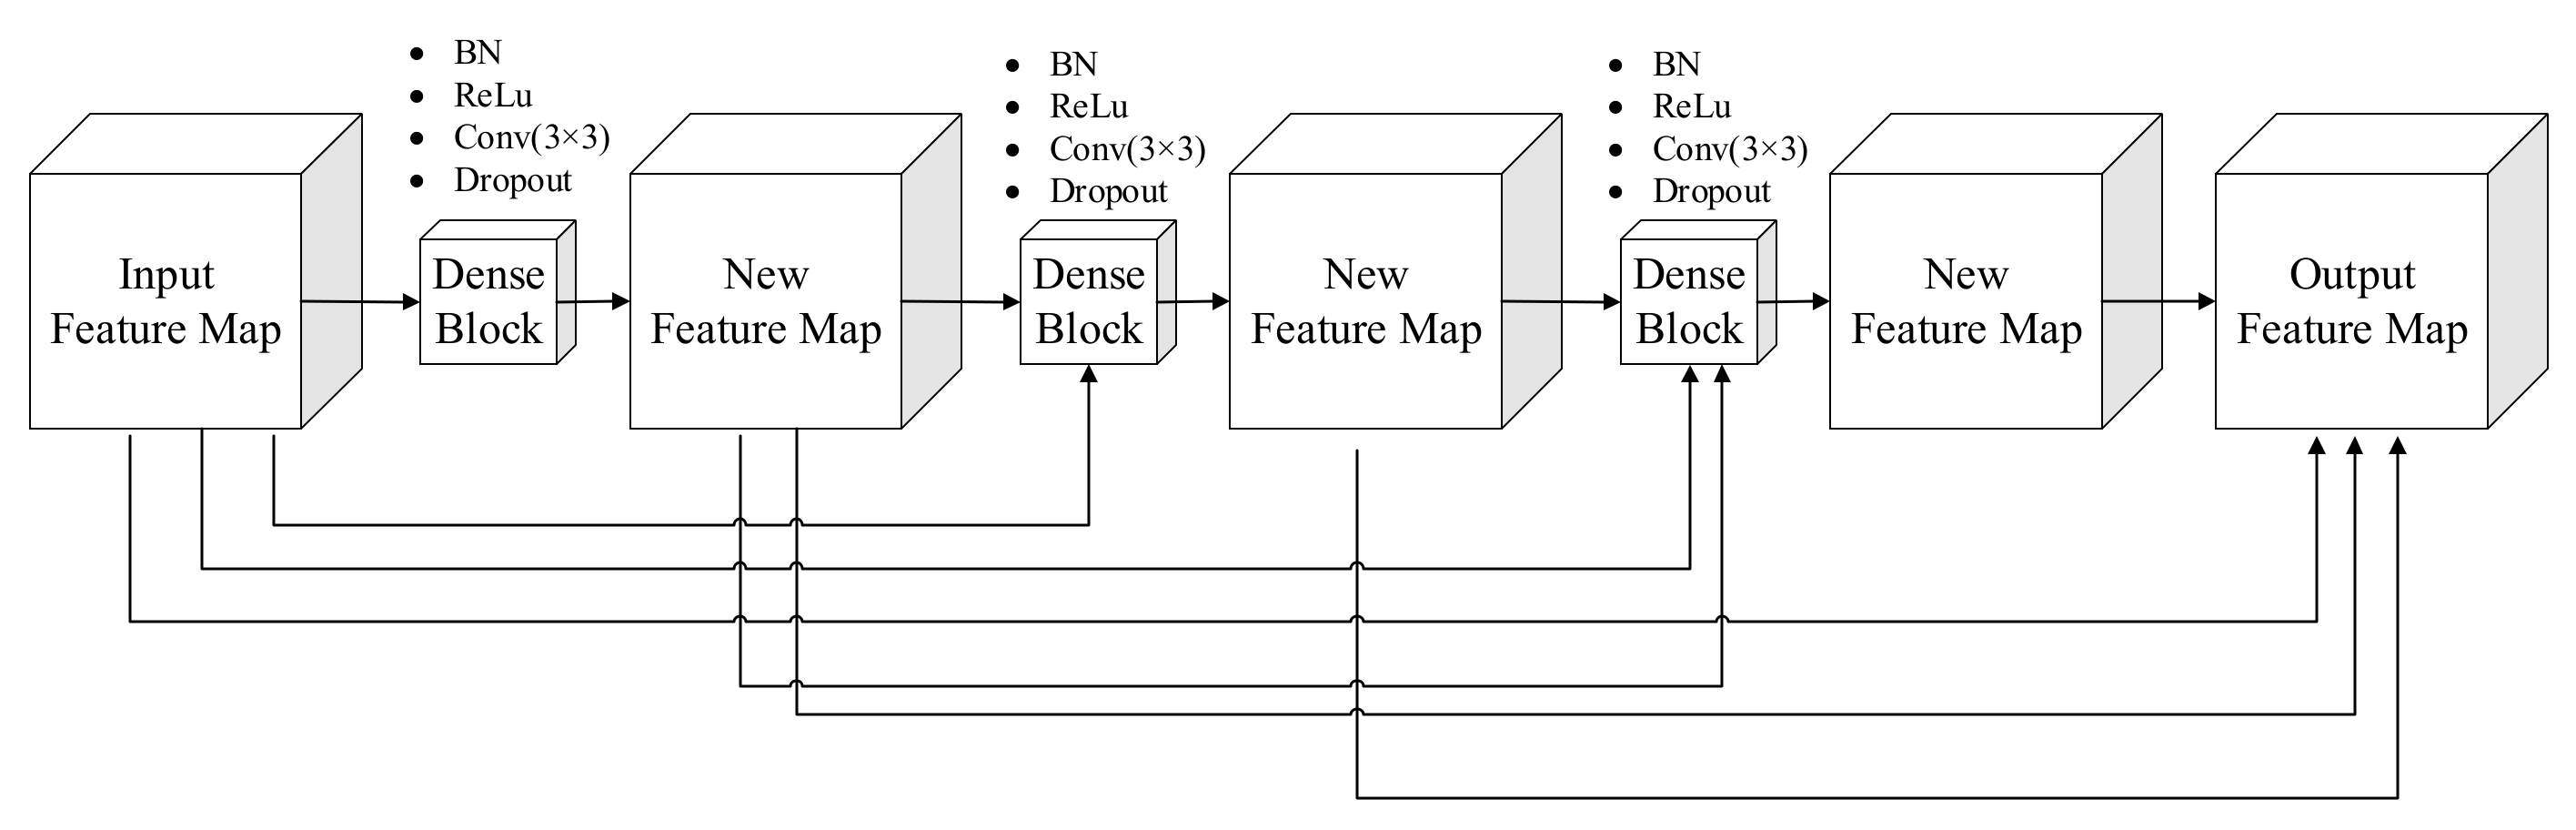
To ensure that maximum information is transferred between the different layers, DenseNet [25] uses dense blocks in the FCN. The dense block transfers the feature mapping in the former layer as the input to all layers in the subsequent nets. That is, every two layers have a direct connection meaning that the feature can be reused. There are L(L + 1)/2 connections to an L-layer net, as shown in Figure 3. The expression of the dense connection is shown below:
The expression [X0, X1, X2, …, XL−1] represents all the feature maps before the L layer. is the nonlinear combination function, including the batch normalized layer, nonlinear activation layer, convolutional layer, and dropout layer. The dense block solves the gradient loss problem in the network training progress, and the network parameters greatly decrease. Figure 2 shows the dense block with three convolutional layers.
2.1.2. Atrous Spatial Pyramid Pooling
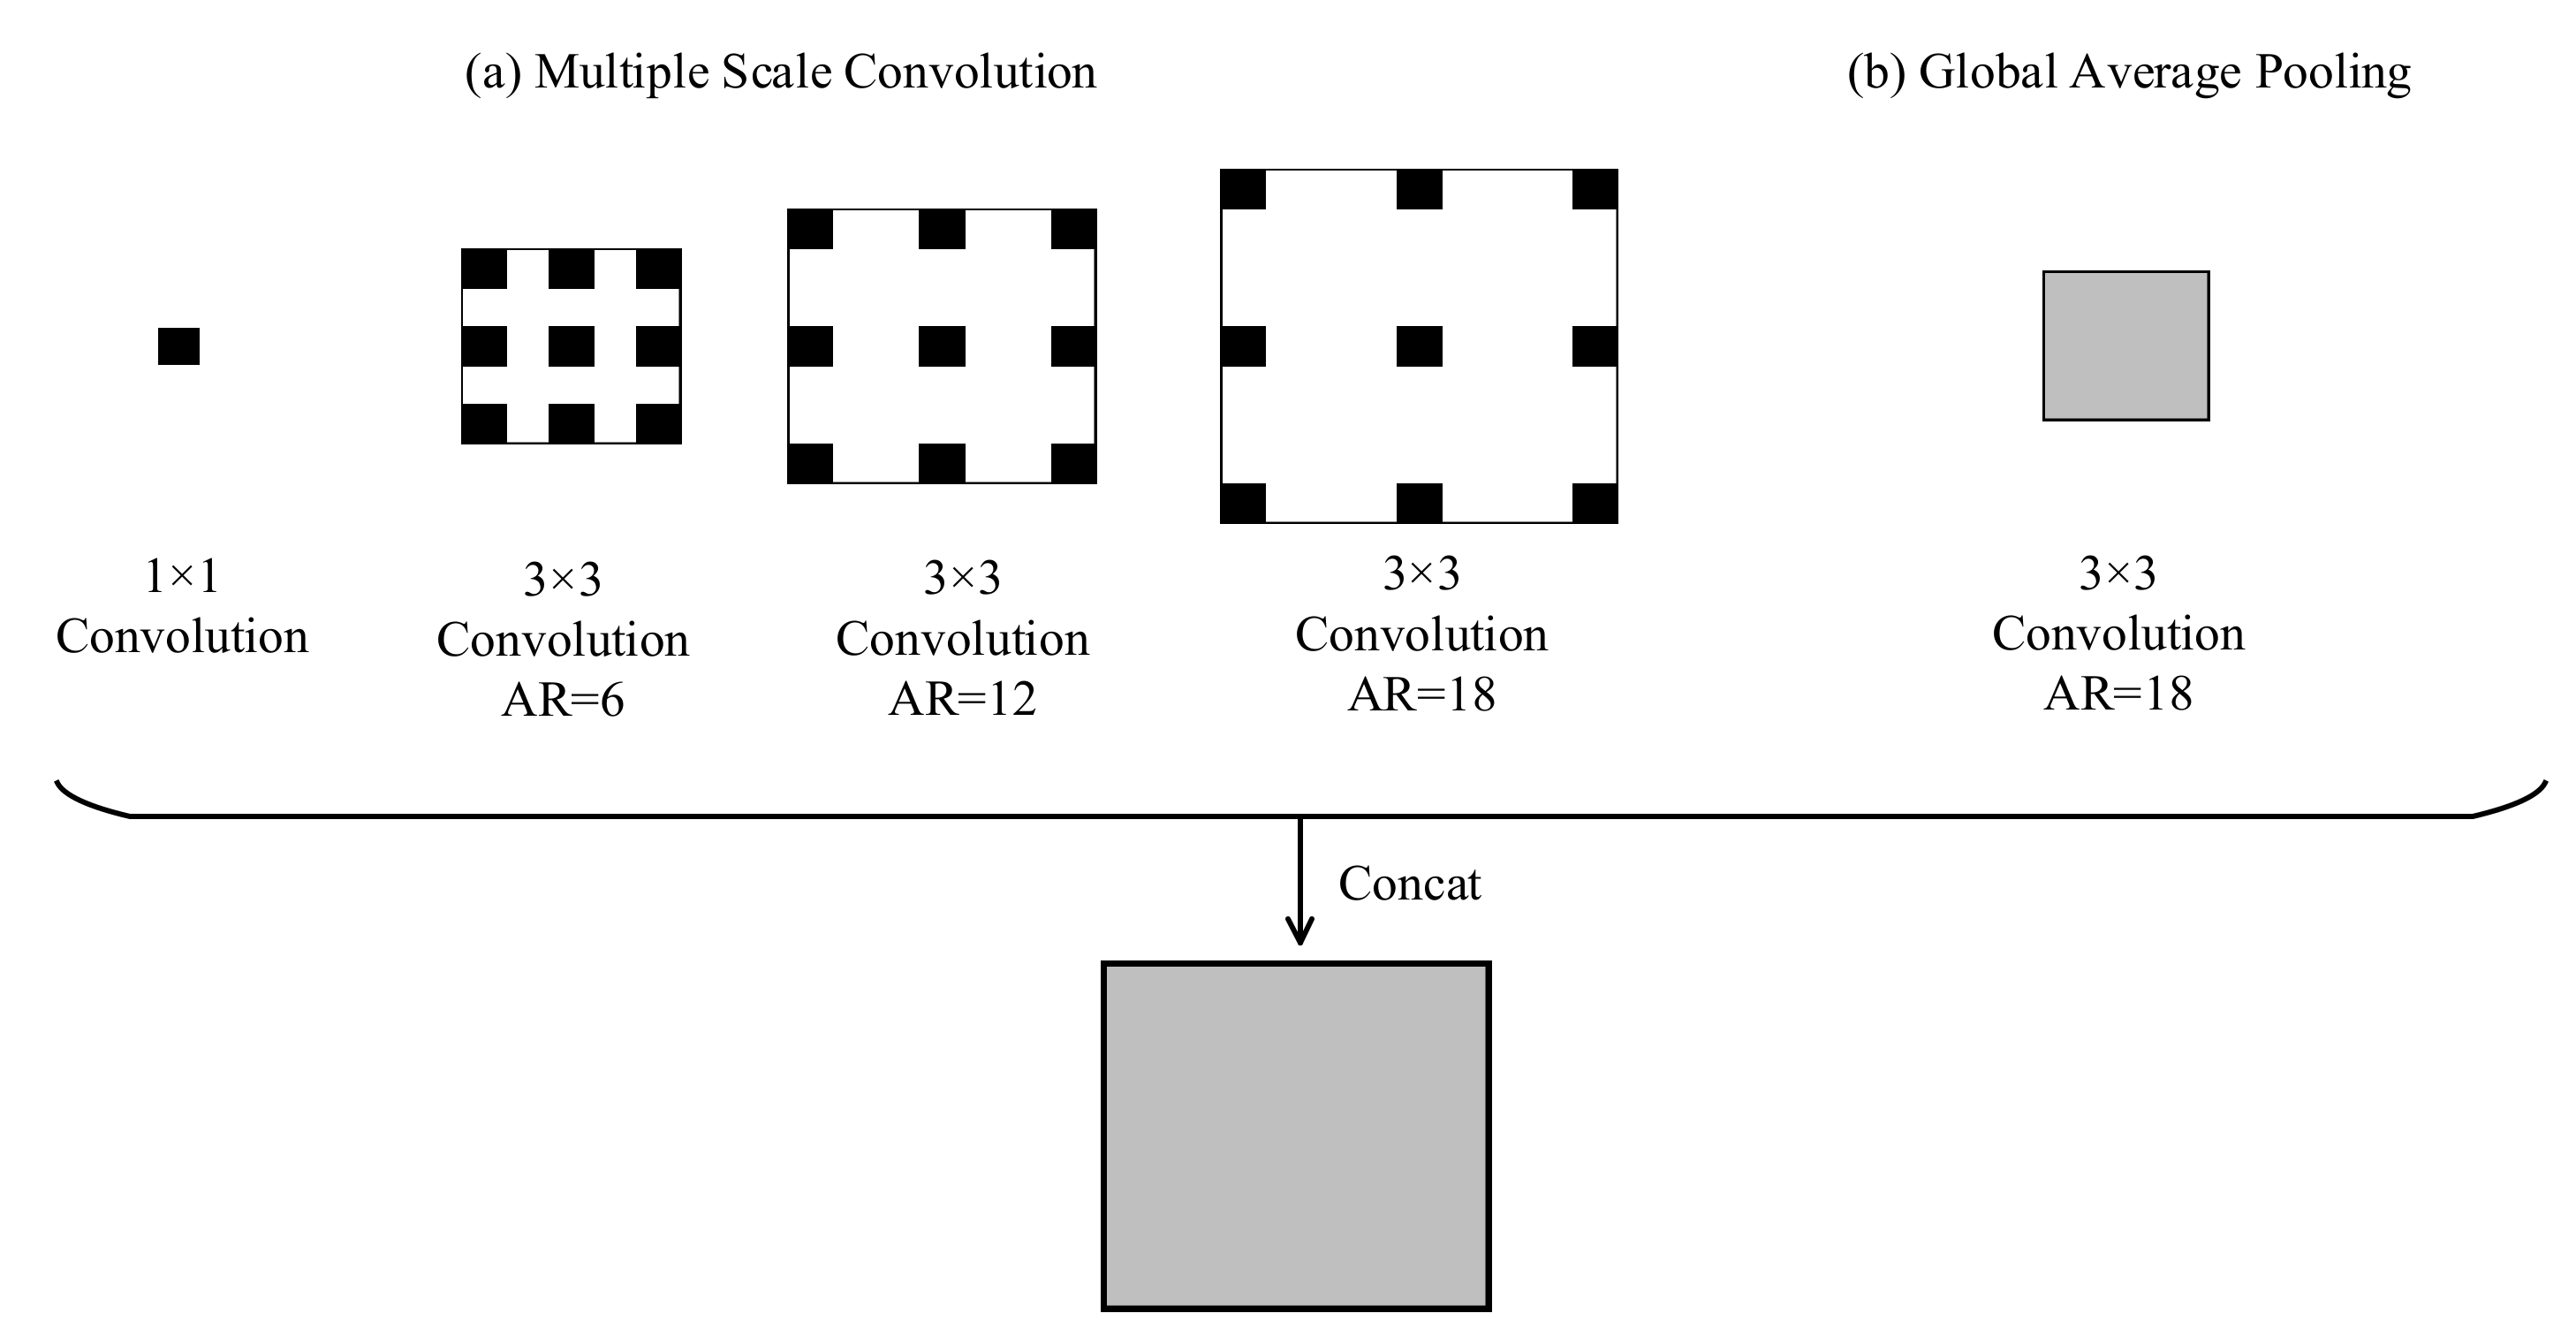
The disadvantage of the FCN structure is the loss of spatial features during convolution and pooling operations in the downsampling process, which results in the loss of detailed information. In [37], atrous convolution was proposed. Atrous convolution can take the place of pooling in downsampling, expanding the receptive fields, and retaining the spatial feature. However, constantly atrous convolution may result in “checkerboard artifacts”, which affect the coherence of object information. Moreover, a greater atrous percentage is unfavorable to the segmentation of small objects. In order to solve the above problem, the ASPP structure uses atrous convolution in different atrous rates to connect multiple-scale information. Each scale is considered as one independent branch. All of these branches are combined to output the convolution. This structure can provide abundant context information and is beneficial to the feature extraction of buildings at multiple scales. The ASPP contains multi-scale atrous convolution and global average pooling. The atrous convolution has one 1 × 1 convolution and one 3 × 3 atrous convolution at atrous rates of 6.12 and 18, respectively. Global average pooling was designed to obtain the feature map at the image level, allowing these two results to be joined and convoluted. Figure 4 shows the ASPP.
2.1.3. Feature Fusion Module
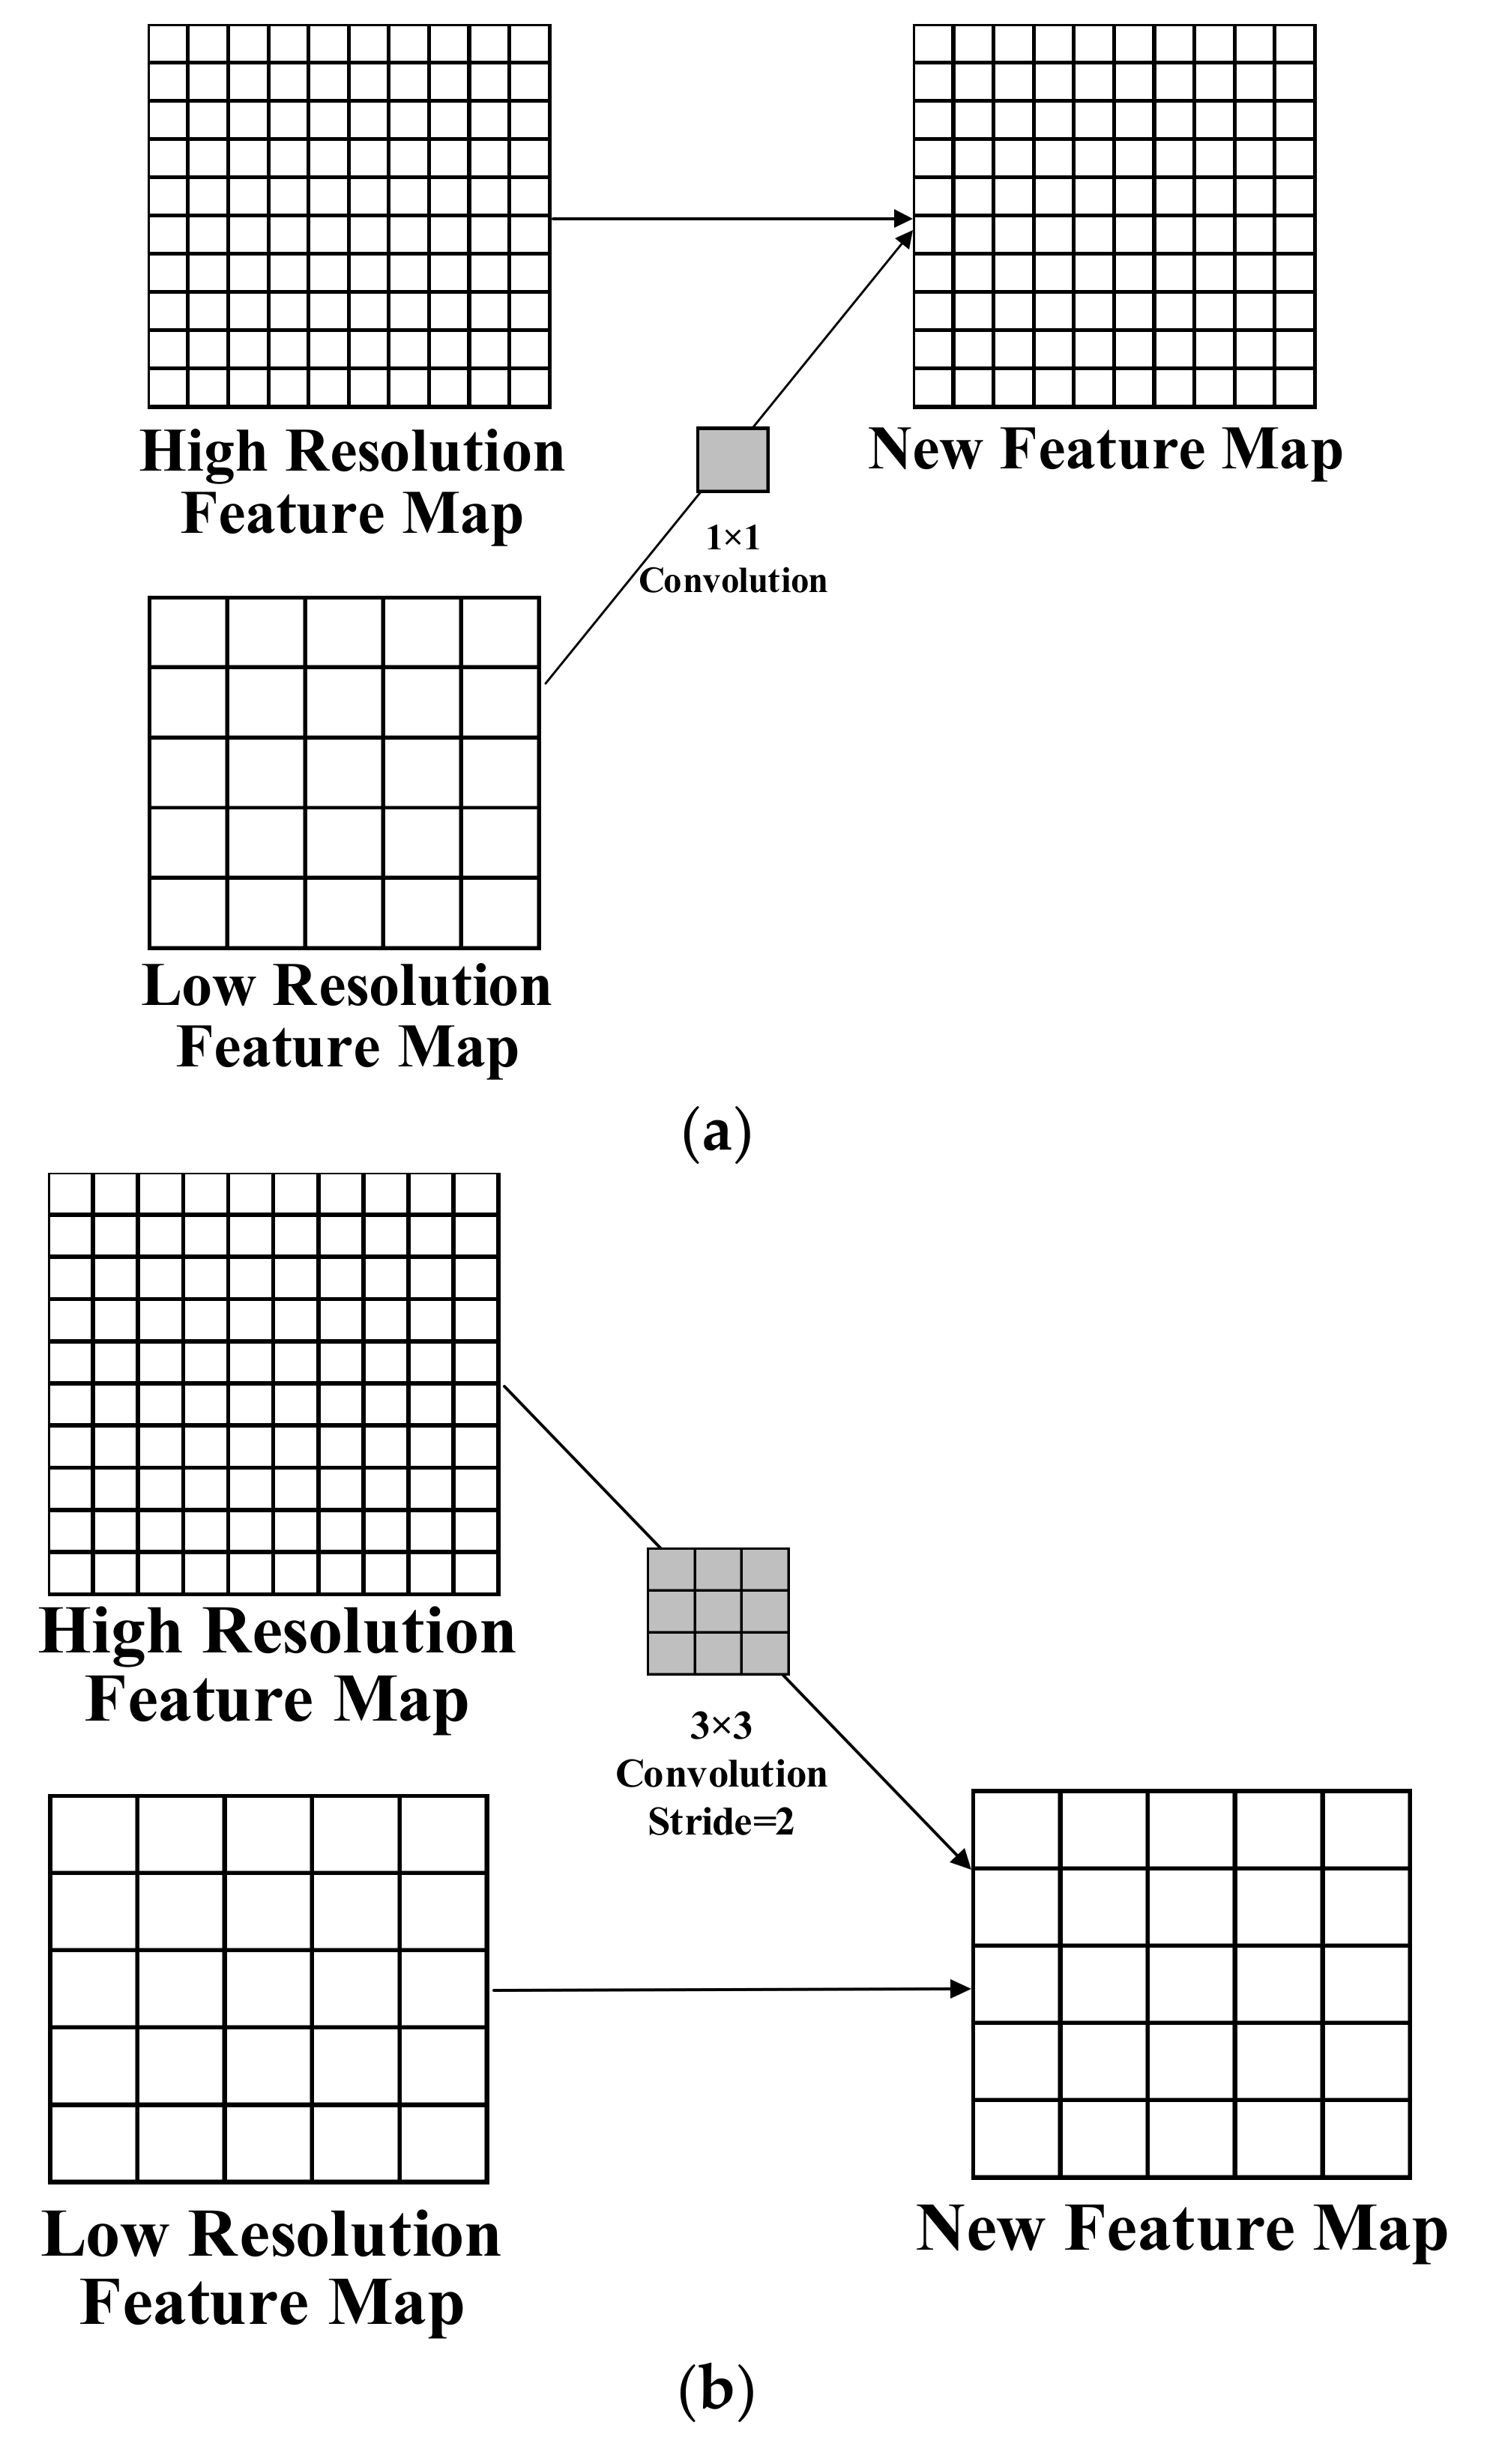
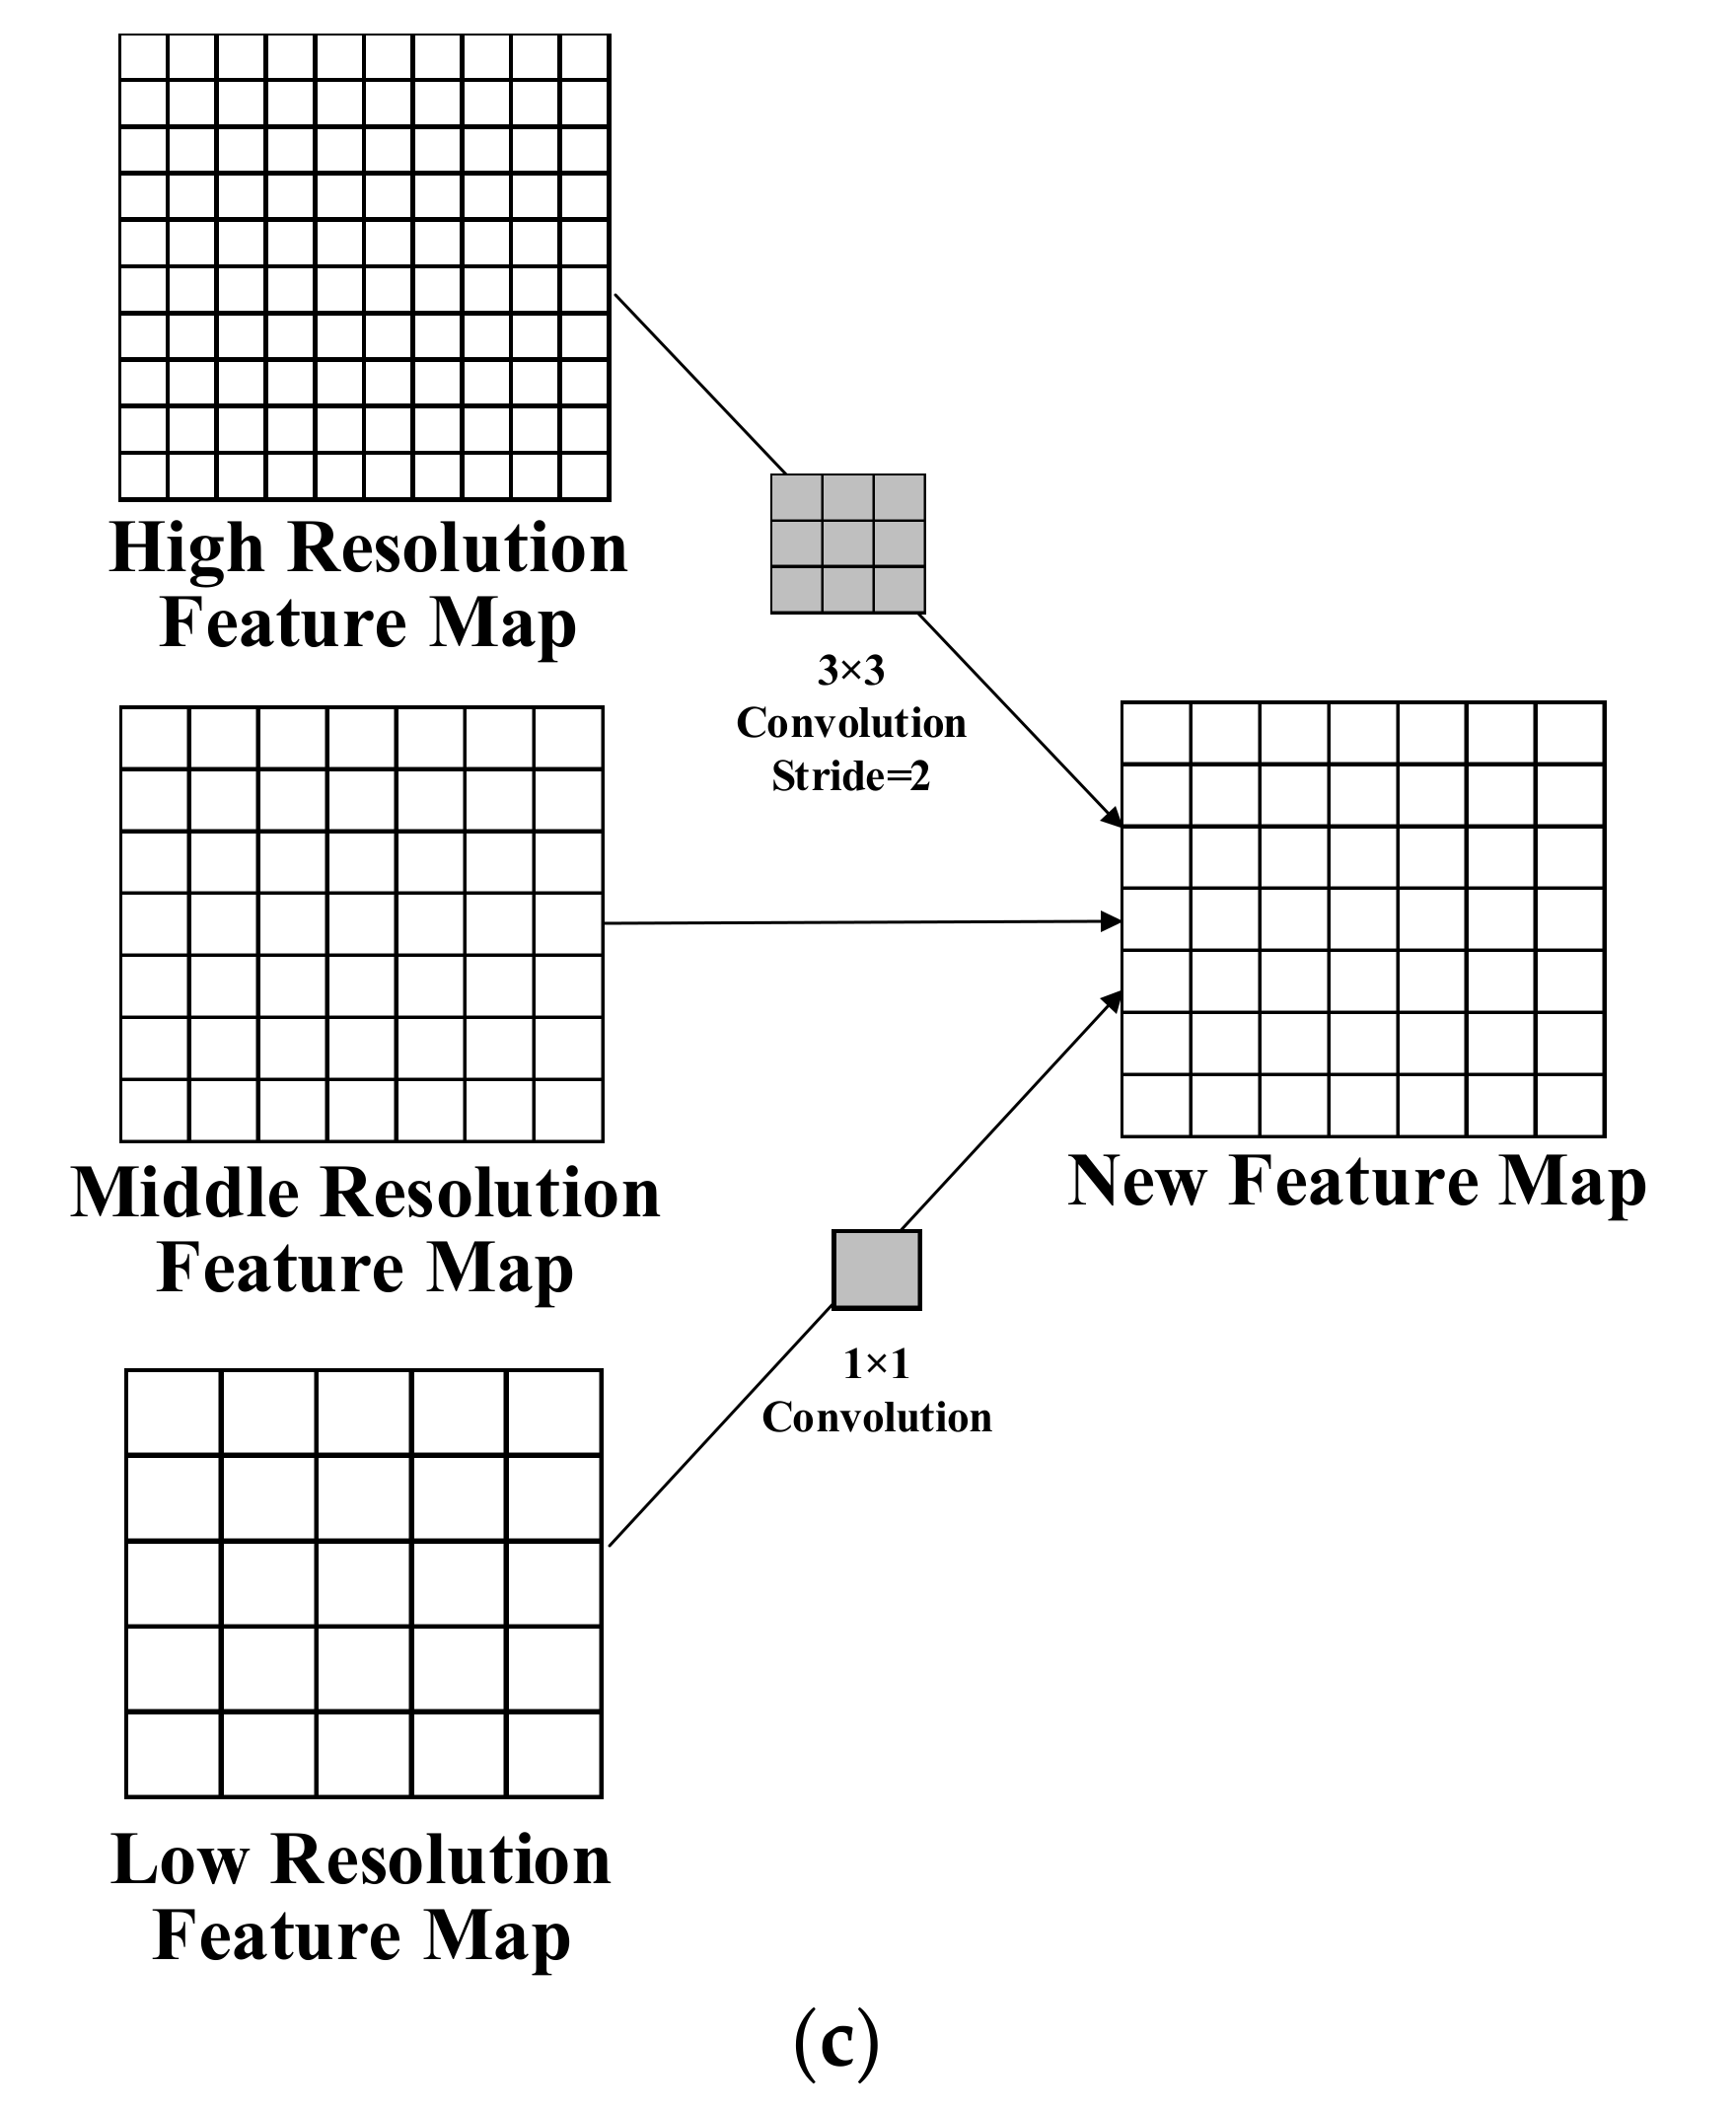
The feature fusion module in this study was designed to enhance the combination of deep-level and low-level features to maintain high- and low-resolution features to the greatest extent. The feature fusion module has three types, as shown in Figure 4. The first (Figure 5a) maintains the high-resolution feature map and retains the same number of channels of the low-resolution feature map as that of the high-resolution feature map via 1 × 1 convolution. The upsampling interpolation is then used to adjust the size of the low-resolution feature map to be the same as the high-resolution feature map. Afterward, the channels of the high- and low-resolution feature maps are overlapped, and the ReLu activation function is used to realize the output. The second (Figure 5b) is the maintenance of the low-resolution feature map by using convolution with a 3 × 3 kernel size and a step of two to downsample the high-resolution feature map to the same size as that of the low-resolution feature map. The channels of the high- and low-resolution feature maps are then overlapped. Afterward, the results are output via the ReLu activation function. The third (Figure 5c) maintains the moderate-resolution feature map, where the low-resolution feature map is upsampled and interpolated to the same size as the moderate-resolution feature map. The high-resolution feature map is downsampled to the same size as the moderate-resolution feature map via a kernel size of 3 × 3 and a step of two. Next, the channels of the high-, middle-, and low-resolution feature maps are overlapped. Finally, the result is output with the ReLu activation function.
2.1.4. Sample Processing
Since the GF-7 images are limited in the testing stage, a sufficient number of samples cannot be collected using GF-7 images only. Thus, GF-2 satellite data, which have a 0.8 m resolution for the panchromatic image and 3.2 m for the multispectral image (thus, allowing for 0.8 m of images to be fused), are used for network training. The resolution and spectral characteristics of the GF-2 multispectral image are similar to the GF-7 multispectral image.
In order to train the network, the first step is vector editing. In this process, with the help of the ArcGIS software Feature Editing tool, we drew the building’s vector boundary via visual interpretation. The accuracy of vector editing directly affects the quality of image samples and the performance of the final network. Thus, strict requirements are emphasized in the operation of sample drawing, and the error is limited to one pixel. Besides the interpreted results, other samples of the building were selected from the existing surveying databases. Secondly, we used the Calculate Field tool in the software ArcGIS. The property of the building class is assigned the value of “1”, and the non-building is assigned “0”. Finally, a total of 188,092 building polygons were collected. In the third step, the vector data with property values were then transferred into the raster data, considered label data. In this process, the Feature to Raster tool in ArcGIS was used, and the raster data were highly coherent to the image. Afterward, the image and raster label data were clipped into sub-datasets because the computer storage was limited such that the whole image could not be input into the computer and calculated at one time. The Split Raster tool of ArcGIS was used, and the size of the sub-image was 512 × 512, while the size of the label data was 800 × 800. After the clipping process, there were 21,245 sub-images available. The training data and test data were divided according to the ratio of 3:1. Thus, a total of 15,934 sub-images were used as the training sample, while 5311 sub-images were used for network validation.
2.2. DSM Generation with Stereo Images
After the network of building extraction is designed and trained, providing the polygons of the building from the GF-7 image, the elevation information is needed to generate the building. In this case, GF-7 DLC images were used to create the DSM to obtain the building height. Here, the DSM was the digital surface model for the study area, and depicted the building, forests, and above-ground objects. The DSM generation process was implemented with the steps described below.
The GF-7 DLC images provide a stereo mapping ability, and high geometric accuracy was validated by some researchers [5,38]. Since the GF-7 DLC images fulfill 1:10,000 scale stereo mapping, the building elevation information can be obtained with acceptable accuracy. DSM generation includes a variety of processes, such as image orientation, ground control point (GCP) collection, tie point (TP) collection, and epipolar image extraction. All these processes are completed via the software PCI Geomatica. The DLC images are a sensor-corrected (SC) product from LASAC; they are oriented via their rational polynomial coefficient (RPC) files. The GF-7 DLC images have good geometric characteristics [38], and image orientation provides a basic geometric correction for subsequent processes. GCP collection is important for subsequent accuracy. This procedure uses fast Fourier transform phase (FFTP) matching to obtain a sufficient number of GCPs for forward and backward images. This approach is suitable to avoid relative displacement between forward and backward images and return a phase difference in the Fourier domain. FFTP method can then locate the deviation between two images with the phase difference. After the GCPs are collected, to assure the matching of forward and backward images, the corresponding points between these two images are connected as the TPs, and then interpolation is performed to increase the density of the connection. Meanwhile, the points with greater residuals are removed to ensure higher accuracy for match modeling. Based on the TP results, the epipolar images can be processed as forward images to those determined to be left epipolar images and the backward images to those determined to be right epipolar images. For epipolar images, The semi-global matching (SGM) method, which uses a pixel-wise, mutual information (MI)-based matching cost for compensating radiometric differences of input images [39], is used to generate the DSM data.
2.3. Building Modeling and Urban Scene Generation
A 3D model building is a digital representation of a three-dimensional object. With the help of the building polygon vector and DSM, 3D models of buildings can be created, viewed, and modified using specialized software referred to as 3D modeling software.
Building information extraction provides us with a polygon of the building vector, representing the panel information for a building. The DSM provides the elevation information of the building in the corresponding area. By combining the building polygon vector with the elevation information, a rough model of the building can be generated. Then, to stretch the building 2D polygon model to a 3D (or 2.5 D) object, a white model of the building can be obtained, which also satisfies the requirements of the LOD1 model. The white model should be organized in the database so it can be used for visualization.
2.3.1. Building Modeling
The elevation information of the building polygon is obtained from the DSM pixel value. The average pixel value within the boundary of the building area is calculated as the height information of this building polygon, and this information is on the property of the feature object stored in the building’s shapefile.
Based on the dataset for the building vector with elevation information, the software Blender is used to generate the white model of the building. First, the building vector polygon shapefile is imported into Blender, and the height information of the building is input from the height attribute in the shapefile. After stretching the building polygon into a 3D model, the building model is saved as an FBX file.
2.3.2. Urban Scene Generation
After the FBX file of the building’s white model is generated, we can import the whole image scene into a 3D engine editor. In this study, Unreal Engine 4 (UE4) was used to create the urban scene with the processed building models.
UE4 is a game engine developed by Epic Games, initially designed for the first-person shooter (FPS) game Unreal in 1998. It has since been used in a variety of three-dimensional game genres and adopted by other industries, most notably the film and television industry. Written in C++, Unreal Engine features a high degree of portability, supporting a wide range of desktop, mobile, console, and virtual reality platforms.
Our study imported the building models, DSM, and multispectral fused images derived from GF-7 images into the UE4 editor to generate an urban scene (Figure 6). With the help of the UE4 editor, the PBR material was set up, and environmental effects, such as the skysphere, directional light, and skylight, were also created. The skysphere was used to simulate the sky for our scene, and the blue sky and cloud materials constituted the skysphere actor. The directional light was set up to generate sunlight and shadow effects. The former was the main light source for the whole scene, whereas the latter represents the shadow for the ground object with a certain height, such as a building, tree, or hill. The skylight reflects the sunlight illuminating the ground objects and atmosphere in the scene environment and causes the scene to appear more realistic. All these actors are organized as a level in the UE4 editor. The level can run directly in the editor or be compiled in a C++ program for the application.
3. Experimental Results
3.1. Experimental Setup
3.1.1. Data
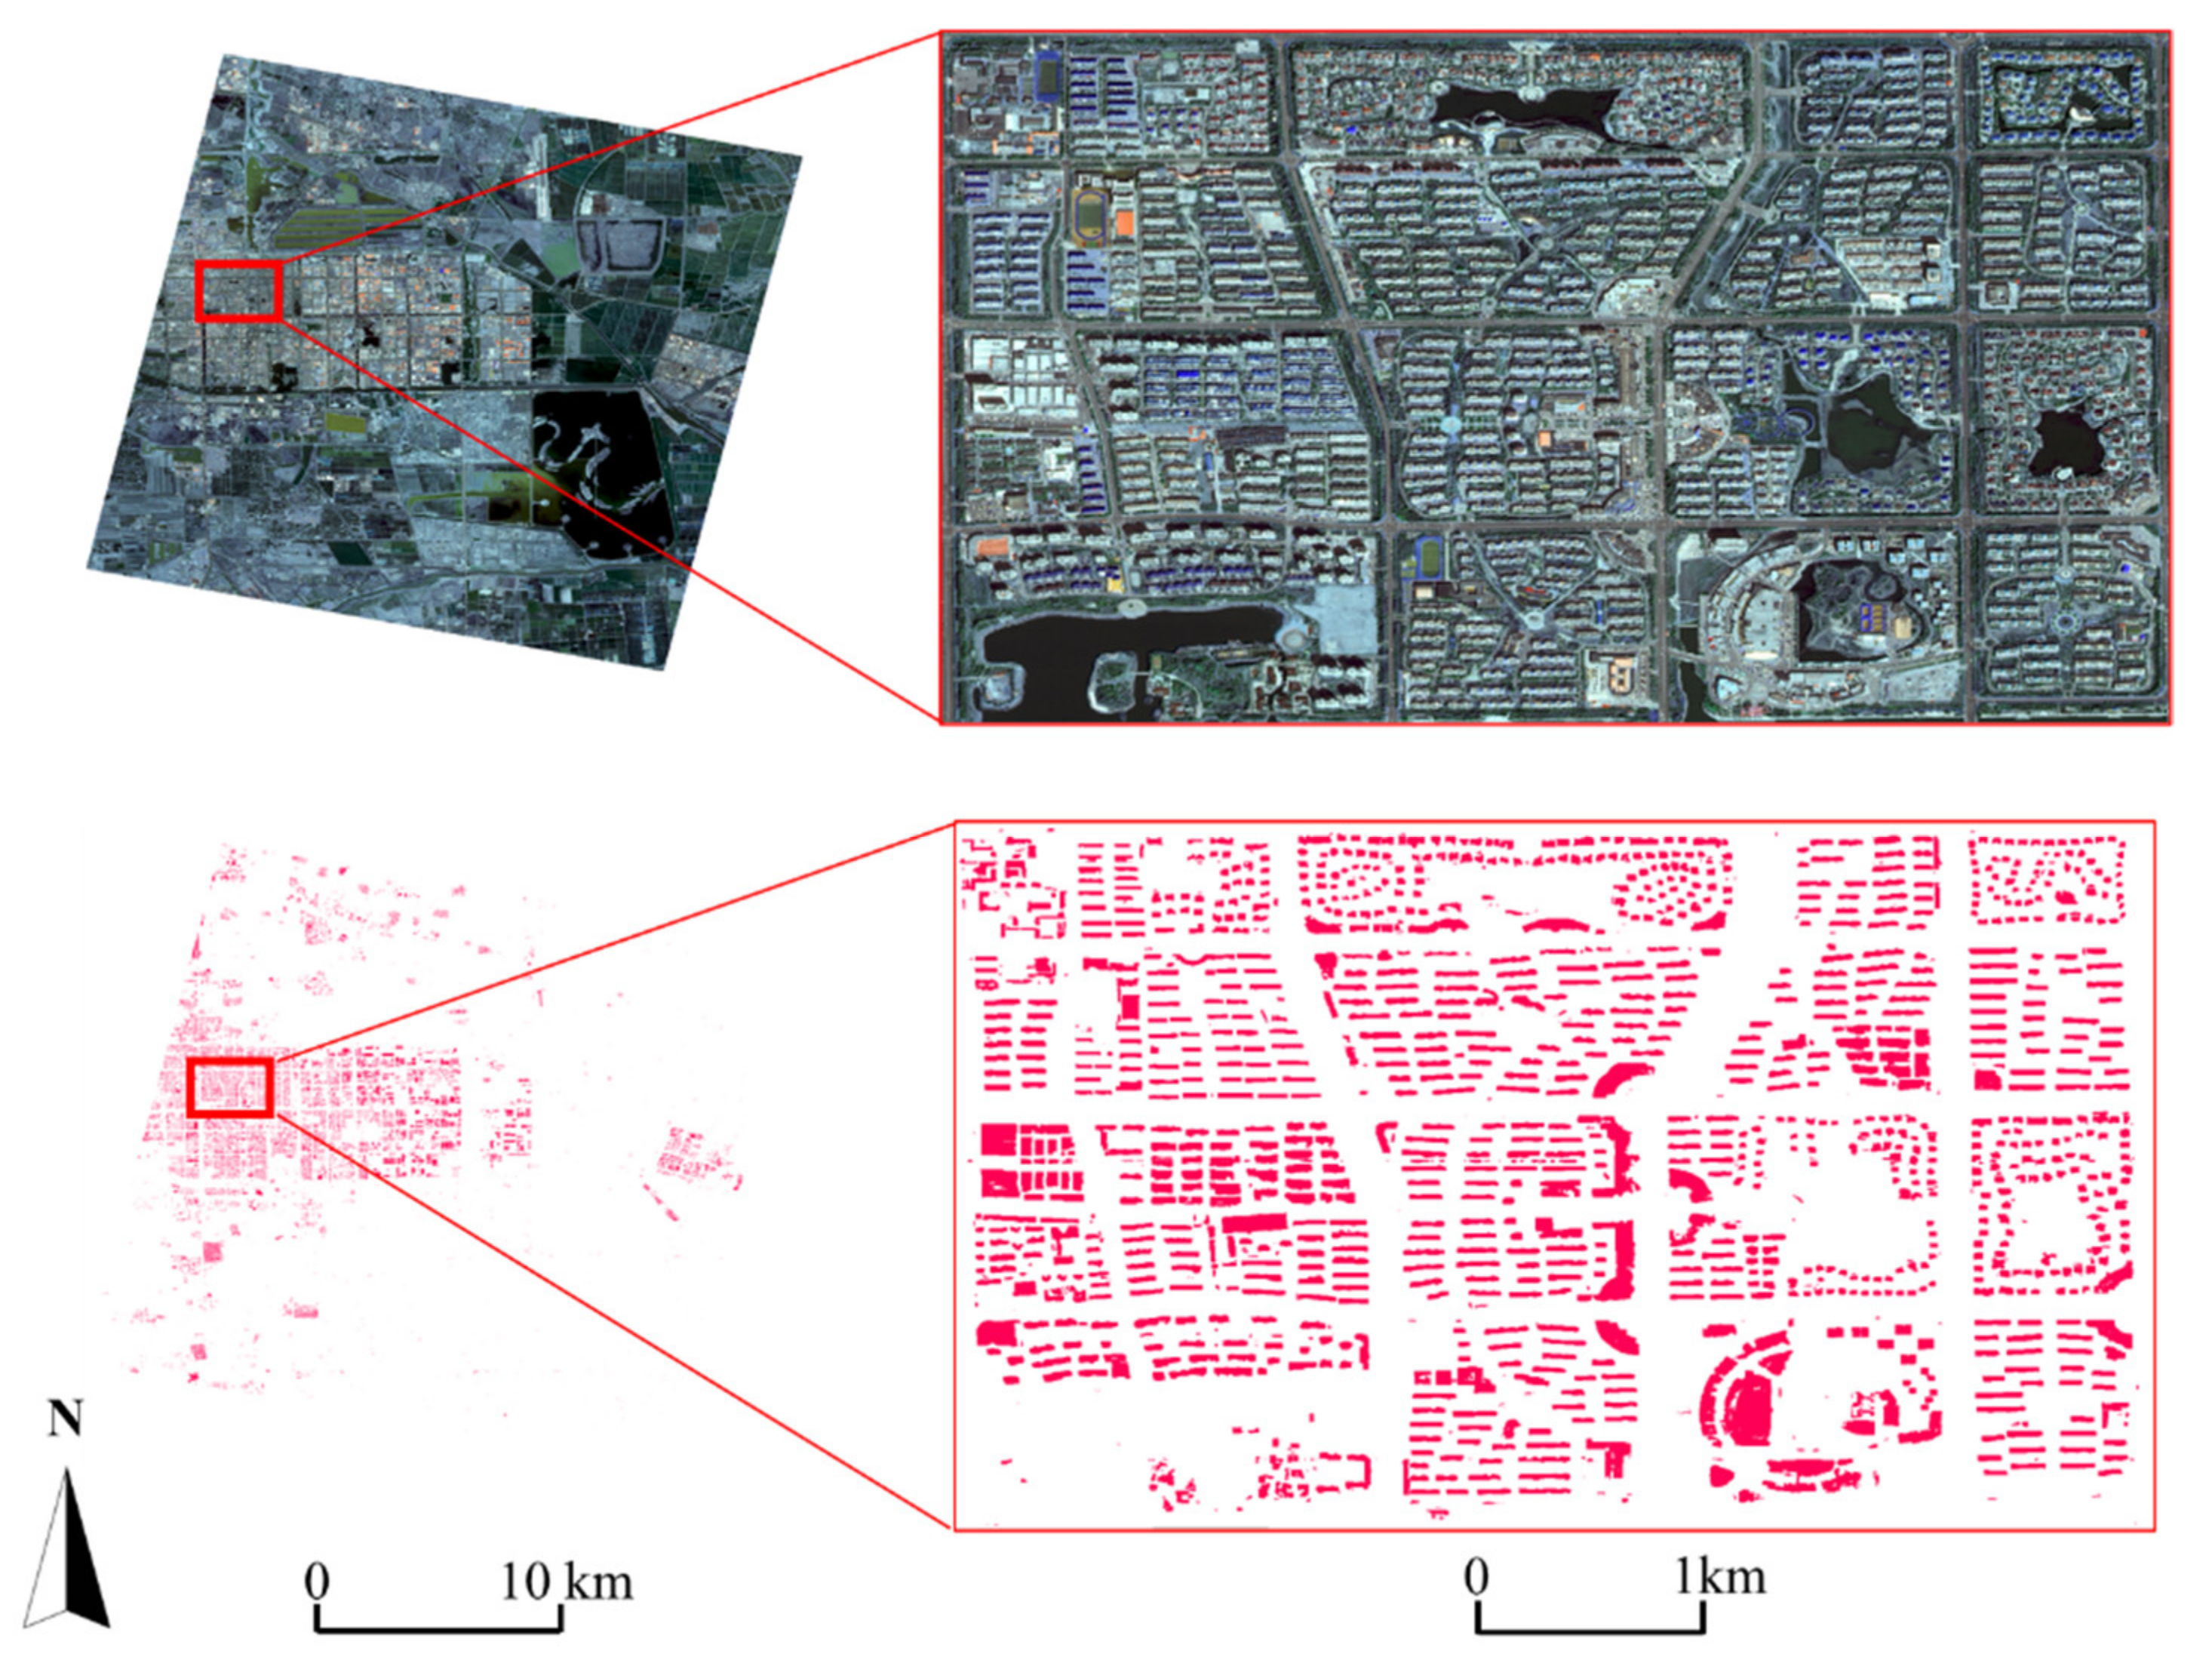
GF-7 DLC and MUX images were used in this experiment. The GF-7 images were acquired on 13 April 2020, as the testing images, with a cloud coverage of 5% in the metadata. The images cover an urban area in Dongying, China. The study area is plain, containing both urban and rural areas. There are some urban areas toward the central–western part of this district. One-fourth of this image is urban area; thus, in this study, we used these images to examine the ability of GF-7 to mode an urban scene. The experimental GF-7 images are shown in Figure 7.
3.1.2. Setup
The setup and workflow of this experiment are shown below in Figure 8. With the help of the trained network, our study used three steps to complete urban scene modeling using GF-7 images: image preprocessing, building modeling, and urban scene modeling. In the building extraction process, the multiple-level network mentioned above, which contains the modules of the dense block, ASPP, and feature fusion, was used. In order to generate the DSM of our study area, PCI Geomatica was used to conduct image orientation, GCP collection, TP collection, epipolar image generation, DSM production, and digital orthorectified model (DOM) processing. The building extraction vector polygon results and the elevation information provided by the DSM were then combined, and Blender was used to complete building stretching and white model generation. Finally, the whole study area scene with the building’s model was organized as an FBX file and imported into the UE4 editor for environment rendering. The scene level was then created for visualization.
3.2. Network Training
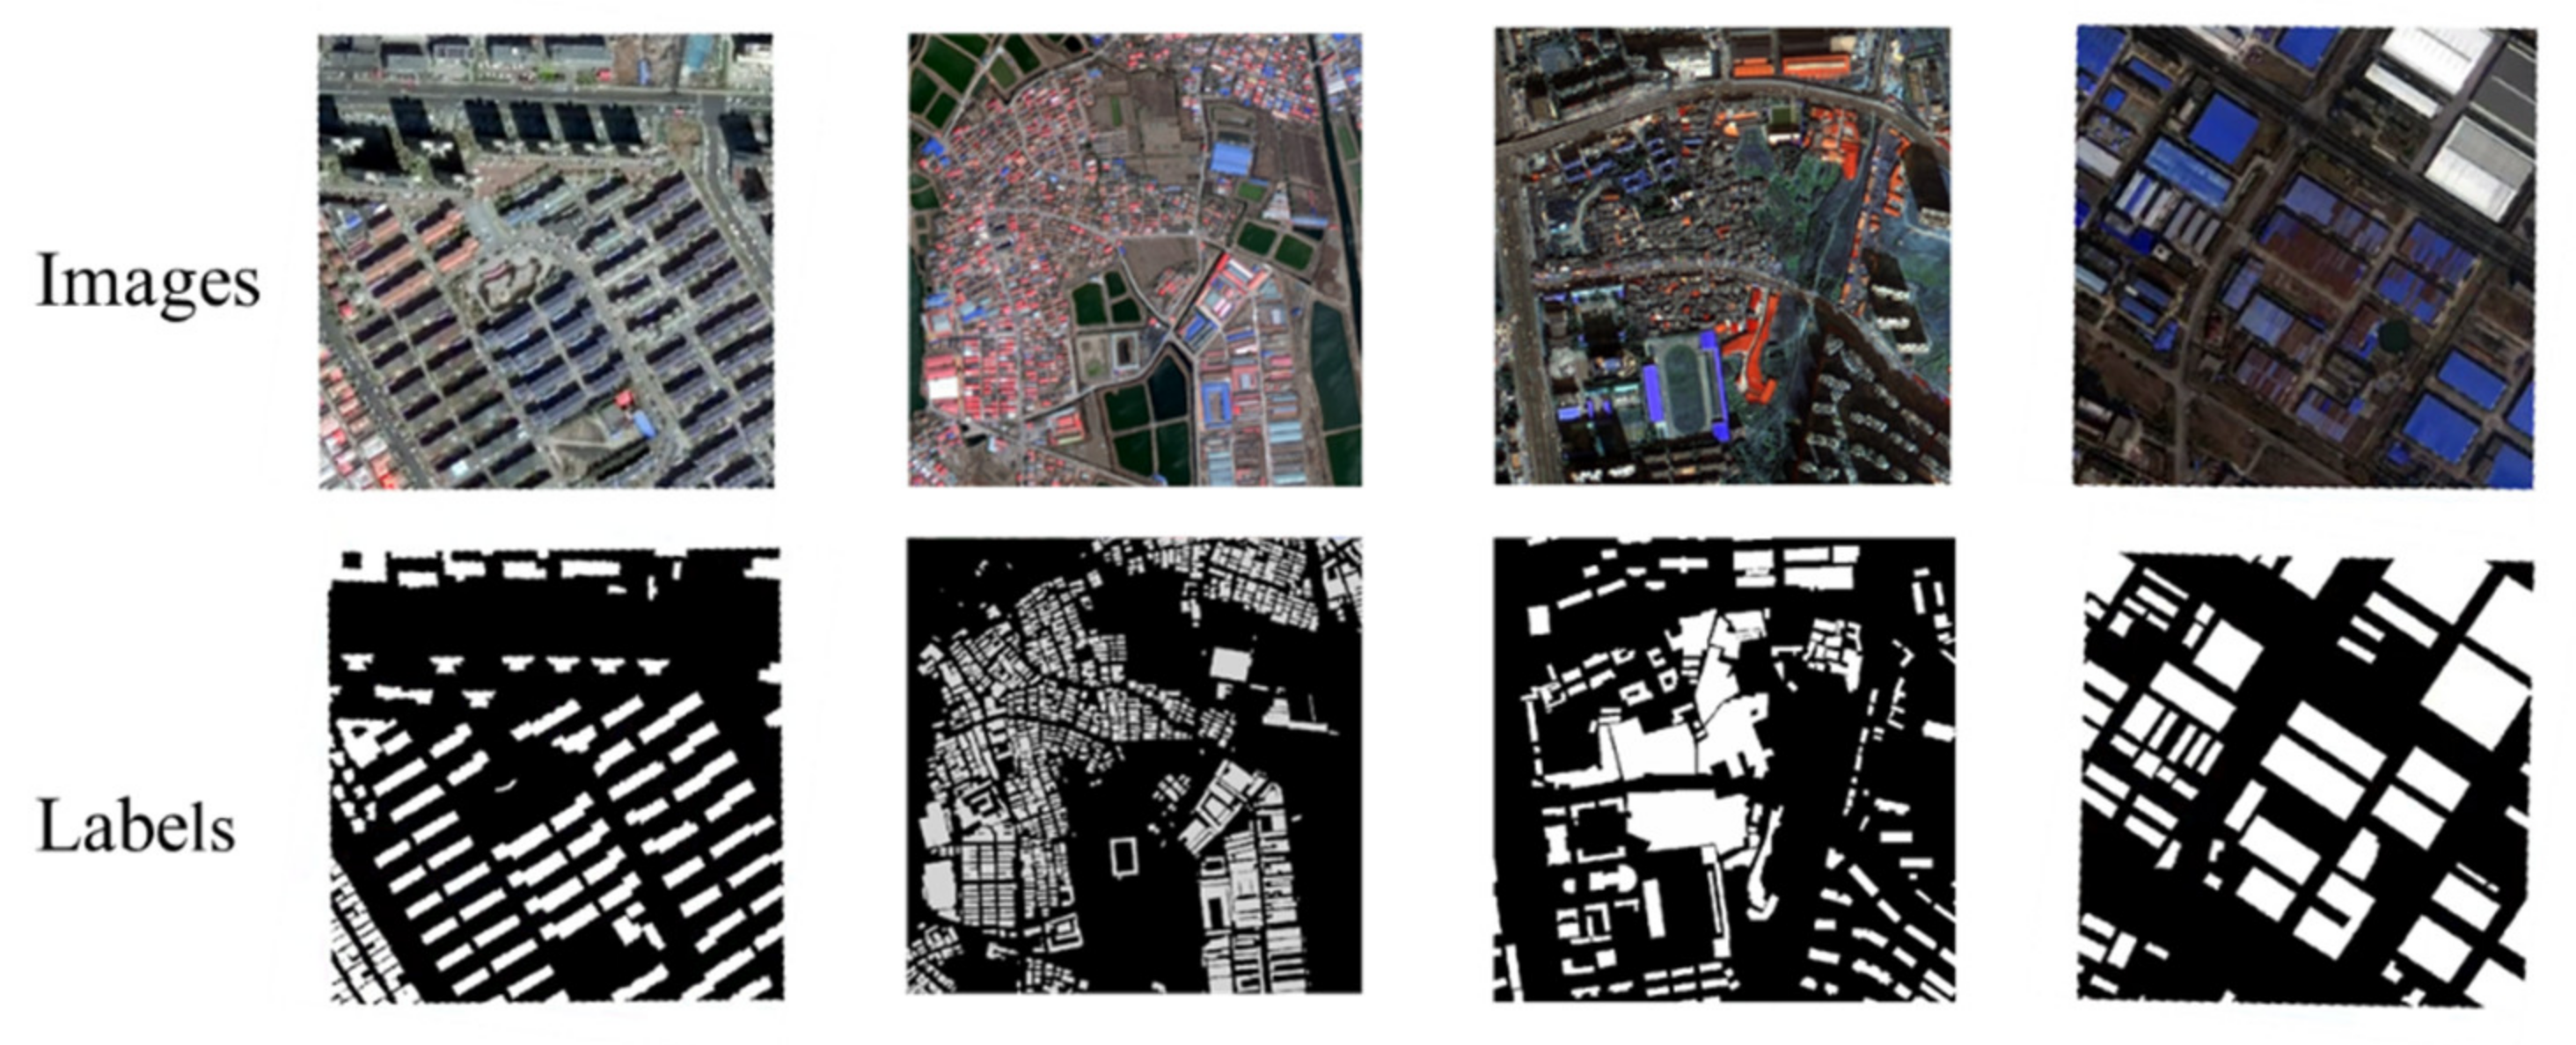
In order to train the network, training samples should be processed to establish a sample data set. The processing includes vector editing, property assigning, raster transformation, sample scale segmenting, and dataset dividing. Therefore, we trained the network with GF-2 image samples and attempted to use this network in the building extraction from GF-7 images. The samples can be seen in Figure 8.
The proposed model for this study is implemented in Tensorflow framework. The loss function of the model adopted a binary cross-entropy loss function. The batch size was set to four, the number of epochs was 80, the number of iterations per epoch was 5000, and the Adam optimizer with an initial learning rate of 0.001 was used to train the models.
3.3. Results of Building Extraction
3.3.1. Extraction Results
In our experiment, we adapted our trained network to the GF-7 multispectral fused image derived from the backward image and multispectral image for classification. The experiment and comparison are presented to evaluate our classification approach. In order to realize the subsequent integration and application, we saved the trained model as a Pb file using Microsoft Visual C++ on a Windows 10 operating system with 32 GB memory, an installed NVIDIA GeForce GTX1080Ti graphics card and 8 G byte graphic memory.
In the building extraction results from our method, we can observe all kinds of building structures, including high-rise, mid-rise, and low-rise buildings, single houses, workshop buildings, and others, which are effectively extracted, as shown in Figure 9. Not only does our method suit rectangular-shaped buildings well, but some buildings with a complex shape are also segmented. Buildings in the residential estate are clearly drawn in the results, and the boundary is well defined (Figure 10a). The mid-rise and high-rise building extractions are of good quality (Figure 10b,c), which indicates that subsequent building 3D modeling is possible. However, it is impossible to completely segment larger buildings, such as commercial market buildings or conference buildings, where some errors occur, and the building body is divided into various parts (Figure 10d). Generally, building extraction results can be visually interpreted. However, most buildings are extracted with a clear shape and can thus provide a panel boundary for building 3D modeling.
3.3.2. Accuracy Assessment
In order to analyze the quantified extraction result, our study used a pixel-based assessment. Through the statistics of the building extracted pixel and the validation sample pixel, the overall accuracy (OA), intersection over union (IoU), and F1-score (F1) were used. The OA was used to assess the global accuracy of the extraction results. The IoU is the ratio of the intersection set of the extracted results and the truth samples and their union set, and F1 is the geometric mean of precision and recall. The expressions are listed below.
In the expressions, TP is the true value, FP is the false value, FN is the false negative value, recall is the ratio of the correct pixel to the true value, and precision is the proportion of correct pixels in the prediction result.
In order to reveal the accuracy of different networks, our method was compared with DenseNet, DeeplabV3+, and BiseNet. The accuracy assessment results are described below. The assessment results of the GF-7 image show that our method achieves 95.29% in OA, 83.92% in F1, and 72.30% in IoU, all of which are higher values than those of BiseNet, DeeplabV3+, and DenseNet. In order to create a comparison, the GF-2 multispectral fused image was used for building extraction with the same network. The GF-2 image’s OA is 96.73%, its F1 is 86.17%, and its IoU is 75.71%. Although high accuracy can be observed in the building extraction experiment from GF-7, better results are still achieved in the extraction results for the GF-2 image since the network was originally trained with the latter data source. Detailed results can be seen in Table 2.
3.4. Results of Building Modeling
3.4.1. DSM Generation Results
GF-7 DLC images are used to generate the DSM for the study area. The forward image and backward image are processed to create left and right epipolar images. The DSM is then generated via the SGM method. In our experiment, the GF-7 images cover a 20 km × 20 km area, including the metropolitan area, which comprises residential, industrial, and suburban areas. As can be observed in Figure 11, the DSM represents the features of the terrain and surface of the study area well. Notably, the buildings, roads, bridges, canals, and other ground objects with certain heights are clearly shown via the highlight of their high pixel values in the DSM. A highlighted area with a very high value in a large area toward the southeast region of the study area is the lake because the reflectance of both the calm or glittering water surface may affect optical images in the visible range of spectral bands, as well as the forward and backward images of GF-7. As a result, the registration of GCPs in this area of water is mistaken, and false elevation information has occurred. In this case, post-processing is needed following DSM generation.
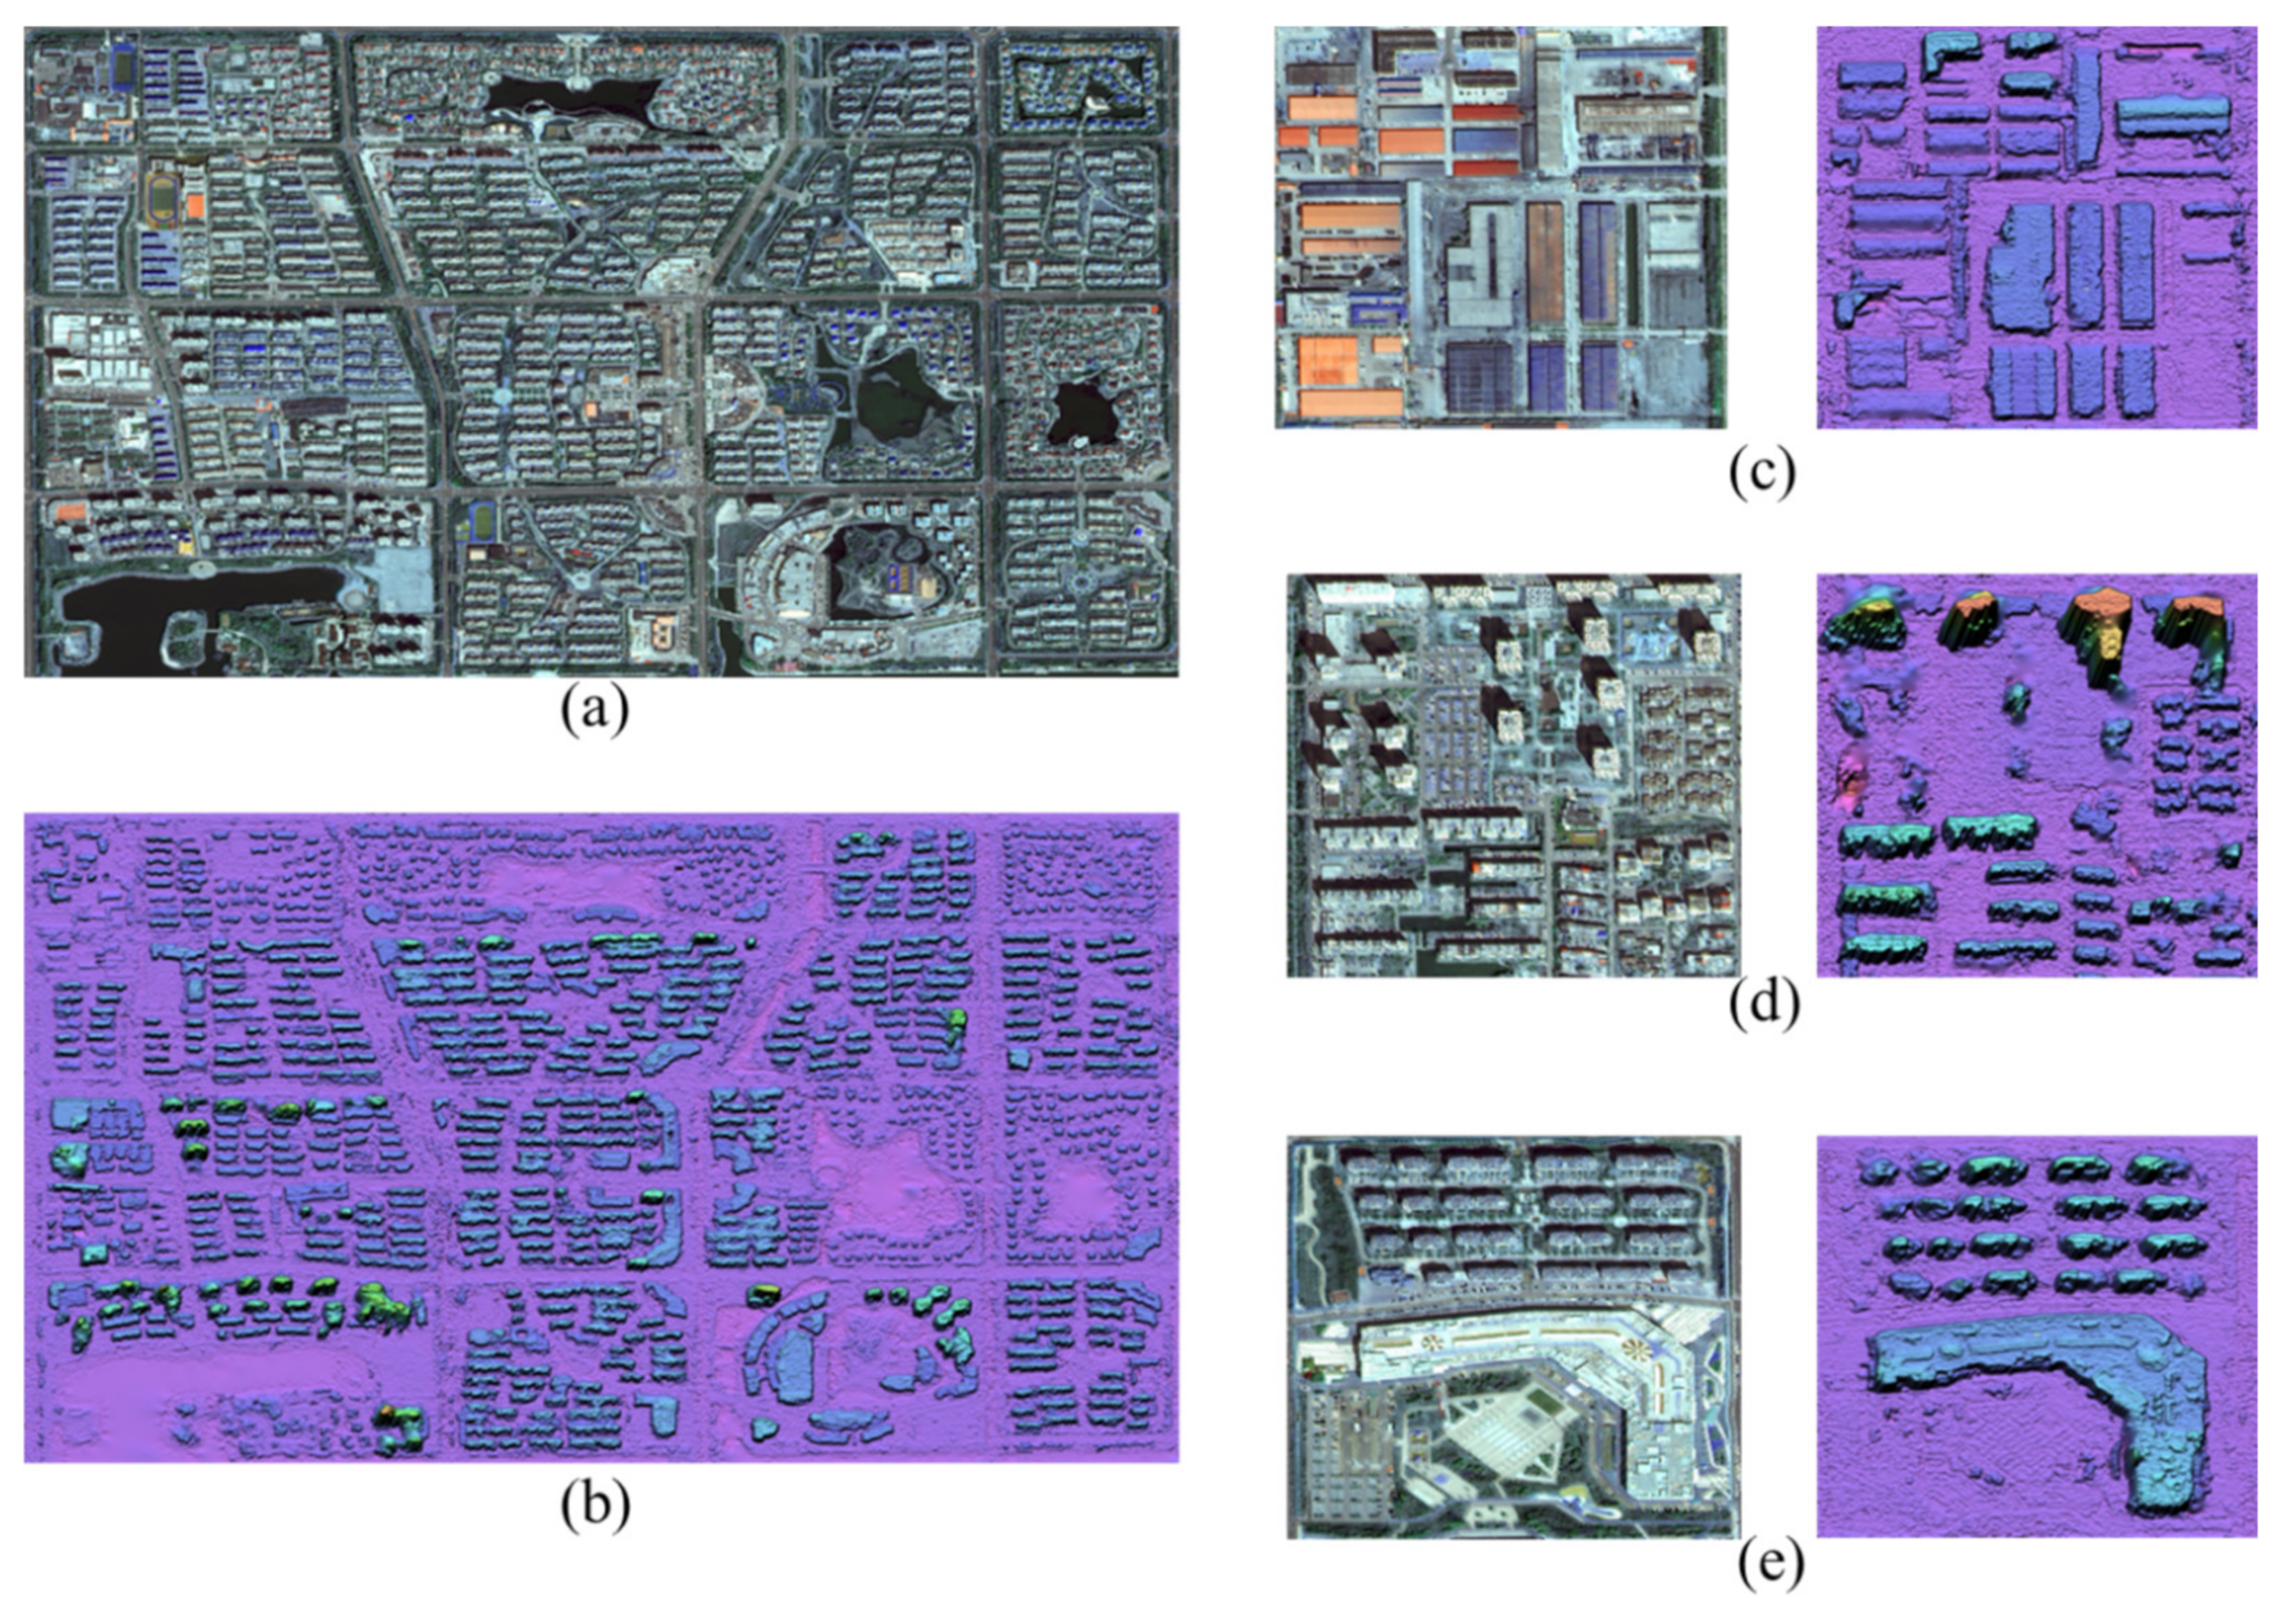
In Figure 12, we can compare the multispectral image with the combination of RGB (Figure 12a) and the generated DSM (Figure 12b). It can be clearly observed that most of the buildings represent accurate boundaries, and the elevation information is very close to our interpretation. The low-rise and mid-rise buildings, single house, and workshop building can be clearly interpreted in the DSM, all of which have approximate elevation ranges from 10 to 80 m. Buildings with large areas, such as workshop buildings, are clearly shown in the DSM in terms of both shape and height (Figure 12c). In the residential estate, the low-rise and mid-rise buildings present good shapes (Figure 12d). However, for some high-rise buildings with elevations above 80 m, errors occur in the DSM; in particular, the upper part of the building presents distortion. Some of the mid-rise and high-rise buildings with a small area and rectangular shape are lost in our interpretation of the DSM. For large-area buildings, we can observe that the DSM also provides accurate geometric conditions, and some parts of the buildings’ roofs are identified through visual interpretation (Figure 12e). The results are available for 1:10,000 topographic mapping in surveying and mapping applications.
In general, the DSM performs well in depicting the study area. The elevation information provided in the DSM can facilitate the modeling of buildings in the urban scene.
3.4.2. LOD1 Building Model
In order to achieve good quality building boundaries, some post-processing should be conducted before modeling the buildings. Small fragments of the building are removed according to the threshold of the area. In our study, the building fragments with an area smaller than 100 m2 are removed. The boundary of the building is smoothed to render the building shape closer to the requirements of the surveying and mapping standard.
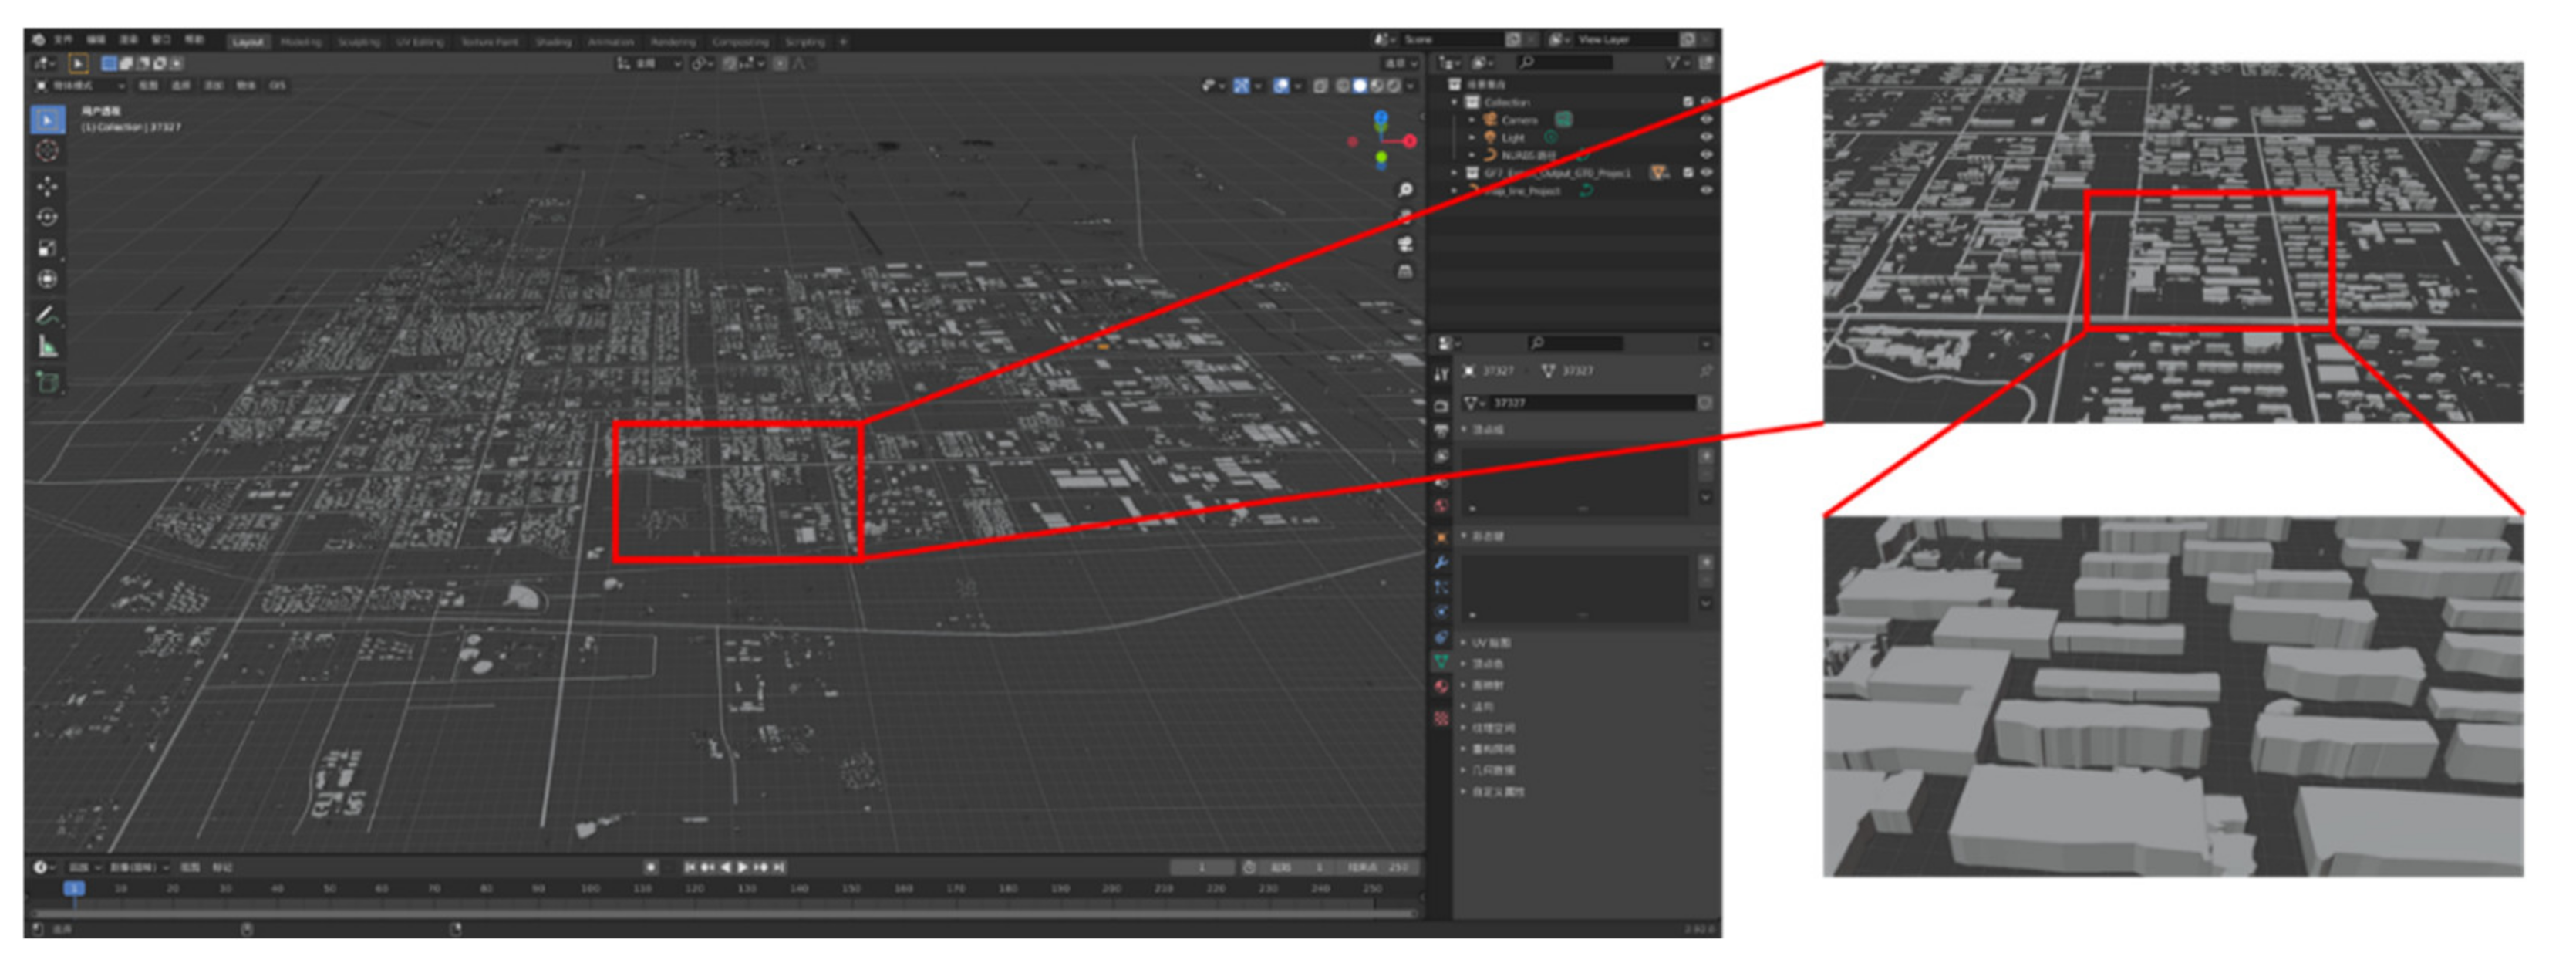
Based on the building vector polygon, which has the attribute of height information, through the software Blender, the building model can be established. The building polygon provides the shape and boundary of the building at the panel dimension, and the height attribute is determined to be the height of the building in the software. With the shape and height information of the building combined, the building is stretched on the stereo dimension. The white model of the buildings is generated without textural information on their facades. Although there is no texture on the buildings, the rough white models of the buildings cover a large area that can still represent the urban scene. In addition to the DSM and DOM data derived from GF-7, the FBX 3D model is quite similar to the actual urban area. As shown in Figure 13, the building has a rough 3D model without texture, but the shape and volume appear to be fairly close to those of the real building. It can be suggested that the bounding volume completely represents the geometric characteristics of the building, meaning that the building model is applicable for use in urban virtual mapping, urban planning and can be a platform for urban big data integration. During this stage, the building model fulfills the requirements of the LOD 1 standard of CityGML applications.
3.4.3. Urban Scene Visualization with Unreal Engine 4
The urban scene 3D model, in the form of FBX, is imported into the UE4 editor together with the DSM and multispectral fused image, which all transform into a uasset file format and a level is created in the UE4 editor.
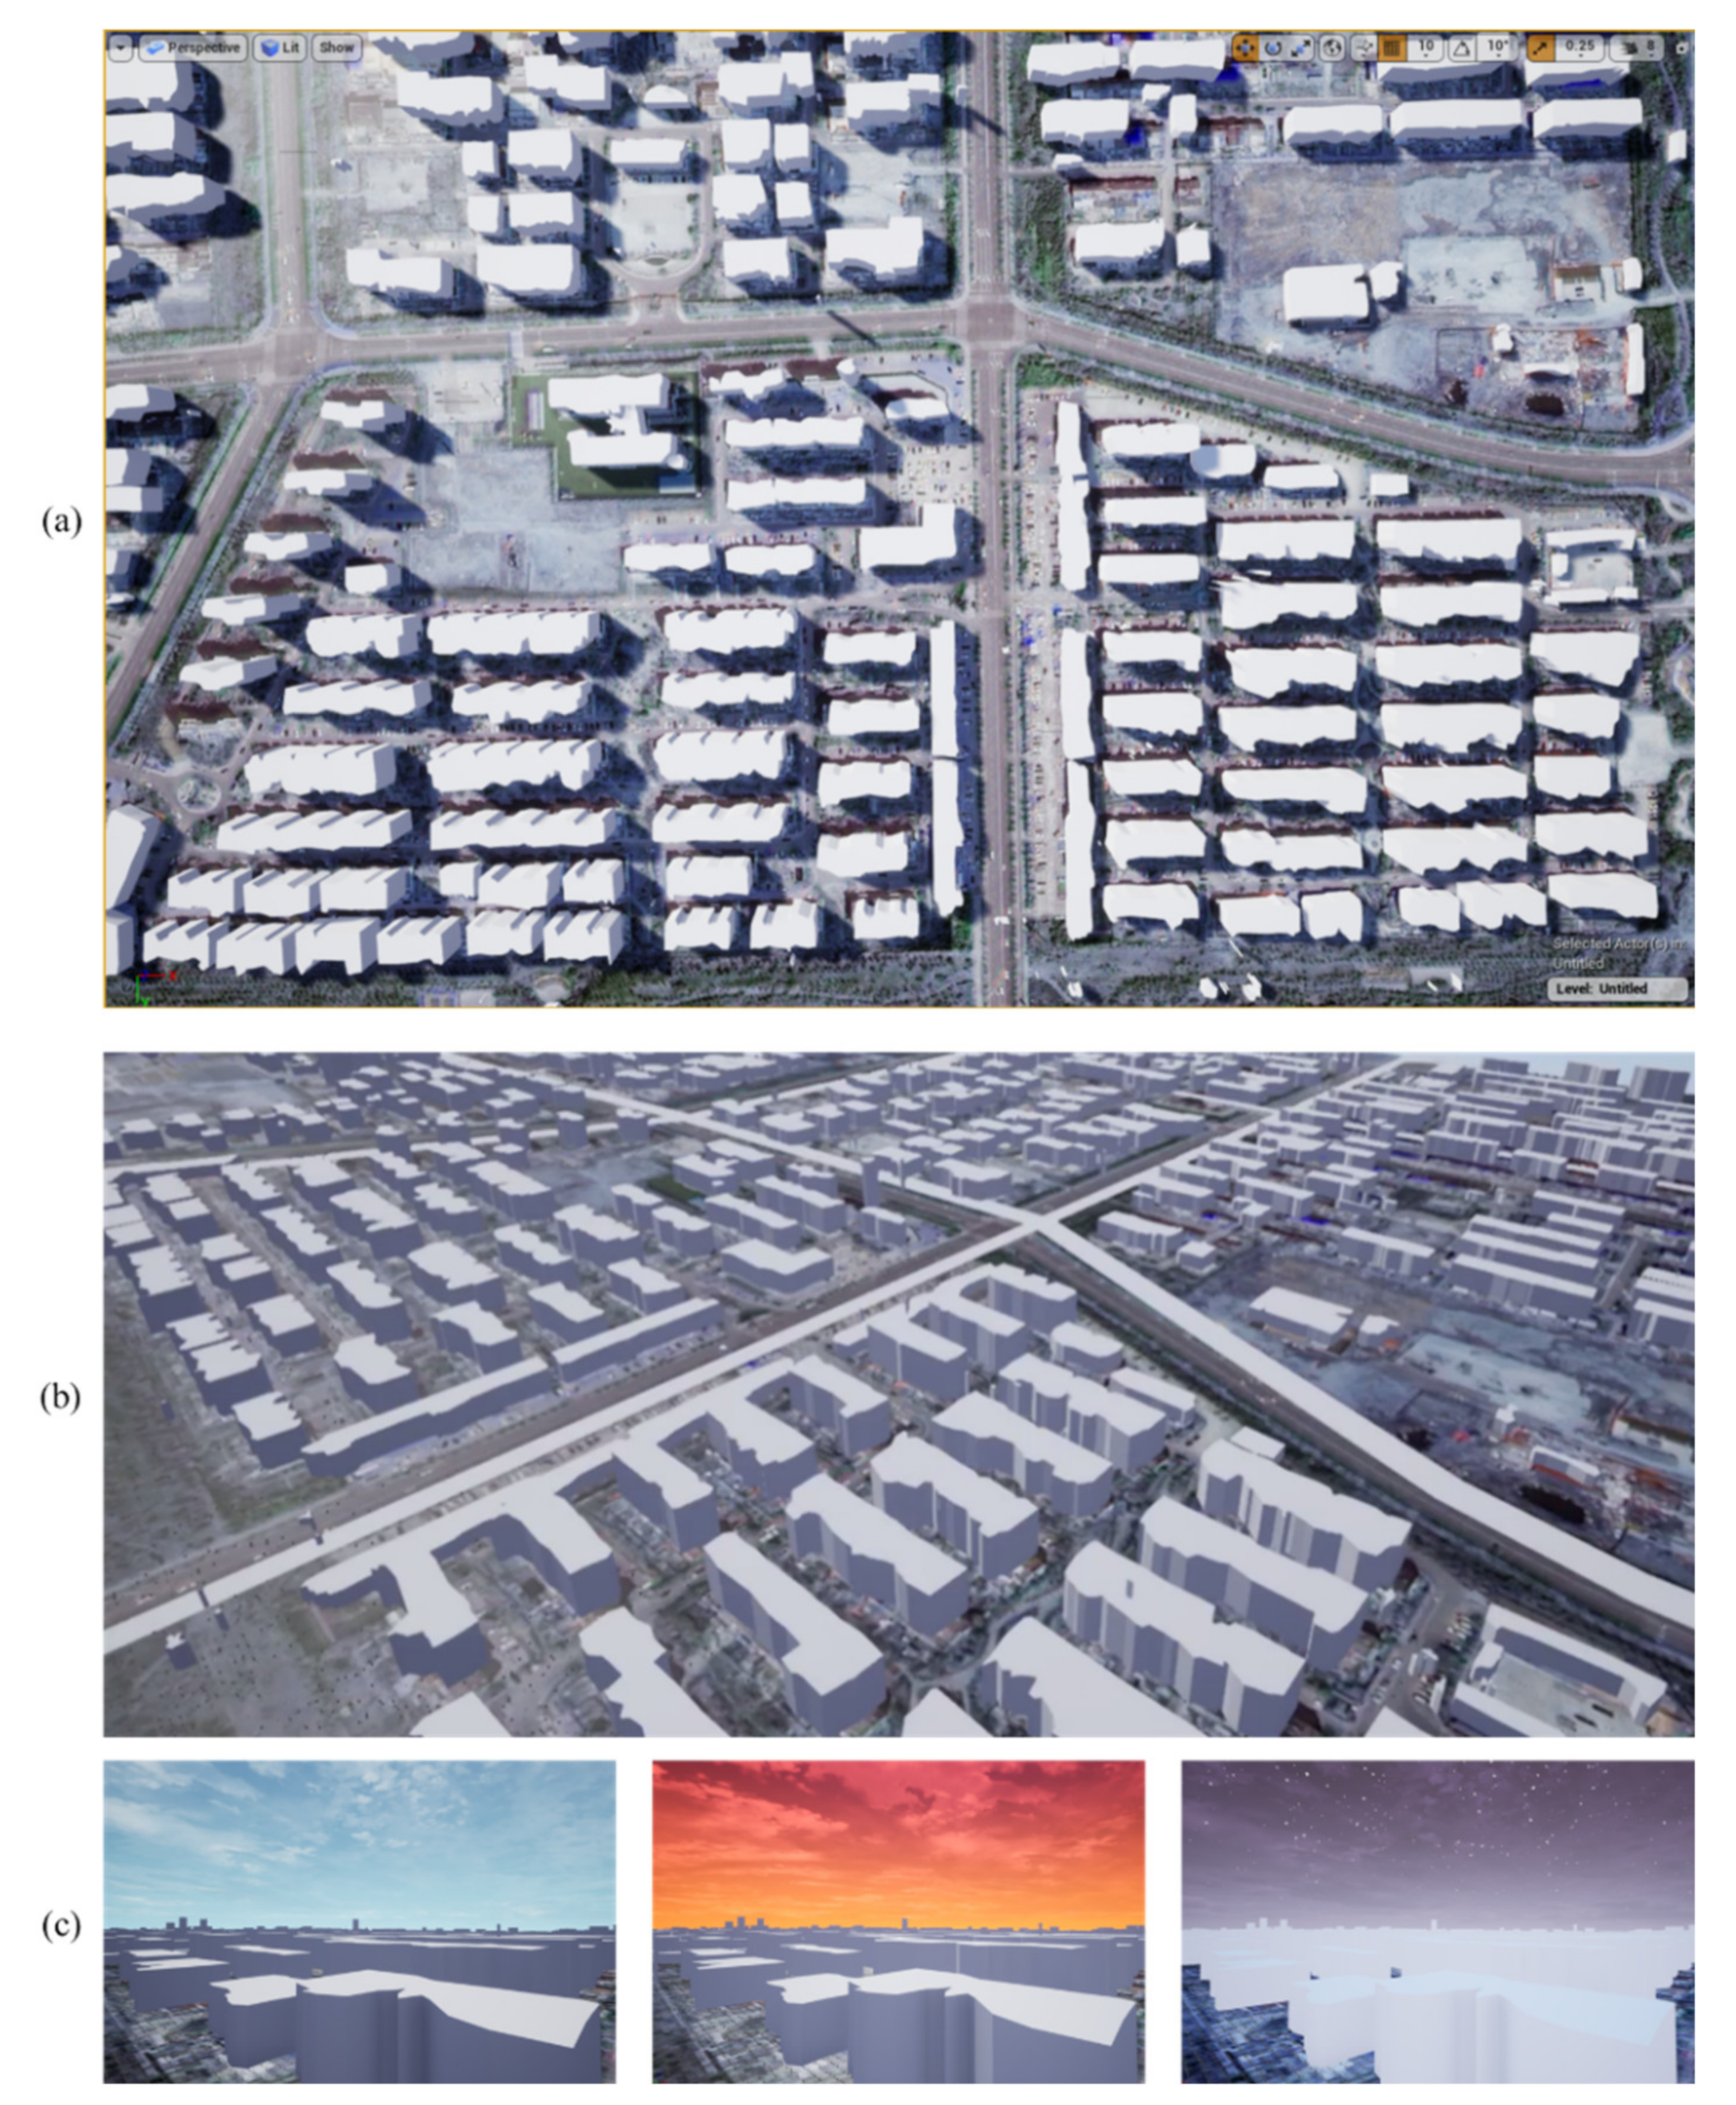
In this level, effects including the rendering of the building and environment can be set up, as shown in Figure 14. Basic environmental elements are used from the library; for example, a skysphere is added to the scene’s background as a sky containing different kinds of clouds. Sunlight shines on the whole scene because directional light simulates sunlight, whose intensity, color, and shadow projections are created with a considerable number of parameters. The directional light generates a shadow of the building; thus, in Figure 14, we can see that at any given distance, the building’s shadow is apparent and quite similar to the situation in reality. The rendering and environment effects are uniquely characteristic of game engines, which set them apart from traditional 3D GIS engines. For example, we can simulate different times of day in the scene, including sunrise, daytime, dusk, night, and different types of weather, such as clear skies, overcast, rain, and fog. Moreover, the simulation of a building’s shadow angle from sunlight at a certain time of day in different seasons can be realized, and the game engine runs these complex renderings and effects smoothly, thereby maintaining high performance during the interaction between the user and computer. Thus, high fidelity, high performance, and free interaction render the game engine powerful in urban visualization applications. Moreover, with the help of stereo mapping satellite images, the large scale of the urban area for one city can be modeled accurately and efficiently. For example, in our study, GF-7 images provide the 3D urban scene data at approximately 20 km × 20 km at a time. The large coverage and high geometric accuracy for such large batches of urban building models can support urban visualization in a high-performance 3D engine and take full advantage of the 3D engine’s powerful rendering ability.
4. Discussion
This study presents a building modeling approach using GF-7 high-resolution images and a MFFN model for building extraction and LOD1 model generation using the building vector and DSM. The building extraction’s accuracy is good, and with our proposed method, the urban scene in the 3D model can be generated effectively and efficiently. Furthermore, we discuss the advantages and disadvantages of the study results in building extraction and modeling.
4.1. Building Extraction Using MFFN
In this study, building extraction was conducted using our proposed networks with good quality and performance. The results show high accuracy and can satisfy the requirements of panel boundary for building modeling. The network that contains the modules of the dense block, ASPP, and feature fusion can effectively improve the extraction of buildings, including the small and diverse buildings in particular.
The convolution network in this study is trained using samples of GF-2 images due to the limited availability of GF-7 images. To our surprise, the generalization of this network is suitable for GF-7 images, as a high OA value of 95.29% can be seen in the results, which is lower than the accuracy of GF-2 results (96.73%). Our study demonstrated that building extraction via GF-2 and GF-7 achieves significantly better results than those of some popular networks, such as BiseNet, DeeplabV3+, and DenseNet; this is because the dense block setup in the network can retain a considerable number of details for the high-resolution feature map, which is especially suitable for buildings with complex boundaries in the image. Moreover, the ASPP module extracts multiple-scale information for feature maps, benefiting the distinction between buildings and other ground objects. With the help of the feature fusion module, these feature maps can be combined effectively.
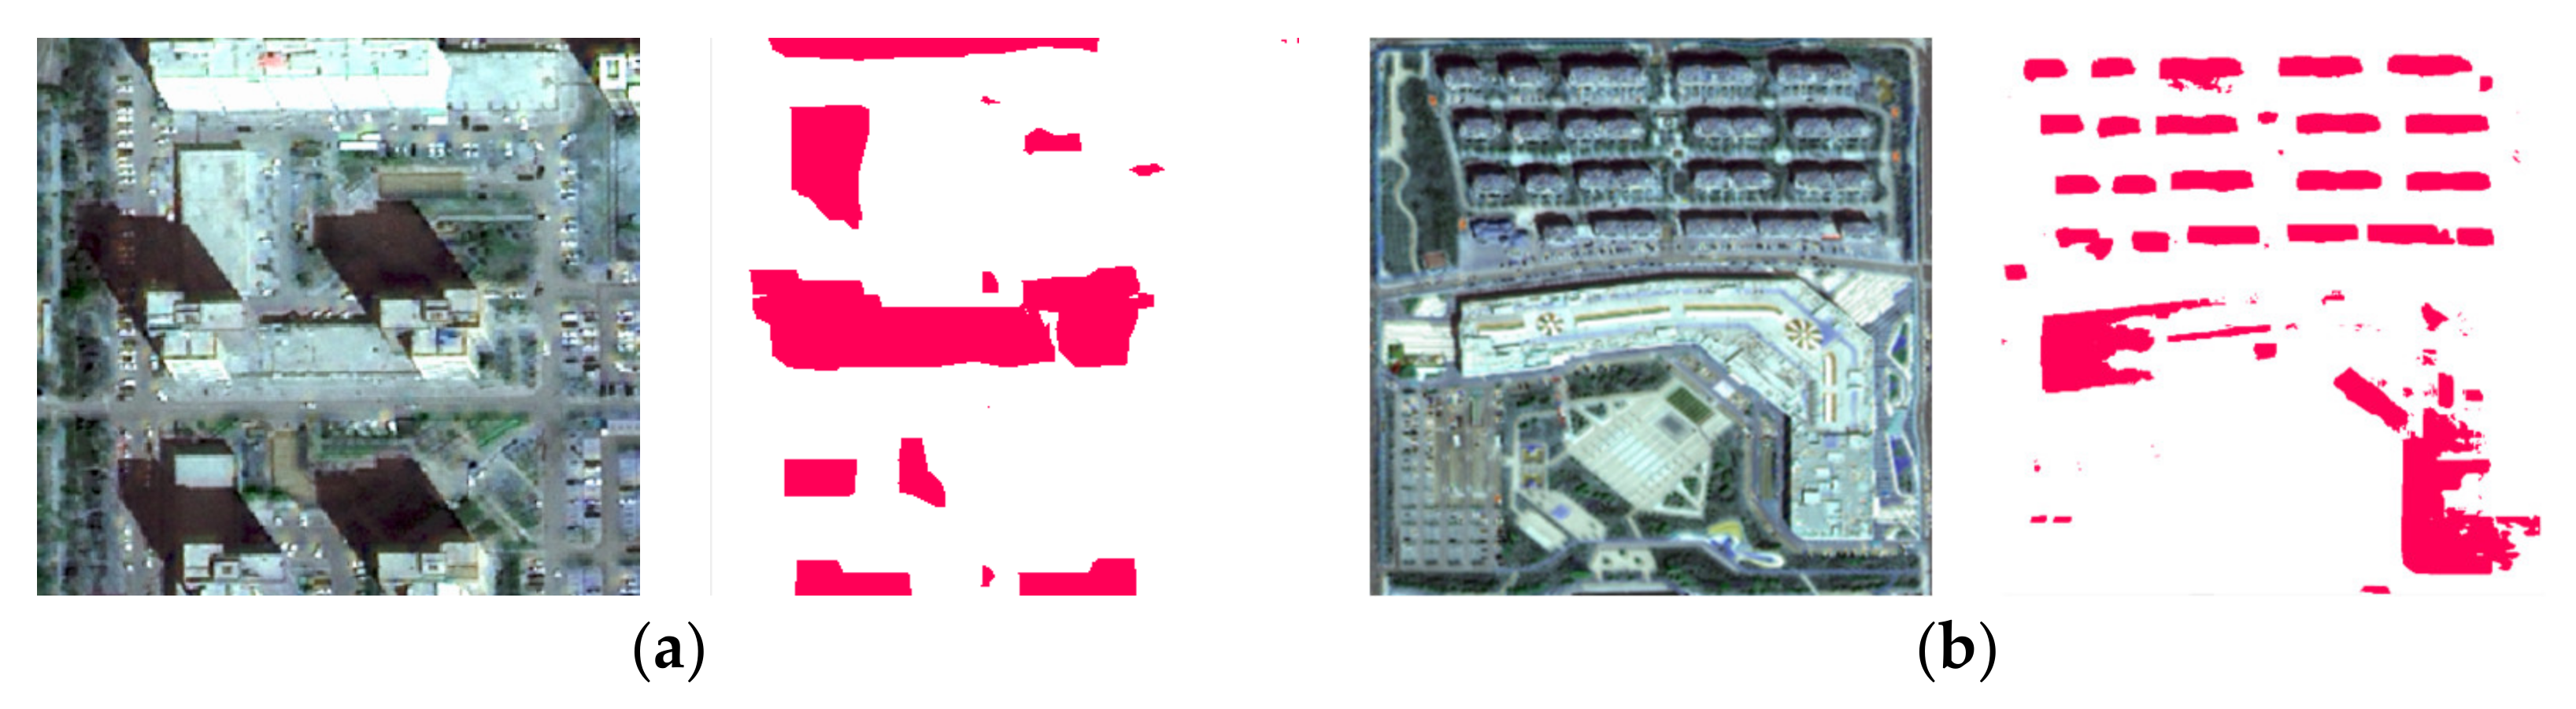
However, our study is not without limitations. Firstly, the current method cannot extract buildings built above another building or ground structure, as shown in Figure 15a, and this results in the loss of such buildings in the subsequent modeling. Secondly, our network has some limitations in extracting buildings with large areas, such as the podium building, and some long, rectangular buildings with large areas, as shown in Figure 15b. Thirdly, some buildings cannot be extracted completely due to their actual shape. Losses may occur at the boundary, and still, some small fragments exist in the extraction results, which should be removed during post-processing.
In future work, we expect to achieve improved performance of the building extraction network with a sufficient number of image samples for GF-7. Additionally, the building samples can be further classified into different sub-classes, e.g., a high-rise building, mid-rise building, low-rise building, single building, workshop building, and other building types. In this case, a sub-classification can provide more details on different building models with a material library for 3D building models, including different kinds of material and textures of certain building types. For example, once we extract the workshop building class from the image, the model example of the workshop building is stored in our material library and can be placed into the corresponding building polygon and modeled in 3D with the height information derived from the DSM. Therefore, the urban scene can be more abundant and realistic than only white models of the building.
4.2. Building Modeling and Urban Scene Rendering
The building model can be efficiently generated through the DLC images, and the height information accurately obtained. However, some disadvantages were observed in the experiment. Firstly, tall buildings with a height above 80 m may result in some errors in the elevation calculation. As a result, some tall buildings cannot generate correct boundaries, and information loss subsequently occurs in the modeling process. Other approaches of DSM generation will be examined in future works. Secondly, building modeling remains at the LOD1 level. The volume information in the upper part of the building cannot be shaped and modeled. There are two reasons for this: one is the hilly phenomenon that exists for the building in the DSM, which renders it difficult to draw the accurate shape of the upper part of the building. Thirdly, the average value of the elevation within the building boundary was used as the building height, which is a method that cannot be applied to buildings with a complex upper portion.
In a future study, other methods will be explored to obtain a better volume for building bodies, especially for the upper part of tall buildings and those with attached buildings, which are quite common in megacities. Moreover, the regularization method for buildings’ boundaries should be developed and used to provide improved boundaries for building modeling in the panel dimension. Once the limitations, mainly modeling the upper part of buildings and the further shaping of the buildings’ outer boundaries, can be solved, building modeling with further detail may be available using the high resolution and good geometric accuracy of GF-7 images,. With these potential results, as well as the material library mentioned above, buildings in a large urban area can be generated in LOD2, and a more realistic and vivid urban scene is expected to be achieved using 3D engines such as UE4. As such, spatial platforms with a large area for digital twin cities can be effectively and efficiently supported by the high-resolution stereo mapping satellite.
5. Conclusions
This study presents an approach for building modeling with GF-7 DLC and MUX images using the MFFN for building boundary extraction and generating the white building model with the help of the DSM. Finally, urban scene visualization is realized via UE4.
The proposed network, which contains the modules of a dense block, ASPP, and feature fusion, can perform well in building extraction from GF-7 fused multispectral images, especially in small and diverse buildings. With the ability of stereo mapping, GF-7 DLC images provide a 1 m resolution DSM which assigns height information for the 3D modeling of a building. Moreover, Blender and UE4 software were used to generate the urban scene level with the white building model in LOD1. This study demonstrates a method and workflow that uses only high-resolution stereo mapping satellite images to complete urban modeling efficiently and effectively; thus, this method can be a reference for other similar data sources and applications.
Although there were limitations due to errors in tall and large rectangular building extraction and loss of information in the modeling of buildings with a complex upper part, using high-resolution stereo mapping satellite images to generate 3D urban scene remains a useful and economical method of urban modeling.
In summary, this study not only attempts to realize a convolution network suitable for GF-7 image in building extraction but also tries to complete 3D building modeling based on extraction results and GF-7 stereo images. These methods reveal the potential of GF-7 images in urban applications and provide a reference for modeling solutions in the spatial platform construction of twin cities, smart cities, and digital earth applications.
Author Contributions
Conceptualization, H.L. and L.X.; data curation, W.W., B.X., Y.W. and L.X.; formal analysis, X.K.; Funding acquisition, R.G.; Methodology, H.L., B.H. and W.W.; supervision, R.G.; visualization, B.H.; Writing–original draft, H.L.; writing–review and editing, D.M. All authors are being informed about each step of manuscript processing including submission, revision, revision reminder, etc. via emails from our system or the assigned Assistant Editor. All authors have read and agreed to the published version of the manuscript.
Funding
This research was funded by the National Natural Science Foundation of China, grant number 42001331; the National Natural Science Foundation of China, grant number 41971354; the National Key Research and Development Program of China, grant number 2019YFB2103104; the Guangdong Science and Technology Strategic Innovation Fund (the Guangdong–Hong Kong-Macau Joint Laboratory Program), grant number 2020B1212030009; the Open Fund of Key Laboratory of Urban Land Resource Monitoring and Simulation, Ministry of Land and Resource under grant KF-2018-03-031; the High-Resolution Remote Sensing Surveying Application Demonstration System of the Land Satellite Remote Sensing Application Center (LASAC), and the Ministry of Natural Resources of the People’s Republic of China (MNR), grant number 42-Y30B04-9001-19/21; the Guangxi Innovative Development Grand Program, grant number GuikeAA18118038.
Acknowledgments
We would like to acknowledge the help of the Land Satellite Remote Sensing Application Center (LASAC) and the Ministry of Natural Resources of the People’s Republic of China (MNR) for providing the GF-7 DLC and MUX images.
Conflicts of Interest
The authors declare no conflict of interest.
References
- Batty, M. Digital twins. Environ. Plan. B Urban Anal. City Sci. 2018, 45, 817–820. [Google Scholar] [CrossRef]
- Dembski, F.; Wössner, U.; Letzgus, M.; Ruddat, M.; Yamu, C. Urban Digital Twins for Smart Cities and Citizens: The Case Study of Herrenberg, Germany. Sustainability 2020, 12, 2307. [Google Scholar] [CrossRef] [Green Version]
- Dowman, I. Automatic feature extraction for urban landscape models. Adding value to Remotely Sensed Data. In Proceedings of the 26th Annual Conference of the Remote Sensing Society, Leicester, UK, 12–14 September 2000. [Google Scholar]
- Sohn, G.; Dowman, I. Data fusion of high-resolution satellite imagery and LiDAR data for automatic building extraction. ISPRS J. Photogramm. Remote Sens. 2007, 62, 43–63. [Google Scholar] [CrossRef]
- Xinming, T.A.; Junfeng, X.I.; Fan, M.O.; Xianhui, D.O.; Xin, L.I.; Shaoning, L.I.; Song, L.I.; Genghua, H.U.; Xingke, F.U.; Ren, L.I.; et al. GF-7 dual-beam laser altimeter on-orbit geometric calibration and test verification. Acta Geod. Cartogr. Sin. 2021, 50, 384–395. [Google Scholar]
- Shahrabi, B. Automatic Recognition and 3D Reconstruction of Buildings through Computer Vision and Digital Photogrammetry. Ph.D. Thesis, University of Stuttgart, Stuttgart, Germany, 2002. [Google Scholar]
- Haala, N.; Kada, M. An update on automatic 3D building reconstruction. ISPRS J. Photogramm. Remote Sens. 2010, 65, 570–580. [Google Scholar] [CrossRef]
- Grigillo, D.; Fras, M.K.; Petrovic, D. Automated building extraction from IKONOS images in suburban areas. Int. J. Remote Sens. 2012, 33, 5149–5170. [Google Scholar] [CrossRef]
- Lee, D.S.; Shan, J.; Bethel, J.S. Class-Guided Building Extraction from Ikonos Imagery. Photogramm. Eng. Remote Sens. 2003, 69, 143–150. [Google Scholar] [CrossRef] [Green Version]
- Bruzzone, L.; Prieto, D. Automatic analysis of the difference image for unsupervised change detection. IEEE Trans. Geosci. Remote Sens. 2000, 38, 1171–1182. [Google Scholar] [CrossRef] [Green Version]
- Mountrakis, G.; Im, J.; Ogole, C. Support vector machines in remote sensing: A review. ISPRS J. Photogramm. Remote Sens. 2011, 66, 247–259. [Google Scholar] [CrossRef]
- Friedl, M.; Brodley, C. Decision tree classification of land cover from remotely sensed data. Remote Sens. Environ. 1997, 61, 399–409. [Google Scholar] [CrossRef]
- Pal, M. Random forest classifier for remote sensing classification. Int. J. Remote Sens. 2005, 26, 217–222. [Google Scholar] [CrossRef]
- Lek, S.; Guégan, J.-F. Artificial neural networks as a tool in ecological modelling, an introduction. Ecol. Model. 1999, 120, 65–73. [Google Scholar] [CrossRef]
- Zhang, L.P.; Zhang, L.F.; Du, B. Deep Learning for Remote Sensing Data A technical tutorial on the state of the art. IEEE Geosci. Remote Sens. Mag. 2016, 4, 22–40. [Google Scholar] [CrossRef]
- Mnih, V. Machine Learning for Aerial Image Labeling; University of Toronto: Toronto, ON, Canada, 2013. [Google Scholar]
- Alshehhi, R.; Marpu, P.R.; Woon, W.L.; Dalla Mura, M. Simultaneous extraction of roads and buildings in remote sensing imagery with convolutional neural networks. ISPRS J. Photogramm. Remote Sens. 2017, 130, 139–149. [Google Scholar] [CrossRef]
- Fu, G.; Liu, C.; Zhou, R.; Sun, T.; Zhang, Q. Classification for High Resolution Remote Sensing Imagery Using a Fully Convolutional Network. Remote Sens. 2017, 9, 498. [Google Scholar] [CrossRef] [Green Version]
- Liu, T.; Abd-Elrahman, A.; Morton, J.; Wilhelm, V.L. Comparing fully convolutional networks, random forest, support vector machine, and patch-based deep convolutional neural networks for object-based wetland mapping using images from small unmanned aircraft system. GIScience Remote Sens. 2018, 55, 243–264. [Google Scholar] [CrossRef]
- Yi, Y.; Zhang, Z.; Zhang, W.; Zhang, C.; Li, W.; Zhao, T. Semantic Segmentation of Urban Buildings from VHR Remote Sensing Imagery Using a Deep Convolutional Neural Network. Remote Sens. 2019, 11, 1774. [Google Scholar] [CrossRef] [Green Version]
- Huang, Z.; Cheng, G.; Wang, H.; Li, H.; Shi, L.; Pan, C. Building extraction from multi-source remote sensing images via deep deconvolution neural networks. In Proceedings of the 2016 IEEE International Geoscience and Remote Sensing Symposium (IGARSS), Beijing, China, 10–15 July 2016; pp. 1835–1838. [Google Scholar]
- Feng, W.; Sui, H.; Hua, L.; Xu, C. Improved Deep Fully Convolutional Network with Superpixel-Based Conditional Random Fields for Building Extraction. In Proceedings of the IGARSS 2019—2019 IEEE International Geoscience and Remote Sensing Symposium, Yokohama, Japan, 28 July–2 August 2019; pp. 52–55. [Google Scholar]
- Liu, P.; Liu, X.; Liu, M.; Shi, Q.; Yang, J.; Xu, X.; Zhang, Y. Building Footprint Extraction from High-Resolution Images via Spatial Residual Inception Convolutional Neural Network. Remote Sens. 2019, 11, 830. [Google Scholar] [CrossRef] [Green Version]
- Shengjun, X. Building segmentation in remote sensing image based on multiscale-feature fusion dilated convolution resnet. Opt. Precis. Eng. 2020, 28, 1588–1599. [Google Scholar]
- Sun, K.; Xiao, B.; Liu, D.; Wang, J. Deep high-resolution representation learning for human pose estimation. In Proceedings of the IEEE Computer Society Conference on Computer Vision and Pattern Recognition, Long Beach, CA, USA, 16–20 June 2019; pp. 5686–5696. [Google Scholar]
- Huang, J.; Zheng, Z.; Huang, G. Multi-Stage HRNet: Multiple Stage High-Resolution Network for Human Pose Estimation. arXiv 2019, arXiv:1910.05901. [Google Scholar]
- Yang, H.; Wu, P.; Yao, X.; Wu, Y.; Wang, B.; Xu, Y. Building Extraction in Very High Resolution Imagery by Dense-Attention Networks. Remote Sens. 2018, 10, 1768. [Google Scholar] [CrossRef] [Green Version]
- Thomson, C.; Boehm, J. Automatic Geometry Generation from Point Clouds for BIM. Remote Sens. 2015, 7, 11753–11775. [Google Scholar] [CrossRef] [Green Version]
- Sohn, G.; Dowman, I. Terrain surface reconstruction by the use of tetrahedron model with the MDL criterion. International Archives of the Photogrammetry. Remote Sens. Spat. Inf. Sci. 2002, 34, 336–344. [Google Scholar]
- Haala, N.; Peter, M.; Kremer, J.; Hunter, G. Mobile LIDAR Mapping for 3D Point Cloud Collection in Urban Areas-A Performance Test. In Proceedings of the XXI ISPRS Congress, Beijing, China, 3–11 July 2008. [Google Scholar]
- Xiong, X.; Adan, A.; Akinci, B.; Huber, D. Automatic creation of semantically rich 3D building models from laser scanner data. Autom. Constr. 2013, 31, 325–337. [Google Scholar] [CrossRef] [Green Version]
- Shiramizu, K.; Doi, K.; Aoyama, Y. Generation of a high-accuracy regional DEM based on ALOS/PRISM imagery of East Antarctica. Polar Sci. 2017, 14, 30–38. [Google Scholar] [CrossRef]
- Li, L.; Luo, H.; Zhu, H. Estimation of the Image Interpretability of ZY-3 Sensor Corrected Panchromatic Nadir Data. Remote Sens. 2014, 6, 4409–4429. [Google Scholar] [CrossRef] [Green Version]
- Tang, X.M.; Zhang, G.; Zhu, X.Y.; Pan, H.B.; Jiang, Y.H.; Zhou, P.; Wang, X.; Guo, L. Triple Linear-array Image Geometry Model of ZiYuan-3 Surveying Satellite and Its Validation. Acta Geod. Cartogr. Sin. 2012, 41, 191–198. [Google Scholar] [CrossRef]
- Maxar. Optical Imagery. Available online: https://resources.maxar.com/optical-imagery (accessed on 18 June 2021).
- Yang, J.K.; Wang, C.J.; Sun, L.; Zhu, Y.H.; Huang, Y. Design Critical Technology of Two-line Array Camera for GF-7 Satellite. Spacecr. Eng. 2020, 29, 61–67. [Google Scholar]
- Chen, L.C.; Zhu, Y.; Papandreou, G.; Schroff, F.; Adam, H. Encoder-Decoder with Atrous Separable Convolution for Semantic Image Segmentation. In Proceedings of the European Conference on Computer Vision (ECCV), Munich, Germany, 8–14 September 2018. [Google Scholar]
- Wang, C.; Zhu, Y.; Yu, S.; Yin, Y. Design and Implementation of the Dual Line Array Camera for GF-7 Satellite. Spacecr. Recovery Remote Sens. 2020, 41, 29–38. [Google Scholar]
- Heiko, H. Stereo processing by semiglobal matching and mutual information. IEEE Trans. Pattern Anal. Mach. Intell. 2008, 2, 328–341. [Google Scholar]
Figure 1.
Workflow of urban scene modeling.

Figure 2.
Network structure.

Figure 3.
Dense block with three convolutional layers.

Figure 4.
Atrous spatial pyramid pooling. (a) Multi-scale convolution, (b) global average pooling.

Figure 5.
Three types of feature fusion methods. (a) Diagram of the high-resolution feature map retaining the same number of channels as the low-resolution feature map as the high-resolution feature map via convolution. (b) Diagram of the low-resolution feature map using convolution to downsample the high-resolution feature map to the same size as the low-resolution feature map. (c) Diagram of the moderate-resolution feature map by upsampling and interpolating the low-resolution feature map.


Figure 6.
Importing the building model, DSM, and DOM data into the UE4 editor.

Figure 7.
GF-7 DLC and MUX images used for the experiment: (a) forward image, (b) backward image, and (c) multispectral image.
Figure 7.
GF-7 DLC and MUX images used for the experiment: (a) forward image, (b) backward image, and (c) multispectral image.

Figure 8.
Building samples from GF-2 multispectral fused images for network training.

Figure 9.
Building extraction results. Above: fused multispectral image; below: extraction result.

Figure 10.
Building extraction results: (a) buildings in the residential estate, (b,c) mid-rise and high-rise buildings, (d) larger buildings.
Figure 10.
Building extraction results: (a) buildings in the residential estate, (b,c) mid-rise and high-rise buildings, (d) larger buildings.

Figure 11.
GF-7 fused multispectral image and DSM. (a) Fused multispectral image with a resolution of 0.8 m, (b) DSM with the resolution of 0.8 m derived from DLC images.
Figure 11.
GF-7 fused multispectral image and DSM. (a) Fused multispectral image with a resolution of 0.8 m, (b) DSM with the resolution of 0.8 m derived from DLC images.

Figure 12.
Effect of GF-7 DSM. (a) Clip of fused multispectral image; (b) clip of DSM; (c–e) clips of views from different types of buildings.
Figure 12.
Effect of GF-7 DSM. (a) Clip of fused multispectral image; (b) clip of DSM; (c–e) clips of views from different types of buildings.

Figure 13.
Generation of a building from the polygon of GF-7 building extraction results and DSM data.
Figure 13.
Generation of a building from the polygon of GF-7 building extraction results and DSM data.

Figure 14.
Effects of the urban scene level in UE4. (a) Ortho-angle of part of the scene; (b) side view of the scene; (c) different environmental effects in the scene, including daytime, dusk, and night.
Figure 14.
Effects of the urban scene level in UE4. (a) Ortho-angle of part of the scene; (b) side view of the scene; (c) different environmental effects in the scene, including daytime, dusk, and night.

Figure 15.
Some false results in building extraction. (a) Mistaken segmentation in the podium, (b) division of a large, rectangular building.
Figure 15.
Some false results in building extraction. (a) Mistaken segmentation in the podium, (b) division of a large, rectangular building.


Table 1.
Specifications of the GF-7 satellite.
| Specification | Value |
|---|---|
| Orbit height | 506 km |
| Orbit inclination | 97.421° |
| Descending node time | 10:30 a.m. |
| Revisit cycle | 60 days |
| Mission Duration | 8 years |
| Swath width | 20 km at nadir |
| Radiometric resolution | 12 bit |
| Panchromatic GSD | 0.65 m at backward (+26°) |
| 0.80 m at forward (−5°) | |
| Panchromatic band | 450 nm to 900 nm |
| Multispectral GSD | 2.6 m at backward |
| Multispectral band | Band 1 (Blue): 450 nm to 520 nm |
| Band 2 (Green): 520 nm to 590 nm | |
| Band 3 (Red): 630 nm to 690 nm | |
| Band 4 (Near-infrared red): 770 nm to 890 nm |
Table 2.
Accuracy assessment of the different methods.
| Image | Network | OA | F1 | IoU |
|---|---|---|---|---|
| GF-7 | BiseNet | 55.26% | 35.63% | 21.68% |
| DeeplabV3+ | 16.05% | 25.43% | 14.57% | |
| DenseNet | 93.37% | 75.09% | 60.11% | |
| Our Method | 95.29% | 83.92% | 72.30% | |
| GF-2 | BiseNet | 60.57% | 45.59% | 29.53% |
| DeeplabV3+ | 89.18% | 64.01% | 32.12% | |
| DenseNet | 87.33% | 50.78% | 34.03% | |
| Our Method | 96.73% | 86.17% | 75.71% |
Publisher’s Note: MDPI stays neutral with regard to jurisdictional claims in published maps and institutional affiliations. |
© 2021 by the authors. Licensee MDPI, Basel, Switzerland. This article is an open access article distributed under the terms and conditions of the Creative Commons Attribution (CC BY) license (https://creativecommons.org/licenses/by/4.0/).
Share and Cite
MDPI and ACS Style
Luo, H.; He, B.; Guo, R.; Wang, W.; Kuai, X.; Xia, B.; Wan, Y.; Ma, D.; Xie, L. Urban Building Extraction and Modeling Using GF-7 DLC and MUX Images. Remote Sens. 2021, 13, 3414. https://0-doi-org.brum.beds.ac.uk/10.3390/rs13173414
AMA Style
Luo H, He B, Guo R, Wang W, Kuai X, Xia B, Wan Y, Ma D, Xie L. Urban Building Extraction and Modeling Using GF-7 DLC and MUX Images. Remote Sensing. 2021; 13(17):3414. https://0-doi-org.brum.beds.ac.uk/10.3390/rs13173414
Chicago/Turabian StyleLuo, Heng, Biao He, Renzhong Guo, Weixi Wang, Xi Kuai, Bilu Xia, Yuan Wan, Ding Ma, and Linfu Xie. 2021. "Urban Building Extraction and Modeling Using GF-7 DLC and MUX Images" Remote Sensing 13, no. 17: 3414. https://0-doi-org.brum.beds.ac.uk/10.3390/rs13173414
Note that from the first issue of 2016, this journal uses article numbers instead of page numbers. See further details here.