Technical Note

Land Degradation and Development Processes and Their Response to Climate Change and Human Activity in China from 1982 to 2015

1
Northwest Institute of Eco-Environment and Resources, CAS, Lanzhou 730000, China
2
School of Environmental Sciences, University of Guelph, 50 Stone Road East, Guelph, ON N1G 2W1, Canada
*
Author to whom correspondence should be addressed.
Remote Sens. 2021, 13(17), 3516; https://0-doi-org.brum.beds.ac.uk/10.3390/rs13173516
Submission received: 26 July 2021 / Revised: 26 August 2021 / Accepted: 31 August 2021 / Published: 4 September 2021
(This article belongs to the Special Issue Remote Sensing for Land Degradation and Drought Monitoring)

Abstract

:
Land degradation and development (LDD) has become an urgent global issue. Quick and accurate monitoring of LDD dynamics is key to the sustainability of land resources. By integrating normalized difference vegetation index (NDVI) and net primary productivity (NPP) based on the Euclidean distance method, a LDD index (LDDI) was introduced to detect LDD processes, and to explore its quantitative relationship with climate change and human activity in China from 1985 to 2015. Overall, China has experienced significant land development, about 45% of China’s mainland, during the study period. Climate change (temperature and precipitation) played limited roles in the affected LDD, while human activity was the dominant driving force. Specifically, LDD caused by human activity accounted for about 58% of the total, while LDD caused by climate change only accounted for 0.34% of the total area. Results from the present study can provide insight into LDD processes and their driving factors and promote land sustainability in China and around the world.

Graphical Abstract

1. Introduction

Land degradation is defined as a persistent decline in terrestrial ecosystem productivity during a period and it is characterized by vegetation degradation, water loss, soil erosion and desertification [1]. It has profoundly affected the ecosystem and human well-being and induced a series of environmental and social problems, including carbon emissions, climate change, biodiversity loss, sandstorms and food and water security [2,3,4]. Land development represents land improvement and is characterized by vegetation restoration, terrestrial ecosystem productivity and vegetation cover growth. It is beneficial to natural environment protection and socioeconomic development [5]. The world is facing the issue of land degradation and development (LDD) and it has attracted strong attention from concerned individuals and the scientific community [6].
Quick and accurate monitoring of LDD dynamics is key to ensure the sustainability of land resources. The development of remote sensing (RS) technology provides an important resource for monitoring the spatiotemporal dynamics of LDD processes and plays a vital role in the mitigation of land degradation, especially at large scales (e.g., national scale, continent scale, and global scale) [4,7]. Remotely sensed vegetation indices have been widely applied to reflect LDD processes in previous studies. One of the most common indices is normalized difference vegetation index (NDVI) [6]. NDVI reflects the vegetation conditions of terrestrial ecosystems based on the normalized difference between red and near-infrared red (NIR) radiation of healthy vegetation. However, there are two main flaws when using NDVI to represent the biomass and production of terrestrial ecosystems [8]. First, the relationships between NDVI, biomass and productivity are not linear, and may become saturated in high vegetation cover areas. In addition, NDVI reflects the greenness instead of the photosynthesis of vegetation. This means that NDVI may not be very sensitive to a substantial increase or decline in vegetation, and therefore does not necessarily reflect the actual biomass and productivity dynamics in particular regions [8]. These issues result in the uncertainty of NDVI in evaluating the dynamics of LDD.
To improve the reliability of NDVI in monitoring LDD processes, some studies have attempted to construct a new index by integrating NDVI with transformation parameters. For instance, multiplying NDVI by NIR, Badgley et al. [9] proposed the NIRv and Camps-Valls et al. [8] built a kernel NDVI (kNDVI) using the theory of kernel methods based on machine learning. Both new indices showed higher correlations with gross primary productivity (GPP) and sun-induced chlorophyll fluorescence (SIF) than the original NDVI at specific temporal scales [8,9]. However, the abovementioned new indices may not be suitable at the large regional scale and over longer period because the calculation process is complex and time-consuming. Therefore, the question remains whether we can create a more convenient and simpler index to quickly and accurately monitor LDD processes at wide spatiotemporal scales. NPP (net primary productivity), as an important remotely sensed parameter, can accurately reflect ecosystem productivity and biomass, and has been individually used to explore LDD processes at different spatiotemporal scales [10]. Theoretically, NDVI can reveal LDD processes if it is integrated with NPP. However, no previous research has attempted this.
In this study, we introduced a LDD index (LDDI) by integrating NDVI and NPP based on the Euclidean distance method to detect the LDD processes in China from 1985 to 2015 and explored its relationship to climate change and human activities. This study can offer quick and accurate monitoring of LDD at large spatiotemporal scales and provide a deeper understanding of LDD processes and their driving mechanisms and eventually contribute to land use sustainability in China and other countries around the world.

2. Materials and Methods
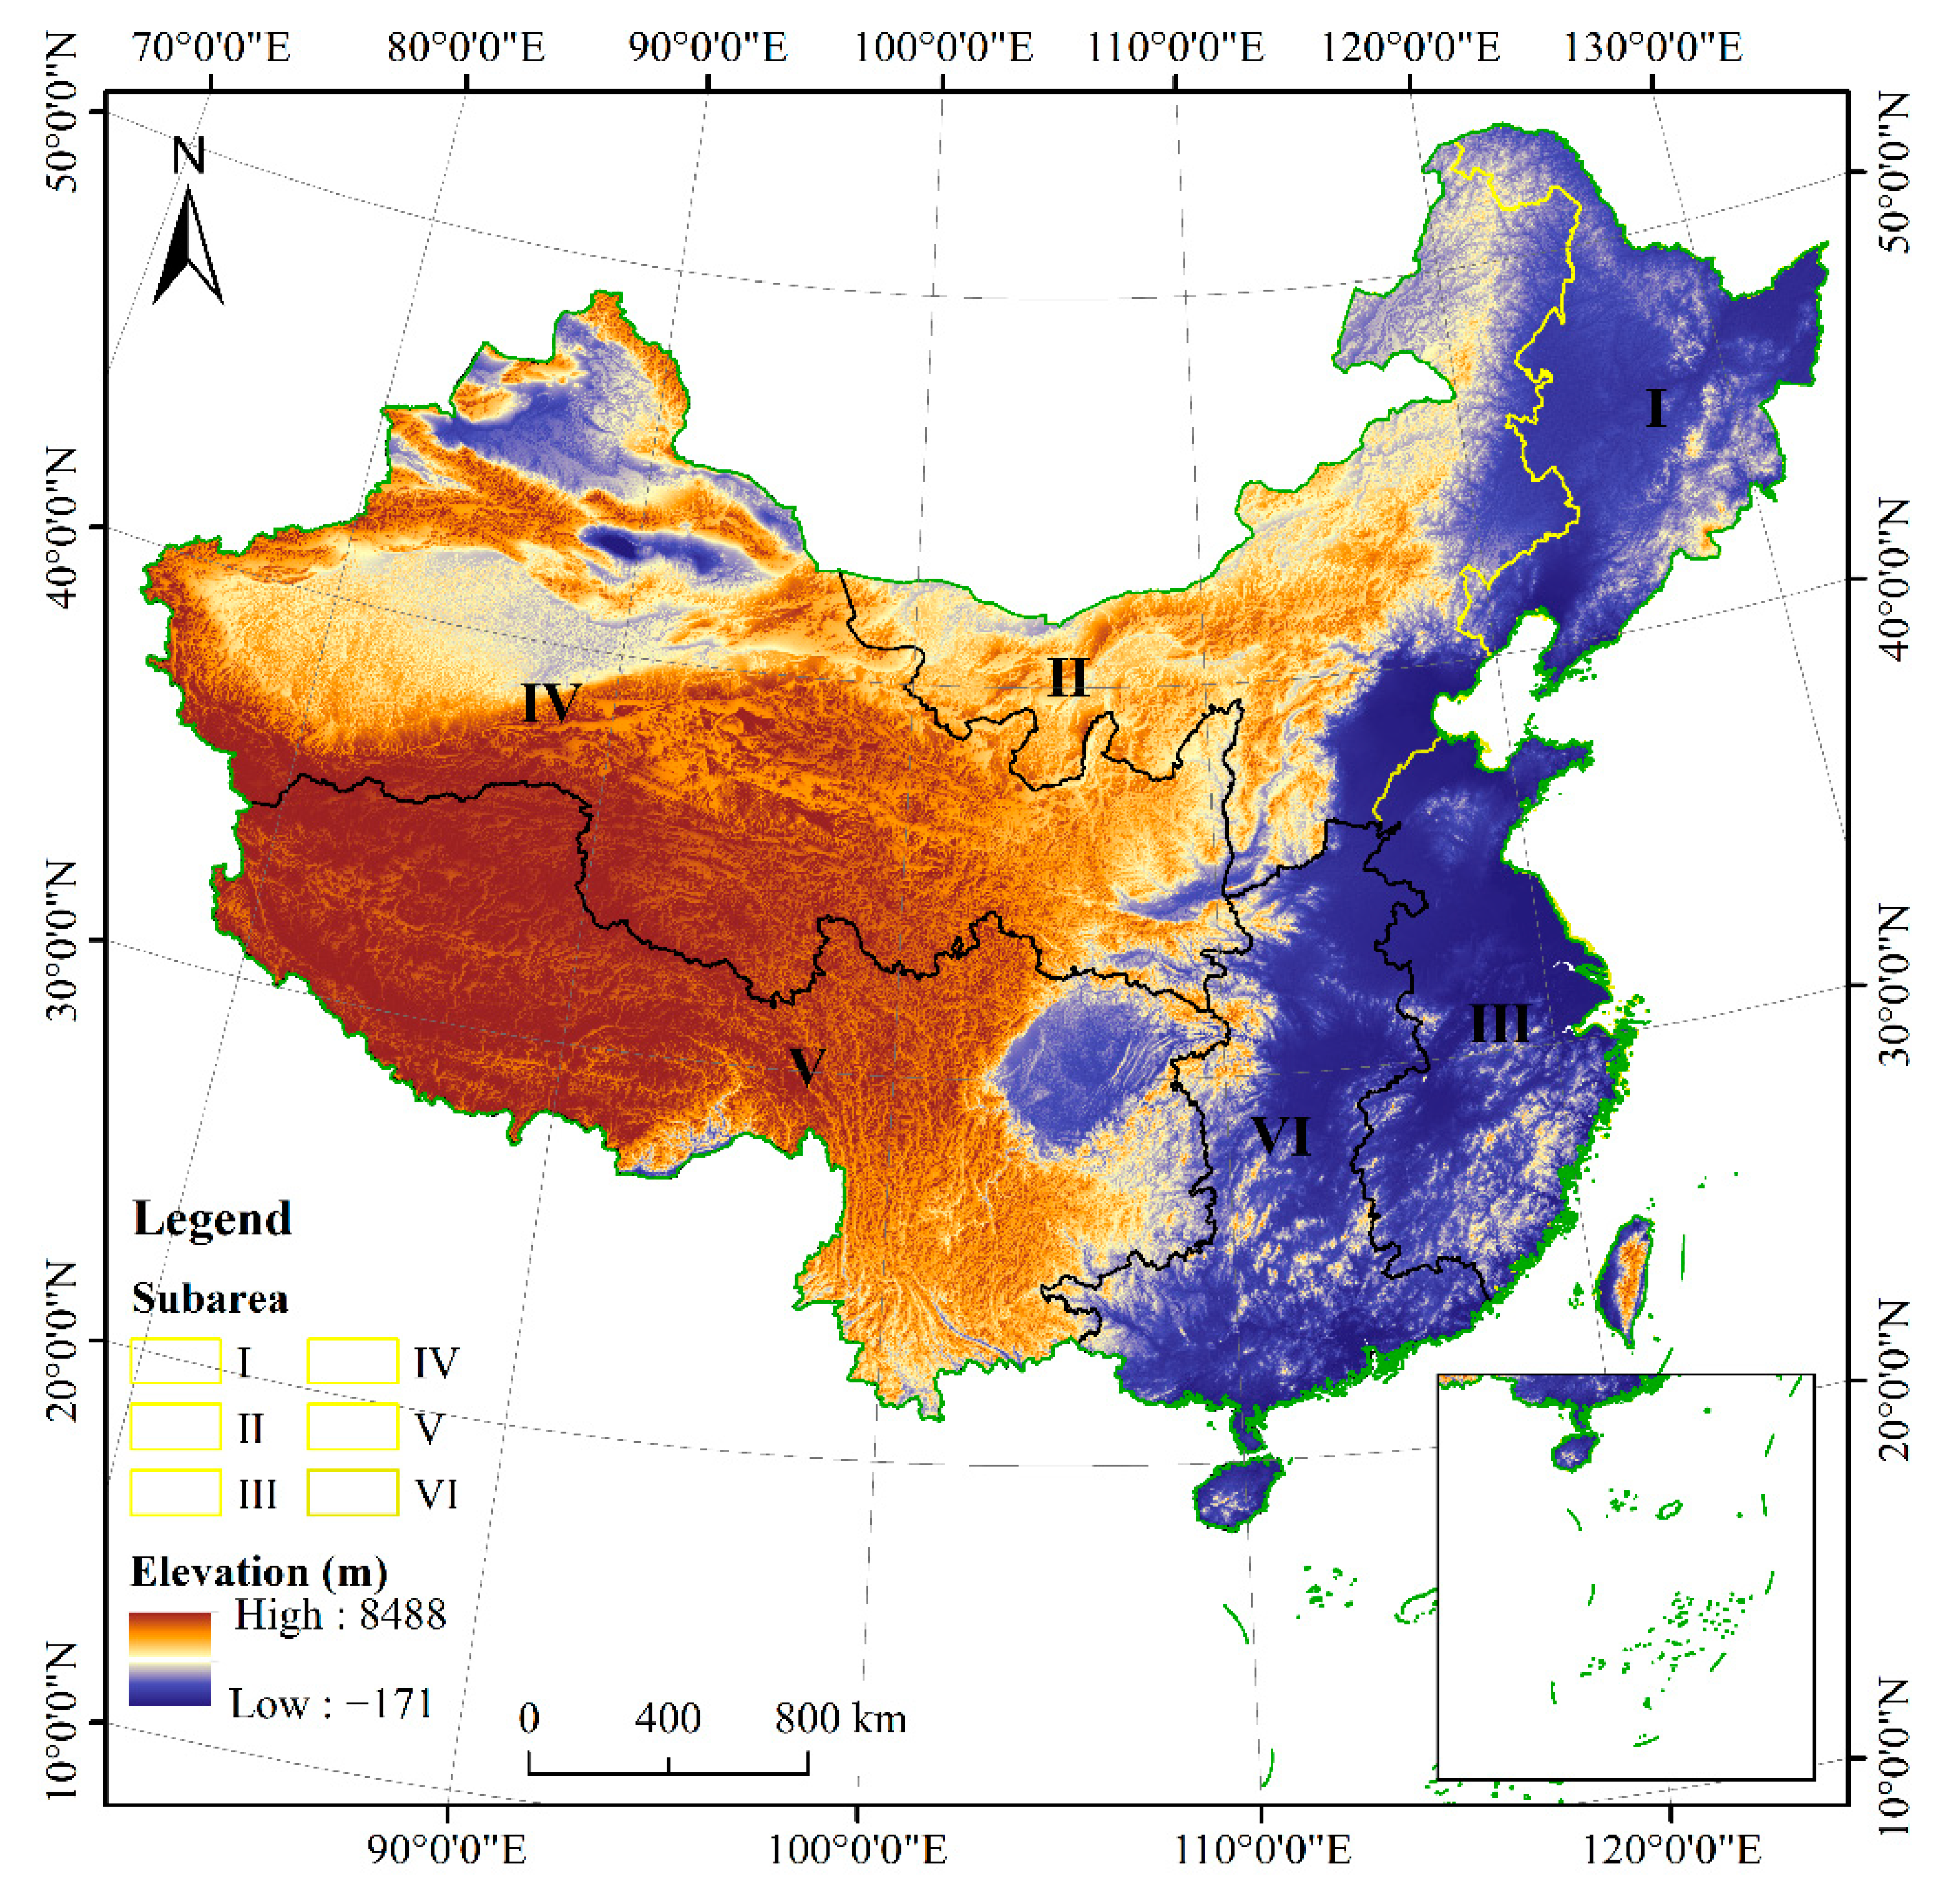
2.1. Study Area

China is located in eastern Asia to the west of the Pacific Ocean. It covers an area of about 9.6 million km2 and has a population of approximately 1.39 billion [11]. The topography of China is high in the west and low in the east, with altitudes ranging from about 171 m to 8488 m above the mean seal level. Generally, China can be divided into 6 subareas with different natural and socioeconomic environments, including north China (NC), northeast China (NEC), northwest China (NWC), east China (EC), central south China (CSC) and southwest China (SWC) (Figure 1). There are four main climate types: Subtropical monsoon climate (covering the EC, CSC and eastern part of SWC), temperate monsoon climate (including the NC and NEC), temperate continental climate (NWC) as well as the plateau climate (including the western part of SEC and southern part of NWC) [12]. Socioeconomic development also varies in different subareas.
Due to tremendous economic growth and rapidly expanding urban development, as well as over cultivation and grazing behaviors, China has undergone great land degradation over the past few decades [13,14]. Since the 1970’s, large-scale ecological projects have been launched in China by the central government with the aim of preventing water loss and soil erosion and ensuring sustainable development (e.g., the Three-North Forest Shelterbelts Program launched in 1979 and the Grain for Green Program implemented in 1999) [15,16,17]. These programs protected ecosystems’ stability and productivity, and therefore mitigated land degradation in some regions to a certain extent.

2.2. Data Acquisition and Processing

The NDVI data used in this study were derived from the GIMMS-NDVI 3g.v1 time series dataset, which was based on an advanced very high-resolution radiometer (AVHRR) and currently ranges from 1981 to 2015 with a spatial resolution of 8 km and temporal resolution of 15 days [18]. Using MATLAB software, the semi-monthly original data were first transformed to monthly data by calculating the maximum value in each pixel and then the monthly maximum data were transformed to yearly data by calculating the mean value of 12 months in a year.
NPP data were acquired from the global annual summed GPP/NPP dataset generated by the revised EC-LUE model, which covers a period from 1980 to 2018 with a spatial resolution of 0.05° [19,20].
The annual mean temperature (MAT) and precipitation (MAP) were derived from the dataset of 1 km monthly mean temperature and precipitation dataset for China (1901–2017) (https://data.tpdc.ac.cn/zh-hans/) (accessed on 22 May 2021). The dataset was spatially downscaled from CRU TS v4.02 with WorldClim datasets based on the delta downscaling method. The dataset was evaluated by 496 national weather stations across China, and the evaluation indicated that the downscaled dataset is reliable for investigations related to climate change across China [21].
All of these data were resampled to a spatial resolution of 10 km with the Albers_WGS_1984 coordinate system using ArcGIS 10.5 software.

2.3. Method

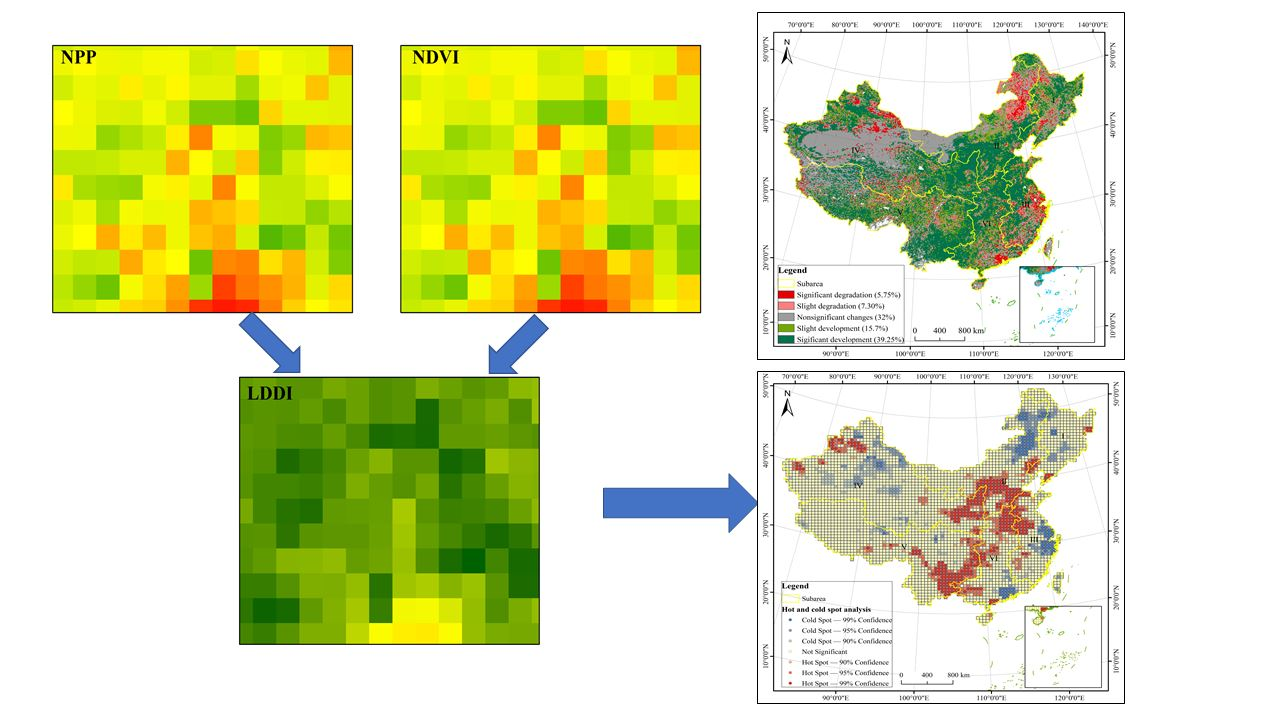
2.3.1. Building of Land Degradation and Development Index (LDDI)

LDDI was built based on the Euclidean distance method [22], which has been widely used in environmental and ecological research, such as dryness monitoring [11]. In 2D space, the Euclidean distance model can be written as follows:
ρ = ( x 2 x 1 ) 2 + ( y 2 y 1 ) 2
where ρ represents the Euclidean distance between points ( x 1 ,   y 1 ) and ( x 2 ,   y 2 ) .
In this study, we measured LDDI using NDVI and NPP. Before building the LDDI, we normalized the NDVI and NPP to values ranging from 0 to 1 by using the following two equations:
NNDVI = NDVI NDVI min NDVI max NNDVI min
NNPP = NPP NPP min NPP max NPP min
where NNDVI and NNPP represent the normalized NDVI and NPP; NDVI max NPP max NNDVI min   and NPP min represent the maximum NDVI, maximum NPP, minimum NDVI and minimum NPP.
Then, based on the Euclidean distance method, we defined LDDI as the distance to the points with minimum NDVI and minimum NPP. Longer distances represent higher LDDI values. Specifically, Equation (1) can be written as:
LDDI = ( NNDVI NNDVI min ) 2 + ( NNPP NNPP min ) 2
where NNDVI min and NNPP min   represent the minimum NNDVI and minimum NNPP, respectively. Because the value of NNDVI min and NNPP min is 0, LDDI can be simplified as:
LDDI = ( NNDVI ) 2 + ( NNPP ) 2

2.3.2. The Sen-MK Method

The Sen-MK method was used to analyze the change trend of LDDI. The Sen-MK method integrates a Theil–Sen median trend analysis with a Mann–Kendall test, which had been widely used in previous studies to evaluate and test the change trend of time series data [23].
The Theil–Sen Median trend analysis is a robust statistical trend based on calculation median slopes of time series data [24]. The equation can be written as follows:
Sen _ slope = median ( x j x i j i ) ,   j > i
where Sen _ slope is the change trend of time series data; x j and x i represents the values of times series data of year j and i, respectively.
The Mann–Kendall test is a non-parametric statistical test and is generally used to test the significance of changes in the trend of time series data, which can be written as [25]:
the   statistic   of   Z = { S 1 Var ( S ) ,     S > 0 0 ,                           S = 0 S + 1 Var ( S ) ,     S < 0  
where S is the test statistic and Var(S) is the variance of statistic S and can be written as:
S = i = 1 n 1 i = i + 1 n sgn ( x j x i )
where x j and x i represent the values of time series of year j and i, respectively; sgn is sign function:
sgn ( x j x i ) = { 1 ,                     x j x i > 0 0 ,                     x j x i = 0 1 ,                 x j x i < 0
Based on the slope value of the Theil–Sen median trend and the statistic of Z of the Mann–Kendall test, the LDD processes in China during the study period was classified into five types (Table 1) [23].

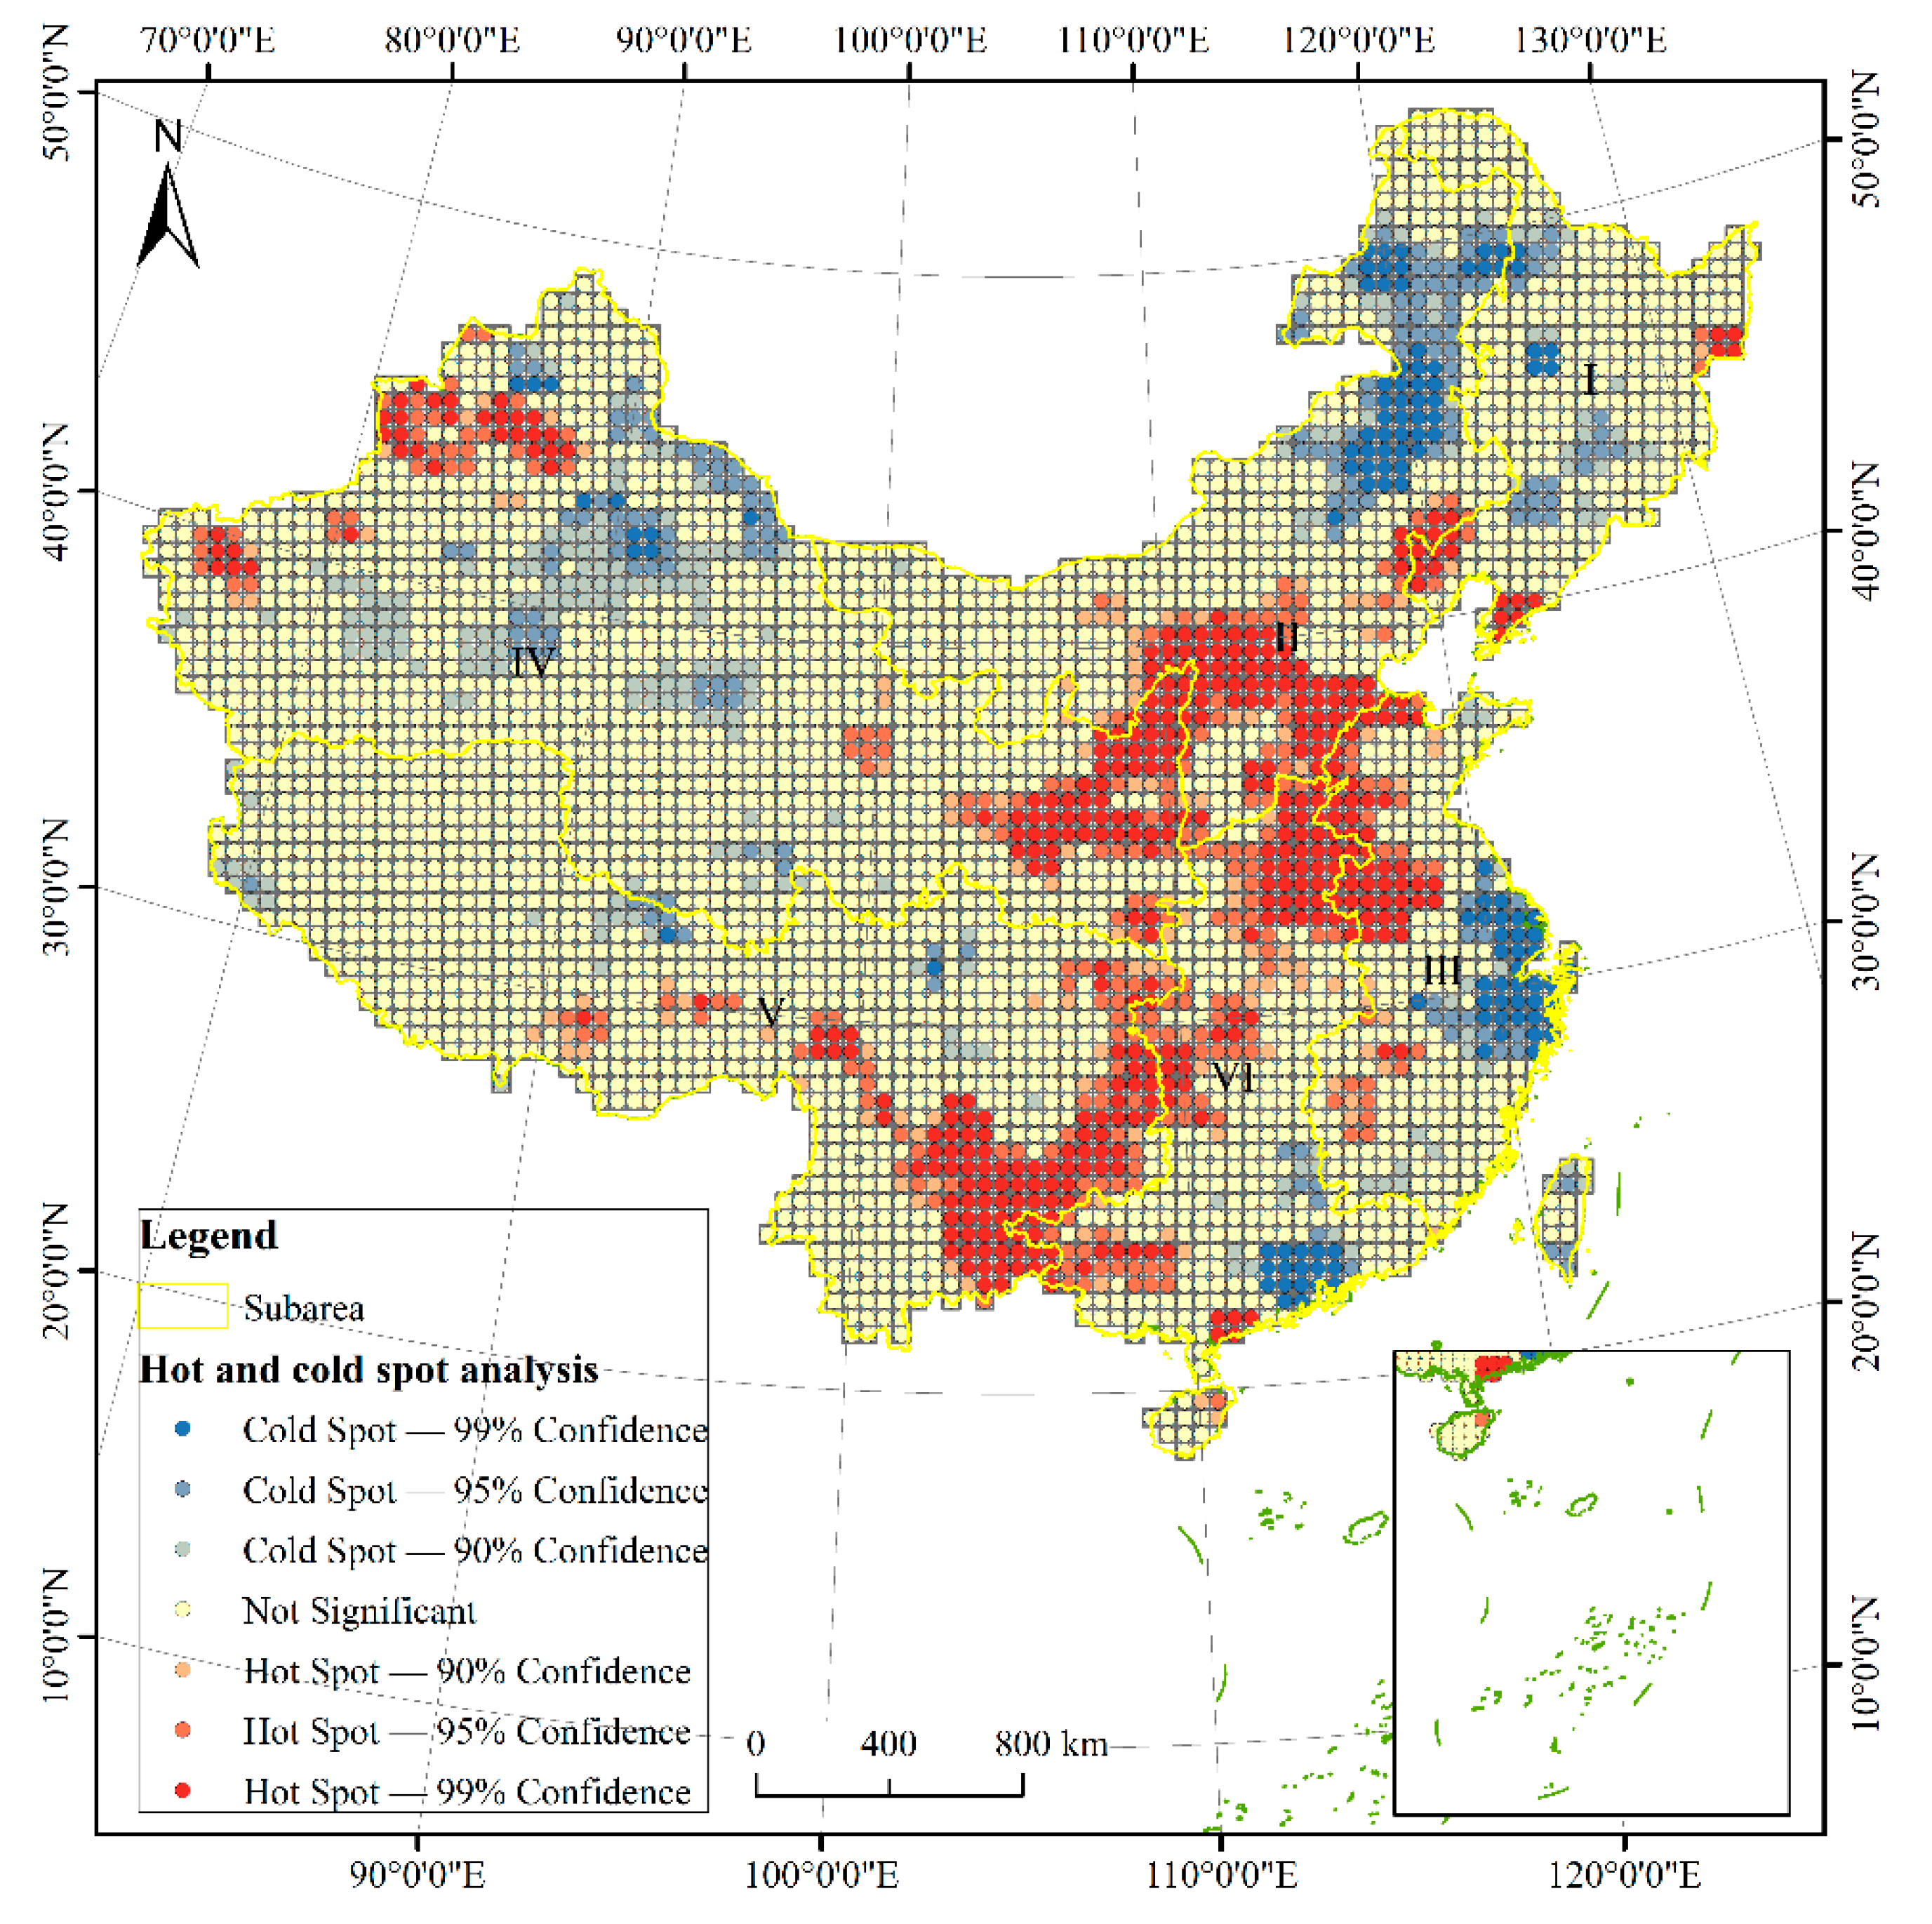
2.3.3. The Hot- and Cold-Spot Analysis

The Getis-OrdGi method was used to identify the hot- and cold-spot areas of LDDI change [26]. The hot-spot represents the agglomerations of higher slope values of LDDI, and the cold-spot represents the agglomeration of lower slope values of LDDI. Its equation can be written as:
G i = j = 1 n w ij x i i = 1 n x i ,   i j
Z ( G i ) = G i E ( G i ) Var ( G i )
where wij is the spatial weight matrix; xi is the value of the spatial unit i; E(Gi) and Var(Gi) represents the exception and variance of Gi, respectively. Z(Gi) is the statistic measuring the hot- and cold-spots, when Z(Gi) > 0, the spatial unit i is a hot-spot; when Z(Gi) < 0, the spatial unit i is a cold-spot. Specifically, the hot spot represents the land development area, while the cold spot represents the land degradation area.

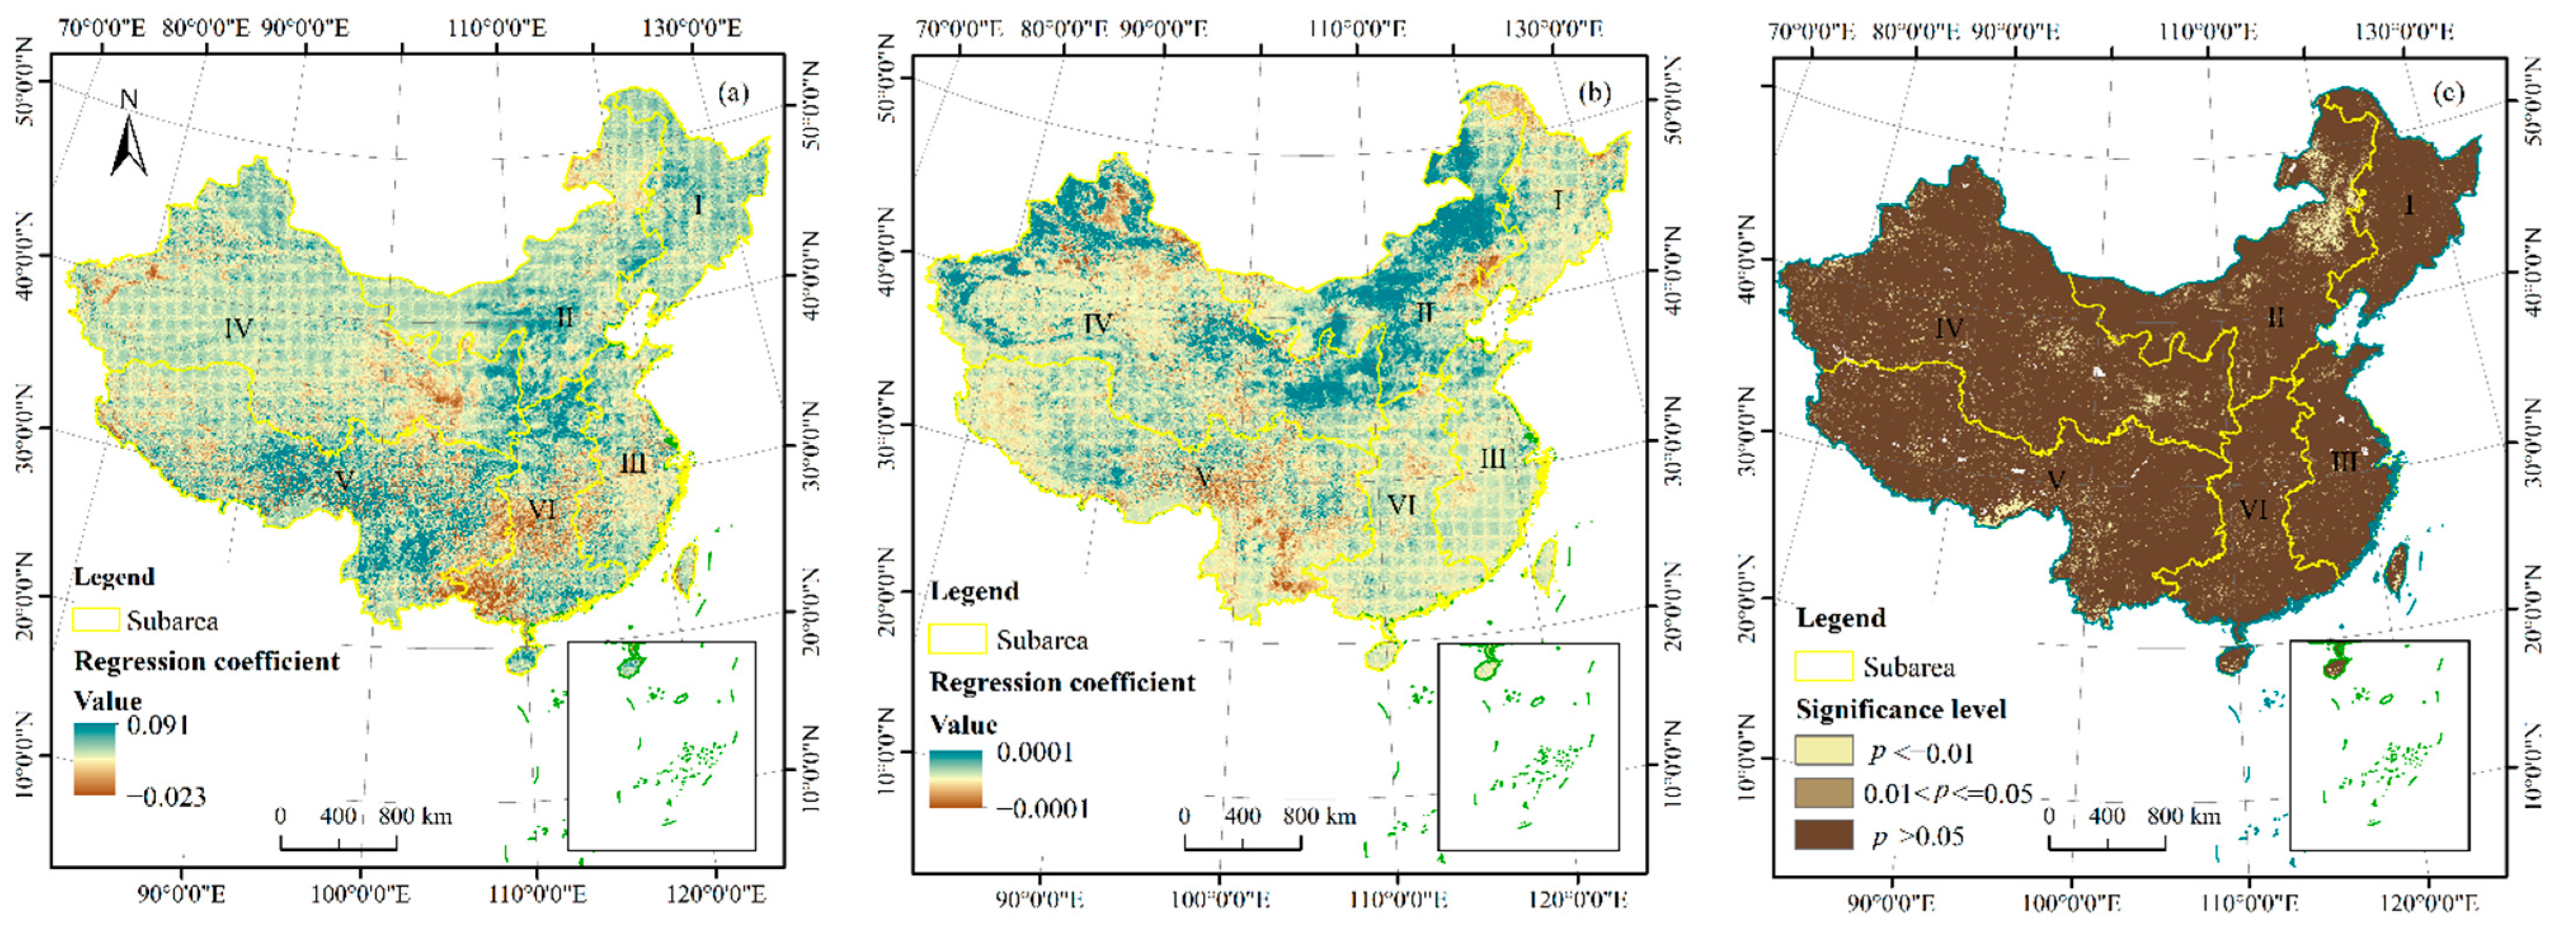
2.3.4. Multiple Linear Regression Model and Residual Analysis

We used the multiple linear regression model to analyze the effects of climate factors on LDD processes at each pixel scale [27], which can be written as:
z = ax + by + β
where z is the dependent variable; x and y are the interpretation variables; a   and b are the regression coefficients of x and y ; β is the constant term.
Specifically, the residual error of multiple linear regression model represents the part of dependent variable Z that are not significantly sensitive to the interpretation factors. In this study, the residual can be regarded as the parts of LDD affected by anthropogenic factors. Therefore, we can use the residual analysis to explore the relationships between the LDD process and human factors [27]. It can be written as:
ε = Z   Z   ^
  Z   ^ = ax + by
where ε is the residual error between the original Z   and modeled   Z   ^ .
For measuring the change trend of residuals, we analyzed the trend of residuals by using the linear regression model and classified them into 5 types based on the classification method of Tian et al. [28] (Table 2). An increase in residuals indicates the enhancement of human activities, while a decrease means a decrease in human activities.

3. Results

3.1. Spatiotemporal Dynamics of LDD from 1985 to 2015

Using the Sen-MK method, the spatiotemporal dynamics of LDD in China from 1985 to 2015 were explored. Overall, China has experienced land development from 1982 to 2015 (Figure 2). The significant and extremely significant land development area spread across the country, such as the Loess Plateau area, the North China Plain, southwest China, the south Tibetan area and the north area of Xinjiang Uygur Autonomous Region, accounting for about 45% of the total area of China. Meanwhile, about 13% of China’s land experienced degradation processes, and these were mainly distributed in the Yangtze River Delta, the Pearl River Delta and the Daxinganling Mountain area of northeast China and some parts of the northeast area of the Xinjiang Uygur Autonomous Region. The remaining 32% of China did not undergo significant change, which was mainly distributed in northwest China.
The hot-spot analysis further showed the areas where LDD took place during the study period in China. As we can see in Figure 3, the hot spots representing the land development areas were mainly located in the Loess Plateau areas such as east Gansu Province, north Shaanxi Province and Shanxi Province, the North China Plain including south Hebei Province, the whole Henan Province, north Anhui Province and west Shandong Province, and southwest China embracing Yunnan Province, Guizhou Province and west Guangxi Zhuang Autonomous Region. In addition, there were hot spots distributed in the northwest Xinjiang Uygur Autonomous Region, Bohai Bay Basin and Sanjiang Plain in Jilin Province. The cold spots were mainly distributed in Guangdong Province, south Jiangsu Province, Shanghai, north Zhejiang Province and the east Inner Mongolia Autonomous Region. Additionally, some cold spots were also found in east Xinjiang Uygur Autonomous Region.

3.2. Relationships between LDDI, Climate Factors and Anthoropogenic Factors

The relationships between LDD and the main climate factors are shown in Figure 4. Temperature had a positive effect on LDDI in the north and southwest parts of China and had a negative correlation with LDDI in south China (Figure 4a). From Figure 4b, we can find that precipitation positively correlated with LDDI in north China, especially in Xinjiang Uygur Autonomous Region, Inner Mongolia Autonomous Region and the Loess Plateau area; while temperature negatively correlated with LDDI in southwest China, such as the south Tibetan area and Yunnan Province. However, as can be seen in Figure 4c, the regression relationships between LDDI and climate factors were not significant, with overall p values higher than 0.5. The significant relationships were only found in the Daxinganling Mountain area and the south Tibetan area.
The residual represents the effects of anthropogenic activities on LDD. The increase in residual indicated that the effects of human activities on LDD processes had been strengthened. From Figure 5, we can see that the human factors became more important in driving the LDD processes in China during the study period. As shown in Figure 5b, the area experiencing increasing effects of human activities on LDD accounting for about 84% of China’s mainland and was mainly distributed in the Loess Plateau area, Qinghai–Tibetan Plateau, north China plain and southwest China. About 6% of the total area underwent a decrease in human influences on LDD, which were located in the Yangtze River delta, the Pearl River Delta area and some places in the Xinjiang Uygur Autonomous Region.

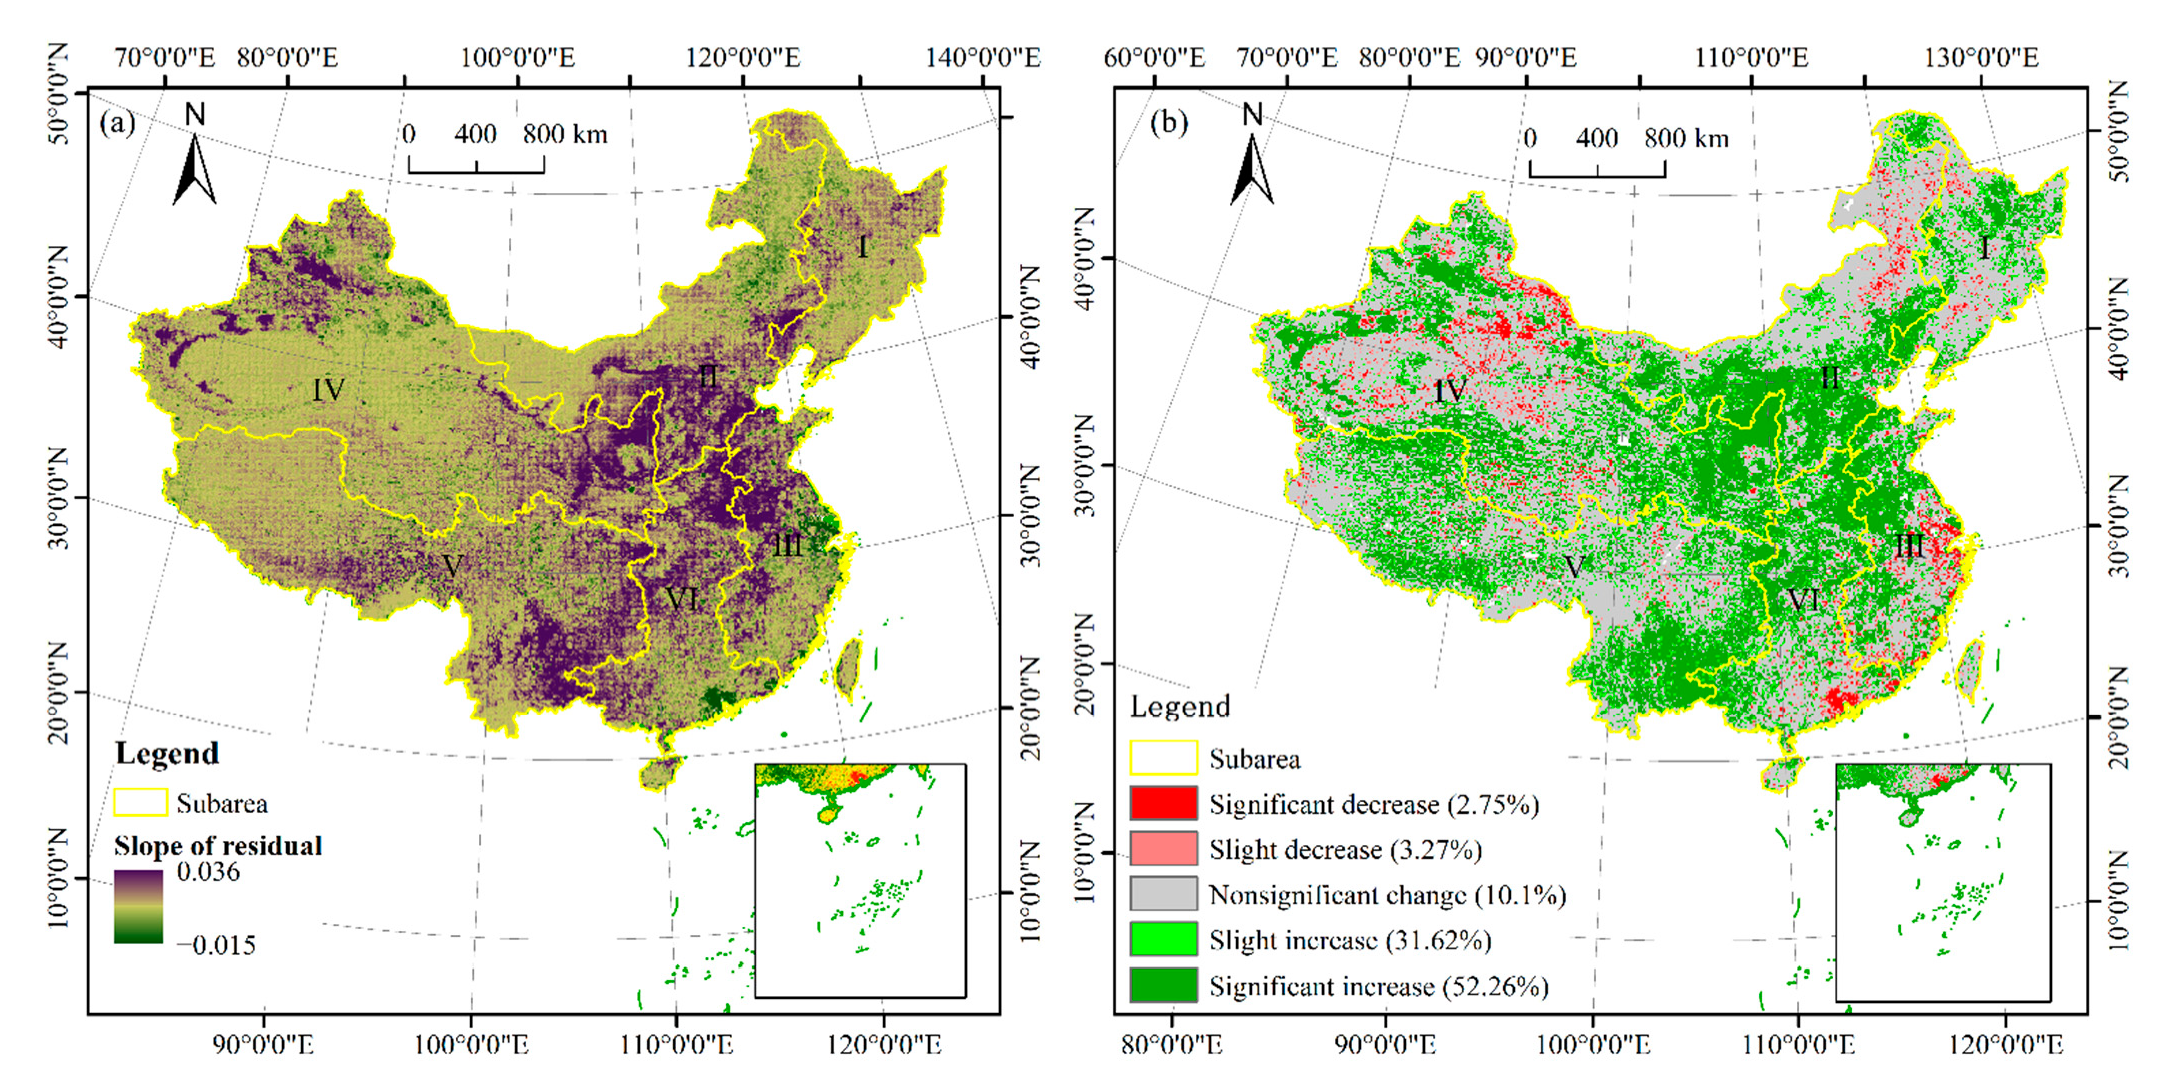
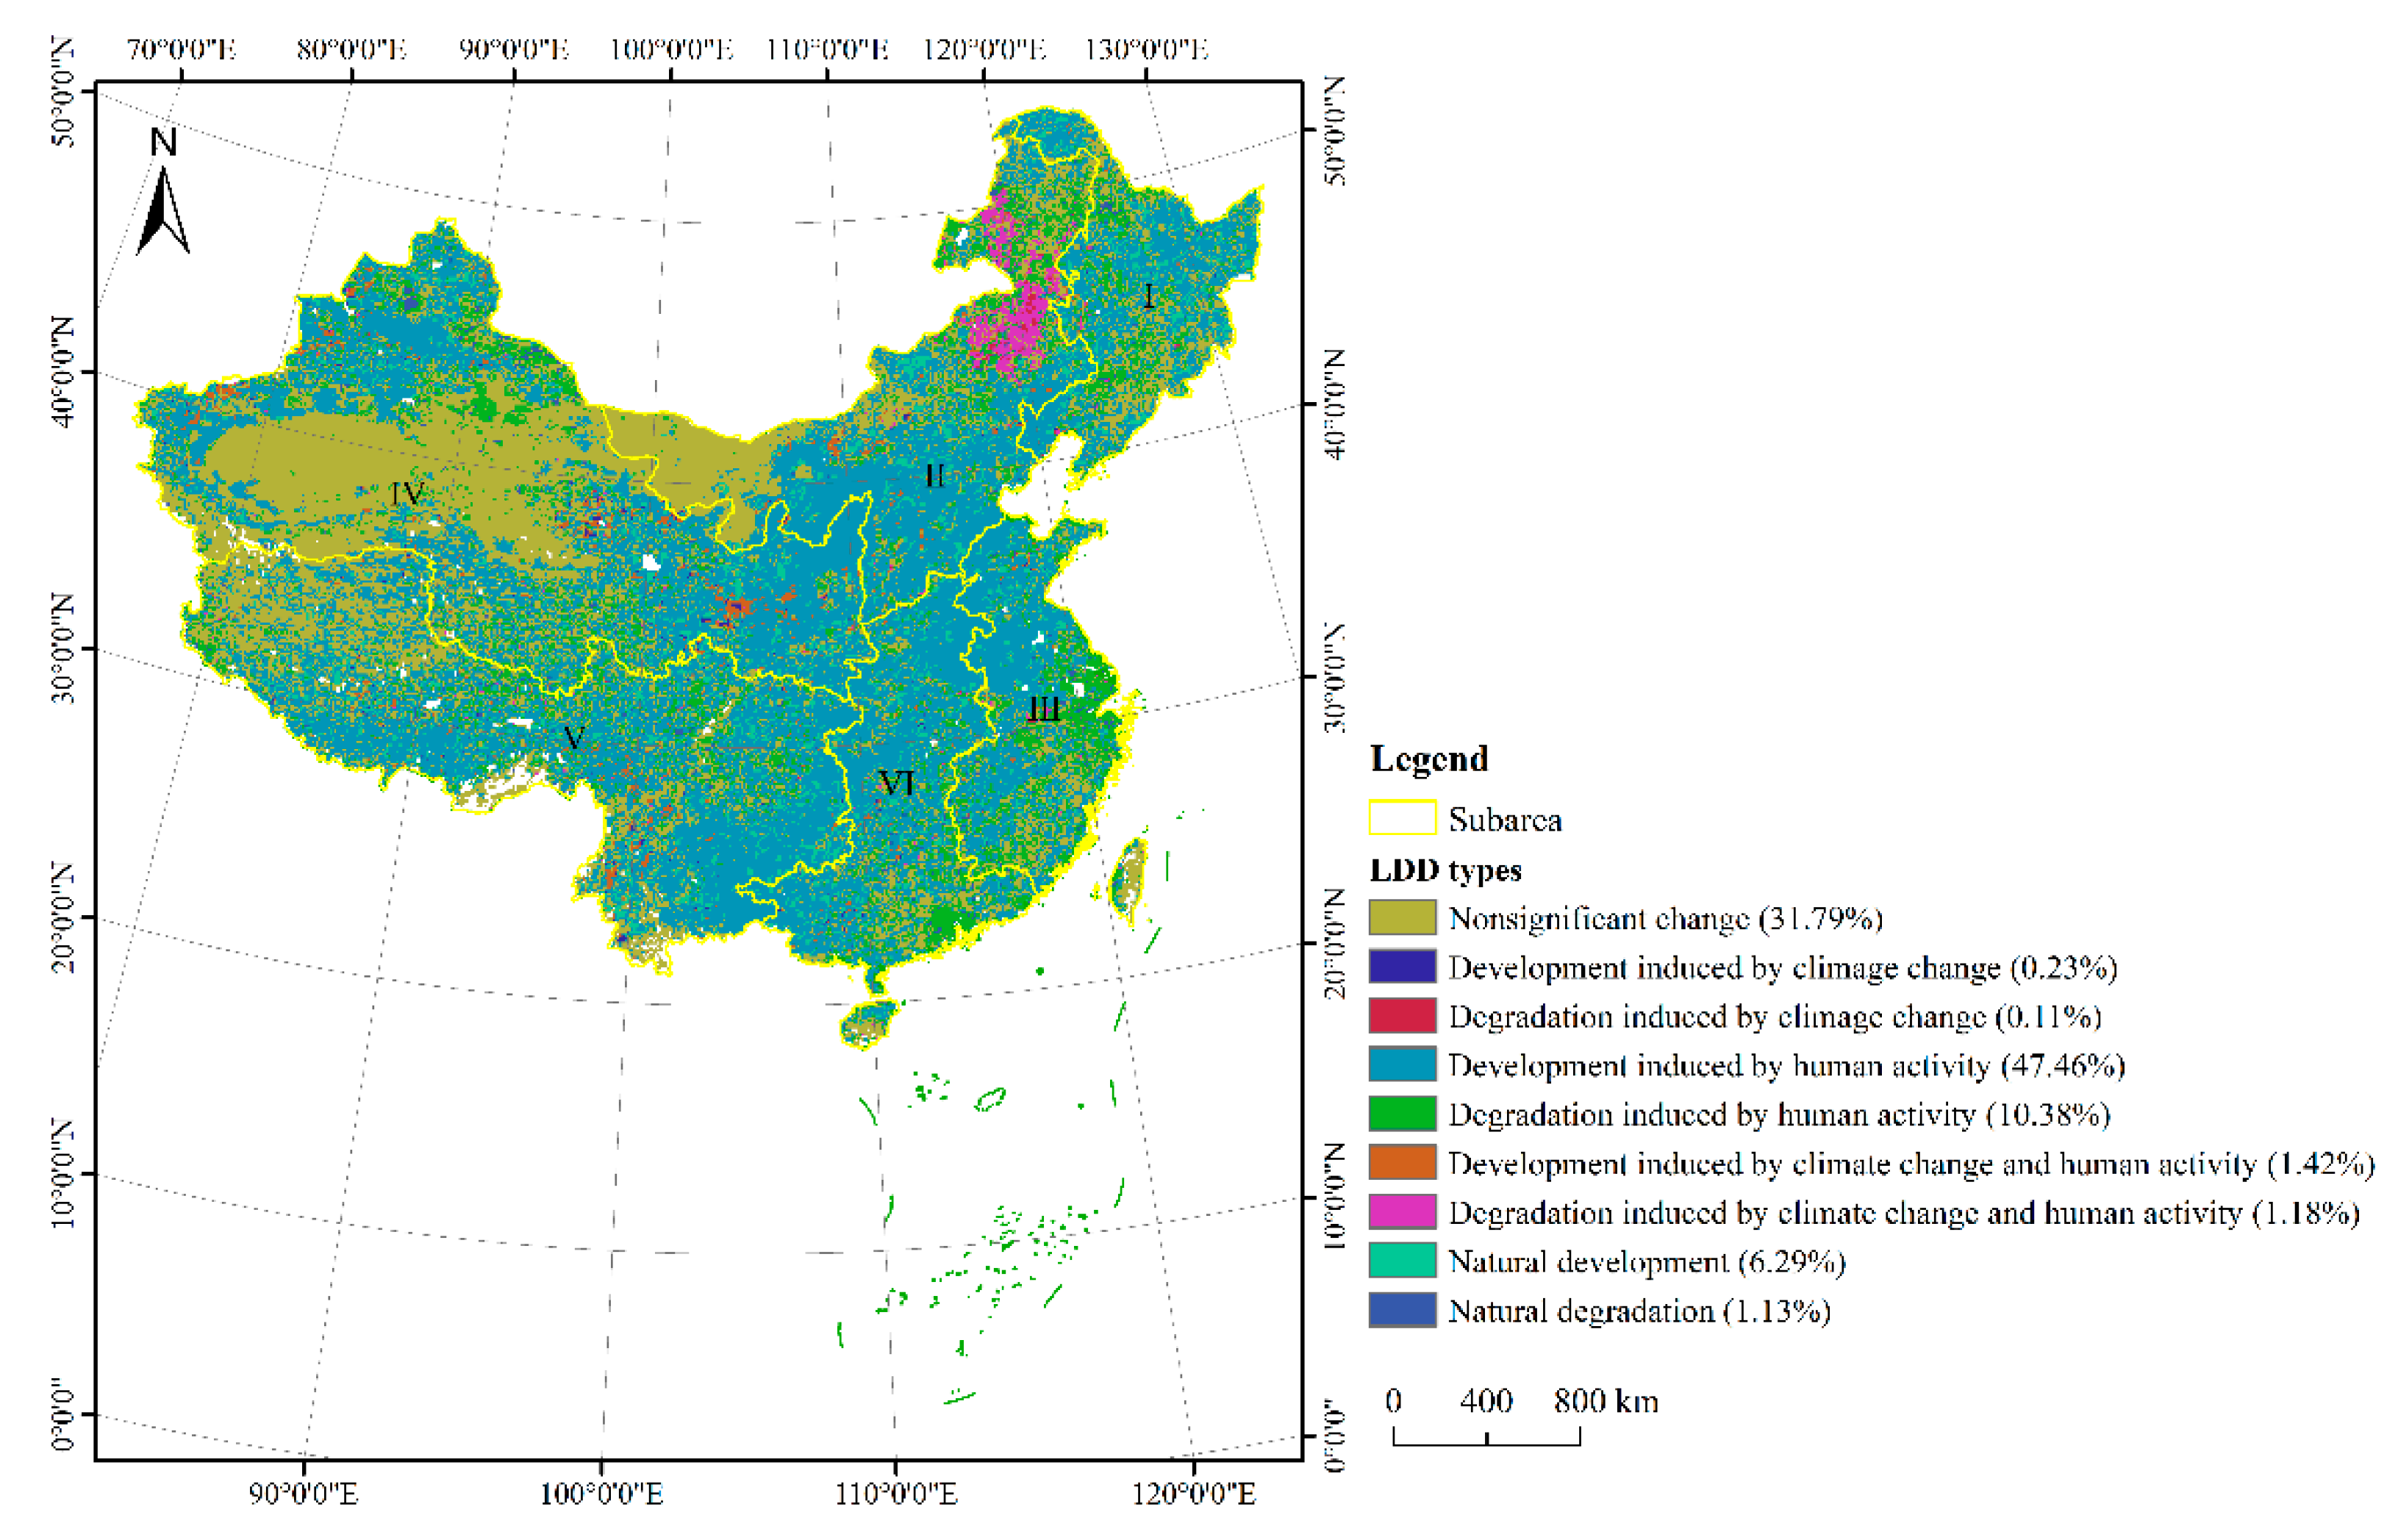
3.3. Relative Roles of Climate Change and Anthropogenic Factors in LDD

Based on the slope of LDDI and its relationships with climate factors and anthropogenic factors, we further explored the relative contributions of climate change and anthropogenic factors to the LDD processes. According to a previous study, we classified LDD into eight types (Table 3).
As shown in Figure 6, anthropogenic factors played dominant roles in driving LDD dynamics. Land significantly influenced by human activities accounted for about 58% of the whole country’s land. Specifically, land development was the dominant LDD type (accounted for about 47.46% of total land area) and was spread all over the country, while the land degradation area accounted for 10.38% and was mainly distributed in east China and central south China. LDD dominated by climate change occupied only 0.34% of the entire country (0.23% and 0.11% for land development and land degradation, respectively). The lands influenced by the synergistic effects of climate factors and anthropogenic factors accounted for 2.6% of the total and they were mainly distributed in the mountain area, such as the south part of the Daxinganling Mountain area of north China and the Qinling Mountain area in northwest China. Meanwhile, about 7.4% of the total land in China experienced natural degradation or development and it was not significantly affected by external factors.

4. Discussion

4.1. Effects of Climate Change on LDD Processes

Based on the multiple linear regression analysis, we explored the effects of precipitation and temperature on LDD processes in China at each pixel scale. In general, the climate represented by precipitation and temperature can greatly influence the LDD processes by directly or indirectly affecting the vegetation’s physical activities (i.e., photosynthesis and respiration) [3,13,16,29]. In the present study, we found that temperature was correlated with LDD processes and had a greater influence on LDD processes than precipitation in China during the study period as found in a previous study in China [27] and in North America [30]. It was widely accepted that global warming exerted a great influence on terrestrial ecosystems [30]. For example, the increase in heat and water stress on vegetation induced by extreme drought can limit the growth of natural vegetation as well as crops, and ultimately cause the degradation of forested land, grassland, and cropland [3,22,31]. Precipitation played a role in affecting LDD processes mainly in north China, which is dominated by arid and semi-arid climate environments, which is also similar to a previous study in China [27,32]. The growth of natural vegetation and crops in these areas is generally constrained by water conditions and thus it is more sensitive to changes in rainfall.
However, from the significant level of the multiple regression models (Figure 4c), we found that at the pixel scale (10 km × 10 km), the relationship between LDD and climate factors in most regions in China were not significant, with a p value greater than 0.05. This may be because the time frame of the present study, which is relatively short. Actually, the responses of the terrestrial ecosystems to climate change vary according to spatiotemporal scales. Consequently, it is important to explore the scale effects of climate change on LDD processes in a future study, which may help reveal the driving mechanism of LDD processes.

4.2. Effects of Anthropogenic Activities on Land Degradation and Development

Based on residual analysis, we further explored the influences of anthropogenic factors on LDD processes in China during the study period. Human activities, such as urbanization, economic development and ecological restoration programs, exerted a great influence on LDD processes and became the most important driving factors of LDD [6,13,33,34].
Human activity was the most important driving force of LDD processes in China during the study period, especially the land development processes. The land development in most natural vegetation areas could be attributed to the implementation of ecological programs in China [31,35]. Since 1970s, the Three-North Forest Shelterbelts Program and Grain for Green program were launched in China, which have greatly transformed the land use and increased the vegetation cover, and eventually contributed to the land development [16,17]. The utilization of advanced cultivation techniques in China during recent decades is the main reason for the development of farmland in areas such as the North China Plain and Northeastern China Plain [36]. With the promotion of chemical fertilizer and pesticides as well as improved cultivation machinery and irrigation technology in China, the disaster resistance of the crop was enhanced and yields were increased since 1980s [6,37,38]. The rapid urbanization that has occurred in China over recent decades (especially in east China) has resulted in various effects on land development both directly and indirectly. Urbanization occupied large portions of farmland and natural spaces and induced land degradation of farmlands, forests, grasslands and wetlands [39,40,41,42]. With the development of urbanization in China, green infrastructure including urban forests, grasslands and water areas attracted attention because of their role in the mitigation of many urban issues. This has helped with the development of ecological lands in or around urban areas [43,44,45,46].

4.3. Availability and Limitation of LDDI in Monitoring LDD Processes

In this study, a new land degradation and development index (LDDI) was proposed to quickly and accurately monitor the LDD processes of terrestrial ecosystems; it was successful in revealing the LDD dynamics in China from 1982 to 2015. Our study proved that the LDDI is suitable for monitoring LDD processes at large spatiotemporal scales. The LDDI demonstrated certain advantages. First, the data used are readily available. Both NDVI and NPP data can be easily acquired from existing remote sensing products, and most are reliable and are generally provided without any cost. Second, compared with other improved NDVI indexes created by introducing transformation parameters, LDDI in the present study can be calculated based on MATLAB software or R by using some relatively concise programs and in a very short time. Third, by integrating NDVI and NPP, LDDI reflects vegetation greenness and productivity in the meantime, and thus accurately reveals the actual vegetation dynamics.
LDDI, of course, has its limitations in monitoring LDD processes. For example, the index partly improves the saturation in high vegetation cover by considering greenness and productivity together, but it is unable to avoid this problem. In addition, this index is not suitable for certain regions, such as mountainous areas with high altitudes and complex terrain.

5. Conclusions

In this study, we initially proposed a LDDI based on the Euclidean distance method, and then detected the spatiotemporal dynamics of LDD and their relationship with climate change and human activities in China from 1982 to 2015. China has experienced significant land development during the study period. Temperature and precipitation partly played a role in the affected LDD. However, human activities served as the dominant driving force of LDD in China.
The LDDI proposed in this study can provide quick and accurate monitoring of LDD processes at the large spatiotemporal scale and offers a deeper understanding of LDD’s driving mechanisms. However, some improvements are needed to solve the saturation problem with high vegetation cover.

Author Contributions

Conceptualization, J.K. and Y.Z.; methodology, J.K. and Y.Z.; software, J.K.; formal analysis, J.K.; investigation, J.K. and Y.Z.; data curation, Y.Z.; writing—original draft preparation, J.K. and A.B.; writing—review and editing, Y.Z. and A.B.; visualization, J.K.; supervision, Y.Z. All authors have read and agreed to the published version of the manuscript.

Funding

This research was funded by the National Cryosphere Desert Data Center, grant number E01Z790201 and the Capacity Building for Cryosphere Desert Data Center, Chinese Academy of Sciences, grant number Y929830201.

Institutional Review Board Statement

Not applicable.

Informed Consent Statement

Not applicable.

Data Availability Statement

The data presented in this study are available on request from the corresponding author.

Conflicts of Interest

The authors declare no conflict of interest.

References

  1. UNCCD. Elaboration of an International Convention to Combat Desertification in Countries Experiencing Serious Drought and/or Desertification, Particularly in Africa; UNCCD: Paris, France, 1994. [Google Scholar]
  2. Bastin, J.F.; Finegold, Y.; Garcia, C.; Mollicone, D.; Rezende, M.; Routh, D.; Zohner, C.M.; Crowther, T.W. The global tree restoration potential. Science 2019, 365, 76. [Google Scholar] [CrossRef]
  3. Hermans, K.; McLeman, R. Climate change, drought, land degradation and migration: Exploring the linkages. Curr. Opin. Environ. Sustain. 2021, 50, 236–244. [Google Scholar] [CrossRef]
  4. Reith, J.; Ghazaryan, G.; Muthoni, F.; Dubovyk, O. Assessment of Land Degradation in Semiarid Tanzania—Using Multiscale Remote Sensing Datasets to Support Sustainable Development Goal 15.3. Remote Sens. 2021, 13, 1754. [Google Scholar] [CrossRef]
  5. Kust, G.; Andreeva, O.; Cowie, A. Land Degradation Neutrality: Concept development, practical applications and assessment. J. Environ. Manag. 2017, 195, 16–24. [Google Scholar] [CrossRef] [PubMed]
  6. Li, H.; Yang, X.; Zhang, K. Understanding global land degradation processes interacted with complex biophysics and socioeconomics from the perspective of the Normalized Difference Vegetation Index (1982–2015). GPC 2021, 198, 103431. [Google Scholar] [CrossRef]
  7. Dubovyk, O. The role of Remote Sensing in land degradation assessments: Opportunities and challenges. Eur. J. Remote Sens. 2017, 50, 601–613. [Google Scholar] [CrossRef]
  8. Camps-Valls, G.; Campos-Taberner, M.; Moreno, A.; Walther, S.; Duveiller, G.; Cescatti, A.; Mahecha, M.; Muñoz, J.; García-Haro, F.; Guanter, L.; et al. A unified vegetation index for quantifying the terrestrial biosphere. Sci. Adv. 2021, 7, eabc7447. [Google Scholar] [CrossRef]
  9. Badgley, G.; Field, C.B.; Berry, J.A. Canopy near-infrared reflectance and terrestrial photosynthesis. Sci. Adv. 2017, 3, e1602244. [Google Scholar] [CrossRef] [Green Version]
  10. Sur, K.; Chauhan, P. Dynamic trend of land degradation/restoration along Indira Gandhi Canal command area in Jaisalmer District, Rajasthan, India: A case study. Environ. Earth Sci. 2019, 78, 472. [Google Scholar] [CrossRef]
  11. Wei, W.; Pang, S.; Wang, X.; Zhou, L.; Xie, B.; Zhou, J.; Li, C. Temperature Vegetation Precipitation Dryness Index (TVPDI)-based dryness-wetness monitoring in China. Remote Sens. Environ. 2020, 248, 111957. [Google Scholar] [CrossRef]
  12. Yin, L.; Feng, X.; Fu, B.; Chen, Y.; Wang, X.; Tao, F. Irrigation water consumption of irrigated cropland and its dominant factor in China from 1982 to 2015. Adv. Water Resour. 2020, 143, 103661. [Google Scholar] [CrossRef]
  13. Shao, Y.; Jiang, Q.O.; Wang, C.; Wang, M.; Xiao, L.; Qi, Y. Analysis of critical land degradation and development processes and their driving mechanism in the Heihe River Basin. Sci. Total Environ. 2020, 716, 137082. [Google Scholar] [CrossRef] [PubMed]
  14. Wang, J.; Wei, H.; Cheng, K.; Ochir, A.; Davaasuren, D.; Li, P.; Chan, F.K.S.; Nasanbat, E. Spatio-Temporal Pattern of Land Degradation from 1990 to 2015 in Mongolia. Environ. Dev. 2020, 34, 100497. [Google Scholar] [CrossRef]
  15. Cao, J.; Tian, H.; Adamowski, J.F.; Zhang, X.; Cao, Z. Influences of afforestation policies on soil moisture content in China’s arid and semi-arid regions. Land Use Policy 2018, 75, 449–458. [Google Scholar] [CrossRef]
  16. Li, K.; Cao, J.; Adamowski, J.F.; Biswas, A.; Zhou, J.; Liu, Y.; Zhang, Y.; Liu, C.; Dong, X.; Qin, Y. Assessing the effects of ecological engineering on spatiotemporal dynamics of carbon storage from 2000 to 2016 in the Loess Plateau area using the InVEST model: A case study in Huining County, China. Environ. Dev. 2021, 100641. [Google Scholar] [CrossRef]
  17. Li, K.; Feng, M.; Biswas, A.; Su, H.; Niu, Y.; Cao, J. Driving Factors and Future Prediction of Land Use and Cover Change Based on Satellite Remote Sensing Data by the LCM Model: A Case Study from Gansu Province, China. Sensors 2020, 20, 2757. [Google Scholar] [CrossRef] [PubMed]
  18. Tucker, C.J.; Pinzon, J.E.; Brown, M.E.; Slayback, D.A.; Pak, E.W.; Mahoney, R.; Vermote, E.F.; El Saleous, N. An extended AVHRR 8-km NDVI dataset compatible with MODIS and SPOT vegetation NDVI data. IJRS 2005, 26, 4485–4498. [Google Scholar] [CrossRef]
  19. Yuan, W.; Liu, S.; Yu, G.; Bonnefond, J.M.; Chen, J.; Davis, K.; Desai, A.R.; Goldstein, A.H.; Gianelle, D.; Rossi, F.; et al. Global estimates of evapotranspiration and gross primary production based on MODIS and global meteorology data. Remote Sens. Environ. 2010, 114, 1416–1431. [Google Scholar] [CrossRef] [Green Version]
  20. Zheng, Y.; Shen, R.; Wang, Y.; Li, X.; Liu, S.; Liang, S.; Chen, J.; Ju, W.; Zhang, L.; Yuan, W. Improved estimate of global gross primary production for reproducing its long-term variation, 1982–2017. Earth Syst. Sci. Data Discuss. 2019, 1–31. [Google Scholar] [CrossRef]
  21. Peng, S.; Ding, D.; Liu, W. 1 km monthly temperature and precipitation dataset for China from 1901 to 2017. Earth Syst. Sci. Data 2019, 11, 1931–1946. [Google Scholar] [CrossRef] [Green Version]
  22. Mesquita, D.P.P.; Gomes, J.P.P.; Souza Junior, A.H.; Nobre, J.S. Euclidean distance estimation in incomplete datasets. Neurocomputing 2017, 248, 11–18. [Google Scholar] [CrossRef]
  23. Jiang, W.; Yuan, L.; Wang, W.; Cao, R.; Zhang, Y.; Shen, W. Spatio-temporal analysis of vegetation variation in the Yellow River Basin. Ecol. Indic. 2015, 51, 117–126. [Google Scholar] [CrossRef]
  24. Fensholt, R.; Proud, S.R. Evaluation of Earth Observation based global long term vegetation trends—Comparing GIMMS and MODIS global NDVI time series. Remote Sens. Environ. 2012, 119, 131–147. [Google Scholar] [CrossRef]
  25. Tošić, I. Spatial and temporal variability of winter and summer precipitation over Serbia and Montenegro. ThApC 2004, 77, 47–56. [Google Scholar] [CrossRef]
  26. Getis, A.; Ord, J.K. The Analysis of Spatial Association by Use of Distance Statistics. Geogr. Anal. 1992, 24, 189–206. [Google Scholar] [CrossRef]
  27. Liu, Y.; Lei, H. Responses of Natural Vegetation Dynamics to Climate Drivers in China from 1982 to 2011. Remote Sens. 2015, 7, 10243–10268. [Google Scholar] [CrossRef] [Green Version]
  28. Tian, H.; Cao, C.; Chen, W.; Bao, S.; Yang, B.; Myneni, R.B. Response of vegetation activity dynamic to climatic change and ecological restoration programs in Inner Mongolia from 2000 to 2012. Ecol. Eng. 2015, 82, 276–289. [Google Scholar] [CrossRef]
  29. Mendoza-Ponce, A.; Corona-Núñez, R.; Kraxner, F.; Leduc, S.; Patrizio, P. Identifying effects of land use cover changes and climate change on terrestrial ecosystems and carbon stocks in Mexico. Glob. Environ. Chang. 2018, 53, 12–23. [Google Scholar] [CrossRef] [Green Version]
  30. Wang, X.; Piao, S.; Ciais, P.; Li, J.; Friedlingstein, P.; Koven, C.; Chen, A. Spring temperature change and its implication in the change of vegetation growth in North America from 1982 to 2006. Proc. Natl. Acad. Sci. USA 2011, 108, 1240–1245. [Google Scholar] [CrossRef] [Green Version]
  31. Zhao, A.; Zhang, A.; Liu, J.; Feng, L.; Zhao, Y. Assessing the effects of drought and “Grain for Green” Program on vegetation dynamics in China’s Loess Plateau from 2000 to 2014. Catena 2019, 175, 446–455. [Google Scholar] [CrossRef]
  32. Xu, G.; Zhang, H.; Chen, B.; Zhang, H.; Innes, J.; Wang, G.; Yan, J.; Zheng, Y.; Zhu, Z.; Myneni, R. Changes in Vegetation Growth Dynamics and Relations with Climate over China’s Landmass from 1982 to 2011. Remote Sens. 2014, 6, 3263. [Google Scholar] [CrossRef] [Green Version]
  33. Wang, Z.; Zhang, Y.; Yang, Y.; Zhou, W.; Gang, C.; Zhang, Y.; Li, J.; An, R.; Wang, K.; Odeh, I.; et al. Quantitative assess the driving forces on the grassland degradation in the Qinghai–Tibet Plateau, in China. Ecol. Inform. 2016, 33, 32–44. [Google Scholar] [CrossRef]
  34. Wen, Y.; Liu, X.; Bai, Y.; Sun, Y.; Yang, J.; Lin, K.; Pei, F.; Yan, Y. Determining the impacts of climate change and urban expansion on terrestrial net primary production in China. J. Environ. Manag. 2019, 240, 75–83. [Google Scholar] [CrossRef]
  35. Li, G.; Sun, S.; Han, J.; Yan, J.; Liu, W.; Wei, Y.; Lu, N.; Sun, Y. Impacts of Chinese Grain for Green program and climate change on vegetation in the Loess Plateau during 1982-2015. Sci. Total Environ. 2019, 660, 177–187. [Google Scholar] [CrossRef]
  36. Tang, W.; Zhang, Y.G.; Liu, Y.J.; Wang, X.; Kou, M.; Yan, H.; Ma, D.F.; Li, Q. Quantifying cultivation technique and growth dynamics of purple-fleshed sweetpotato (Ipomoea batatas L.) in China. Field Crops Res. 2018, 227, 41–48. [Google Scholar] [CrossRef]
  37. Qiu, S.; Xie, J.; Zhao, S.; Xu, X.; Hou, Y.; Wang, X.; Zhou, W.; He, P.; Johnston, A.M.; Christie, P.; et al. Long-term effects of potassium fertilization on yield, efficiency, and soil fertility status in a rain-fed maize system in northeast China. Field Crops Res. 2014, 163, 1–9. [Google Scholar] [CrossRef]
  38. Zeng, R.; Yao, F.; Zhang, S.; Yang, S.; Bai, Y.; Zhang, J.; Wang, J.; Wang, X. Assessing the effects of precipitation and irrigation on winter wheat yield and water productivity in North China Plain. Agric. Water Manag. 2021, 256, 107063. [Google Scholar] [CrossRef]
  39. Fu, Y.C.; Li, J.F.; Weng, Q.H.; Zheng, Q.M.; Li, L.; Dai, S.; Guo, B.Y. Characterizing the spatial pattern of annual urban growth by using time series Landsat imagery. Sci. Total Environ. 2019, 666, 274–284. [Google Scholar] [CrossRef]
  40. He, C.; Zhang, D.; Huang, Q.; Zhao, Y. Assessing the potential impacts of urban expansion on regional carbon storage by linking the LUSD-urban and InVEST models. Environ. Model Softw. 2016, 75, 44–58. [Google Scholar] [CrossRef]
  41. Li, C.; Liu, M.; Hu, Y.; Zhou, R.; Wu, W.; Huang, N. Evaluating the runoff storage supply-demand structure of green infrastructure for urban flood management. J. Clean. Prod. 2021, 280. [Google Scholar] [CrossRef]
  42. Wang, K.; Li, Z.Y.; Zhang, J.J.; Wu, X.; Jia, M.; Wu, L. Built-up land expansion and its impacts on optimizing green infrastructure networks in a resource-dependent city. Sustain. Cites Soc. 2020, 55, 10. [Google Scholar] [CrossRef]
  43. Li, K.; Li, C.; Cao, J.; Wang, H.; Liu, M.; Lü, J.; Hao, Z. Spatiotemporal evolution characteristics of urban green infrastructure in central Liaoning urban agglomerations during the past 20 years based on landscape ecology and morphology. Acta Ecol. Sin. 2021, 41. [Google Scholar] [CrossRef]
  44. Maes, J.; Barbosa, A.; Baranzelli, C.; Zulian, G.; Batista, E.S.F.; Vandecasteele, I.; Hiederer, R.; Liquete, C.; Paracchini, M.L.; Mubareka, S.; et al. More green infrastructure is required to maintain ecosystem services under current trends in land-use change in Europe. Landscape Ecol. 2015, 30, 517–534. [Google Scholar] [CrossRef] [PubMed] [Green Version]
  45. Ramyar, R.; Saeedi, S.; Bryant, M.; Davatgar, A.; Mortaz Hedjri, G. Ecosystem services mapping for green infrastructure planning-The case of Tehran. Sci. Total Environ. 2020, 703, 135466. [Google Scholar] [CrossRef] [PubMed]
  46. Wang, Y.C.; Shen, J.K.; Xiang, W.N. Ecosystem service of green infrastructure for adaptation to urban growth: Function and configuration. Ecosyst. Health Sustain. 2018, 4, 132–143. [Google Scholar] [CrossRef]
Figure 1. The study area. I–VI represents northeast China (NEC), north China (NC), east China (EC), northwest China, southwest China (SWC) and central south China (CSC), respectively.
Remotesensing 13 03516 g001
Figure 2. LDD processes in China from 1985 to 2015.
Remotesensing 13 03516 g002
Figure 3. The hot and cold spots of LDD.
Remotesensing 13 03516 g003
Figure 4. The regression relationships between LDDI and climate factors in China. (a) The regression coefficient of temperature; (b) The regression coefficient of precipitation; and (c) The significance level.
Remotesensing 13 03516 g004
Figure 5. Residual analysis of LDDI’s influencing factors. (a) The slope of residual and (b) significance level.
Remotesensing 13 03516 g005
Figure 6. LDD types in China.
Remotesensing 13 03516 g006
Table 1. LDD processes in China.
Slope of LDDIZ StatisticLDD Types
Slope ≤ −0.0005Z ≤ −1.96Significant degradation
Slope ≤ −0.0005−1.96 < Z < 1.96Slight degradation
−0.0005 < Slope < 0.0005−1.96 < Z < 1.96Nonsignificant change
Slope ≥ 0.0005−1.96 < Z < 1.96Slight development
Slope ≥ 0.0005Z ≥ 1.96Significant development
Table 2. The change in effects of human activities on LDD.
Slope of ResidualSignificance LevelLDD Types
Slope ≤ −0.0005p < 0.01Significant decrease
Slope ≤ −0.00050.01 ≤ p < 0.05Slight decrease
−0.0005 < Slope < 0.0005p ≥ 0.05Nonsignificant change
Slope ≥ 0.0005p < 0.01Slight increase
Slope ≥ 0.00050.01 ≤ p < 0.05Significant increase
Table 3. Classification standard of LDD types.
LDDI’s Change TrendSignificance Level of Regression Model between LDDI and Climate FactorsSignificant Level of Residual’s Slope
Development induced by climate changeSignificant increasep < 0.05p > 0.05
Degradation induced by climate changeSignificant decreasep < 0.05p > 0.05
Development induced by human factorsSignificant increasep > 0.05p < 0.05
Degradation induced by human factorsSignificant decreasep > 0.05p < 0.05
Development induced by climate change and human factorsSignificant increasep < 0.05p < 0.05
Degradation induced by climate change and human factorsSignificant decreasep < 0.05p < 0.05
Natural developmentSignificant increasep > 0.05p > 0.05
Natural degradationSignificant decreasep > 0.05p > 0.05
Publisher’s Note: MDPI stays neutral with regard to jurisdictional claims in published maps and institutional affiliations.

