Technical Note

Micro-Motion Parameter Extraction for Ballistic Missile with Wideband Radar Using Improved Ensemble EMD Method

1
Electronics and Communication Engineering, Sun Yat-Sen University, Guangzhou 510006, China
2
Science and Technology on Automatic Target Recognition Laboratory, National University of Defense Technology, Changsha 410003, China
*
Author to whom correspondence should be addressed.
Remote Sens. 2021, 13(17), 3545; https://0-doi-org.brum.beds.ac.uk/10.3390/rs13173545
Submission received: 2 August 2021 / Accepted: 1 September 2021 / Published: 6 September 2021

Abstract

:
Micro-motion parameters extraction is crucial in recognizing ballistic missiles with a wideband radar. It is known that the phase-derived range (PDR) method can provide a sub-wavelength level accuracy. However, it is sensitive and unstable when the signal-to-noise ratio (SNR) is low. In this paper, an improved PDR method is proposed to reduce the impacts of low SNRs. First, the high range resolution profile (HRRP) is divided into a series of segments so that each segment contains a single scattering point. Then, the peak values of each segment are viewed as non-stationary signals, which are further decomposed into a series of intrinsic mode functions (IMFs) with different energy, using the ensemble empirical mode decomposition with the complementary adaptive noise (EEMDCAN) method. In the EEMDCAN decomposition, positive and negative adaptive noise pairs are added to each IMF layer to effectively eliminate the mode-mixing phenomenon that exists in the original empirical mode decomposition (EMD) method. An energy threshold is designed to select proper IMFs to reconstruct the envelop for high estimation accuracy and low noise effects. Finally, the least-square algorithm is used to do the ambiguous phases unwrapping to obtain the micro-curve, which can be further used to estimate the micro-motion parameters of the warhead. Simulation results show that the proposed method performs well with SNR at −5 dB with an accuracy level of sub-wavelength.

1. Introduction

In the missile defense system, it is crucial to distinguish the true warheads from decoys in the mid-course phase, where warheads and decoys exhibit different micro-motions. Specifically, the true warheads have precession and nutation movements, while decoys wobble after being released from the true warheads. When observing the mid-course ballistic missiles using radar, the precession and nutation movements will modulate the echoes. Consequently, it is possible to extract micro-motion parameters from the radar echoes to recognize the true warheads [1,2,3,4,5,6].
In the past few decades, many methods have been developed to exploit the micro-motion features to recognize the mid-course ballistic missiles [7,8,9,10,11,12]. It is difficult for the narrow-band radar to discriminate the different scattering points lying on the true warhead due to its low range resolution. Thus, the warhead is usually considered as a whole, and many methods based on the whole radar cross section (RCS) are developed [13,14,15]. RCS is affected by various factors such as target shape, target material, illuminating angle, etc. As a result, the estimated micro-motion parameters based on the RCS sequence may not be fine, accurate, and reliable enough [16]. By contrast, the wideband radar is much more appealing. The high range resolution profile (HRRP) benefiting from the large available bandwidth makes it possible to separate the scattering points from each other. Therefore, many more advanced methods for the wideband radar have been proposed to extract finer and more accurate micro-motion features [17,18,19,20,21].
It is reported that the phase-derived range (PDR) method based on HRRP sequences can achieve the half-wavelength accuracy, and thus has attracted increasing attentions [22,23]. It measures the target range using the phase information based on R = ( λ / 4 π ) Δ ϕ , where λ and Δ ϕ represent the wavelength and the unambiguous phase, respectively. However, there are two challenges for the the PDR method in the wideband radar. One is how to extract the ambiguous phase, corresponding to the envelop across the HRRP sequence. As the scattering point will occupy several range bins, it is particularly significant to determine the correct range bins to fit the envelop. The other is how to unwrap the ambiguous phase, as Δ ϕ is unambiguous only with Δ ϕ < 2 π . In other words, the maximum unambiguous range is λ / 2 , which is impractical. Therefore, the phase unwrapping is indispensable.
Note that several improved PDR methods have been applied for the micro-motion parameters extraction. In [7], a micro-Doppler phase delta method was proposed to tackle the phase ambiguity. It calculates the phase difference between two adjacent pulses, resolves the number of phase ambiguities, and further uses the PDR method to properly measure the distance. However, as mentioned in [7], it requires several related measurement errors to be small enough to correctly resolve the phase ambiguity. In other words, it requires high signal-to-noise ratio (SNR). In [17], the authors proposed a new PDR method to extract Doppler phases from HRRP sequences through a matched filter. This algorithm was developed in [7], where they applied the same method to the direct sampling linear frequency modulated signal to avoid the influences of the recording error. However, the high SNR requirement and the limitation to stationary targets remained unresolved. In [10], the authors presented a high-precision PDR method with no constraints on SNRs for phase ambiguity. The ambiguous phase is estimated by applying the conjugate multiplication between two adjacent pulses, and relaxes the requirement of SNR. However, the variation range between adjacent frames is required to be less than one-quarter of the wavelength, which limits its application.
As is well known, EMD is a powerful tool for the non-stationary signal analysis [24,25]. Its main advantage is that it can decompose the non-stationary signal into a series of intrinsic mode functions (IMFs). The non-stationary signal can be reconstructed by the filtered IMFs to envelop association for micro-curve extraction [26]. However, the original EMD algorithm heavily relies on the extreme points of the non-stationary signal. Besides, EMD is greatly affected by the high-frequency interference in the signal.
In this paper, we develop an improved PDR method and attempt to deal with the micro-motion parameters extraction in the wideband radar. To overcome the low-SNR issue and high-frequency interference, instead of directly applying EMD, we adopt an ensemble EMD with complementary adaptive noise (EEMDCAN) [27] to extract the scattering point envelop across the HRRPs. First, we divide the HRRP into a series of segments such that each of them contains a scattering point. We take the peak value of each segment along the HRRP as the coarse estimation of the corresponding scattering point, and then regard all coarse estimations of the scattering point across the HRRPs as a non-stationary signal. Then, the EEMDCAN method is applied to each non-stationary signal to obtain a series of IMFs for each scattering point. The decomposition terminates when the conditions of modal amplitude and estimation function proposed by Rilling G. are satisfied [28]. Only the IMFs with a zero-crossing rate (ZCR) larger than a threshold will be employed to reconstruct the accurate envelop, while the remaining IMFs will be considered as interference and discarded [28]. Based on the accurate envelop, the ambiguous phases can be directly obtained, and the least-squares algorithm is employed to unwrap the ambiguous phases. Finally, parameters estimation is performed. For the target with precession, the micro-curve of scattering points can be regarded as sinusoidal curves, of which the amplitudes are affected by the precession angle, cone height, and radius. Therefore, the precession angle, precession frequency, cone height, and radius can be obtained through the estimated micro-curve.
The most important contribution of this paper is that an improved PDR method is proposed to overcome the difficulties in recognizing the true warheads with low SNRs. Specifically, the proposed method can adaptively estimate the envelop according to the characteristics of the signal. Even when the SNR is lower than 5 dB, this method can still estimate the envelop with high accuracy at a sub-wavelength level.
The remaining of this paper is organized as follows. Section 2 introduces the geometric model and related backgrounds. Section 3 presents the parameter estimation method, which contains scattering point separation, micro-curve extraction, and parameter extraction methods. In Section 4, simulation results are provided to verify the proposed method. Section 5 concludes the paper.

2. Geometry and Signal Model

The cone model of a mid-course warhead observed by a wideband radar is illustrated in Figure 1, where Figure 1a presents the radar coordinate system ( Q U V W ), the warhead local coordinate system ( O x y z ), and the reference coordinate system ( O X Y Z ), while Figure 1b presents the details of a warhead. During the observation, the radar keeps stationary.

2.1. Warhead Motion

In general, the warhead is modeled as a rigid body, where the distance between any two particles does not vary during any motion [1]. For cone targets, precession is a common form of micro-motion, i.e., when the target is moving, it is accompanied by periodic cone rotation around the cone rotation axis [8]. As Figure 1 shows, the warhead is modeled as a cone, and in a mid-course warhead, there usually exist two motions [8,29]: one is the warhead spinning around the symmetric axis O z with the angular velocity ω s , and the other is the warhead rotating around the precession direction O C with angular velocity ω c . The angle φ between O C and the cone symmetric axis O z is referred as to the precession angle. In Figure 1b, H, σ , r, and d stand for the height, half opening angle, the base radius of the cone, and the distance from the top to O (namely, O P 1 ), respectively. According to the scattering theory, there are usually three strong scattering points in the HRRP sequences of the cone target, namely P 1 , P 2 , and P 3 , where P 1 is fixed, while P 2 and P 3 change their positions as the radar line of sight (LOS) changes.
In the radar coordinate system, let α and β denote the initial azimuth and elevation angle of the warhead, respectively; R 0 = ( U 0 , V 0 , W o ) T denote the initial position vector of the origin of the reference coordinate system O; and R 0 = R 0 , where · represents the Euclidean norm, then the unit vector of radar L O S is
n = R 0 R 0 = cos α cos β , sin α cos β , sin β .
Rotation will change the target posture, and consequently change the position of the scattering point relative to the radar. In the target coordinate system, assume the scattering point P is with a position vector r 0 = X 0 , Y 0 , Z o T at the initial time t = 0 . Let ϕ , θ , ψ denote the initial Euler angles, where ϕ , θ , and ψ rotate about z-axis, x-axis, and z-axis, respectively, and the corresponding initial rotation matrix is
R I n i t = cos ϕ sin ϕ 0 sin ϕ cos ϕ 0 0 0 1 1 0 0 0 cos θ sin θ 0 sin θ cos θ cos ψ sin ψ 0 sin ψ cos ψ 0 0 0 1 .
Then, the new location of P in the reference coordinate system can be represented by R I n i t · r 0 . Supposing that the angular vector is w c = ( w x , w y , w z ) T , then the unit vector of the rotation is w c = ( w x , w y , w z ) T = R I n i t · w c w c . According to the Rodrigues formula [8], the rotation matrix at time t can be written as
R t = I + K sin Ω t + K 2 1 cos Ω t ,
where I is the unit matrix, Ω = ω c , and K = w c ^ is a skew symmetric matrix of the unit direction vector:
K = 0 w c z w cy w c z 0 w c x w c y w c x 0 = 0 cos φ sin φ cos φ 0 0 sin φ 0 0 .
Substituting (4) into (3), the rotation matrix becomes
R t = cos Ω t cos φ sin Ω t sin φ sin Ω t cos φ sin Ω t 1 cos 2 φ + cos 2 φ cos Ω t sin φ cos φ sin φ cos φ cos Ω t sin φ sin Ω t sin φ cos φ sin φ cos φ cos Ω t 1 sin 2 φ + sin 2 φ cos Ω t .
The distance from the radar to the point P can be derived as
r t = Q P = Q O + O O + O P = R 0 + V t + R t r 0 ,
where V is the velocity vector, i.e., O O = V t , and R 0 is the initial range value.
Ballistic targets are usually far away from the radar, and the far-field condition can be satisfied. Thus, the instantaneous radial distance from the scattering point to the radar can be calculated by the projection of the scattering point to the radar’s LOS, namely,
r i ( t ) = L O S , P i + R 0 = Y i sin γ + Z i cos γ + R 0 ,
where · denotes the inner product of two vectors, and γ denotes the angle between target symmetry axis and radar line of sight at the time t, cos γ = L O S , Z , i = 1 , 2 , 3 .
We assume that the radar bandwidth is large enough so that it can discriminate each scattering point of the cone target, and the cone target will span several range bins. Therefore, the micro-motions of the scattering points could be distinguished from the bulk of the target in the radial range dimension. In this paper, we ignore the influence of bulk motion, and assume R 0 to be 0. According to the works in [30], the distance between scattering points and radar can be expressed as
r 1 t = d cos φ cos φ + α H sin φ sin φ + α cos Ω t + R h ,
r 2 t = r 1 cos 2 φ cos 2 φ + γ + H d r cos φ cos φ + γ 1 cos 2 φ cos 2 φ + γ · ρ + R h ,
r 3 t = r 1 cos 2 φ cos 2 φ + γ + H d + r cos φ cos φ + γ 1 cos 2 φ cos 2 φ + γ · ρ + R h ,
where ρ = sin φ sin φ + γ cos w c t , and R h represents the radial distance change caused by the position of the local coordinate center O
R h = H d sin φ sin φ + α cos Ω t .

2.2. Radar Echoes

The linear frequency modulation (LFM) signals are widely used in wideband radar systems [10] and can be expressed as
s t = rect t T p exp j 2 π f c t + 1 2 k t 2 ,
where rect ζ = 1 , ζ 0.5 0 , ζ > 0.5 , t denotes the fast time, T p denotes the pulse duration, f c denotes the carrier frequency, and k denotes the slope frequency modulation. Then, the signal returned from the cone can be modeled as the summation of the returns from all scattering points [31]:
s t , t m = i = 1 N A i rect t 2 r i t m / c T p exp j 4 π r i t m λ exp j π k t 2 r i t m c 2 + n t m ,
where t m = m T r is the slow time, A i is the P i reflectivity, λ = c / f c represents the carrier wavelength, c is the wave propagation velocity, n r ( t m ) denotes the noise term of the received echo signal, and N denotes the number of scattering points. After pulse compression, the obtained HRRPs can be represented as
S t , t m = i = 1 N A i sin c B t 2 r i t m c exp j 4 π r i t m λ + n t m = i = 1 N A i ( t m ) exp j 4 π r i t m λ + n t m ,
where A i denotes the amplitude after pulse compression, and A i ( t m ) represents the amplitude containing the sinc function.

3. Micro-Motion Parameter Estimation

3.1. Scattering Point Separation

The attitude of the warhead is relatively stable in the mid-course phase, and the envelops of the different scattering points do not cross each other. Thus, HRRP sequences can be divided into corresponding segments according to the number of scattering points. The HRRP sequences of each scattering point can be presented as
S i t m = A i ( t m ) exp j 4 π r i t m λ + n t m .
Then, the signal of the m-th pulse of the i-th scattering point in the slow-time dimension can be expressed as
S i m = A i ( m ) exp j 4 π r i m λ + n m .

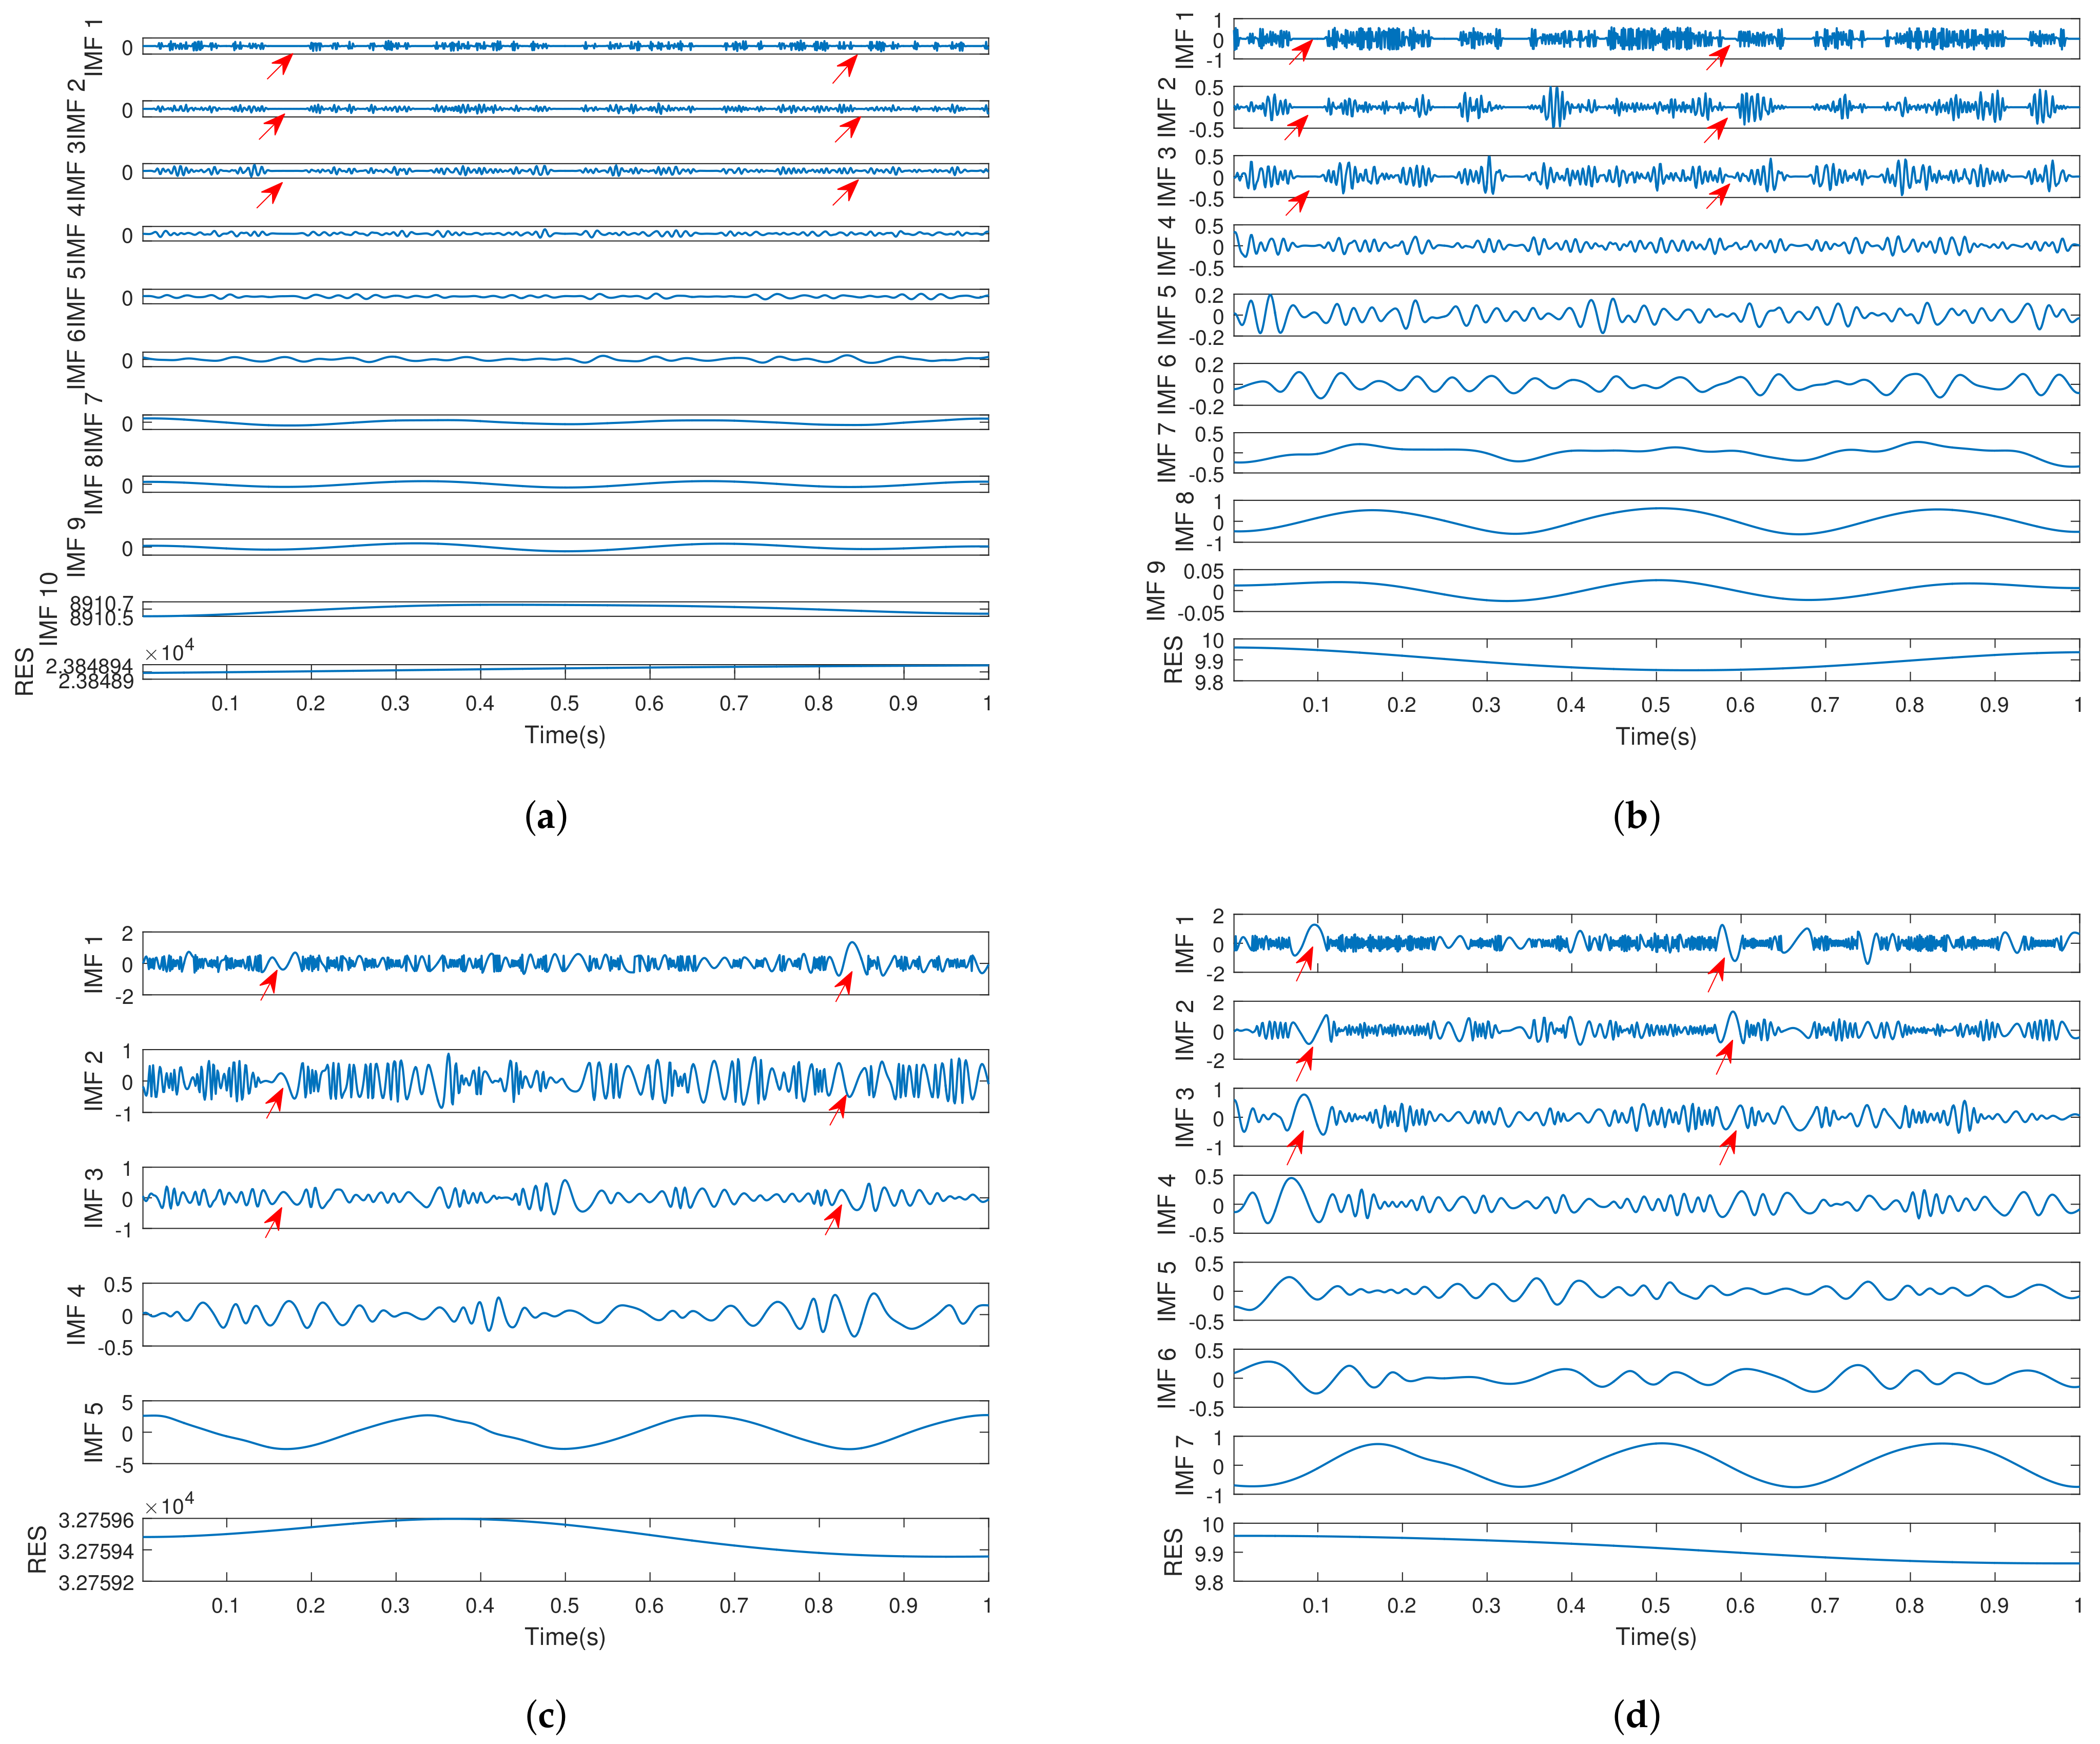
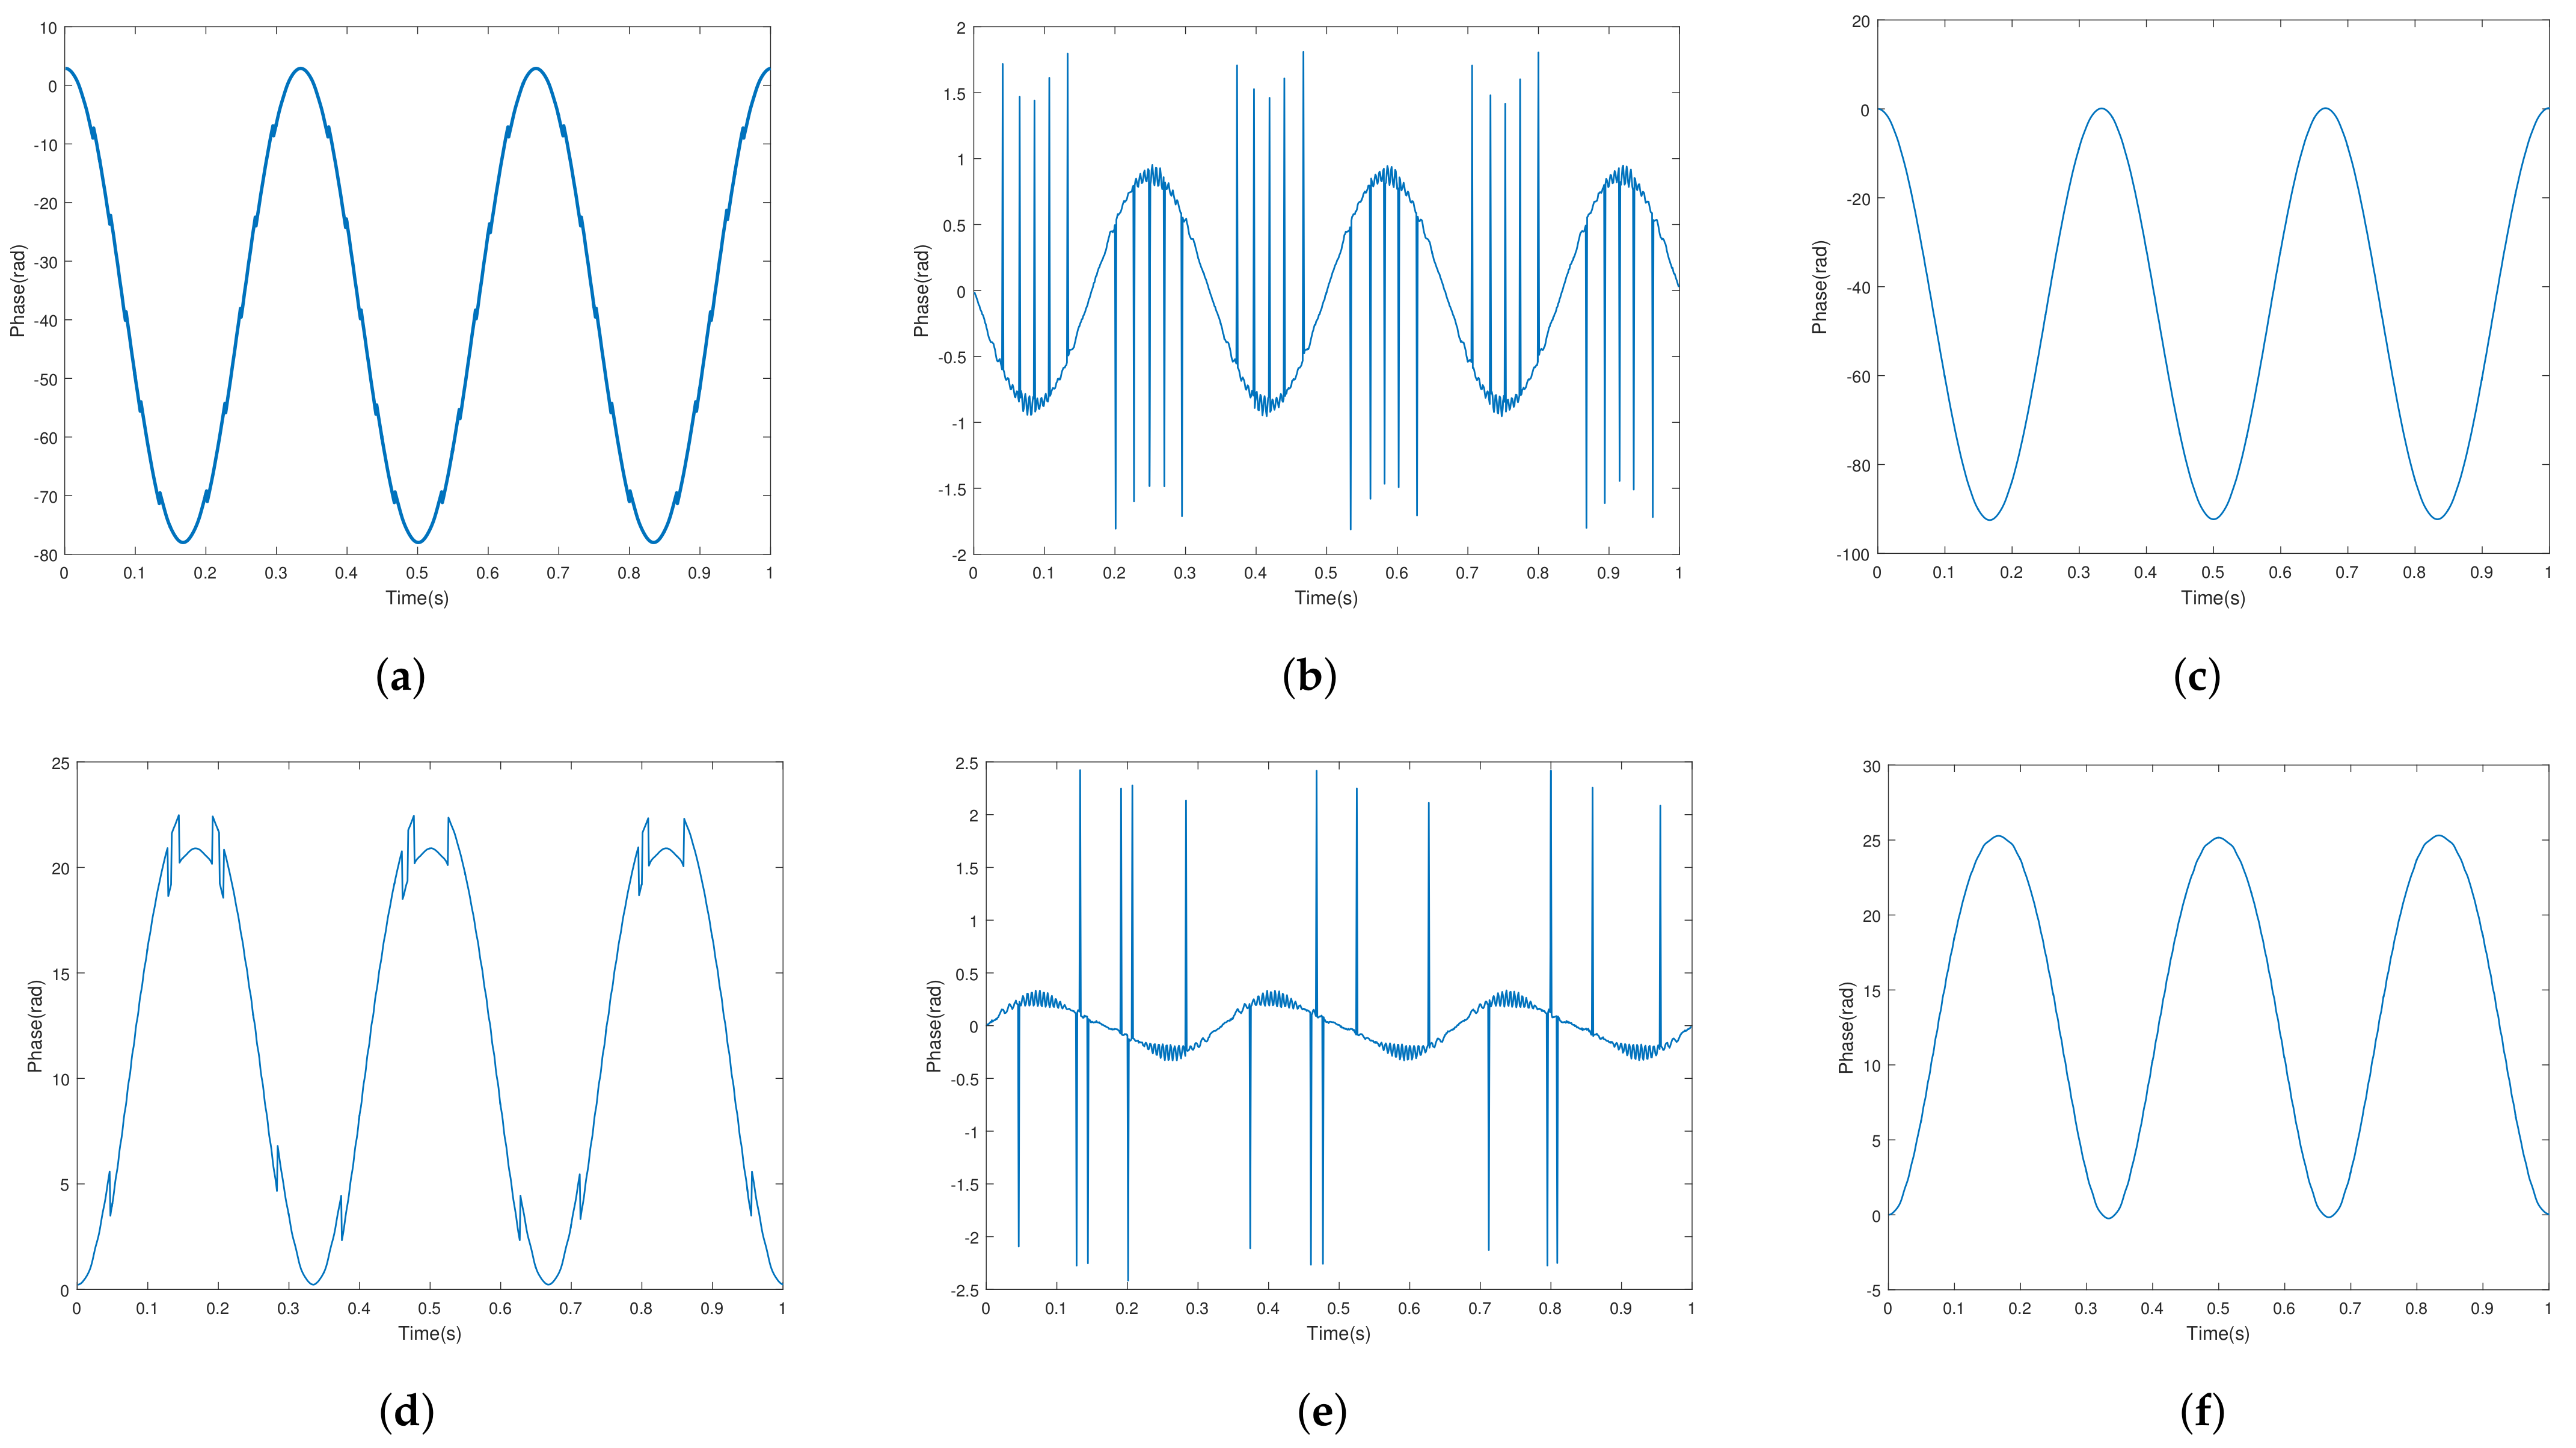
3.2. Micro-Curve Extraction

HRRP sequences can be used to distinguish different scattering points, but it is challenging to obtain the peak value for the envelop from numerous range-bins. As shown in (16), the energy distribution of the scattering points is close to sinc functions, and the peaks are sensitive to noise. Thus, it is required to determine the accurate scattering point position in each HRRP. The EEMDCAN has good time-frequency characteristics, so it is introduced to deal with the nonlinear and non-stationary signals. To reduce the interference of the residual noise remaining in the IMF component, positive and negative noises are added in the decomposition process of each layer of the EEMDCAN approach.
As shown in Figure 2, the proposed procedure is described in detail as follows.
Step 1: For each scattering point segment, select the peak as the estimated scattering point. As a result, we can obtain a rough envelop, namely, s ( m ) ,
s m = s 1 , s 2 , , s m .
Step 2: Add the pairs of positive and negative white noises 1 q a 0 n j m to the sequence s m , and the mixed signal s m + 1 q a 0 n j m is achieved. Perform EMD decomposition on the mixed signals, and stop the EMD decomposition immediately after filtering out the first IMFs,
s ( m ) + ( 1 ) q a 0 n j ( m ) = i m f 1 j ( m ) + l 1 j ( m ) ,
where q = 1 , 2 , j = 1 , 2 , , M / 2 , M represents the number of the added positive and negative white noises, and n j ( m ) denotes the jth white Gaussian noise. The ensemble mean i m f 1 ( m ) ¯ of all the i m f 1 j ( m ) can be calculated as
i m f 1 m ¯ = 1 M j = 1 M i m f 1 j m = s m 1 M j = 1 M l 1 j m .
Step 3: Subtracting i m f 1 ( m ) ¯ from s ( m ) and the achieved residual signal l 1 ( m ) is
l 1 m = s m i m f 1 m ¯ .
Define a k and E k as the standard deviation of the kth residual signal and IMF of the signal by the EMD, respectively. Add the pairs of positive and negative adaptive noises 1 q a 1 E 1 n j m to the residual signal l 1 m and then obtain the new signal l 1 m + 1 q a 1 E 1 n j m . Decomposing the new signal by EMD will achieve the second ensemble i m f 2 j m and the corresponding residual signal l 2 m , we have
l 1 m + 1 q a 1 E 1 n j m = i m f 2 j m + l 2 j m ,
l 2 m = l 1 m i m f 2 m ¯ .
Step 4: The pairs of positive and negative adaptive noises 1 q a k E k n j m are added to the residual signal to achieve the new signal l k m + 1 q a k E k n j m , where a k is usually chosen as 0.1 0.2 times of the standard deviation of the new residual signal l k m [28]. Then, the k + 1 -th ensemble i m f k + 1 m ¯ is
i m f k + 1 m ¯ = 1 M j = 1 M i m f k + 1 j m = l k m 1 M j = 1 M l k + 1 j m .
Step 5: Repeat step 4 until all modal components are extracted. With all the ensemble mean i m f k m ¯ , the final residual component L m is obtained as follows:
L m = s m k = 1 G i m f k m ¯ ,
where G is the total number of the ensemble mean of IMFs. We employ the modal amplitude and estimation function proposed by Rilling G. as the condition to terminate the decomposition [28].
After EEMDCAN decomposition, s ( m ) is decomposed into a series of modal components and residual components, merely IMF with ZCR greater than 10 is used to reconstruct the envelop.
s ^ m = s ^ 1 , s ^ 2 , , s ^ m = k = 1 D i m f k m ¯ ,
where D represents the maximum order of IMF that meets the threshold, and the corresponding ambiguous phase is
Φ ^ m = Φ s ^ 1 , Φ s ^ 2 , , Φ s ^ m = arctan I m s ^ 1 R e s ^ 1 , arctan I m s ^ 2 R e s ^ 2 , , arctan I m s ^ m R e s ^ m .
Next, the least-squares method [32] is employed to find the real phase Φ ˜ m . Then, the micro-curve can be estimated by the PDR as
R m = λ 4 π Φ ˜ m .

3.3. Micro-Motion Parameter Estimation

3.3.1. Precession Frequency Estimation

According to the works in [1], for the precession target, the micro-curve of predicted scattering points can be regarded as sinusoidal curves. The Fourier transform is performed to obtain the spectrum of the micro-curve:
F = FFT { s ^ ( m ) } ,
and the precession frequency is the frequency corresponding to the peak point [33].

3.3.2. Precession Angle Estimation

As the amplitude of the micro-curve is coupled with the precession angle, the height, and radius of the cone, the micro-curve is normalized to eliminate the influence of the amplitude factor. After excluding the influence of the amplitude factor, the spectrum amplitude of the micro-curve is only affected by the precession angle. If the estimated precession frequency is regarded as a known parameter, the precession angle estimation problem can be transformed into an optimization problem as
φ ^ = error φ F FFT s ^ ( m ) s ^ ( m ) ,
where φ ^ denotes the precession angle, which is usually less than 15 ° to ensure the stability of the target’s attitude.

3.3.3. Half-Cone Angle and Length of Busbar Estimation

As shown in Figure 1, the length of bus-bar S, half-cone angle, and the distance between the top and the bottom of the cone can be expressed as S = r 2 + H 2 , σ = arctan r / H , and ξ = R 1 R 3 = H cos γ t r sin γ t , and then
ξ max = S cos α φ + σ ,
ξ min = S cos α + φ + σ ,
S = ξ max ξ min 2 cos α + σ cos φ ,
ξ t = ξ max ξ min 2 cos α + σ cos φ cos γ t + σ ,
σ = arg min σ Γ σ 1 ,
Γ σ = R σ R ˜ ,
R σ = ξ σ | t 0 , ξ σ | t 1 , , ξ σ | t N ,
where (36) can be used to search the half cone angle, and R ˜ is the distance difference between two scattering points in the estimation micro-curve.

3.3.4. Cone Height and Base Radius Estimation

The cone height and the base radius can be obtained according to the properties of the geometric parameters,
H = S cos ( σ ) , r = S sin ( σ ) .

4. Simulations and Discussion

This section shows the numeric simulations carried out to evaluate the proposed method. The radar parameters and warhead parameters are shown in Table 1.

4.1. Scattering Point Separation

Figure 3 shows the HRRP sequences with SNR equal to 15 dB and it can be seen that the wideband radar can distinguish the scattering points. In addition, the cone target occupies some range bins due to its volume. Note that it is also possible to divide HRRP sequences into two parts: one contains the cone-top scattering point, and the other contains the cone-bottom scattering point.

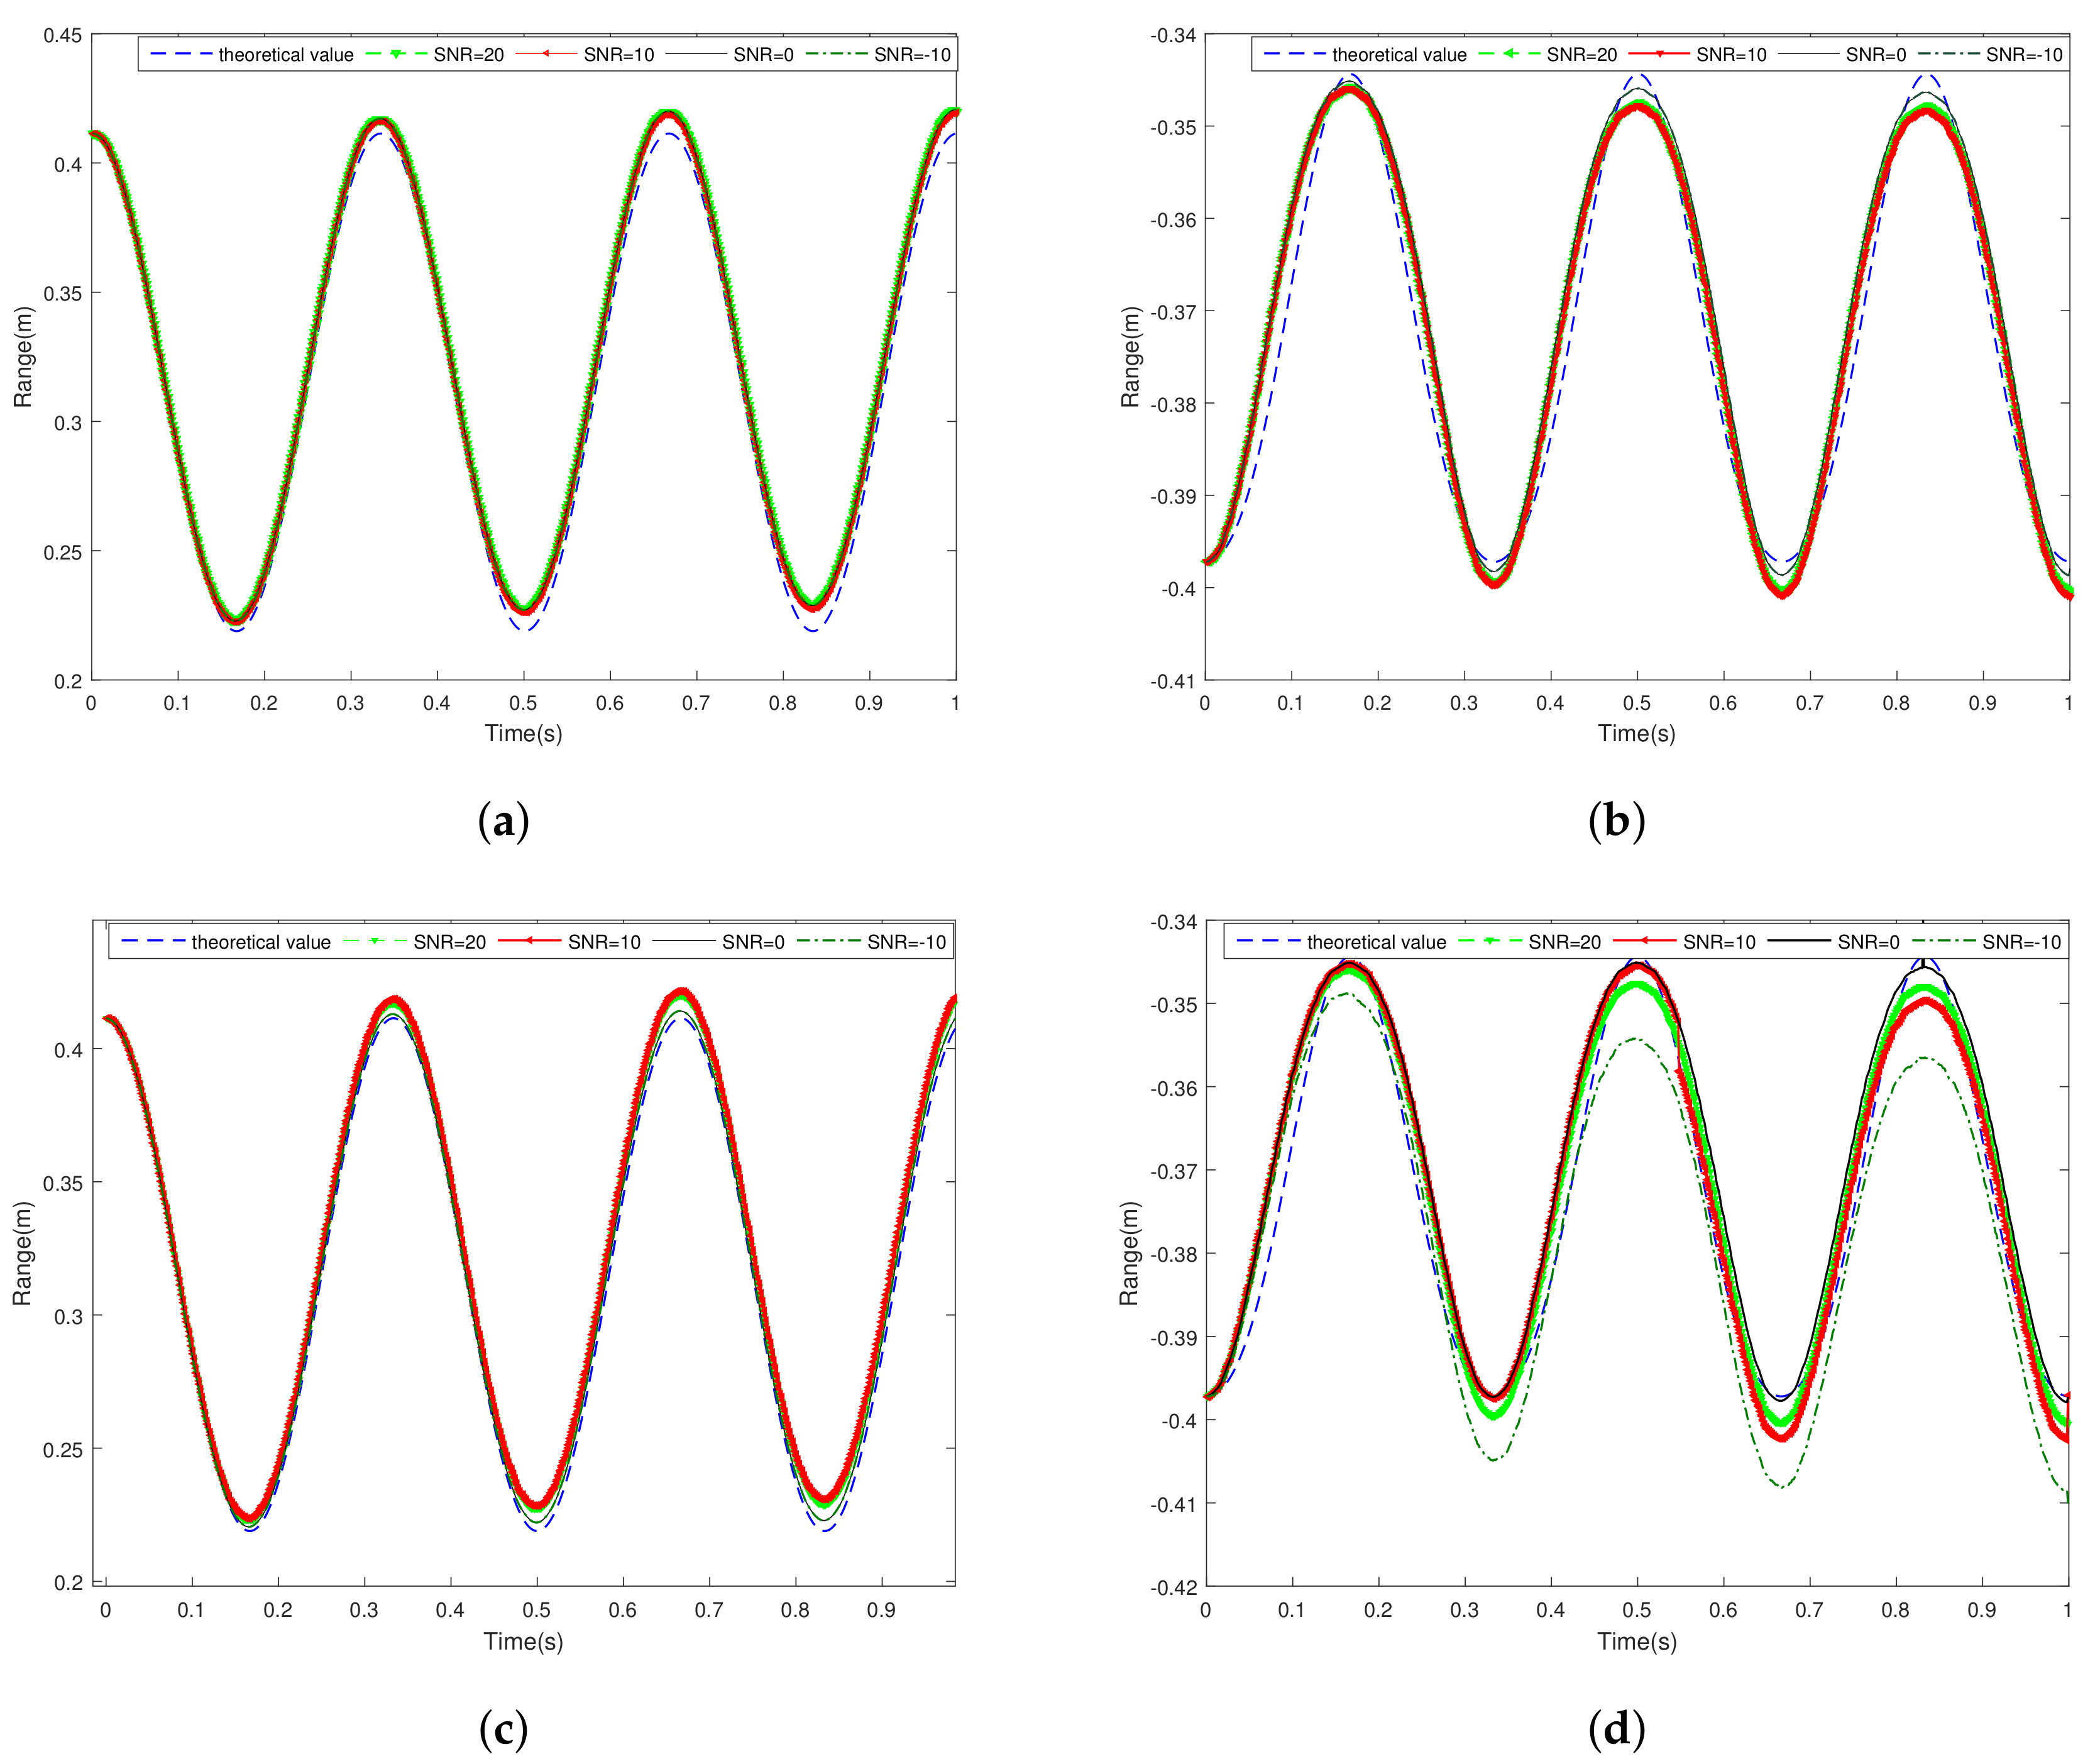
4.2. Micro-Curve Extraction

Micro-curve extraction is divided into two steps: one is envelop extraction, and the other is phase unwrapping. Envelop extraction includes peak signal decomposition and signal reconstruction. It can be observed from Figure 4 that the extracted peaks of the cone-top and cone-bottom scattering point exhibit nonlinear and non-stationary characteristics. We adopt the original EMD method and the EEMDCAN method to decompose the non-stationary peak envelops, and obtain the results shown in Figure 5. We can see that the first-order IMF contains the highest frequency energy, and there is no mode mixing in the decomposition process. However, as the red arrows indicate, the obtained IMF components by original EMD are obviously mixed with each other. With the obtained IMFs by EEMDCAN, we reconstruct the peak envelops, which are presented in Figure 4a,b as red dashed lines.
Based on the reconstructed envelops, we calculate the phase distributions in Figure 6a,d. When the range changing is greater than one range bin (i.e., c / 2 B ) in the radial range dimension, namely, across-range unit migration, phase increases by π or + π and consequently phase hopping occurs. Thus, phase compensation is required before the phase unwrapping to guarantee the accuracy. We calculate the phase difference between two adjacent HRRPs, and take the points where the difference is greater than 0.5 as phase hopping, as depicted in Figure 6b,e. Then, additional compensation of π or π is added and a smooth sine-like curve will be achieved, as shown in Figure 6c,f. Besides, Figure 7 depicts that the micro-curve extraction using the EMD and EEMDCAN methods with different SNR values. It can be observed that the micro-curves extraction using EEMDCAN method is much closer to the theoretical curve, compared to the one using the EMD method. Especially, when the SNRs is low, say 10 dB, the EEMDCAN method obviously outperforms the EMD method.

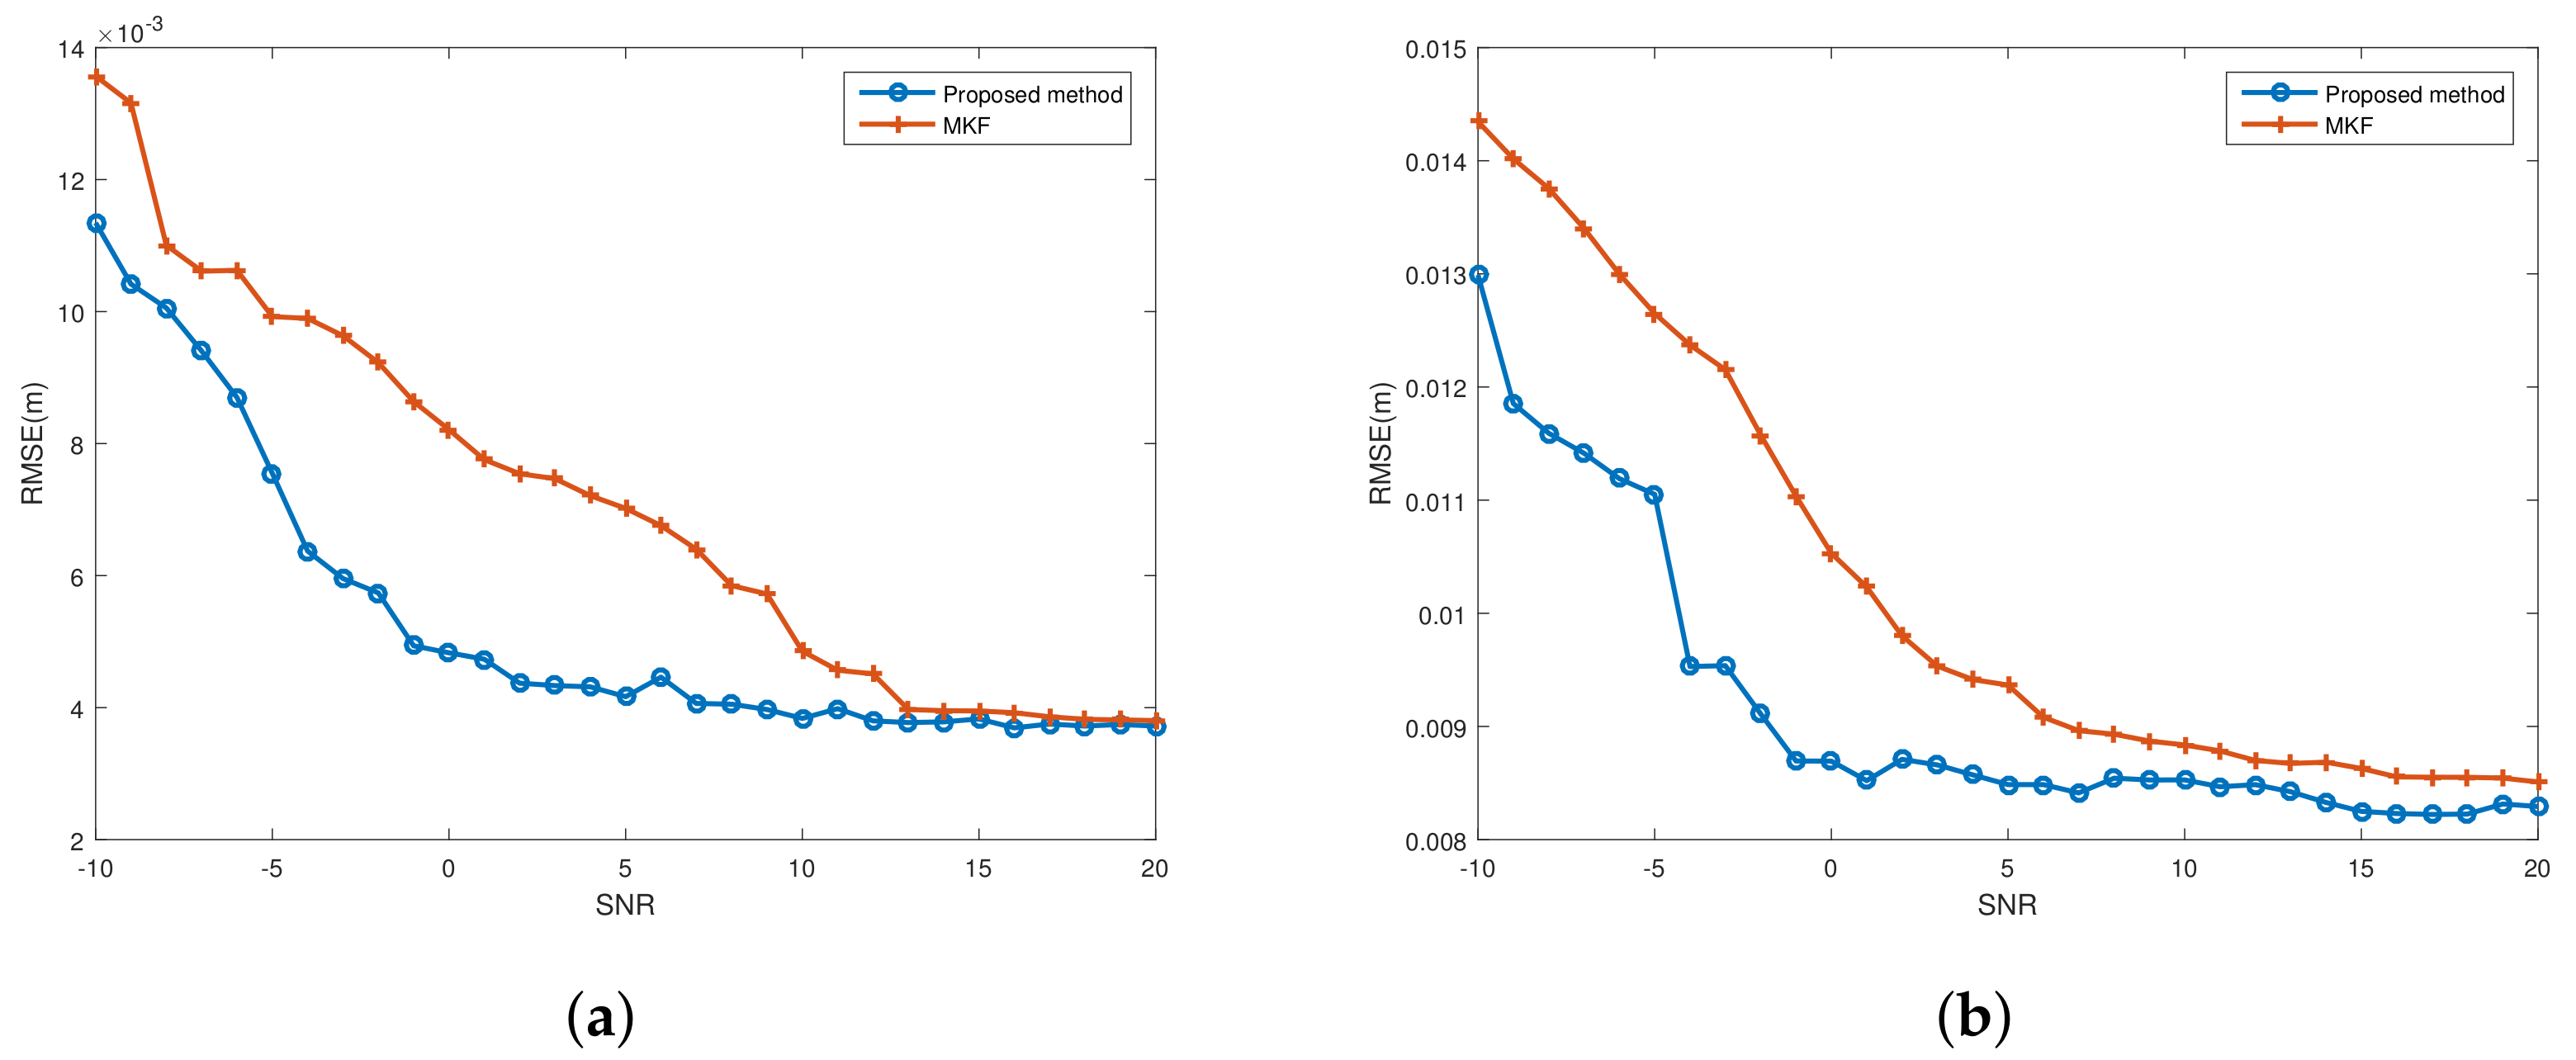
4.3. Parameters Estimation

With the extracted and unwrapped phase distribution curves via the EEMDCAN and EMD methods, we compare the estimated warhead cone parameters in Table 2, where 100 times Monte Carlo simulations are carried out for each SNR value. The results also validate that EEMDCAN outperforms EMD with higher accuracy.
We compare the proposed method with the modified Kalman filter (MKF) method proposed in [4] with the same parameters listed in Table 1. The RMSE with different SNRs are given in Figure 8, where the RMSE is obtained by
R M S E = 1 M m = 1 M ( r ( m ) s ^ ( m ) ) 2 ,
where r ( m ) and s ^ ( m ) denote the theoretical and estimated values of micro-curve, respectively.
In the simulation, the MKF method is used to fit envelops and calculate the ambiguous phases, and the least-square method is adopted to phase unwrapping. Finally, the PDR method is used to obtain the micro-curves. Both the MKF and the proposed methods achieved the sub-wavelength level accuracy.
It is shown in Figure 8 that the proposed method can achieve lower RMSE values, especially when SNR is low. Note that in [4], when using the MKF method to fit the envelop, it is assumed the Kalman filter is a constant velocity model, which may cause fitting distortion.

5. Conclusions

In this paper, we proposed an improved PDR method to conquer the difficulties in recognizing the true warheads using wideband radar with low SNRs. Specifically, the proposed method can adaptively estimate the envelop according to the characteristics of the signal. Even when the SNR is lower than 5 dB, this method can still estimate the envelop with high accuracy at a sub-wavelength level. Numerical simulations validate the anti-noise performance and robustness of the proposed method. The directions of future research could be on the scenario where scattering points are not distinguishable.

Author Contributions

N.Z. developed most of the methodology and validated the results. J.H., Y.Z. and W.W. provided valuable suggestions for the research. S.X. and Z.C. supervised the project and provided valuable advice on conducting the work. All authors contributed to writing the final manuscript. All authors have read and agreed to the published version of the manuscript.

Funding

This research received no external funding.

Data Availability Statement

Not applicable.

Acknowledgments

The authors would like to thank Lei Zhang, Congduan Li, Xueqing Fang, Guanghui Wu, and Xiping Sun for their valuable suggestions and technical supports. This work was supported by Shenzhen Science and Technology Program (Grant No. KQTD20190929172704911).

Conflicts of Interest

The authors declare no conflict of interest.

References

  1. Zhuo, Z.Y.; Zhou, Y.; Du, L.; Ren, K.; Li, Y. A Noise Robust Micro-Range Estimation Method for Precession Cone-Shaped Targets. Remote Sens. 2021, 13, 1820. [Google Scholar] [CrossRef]
  2. Choi, O.; Park, S.H.; Kim, M.; Kang, K.B.; Kim, K.T. Efficient Discrimination of Ballistic Targets with Micromotions. IEEE Trans. Aerosp. Electron. Syst. 2020, 56, 1243–1261. [Google Scholar] [CrossRef]
  3. Li, W.J.; Fan, H.Y.; Ren, L.X.; Mao, E.K.; Liu, Q.H. A High-Accuracy Phase-Derived Velocity Measurement Method for High-Speed Spatial Targets Based on Stepped-Frequency Chirp Signals. IEEE Trans. Geosci. Remote Sens. 2021, 59, 1999–2014. [Google Scholar] [CrossRef]
  4. Ren, K.; Du, L.; Lu, X.F.; Zhuo, Z.Y.; Li, L. Instantaneous Frequency Estimation Based on Modified Kalman Filter for Cone-Shaped Target. Remote Sens. 2020, 12, 2766. [Google Scholar] [CrossRef]
  5. Zeng, Z.X.; Amin, M.G.; Shan, T. Arm Motion Classification Using Time-Series Analysis of the Spectrogram Frequency Envelopes. Remote Sens. 2020, 12, 454. [Google Scholar] [CrossRef] [Green Version]
  6. He, Y.; Li, X.; Jing, X. A Mutiscale Residual Attention Network for Multitask Learning of Human Activity Using Radar Micro-Doppler Signatures. Remote Sens. 2019, 11, 2584. [Google Scholar] [CrossRef] [Green Version]
  7. Liu, Y.X.; Zhu, D.K.; Li, X.; Zhuang, Z.W. Micromotion Characteristic Acquisition Based on Wideband Radar Phase. IEEE Trans. Geosci. Remote Sens. 2014, 52, 3650–3657. [Google Scholar] [CrossRef]
  8. Chen, V.C.; Li, F.; Ho, S.-S.; Wechsler, H. Micro-Doppler effect in radar: Phenomenon, model, and simulation study. IEEE Trans. Aerosp. Electron. Syst. 2006, 42, 2–21. [Google Scholar] [CrossRef]
  9. Liu, L.H.; Zhuang, W.; Hu, W.D. Precession Period Extraction of Ballistic Missile Based on Radar Measurement. In Proceedings of the 2006 CIE International Conference on Radar, Shanghai, China, 16–19 October 2006. [Google Scholar]
  10. Xiong, X.Y.; Liu, H.; Deng, Z.M.; Fu, M.Z.; Qi, W.; Zhang, Y.J. Micro-Doppler Ambiguity Resolution with Variable Shrinkage Ratio Based on Time-Delayed Cross Correlation Processing for Wideband Radar. IEEE Trans. Geosci. Remote Sens. 2019, 57, 1906–1917. [Google Scholar] [CrossRef]
  11. Yang, Q.; Deng, B.; Wang, H.Q.; Qin, Y.L.; Ding, W.X. Doppler aliasing free micro-motion parameter estimation algorithm based on the spliced time-frequency image and inverse Radon transform. In Proceedings of the International Conference on Information and Communications Technologies (ICT), Nanjing, China, 15–17 May 2014; pp. 1–6. [Google Scholar]
  12. Tan, R.; Lim, H.S.; Smits, A.B.; Harmanny, R.I.A.; Cifola, L. Improved micro-Doppler features extraction using Smoothed-Pseudo Wigner-Ville distribution. In Proceedings of the 2016 IEEE Region 10 Conference (TENCON), Singapore, 22–25 November 2016. [Google Scholar]
  13. Chen, H.Y.; Liu, Y.X.; Liang, W.D. A New Approach for Synthesizing Range Profile of Moving Target via Stepped-Frequency Waveforms. IEEE Geosci. Remote Sens. Lett. 2006, 3, 406–409. [Google Scholar] [CrossRef]
  14. Yang, T.; Wang, S.R.; Li, M.M.; Chen, R.S. Electromagnetic Analysis and Micro-motion Parameters Extraction of Moving Targets. In Proceedings of the 2020 Cross Strait Radio Science & Wireless Technology Conference (CSRSWTC), Fuzhou, China, 13–16 December 2020. [Google Scholar]
  15. He, S.S.; Zhou, J.X.; Zhou, J.X.; Fu, Q. Using HRRP Sequence to Estimate the Precession Parameters of Mid-course Target. Signal Process. 2009, 25, 925–929. [Google Scholar]
  16. Li, X.C.; Li, B.; Hu, J.; Song, Y. Review for Feature Extraction of Ballistic Targets Based on HRRP. Mod. Def. Technol. 2015, 43, 142–150. [Google Scholar]
  17. Zhu, D.K.; Liu, Y.X.; Huo, K.; Li, X. A Novel High-Precision Phase-Derived-Range Method for Direct Sampling LFM Radar. IEEE Trans. Geosci. Remote Sens. 2016, 54, 1131–1141. [Google Scholar] [CrossRef]
  18. Mehrholz, D. Radar Techniques for the Characterization of Meter-Sized Object in Space. Adv. Space Res. 2001, 28, 1259–1268. [Google Scholar] [CrossRef]
  19. Chen, V.C.; Ling, H. Time-Frequency Transforms for Radar Image and Signal Analysis; Artech House: Boston, MA, USA, 2002; pp. 174–192. [Google Scholar]
  20. Xiong, X.Y.; Deng, Z.M.; Qi, W.; Ou, H.; Cui, Z.J. A Novel High-Precision Range Estimation Method Based on Phase of Wideband Radar Echo. IEEE Trans. Geosci. Remote Sens. 2019, 57, 3392–3403. [Google Scholar] [CrossRef]
  21. Camp, W.W.; Mayhan, J.T.; O’Donnell, R.M. Wideband radar for ballistic missile defense and Range-Doppler imaging for satellites. Linc. Lab. J. 2000, 12, 267–280. [Google Scholar]
  22. Xu, X.G.; Feng, C.Q.; He, S.S. A Method for the Micro-Motion Signal Separation and Micro-Doppler Extraction for the Space Precession Target. IEEE Access 2020, 8, 130392–130404. [Google Scholar] [CrossRef]
  23. Jin, J.W.; Ruan, H.L.; Sun, B. Micro-Doppler Period Estimation of Ballistic Targets Based on Circular Average Magnitude Difference Coefficients. In Proceedings of the 2020 International Conference on Information Science, Parallel and Distributed Systems (ISPDS), Xi’an, China, 14–16 August 2020. [Google Scholar]
  24. Huang, N.E.; Shen, Z.; Long, S.R.; Wu, M.C.; Shih, H.H.; Zheng, Q.; Yen, N.-C.; Tung, C.C.; Liu, H.H. The empirical mode decomposition and the Hilbert spectrum for nonlinear and non-stationary time series analysis. Math. Phys. Eng. Sci. 1988, 454, 903–995. [Google Scholar] [CrossRef]
  25. Oh, B.S.; Guo, X.; Wan, F.Y.; Toh, K.A.; Lin, Z.P. Micro-Doppler Mini-UAV Classification Using Empirical-Mode Decomposition Features. IEEE Trans. Geosci. Remote Sens. Lett. 2018, 15, 227–231. [Google Scholar] [CrossRef]
  26. Li, F.; Xiong, J.J.; Lan, X.H.; Bi, H.K.; Chen, X. NSHV trajectory prediction algorithm based on aerodynamic acceleration EMD decomposition. J. Syst. Eng. Electron. 2021, 32, 103–117. [Google Scholar]
  27. Huang, W.W.; Cai, N.; Xie, W.; Ye, Q.; Yang, Z.J. ECG Baseline Wander Correction Based on Ensemble Empirical Mode Decomposition with Complementary Adaptive Noise. J. Med. Imaging Health Inform. 2015, 5, 1796–1799. [Google Scholar] [CrossRef]
  28. Rilling, G.; Flandrin, P.; Goncalves, P. On empirical mode decomposition and its algorithms. In Proceedings of the IEEE-EURASIP workshop on Nonlinear Signal and Image Processing NSIP-03, Grado, Italy, 8–11 June 2003. [Google Scholar]
  29. Gao, H.W.; Xie, L.G.; Wen, S.L.; Kuang, Y. Micro-Doppler signature extraction from ballistic target with micro-motion. IEEE Trans. Aerosp. Electron. Syst. 2010, 46, 1969–1981. [Google Scholar] [CrossRef]
  30. Bai, X.; Zheng, B. Imaging of rotation-symmetric space targets based on electromagnetic modeling. IEEE Trans. Aerosp. Electron. Syst. 2014, 50, 1680–1689. [Google Scholar]
  31. Li, X.L.; Cui, G.L.; Kong, L.J.; Yi, W. Fast non-searching method for maneuvering target detection and motion parameters estimation. IEEE Trans. Signal Process. 2016, 64, 2232–2244. [Google Scholar] [CrossRef]
  32. Fried, D.L. Least-Square Fitting a Wave-Front Distortion Estimate to an Array of Phase-Difference Measurements. J. Opt. Soc. Am. 1977, 67, 370–375. [Google Scholar] [CrossRef]
  33. Wei, J.Q.; Zhang, L.; Liu, H.W.; Zhou, Y.J. Micro-motion and gemetric parameters estimation of wide-band radar cone-shaped targets based on phase-derived range. J. Electron. Inf. Technol. 2018, 40, 2227–2234. [Google Scholar]
Figure 1. Target model: (a) cone target model and (b) target micro-motion model.
Remotesensing 13 03545 g001
Figure 2. Flowchart of the proposed method.
Remotesensing 13 03545 g002
Figure 3. HRRP sequences.
Remotesensing 13 03545 g003
Figure 4. Envelop extraction: (a) the cone-top scattering point and (b) the cone-bottom scattering point.
Remotesensing 13 03545 g004
Figure 5. Decomposition process: (a) the cone-top scattering point decomposition using EEMDCAN method, (b) the cone-bottom scattering point decomposition using EEMDCAN method, (c) the cone-top scattering point decomposition using original EMD method, and (d) the cone-bottom scattering point decomposition using original EMD method.
Remotesensing 13 03545 g005
Figure 6. Phase hopping phenomenon: (a) phase distributions of the cone-top scattering point; (b) the difference between two adjacent pulse of panel (a); (c) phase after compensation of panel (a); (d) phase distributions of the cone-bottom scattering point; (e) the difference between two adjacent pulse of panel (d); (f) phase after compensation of panel (d).
Remotesensing 13 03545 g006
Figure 7. Comparison of the estimated value with the theoretical value for phase ranging: (a) the cone-top scattering point using EEMDCAN method; (b) the cone-bottom scattering point using EEMDCAN method; (c) the cone-top scattering point using original EMD method; (d) the cone-bottom scattering point using original EMD method.
Remotesensing 13 03545 g007
Figure 8. RMSE comparison of the proposed method with MKF method under different SNR conditions: (a) the cone-top scattering point and (b) the cone-bottom scattering point.
Remotesensing 13 03545 g008
Table 1. Simulation parameters.
ParametersValues
warheadcone height H0.96 m
distance between the mass center and the cone top h0.64 m
base radius of cone r0.25 m
spin frequency f s 4 Hz
conic rotation frequency f z 2 Hz
precession angle φ 10 °
radarcarrier Frequency f c 10 GHz
bandwidth B2 GHz
pulse width t p 10 us
pulse repetition period p r f 1 kHz
dwell time T1 s
Table 2. The error rate (%) comparison of the EEMDCAN with EMD methods under different SNR conditions.
SNR (dB)MethodsP θ σ sHr
30EEMDCAN00.880.851.691.340.79
EMD02.633.462.672.362.80
25EEMDCAN00.900.861.691.750.84
EMD02.653.382.802.803.15
20EEMDCAN00.890.831.671.720.83
EMD02.643.713.743.183.23
15EEMDCAN00.900.880.171.740.81
EMD05.905.323.914.043.68
10EEMDCAN00.910.791.641.340.84
EMD07.505.983.094.313.76
5EEMDCAN01.153.780.100.163.12
EMD08.235.875.456.454.84
0EEMDCAN01.415.402.552.941.54
EMD010.6512.349.919.4111.34
−5EEMDCAN02.8130.7610.6212.7615.39
EMD011.2040.3513.3516.1316.19
−10EEMDCAN02.2133.568.0110.2921.15
EMD011.3442.4623.2821.1124.32
Publisher’s Note: MDPI stays neutral with regard to jurisdictional claims in published maps and institutional affiliations.

