
Assessing the Reliability of Satellite and Reanalysis Estimates of Rainfall in Equatorial Africa

Department of Earth, Ocean and Atmospheric Sciences, Florida State University, Tallahassee, FL 32306, USA
*
Author to whom correspondence should be addressed.
Remote Sens. 2021, 13(18), 3609; https://0-doi-org.brum.beds.ac.uk/10.3390/rs13183609
Submission received: 5 August 2021
/
Revised: 1 September 2021
/
Accepted: 5 September 2021
/
Published: 10 September 2021
Abstract
:This article examines the reliability of satellite and reanalysis estimates of rainfall in the Congo Basin and over Lake Victoria and its catchment. Nine satellite products and five reanalysis products are considered. They are assessed by way of inter-comparison and by comparison with observational data sets. The three locations considered include a region with little observational gauge data (the Congo), a region with extensive gauge data (Lake Victoria catchment), and an inland water body. Several important results emerge: for one, the diversity of estimates is generally very large, except for the Lake Victoria catchment. Reanalysis products show little relationship with observed rainfall or with the satellite estimates, and thus should not be used to assess rainfall in these regions. Most of the products either overestimate or underestimate rainfall over the lake. The diversity of estimates makes it difficult to assess the factors governing the interannual variability of rainfall in these regions. This is shown by way of correlation with sea-surface temperatures, particularly with the Niño 3.4 temperatures and with the Dipole Mode Index over the Indian Ocean. Some guidance is given as to the best products to utilize. Overall, any user must establish that the is product reliable in the region studied.

1. Introduction
Equatorial Africa has some of the world’s most interesting climate regimes, from the extreme thunderstorms of the Congo Basin to the extreme year-to-year variability of rainfall in eastern Africa. Unfortunately, in much of this region, precipitation gauge data have become increasingly scarce, so that there is an almost complete reliance on satellite products for the examination of interannual variability. In the study of equatorial Africa, two serious problems have emerged with respect to the satellite rainfall products. One is that the accuracy of the product is strongly dependent on gauge data incorporated into the development of the product [1,2]. A result of this is that the various satellite products give extremely diverse results in regions where gauge data are particularly scarce, such as the Congo Basin [3]. This holds true for reanalysis products as well [4]. The second problem is that the products which are strongly dependent on passive microwave data produce questionable results over the extensive lakes of eastern Africa [5]. The purpose of this article is to demonstrate the extent of these problems, to determine the most reliable products in these two regions, and to suggest some possible explanations and solutions for the diversity of the estimates.
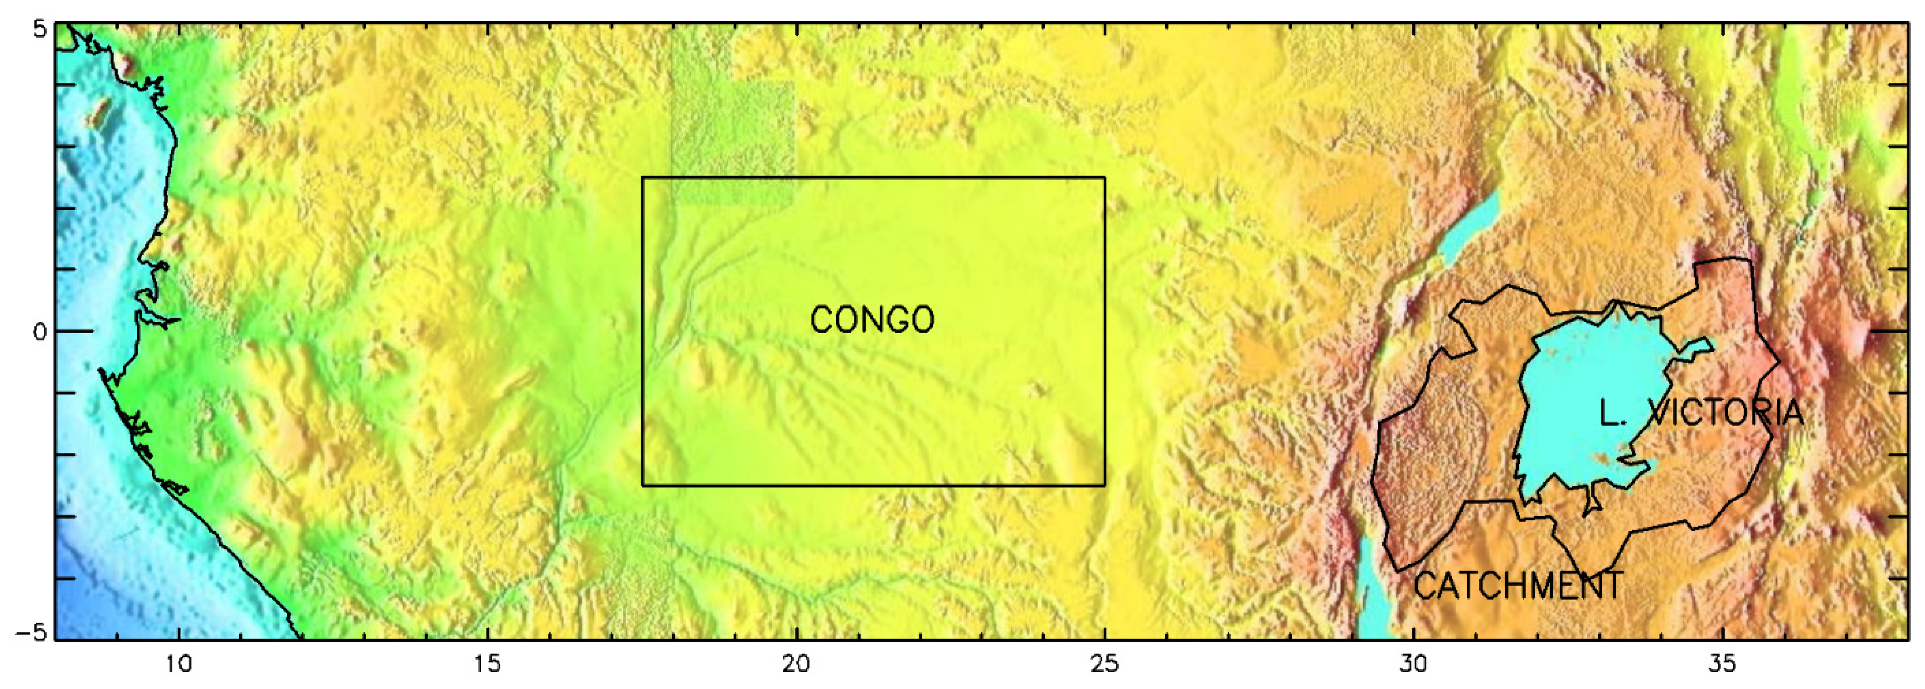
Two geographical areas are considered here (Figure 1). One is central equatorial Africa, in particular a region within the Congo Basin. Analysis in this area will serve to illustrate the diversity of estimates in an area without gauge coverage. The second is eastern Africa, with emphasis on the Lake Victoria region. This region will illustrate the difficulty of using satellite products to produce reliable estimates of over-lake rainfall. In both regions, an equatorial rainfall regime prevails, with two rainy seasons in the boreal spring and autumn. Both fall under the Tropical Forest (Af) classification of Köppen –Geiger. A difference between the two regions relates to topography. The Congo Basin region is one of relatively uniform topography. In contrast, the topography is quite complex over the Lake Victoria region. This presents special problems in the remote sensing of precipitation [6,7,8,9,10,11,12]. A second contrast is in gauge availability. While gauges are plentiful in the Lake Victoria region, the area defined in Figure 1 as the Congo Basin is almost devoid of stations. At the beginning of the analysis period, only four stations are available, and those lie along the western edge of the region. By the end of the analysis period, no stations exist in the region in the accessible station archives, such as the Global Precipitation Climatology Centre (GPCC).
Accurate monitoring of climate in equatorial Africa is of critical importance. The levels of Lake Victoria control the flow of the Nile [13], the waters of which sustain 300 million people. A one-meter change in lake level can modify Nile flow by 70 to 80% [14]. The region is considered to be a “hotspot” for climatic change, so that the climatic responses to global warming are a serious concern [13,15,16]. It is very likely that precipitation will be strongly affected [17,18,19]. Some changes have already been noted. An alarming decrease in productivity in the Congo rainforest starting around 2000 was noted by Zhou et al. [20] for the April-to-June season. Nicholson [21] noted a decrease in rainfall in this region starting in the late 1990s during both rainy seasons. In October and November of 2019, an unprecedented flood situation encompassed all of equatorial Africa, with rainfall 150–400% above normal over most of East Africa and the Guinea Coast [22].
The overall goal of this article is an inter-comparison of precipitation estimates from three types of sources: gauge data, satellite products, and reanalysis data sets. Secondly, the article shows how that diversity in the estimates makes it difficult to ascertain rainfall trends and factors in interannual variability. The data and methodology are described in Section 2. Section 3.1 and Section 3.2 presents mean rainfall, including the seasonal cycle. Section 3.3 examines interannual variability and trends, and well as the impact of the diverse rainfall estimates on the identification of causal factors in interannual variability. Section 4 discusses the overall performance of the various products. The results are summarized in Section 5, along with suggestions for improving the utility of the satellite products.
2. Materials and Methods
2.1. Data Sets
2.1.1. Overview
This study utilizes ten satellite rainfall products, four gauge products, and five Reanalysis products. The gauge products include the Global Precipitation Centre Climatology (GPCC), Centennial Trends (CenTrends), NIC131 gauge data, and NIC131-gridded. The reanalysis data sets include National Center for Environmental Prediction reanalysis version II (NCEP II), ECMWF Re-Analysis version 5 (ERA 5), Japanese 55-year Reanalysis (JRA 55), Climate Forecast System Reanalysis (CSFR), and Modern-Era Retrospective analysis for Research and Applications Version 2 (MERRA 2).
Several satellite rainfall products are based only on thermal infrared (IR) retrievals. These include Climate Hazards Group InfraRed Precipitation with Station Data Climatology Version 2 (CHIRPS2), African Rainfall Climatology version 2 (ARCv2), Tropical Applications of Meteorology using SATellite Data and Ground-Based Observations (TAMSAT3) and Precipitation Estimation from Remotely Sensed Information using Artificial Neural Networks (PERSIANN-CDR). Other products merge thermal IR and microwave data: Tropical Rainfall Measuring Mission (TRMM) 3B43; Integrated Multi-satellitE Retrievals for GPM Final Product (IMERG-F), Climate Prediction Center (CPC) MORPHing technique (CMORPH CRT); CPC Merged Analysis of Precipitation (CMAP); CPC Rainfall Estimation (RFE) 2.0; The Global Precipitation Climatology Project (GPCP V3.1). Three of the products (ARCv2, RFE 2.0, TAMSAT3) cover solely the African continent and are produced primarily for drought monitoring.
Table 1 summarizes the characteristics of these products. The satellite products considered are those that have been used extensively to study rainfall over Africa. Most of the products are available since 1979 or 1983. However, TRMM 3B43, RFE 2.0, and CMORPH CRT have been available only since 1998. All are merged with gauge data or utilize gauge data for bias-adjustment. Table 1 also includes the extent to which gauge data, such as that from the Global Telecommunications System (GTS) or GPCC, have been incorporated into each product or used to adjust it.
2.1.2. Satellite Rainfall Products
The TRMM (Tropical Rainfall Measuring Mission) satellite was a joint mission between NASA and the Japanese Aerospace Exploration Agency. It was specifically designed to measure tropical rainfall globally. The product used here, 3B43 V7, is a monthly accumulation of 3B42 V7 product that merges precipitation estimates from several passive microwave products with microwave-calibrated infrared-based precipitation estimates and then performs bias adjustment using monthly accumulated rain gauge analysis from GPCC [23,24,25]. TRMM 3B43 is a monthly product with a spatial resolution of 0.25 degrees. Data are available for 1998 through 2019. Several studies have shown good agreement between TRMM 3B42 and gauge data over equatorial Africa [26,27,28,29,30,31]. Guo and Liu [32] found that, when TRMM 3B42 values are aggregated to the monthly scale, they provide rainfall estimates extremely close to those of TRMM 3B43.
IMERG was developed within the Global Precipitation Measurement (GPM) mission as the successor to TRMM. It combines Passive Microwave (PMW) satellite retrievals from whichever constellation of satellites is operating in earth’s orbit at a given time and location to estimate precipitation over the majority of the earth’s surface [33]. Precipitation estimates are derived from a fully parametric retrieval algorithm based on PMW brightness temperature (GPROF). The PMW estimates are also merged with Infrared (IR) estimates and are eventually calibrated and merged with gauge data. The current algorithm fuses the early precipitation estimates collected in 2000–2014 from the TRMM satellite with more recent estimates collected from the GPM Core Observatory satellite, launched in 2014. These serve as both input and calibrators. However, the bulk of the input data is from the constellation of other PMW sensors, with geo-Infrared fill-in. IMERG V06B has a 0.1 degree and half hour resolution. Here, we use the Final run (IMERG-F), which has gauge-adjusted estimates based on GPCC. Data are available for 2001 to 2021.
CHIRPS2 [34] is based on thermal infrared (IR) brightness temperature from geostationary satellites. It has a spatial resolution of 0.05 degrees and a daily temporal resolution. CHIRPS2 begins in 1981 and extends to the present time. It is a result of a collaboration between the University of California at Santa Barbara and USGS. CHIRPS2 is based on cold-cloud duration from two geosynchronous thermal IR archives produced by NOAA. One is the 1981–2008 Globally Gridded Satellite (GridSat) produced by the National Climate Data Center, the second is the 2000–present NOAA Climate Prediction Center dataset (CPC 4 km Merged IR). The thermal IR data are merged with African gauge data, using ‘smart’ interpolation techniques that take the spatial correlation structure into account. The CHIRPS2 data have low bias and better gauge coverage over Africa compared to other similar products [27].
PERSIANN-CDR [35] is also based on geostationary thermal IR brightness temperature, with a neural network approach applied to produce the precipitation estimates. The product is calibrated using NCEP/NCAR precipitation forecasts. It is bias-corrected with GPCP precipitation estimates on a monthly basis, such that PERSIANN-CDR and GPCP monthly totals are consistent. Its spatial resolution is 0.25 degrees. Data are available for 1983 through to the present time.
GPCP was originally produced by NASA’s Goddard Space Center [36] but is now being produced by NOAA/University of Maryland. As with TRMM 3B43, it merges microwave and infrared estimates from polar orbiting and geostationary satellites, but from a different constellation of sensors. It is also a monthly product, though has a spatial resolution of 2.5 degrees. GPCP V3.1 is available from 1979 and it does not utilize data from TRMM instruments, which do not commence until 1998. It is adjusted with gauge data from GPCC.
NOAA’s Climate Prediction Center (CPC) provides two rainfall products for Africa only, namely RFE and ARC. RFE 2.0 is based on three satellite products [37,38,39]; daily gauge data from the Global Telecommunications System (GTS) are used to correct the bias. The satellite products include: (1) IR data from the Geosynchronous Operational Environmental Satellite (GOES) precipitation index (GPI); (2) Passive microwave estimates from the Special Sensor Microwave Imager (SSM/I); (3) Advanced Microwave Sounding Unit (AMSU) microwave estimates of rainfall. The GPI is based on IR cloud-top temperature from Meteosat, which is centered over Africa. A daily product is produced with a spatial resolution of 0.1 degrees. The ARCv2 (version 2) product has the same spatial and temporal resolution. The main difference between RFE 2.0 and ARCv2 data is that the algorithm used to produce the latter does not contain microwave data [40]. RFE 2.0 runs from 2000 to present and ARCv2 runs from 1983 to present.
CPC also provides two global products: CMORPH and CMAP. The former “morphs” high quality passive microwave estimates from several low orbiting satellites with high spatial and temporal resolution IR data to yield information for the time period between microwave sensor scans [41]. The final product is half-hourly precipitation estimates. The current study uses the CMORPH CRT product, with bias removed via comparison with gauge data [42]. It is available from 1998. The raw CMORPH CRT product has been shown to have a positive bias over tropical land areas. CMAP [38] provides pentad and monthly analyses at a spatial resolution of 2.5 degrees. It is based on a merger of gauge data plus five infrared and microwave satellite estimates [38,43]. Satellite estimates provide the spatial pattern of rainfall and gauge data are used to calibrate the magnitude. IR data is from geostationary satellites as of 1986; previously, only outgoing longwave radiation (OLR) from polar orbiting satellites was used. An “enhanced” version, which is used here, utilizes NCEP/NCAR reanalysis data to fill in any gaps in coverage.
TAMSAT (Tropical Applications of Meteorology using Satellite Data and Ground-based Observations), produced at the University of Reading, utilizes thermal IR data from Meteosat, a geostationary satellite. It is based on two assumptions: that most rainfall over Africa results from convective clouds and that there is a linear relationship between cold-cloud duration and precipitation amount. The IR estimates are not merged with contemporaneous gauge data, but the product is calibrated with historical rain gauge data [44,45,46] It runs from 1983 to present. There are two versions of TAMSAT, with the second (TAMSAT3) designed to correct a dry-bias evident in the earlier version [47]. TAMSAT3 is used here.
2.1.3. Gauge Data Sets
Four gauge-data sets are used in this study, as each set provides different advantages in the two regions of study. Individual station records, such as those in the NIC131 gauge data set, provide the most direct estimate of rainfall. These are useful in creating multi-year maps in cases where the station network is relatively dense. Gridded products such as GPCC and NIC131-gridded facilitate spatial averaging, particularly in an area with very heterogeneous rainfall, such as over the Lake Victoria catchment. Centennial Trends has a very dense station network, and thus is very reliable, but it is only available for East Africa.
The NIC131 data set is Africa-wide and has been assembled over the years by the author. It has been used in numerous publications and is described in Nicholson [48] and Nicholson et al. [49]. The original data set extended only to 1998, but it was recently updated and now includes well over 2000 station records [50]. In the central equatorial region, the station number continually increased to nearly 1000 in the 1970s. Afterward, there was a long decrease then a sharp drop off after 2010. Similar trends are evident in other gauge data sets for Africa, such as CenTrends and GPCC [51]. The trend in the Lake Victoria catchment is similar, except that the number rose sharply around 1960 and decreased sharply starting in 1990. However, a recent update extended the data set in eastern Africa to 2019 [52].
Nicholson et al. [52] used the NIC131 data set to create a gridded data set for western and central equatorial Africa. It has a spatial resolution of 2.5 degrees of latitude and longitude and covers the period from 1921 to 2014. The gridding was not based on a simple spatial aggregation of the records but instead relied upon a spatial reconstruction technique based on principal components. This allowed for a complete spatial coverage in years with a sparse gauge network. The data set is based upon a total of 1826 gauge records in the analysis sector, of which only several hundred operate in recent years. In recent years, few stations are available over the Democratic Republic of the Congo (Figure 2), the heart of the Congo Basin and Congo rain forest, so that, in this region, its reliability since around 2010 is questionable.
The GPCC Full Data Monthly Product version 7 (GPCC V7) is produced by the German Weather Service (DWD) under the auspices of the World Meteorological Organization. It is a gridded product available at spatial resolutions of 0.5 × 0.5, 1.0 × 1.0, and 2.5 × 2.5 degrees [53]. GPCC V7 runs from 1901 through to the present date. The precipitation data are acquired by agreement with individual countries or from the Global Telecommunications System (GTS).
The CenTrends data set, also a gridded product, is produced by the US Geological Survey/UC Santa Barbara Climate Hazards Group [51]. Coverage is restricted to eastern Africa (−15S to 18N, 28E to 54E) and from the year 1900 to 2014. It is based on 634 stations. Roughly half that number are available in GPCC in the same area and time frame. CenTrends has a spatial resolution of 0.1 × 0.1 degrees.
These are the most extensive rainfall data sets for Africa, but they do not constitute all operative stations. Many countries do not disseminate their data or charge extremely high prices to obtain it. In some cases, however, the absence of gauge data is real. Examples of this are Angola and the Democratic Republic of the Congo, countries in which the meteorological services have all but ceased to operate for decades.
It should be noted that these four gauge-data sets are not completely independent. NIC131-gridded, of course, was created from NIC131. The NIC131 stations were also provided for the CenTrends data set, but the latter includes many additional stations. For the years up to 1998, the African portion of GPCC was largely NIC131. Since 1998, GPCC has relied mostly on data transmitted through the Global Telecommunications System (GTS), while NIC131 includes numerous updates obtained directly from the African meteorological services. Hence, there is considerable overlap in the stations incorporated into the four data sets, although, since 1998, GPCC and the “NIC” data sets are largely independent. Moreover, the processing is very different in the three gridded data sets, providing some degree of independence.
2.1.4. Reanalysis Data Sets
A reanalysis data set uses forecast models and data assimilation systems to analyze and merge irregular observations of the land, atmosphere, and oceans. These are “reanalyzed” or synthesized into a coherent and uniform gridded image or map of observational variables with spatial homogeneity, temporal continuity, and a multi-dimensional hierarchy [1].
Table 2 gives the temporal and spatial resolution of the five reanalysis products used here. All but ERA 5 and JRA 55 are relatively new products. ERA 5 replaces ERA Interim. NCEP II [54] covers the longest period, beginning in 1948. The disadvantage is its low spatial resolution, and 2.5 degrees of latitude and longitude. MERRA 2 [55], ERA 5 [56], JRA 55 [57], and CSFR [58] all have higher spatial resolution, and except for JRA 55, commence only in 1979 or 1980.
The reanalyses generally assimilate precipitation estimates from satellites, surface radar, and/or surface gauge data. However, the sources and approach to assimilation vary among the different reanalysis products. Hua et al. (2019) performed a validation of the reanalyses used here and considered the central equatorial Africa region. They found that, while the reanalyses could reproduce major features such as the seasonal cycle, they exhibit considerable spread in rainfall magnitude and spatiotemporal characteristics. The rainfall produced in the reanalyses is strongly dependent on the model’s hydrologic cycle and is also affected by model biases.
2.1.5. Other Data Sets
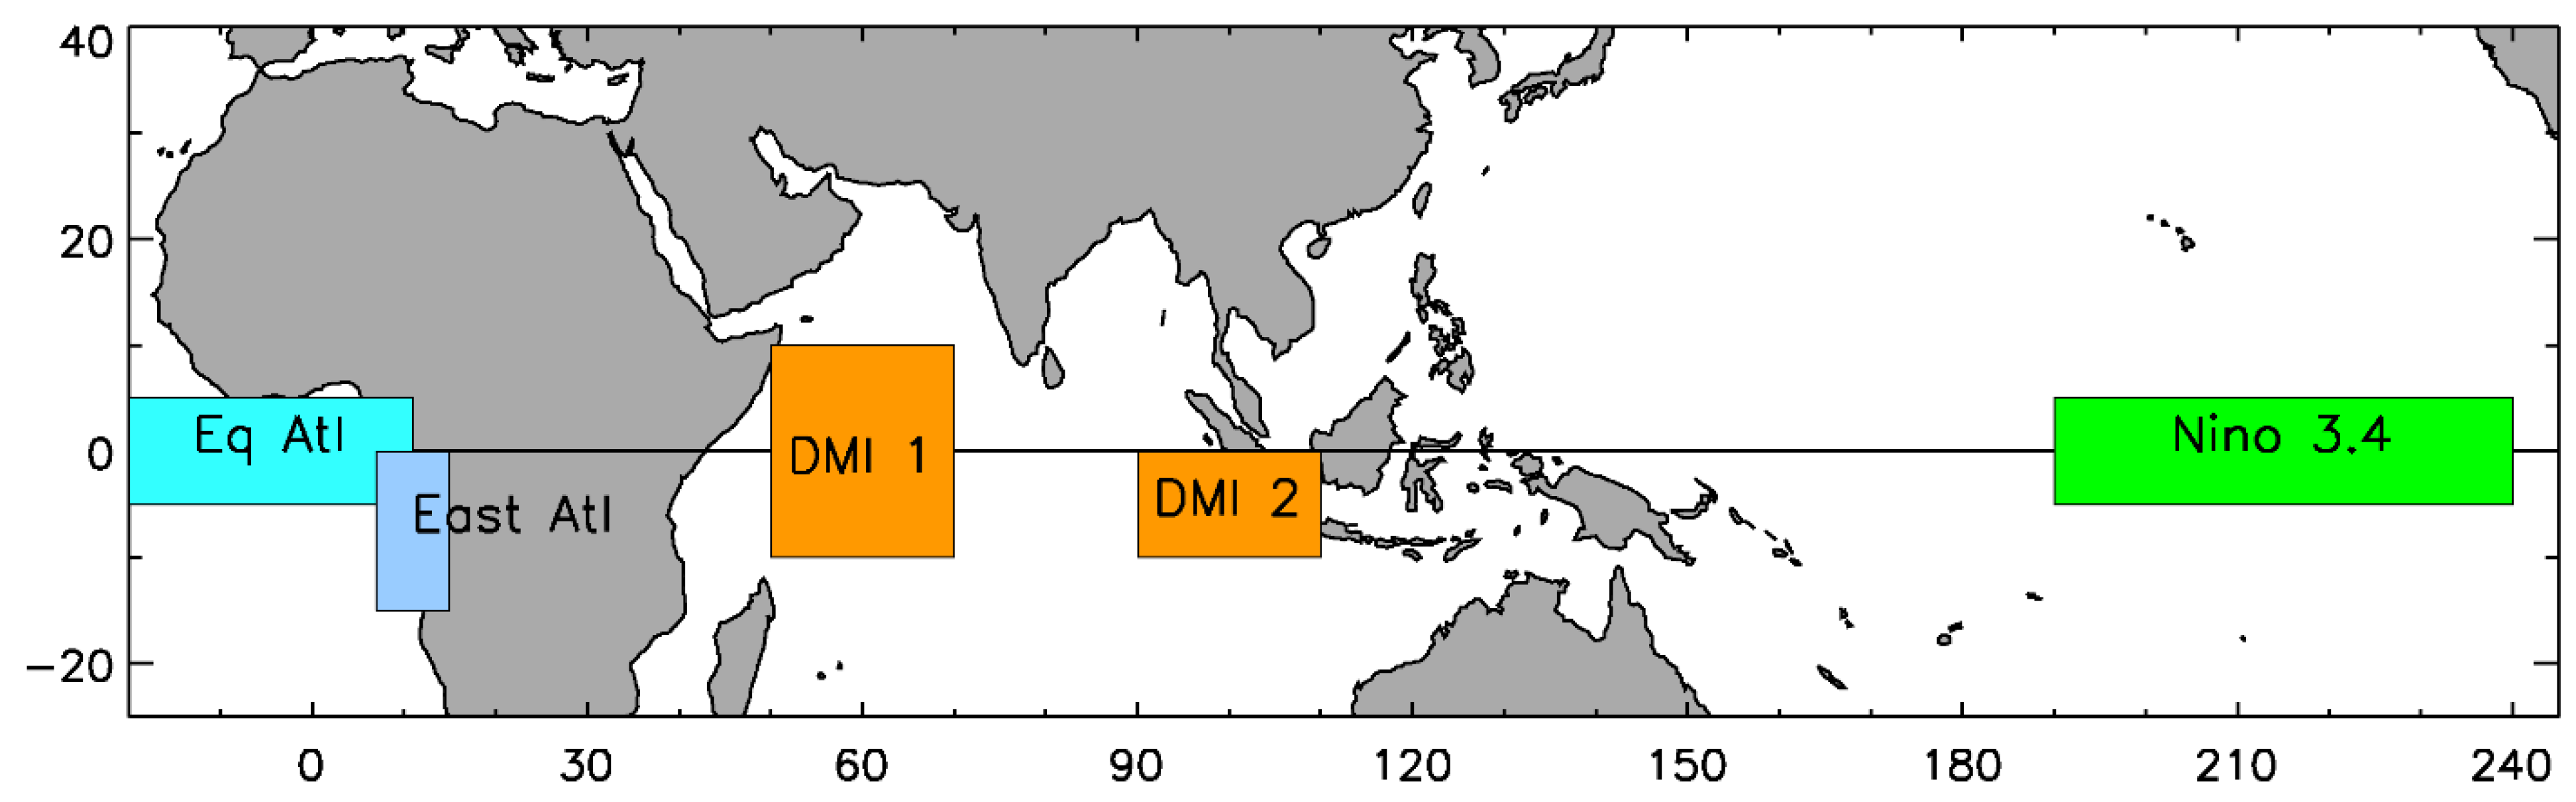
Additional data utilized are sea-surface temperatures (SSTs) and the Indian Ocean Dipole Index (DMI). SSTs were derived from the NOAA Extended Reconstructed SST (ERSST) V5 data set [59]. The DMI represents the anomalous SST gradient between the two Indian Ocean sectors: 50°E–70°E, 10°S–10°N and 90°E–110°E, 10°S–0°N [60].
2.2. Methodology
The goals of this study are to show the diversity of rainfall estimates produced by the various products, to illustrate the impact of gauge data on the reliability of satellite retrievals, and to demonstrate how this diversity hinders attempts to find causal factors in variability. The approach is somewhat different for central equatorial Africa and eastern Africa.
For both areas, long-term means were calculated from the various products. The long-term annual mean and the long-term mean for one wet month (November) were derived from all products. However, the contrasts among the products in November are similar to those evident in the annual maps, therefore only the annual maps are presented here. November is utilized because it is a wet month through the regions evaluated. In order to have a common period for the various products, the mean was calculated for the nineteen-year period from 2001 to 2019.
As described in Section 2.1.3, gauge coverage in these years is sparse. In order to obtain a reliable spatial picture from the gauge data, the maps for the recent years were compared with a NIC131 gauge average for an earlier time period with dense gauge coverage, namely 1945 to 1984. However, there is reasonable gauge coverage in the Lake Victoria catchment, therefore a map of NIC131 rainfall for the satellite period is presented. Twenty- and thirty-year means are relatively stable over time, though some changes in the magnitude of rainfall cannot be ruled out. Nevertheless, the spatial pattern can be assumed to be largely conservative. In addition to the comparison with NIC131, a comparison was also made with published maps for the two areas, including a map of rainfall over Lake Victoria itself.
To quantify the diversity of the various products, spatial averages were produced for three locations: the central Congo Basin, Lake Victoria, and Lake Victoria’s catchment. These locations are shown in Figure 1. The seasonal cycle at each location was also derived and compared for the various products.
A second type of analysis was year-to-year time series of rainfall, both for the year and for the month of November. These were produced for the aforementioned four regions. The analysis included a calculation of standard deviations and trends over the period of 2001 to 2019. Trends are often used in the evaluation of causal factors in variability or in changes in the vegetation density of productivity. For example, Zhou et al. [20] compared rainfall trends in the Congo Basin over the period of 2000 to 2012, with trends in such variables being related to vegetation productivity (e.g., vegetation index, ground and vegetation water storage, and vegetation optical depth).
The third analysis was correlation with potential causal factors of rainfall variability. The purpose was to demonstrate the difficulty of identifying causal factors because of the diversity in the estimates by the various rainfall sources. This was demonstrated using November rainfall and was considered.
The potential causal factors that were considered include two sectors of the equatorial Atlantic, the western Indian Ocean, Niño 3.4 sea-surface temperatures (SSTs), and the Indian Ocean Dipole Mode Index (DMI). All of these factors have been identified in past literature as possible factors in rainfall variability in the regions considered here. The SST locations are shown in Figure 2. Niño 3.4 is considered to be an index of the El Niño/Southern Oscillation phenomenon. The DMI is an indicator of the east–west temperature gradient across the tropical Indian Ocean, calculated as the difference between SSTs in the western tropical Indian Ocean and the southeast tropical Indian Ocean (see Figure 2). The DMI is known to be strongly correlated with rainfall in East Africa in the boreal autumn [61,62,63].
3. Results
3.1. Mean Rainfall
3.1.1. Central Equatorial Africa
Years ago, meteorological observations were plentiful in equatorial Africa. As some examples, Institut National pour l’Etude et la Recherche Agronomiques (INERA) operated 62 stations in the Democratic Republic of the Congo (DRC, formerly Zaire) during the 1950s and 1960s. The meteorological service operated 200 stations in the DRC, Rwanda, and Burundi. Well over one thousand stations operated in Kenya alone. Since the 1960s or 1970s, the number of stations has steadily decreased in the region. However, the data from the earlier years allows for a reliable picture of the spatial pattern of rainfall over equatorial Africa and its magnitude.
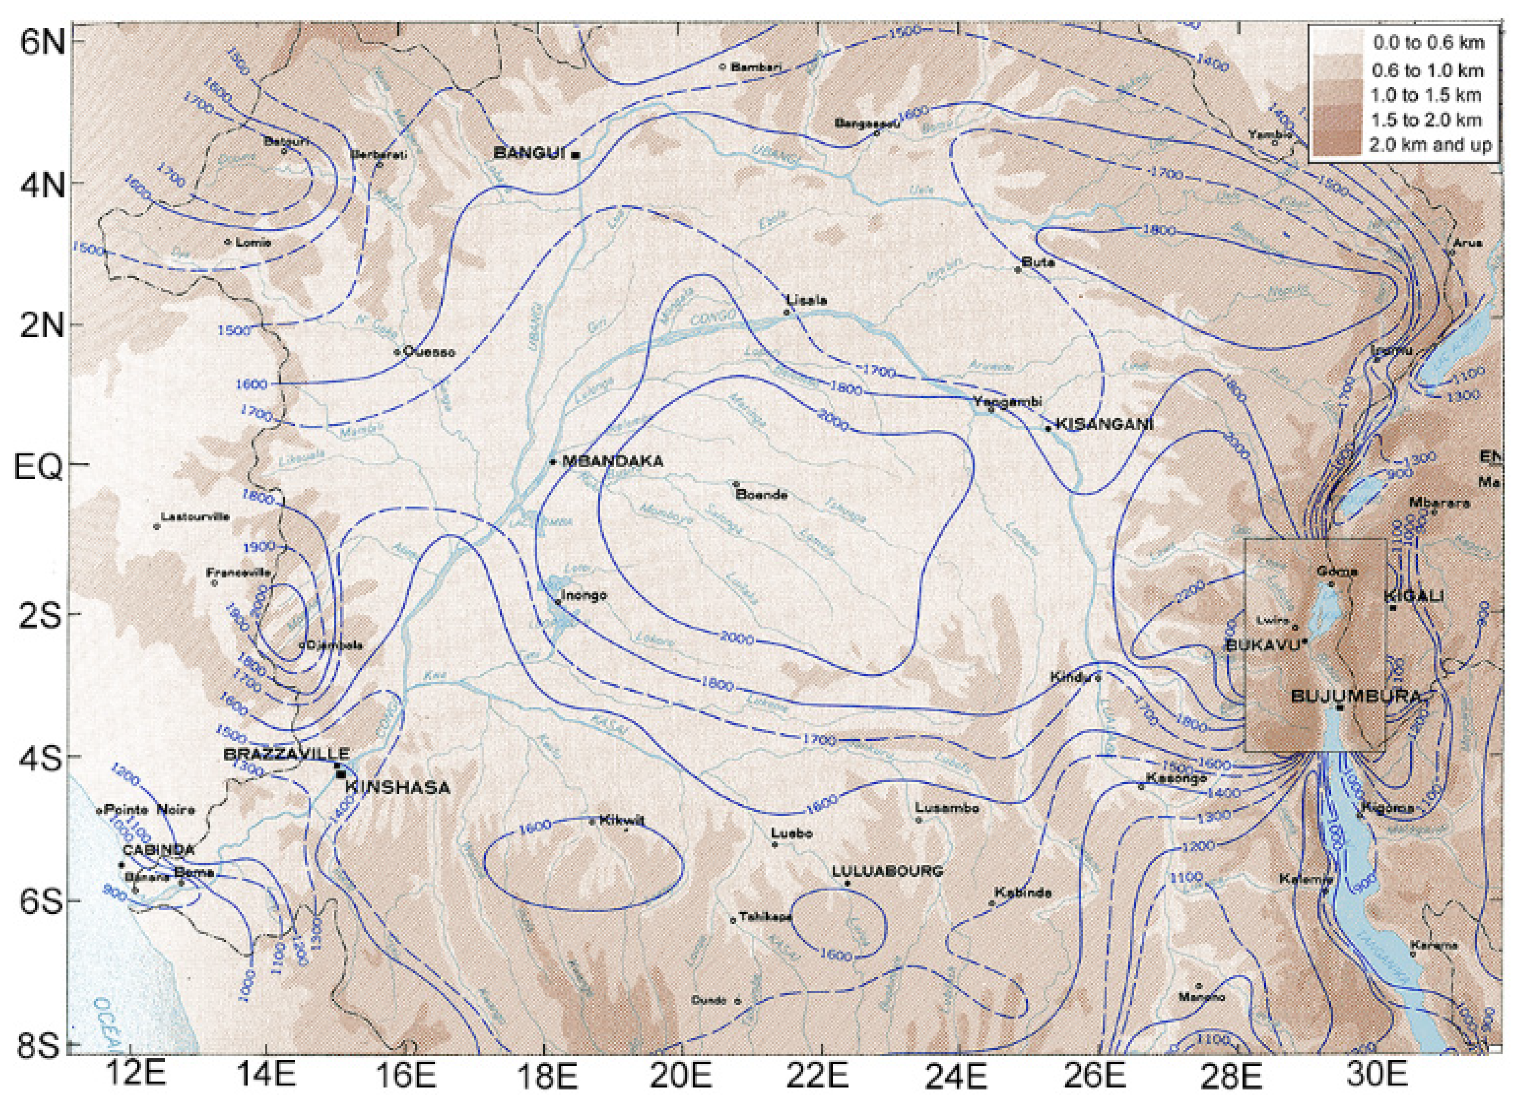
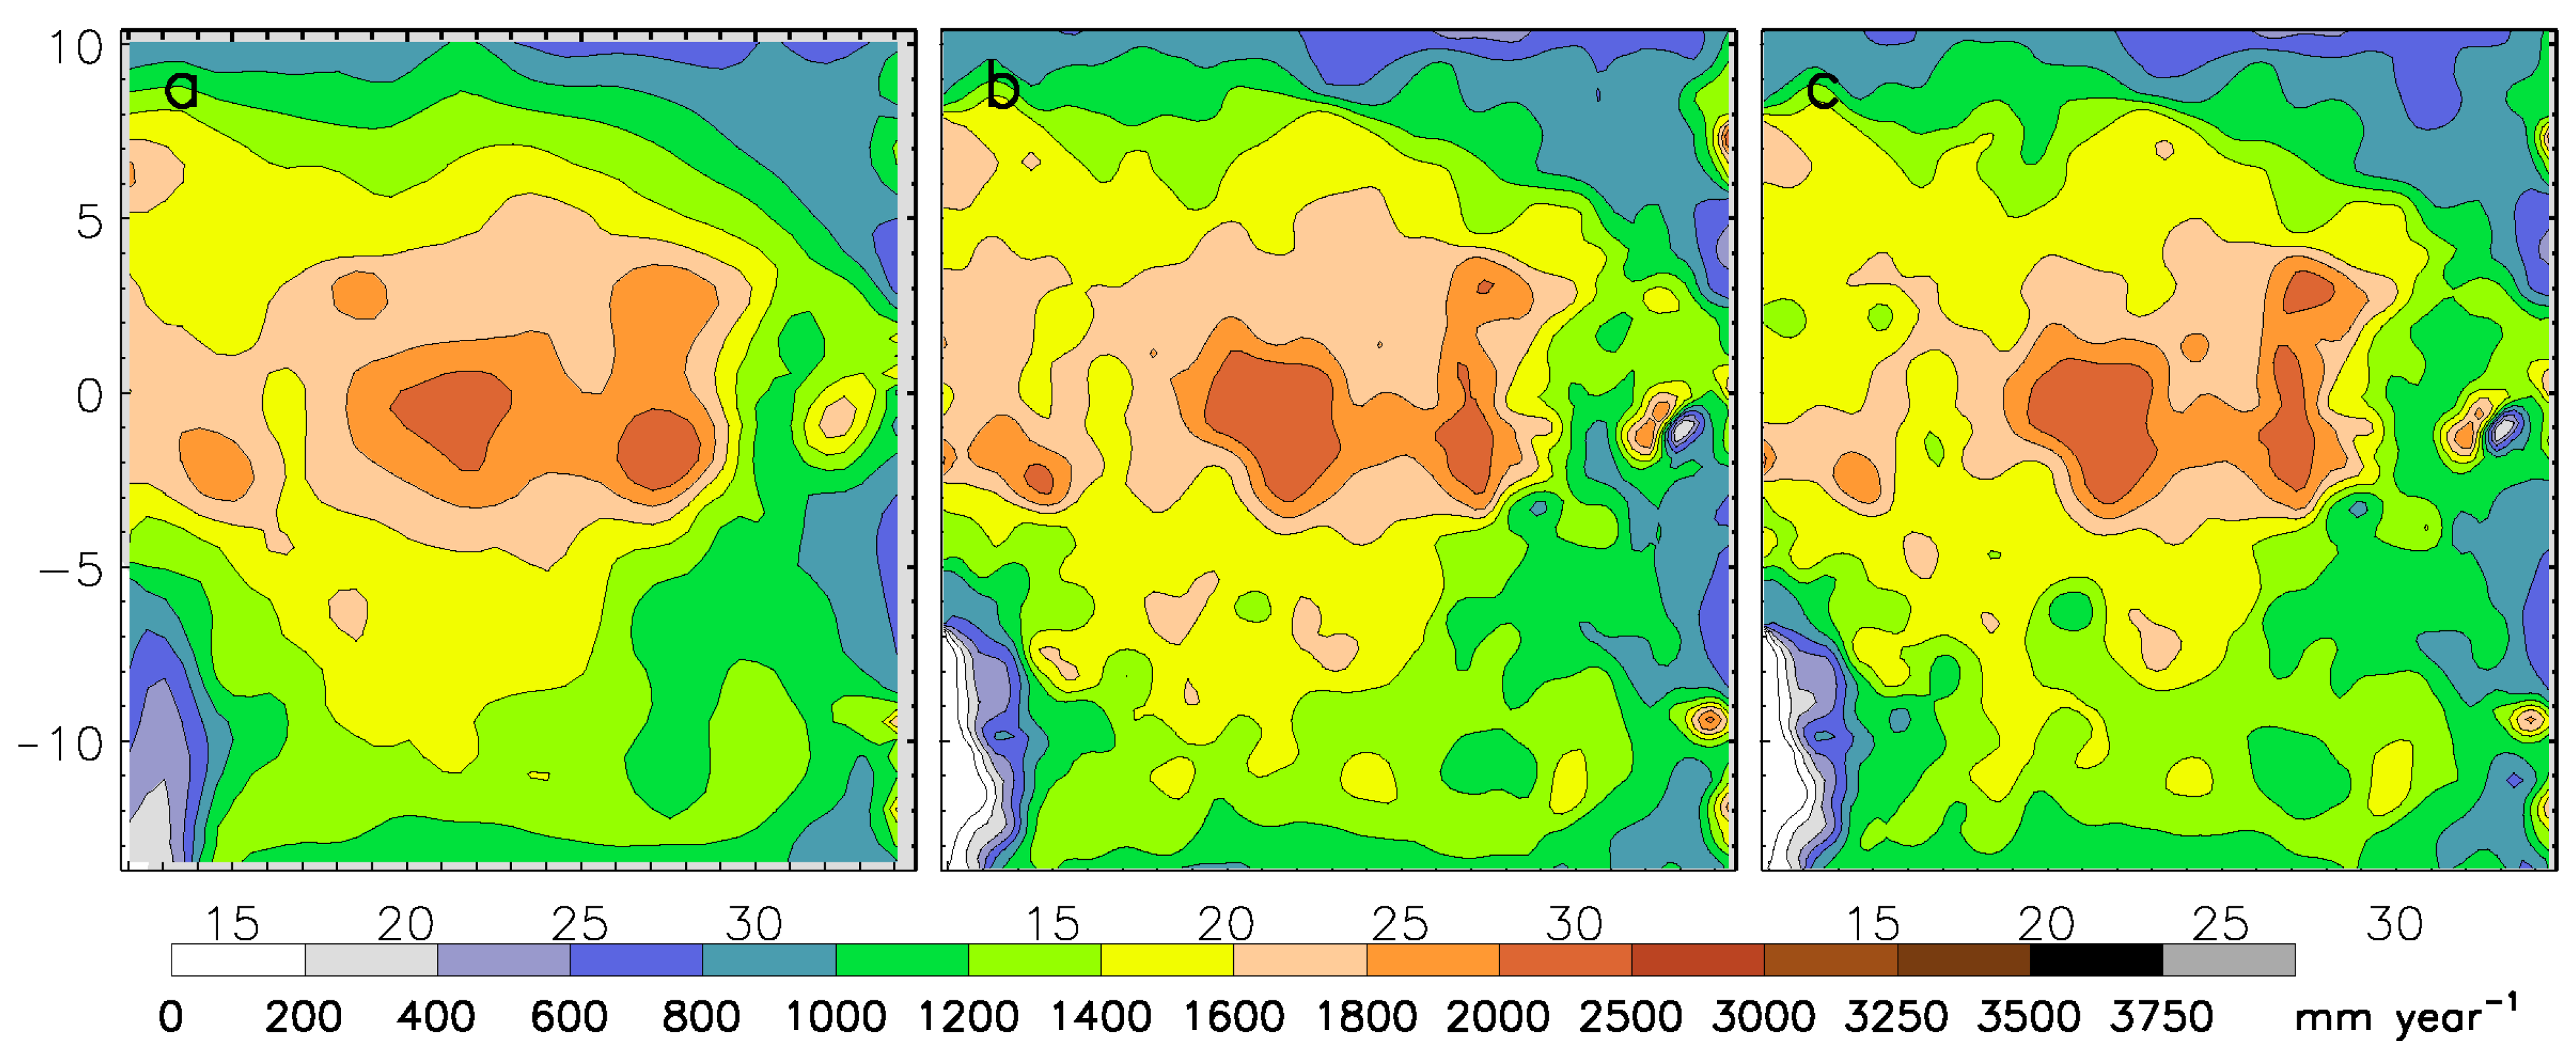
Figure 3 shows the mean annual rainfall published in Bultot’s [64] classic four-volume work on the DRC, which is based on roughly 50 stations. The same from the NIC131 data set and the GPCC V7 data set for the years 1945 to 1994 (of which the station network was dense) is also shown, along with a map based on GPCC V7 for the years 2001–2019 (when few stations were available) (Figure 4). The spatial pattern is clear and robust. There are maxima in the equatorial region at roughly 21° E and 28° E. The more eastern maximum lies over the Western Rift Valley highlands and is the stronger of the two. Other evidence that this pattern extends to the present time comes from lightning data, which shows maxima in these same areas (Figure 5), and counts of Mesoscale Convective Systems [65], which produce some 50 to 70% of the rainfall in this region [66]. Another small maximum is evident just to the north of the eastern one.
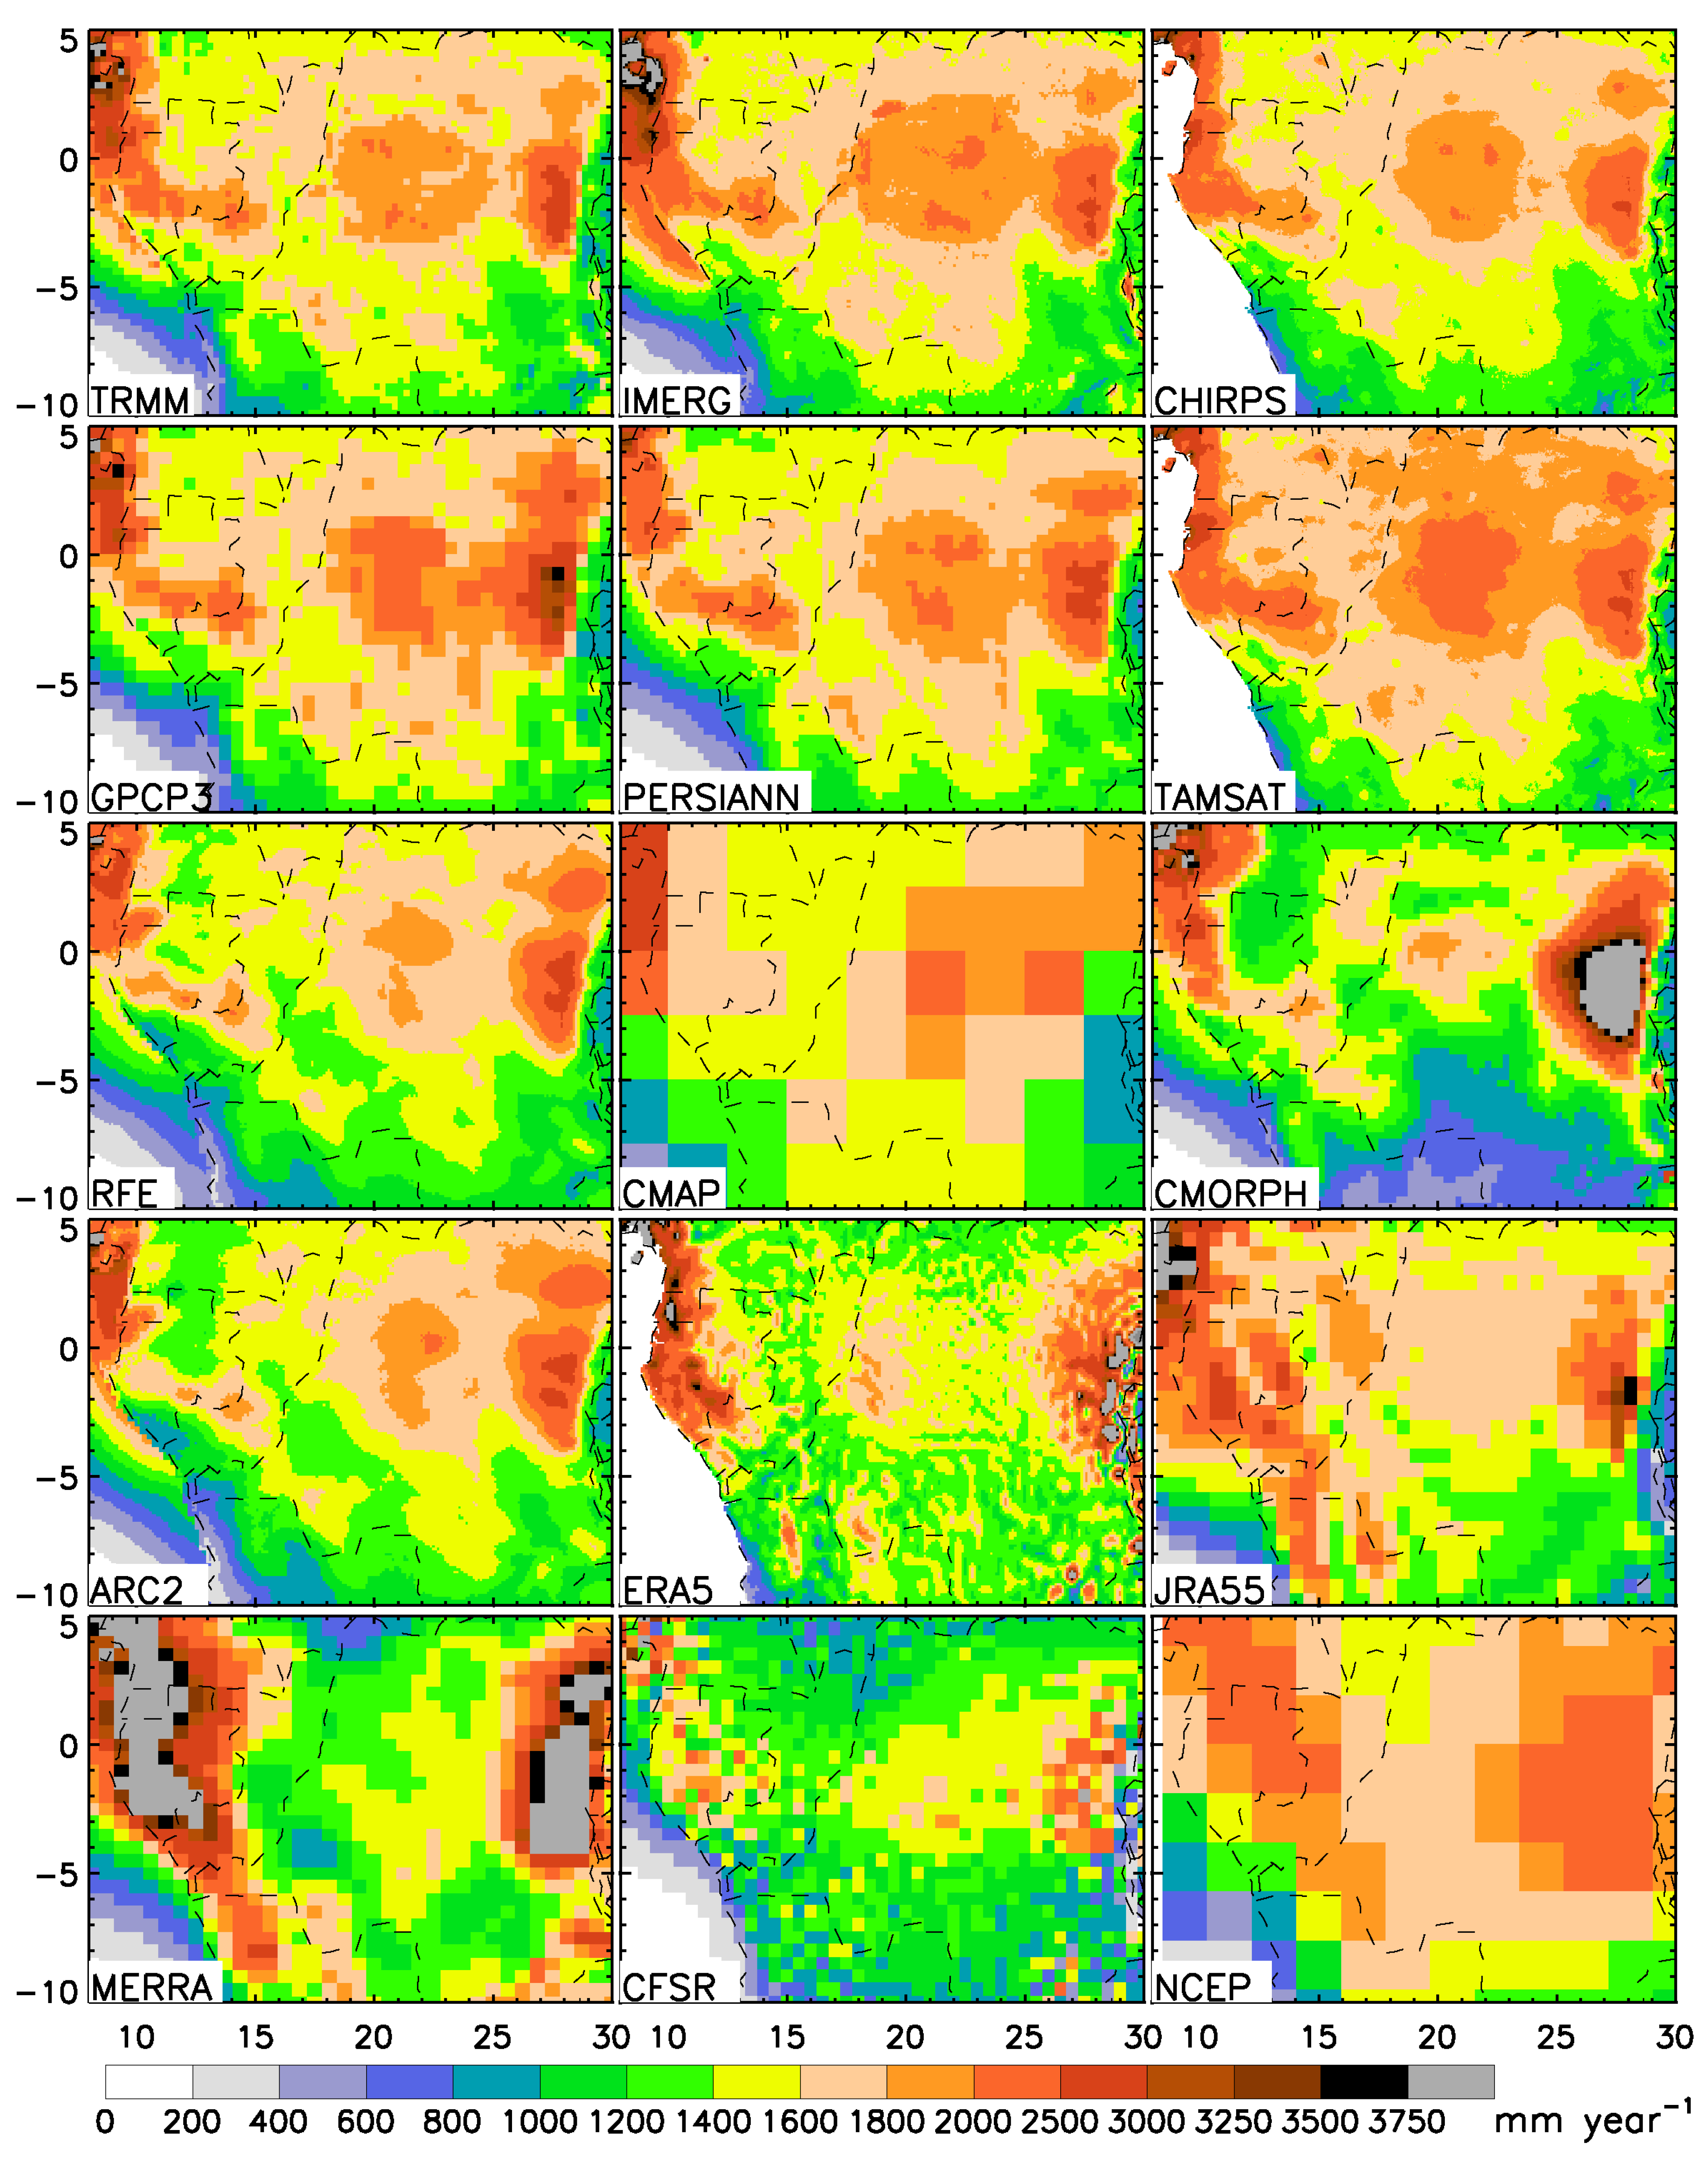
All of the satellite products show some semblance of the double maxima over the Congo Basin (c. 22° E) and eastern Congo (c. 28° E), although the pattern is not well developed in the low-resolution products (Figure 6). However, the intensities of the two maxima vary substantially. TRMM 3B43 and CHIRPS2 arguably show the closest agreement with gauge data but IMERG-F, TAMSAT3, and PERSIANN-CDR also show good agreement. RFE 2.0 and ARC2 show somewhat lesser agreement. CMORPH CRT dramatically overestimates the eastern maximum, but appears to underestimate rainfall in most other areas.
Of the reanalysis products, only ERA5 and CFSR show the double maximum over the Congo Basin. However, ERA5 appears to overestimate the eastern maximum and underestimate the maximum in the Congo Basin. CFSR appears to underestimate through the region. JRA55, NCEP2 II, and ERA5 all show a second maximum far to the west and a clear minimum over the Congo Basin.
Rainfall is quantified in Table 3 for the analysis region termed Congo (Figure 1). The values obtained from three gauge-data sets are indicated, in addition to the values from the satellite and reanalysis products. For the latter, the average rainfall for the Congo region ranges between 1402 and 1758 mm, compared to gauge estimates of 1840 (GPCC 2V7) and 1831 (Nic131). The satellite estimates range from 1571 to 1954 mm per year. For November, the range is 160 to 210 mm for satellites and 156 to 202 mm for reanalysis products, compared to 206 mm for GPCC V7 and 199 mm for Nic131. For the satellite estimates, CMORPH CRT is an outlier, giving the lowest estimate by far for both annual and November rainfall.
3.1.2. Lake Victoria and Its Catchment
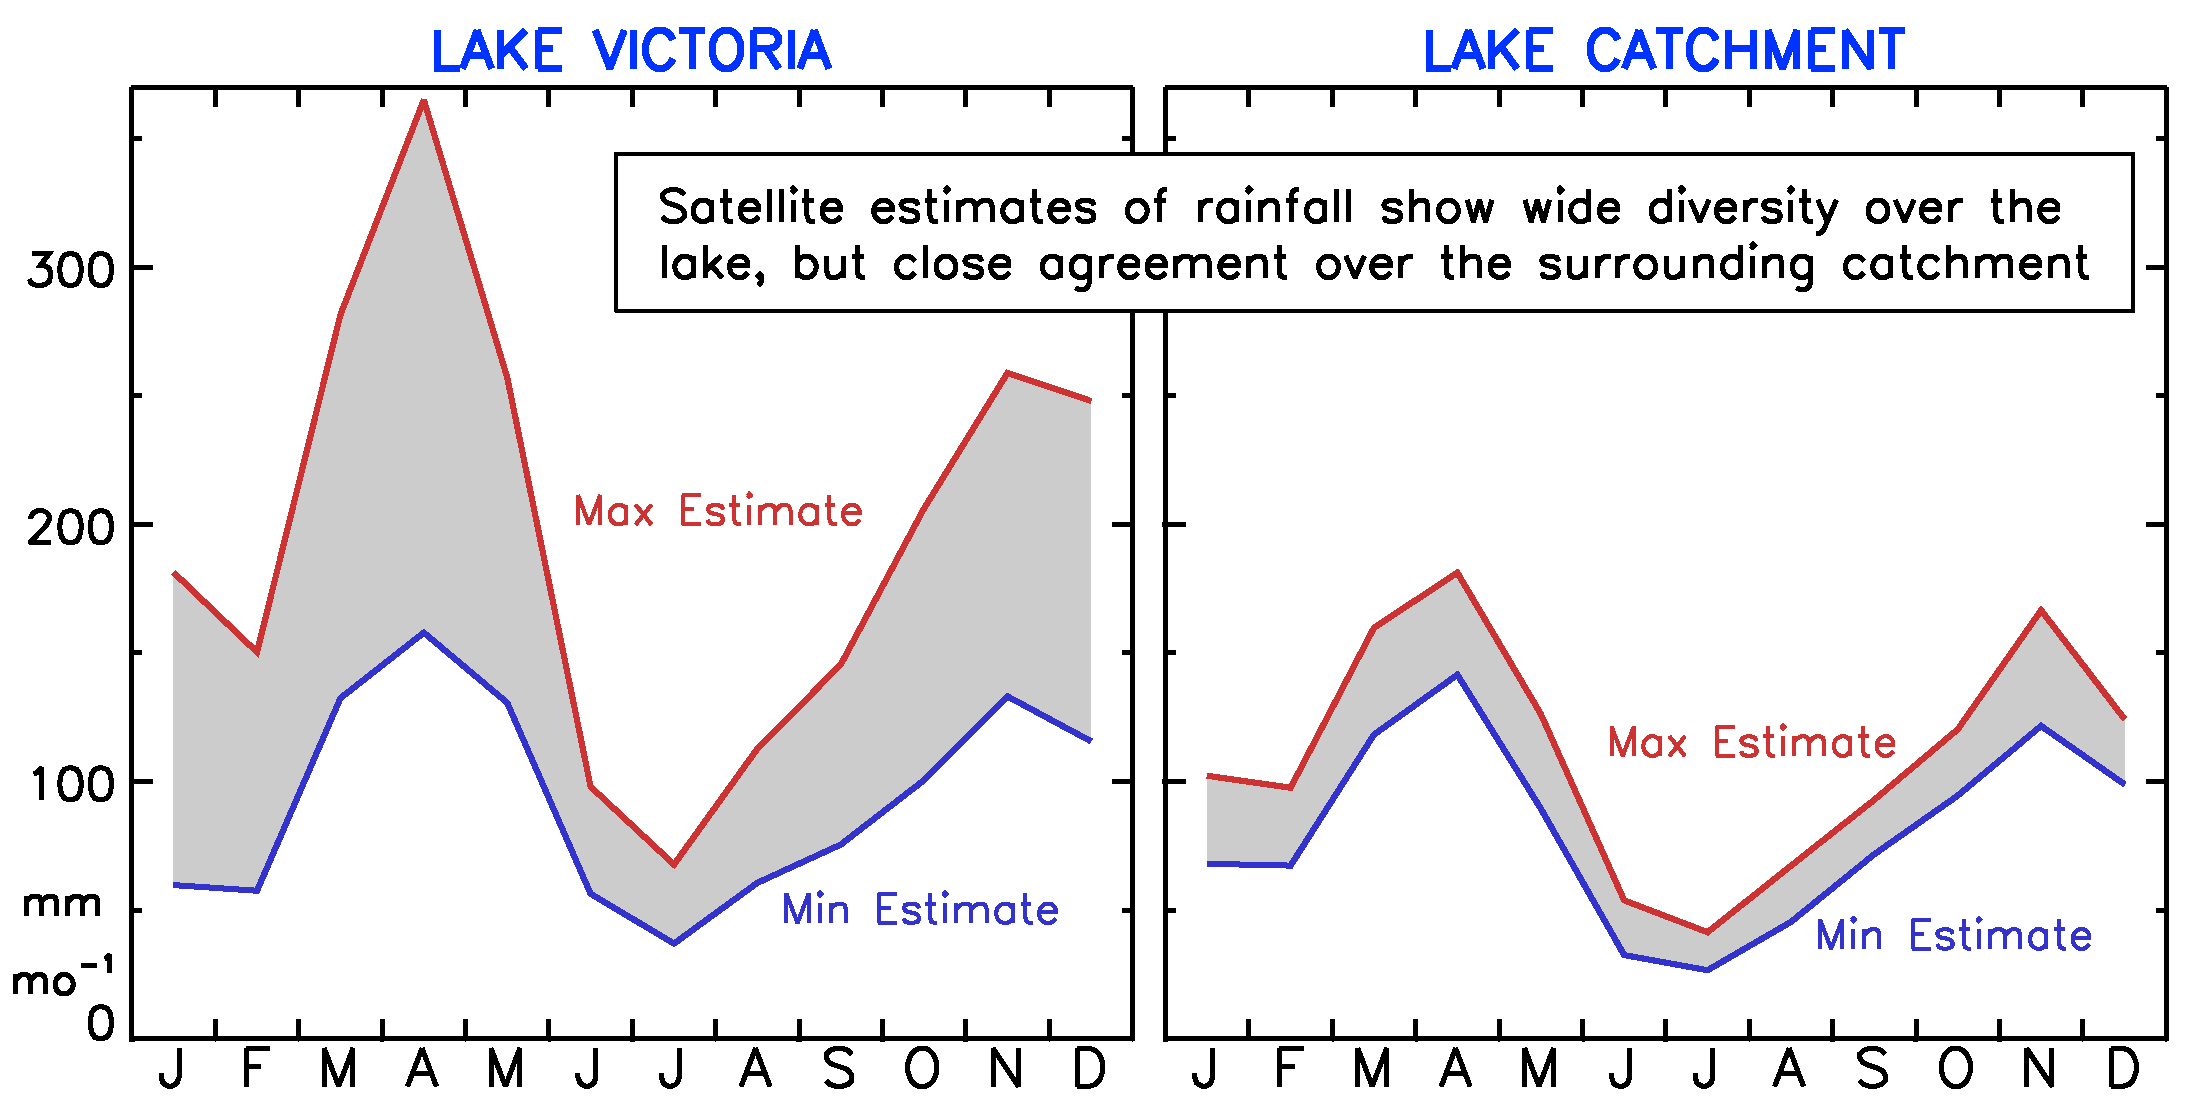
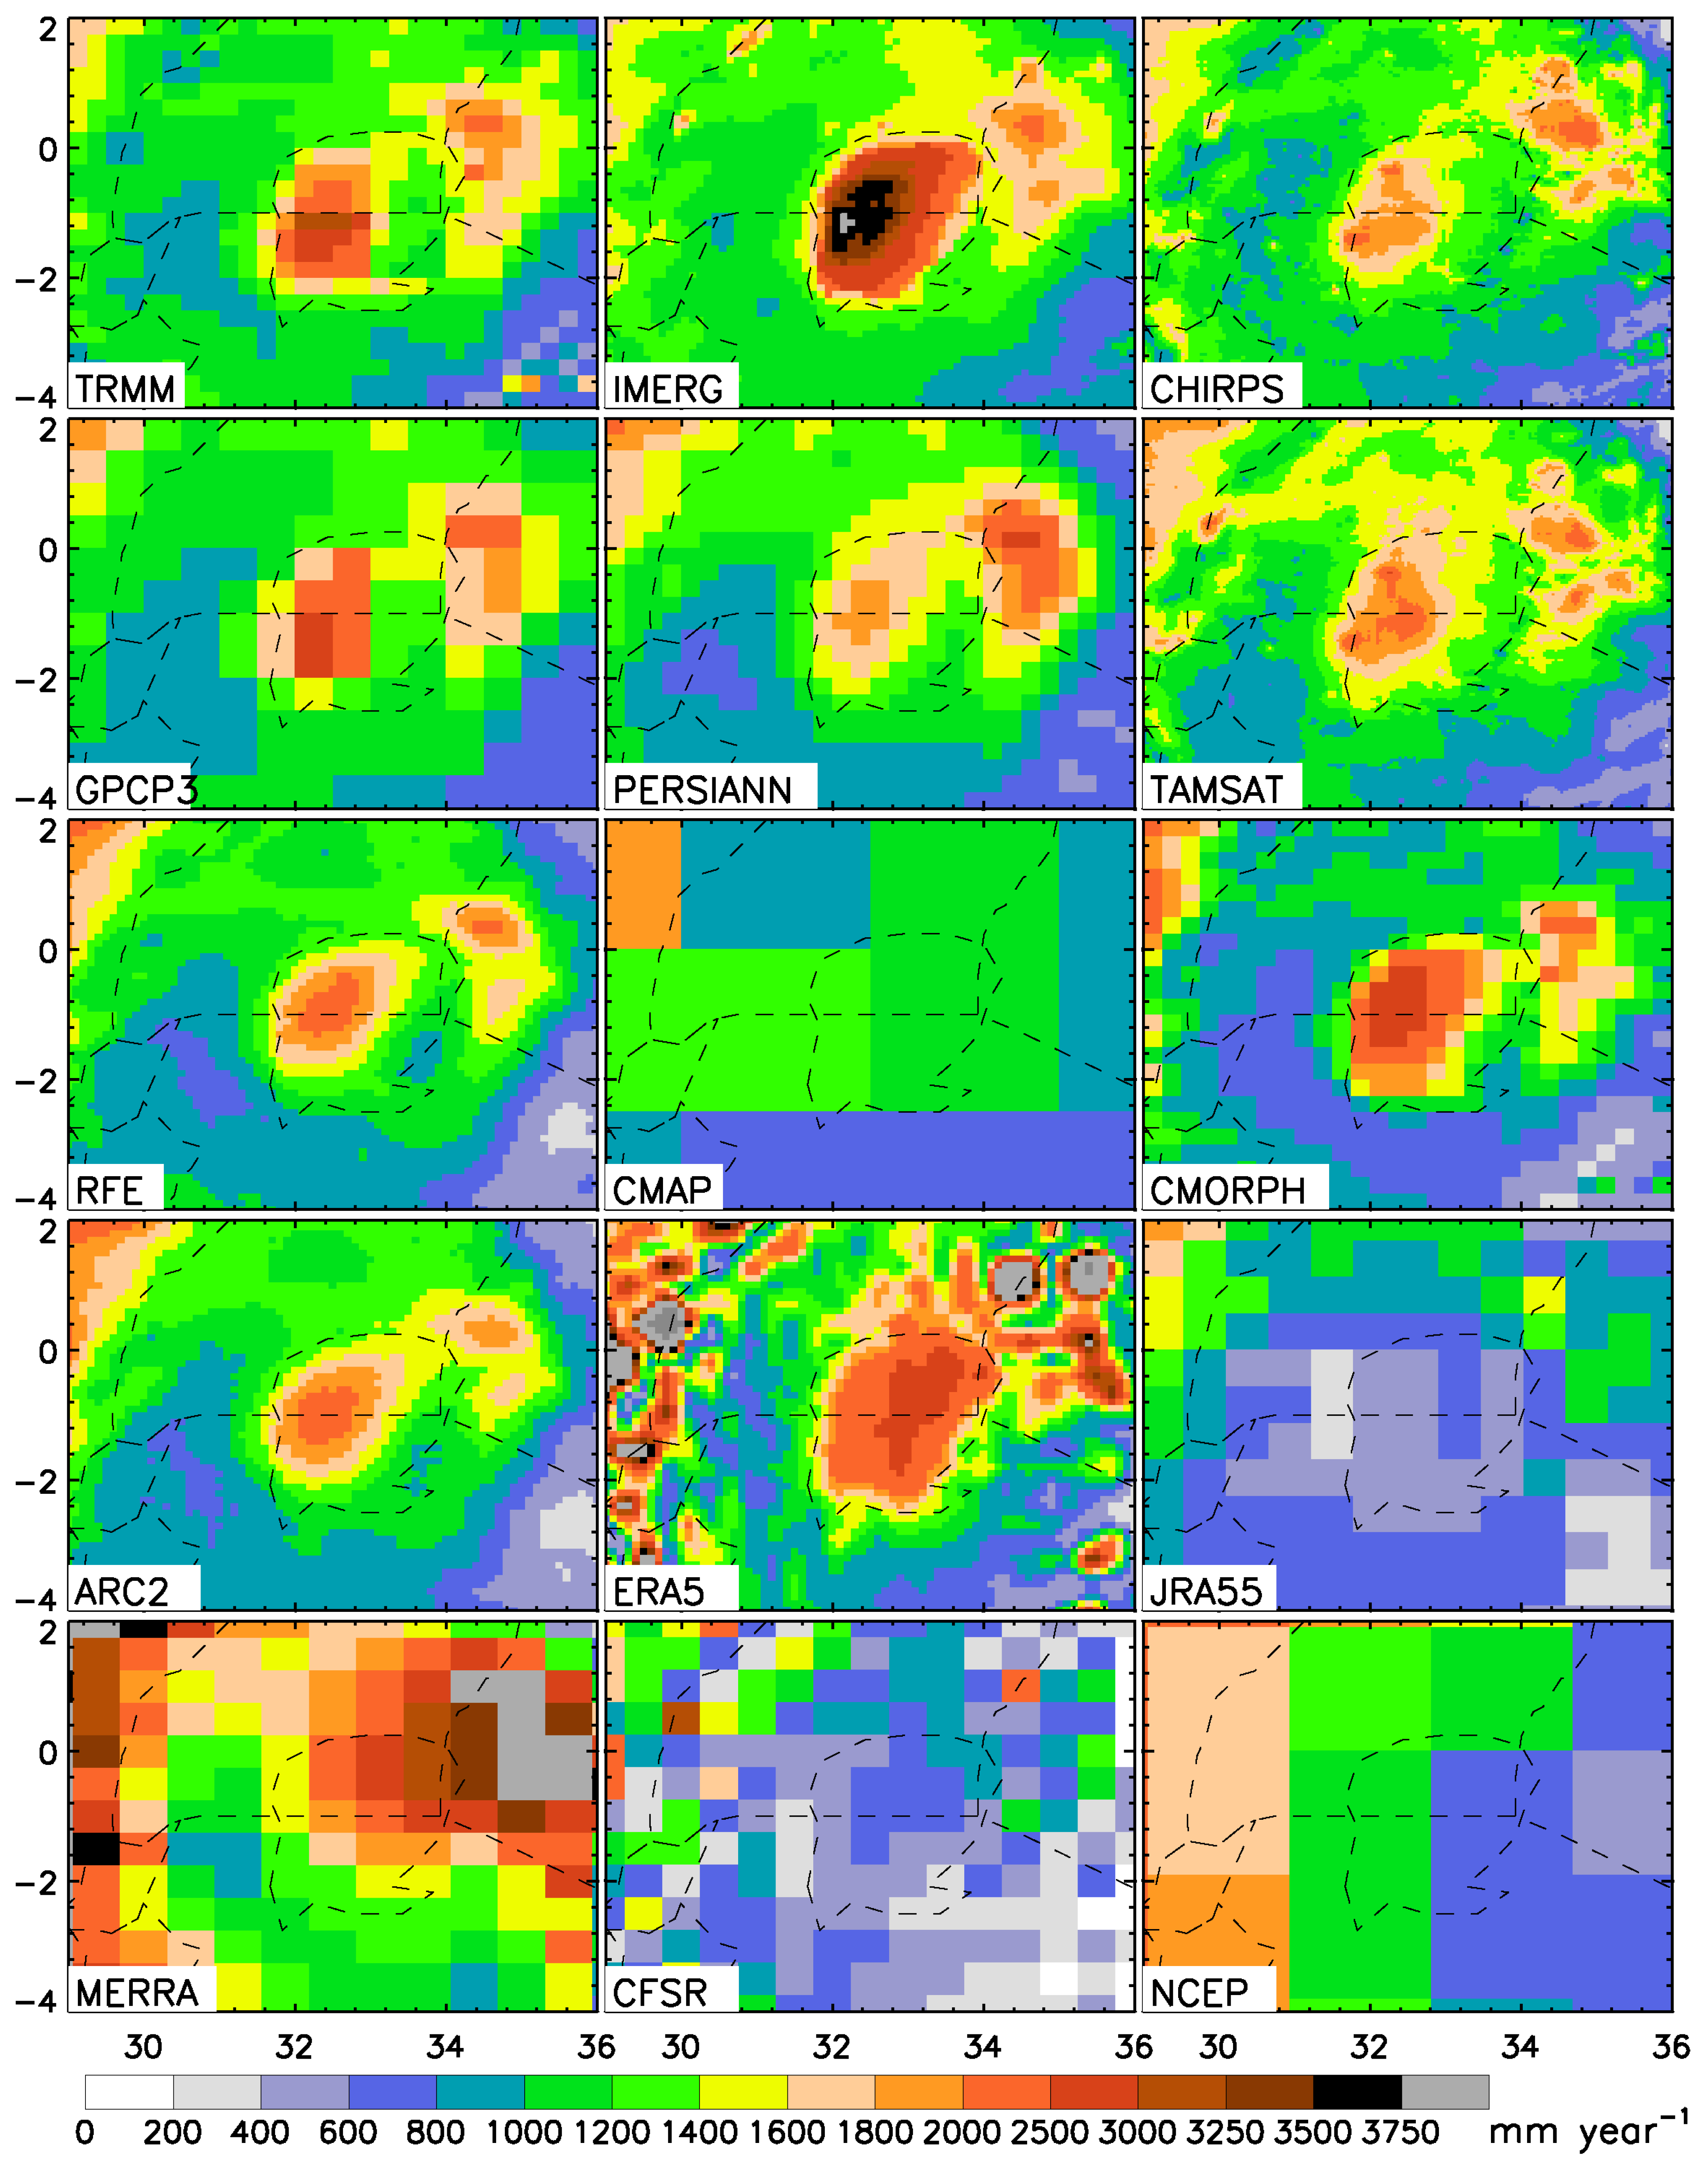
Figure 7 shows annual rainfall over Lake Victoria and its catchment for the 12 products. The diversity of rainfall over the lake itself is tremendous. Most of the products show higher rainfall over the lake than over the surrounding catchment. However, in the products with a high enough resolution to delineate the lake, the maximum rainfall over the lake varies from around 400 to 600 mm in JRA55 to over 3750 in IMERG. The spatial resolution of CMAP, GPCP V3.1, and NCEP2 II is too coarse to capture the lake itself, but the pixels lying primarily over the lake do not suggest an enhancement over the lake. Such diversity is similarly evident for November rainfall (not shown).
Figure 8 shows mean rainfall over the lake, based on a combination of gauge records from island stations and dynamic modeling. A strong maximum exists in the western portion of the lake, with highest annual rainfall on the order of 3000 mm. A similar spatial pattern is apparent in the higher resolution satellite products but is not evident in any of the reanalysis products. In a more detailed evaluation, Nicholson et al. [5] concluded that TRMM 3B43 provided the best estimate over the lake and gave values similar to that which is shown in Figure 8.
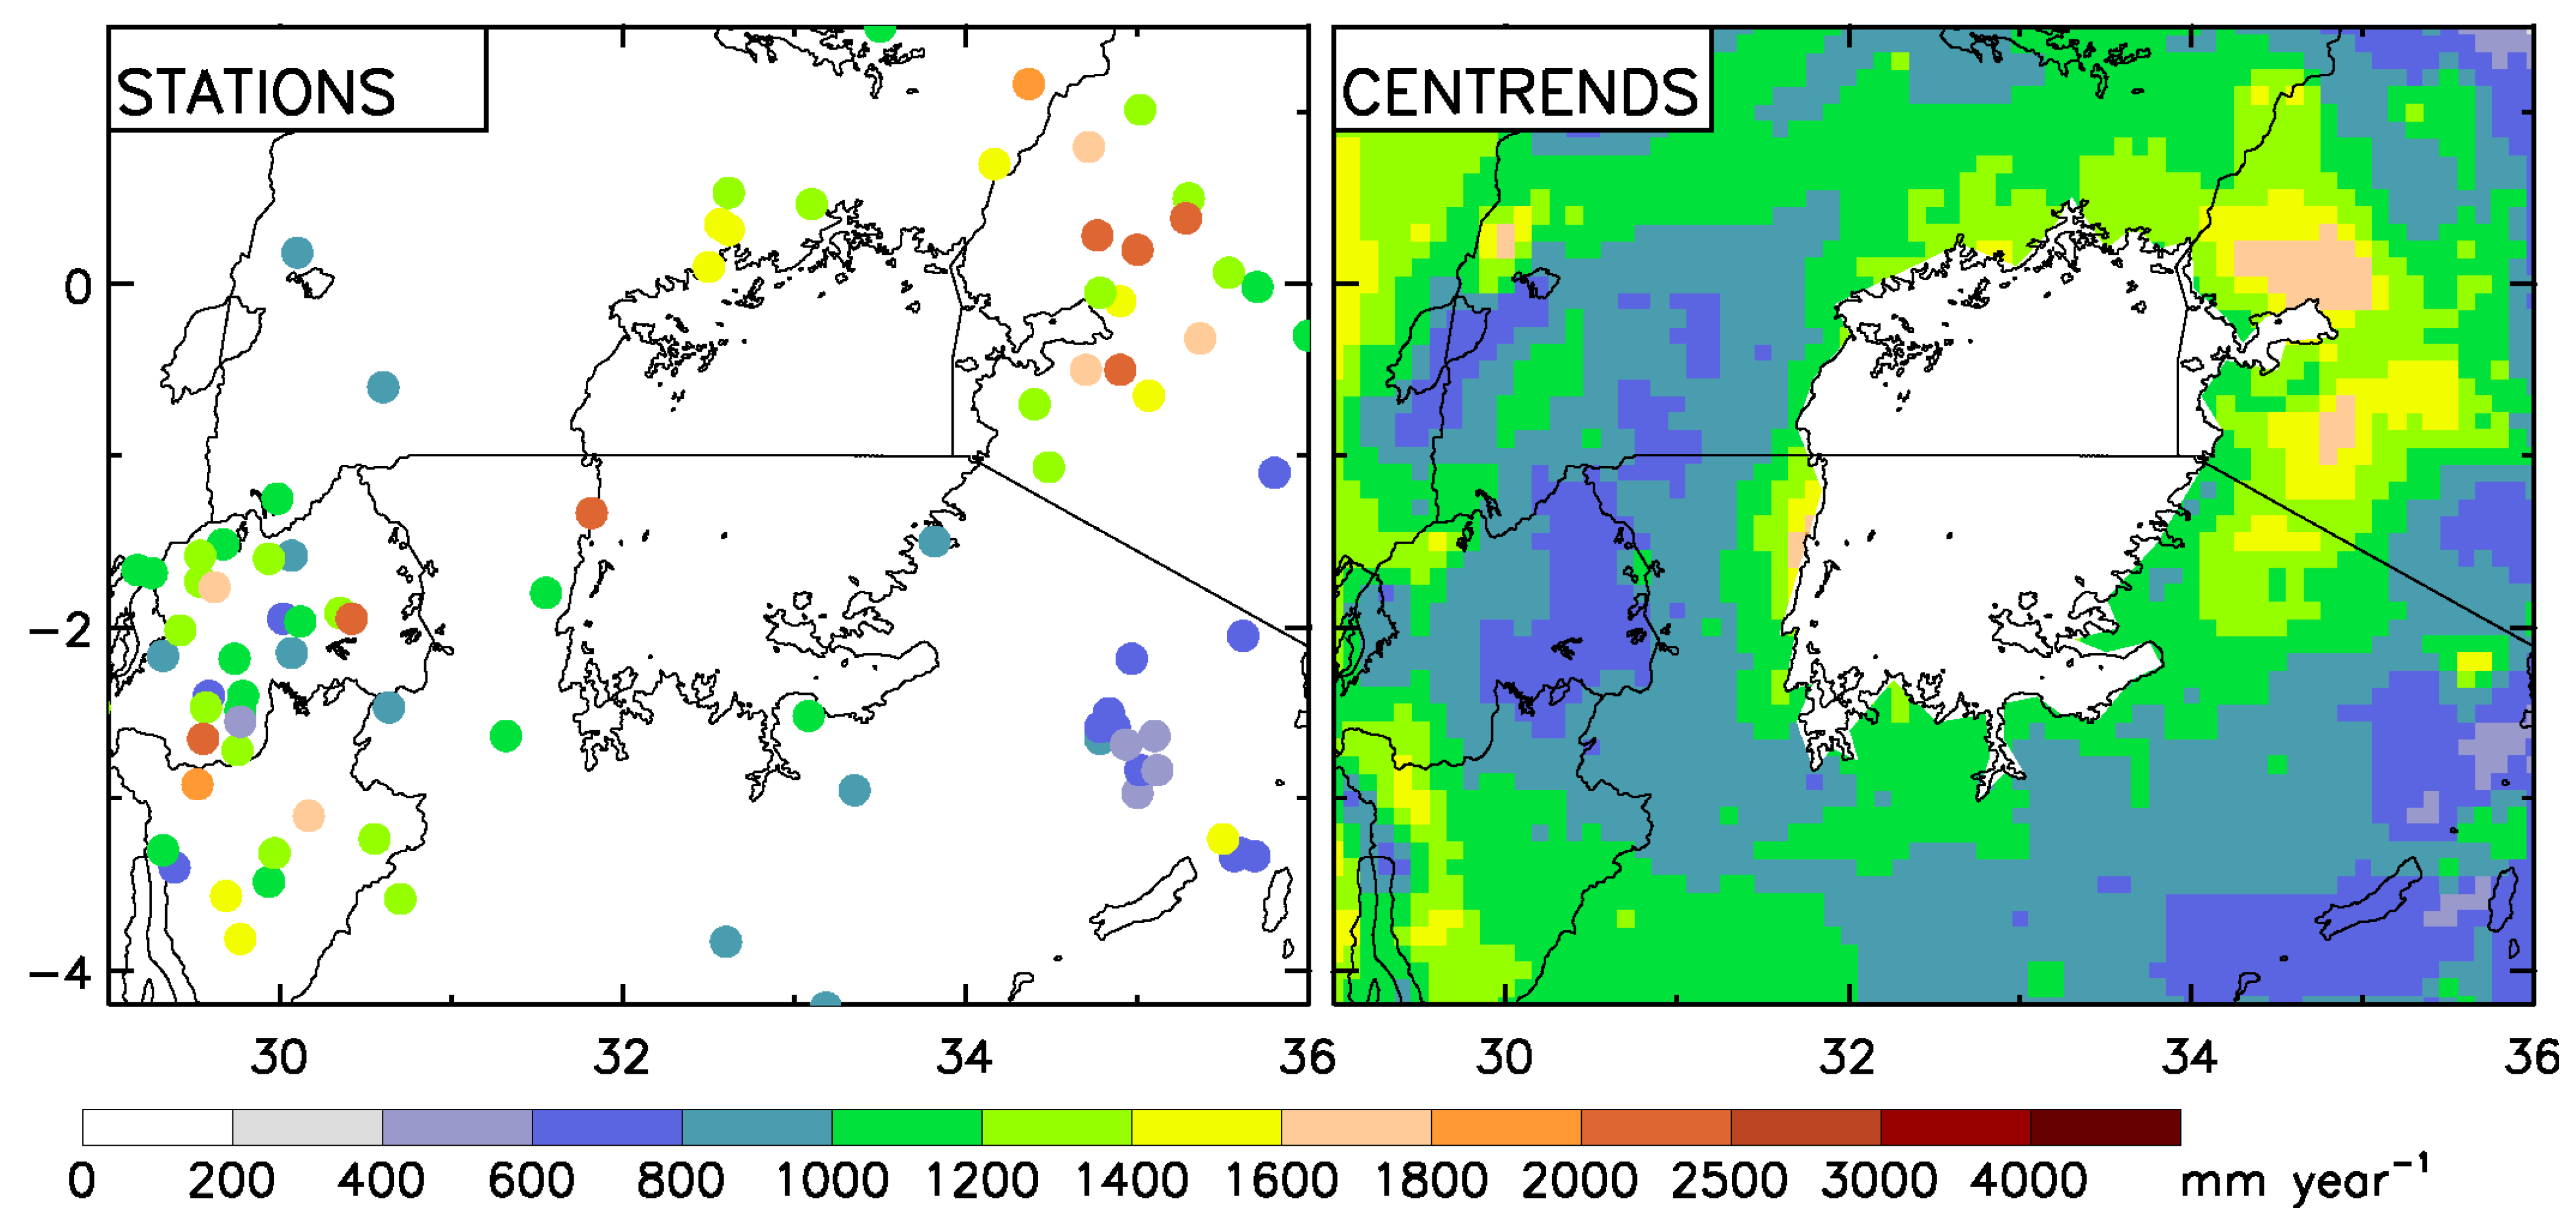
In the catchment surrounding the lake, there is less diversity (Table 3). In this case, two gauge products provide some comparison. CenTrends is the best gridded product for this region because it is based on the largest number of stations. CenTrends annual means for the period of 2001 to 2014 are shown in Figure 9, along with station values from NIC131 averaged for the period of 2001 to 2019, which is the period of analysis for the satellite and reanalysis products. NIC131 is probably more accurate than CenTrends in the mountainous area of Rwanda and Burundi, because of its high concentration of stations.
Collectively, the two products suggest that annual rainfall shows a maximum on the order of 1800 to 2500 mm to the northeast of the lake, with rainfall on the order of 1200 to 1600 most elsewhere in the north and east. To the west and south, annual rainfall is typically 400 to 1200 mm. All but the low-resolution satellite products exhibit a similar pattern and magnitude, but TRMM 3B43, IMERG-F, and CHIRPS2 generally have a higher amount of rainfall than the gauge products in the west and southwest. Of the reanalysis products, only ERA5 shows any similarity to CenTrends or NIC131, but the values are too high over the highlands to the west and northeast of the lake. Values exceeding 3750 mm are indicated in numerous locations. For the most part, the November patterns (not shown) are similar to the annual, though of lower magnitude.
3.2. The Seasonal Cycle
3.2.1. Congo Basin
Figure 10a shows the seasonal cycle for the Congo Basin region based on the satellite products. There is substantial agreement in the first rainy season and in the dry months. Ignoring the obvious outlier (CMORPH CRT), the spread of estimates is on the order of 20 to 30 mm during the first rainy season. The spread is notably larger during the second rainy season, reaching as high as 50 mm during October. Most satellite products give values similar to that of the observational data sets, the two of which give almost identical values. IMERG-F and TRMM 3B43 show the best agreement with the observations. All except CMORPH show two distinct rainy seasons, with maxima in April and October and minima in June and January. CMORPH CRT is an extreme outlier on the low side and TAMSAT3 tends to overestimate in the rainy seasons and boreal summer dry season. RFE 2.0 and ARCv2 are outliers in the second rainy season, both underestimating rainfall.
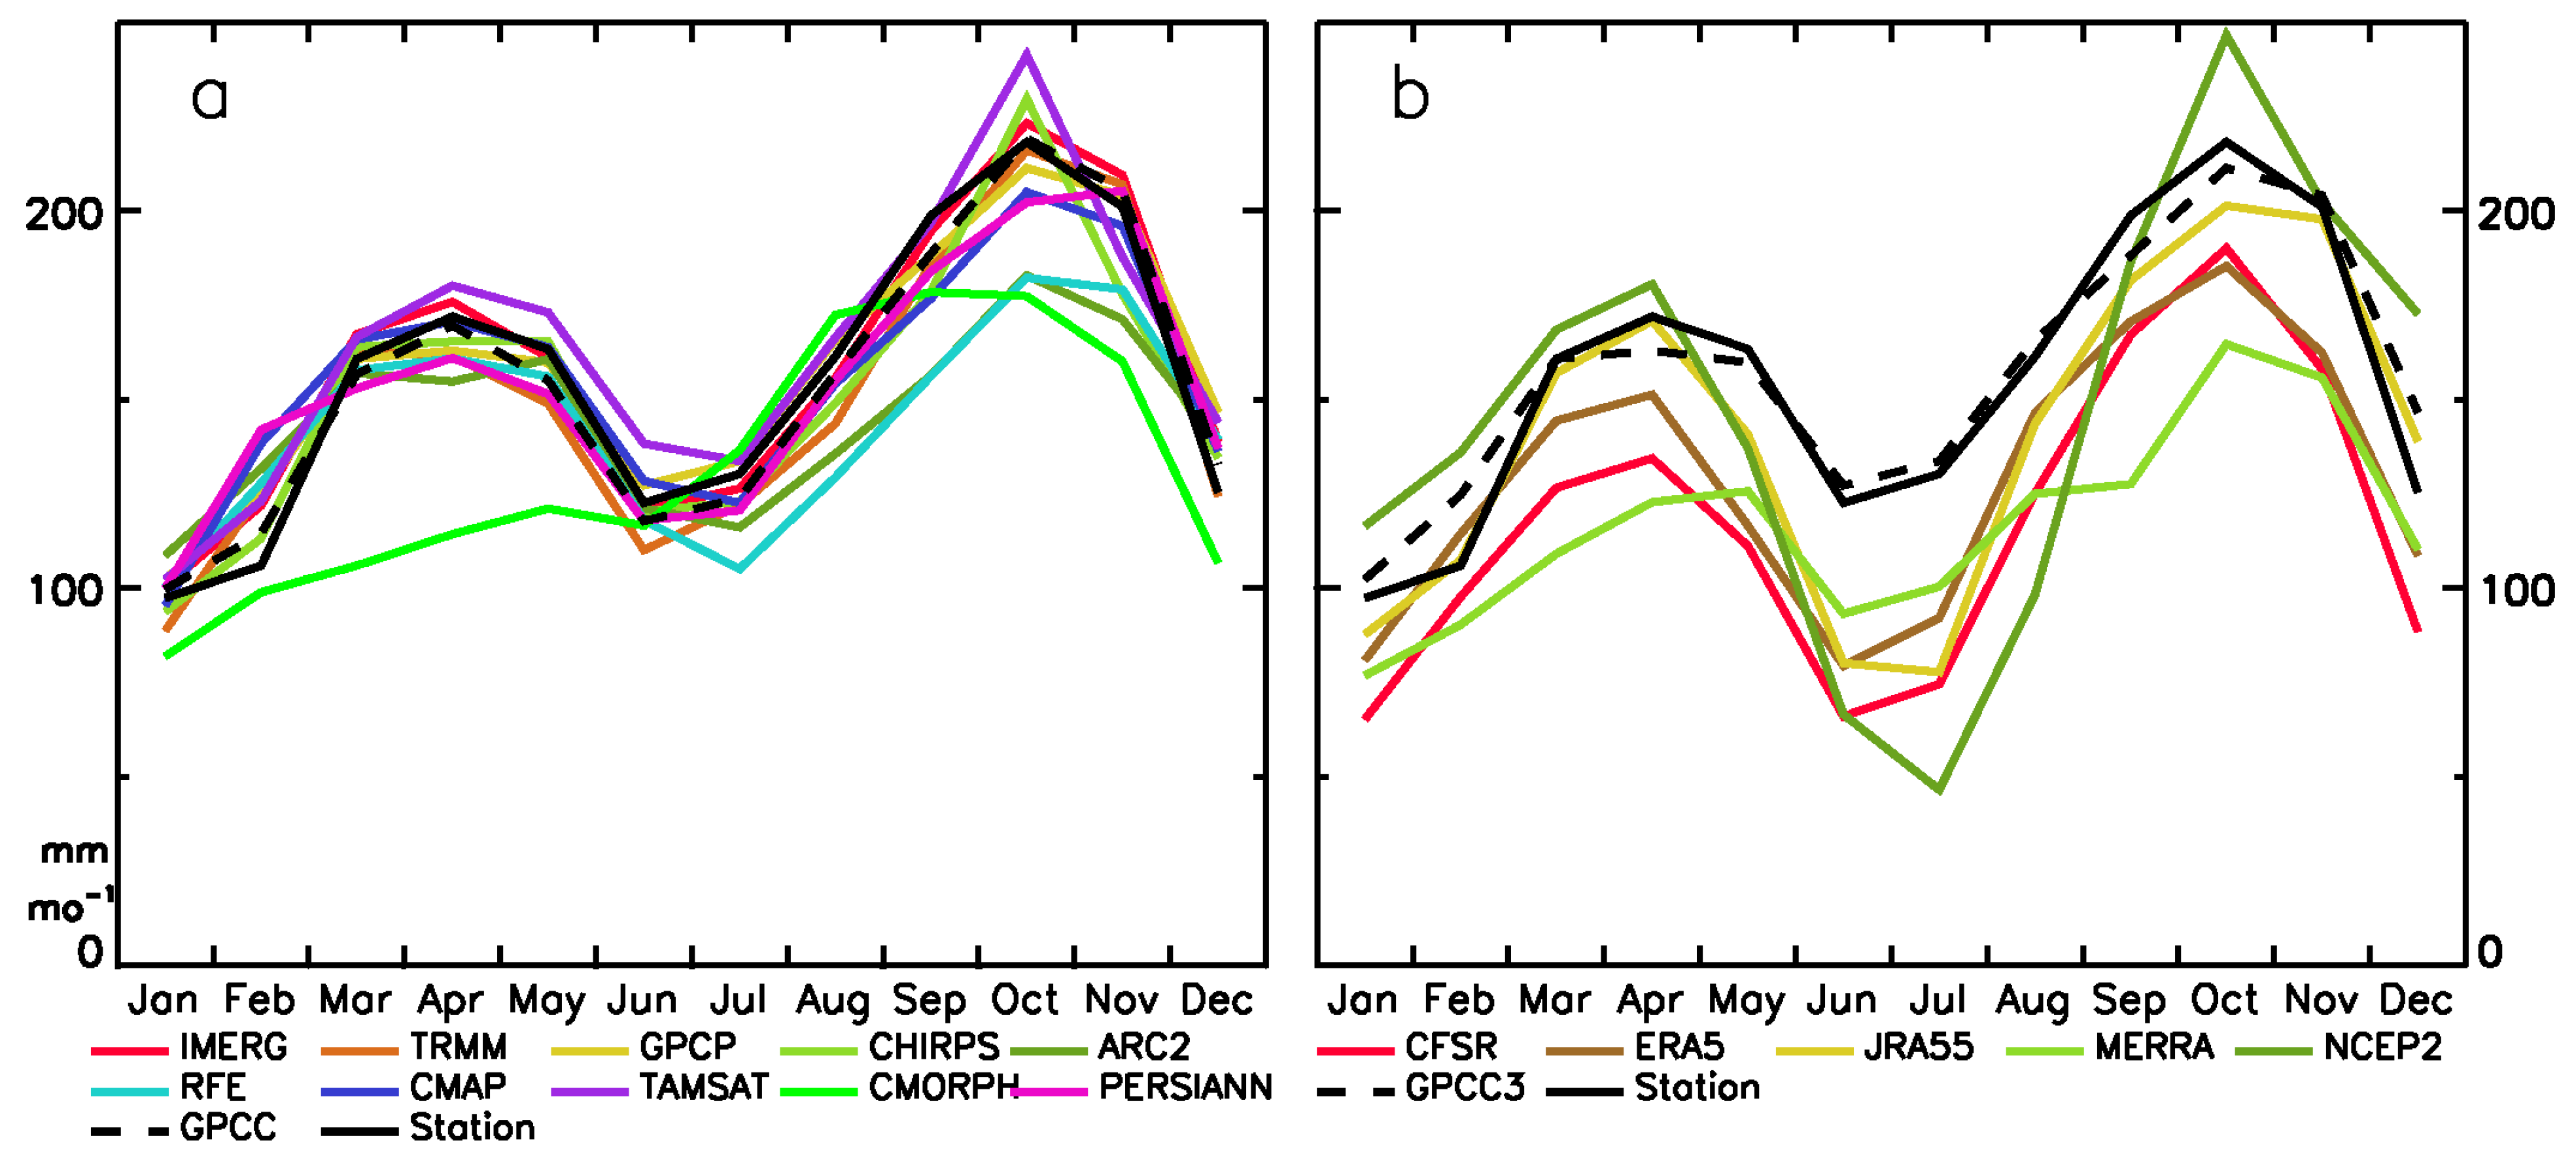
The range of estimates is roughly twice as great for the reanalysis data sets (Figure 10b). Of the five, NCEP II and JRA55 are closest to observations, but in general the reanalysis products tend to underestimate rainfall in this region. All clearly show two distinct rainy seasons, with that of the boreal autumn being the strongest. All show October as the wettest month and all but NCEP II show June as the driest of the boreal summer dry season. In contrast, the wettest month of the first rainy season varies between March and May.
3.2.2. Lake Victoria and Its Catchment
Figure 11 shows the season cycle over the lake and catchment. The graphs on the left are based on the satellite products. GPCC V7 and the long-term mean from NIC131 are also shown for the catchment. Those on the right are based on the five reanalysis products, with GPCC V7 and NIC131 also shown for the catchment. GPCC V7 and NIC131 are averaged for the period of 1945 to 1994, in order to produce averages for the period with the greatest gauge coverage.
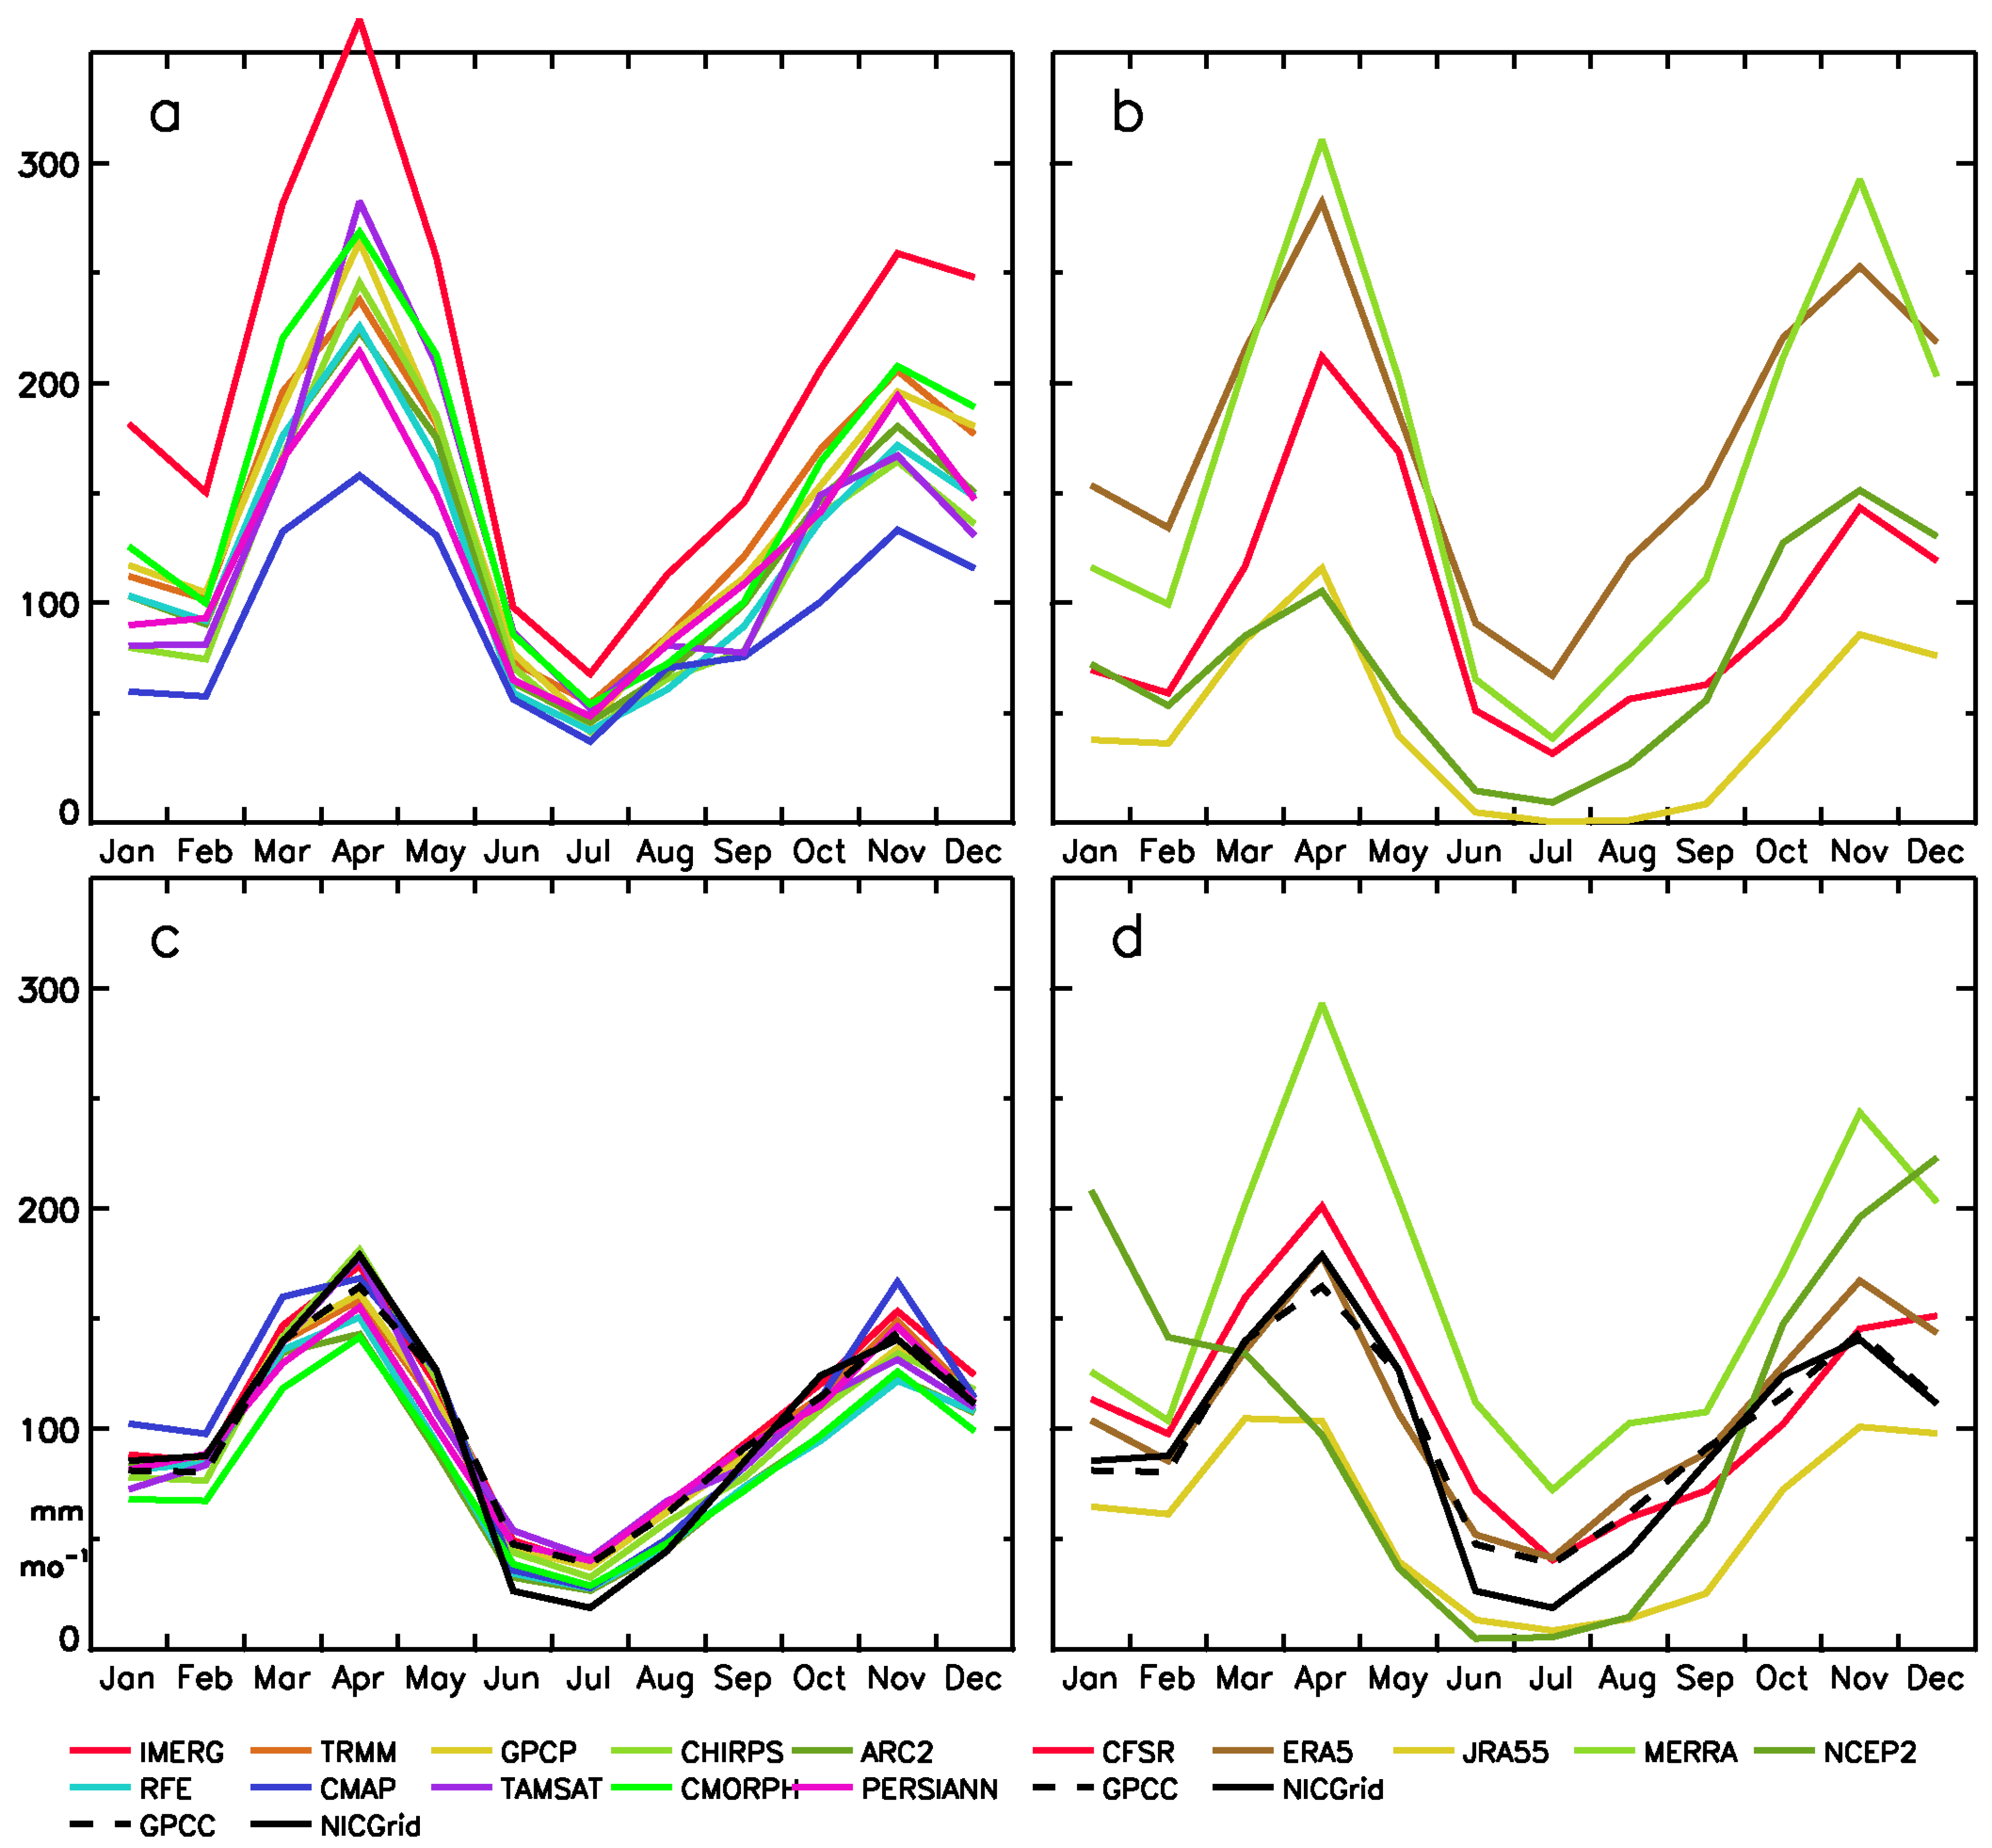
The range of estimates over the lake is vast for both satellite and reanalysis products. The April maximum ranges from 160 mm to 375 mm for the satellite products but the seasonal cycle is similar in all products. Maxima are evident in April and November, with a minimum in July. April values for the reanalysis products range from 105 to 310 mm; however, as with the satellite products, there is agreement on the seasonal cycle.
The situation is very different over the catchment. Satellite estimates in this area are in good agreement. All show maxima in April and November and the spread is generally on the order of only 20 to 30 mm. Over the catchment the reanalysis products are similarly diverse. As over the lake, estimates for April vary from roughly 100 to 300 mm. One product (NCEP II) does not capture the seasonal cycle. The maximum in the second rainy season varies between October and December.
3.3. Interannual Variability and Trends
3.3.1. Congo Basin
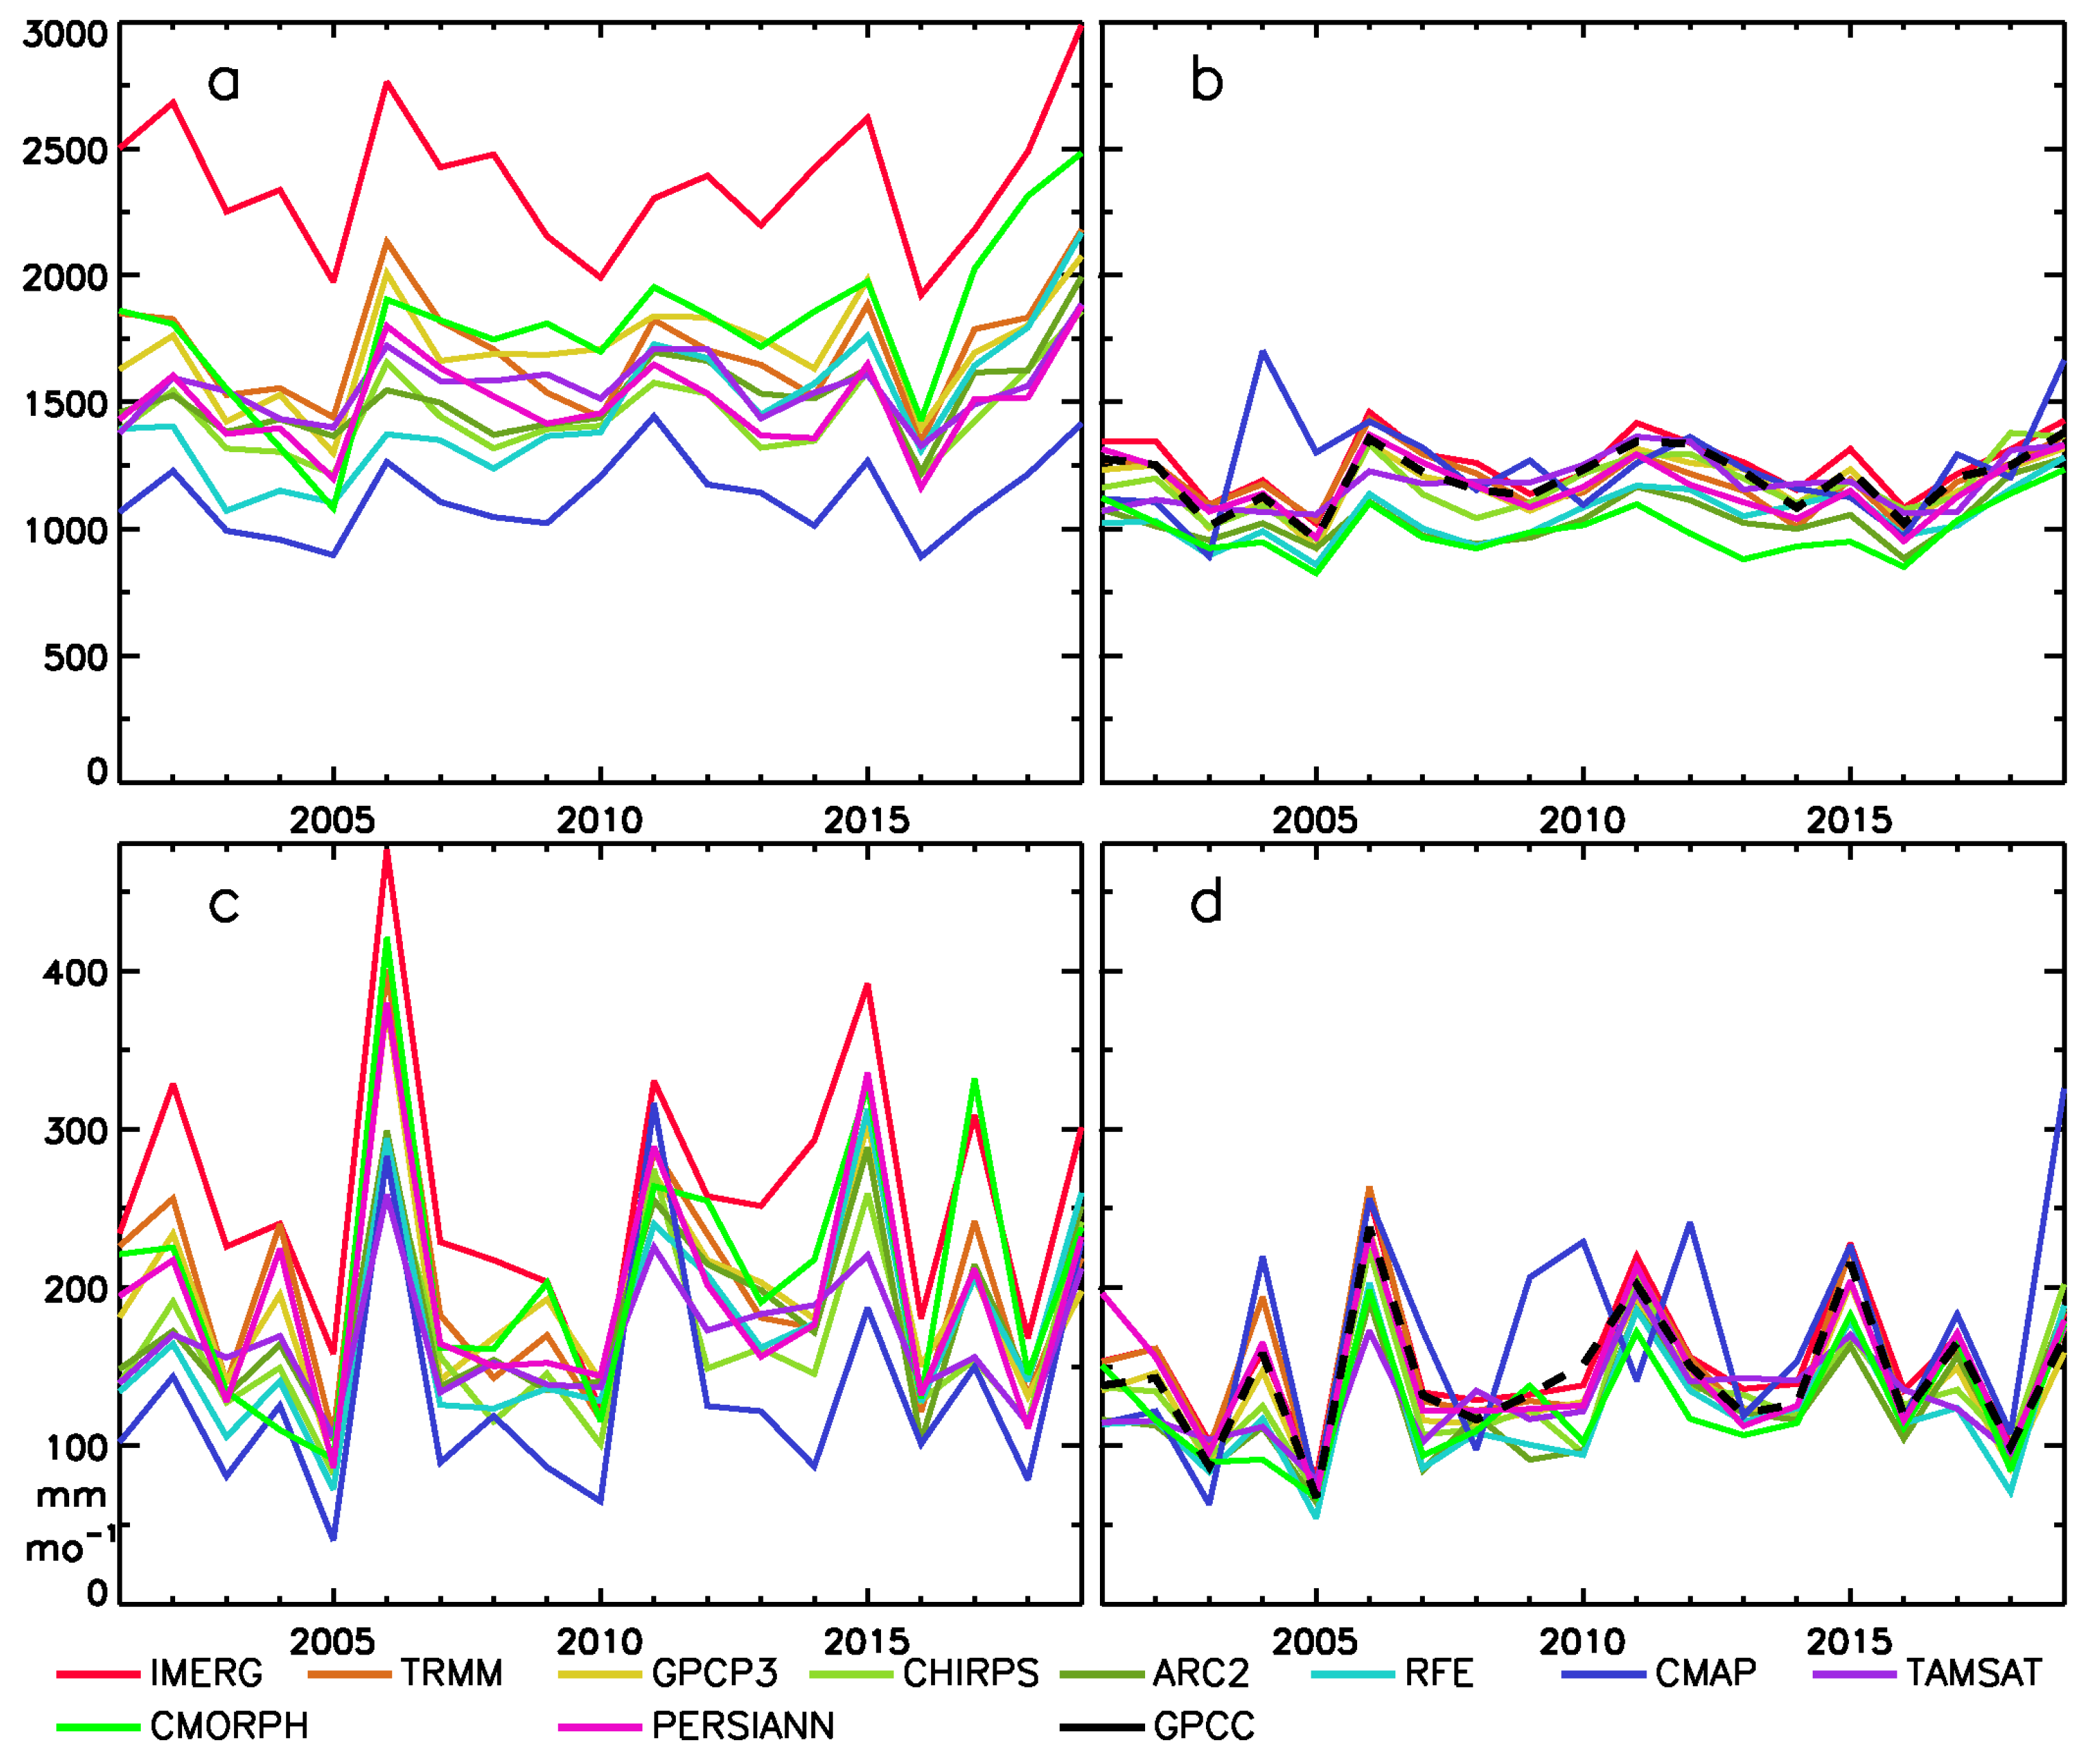
Figure 12a shows the time series of rainfall for satellite products for the period of 2001 to 2019 for the year and for the month of November for the Congo Basin region. There is considerable disparity among the estimates for annual rainfall. RFE 2.0, TAMSAT3, and ARCv2 are extreme outliers. The overall magnitude is not so different among the remaining satellite products, but the sequence of interannual variability appears almost random. The only case with substantial agreement is the rainfall increase between 2015 and 2017.
There is considerably more agreement among the satellite estimates for November; however, the spread is still very large. There is, however, substantial agreement for the sequence of interannual variability, at least for the wet years such as 2007, 2010, and 2017. Most products also show 2007 as a peak year.
There is substantial disparity among the reanalysis estimates in this region (Figure 12b). For the annual estimates, the range is on the order of 500 mm. NCEP II shows a clear and increasing trend, as does MERRA2, albeit to a limited extent, while CMORPH shows a clearly decreasing trend. This holds true for November as well. The range of magnitudes for November is on the order of 200 mm.
The observational products were not used here for comparison because their reliability during these years is questionable. GPCC V7, NIC131, and NIC131 gridded are nearly devoid of stations in the region during the time period shown.
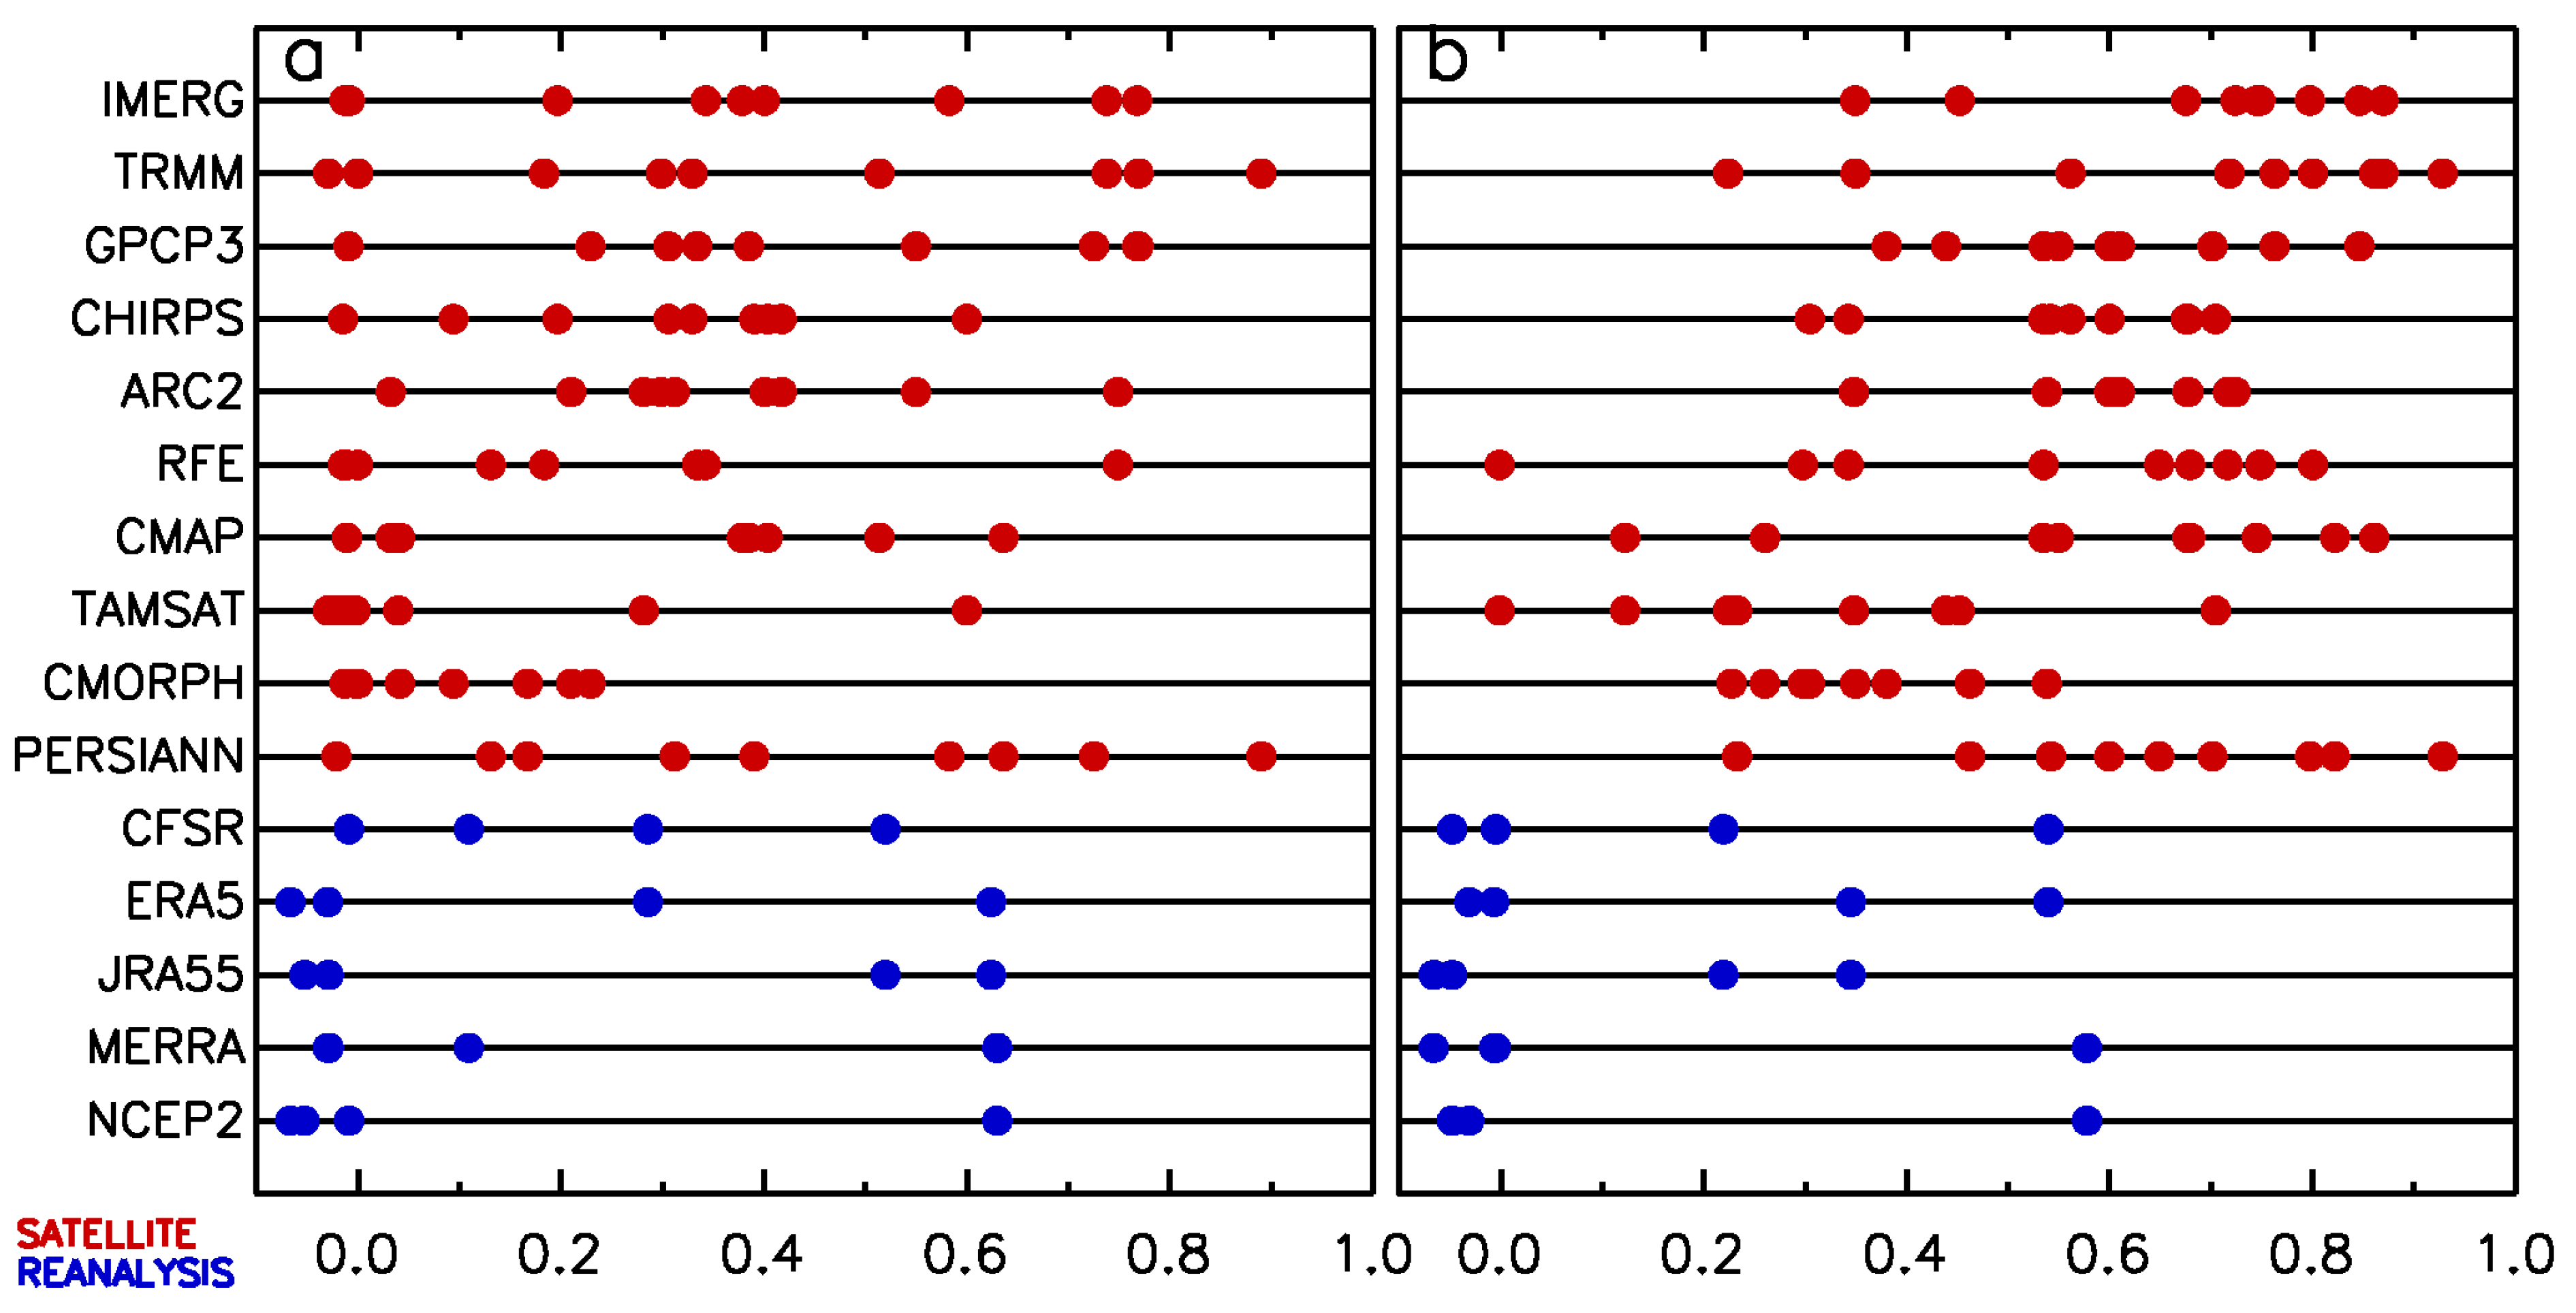
The diversity of the estimates is quantified in Figure 13, which gives the correlations among the various products. Only like products were correlated, in order to simply the interpretation of the figure. Correlations between reanalysis products and satellite products (not shown) were, as a whole, lower than the satellite–satellite correlations but higher than the reanalysis–reanalysis correlations. The satellite–satellite correlations, based on the 19-year period from 2001 to 2019 with a range from 0 to 1.0 for annual rainfall, with most being around 0.4 or lower. For the most part, the correlations among the reanalysis products are weaker, with the exception of four cases with correlation coefficients of 0.63. Looking into this, it appears that ERA5 and JRA55 are well-correlation, as are MERRA2 and NCEP II. Still, the common variance is only about 40%.
For November, the reanalysis–reanalysis correlations are similar to those for annual rainfall, but the satellite–satellite correlations are substantially higher. Again, they range from 0 to 1.0, but they tend to cluster between 0.5 and 0.9. For both annual and November rainfall, the 1.0 correlation is between GPCP V3.1 and PERSIANN-CDR, both of which are strongly dependent on the GPCC gauge data set. Arguably, the products with the best correlations with other similar products are the most reliable. In this case, that would be IMERG-F, TRMM 3B43, GPCP V3.1, and PERSIANN-CDR.
3.3.2. Lake Victoria
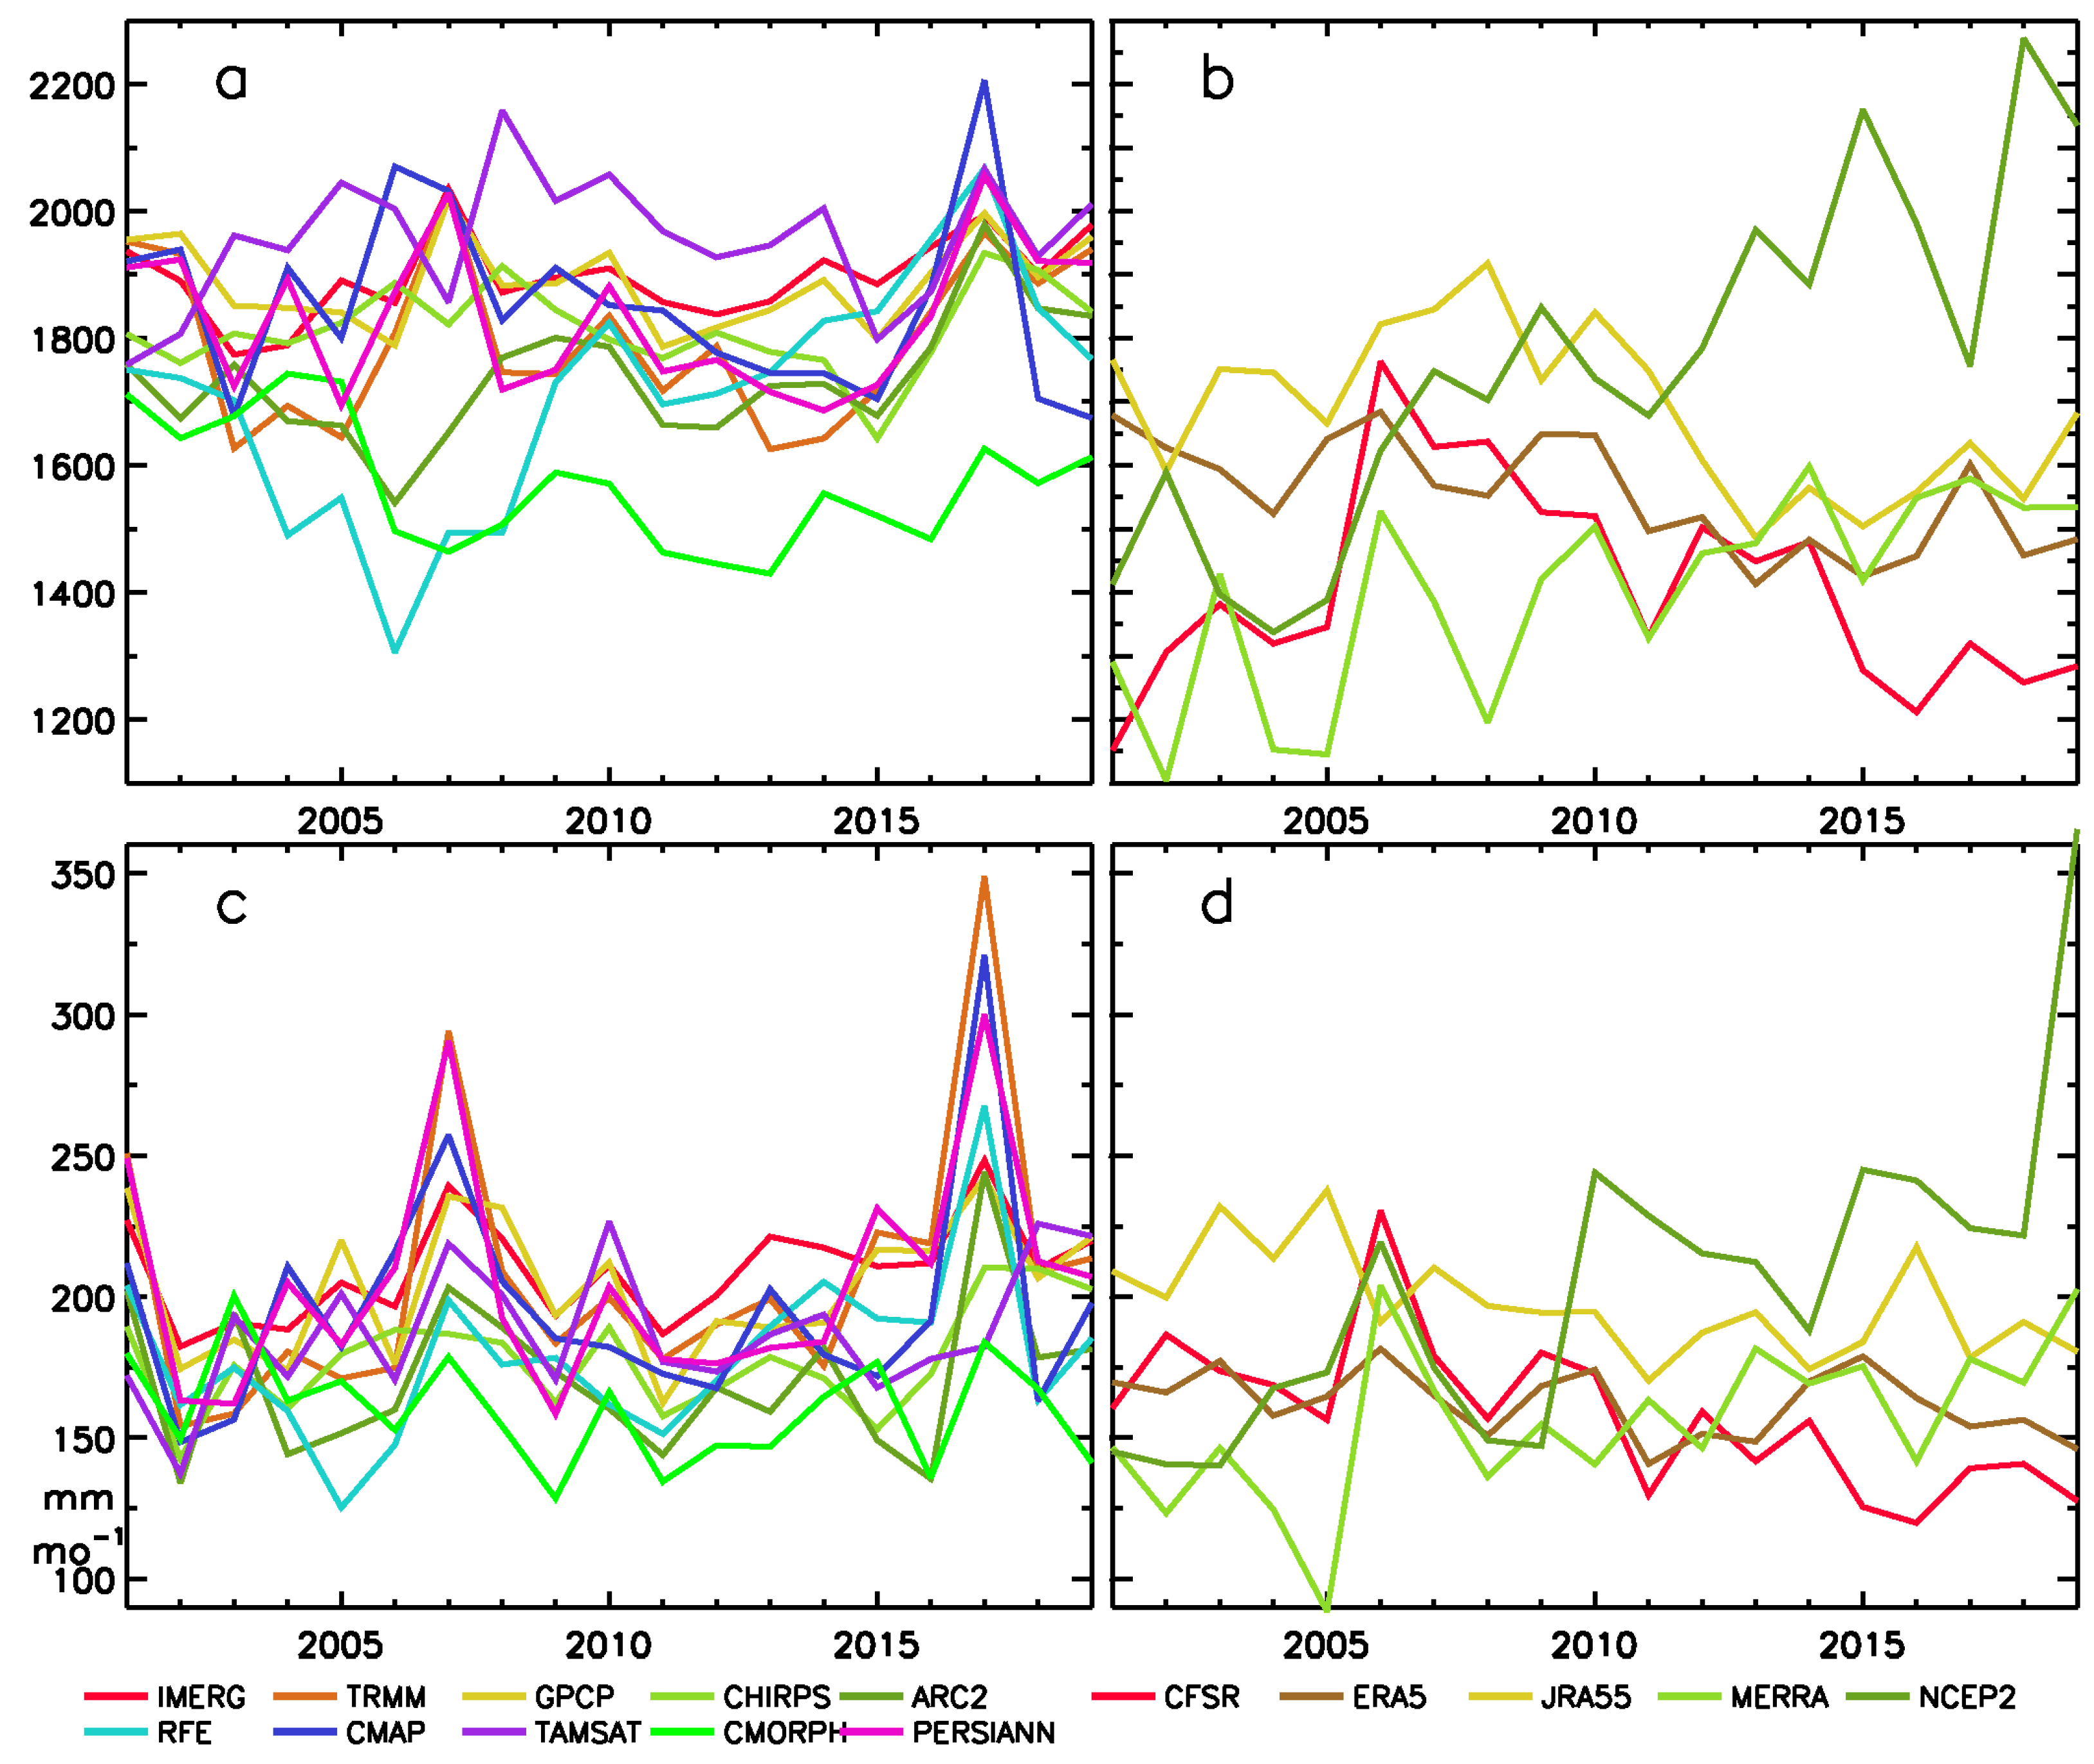
Figure 14 shows the interannual variability of rainfall over Lake Victoria for the year and for the month of November based on the satellite products. For annual rainfall (Figure 14a), the sequence of inter-annual variability is similar in all products, but there is an extreme diversity in magnitude. CMAP is an outlier on the low side, with annual rainfall on the order of 1000 to 1500 mm. IMERG-F is an extreme outlier on the positive side, with an annual rainfall ranging from roughly 2000 to 3000 mm. CMORPH CRT is also a positive outlier in most years. The remaining products are fairly similar in magnitude but generally somewhat higher than the GPCC V7 observational data set. In November (Figure 14c), the sequence of all satellite products is similar, however there are numerous discrepancies. Overall, CMORPH CRT and IMERG-F are again outliers on the positive side and CMAP is an outlier on the negative side. Nicholson et al. [2] noted the extremely positive bias of IMERG-F over the lake and attributed it to problems with passive microwave retrievals (PMWs). Since CMORPH CRT relies on PMW, its over-estimation is not surprising. Nicholson et al. [2] noted that CMAP performed poorly over the Congo Basin, exhibiting a very high root mean square error and also a large bias. However, the latter was mostly positive.
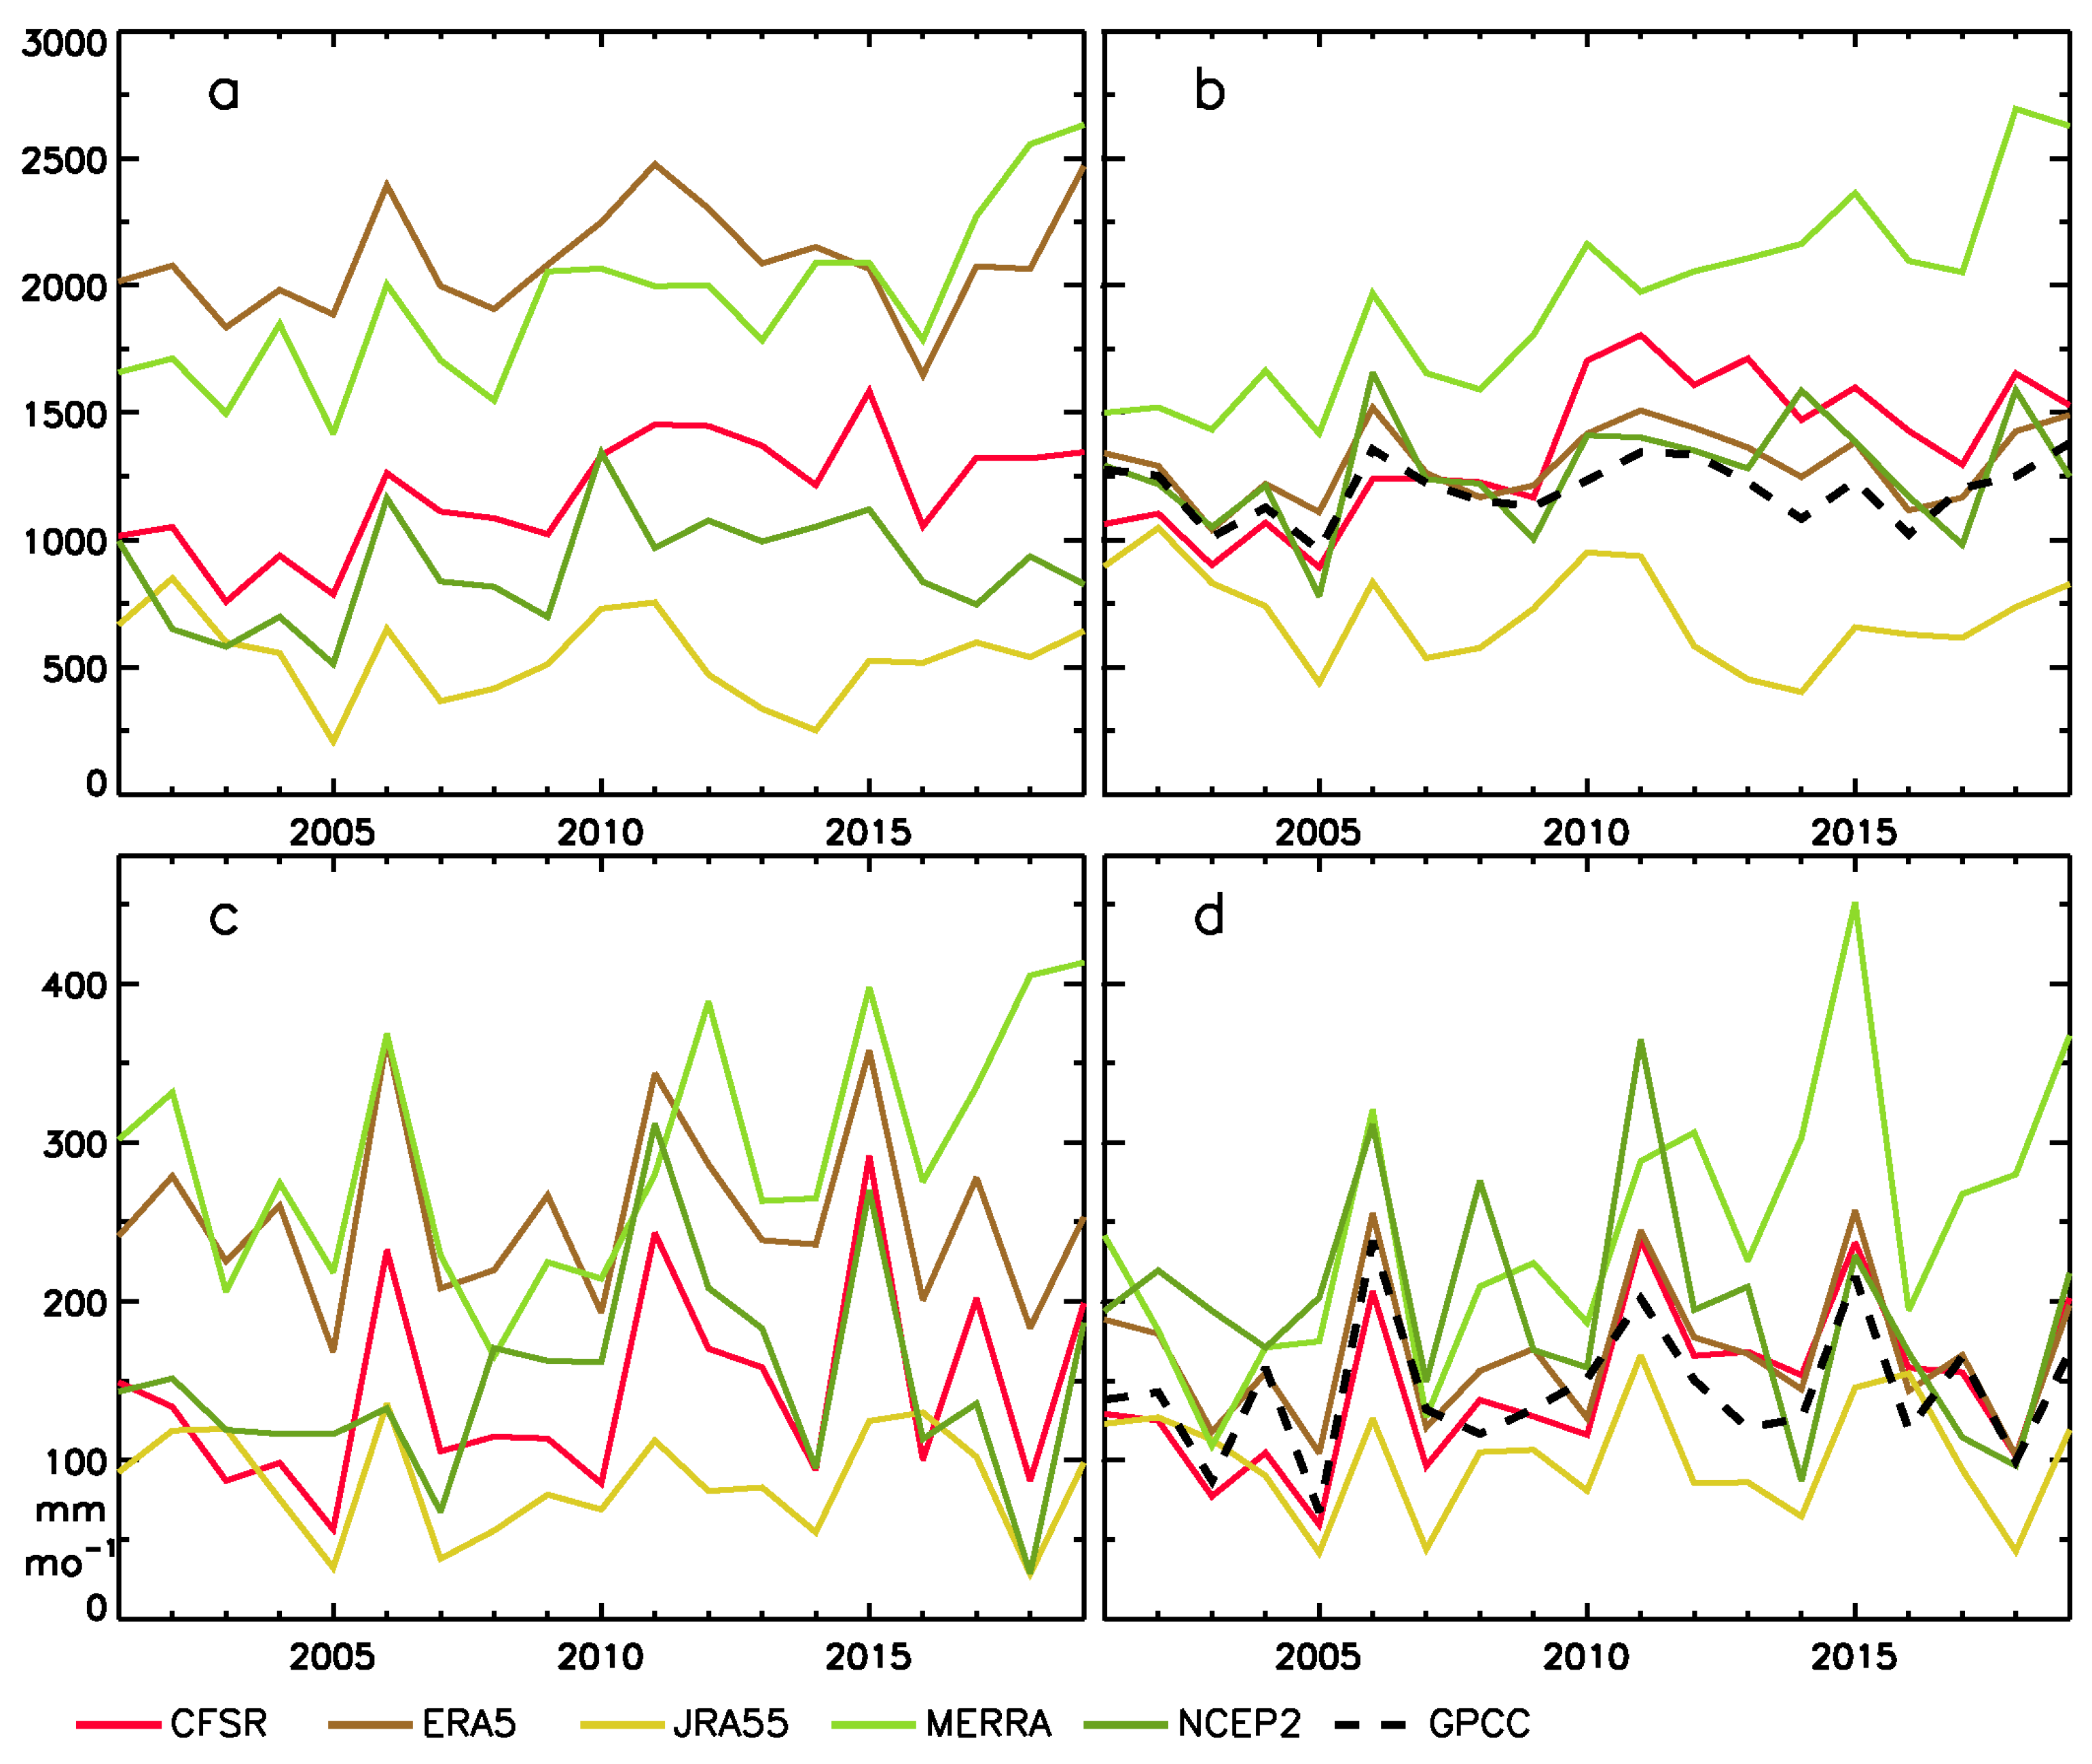
The diversity of annual rainfall estimates for the reanalysis products (Figure 15) is much greater. The lowest (JRA55) is on the order of 500mm while the highest (ERA 4) generally gives values between 2000 and 2500 mm. The sequence of interannual variability is also quite disparate among the products. The same holds true for November.
The picture is very different for the Lake Victoria catchment. Except for CMAP, there is excellent agreement among the satellite products both for annual rainfall (Figure 14c) and for November rainfall (Figure 14d). The agreement is excellent for both the magnitude of rainfall and for the sequence of interannual variability. CMORPH CRT, ARCv2, and RFE 2.0 give the lowest values. Agreement is particularly strong among the remaining products, and they agree closely with GPCC V7. In contrast to the situation over the lake, IMERG-F appears to provide excellent values over the catchment. Notably, a good array of stations is available in that area.
In contrast to the satellite products, there is an extreme diversity among the reanalysis products (Figure 15), especially for annual rainfall. Values for CFSR and ERA 5 are fairly similar in magnitude, but JRA55 is an extreme outlier on the low side and MERRA2 is an extreme outlier on the high side. The contrasts increase steadily between 2001 and 2019. The same holds true for the November estimates, except that NCEP II is also an outlier in most years.
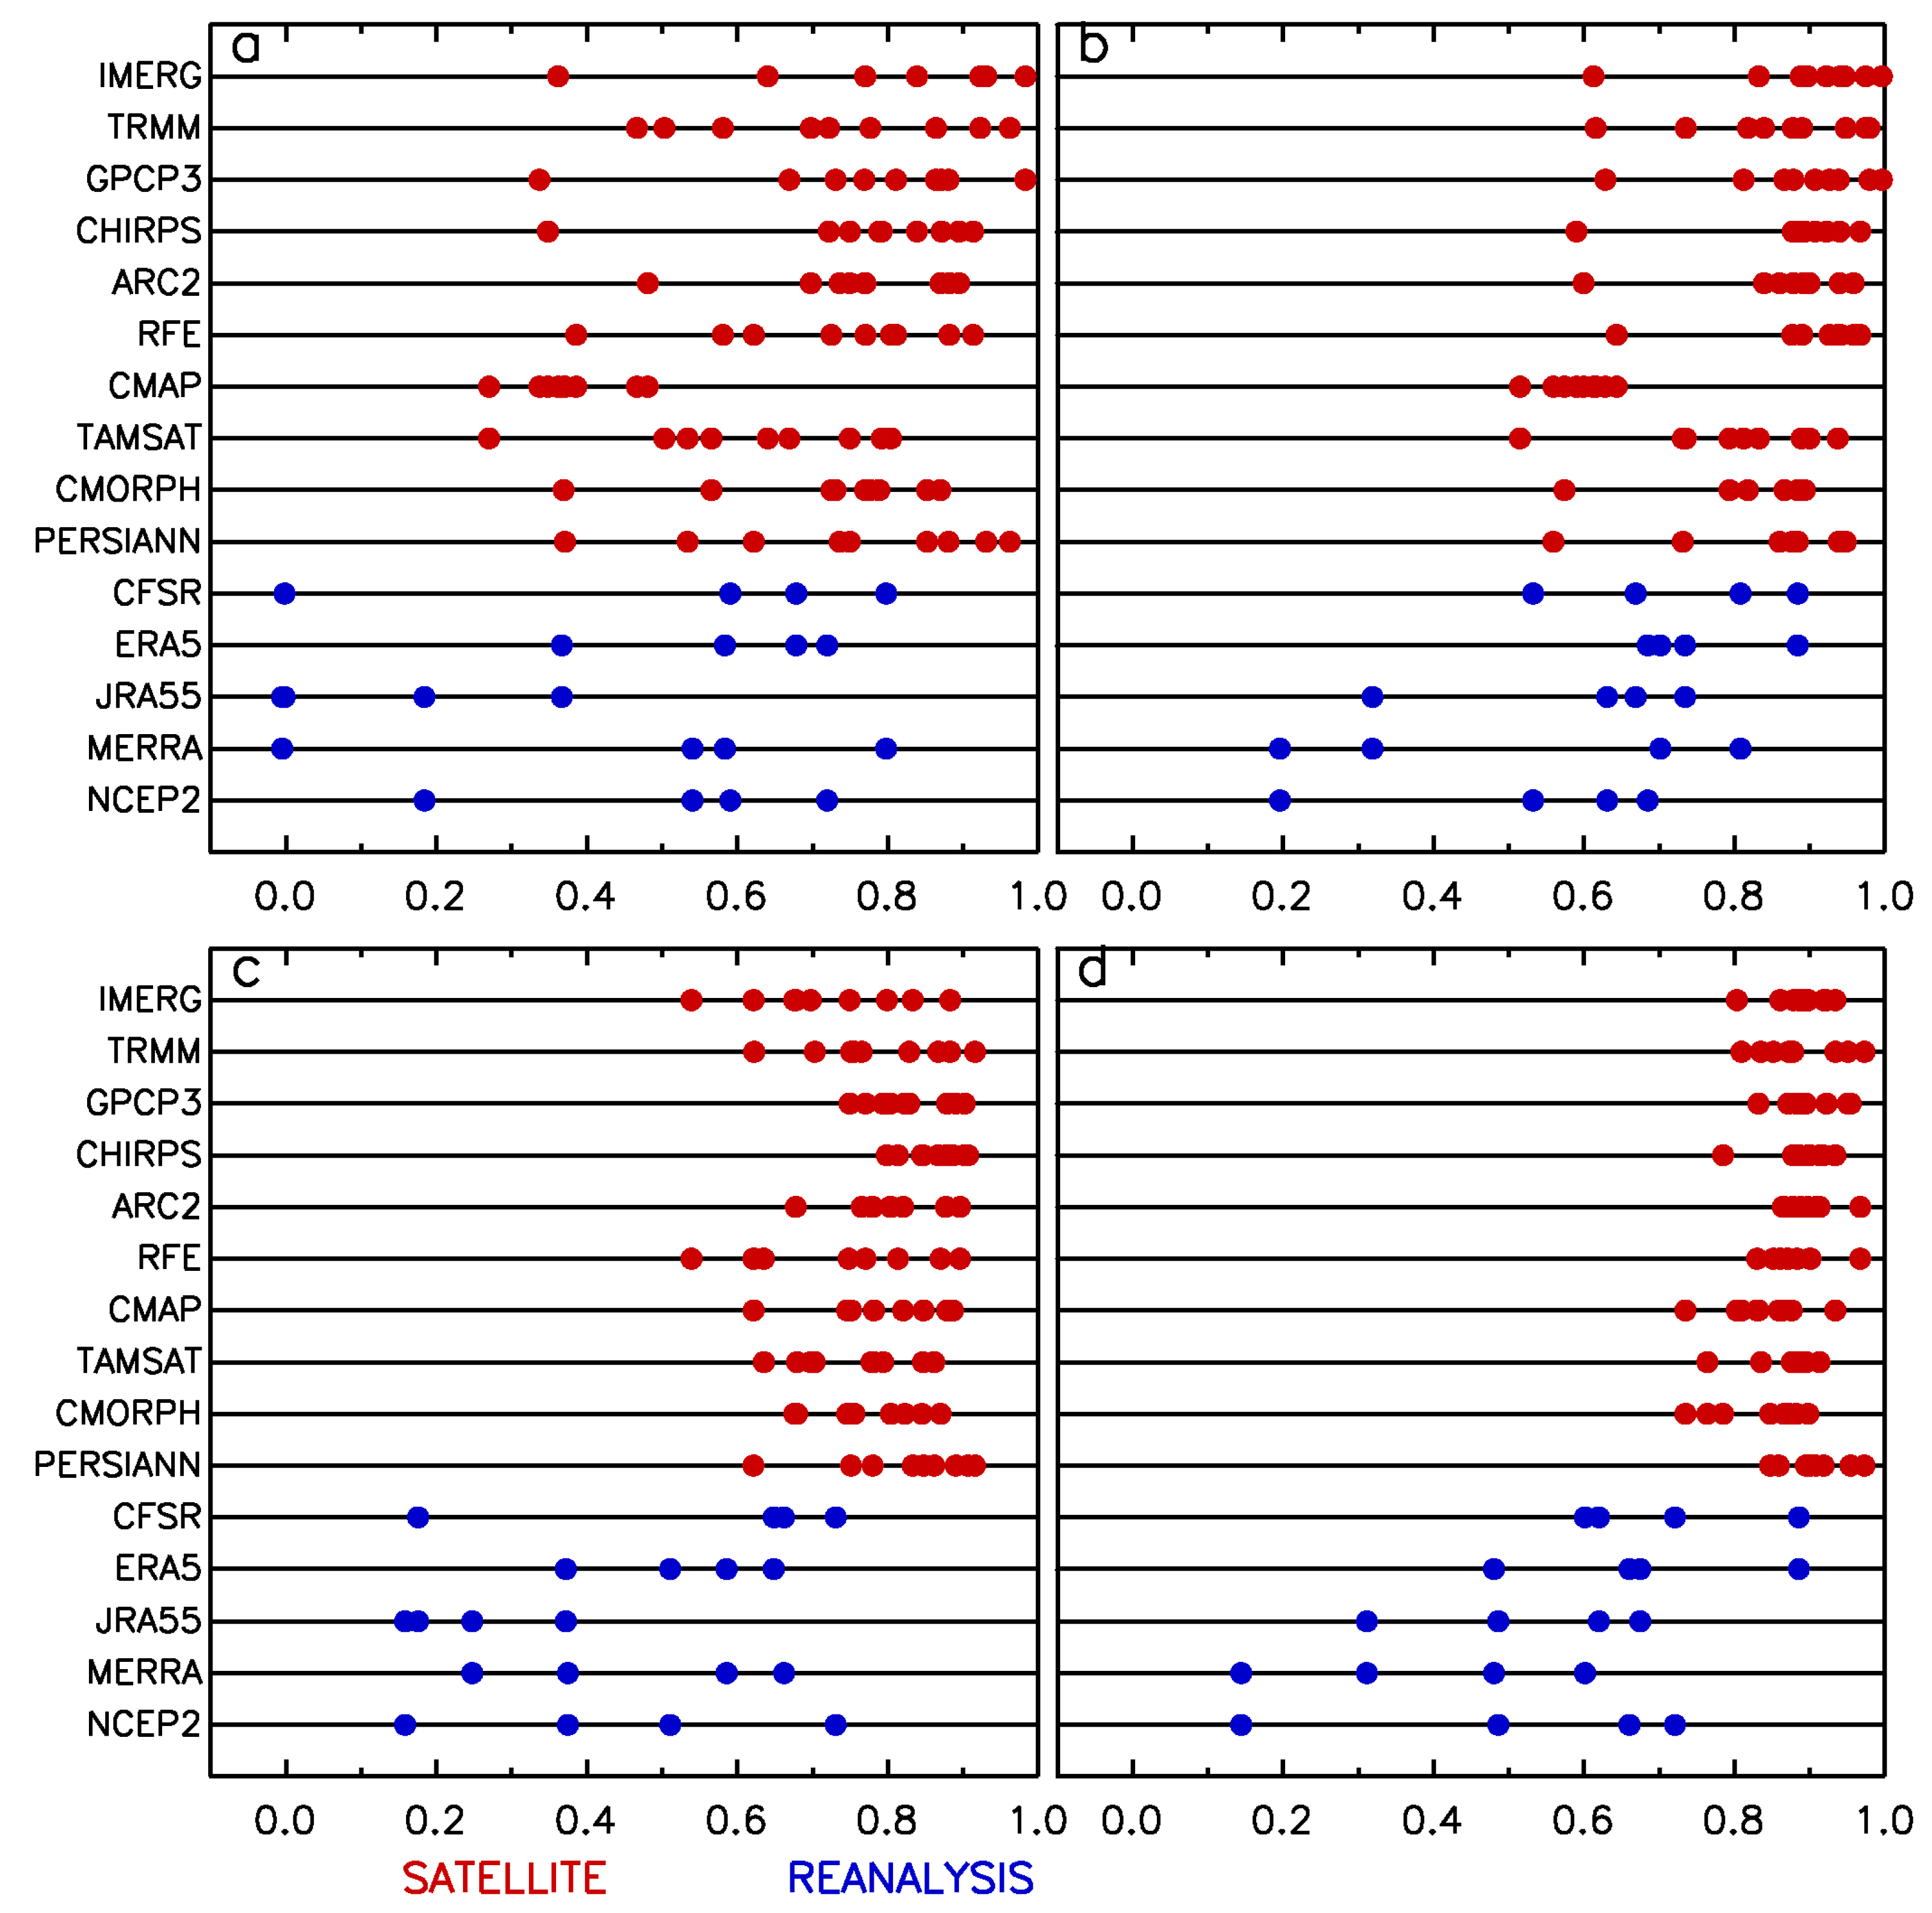
The correlations among the products are shown for both the lake and catchment in Figure 16. As with the Congo, the correlations among the satellite products are much higher than the correlations among the reanalysis products. Those for November are also clearly higher than for annual rainfall. Regarding the annual rainfall over the catchment, no products clearly emerge as the best, but correlations are notably lower with CMAP, TAMSAT3, and CMORPH CRT, suggesting that these products might not be highly reliable in this region. November, however, suggests that the best performance may be from IMERG-F, TRMM 3B43, CHIRPS2, RFE 2.9, and ARCv2. Again, correlations are notably lower for CMAP, TAMSAT3, CMORPH CRT, and PERSIANN-CDR.
A surprising result is the higher correlations among satellite products over the lake itself. The diversity in magnitude among the various products was noted earlier. Figure 14 shows that most satellite products tend to show a similar pattern of interannual variability. However, variability over the lake is more extreme, which may the reason for the higher correlations.
3.3.3. Trends
The examination of trends in data sets is a common approach used for studying climatic variability and change. Zhou et al. [20], for example, compared recent trends in rainfall, vegetation productivity, and total water storage in an attempt to demonstrate deforestation in the Congo rain forest and link it to a drying trend.
Here, the trend in each of the annual time series in Figure 12, Figure 14 and Figure 15 is assessed using linear regression. Values are indicated in Table 4. For the Congo Basin, the calculated trends vary between −1.15 and +4.19 mm per year per decade. Of the 15 products, there are negative trends in five cases for annual rainfall. Notably, the spread among the satellite products is much smaller; they range from 1.95 to −0.80 for annual data.
For the Lake Victoria region, where some satellites appeared to perform well, the diversity of the trend estimates is as large as or greater than that for the Congo region. However, almost all of the products register a positive trend between 2001 and 2019. For annual rainfall, the magnitude of the trend varies between −0.47 and +4.44 mm per year per decade for Lake Victoria and between −1.05 and +6.04 for its catchment.
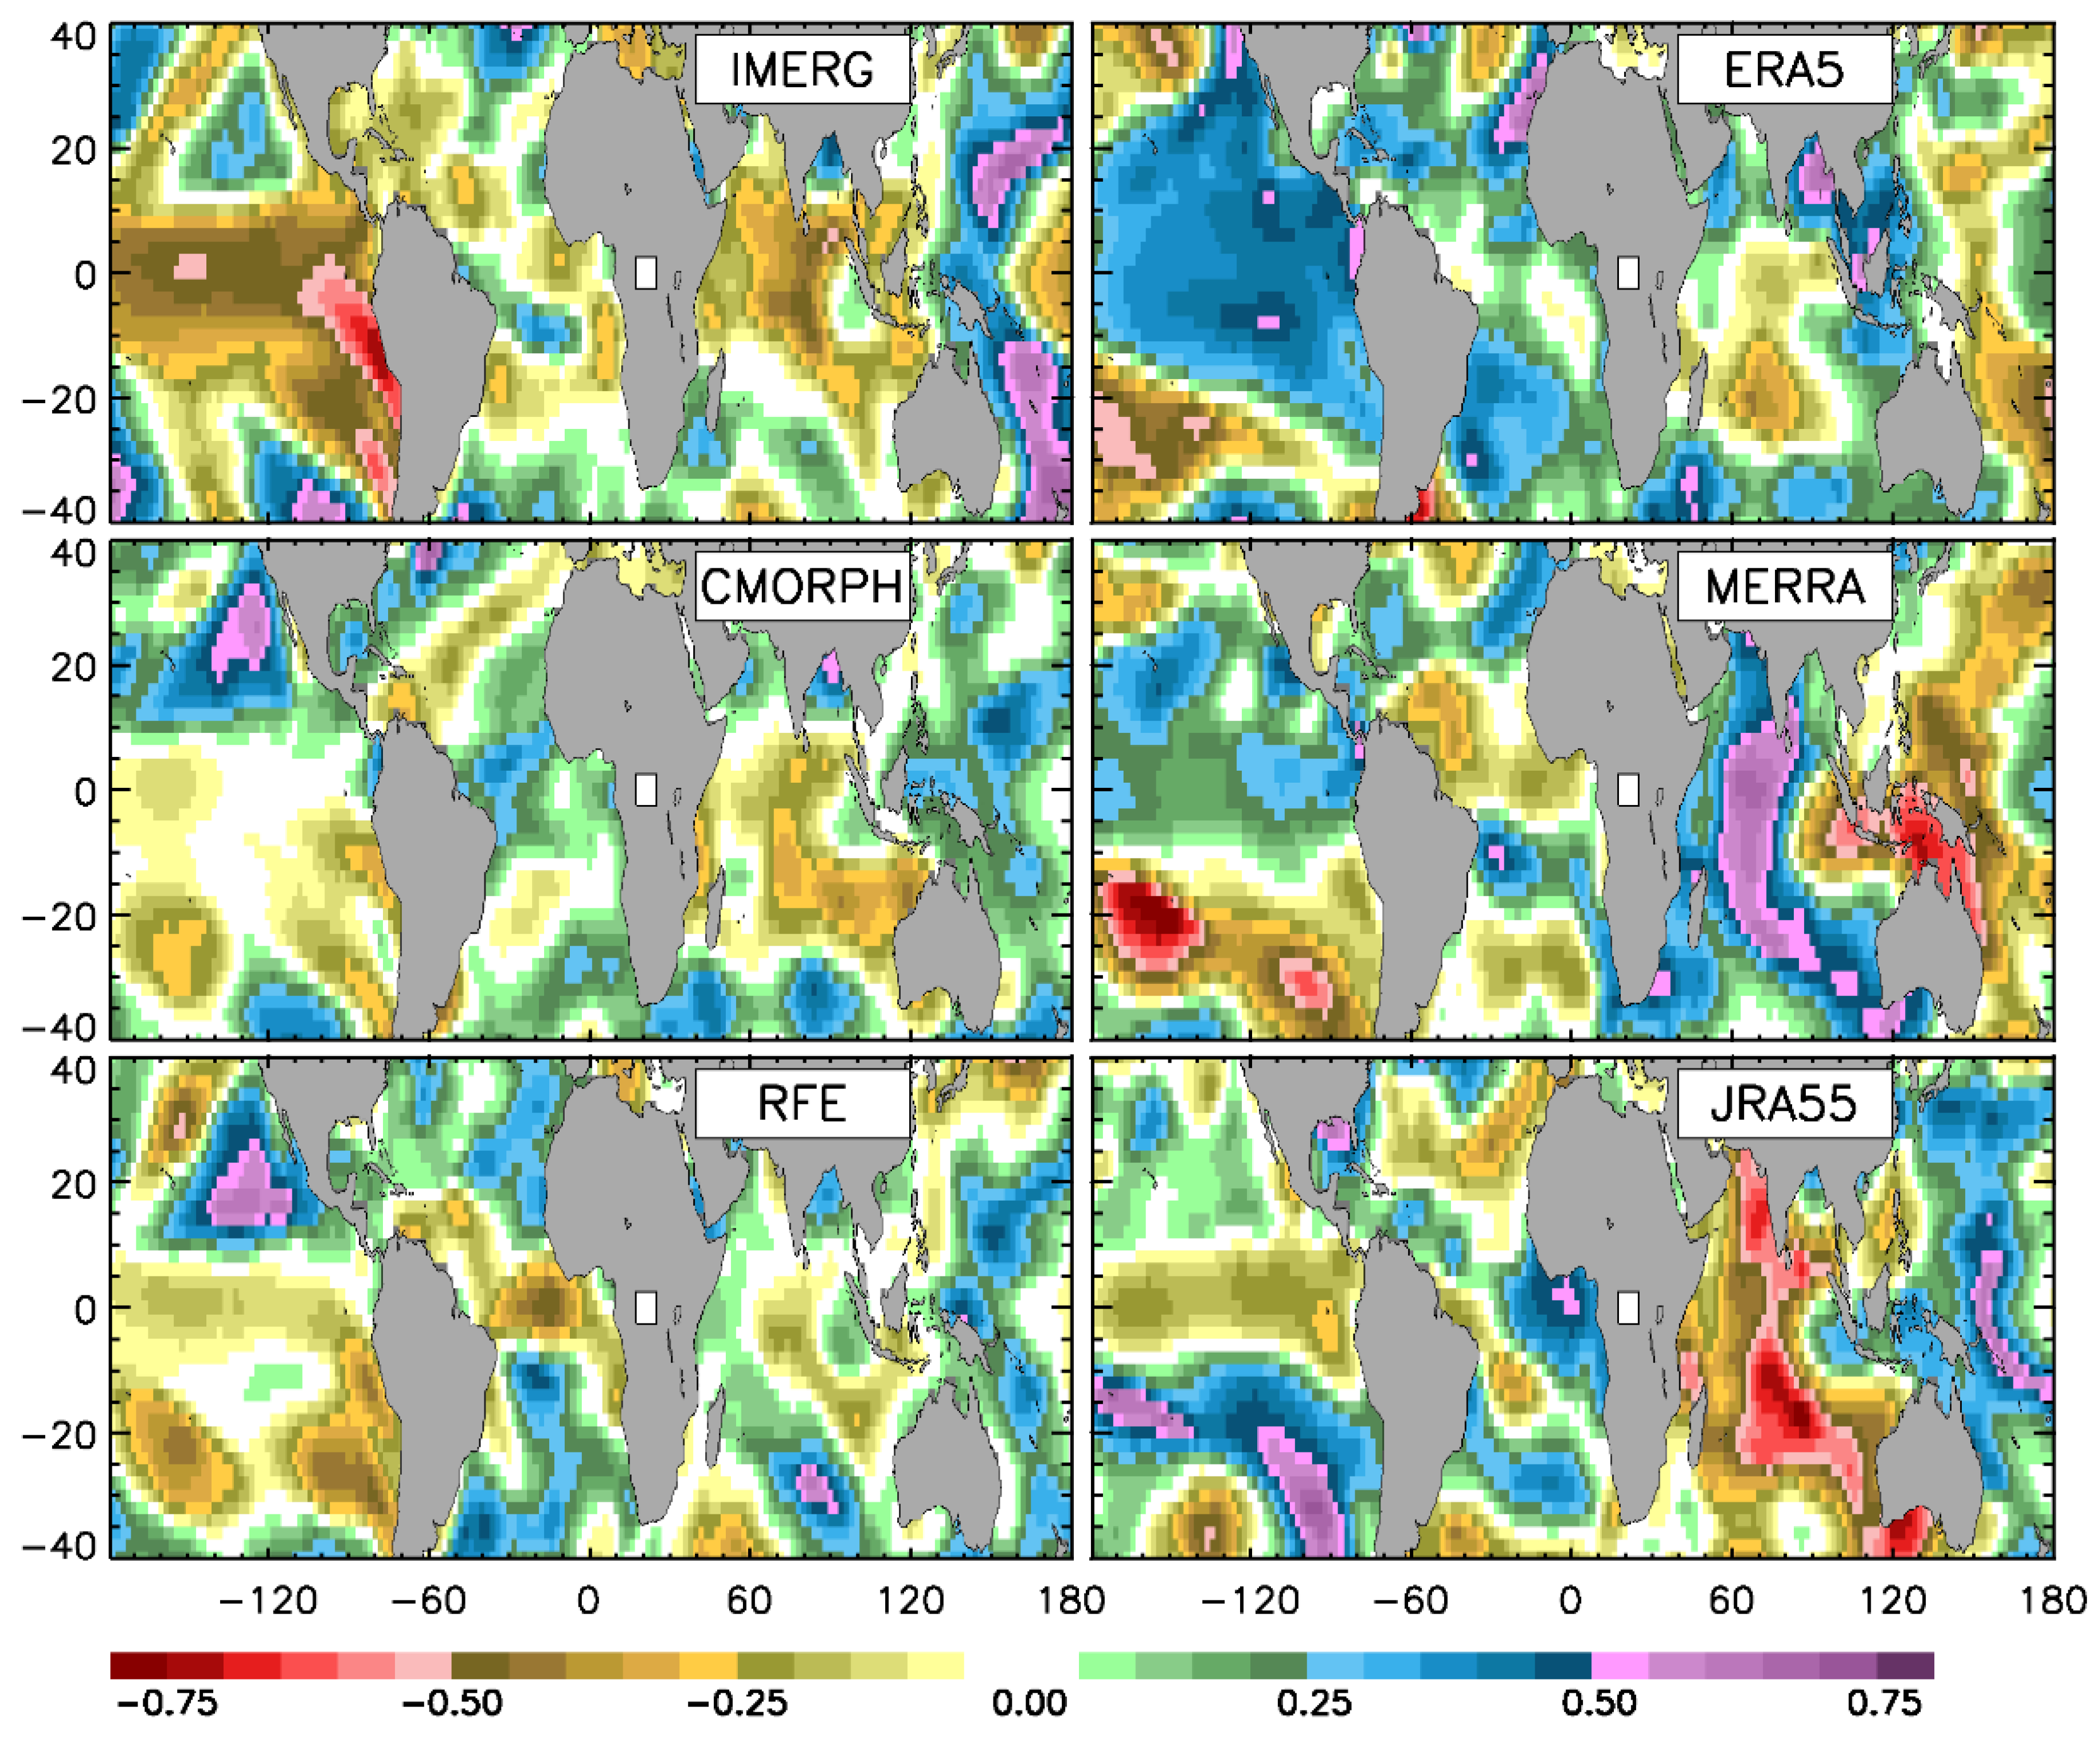
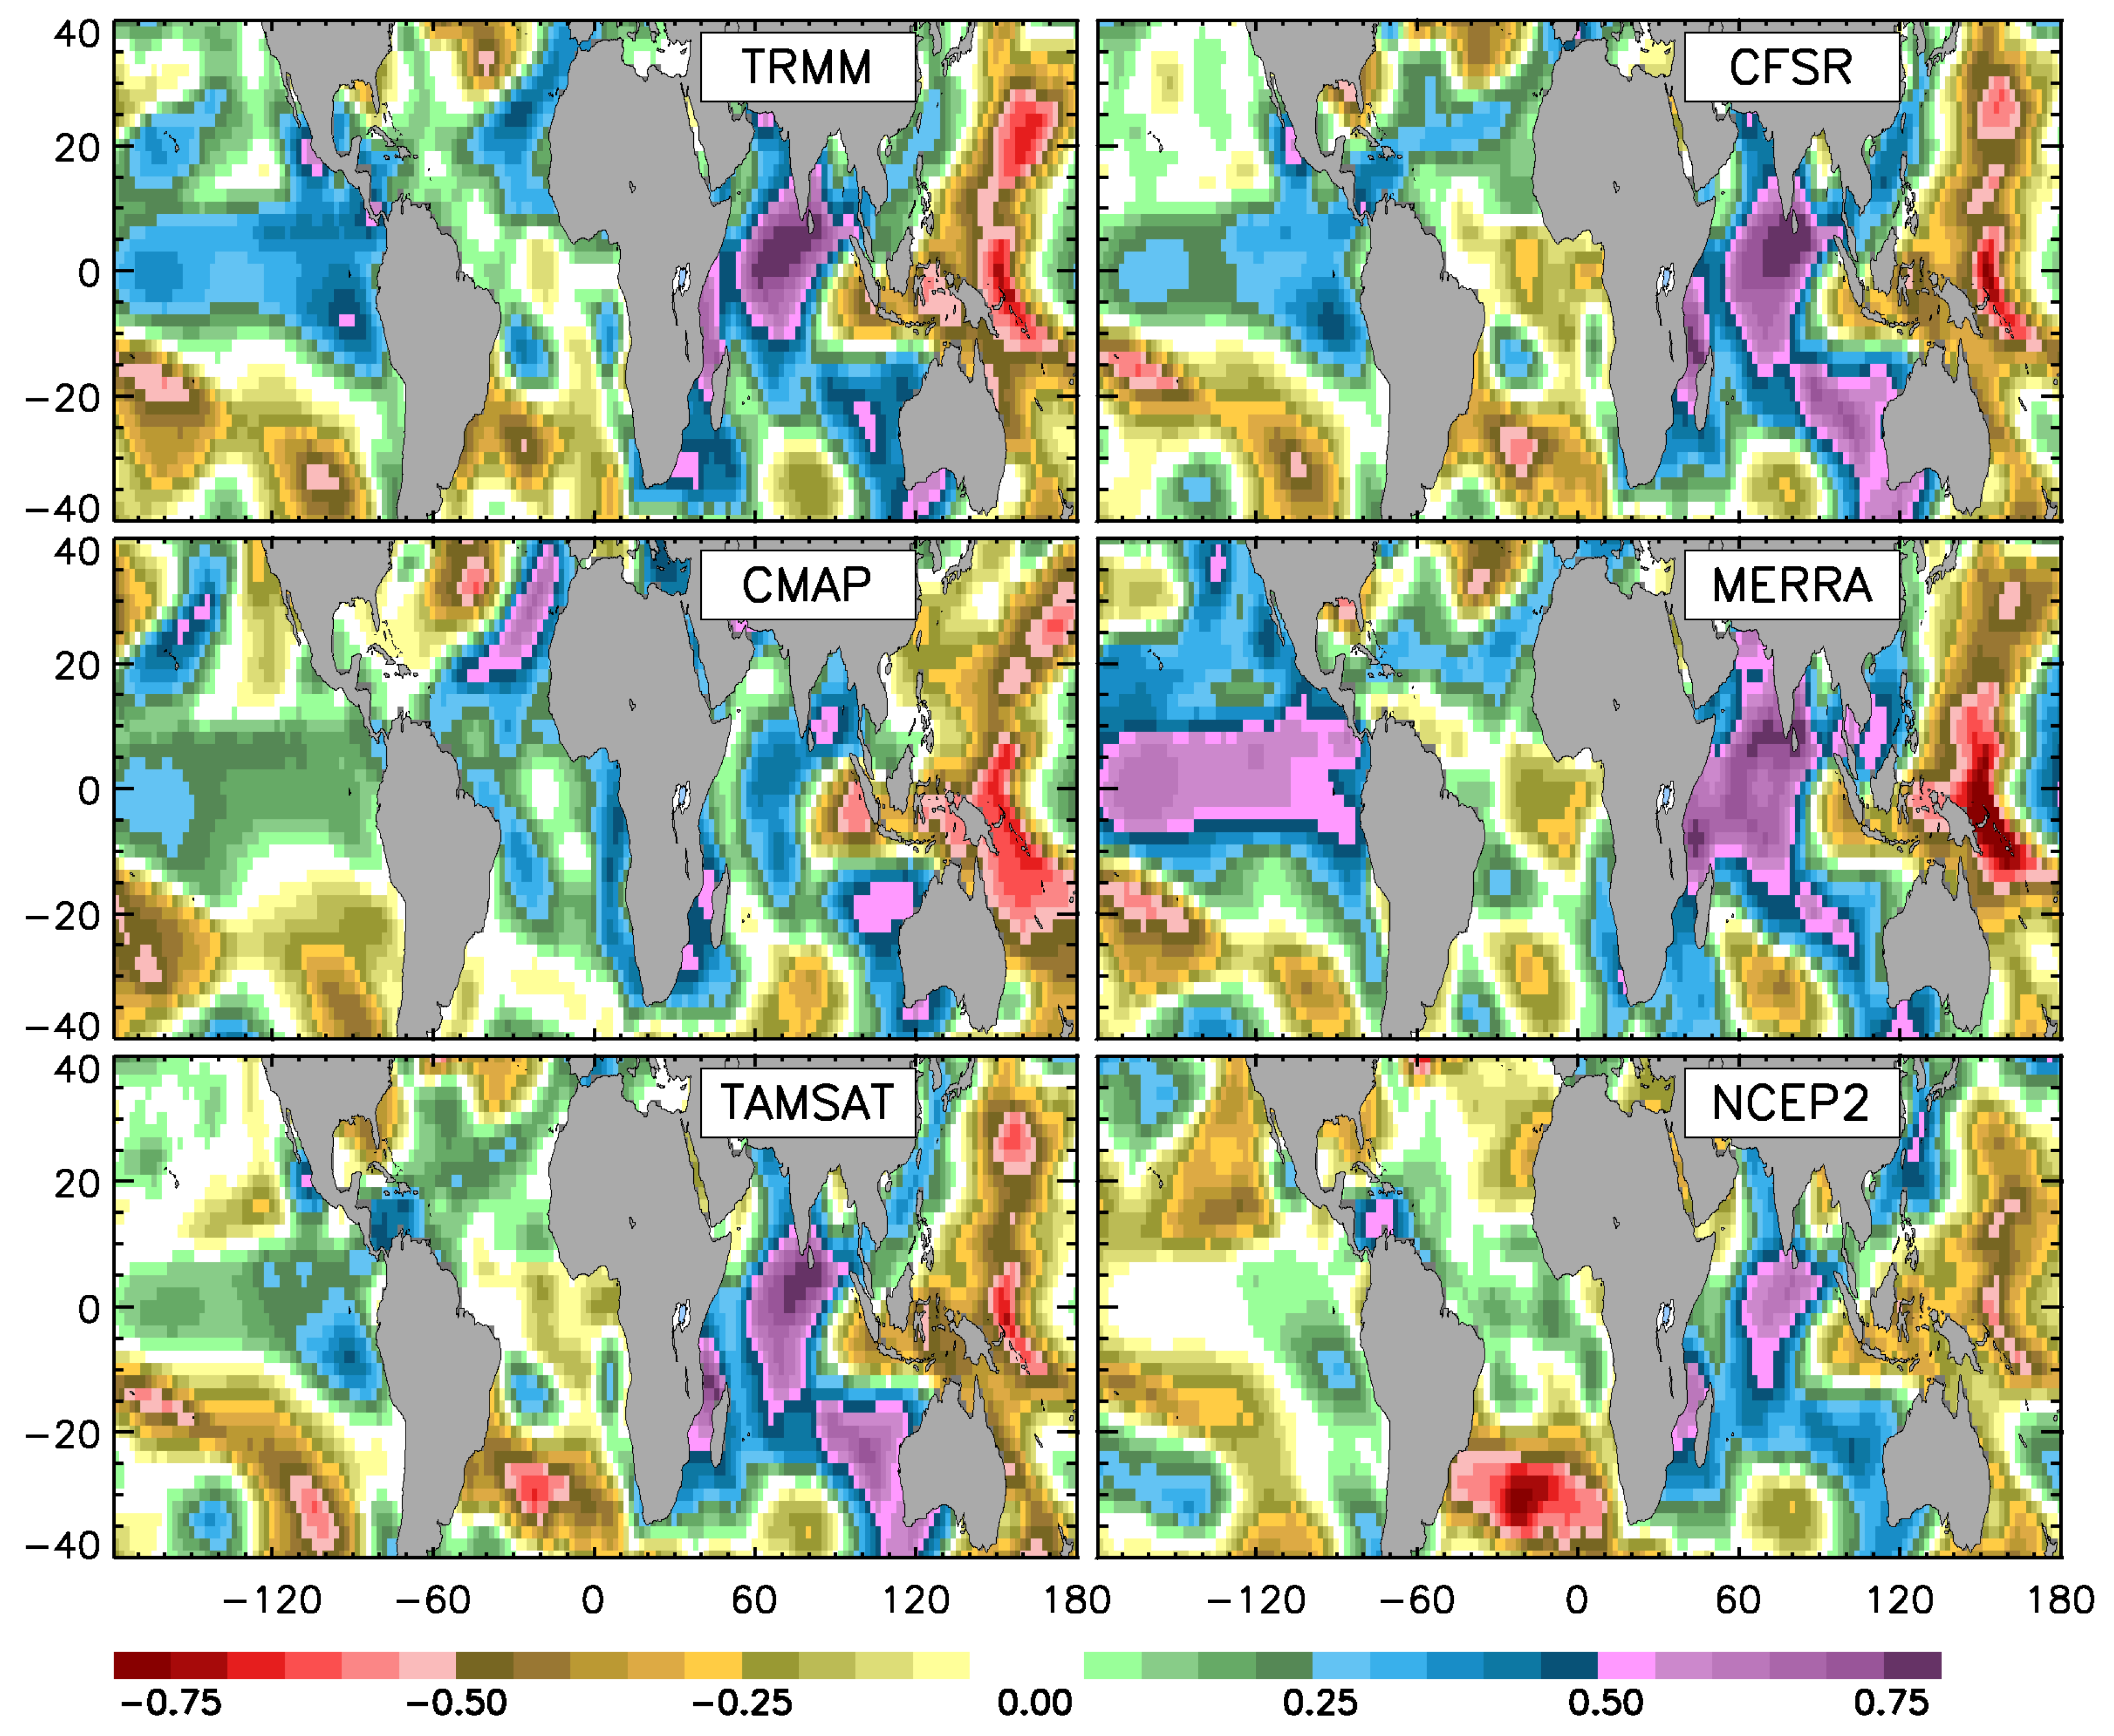
3.4. Links to Large-Scale Factors in Variability
The November rainfall time series for each product for the Lake Victoria catchment and the Congo region was correlated with sea-surface temperatures (Figure 17 and Figure 18). Because the time series of over-lake rainfall is so similar to that over the catchment, correlations with over-lake rainfall were not carried out. From these, a handful are presented here to illustrate the difficulty posed by the product differences in identifying causal factors in variability. The various time series are also correlated with the Niño 3.4 SSTs, the DMI, and SSTs in the equatorial and eastern Atlantic (see Figure 2). Values are given in Table 5.
Figure 17 shows the SST correlations for the Congo November rainfall time series from the satellite products RFE 2.0, CMORPH CRT, and IMERG-F, and the reanalysis products ERA5, MERRA2, and JRA55. ERA5 suggest that the main forcing is from the Pacific, with rainfall being positively correlated with SSTs. There is also some contribution from the isolated areas of the Atlantic and Indian Oceans. JRA55 shows predominantly negative correlations in the equatorial Pacific, positive in the higher latitudes, and extremely high negative correlations within the Indian Ocean. MERRA2 shows extremely high positive correlations within the Indian Ocean. Nearly everywhere, the correlations are of opposite sign in Merra2 and JRA55. The correlations shown with IMERG-F tend to be opposite in sign to those of ERA5, especially in the Pacific. CMORPH CRT and RFE 2.0 fail to show a strong link to the Pacific and, overall, show weak correlations. Notably, they show correlations of the opposite sign in the equatorial Atlantic.
Figure 18 shows the SST correlations for the Lake Victoria catchment. Those for Lake Victoria itself are exceedingly similar and are therefore not shown here. TRMM 3B43 shows a pattern that is well known to be associated with interannual variability of the East African short rains of the boreal autumn. This includes a link to both El Niño and the Indian Ocean Dipole. TAMSAT3 and CMAP show similar patterns in the Indian Ocean and the western Pacific, but fail to show a link to El Niño. CMAP shows strong correlations in the equatorial Atlantic that are not indicated in other products. The similarity in the correlations for the reanalysis products are better than in the Congo region, but there are still strong disparities among them. Both MERRA2 and CFSR show patterns resembling that of TRMM 3B43. However, CFSR shows a limited and barely significant correlation with the tropical Pacific. NCEP II shows weaker correlations overall and the strongest correlations in the western Pacific.
4. Discussion
The two primary results of this study are to demonstrate the strong diversity of rainfall estimates from satellite and reanalysis products and to show that this diversity is strongly dependent on the region considered. Sun et al. [1], examining precipitation data sets on a global basis, demonstrated similar findings. Figure 13 and Figure 16 amply demonstrate this diversity by showing the correlations between products over the Congo, Lake Victoria, and the Victoria catchment for annual and November rainfall. This diversity suggests that many of the rainfall estimates are unreliable.
The lowest correlations are among the reanalysis products. The correlations are very low in all three regions and for both annual and November rainfall. For the satellite products, correlations are considerably lower for the Congo region than for the Lake Victoria region. They are also higher for November than for annual rainfall for both the Lake Victoria region and the Congo. The reason for this is not clear.
An unexpected finding is the relatively uniform estimates over the complex terrain within the Lake Victoria catchment. As indicated earlier, such terrain can pose problems for the remote sensing of precipitation. Notably, the impact of terrain was lower than the impact of the lack of gauge stations, such as over the Congo Basin.
It would be good if one or more of the satellite products would clearly emerge as most reliable in these regions. No validation was carried out in this study, in part because of the absence of recent gauge data in the Congo region and over Lake Victoria. Based on the various analyses, however, some subjective comments can be made. Most satellite products, with the exception of CMORPH CRT, appear to capture the spatial pattern over the Congo. The low-resolution products fail to show any semblance of the spatial pattern over the Lake Victoria catchment, and TRMM 3B43, IMERG-F, and CHIRPS2 tend to overestimate rainfall over much of the catchment. The results of the seasonal cycle suggest poor performance of CMORPH CRT, RFE 2.0, TAMSAT3, and CMAP. The inter-product correlations suggest good performance of IMERG-F, TRMM 3B43, GPCP V3.1, CHIRPS2, and PERSIANN-CDR. Similar results were obtained by Nicholson et al. [2]. What does stand out clearly in the results is that the reanalysis products are not reliable and therefore should not be used to evaluate rainfall.
Another result that emerges is the overestimation of over-lake rainfall by IMERG-F over Lake Victoria. Nicholson et al. (2021a) showed that this is a general problem with IMERG-F over the East African lakes, with the cause most likely lying in the passive microwave estimates utilized. This issue is discussed in detail in Nicholson et al. [2].
5. Conclusions
In most of the analyses present in this study, there is great diversity in the rainfall estimates by the various products. This suggests that many of the rainfall estimates are unreliable. That is clearly the case with the reanalysis products considered. They should not be used to estimate rainfall over equatorial Africa.
In the absence of a true validation study, the “best” products cannot be ascertained. However, a collective look at the results suggests that, in the regions studied, the more reliable satellite products for monthly and annual rainfall include IMERG-F, TRMM 4B43, GPCP V3.1, CHIRPS2, and PERSIANN-CDR. Results could be different at the sub-monthly scale.
The low correlations among the various products, the contrasts in the temporal trends exhibited by them and in the correlations with causal factors indicate that it is difficult to assess interannual variability and determine its causes in the regions studied. Depending on the product used, very different conclusions could be reached. It is imperative that any such study carefully choose and, if possible, validate the product or products used.
This study also demonstrated a marked contrast in the diversity of satellite rainfall estimates between areas with good station coverage (e.g., the Lake Victoria catchment) and poor station coverage (e.g., the Congo Basin region). Sun et al. [1] conducted a study on the reliability of precipitation data sets on a global basis and similarly concluded that the reliability is mainly limited by the number and spatial coverage of surface stations, a finding echoed by Nicholson et al. [2]. This is an acute problem because gauge is either scarce or exceedingly difficult to obtain in many areas of the world, but especially in parts of Africa.
The lack of observational data sets not only affects the reliability of precipitation products, but it also limits the ability to validate them. Some alternative approaches may be necessary. Munzimi et al. [68] used a long-term data set of historical isohyets to validate and bias correct rainfall estimates over the Congo Basin. Pombo et al. [69] did likewise in evaluating reanalysis products over Angola. Beighley et al. [29] evaluated three satellite rainfall products over the Congo Basin via comparison with stream flow and water storage. Peng et al. [70] used hydrologic modeling to evaluate satellite rainfall products in an arid region of Central Asia. Additional but non-quantitative checks include examining such variables as cloud cover and surface temperature.
Ideally, a re-emergence of adequate gauge networks over Africa would occur. At least two projects are promising in this context: SASSCAL has established some 150 stations in Angola, Botswana, Namibia, Zambia, and South Africa, and the TAHMO project hopes to establish 20,000 stations across the continent of Africa. They currently have 500 stations in 20 countries—This is a giant step forward.
Author Contributions
The first author (S.E.N.) designed and interpreted the various analyses, chose data sets, and wrote the manuscript. The second author (D.A.K.) performed the analyses and prepared the figures for publication. All authors have read and agreed to the published version of the manuscript.
Funding
This project was supported by two grants from the National Science Foundation, GEO/ATM 1,854,511 and EAR 1850661.
Data Availability Statement
The data sets utilized are all in the public domain. The links to these are indicated below. NIC131 data can be obtained from the authors.
Conflicts of Interest
The authors declare no conflict of interest.
References
- Sun, Q.; Miao, C.; Duan, Q.; Ashouri, H.; Sorooshian, S.; Hsu, K.-L. A review of global precipitation data sets: Data sources, estimation, and inter-comparisons. Rev. Geophys. 2018, 56, 79–107. [Google Scholar] [CrossRef] [Green Version]
- Nicholson, S.E.; Klotter, D.; Zhou, L.; Hua, W. Validation of satellite precipitation estimates over the Congo Basin. J. Hydrometeor. 2019, 20, 631–656. [Google Scholar] [CrossRef] [Green Version]
- Washington, R.; James, R.; Pearce, H.; Pokam, W.M.; Moufouma-Okia, W. Congo Basin rainfall climatology: Can we believe the climate models? Philos. Trans. Roy. Soc. B 2013, 368, 20120296. [Google Scholar] [CrossRef]
- Hua, W.; Zhou, L.; Nicholson, S.E.; Chen, H.; Qin, M. Assessing reanalysis data for understanding rainfall climatology and variability over central Equatorial Africa. Clim. Dyn. 2019, 53, 651–669. [Google Scholar] [CrossRef] [Green Version]
- Nicholson, S.E.; Klotter, D.; Hartman, A.T. Lake-effect rains over Lake Victoria and their association with Mesoscale Convective Systems. J. Hydrometeor. 2021, 22, 1353–1368. [Google Scholar]
- Dinku, T.; Ceccato, P.; Ropelewski, C.F. Validation of satellite rainfall products over over East Africa’s complex topography. Int. J. Remote Sens. 2007, 29, 1503–1526. [Google Scholar] [CrossRef]
- Dinku, T.; Chidzamwa, S.; Ropelewski, C.F. Validation of high-resolution satellite rainfall products over complex terrain. Int. J. Remote Sens. 2008, 29, 4097–4110. [Google Scholar] [CrossRef]
- Dinku, T.; Connor, S.J.; Ceccato, P. Comparison of CMORPH and TRMM-3B42 over mountainous regions of Africa and South America. In Satellite Rainfall Applications for Surface Hydrology; Springer: Dordrecht, The Netherlands, 2010; pp. 193–204. [Google Scholar]
- Dinku, T.; Ceccato, P.; Connor, S.J. Challenges of satellite rainfall estimation over mountainous and arid parts of east Africa. Int. J. Remote Sens. 2011, 21, 5965–5979. [Google Scholar] [CrossRef]
- Bitew, M.M.; Gebremichael, M. Evaluation through independent measurements: Complex terrain and humid tropical region in Ethiopia. In Satellite Rainfall Applications for Surface Hydrology; Springer: Dordrecht, The Netherlands, 2010; pp. 205–214. [Google Scholar]
- Bartsotas, N.S.; Aganostou, E.N.; Nikolopoulos, E.I.; Kallos, G. Investigating satellite precipitation uncertainty over Complex Terrain. J. Geophys. Res.–Atmos. 2018, 123, 5346–5359. [Google Scholar] [CrossRef]
- Ehsan Bhuiyan, M.A.; Nikolopoulos, E.I.; Anagnostou, E.N. Machine Learning-Based Blending of Satellite and Reanalysis Precipitation Datasets: A Multiregional Tropical Complex Terrain Evaluation. J. Hydrometeor. 2019, 20, 2147–2161. [Google Scholar] [CrossRef]
- Di Baldassarre, G.; Elshamy, M.; van Griensven, A.; Soliman, E.; Kigobe, M.; Ndomba, P.; Mutemi, J.; Mutua, F.; Moges, S.; Xuan, Y.; et al. Future hydrology and climate in the River Nile basin: A review. Hydrolog. Sci. J. 2011, 56, 199–211. [Google Scholar] [CrossRef] [Green Version]
- Sene, K.J. Theoretical estimates for the influence of Lake Victoria on flows in the upper White Nile. Hydrolog. Sci. J. 2000, 45, 125–145. [Google Scholar] [CrossRef] [Green Version]
- Akurut, M.; Willems, P.; Niwagaba, C.B. Potential Impacts of Climate Change on Precipitation over Lake Victoria, East Africa, in the 21st Century. Water 2014, 6, 2634–2659. [Google Scholar] [CrossRef] [Green Version]
- Vanderkelen, I.; van Lipzig, N.P.M.; Thiery, W. Modelling the water balance of Lake Victoria (East Africa)-Part 2: Future projections. Hydrol. Earth Syst. Sci. 2018, 22. [Google Scholar] [CrossRef] [Green Version]
- Kent, C.; Chadwick, R.; Rowell, D.P. Understanding uncertainties in future projections of seasonal tropical precipitation. J. Clim. 2015, 28, 4390–4413. [Google Scholar] [CrossRef]
- Otieno, V.O.; Anyah, R.O. CMIP5 simulated climate conditions of the Greater Horn of Africa (GHA). Part II: Projected climate. Clim. Dyn. 2013, 41, 2099–2113. [Google Scholar] [CrossRef]
- Souverijns, N.; Thiery, W.; Demuzere, M.; Van Lipzig, N.P.M. Drivers of future changes in East African precipitation. Environ. Res. Lett. 2016, 11, 114011. [Google Scholar] [CrossRef] [Green Version]
- Zhou, L.; Tian, Y.; Myneni, R.B.; Ciais, P.; Saatchi, S.; Liu, Y.Y.; Piao, S.; Chen, H.; Vermote, E.F.; Song, C.; et al. Widespread decline of Congo rainforest greenness in the last decade. Nature 2014, 509, 86–90. [Google Scholar] [CrossRef] [PubMed]
- Nicholson, S.E. The rainfall and convective regime over equatorial Africa, with emphasis on the Congo Basin. In Congo Basin Hydrology, Climate and Biogeochemistry: A Foundation for the Future; Alsdorf, D., Ed.; AGU Geophysical Monograph: Washington, DC, USA, 2021; in press. [Google Scholar]
- Nicholson, S.E.; Fink, A.H.; Funk, C. Meteorological causes of the catastrophic floods of October/November 2019 in equatorial Africa. Glob. Planet. Chang. 2021, in press. [Google Scholar]
- Huffman, G.J.; Bolvin, D.T. TRMM and Other Data Precipitation Data Set Documentation. NASA TRMM Doc. 2014, 42. Available online: https://gpm.nasa.gov/sites/default/files/document_files/3B42_3B43_doc_V7.pdf (accessed on 1 February 2021).
- Huffman, G.J.; Bolvin, D.T.; Nelkin, E.J.; Wolff, D.B.; Adler, R.F.; Gu, G.; Hong, Y.; Bowman, K.P.; Stocker, E.F. The TRMM Multi-satellite precipitation analysis: Quasi-global, multi-year, combined-sensor precipitation estimates at finer scale. J. Hydrometeor. 2007, 8, 38–55. [Google Scholar] [CrossRef]
- Huffman, J.G.; Bolvin, D.T.; Nelkin, E.J. Day 1 IMERG Final Run Release Notes. NASA Doc. 2015, 9. Available online: http://pmm.nasa.gov/sites/default/files/document_files/IMERG_FinalRun_Day1_release_notes.pdf (accessed on 1 March 2021).
- Cattani, E.; Merino, A.; Levizzani, V. Evaluation of monthly satellite-derived precipitation products over East Africa. J. Hydrometeor. 2016, 17, 2555–2573. [Google Scholar] [CrossRef]
- Dezfuli, A.K.; Ichoku, C.M.; Huffman, G.J.; Mohr, K.; Selker, J.S.; Van De Giesen, N.; Hochreutener, R.; Annor, F.O. Validation of IMERG precipitation in Africa. J. Hydrometeor. 2017, 18, 2817–2825. [Google Scholar] [CrossRef] [PubMed]
- Beighley, R.E.; Ray, R.; He, Y.; Lee, H.; Schaller, L.; Andreadis, K.M.; Durand, M.; Alsdorf, D.E.; Shum, C.K. Comparing satellite derived precipitation datasets using the Hillslope River Routing (HRR) model in the Congo River Basin. Hydrolog. Process. 2011, 25, 3216–3229. [Google Scholar] [CrossRef]
- Awange, J.L.; Ferreira, V.G.; Forootan, E.; Andam-Akorful, S.A.; Agutu, N.O.; He, X.F. Uncertainties in remotely sensed precipitation data over Africa. Int. J. Climatol. 2016, 36, 303–323. [Google Scholar] [CrossRef] [Green Version]
- Diem, J.E.; Hartler, J.; Ryan, S.J. Validation of satellite rainfall products for western Uganda. J. Hydrometeor. 2014, 15, 2030–2036. [Google Scholar] [CrossRef]
- Asadullah, A.; McIntyre, N.; Kigobe, M. Evaluation of five satellite products for estimation of rainfall over Uganda. Hydrolog. Sci. J. 2008, 53, 1137–1150. [Google Scholar] [CrossRef]
- Guo, R.F.; Lui, Y.B. Evaluation of satellite precipitation products with rain gauge data at different scales: Implications for hydrological applications. Water 2016, 8, 281. [Google Scholar] [CrossRef]
- Huffman, G.J.; Bolvin, D.T.; Nelkin, E.J.; Tan, J. Integrated Multi-Satellite Retrievals for GPM (IMERG) Technical Documentation (Technical Documentation). NASA 2019, 71. Available online: https://pmm.nasa.gov/data-access/downloads/gpm (accessed on 1 March 2021).
- Funk, C.; Peterson, P.; Landsfeld, M.; Pedreros, D.; Verdin, J.; Shukla, S.; Husak, G.; Rowland, J.; Harrison, L.; Hoell, A.; et al. The climate hazards infrared precipitation with stations—A new environmental record for monitoring extremes. Sci. Data 2015, 2, 150066. [Google Scholar] [CrossRef] [Green Version]
- Ashouri, H.; Hsu, K.L.; Sorooshian, S.; Braithwaite, D.K.; Knapp, K.R.; Cecil, L.D.; Nelson, B.R.; Prat, O.P. PERSIANN-CDR: Daily precipitation climate data record from multisatellite observations for hydrological and climate studies. Bull. Amer. Meteor. Soc. 2015, 96, 69–83. [Google Scholar] [CrossRef] [Green Version]
- Adler, R.F.; Huffman, G.J.; Chang, A.; Ferraro, R.; Xie, P.; Janowiak, J.; Rudolf, B.; Schneider, U.; Curtis, S.; Bolvin, D.; et al. The Version 2 Global Precipitation Climatology Project (GPCP) Monthly Precipitation Analysis (1979-Present). J. Hydrometeor. 2003, 4, 1147–1167. [Google Scholar] [CrossRef]
- Xie, P.; Arkin, P.A. Analyses of global monthly precipitation using gauge observations, satellite estimates, and numerical model predictions. J. Clim. 1996, 9, 840–858. [Google Scholar] [CrossRef] [Green Version]
- Xie, P.; Arkin, P.A. Global precipitation: A 17-year monthly analysis based on gauge observations, satellite estimates, and numerical model outputs. Bull. Amer. Meteor. Soc. 1997, 78, 2537–2558. [Google Scholar] [CrossRef]
- Love, T.B.; Kumar, V.; Xie, P.; Thiaw, W. A 20-Year Daily Africa Precipitation Climatology Using Satellite and Gauge Data. Preprints. In Proceedings of the 14th Conference on Applied Meteorology, Seattle, WA, USA, 2004; Available online: http://ams.confex.com/ams/pdfpapers/67484.pdf (accessed on 1 March 2021).
- Novella, N.S.; Thiaw, W.M. African Rainfall Climatology Version 2 for famine early warning systems. J. Appl. Meteor. Climatol. 2013, 52, 588–606. [Google Scholar] [CrossRef]
- Joyce, R.J.; Janowiak, J.E.; Arkin, P.A.; Xie, P. CMORPH: A method that produces global precipitation estimates from passive microwave and infrared data at high spatial and temporal resolution. J. Hydrometeor. 2004, 5, 487–503. [Google Scholar] [CrossRef]
- Xie, P.; Joyce, R.J.; Wu, S.; Yoo, S.-H.; Yarosh, Y.; Sun, F.; Lin, R. Reprocessed, bias-corrected CMORPH CRT global high resolution estimates form 1998. J. Hydrometeor. 2017, 18, 1617–1641. [Google Scholar] [CrossRef]
- Xie, P.; Janowiak, J.E.; Arkin, P.A.; Adler, R.; Gruber, A.; Ferraro, R. GPCP pentad precipitation analyses: An experimental data set based on gauge observations and satellite estimates. J. Clim. 2003, 16, 2197–2214. [Google Scholar] [CrossRef] [Green Version]
- Maidment, R.I.; Grimes, D.I.F.; Allan, R.; Greatrex, H.; Rojas, O.; Leo, O. Evaluation of satellite-based and model re-analysis rainfall estimates for Uganda. Meteorol. Appl. 2013, 20, 308–317. [Google Scholar] [CrossRef] [Green Version]
- Maidment, R.; Grimes, D.; Allan, R.P.; Tarnavsky, E.; Stringer, M.; Hewison, T.; Roebeling, R.; Black, E. The 30 year TAMSAT African Rainfall Climatology And Time series (TARCAT) data set. J. Geophys. Res. 2014, 119, 10,619–10,644. [Google Scholar] [CrossRef] [Green Version]
- Tarnavsky, E.; Grimes, D.; Maidment, R.; Black, E.; Allan, R.P.; Stringer, M. Extension of the TAMSAT satellite-based rainfall monitoring over Africa and fro 1983 to present. J. Appl. Meteor. Climatol. 2014, 53, 2805–2822. [Google Scholar] [CrossRef] [Green Version]
- Maidment, R.I.; Grimes, D.; Black, E.; Tarnavsky, E.; Young, M.; Greatrex, H.; Allan, R.P.; Stein, T.; Nkonde, E.; Senkunda, S.; et al. A new, long-term daily satellite-based rainfall dataset for operational monitoring in Africa. Sci. Data 2017, 4, 170063. [Google Scholar] [CrossRef]
- Nicholson, S.E. The spatial coherence of African rainfall anomalies: Interhemispheric teleconnections. J. Clim. Appl. Meteorol. 1986, 25, 1365–1381. [Google Scholar] [CrossRef] [Green Version]
- Nicholson, S.E.; Some, B.; Kone, B. An analysis of recent rainfall conditions in West Africa, including the rainy seasons of the 1997 el Niño and 1998 la Niña years. J. Clim. 2000, 13, 2628–2640. [Google Scholar] [CrossRef]
- Nicholson, S.E.; Funk, C.; Fink, A.H. One and a half centuries of rainfall variability over the African continent. Glob. Planet. Chang. 2018, 165, 114–127. [Google Scholar] [CrossRef]
- Funk, C.C.; Nicholson, S.E.; Landsfeld, M.; Klotter, D.A.; Peterson, P.; Harrison, L. The Centennial Trends Greater Horn of Africa precipitation dataset. Sci. Data 2015, 2, 1–17. [Google Scholar] [CrossRef] [PubMed]
- Nicholson, S.E.; Klotter, D.; Dezfuli, A.K.; Zhou, L. New rainfall data sets for the Congo Basin and surrounding regions. J. Hydrometeor. 2018, 19, 1379–1396. [Google Scholar] [CrossRef]
- Schneider, U.; Becker, A.; Finger, P.; Meyer-Christoffer, A.; Rudolf, B.; Ziese, M. GPCC Full Data Monthly Product Version 7 at 2.5: Monthly Land-Surface gauges built on GTS-based and Historic Data. GPCC Data Rep. 2015. [Google Scholar] [CrossRef]
- Saha, S.; Moorthi, S.; Wu, X.; Wang, J.; Nadiga, S.; Tripp, P.; Behringer, D.; Hou, Y.-T.; Chuang, H.-Y.; Iredell, M.; et al. The NCEP Climate Forecast System Version 2. J. Clim. 2014, 27, 2185–2208. [Google Scholar] [CrossRef]
- Gelaro, R.; McCarty, W.; Suárez, M.J.; Todling, R.; Molod, A.; Takacs, L.; Randles, C.A.; Darmenov, A.; Bosilovich, M.G.; Reichle, R.; et al. The modern-era retrospective analysis for research and applications, version 2 (MERRA-2). J. Clim. 2017, 30, 5419–5454. [Google Scholar] [CrossRef] [PubMed]
- Hersbach, H.; Dee, D. ERA5 Reanalysis Is in Production ECMWF Newsletter; ECMWF: Reading, UK, 2016; Volume 147. [Google Scholar]
- Onogi, K.; Tsutsui, J.; Koide, H.; Sakamoto, M.; Kobayashi, S.; Hatsushika, H.; Matsumoto, T.; Yamazaki, N.; Kamahori, H.; Takahashi, K.; et al. The JRA-25 Reanalysis. J. Meteor. Soc. Jpn. 2007, 85, 369–432. [Google Scholar] [CrossRef] [Green Version]
- Saha, S.; Moorthi, S.; Pan, H.-L.; Wu, X.; Wang, J.; Nadiga, S.; Tripp, P.; Kistler, R.; Woollen, J.; Behringer, D.; et al. The NCEP climate forecast system reanalysis. Bull. Amer. Meteor. Soc. 2010, 91, 1015–1057. [Google Scholar] [CrossRef]
- Huang, B.; Thorne, P.W.; Banzon, V.F.; Boyer, T.; Chepurin, G.; Lawrimore, J.H.; Menne, M.J.; Smith, T.M.; Vose, R.S.; Zhang, H.M. Extended Reconstructed Sea Surface Temperature version 5 (ERSSTv5), Upgrades, validations, and inter-comparisons. J. Clim. 2017, 30, 8179–8205. [Google Scholar] [CrossRef]
- Saji, N.H.; Yamagata, T. Possible impacts of Indian Ocean Dipole mode events on global climate. Clim. Res. 2003, 25, 151–169. [Google Scholar] [CrossRef]
- Nicholson, S.E. Long-term variability of the East African ‘short rains’ and its links to large-scale factors. Int. J. Climatol. 2015, 35, 3979–3990. [Google Scholar] [CrossRef]
- Clark, C.O.; Webster, P.J.; Cole, J.E. Interdecadal variability of the relationship between the Indian Ocean zonal mode and East African coastal rainfall anomalies. J. Clim. 2003, 16, 548–554. [Google Scholar] [CrossRef] [Green Version]
- Ummenhofer, C.C.; Gupta, A.S.; England, M.H.; Reason, C.C.J. Contributions of Indian Ocean sea surface temperatures to enhanced East African rainfall. J. Clim. 2009, 22, 993–1013. [Google Scholar] [CrossRef] [Green Version]
- Bultot, F. Atlas climatique du bassin Congolais: Les composantes du bilan d’eau. Bruss. Inst. Natl. pour l’Étude Agron. du Congo. 1971, 2, 25. [Google Scholar]
- Jackson, B.; Nicholson, S.E.; Klotter, D. Mesoscale convective systems over western equatorial Africa and their relationship to large-scale circulation. Mon. Wea. Rev. 2009, 137, 1272–1294. [Google Scholar] [CrossRef]
- Nesbitt, S.W.; Cipelli, R.; Rutledge, S.A. Storm morphology and rainfall characteristics of TRMM precipitation features. Mon. Wea. Rev. 2006, 134, 2702–2721. [Google Scholar] [CrossRef] [Green Version]
- Flohn, H.; Burkhardt, T. Nile runoff at Aswan and Lake Victoria; An example of a discontinuous climate time series. Z. Gletscherk. Glazialgeol. 1985, 21, 125–130. [Google Scholar]
- Munzimi, Y.A.; Hansen, M.C.; Adusei, B.; Senay, G.B. Characterizing Congo Basin rainfall and climate using tropical rainfall measuring mission (TRMM) satellite data and limited rain gauge ground observations. J. Appl. Meteorol. Climatol. 2015, 54, 541–555. [Google Scholar] [CrossRef]
- Pombo, S.; de Oliveira, R.P.; Mendes, A. Comparative performance analysis of climate reanalysis approaches in Angola. Hydrolog. Sci. J. 2017, 62, 698–714. [Google Scholar] [CrossRef] [Green Version]
- Peng, J.; Liu, T.; Huang, Y.; Ling, Y.; Li, Z.; Bao, A.; Chen, X.; Kurban, A.; De Maeyer, P. Satellite-based precipitation datasets evaluation using gauge observation and hydrological modeling in a typical arid land watershed of Central Asia. Remote Sens. 2021, 13, 221. [Google Scholar] [CrossRef]
Figure 1.
Map of locations: Congo Basin, Lake Victoria, and Lake Victoria catchment.

Figure 2.
Ocean sectors used for calculating the Dipole Mode Index (DMI), Niño 3.4, equatorial Atlantic and eastern Atlantic SST time series.
Figure 2.
Ocean sectors used for calculating the Dipole Mode Index (DMI), Niño 3.4, equatorial Atlantic and eastern Atlantic SST time series.

Figure 3.
Mean annual rainfall over the Congo region based on an extensive gauge data set (adapted from Bultot, [64]).
Figure 3.
Mean annual rainfall over the Congo region based on an extensive gauge data set (adapted from Bultot, [64]).

Figure 4.
Mean annual rainfall based on NIC131 for the years 1945–94 (a), on GPCC for the years 1945–94 (b) and GPCC for the years 2001–20219 (c).
Figure 4.
Mean annual rainfall based on NIC131 for the years 1945–94 (a), on GPCC for the years 1945–94 (b) and GPCC for the years 2001–20219 (c).

Figure 5.
Map of world lightning frequency from NASA.

Figure 6.
Mean annual rainfall (2001–2019) over the Congo region from fifteen satellite and reanalysis products.
Figure 6.
Mean annual rainfall (2001–2019) over the Congo region from fifteen satellite and reanalysis products.

Figure 7.
Mean November rainfall (2001–2019) over the Congo region from fifteen satellite and reanalysis products.
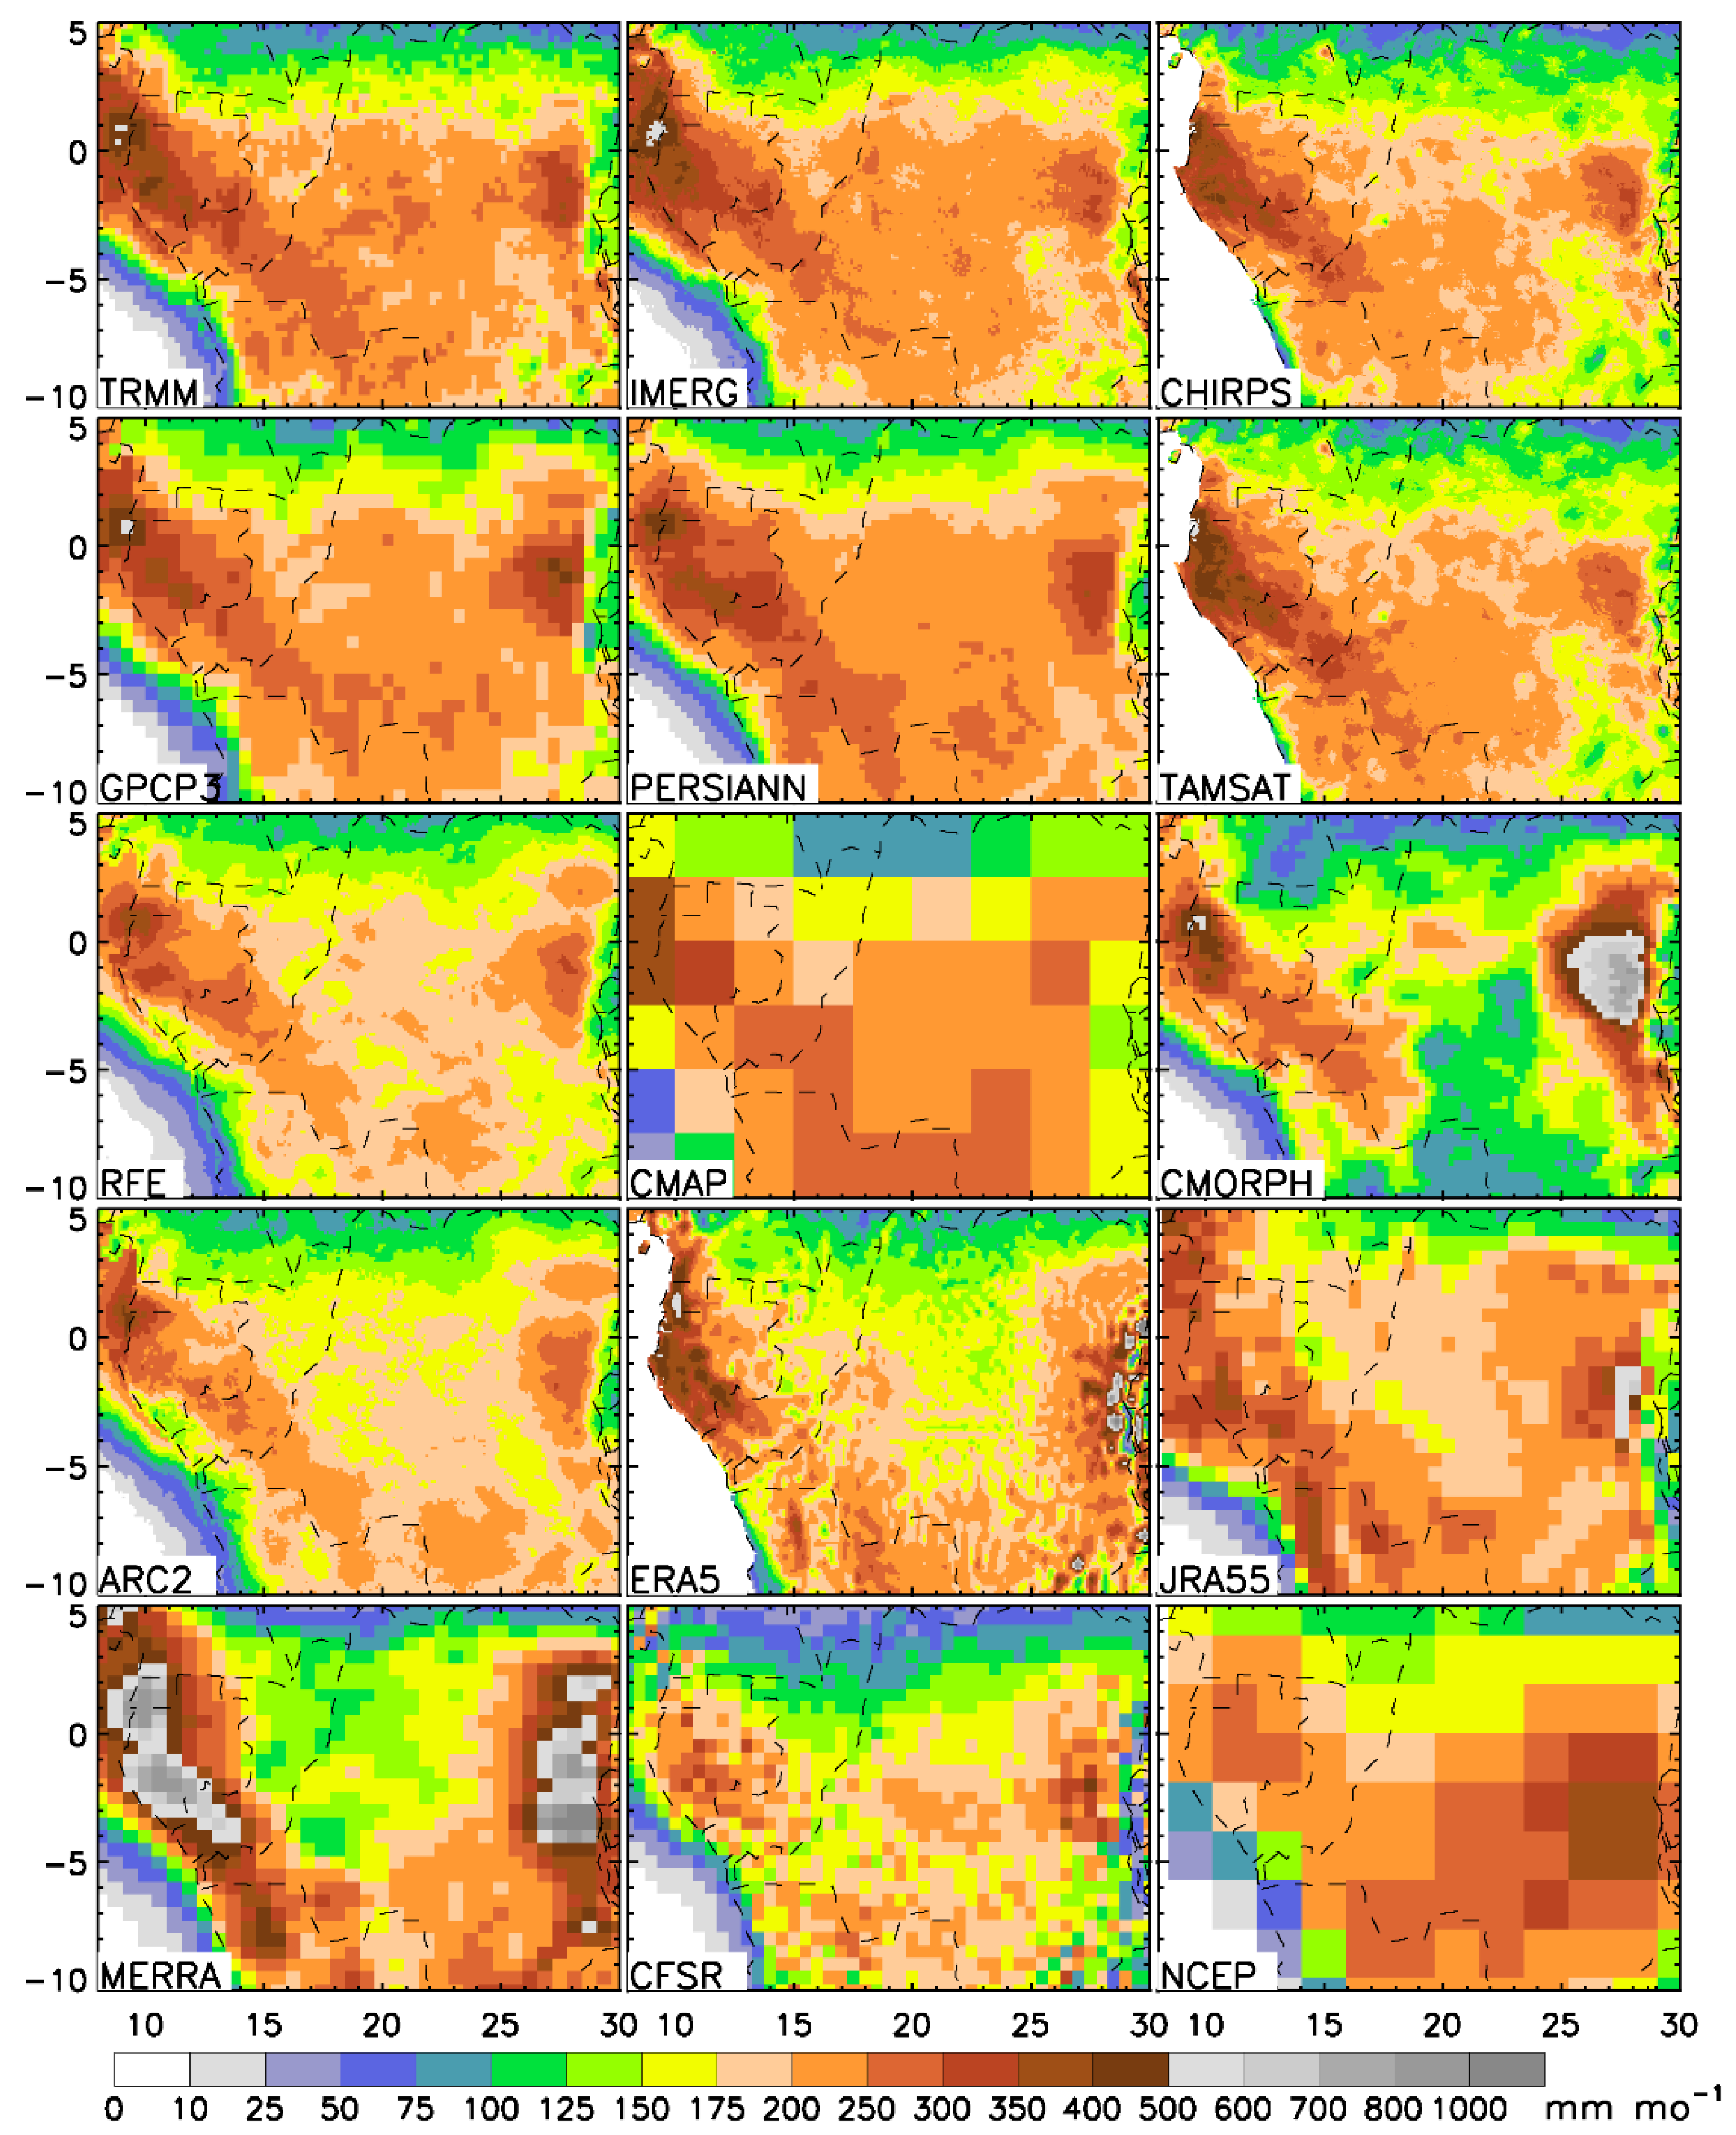
Figure 7.
Mean November rainfall (2001–2019) over the Congo region from fifteen satellite and reanalysis products.

Figure 8.
Map of annual rainfall over Lake Victoria and the surrounding region (based on Flohn and Burkhardt [67]).
Figure 8.
Map of annual rainfall over Lake Victoria and the surrounding region (based on Flohn and Burkhardt [67]).

Figure 9.
Mean annual rainfall (mm) from NIC131 (2001 to 2018) and CenTrends (2001 to 2014).

Figure 10.
Seasonal cycle of rainfall (mm/mo) over the Congo (averaged for the sector shown in Figure 1: (a) satellite, (b) reanalysis.
Figure 10.
Seasonal cycle of rainfall (mm/mo) over the Congo (averaged for the sector shown in Figure 1: (a) satellite, (b) reanalysis.

Figure 11.
Seasonal cycle of rainfall (mm/mo) averaged over Lake Victoria or its catchment (see Figure 1 for location): NIC131 is an average for 1945–94, when gauge coverage was very dense. Others are averaged for 2001–2019: (a) Lake Victoria—satellite (b) Lake Victoria—reanalysis (c) Catchment—satellite (d) Catchment—reanalysis.

Figure 12.
Interannual variability (mm/year) over the Congo (averaged for the sector shown in Figure 1): (a) satellite, annual (b) reanalysis, annual (c) satellite, November (d) reanalysis, November.
Figure 12.
Interannual variability (mm/year) over the Congo (averaged for the sector shown in Figure 1): (a) satellite, annual (b) reanalysis, annual (c) satellite, November (d) reanalysis, November.

Figure 13.
Correlation among rainfall products over the Congo: Each satellite product is correlated with all other satellite products, with the correlation values indicated on the x-axis (red values). Each reanalysis rainfall product is correlated with every other reanalysis product (blue values). Annual rainfall correlations are on the left (a). November rainfall correlations are on the right (b). The 10% significance level is 0.37 and the 5% significance level is 0.43.

Figure 14.
Interannual variability of rainfall (mm/yr or mm/mo) based on satellite products: (a) Lake Victoria, annual (b) catchment, annual (c) Lake Victoria, November (d) catchment, November.
Figure 14.
Interannual variability of rainfall (mm/yr or mm/mo) based on satellite products: (a) Lake Victoria, annual (b) catchment, annual (c) Lake Victoria, November (d) catchment, November.

Figure 15.
Interannual variability of rainfall (mm/yr or mm/mo) based on reanalysis products: (a) Lake Victoria, annual, (b) catchment, annual, (c) Lake Victoria, November, (d) catchment, November.
Figure 15.
Interannual variability of rainfall (mm/yr or mm/mo) based on reanalysis products: (a) Lake Victoria, annual, (b) catchment, annual, (c) Lake Victoria, November, (d) catchment, November.

Figure 16.
Correlation among rainfall products in the Lake Victoria region. Each satellite product is correlated with all other satellite products, with the correlation values indicated on the horizonal axis (red values). Each reanalysis rainfall product is correlated with every other reanalysis product (blue values). Annual rainfall correlations are on the left. November correlations are on the right. Top panels (a,b) are for rainfall over the catchment and bottom panels (c,d) are for rainfall over the lake. The 10% significance level is 0.37 and the 5% significance level is 0.43.

Figure 17.
Correlation between November rainfall over the Congo (area shown on map) and November SSTs for three satellite products and three reanalysis products: The 10% significance level is 0.37 and the 5% significance level is 0.43.
Figure 17.
Correlation between November rainfall over the Congo (area shown on map) and November SSTs for three satellite products and three reanalysis products: The 10% significance level is 0.37 and the 5% significance level is 0.43.

Figure 18.
Correlation between November rainfall over the Lake Victoria catchment (area shown on map) and November SSTs for three satellite products and three reanalysis products: The 10% significance level is 0.37 and the 5% significance level is 0.43.
Figure 18.
Correlation between November rainfall over the Lake Victoria catchment (area shown on map) and November SSTs for three satellite products and three reanalysis products: The 10% significance level is 0.37 and the 5% significance level is 0.43.


Table 1.
The satellite rainfall products evaluated in this study.
| Product | Start | End | Resolution | Global Coverage | |
|---|---|---|---|---|---|
| Spatial | Temporal | ||||
| ARC2 | 1/83 | present | 0.1° | daily | 40S–40N 20W–55E |
| CHIRPS 2.0 | 1981 | present | 0.05° | daily | 50S–50N 0–360 Long. |
| CMAP ENHANCED | 1/79 | present | 2.5° | pentad | Global |
| CMORPH CRT | 12/2002 | present | 8 km | sub-daily | 60S–60N 0–360 Long |
| GPCP V.3.1 | 1/83 | present | 0.5° | monthly | Global |
| IMERG-F | 6/2000 | present | 0.1° | sub-daily | Global |
| PERSIANN CDR | 1/83 | present | 0.25° | sub-daily | 60S–60N 0–360 Long |
| RFE 2.0 | 1/83 | present | 0.1° | daily | 40S–40N 20W–55E |
| TAMSAT V3 | 1/83 | present | 4 km | daily | 36S–38N 19W–52E |
| TRMM 3B43 V7 | 1/98 | 12/2019 | 0.25° | monthly | 50S–50N 180W–180E |
Table 2.
The reanalysis products used in this study.
| Product | Start | End | Resolution | Global Coverage | |
|---|---|---|---|---|---|
| Spatial | Temporal | ||||
| CFSR | 1/1979 | 11/2017 | 0.25° | Sub-daily | Global |
| ERA5 | 1/1979 | Present | 0.10° | Sub-daily | Global |
| JRA55 | 1/1958 | Present | 0.56° | Sub-daily | Global |
| MERRA 2 | 1/1980 | Present | 0.5° × 0.625° | Sub-daily | Global |
| NCEP II | 1/1979 | Present | 2.0° × 2.0° | Sub-daily | Global |
Table 3.
Mean annual and November rainfall for the three locations shown in Figure 1.
Table 3.
Mean annual and November rainfall for the three locations shown in Figure 1.
| Source | Congo | Lake | Catchment | |||
|---|---|---|---|---|---|---|
| Ann | Nov | Ann | Nov | Ann | Nov | |
| IMERG | 1896 | 210 | 2372 | 259 | 1257 | 153 |
| TRMM | 1797 | 207 | 1714 | 206 | 1194 | 149 |
| GPCP V3.1 | 1887 | 204 | 1706 | 196 | 1175 | 137 |
| CHIRPS | 1815 | 178 | 1448 | 164 | 1172 | 134 |
| ARC2 | 1735 | 171 | 1522 | 180 | 1040 | 123 |
| RFE | 1713 | 179 | 1470 | 172 | 1051 | 122 |
| CMAP | 1854 | 196 | 1127 | 133 | 1245 | 167 |
| TAMSAT | 1954 | 188 | 1559 | 167 | 1179 | 131 |
| CMORPH | 1571 | 160 | 1800 | 208 | 996 | 126 |
| PERSIANN | 1830 | 205 | 1498 | 194 | 1169 | 146 |
| CFSR | 1405 | 158 | 1183 | 143 | 1353 | 145 |
| ERA5 | 1553 | 162 | 2093 | 253 | 1301 | 167 |
| JRA55 | 1685 | 198 | 535 | 86 | 706 | 101 |
| MERRA 2 | 1402 | 156 | 1933 | 292 | 1940 | 244 |
| NCEP II | 1758 | 202 | 886 | 151 | 1267 | 196 |
| GPCC | 1840 | 206 | 9999 | 9999 | 1200 | 144 |
| NIC131 | 1831 | 199 | 9999 | 9999 | 1218 | 129 |
Table 4.
Rainfall trends (mm/year/decade) over the period 2001–2019 for annual and November rainfall in the three areas shown in Figure 1: N.A. in the lake column indicates the product has no stations over the lake.
Table 4.
Rainfall trends (mm/year/decade) over the period 2001–2019 for annual and November rainfall in the three areas shown in Figure 1: N.A. in the lake column indicates the product has no stations over the lake.
| Source | Congo | Lake | Catchment | |||
|---|---|---|---|---|---|---|
| Ann | Nov | Ann | Nov | Ann | Nov | |
| IMERG | 0.44 | 0.12 | 0.17 | 0.04 | 0.22 | 0.09 |
| TRMM | 0.23 | 0.28 | 0.54 | 0.09 | −0.12 | −0.01 |
| GPCP V3.1 | 0.05 | 0.10 | 1.42 | 0.03 | 0.41 | 0.06 |
| CHIRPS | 0.08 | 0.12 | 1.08 | 0.16 | 0.89 | 0.16 |
| ARC2 | 0.88 | 0.06 | 1.43 | 0.30 | 0.71 | 0.24 |
| RFE | 1.95 | 0.21 | 3.62 | 0.47 | 1.07 | 0.20 |
| CMAP | −0.59 | 0.10 | 0.84 | 0.22 | 0.41 | 0.43 |
| TAMSAT | 0.37 | 0.16 | 0.62 | 0.10 | 0.81 | 0.21 |
| CMORPH | −0.80 | −0.09 | 3.14 | 0.30 | 0.35 | 0.17 |
| PERSIANN | 0.10 | 0.14 | 0.49 | 0.03 | −0.21 | 0.00 |
| CFSR | −0.48 | −0.32 | 2.72 | 0.34 | 3.66 | 0.42 |
| ERA5 | −1.06 | −0.08 | 0.88 | 0.02 | 0.72 | 0.05 |
| JRA55 | −1.15 | −0.19 | −0.47 | −0.02 | −1.05 | −0.01 |
| MERRA 2 | 2.01 | 0.28 | 4.44 | 0.63 | 6.04 | 0.88 |
| NCEP II | 4.19 | 0.74 | 1.16 | 0.12 | 0.94 | −0.33 |
| GPCC | 0.12 | 0.07 | N.A. | N.A. | 0.44 | 0.11 |
| NIC131 | −0.75 | −0.21 | N.A. | N.A. | −1.05 | 0.11 |
Table 5.
Correlations between rainfall estimates from satellite and reanalysis products and indicators of potential large-scale factors: Niño is SSTs from the Niño 3.4 region; equatorial Atlantic and eastern Atlantic are also SSTs. DMI is the Dipole Mode Index. Locations for these are shown in Figure 2. C = Congo, LC = Lake catchment; these regions are shown in Figure 1. Only correlations reaching at least the 10% significance level are indicated. Those highlighted in yellow exceed the 5% significance level.
| PRODUCT | NIÑO | DMI | Equatorial Atlantic | Eastern Atlantic | ||||||||
|---|---|---|---|---|---|---|---|---|---|---|---|---|
| C | Lake | LC | C | Lake | LC | C | Lake | LC | C | Lake | LC | |
| IMERG | −0.49 | 0.39 | 0.54 | 0.65 | ||||||||
| TRMM | 0.39 | 0.53 | 0.58 | −0.47 | ||||||||
| GPCP V3.1 | −0.39 | 0.39 | 0.82 | 0.62 | ||||||||
| CHIRPS | 0.79 | −0.47 | ||||||||||
| ARC2 | −0.47 | 0.61 | 0.78 | −0.48 | ||||||||
| RFE | −0.53 | 0.57 | 0.59 | 0.77 | ||||||||
| CMAP | −0.45 | 0.65 | 0.56 | 0.60 | 0.73 | |||||||
| TAMSAT | −0.40 | 0.73 | 0.64 | |||||||||
| CMORPH | −0.59 | 0.50 | 0.55 | 0.46 | ||||||||
| PERSIANN | −0.51 | 0.40 | 0.60 | 0.57 | ||||||||
| CFSR | 0.68 | 0.71 | 0.50 | 0.65 | 0.47 | |||||||
| ERA5 | 0.53 | −0.57 | ||||||||||
| JRA55 | 0.38 | 0.57 | 0.37 | −0.40 | ||||||||
| MERRA2 | 0.50 | 0.47 | 0.48 | |||||||||
| NCEP II | 0.48 | −0.40 | 0.45 | −0.45 | −0.50 | |||||||
Publisher’s Note: MDPI stays neutral with regard to jurisdictional claims in published maps and institutional affiliations. |
© 2021 by the authors. Licensee MDPI, Basel, Switzerland. This article is an open access article distributed under the terms and conditions of the Creative Commons Attribution (CC BY) license (https://creativecommons.org/licenses/by/4.0/).
Share and Cite
MDPI and ACS Style
Nicholson, S.E.; Klotter, D.A. Assessing the Reliability of Satellite and Reanalysis Estimates of Rainfall in Equatorial Africa. Remote Sens. 2021, 13, 3609. https://0-doi-org.brum.beds.ac.uk/10.3390/rs13183609
AMA Style
Nicholson SE, Klotter DA. Assessing the Reliability of Satellite and Reanalysis Estimates of Rainfall in Equatorial Africa. Remote Sensing. 2021; 13(18):3609. https://0-doi-org.brum.beds.ac.uk/10.3390/rs13183609
Chicago/Turabian StyleNicholson, Sharon E., and Douglas A. Klotter. 2021. "Assessing the Reliability of Satellite and Reanalysis Estimates of Rainfall in Equatorial Africa" Remote Sensing 13, no. 18: 3609. https://0-doi-org.brum.beds.ac.uk/10.3390/rs13183609
Note that from the first issue of 2016, this journal uses article numbers instead of page numbers. See further details here.