
Evaluation of Polycentric Spatial Structure in the Urban Agglomeration of the Pearl River Delta (PRD) Based on Multi-Source Big Data Fusion


Abstract
:
1. Introduction
2. Materials and Methods
2.1. Study Area
2.2. Study Data
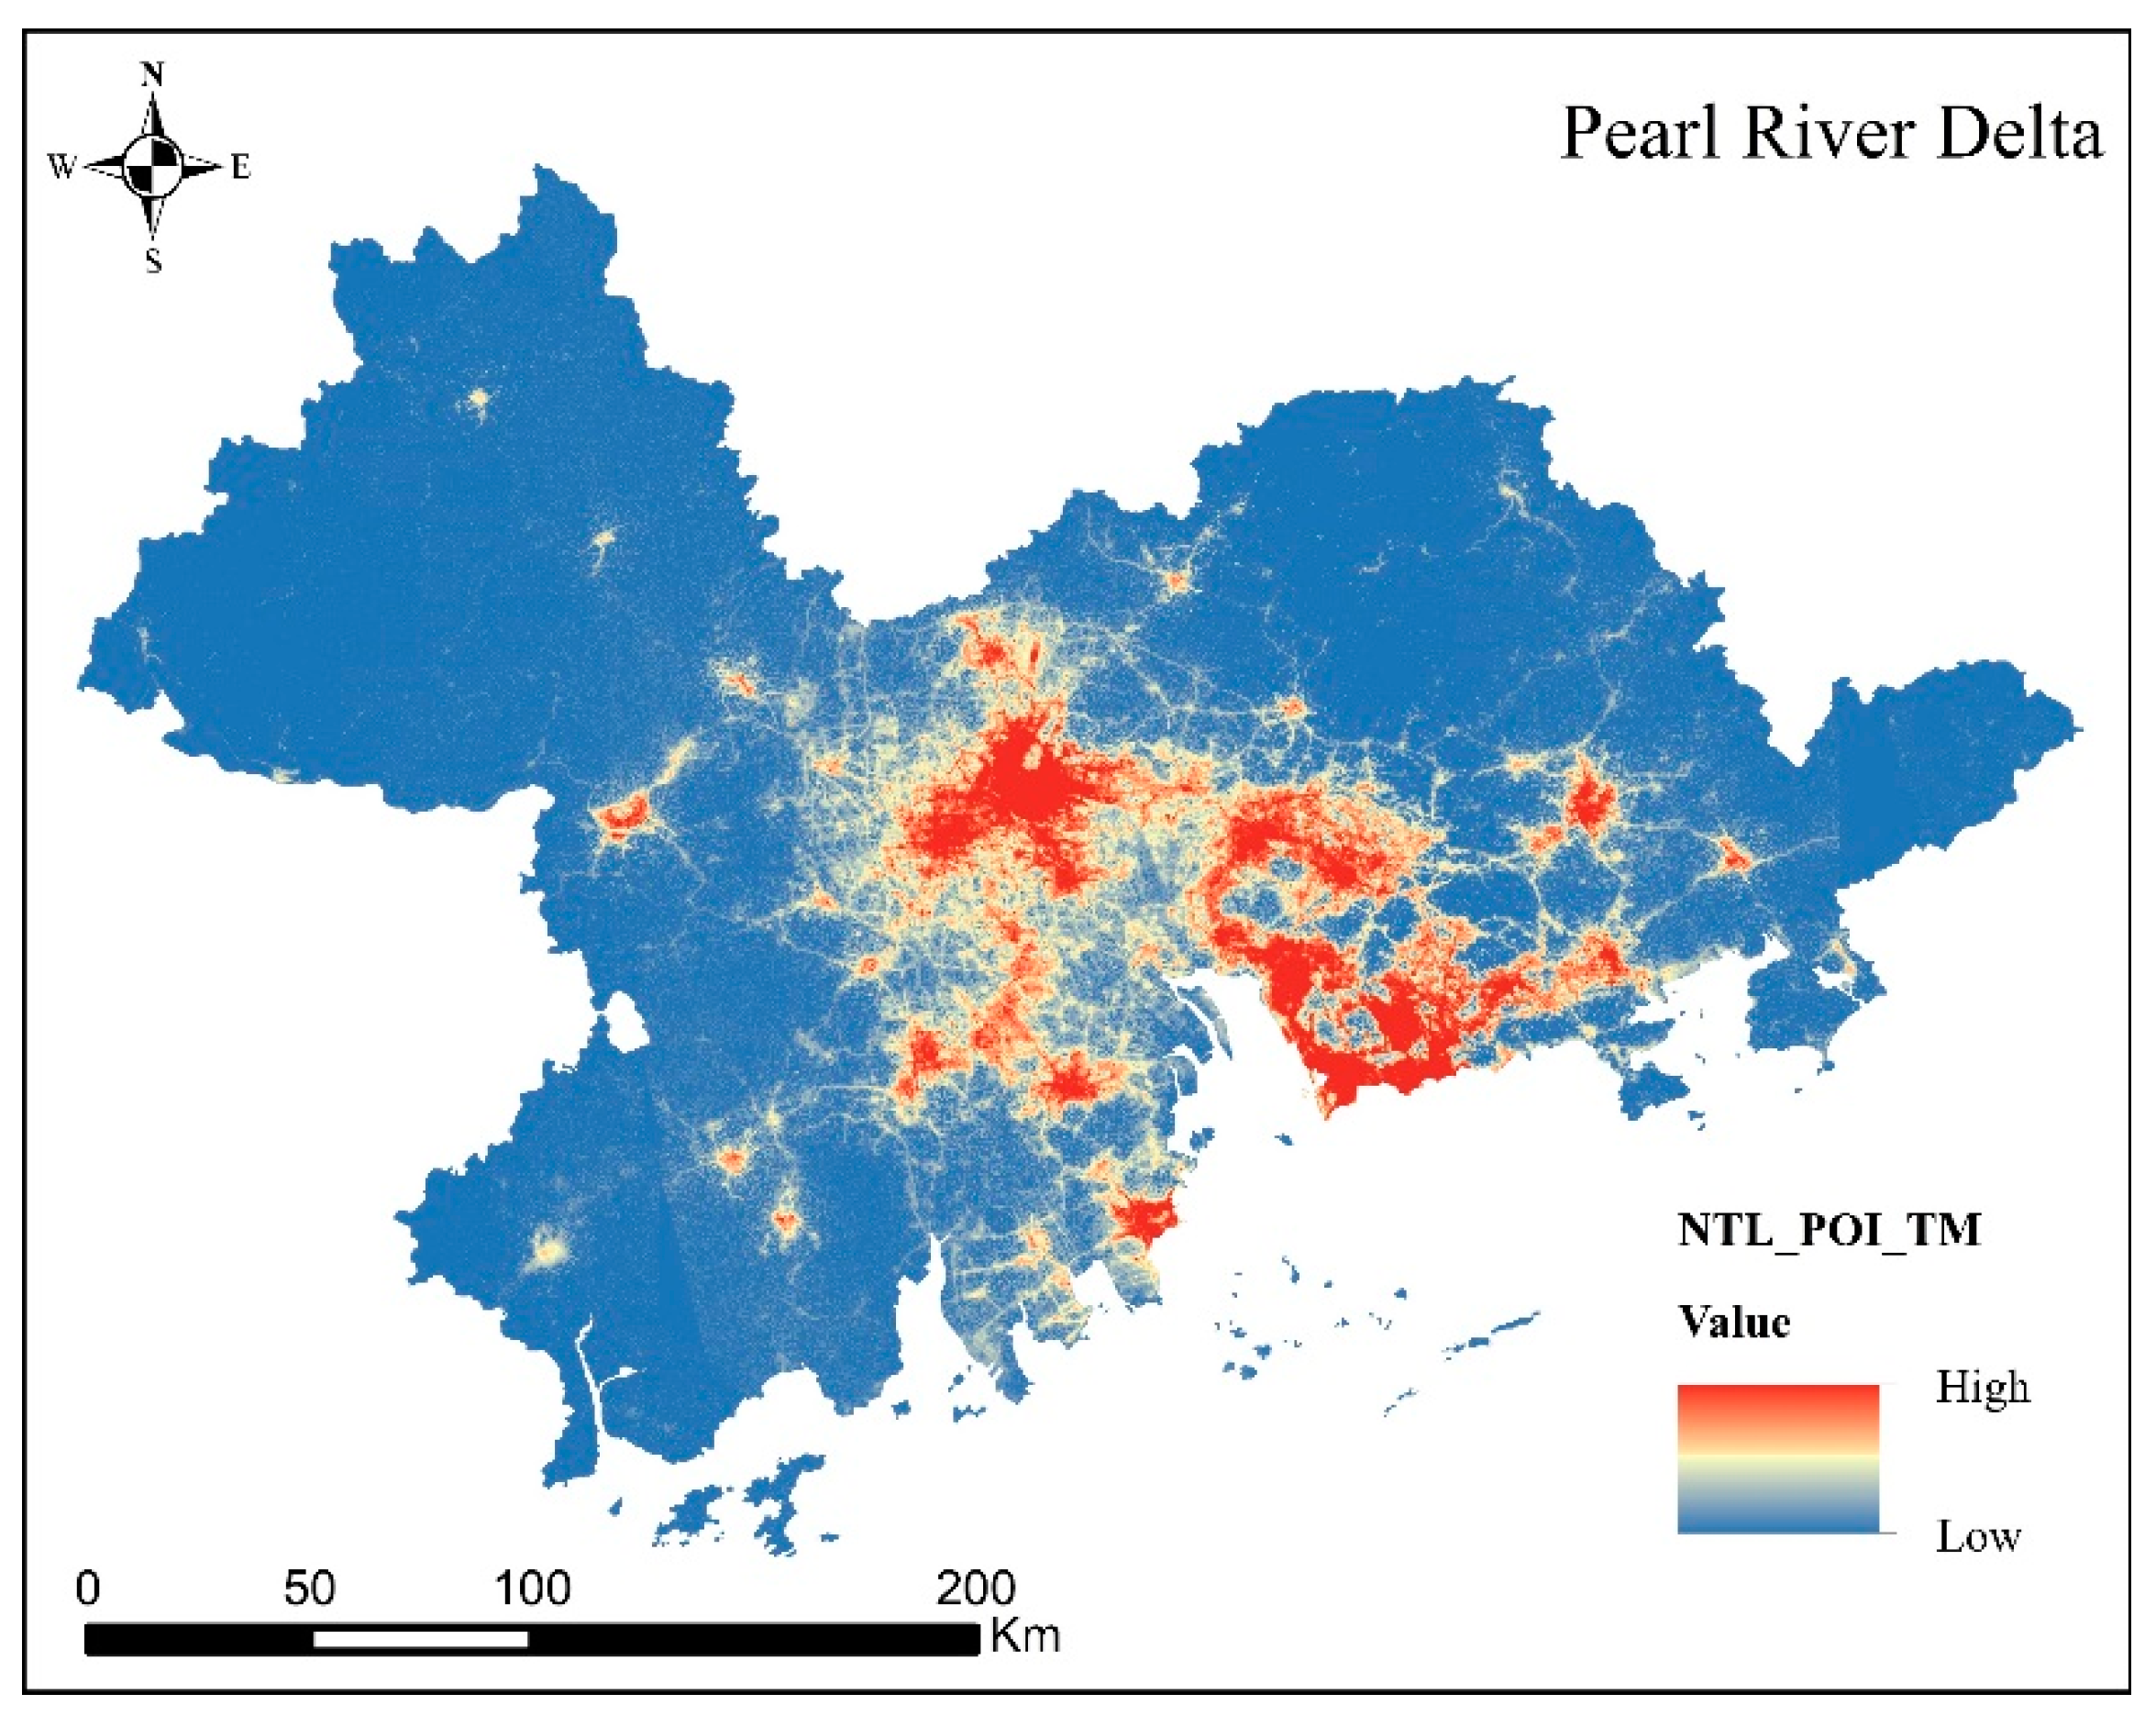
2.2.1. Nighttime Light Data (NTL Data)
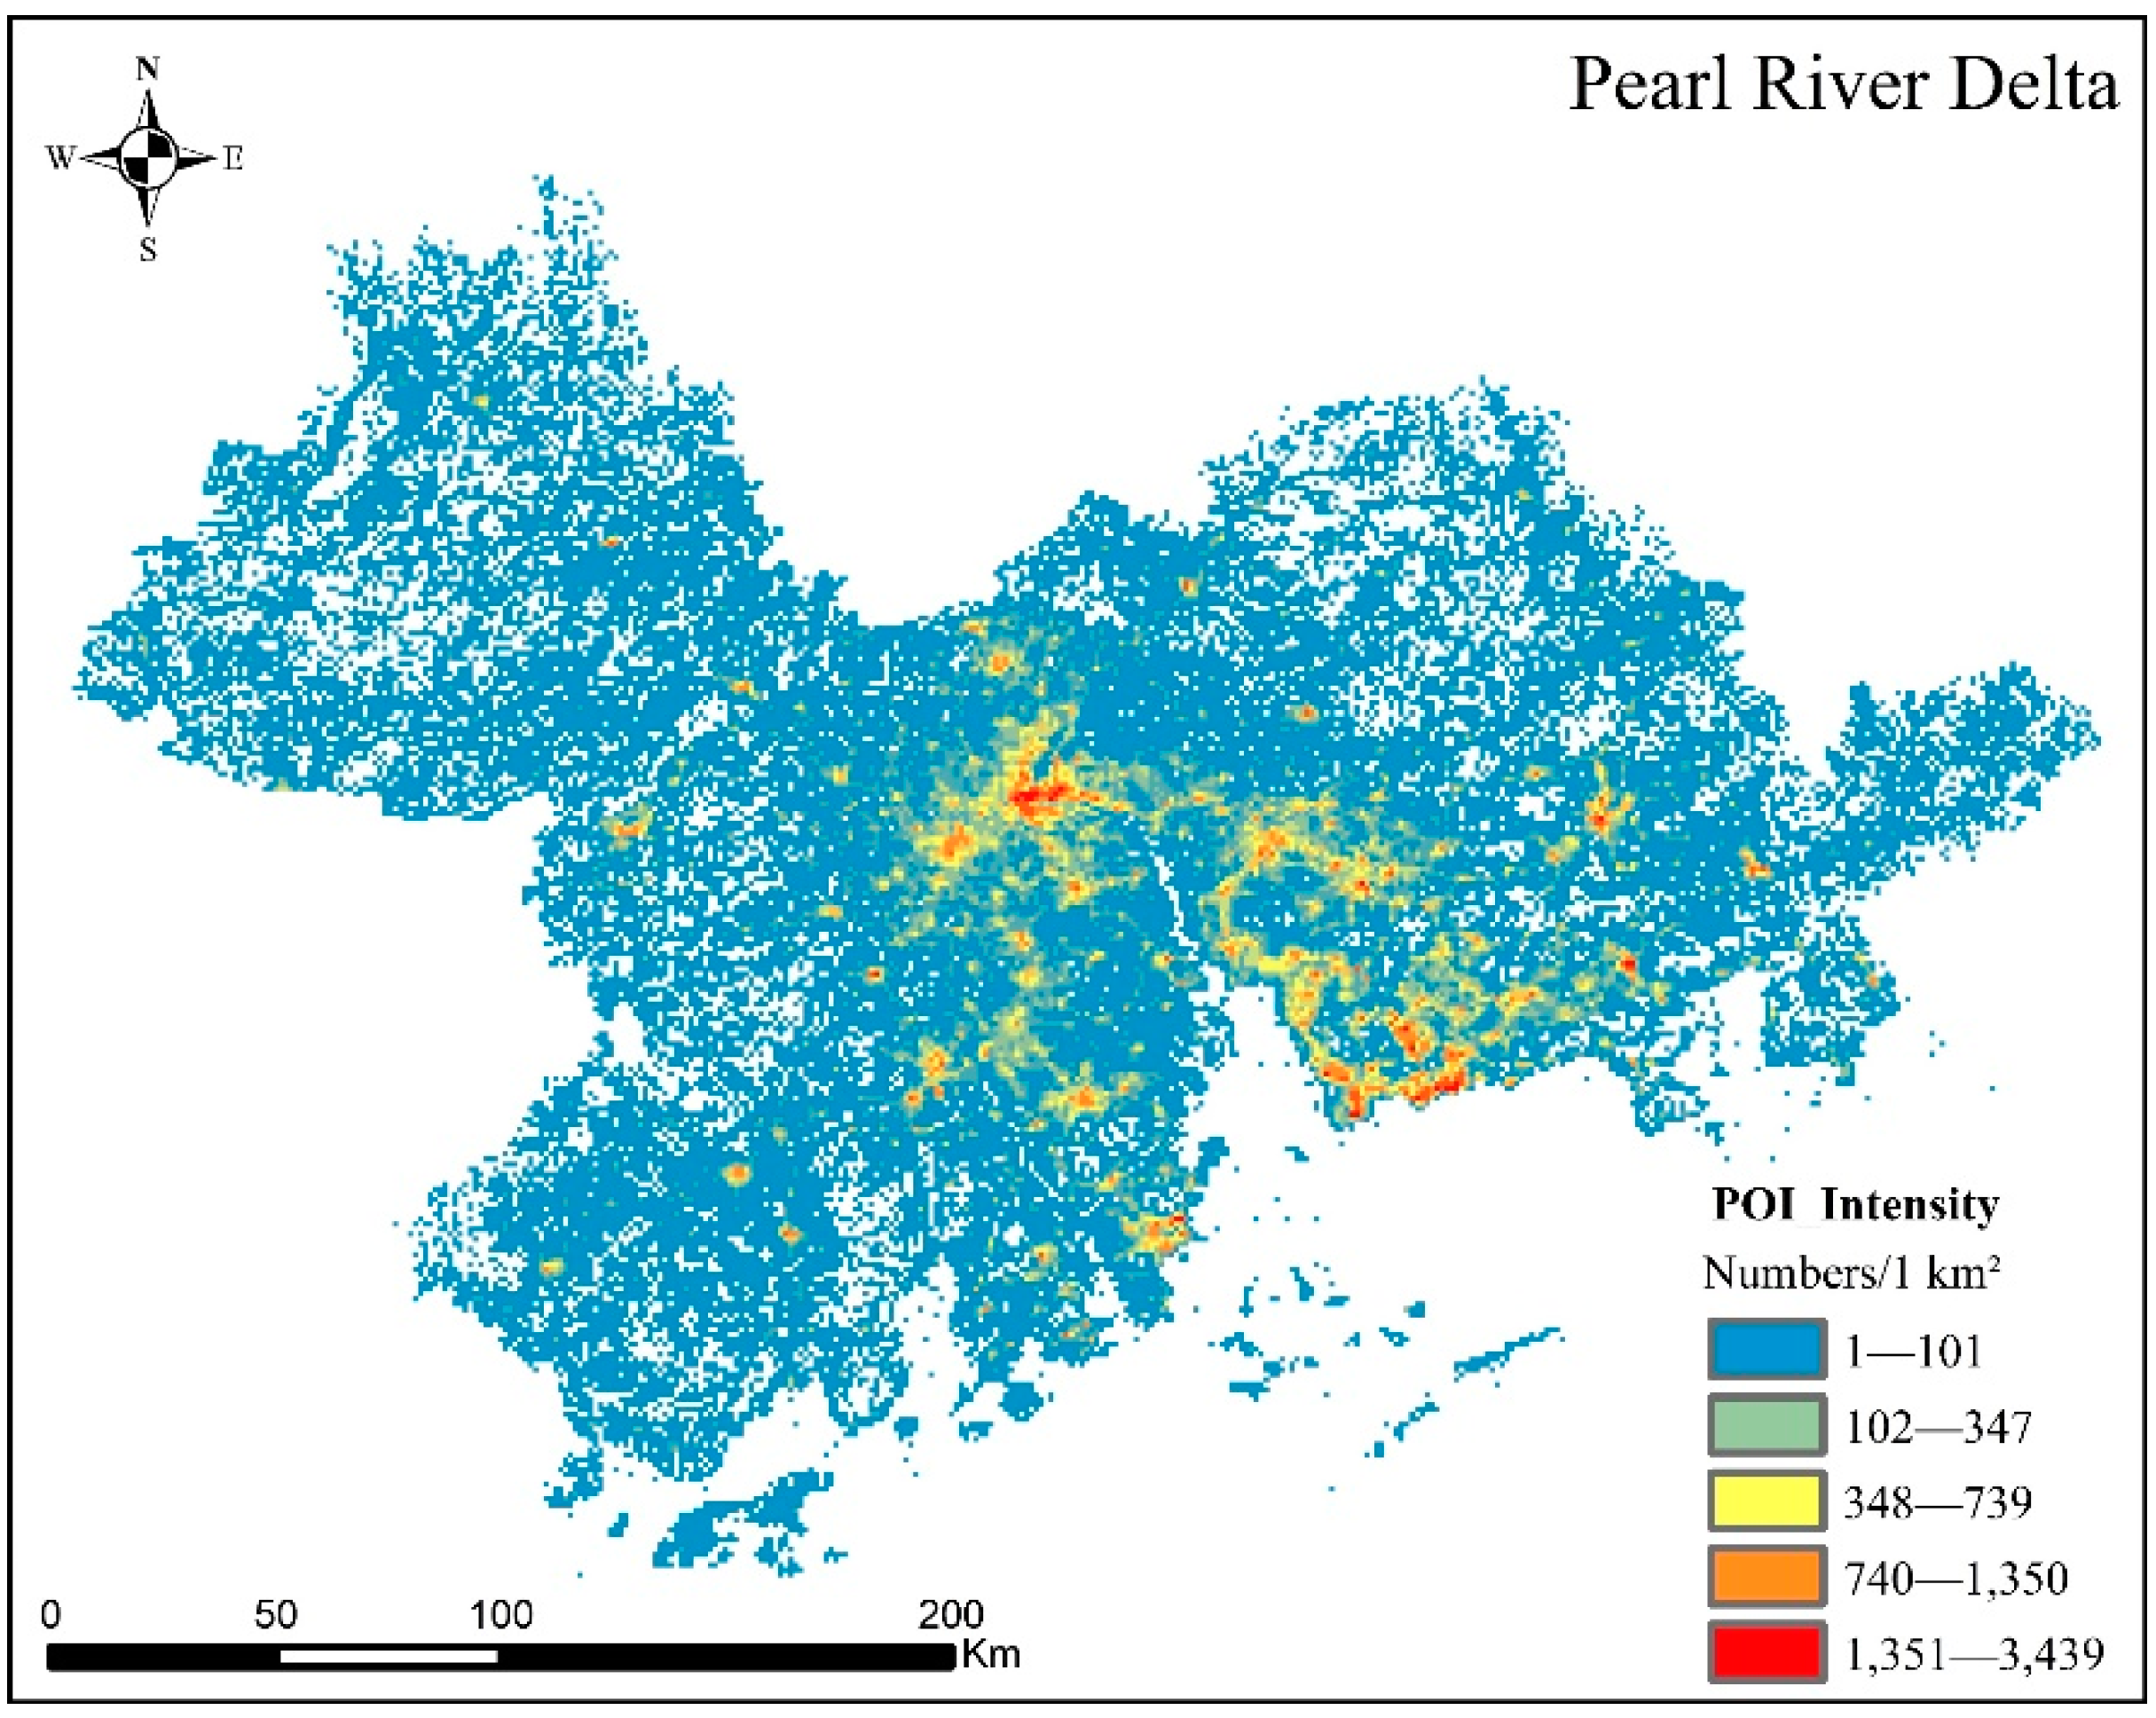
2.2.2. POI Data
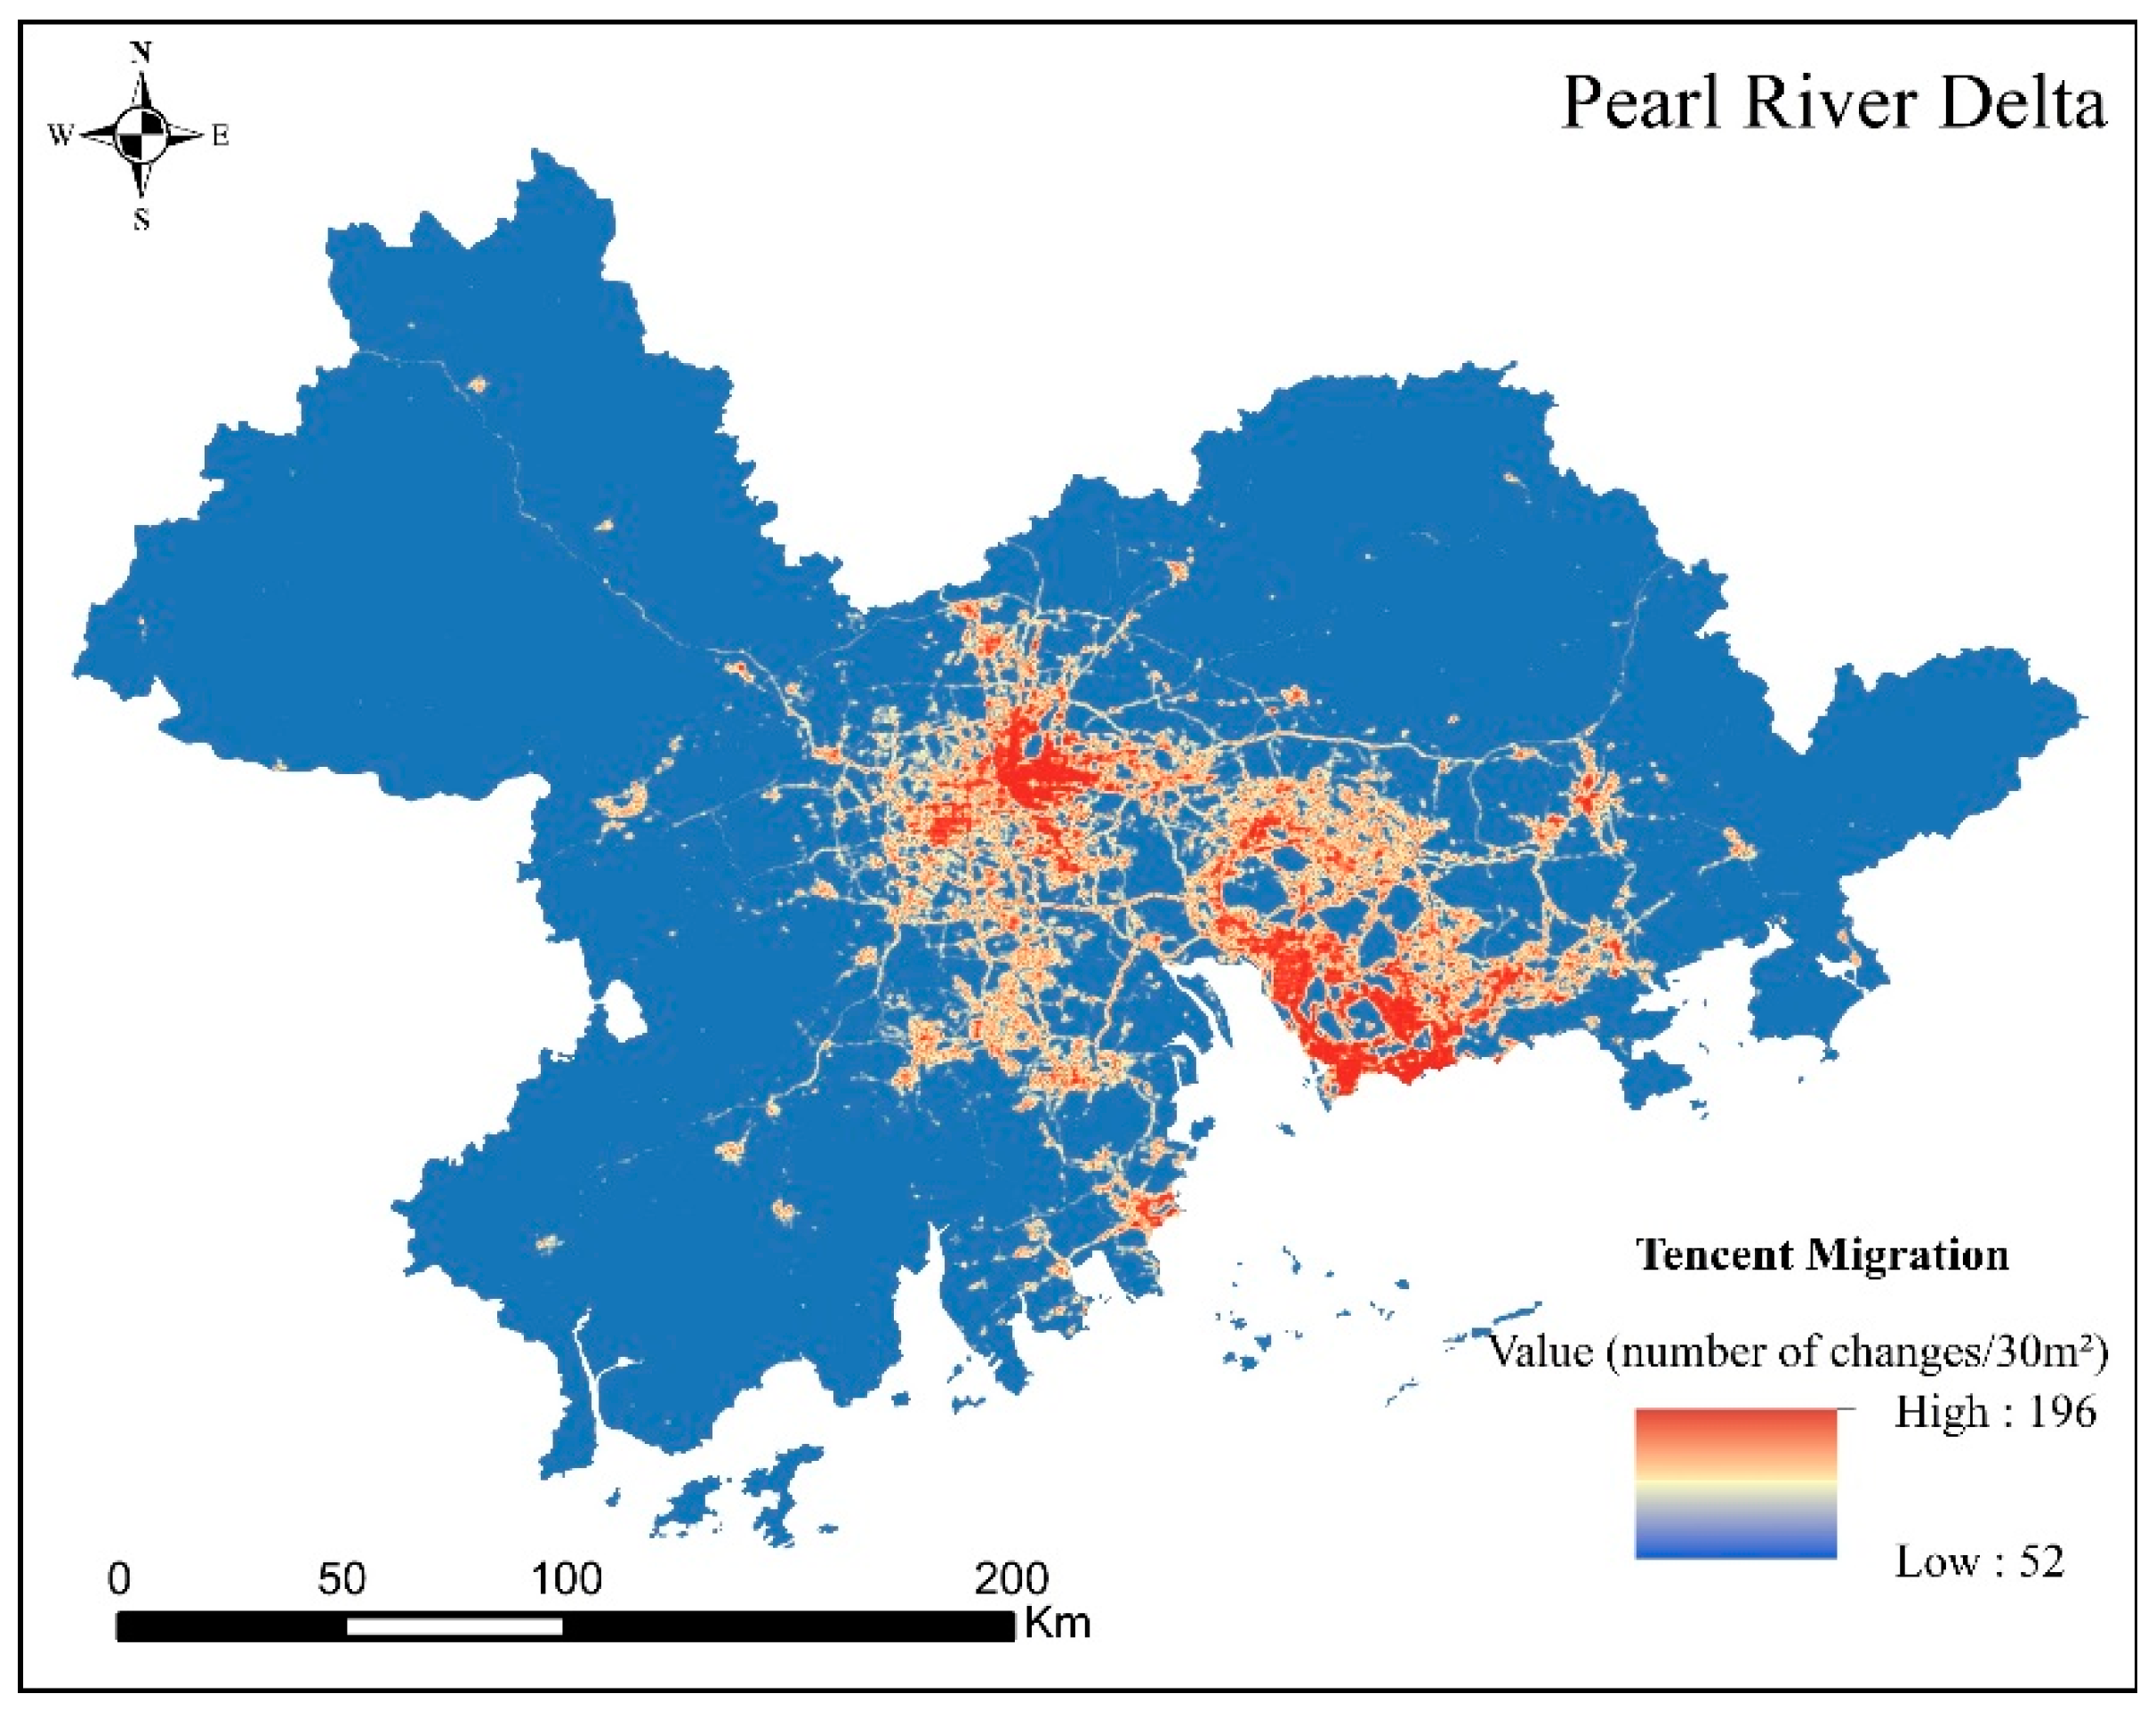
2.2.3. Tencent Migration (TMG) Data and Population Grid Data
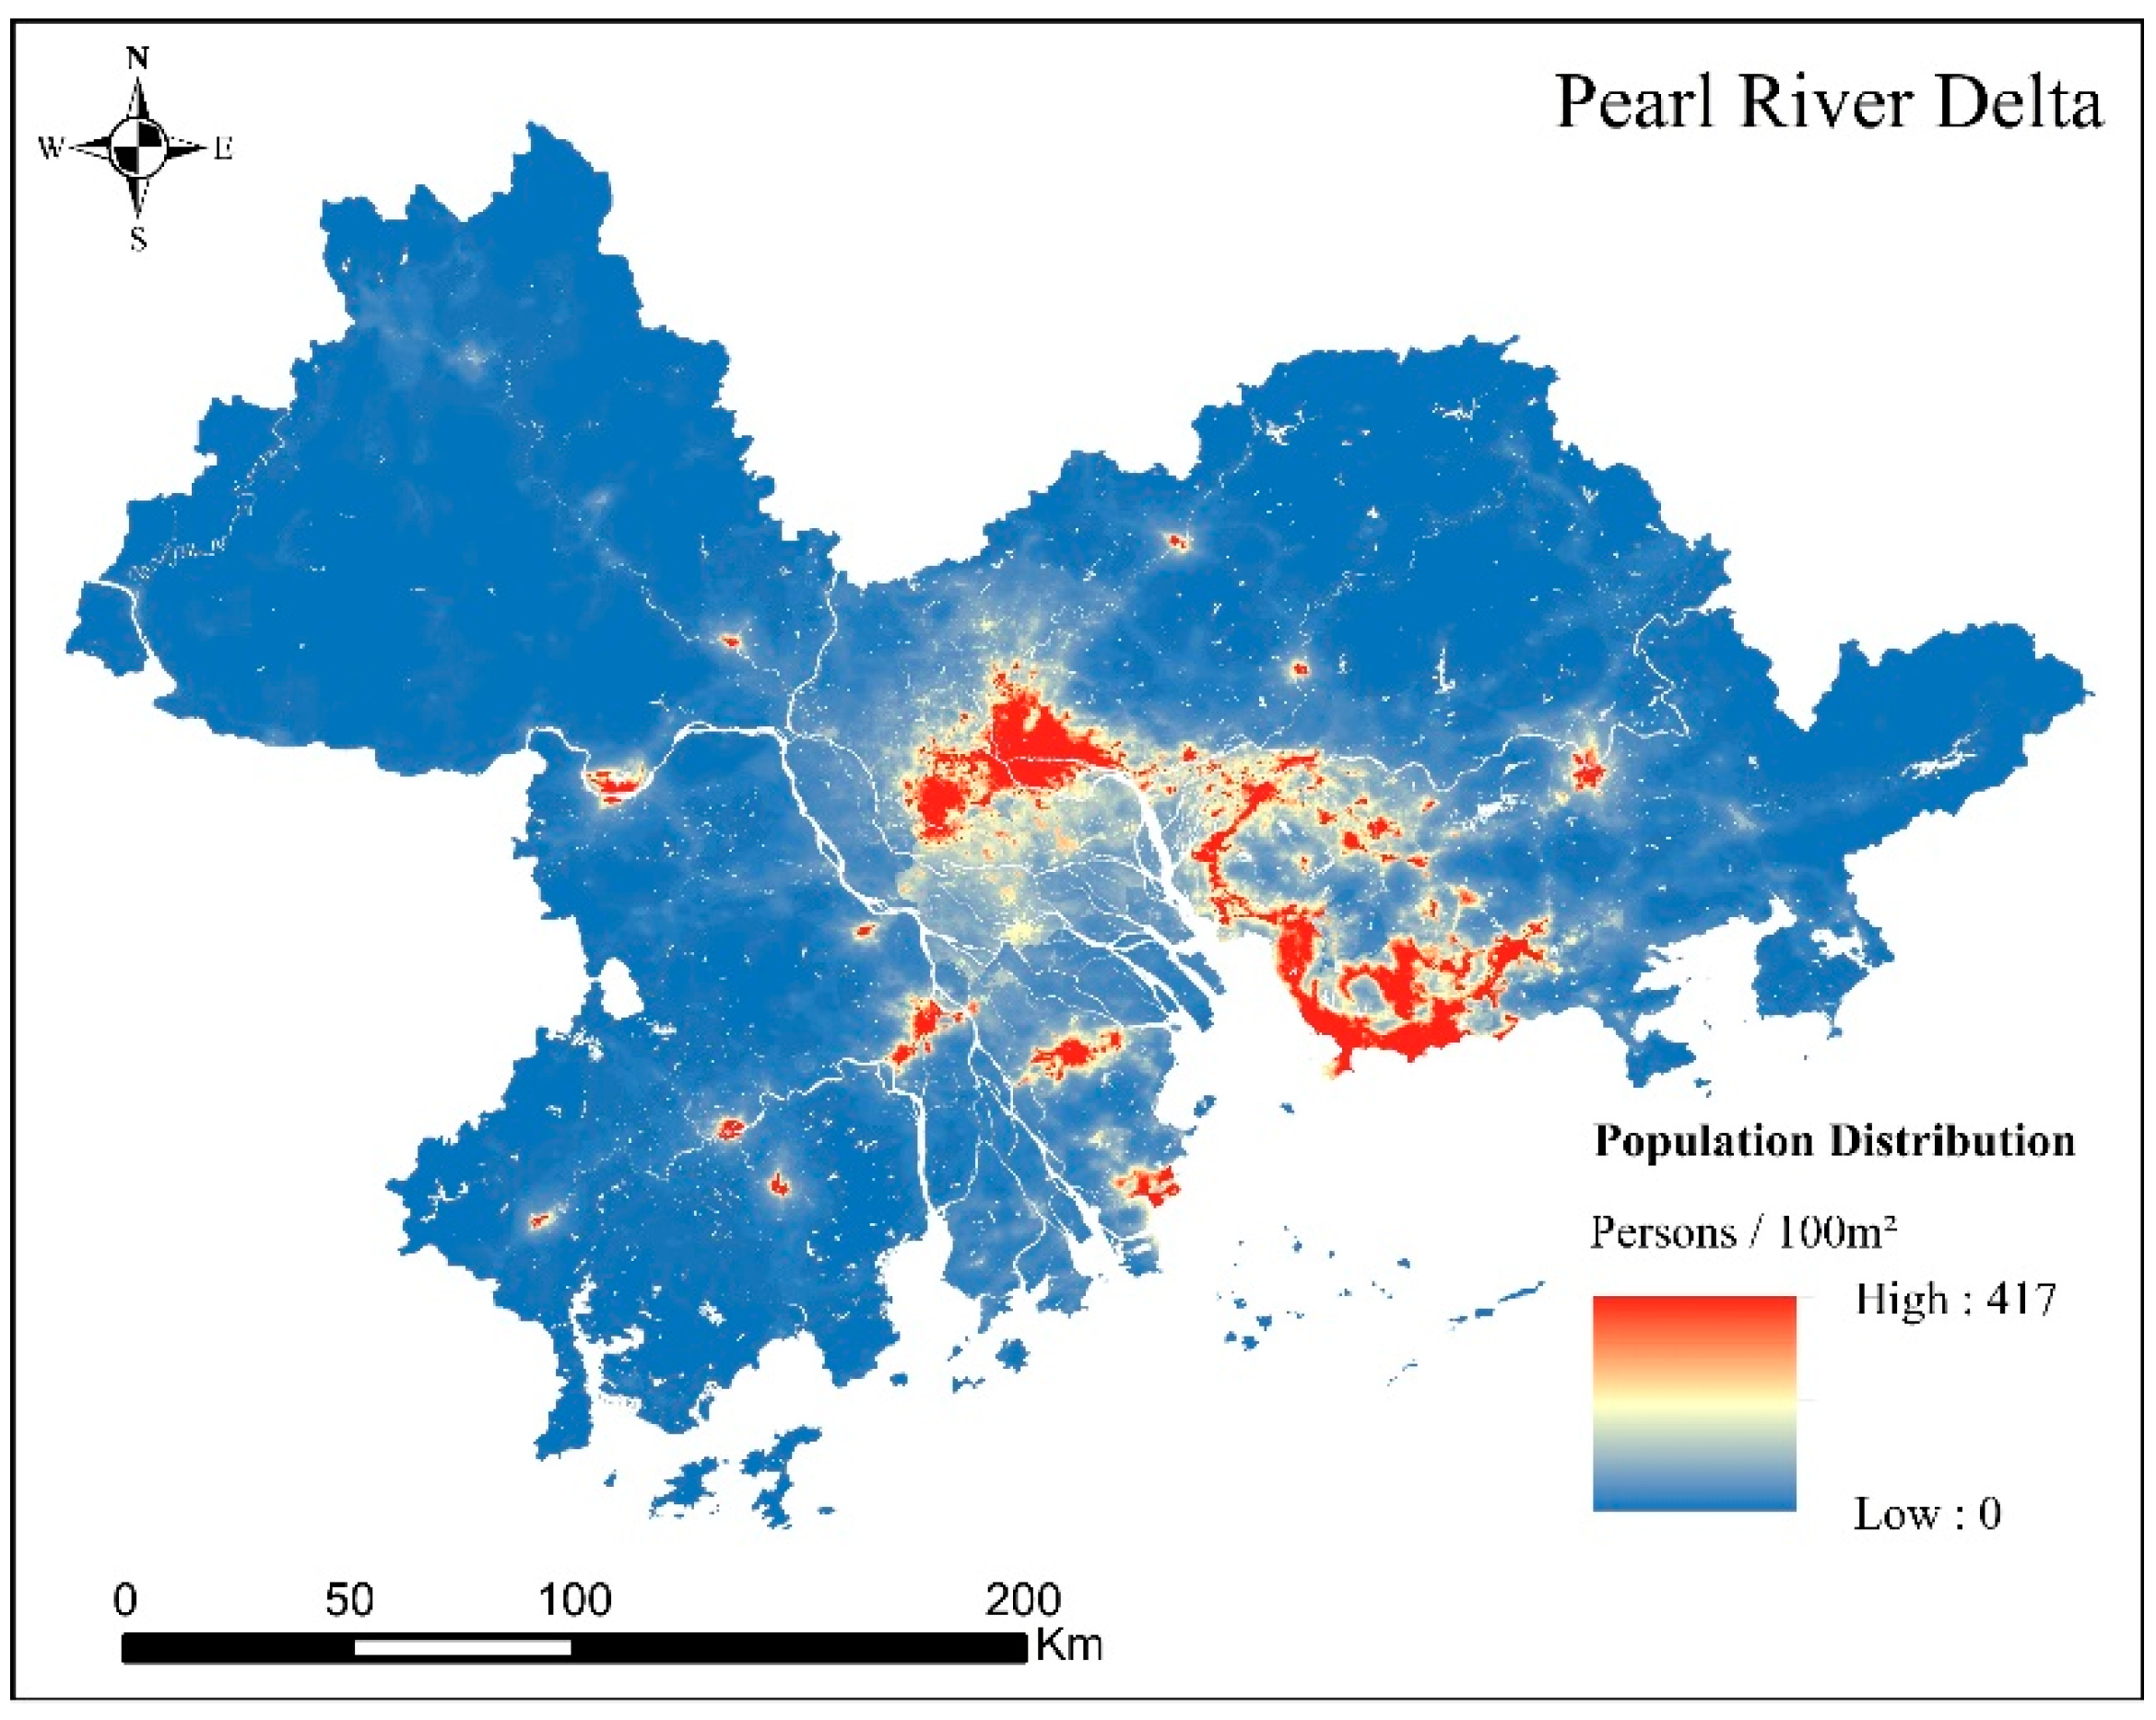
2.2.4. Grid Data of Population Spatial Distribution
2.3. Methods
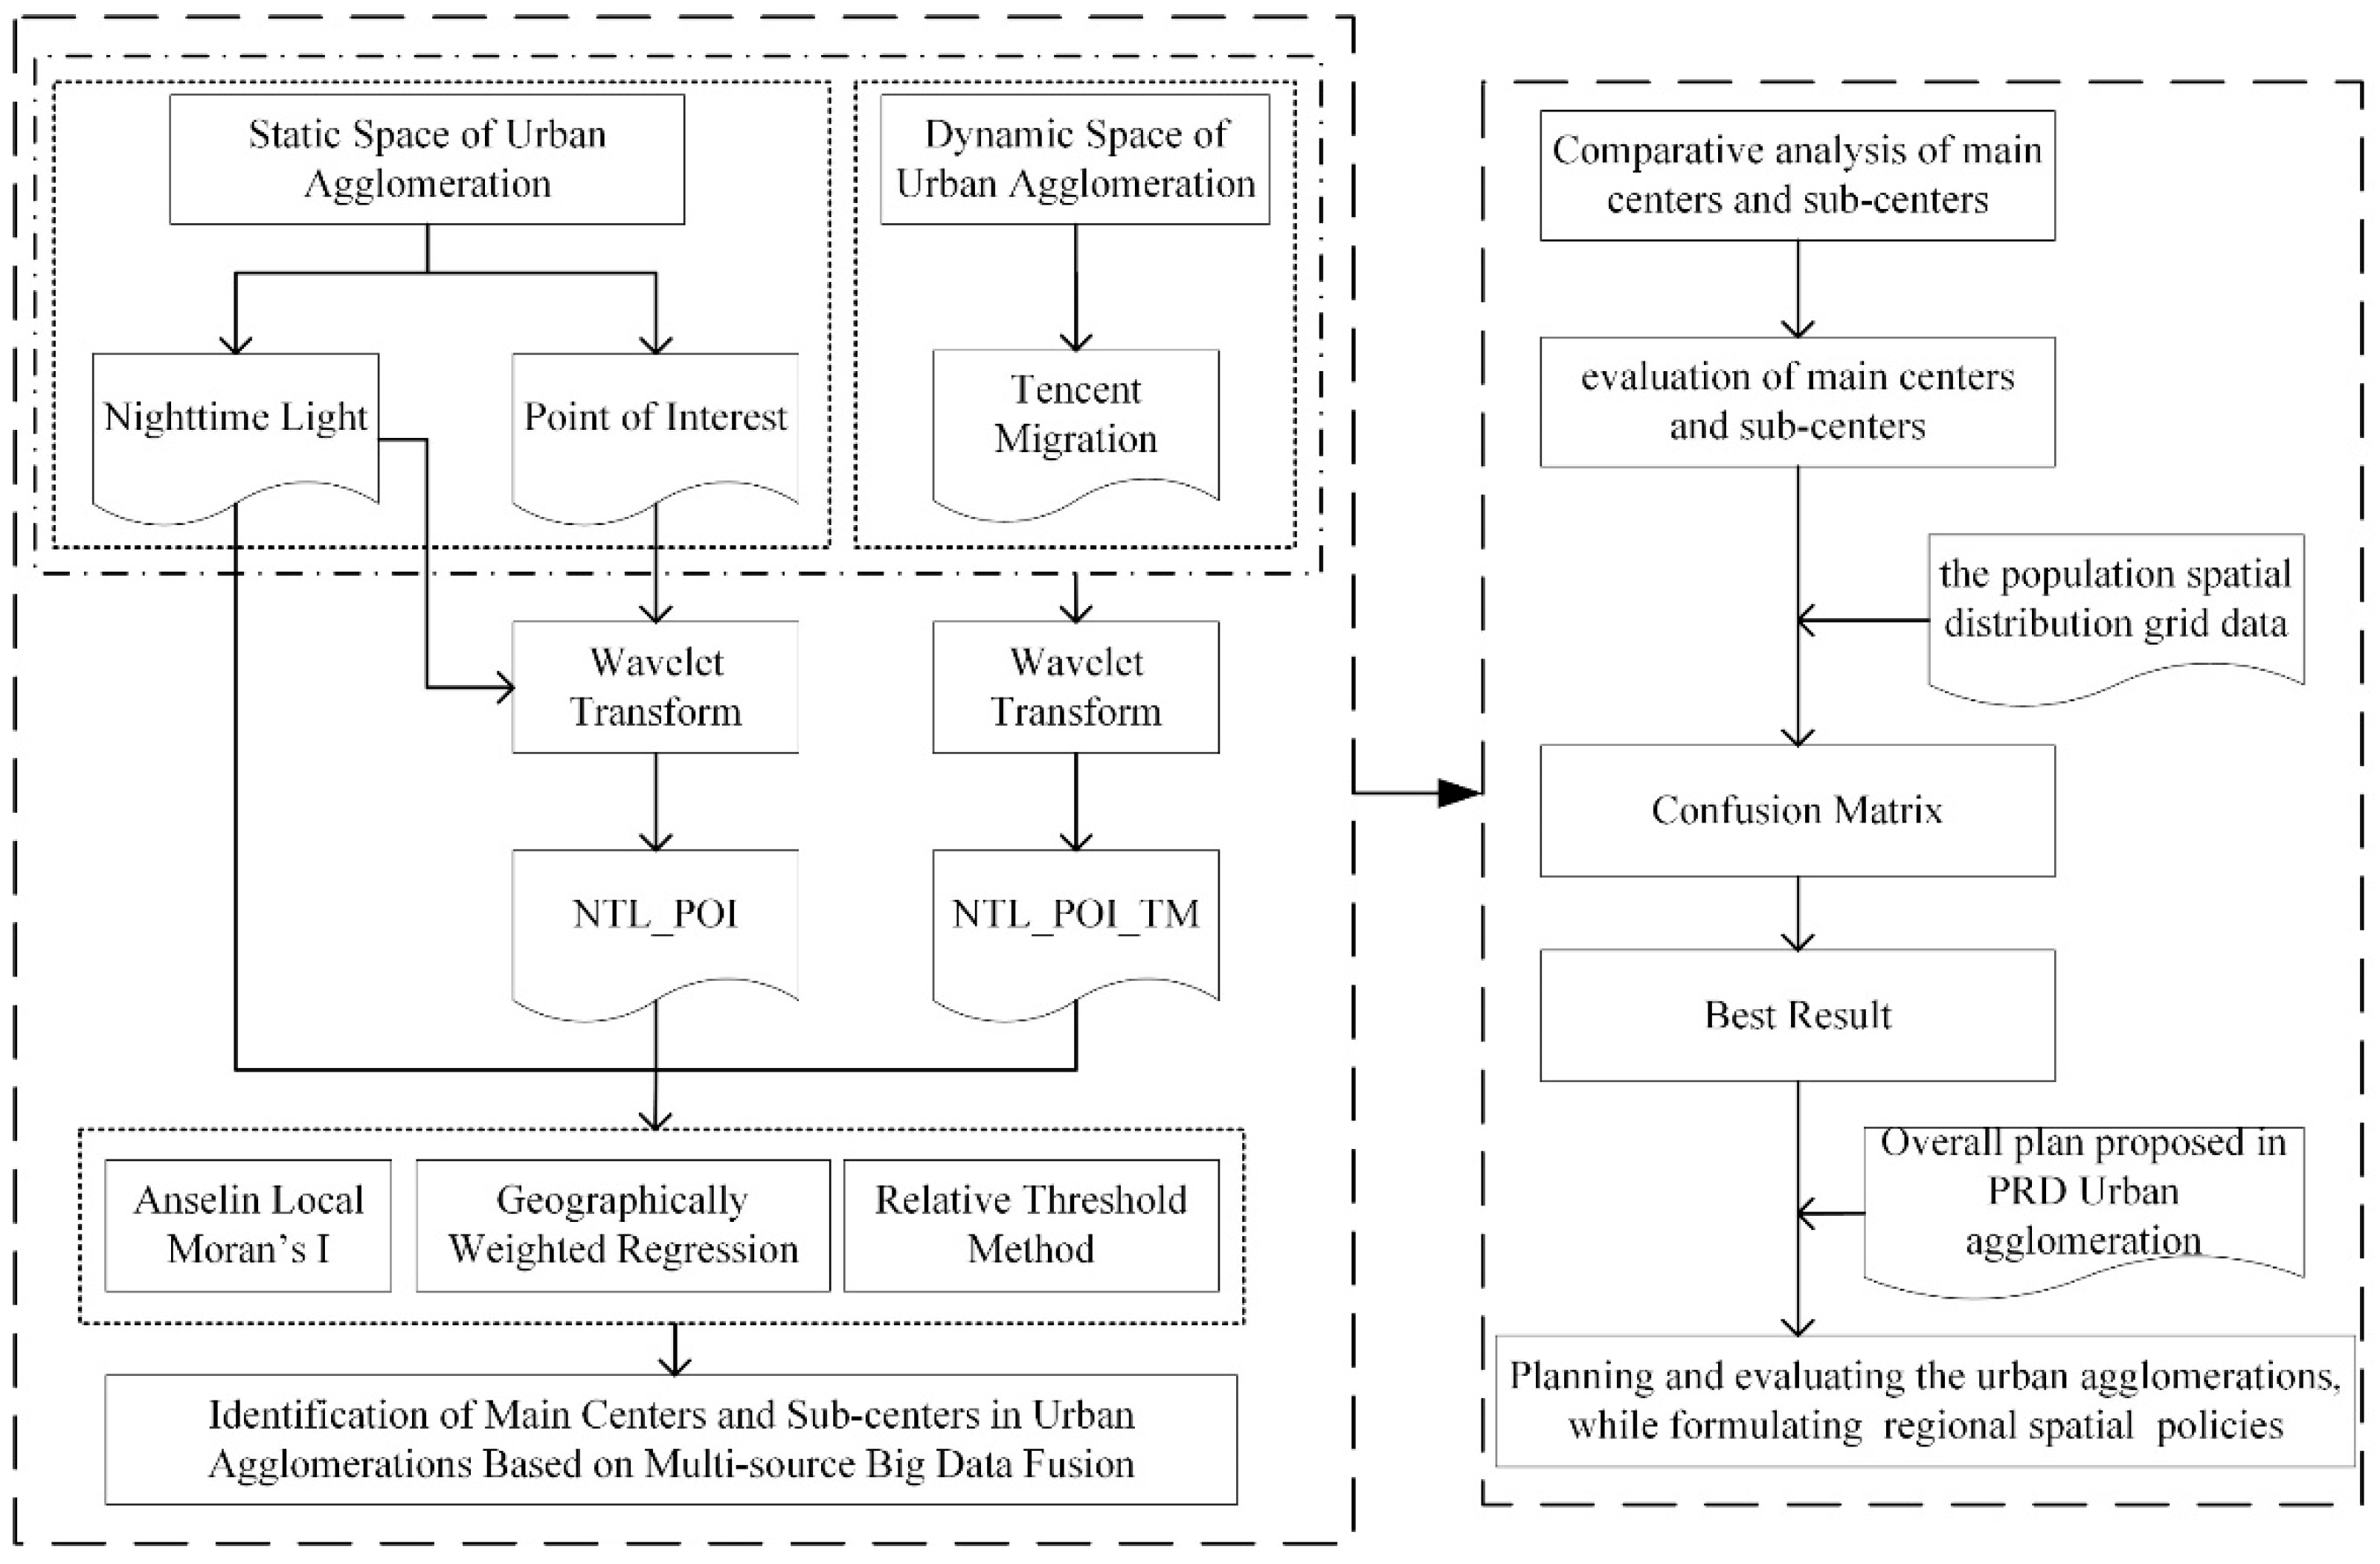
2.3.1. Data Fusion
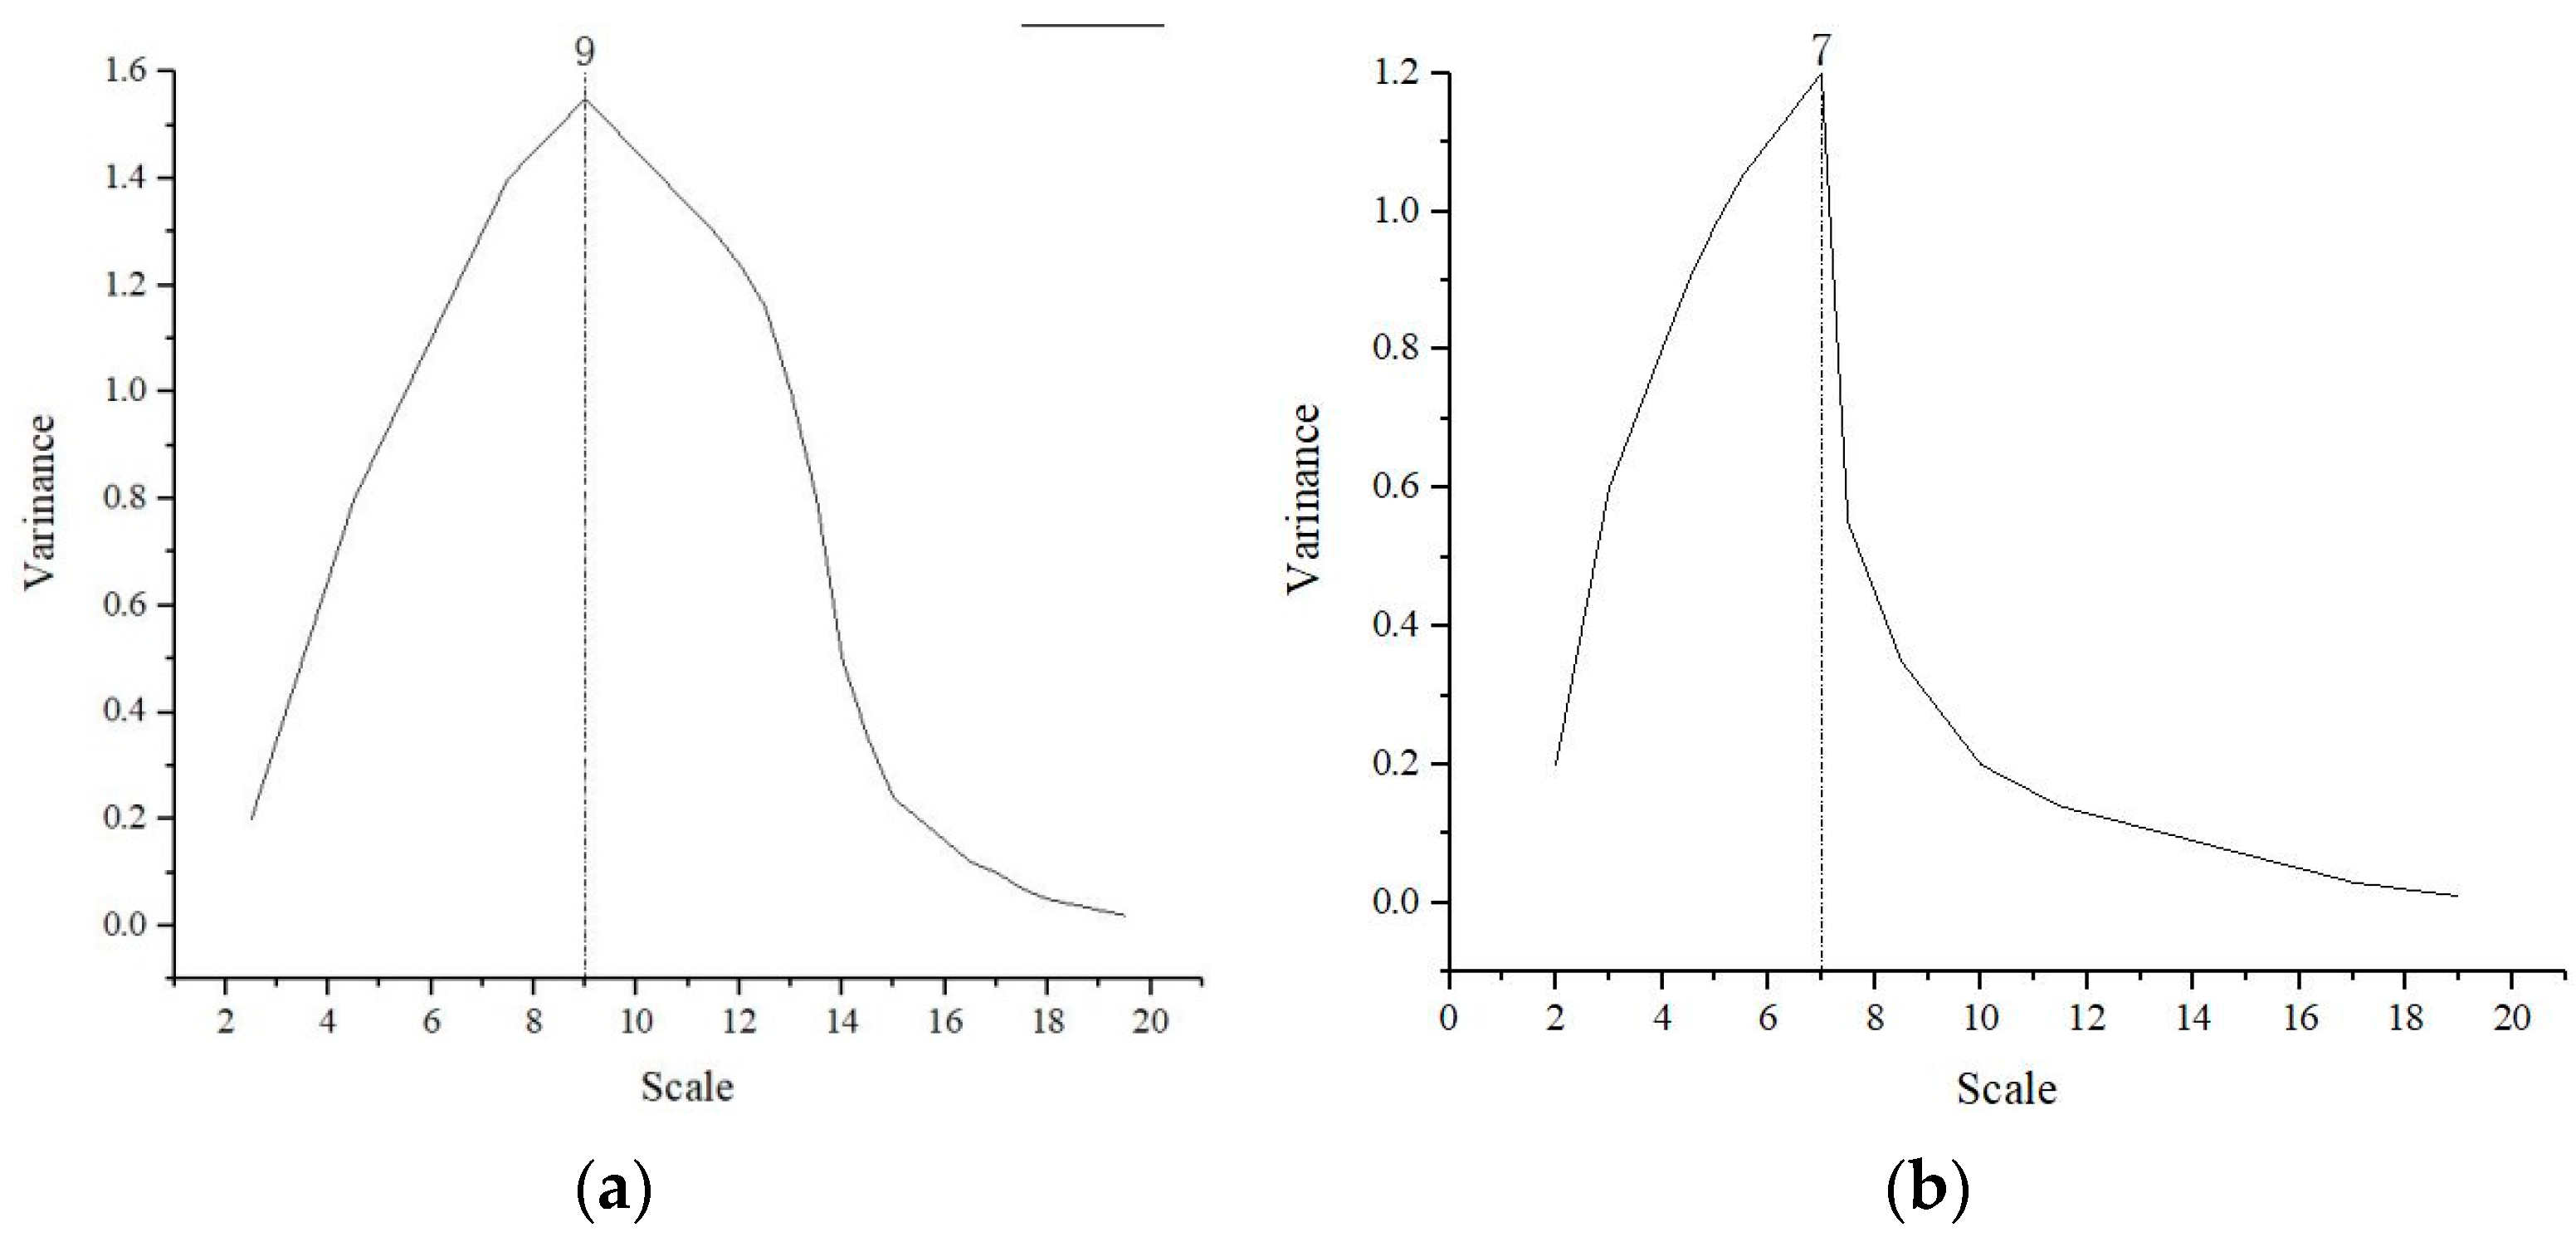
2.3.2. Main Center Identification
2.3.3. Subcenter Identification
3. Results
3.1. Polycentric Spatial Structure of Urban Agglomerations Identified by Different Data
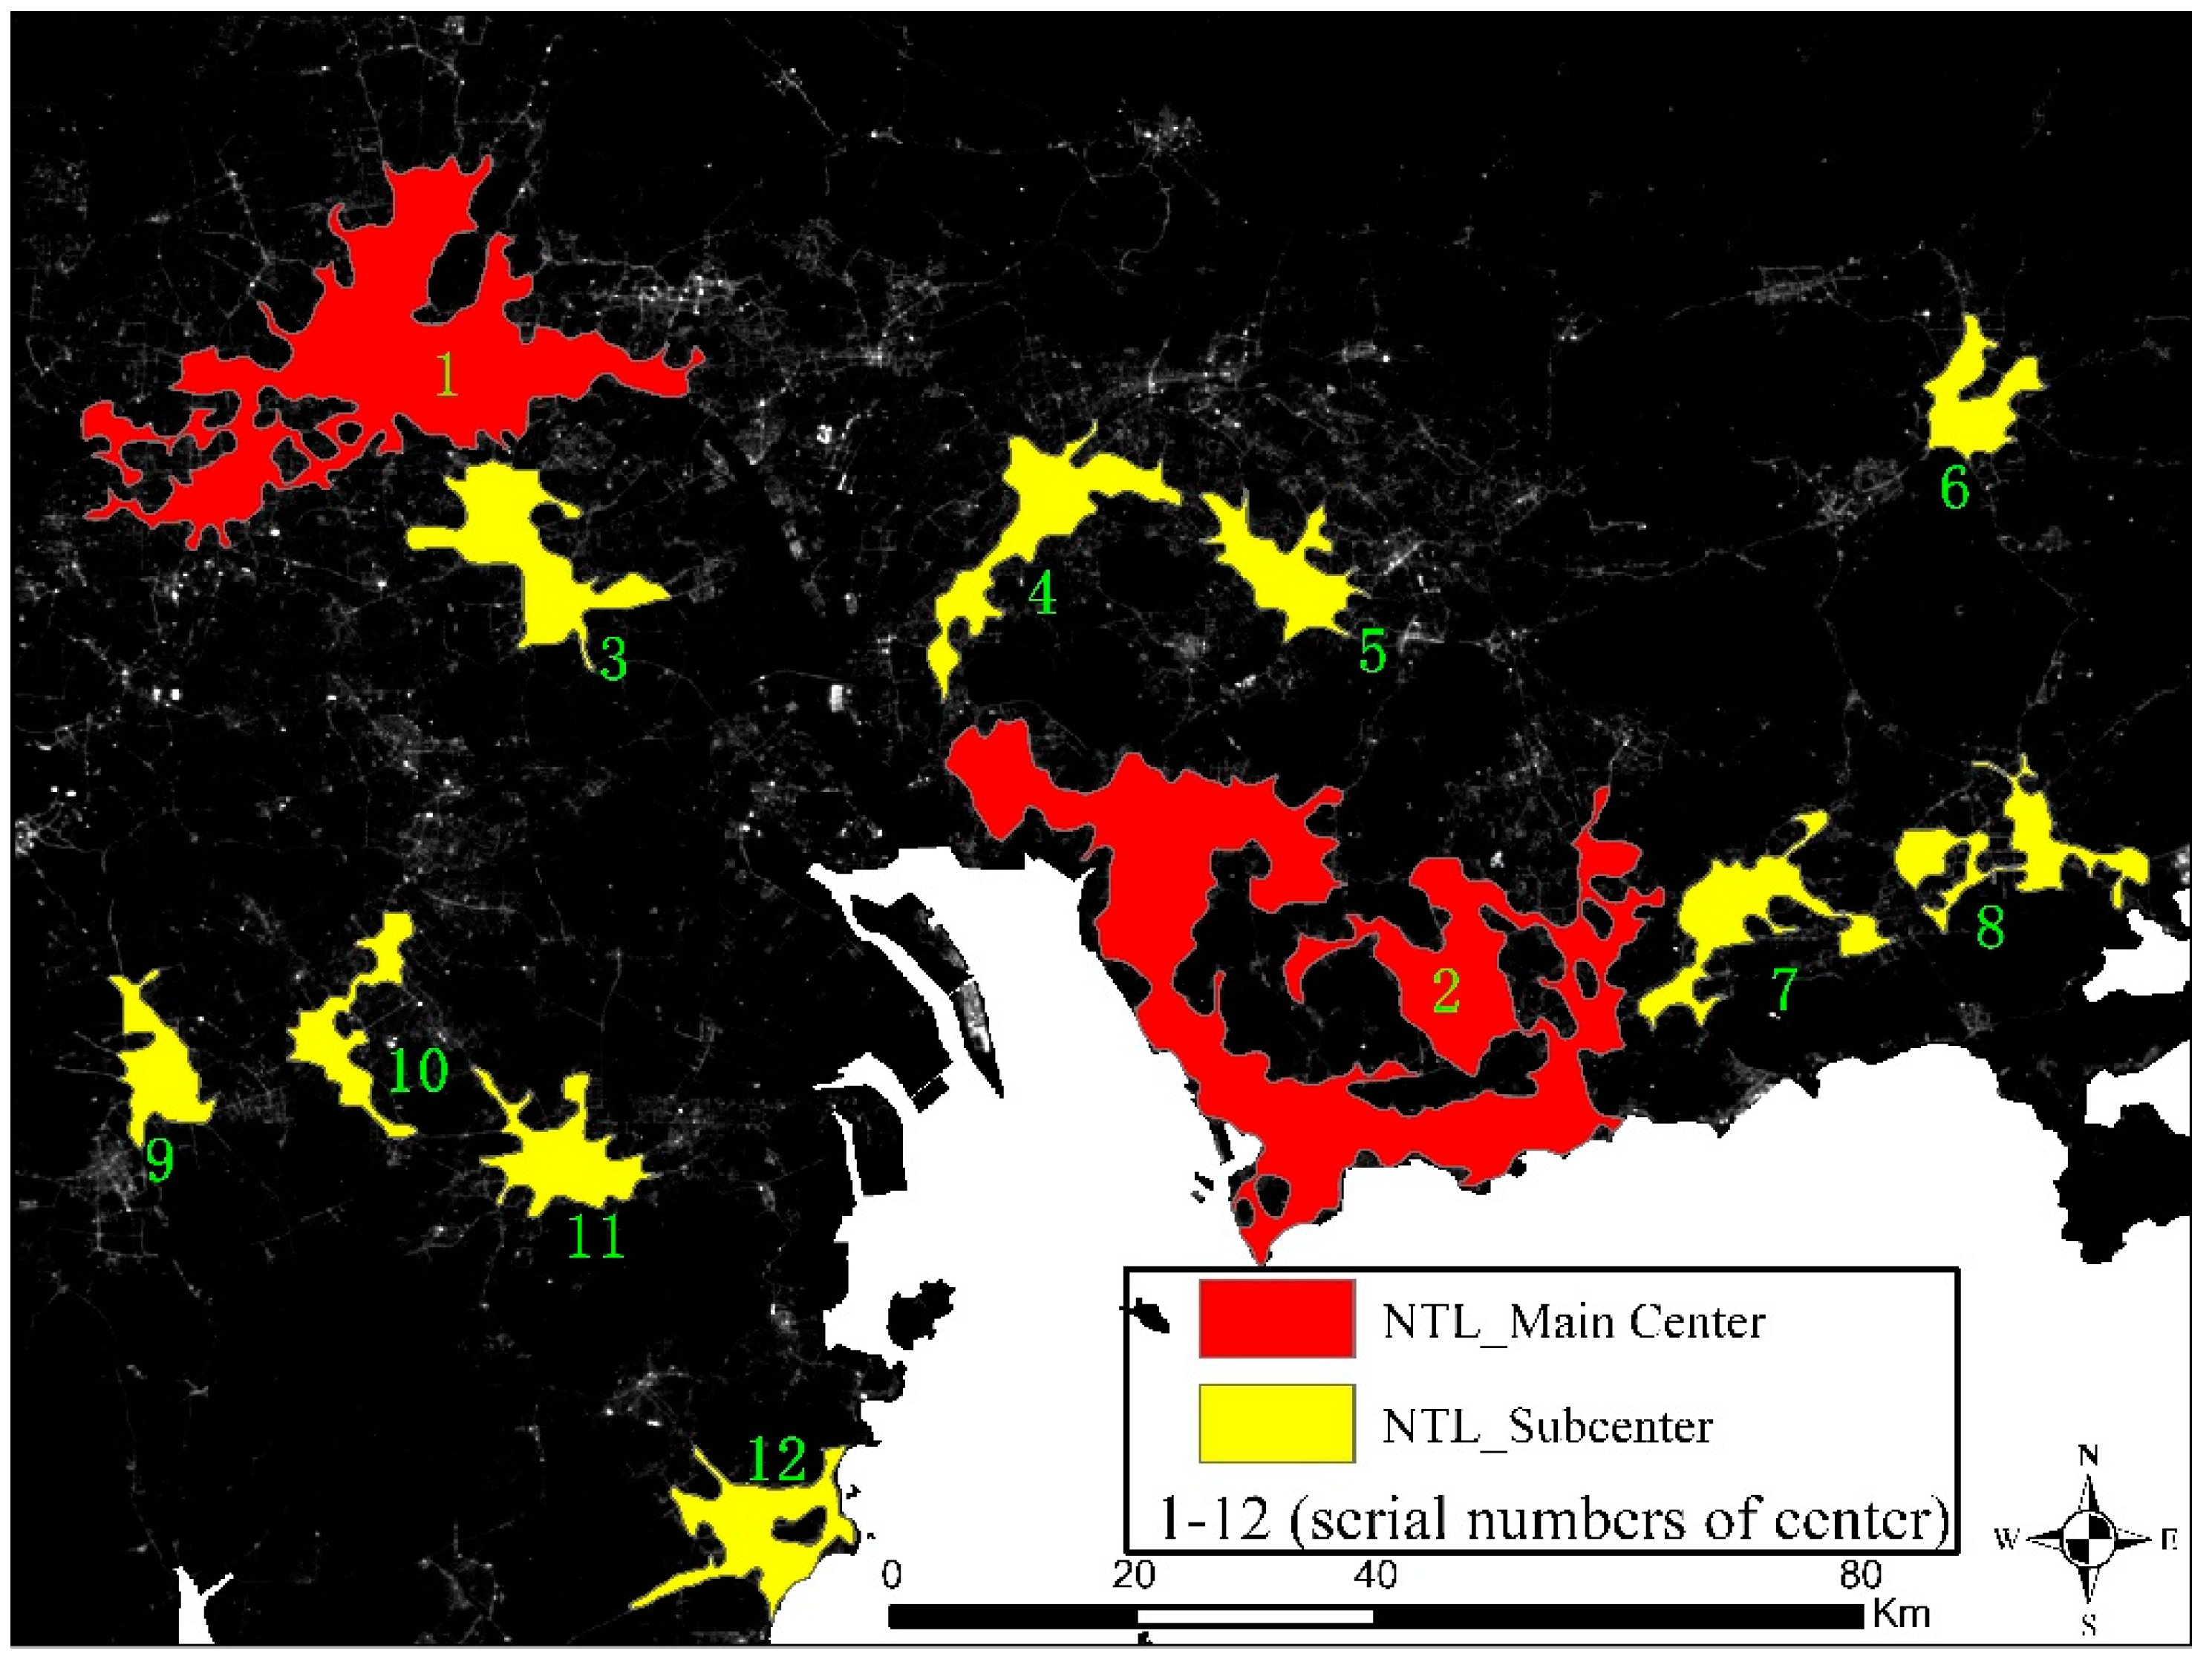
3.1.1. Polycentric Spatial Structure of Urban Agglomerations Identified by NTL Data
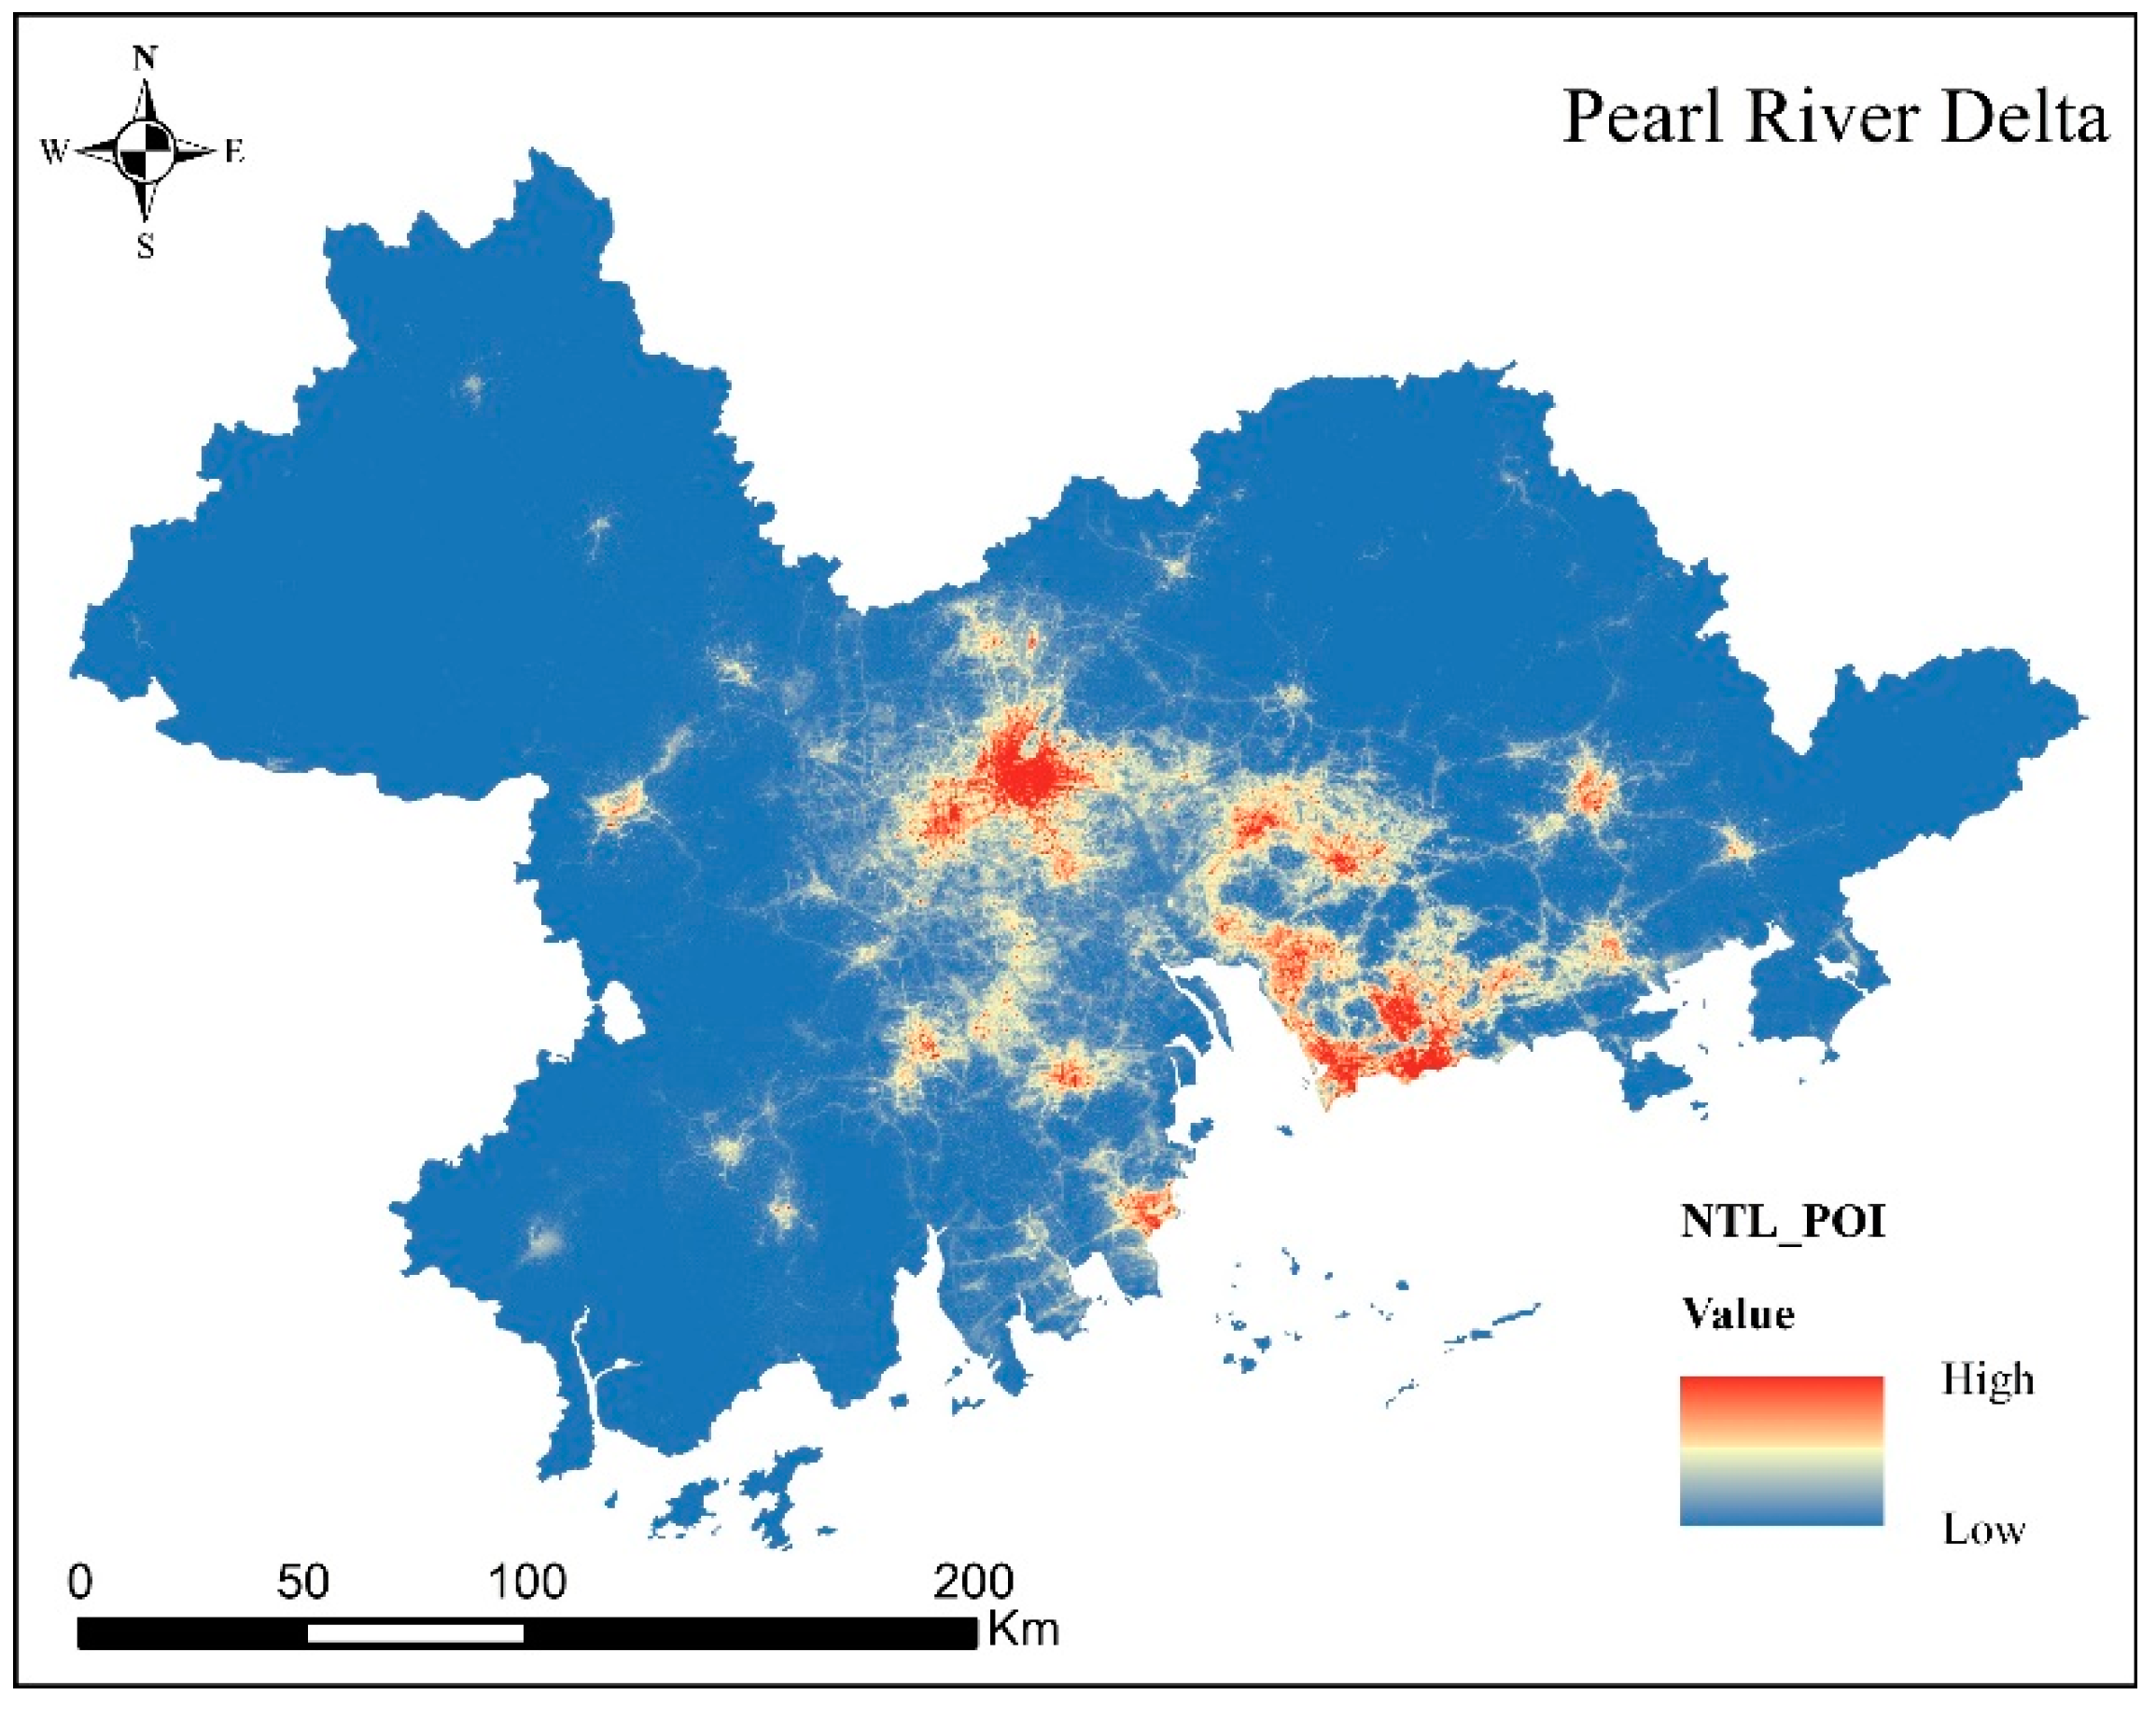
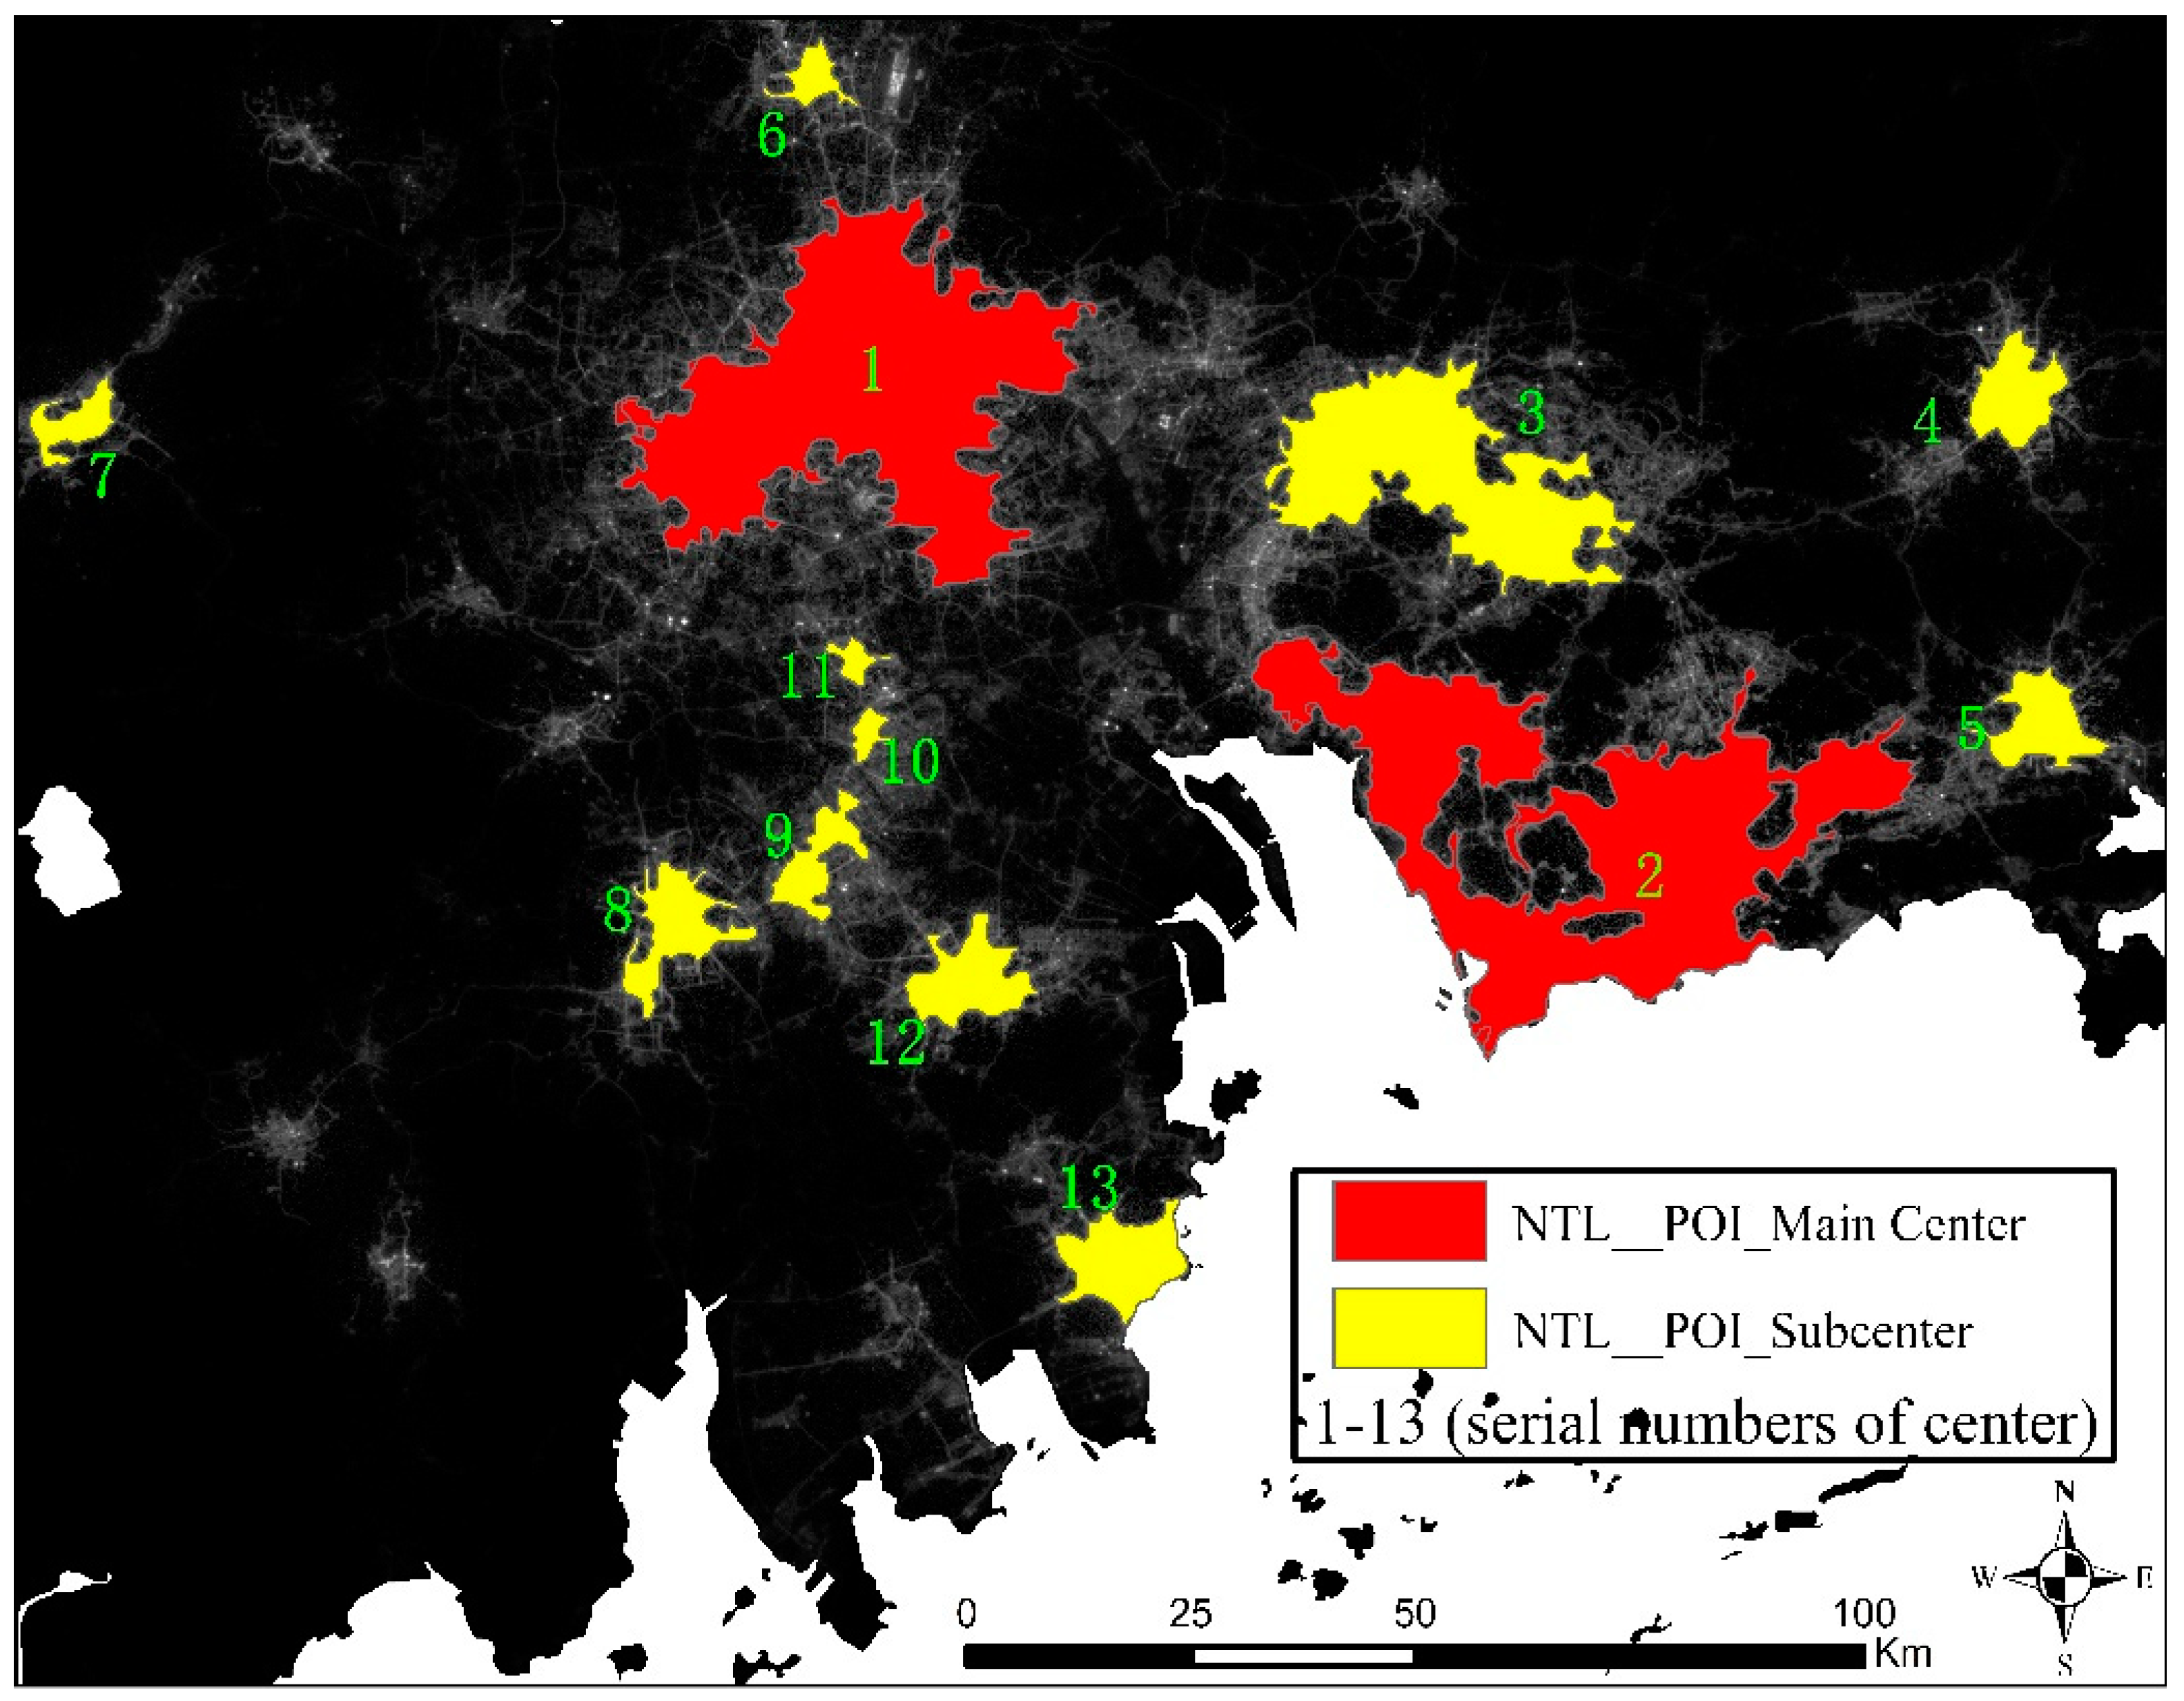
3.1.2. Polycentric Spatial Structure of Urban Agglomerations Identified by NTL_POI (NP)
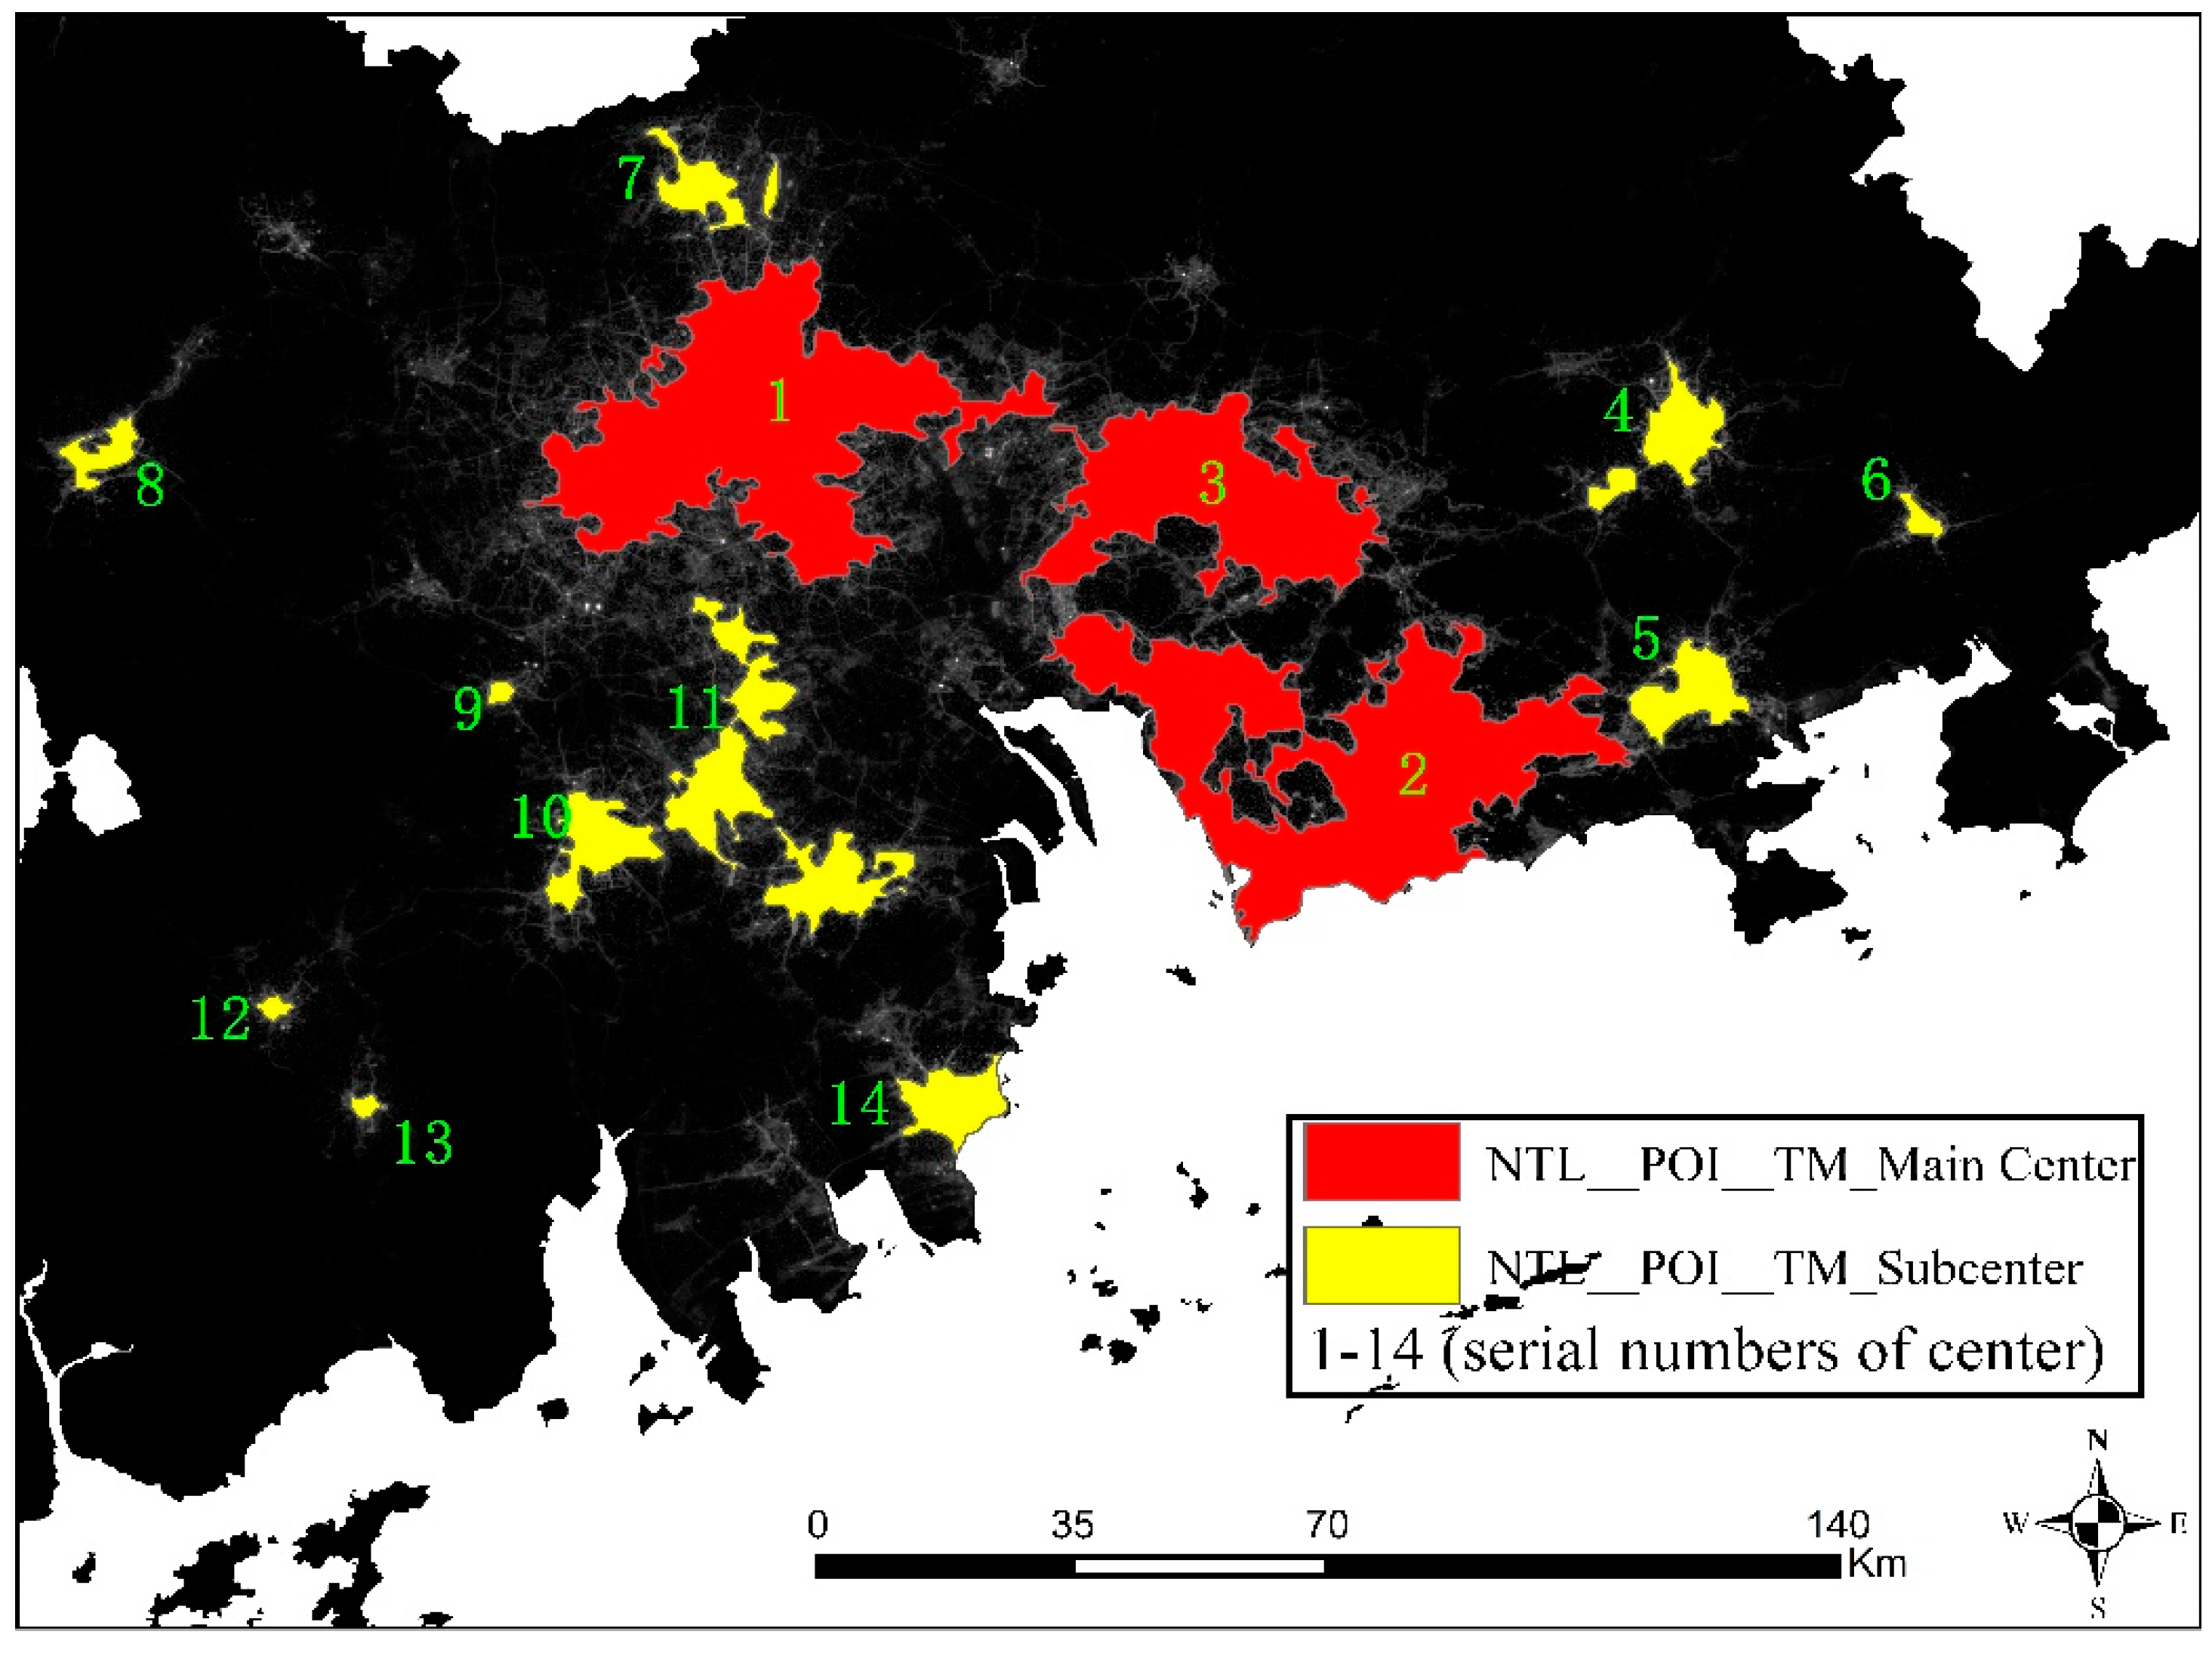
3.1.3. Polycentric Spatial Structure of Urban Agglomerations Identified by NTL_POI_TMG (NPT)
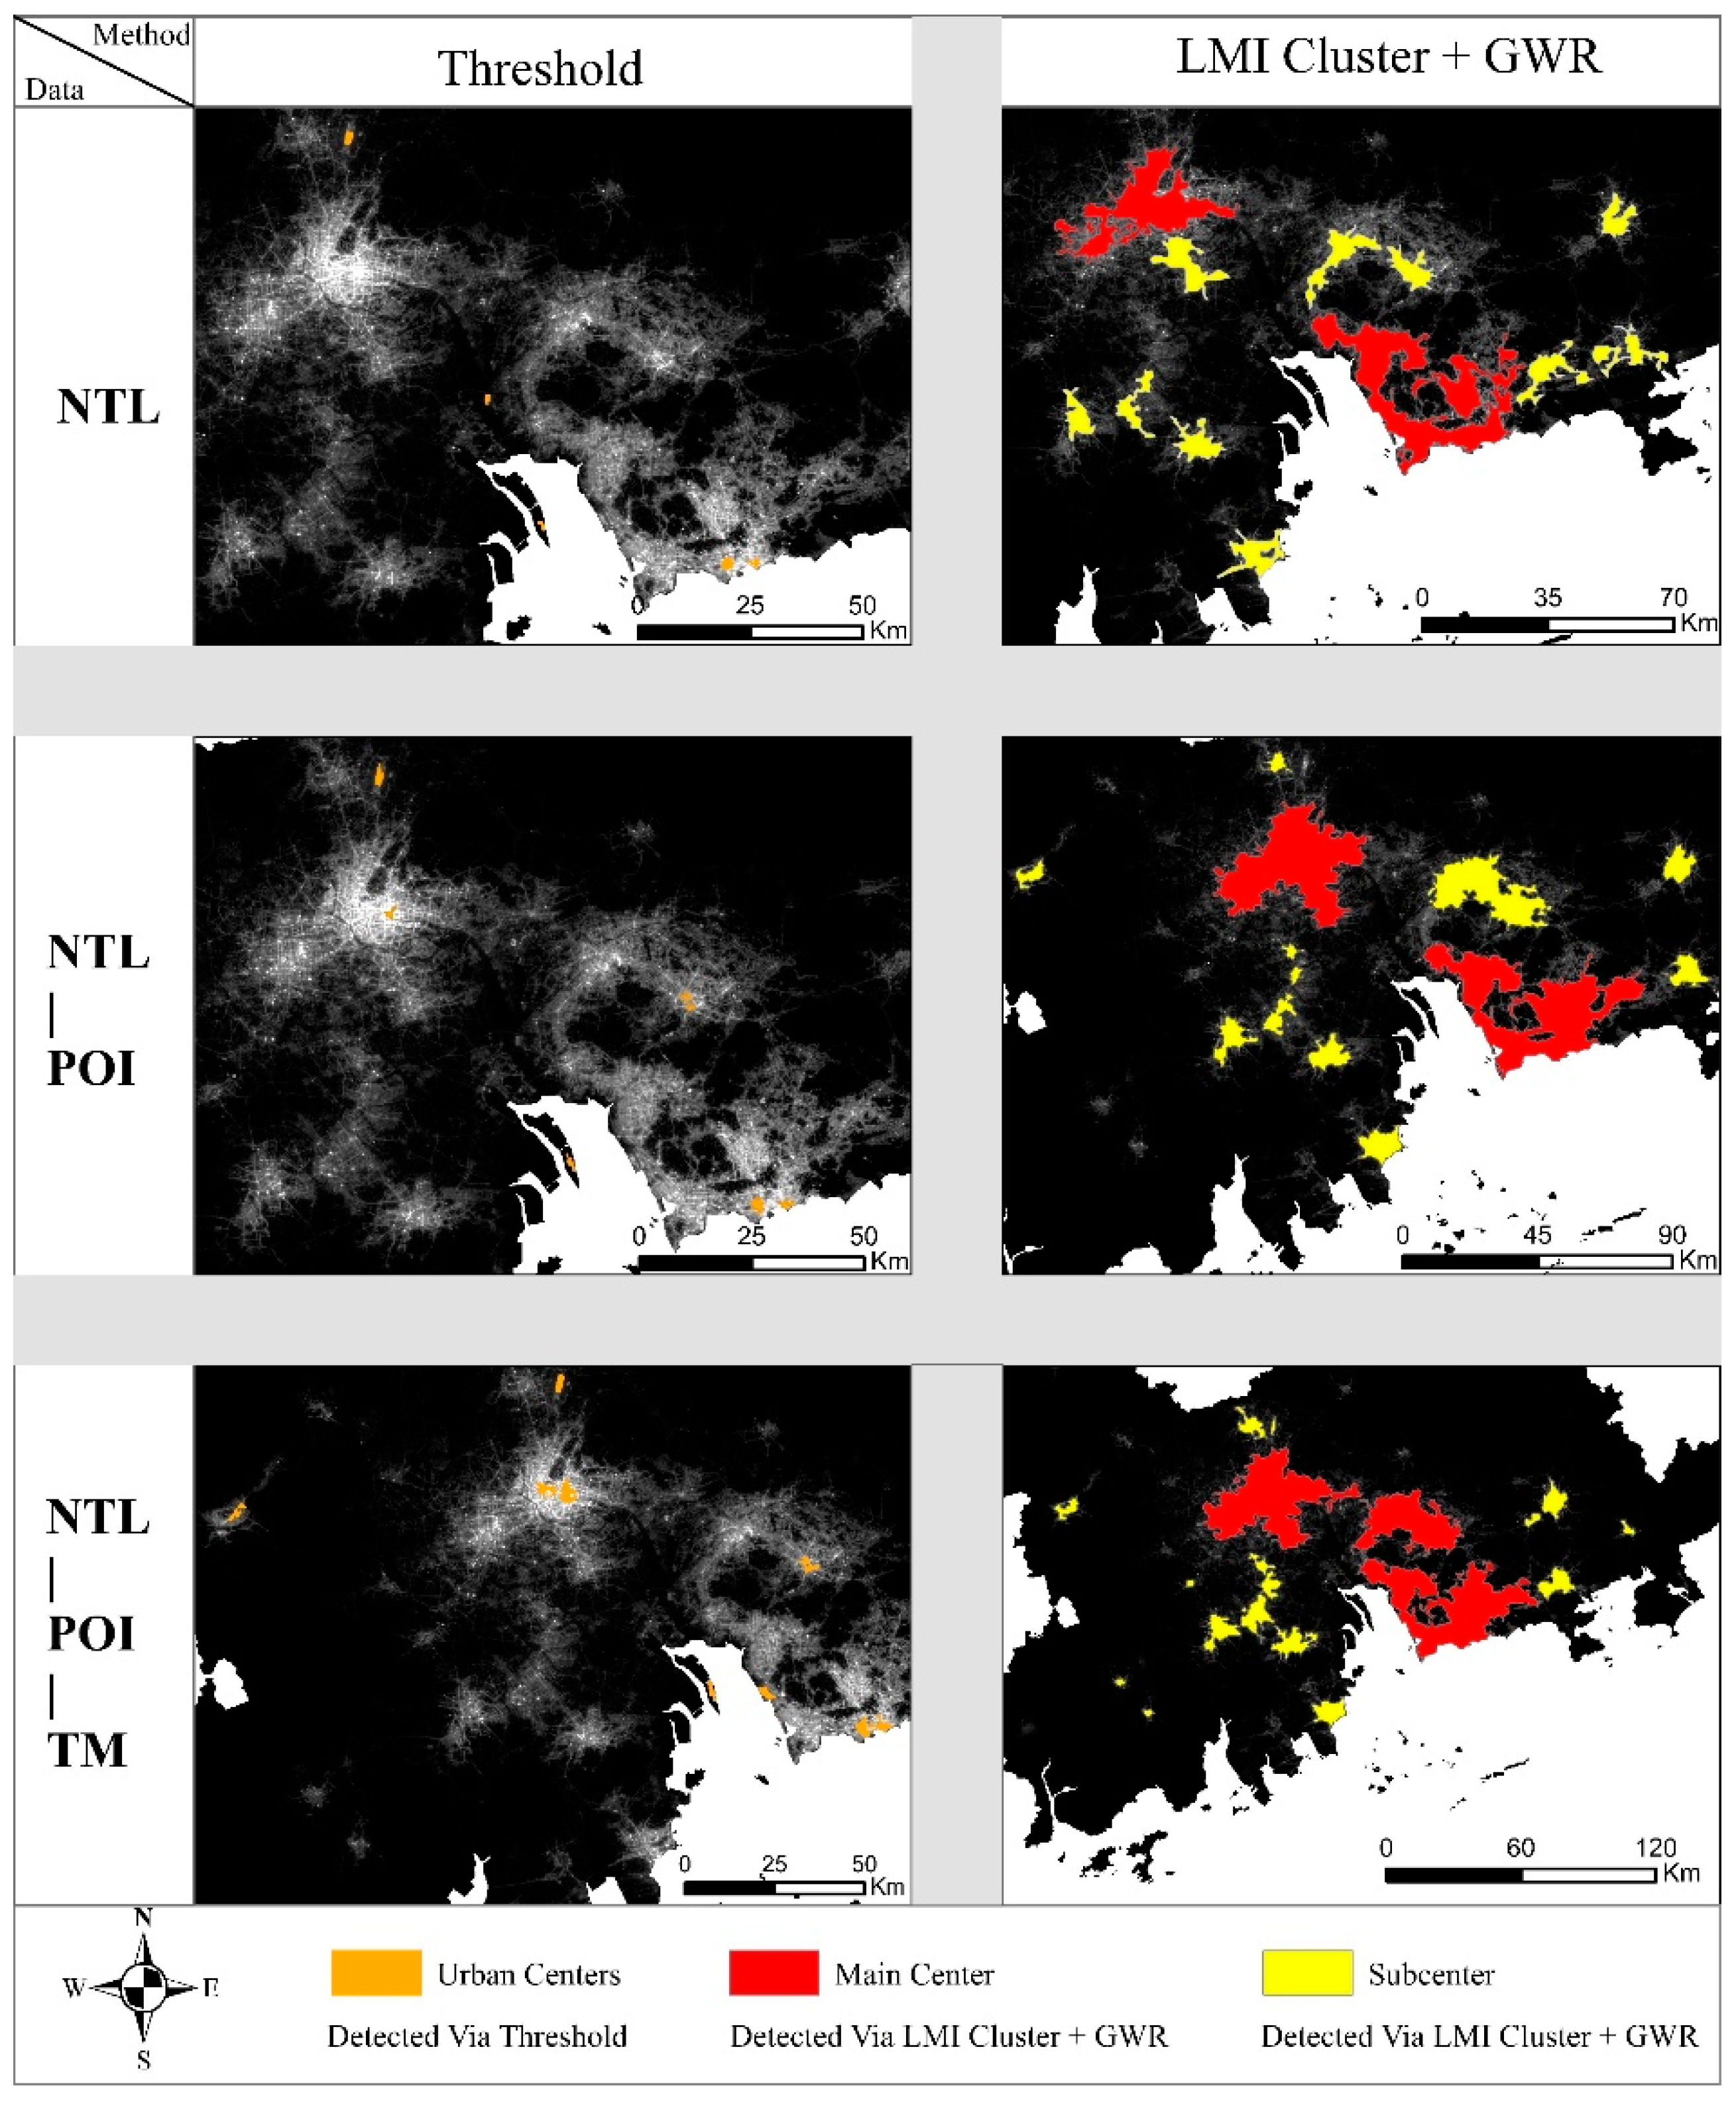
3.2. Comparison and Evaluation
3.2.1. Competitive Trial
3.2.2. Precision Validation
4. Discussion
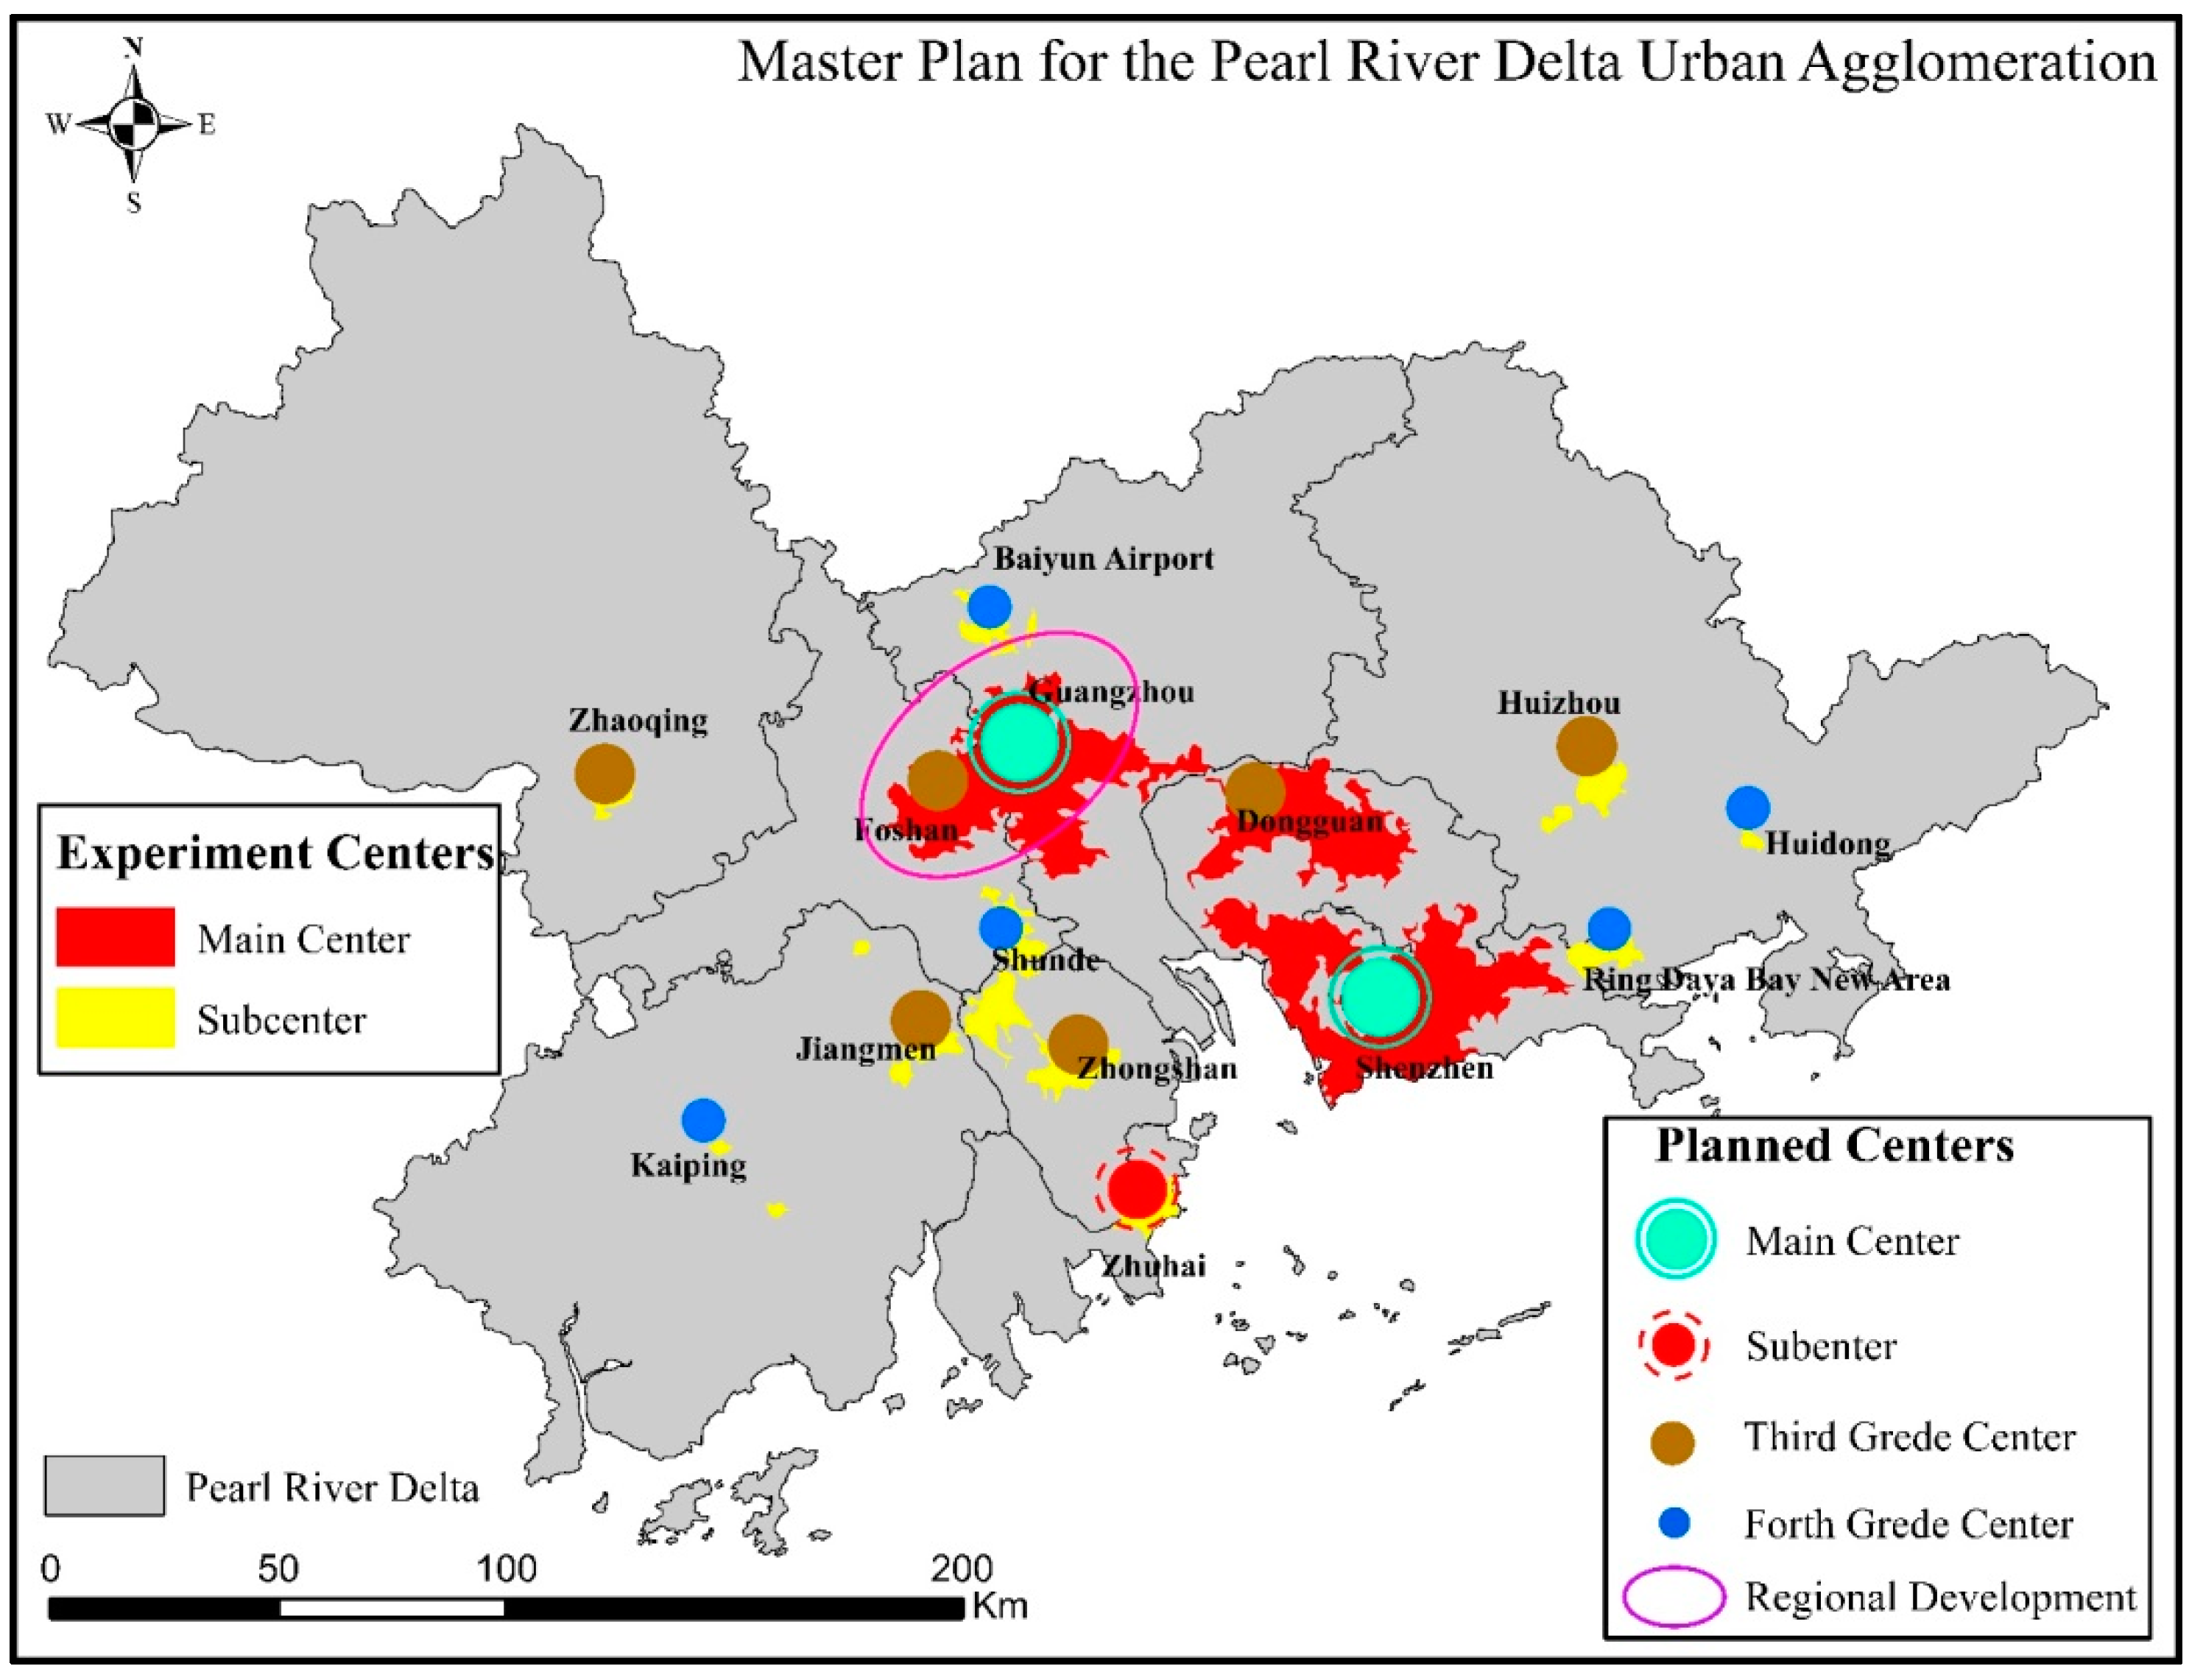
4.1. Comparison of Experimental Results and Planning Results
4.2. Study Contribution
4.3. The Deficiencies and Prospects of the Study
5. Conclusions
Author Contributions
Funding
Institutional Review Board Statement
Informed Consent Statement
Data Availability Statement
Acknowledgments
Conflicts of Interest
References
- Chen, M.; Liu, W.; Tao, X. Evolution and assessment on China’s urbanization 1960–2010: Under-urbanization or over-urbanization? Habitat Int. 2013, 38, 25–33. [Google Scholar] [CrossRef]
- Zeng, H.; Yan, C.; Huang, W.; Lin, Q.; Yu, L.; Qiu, G. A case study on the relationship between urbanization level and water use efficiency in the pearl river delta urban agglomeration. Beijing Da Xue Xue Bao 2020, 56, 561–570. [Google Scholar]
- Li, L.; Zhu, Y. The Impact of China’s Urbanization Level on Household Consumption. Rev. Cercet. Interv. Sociala 2021, 72, 378–397. [Google Scholar] [CrossRef]
- Li, Y. New Actors in the Old Hierarchies: Alliances for Low-Carbon Urban Development in Shenzhen, China. J. Plan. Educ. Res. 2021. [Google Scholar] [CrossRef]
- Wang, X.R.; Hui, E.C.M.; Sun, J.X. Population migration, urbanization and housing prices: Evidence from the cities in China. Habitat Int. 2017, 66, 49–56. [Google Scholar] [CrossRef]
- Wu, L. Correlation between Population Migration and Regional Planning Based on Urbanization of Coastal Cities. J. Coast. Res. 2020, 110, 50–53. [Google Scholar] [CrossRef]
- Hu, D.; Meng, Q.; Zhang, L.; Zhang, Y. Spatial quantitative analysis of the potential driving factors of land surface temperature in different “Centers” of polycentric cities: A case study in Tianjin, China. Sci. Total Environ. 2019, 706, 135244. [Google Scholar] [CrossRef] [PubMed]
- Yue, W.; Qiu, S.; Xu, H.; Xu, L.; Zhang, L. Polycentric urban development and urban thermal environment: A case of Hangzhou, China. Landsc. Urban Plan. 2019, 189, 58–70. [Google Scholar] [CrossRef]
- Zou, Y.; Lu, Y.; Cheng, Y. The impact of polycentric development on regional gap of energy efficiency: A Chinese provincial perspective. J. Clean. Prod. 2019, 224, 838–851. [Google Scholar] [CrossRef]
- McMillen, D.P.; McDonald, J.F. A nonparametric analysis of employment density in a polycentric city. J. Reg. Sci. 1997, 37, 591–612. [Google Scholar] [CrossRef]
- Nagel, M.; Stark, M.; Satoh, K.; Schmitt, M.; Kaip, E. Diversity in collaboration: Networks in urban climate change governance. Urban. Clim. 2019, 29, 100502. [Google Scholar] [CrossRef]
- Kumar, S.; Kumar, S.; Gupta, B. Urban health: Needs urgent attention. Indian J. Public Health 2018, 62, 214. [Google Scholar] [CrossRef]
- Yew, C.P. Pseudo-urbanization? Competitive government behavior and urban sprawl in China. J. Contemp. China 2012, 21, 281–298. [Google Scholar] [CrossRef]
- Liu, Y.; Li, Z.; Jin, J. Pseudo-urbanization or Real Urbanization? Urban China’s Mergence of Administrative Regions and Its Effects: A Case Study of Zhongshan City, Guangdong Province. China Rev. 2014, 14, 37–59. [Google Scholar]
- Randell, H.F.; VanWey, L.K. Networks versus need: Drivers of urban out-migration in the Brazilian Amazon. Popul. Res. Policy Rev. 2014, 33, 915–936. [Google Scholar] [CrossRef] [PubMed]
- Liu, W.; Hou, Q.; Xie, Z.; Mai, X. Urban Network and Regions in China: An Analysis of Daily Migration with Complex Networks Model. Sustainability 2020, 12, 3208. [Google Scholar] [CrossRef] [Green Version]
- Lee, H.; Roh, J.; Jung, J.H.; Jang, W. Network analysis of urban-to-rural migration. Korean J. Appl. Stat. 2016, 29, 487–503. [Google Scholar] [CrossRef]
- Li, G.; Li, F. Urban sprawl in China: Differences and socioeconomic drivers. Sci. Total Environ. 2019, 673, 367–377. [Google Scholar] [CrossRef]
- Meijers, E. Polycentric Urban Regions and the Quest for Synergy: Is a Network of Cities More than the Sum of the Parts? Urban. Stud. 2005, 42, 765–781. [Google Scholar] [CrossRef]
- Liu, X.; Wang, M. How polycentric is urban China and why? A case study of 318 cities. Landsc. Urban Plan. 2016, 151, 10–20. [Google Scholar] [CrossRef]
- Taubenböck, H.; Standfuß, I.; Wurm, M.; Krehl, A.; Siedentop, S. Measuring morphological polycentricity—A comparative analysis of urban mass concentrations using remote sensing data. Comput. Environ. Urban Syst. 2017, 64, 42–56. [Google Scholar] [CrossRef]
- Yu, L.Y.; Xie, J.B.; Zhang, Z.Z. Study on the Siphon Effect of the Develotipment of Agricultural Electronic Commerce Industry among Regions. Appl. Eng. Agric. 2021, 37, 743–749. [Google Scholar]
- Niu, F.; Xin, Z.; Sun, D. Urban land use effects of high-speed railway network in China: A spatial spillover perspective. Land Use Policy 2021, 105, 105417. [Google Scholar] [CrossRef]
- Yang, J.; Song, G.; Lin, J. Measuring Spatial Structure of China’s Megaregions. J. Urban Plan. Dev. 2015, 141, 04014021. [Google Scholar] [CrossRef] [Green Version]
- Xie, Z.; Ye, X.; Zheng, Z.; Li, D.; Sun, L.; Li, R.; Benya, S. Modeling Polycentric Urbanization Using Multisource Big Geospatial Data. Remote Sens. 2019, 11, 310. [Google Scholar] [CrossRef] [Green Version]
- McMillen, D.P. Nonparametric employment subcenter identification. J. Urban Econ. 2001, 50, 448–473. [Google Scholar] [CrossRef]
- Redfearn, C.L. The topography of metropolitan employment: Identifying centers of employment in a polycentric urban area. J. Urban Econ. 2007, 61, 519–541. [Google Scholar] [CrossRef]
- Rao, Y.; Yang, J.; Dai, D.; Wu, K.; He, Q. Urban growth pattern and commuting efficiency: Empirical evidence from 100 Chinese cities. J. Clean. Prod. 2021, 302, 126994. [Google Scholar] [CrossRef]
- Zhang, H.; Chen, B.; Sun, Z.; Bao, Z. Landscape perception and recreation needs in urban green space in Fuyang, Hangzhou, China. Urban For. Urban Green. 2013, 12, 44–52. [Google Scholar] [CrossRef]
- Zhang, J.; Yuan, X.; Tan, X.; Zhang, X. Delineation of the Urban-Rural Boundary through Data Fusion: Applications to Improve Urban and Rural Environments and Promote Intensive and Healthy Urban Development. Int. J. Environ. Res. Public Health 2021, 18, 7180. [Google Scholar] [CrossRef] [PubMed]
- Sá Marques, T.; Saraiva, M.; Ribeiro, D.; Amante, A.; Silva, D.; Melo, P. Accessibility to services of general interest in polycentric urban system planning: The case of Portugal. Eur. Plan. Stud. 2020, 28, 1068–1094. [Google Scholar] [CrossRef]
- He, X.; Zhou, C.; Zhang, J.; Yuan, X. Using Wavelet Transforms to Fuse Nighttime Light Data and POI Big Data to Extract Urban Built-Up Areas. Remote Sens. 2020, 12, 3887. [Google Scholar] [CrossRef]
- Wu, R.; Li, Z.; Wang, S. The varying driving forces of urban land expansion in China: Insights from a spatial-temporal analysis. Sci. Total Environ. 2020, 766, 142591. [Google Scholar] [CrossRef] [PubMed]
- Salvati, L. Planning for Sustainable Land-Use Changes: Indications from an Assessment of Soil Consumption in a Polycentric Region. J. Urban Plan. Dev. 2014, 140, 05014002. [Google Scholar] [CrossRef]
- Hou, Y. Polycentric urban form and non-work travel in Singapore: A focus on seniors. Transp. Res. Part D Transp. Environ. 2019, 73, 245–275. [Google Scholar] [CrossRef]
- Crosato, E.; Prokopenko, M.; Harré, M.S. The Polycentric Dynamics of Melbourne and Sydney: Suburb attractiveness divides a city at the home ownership level. Proc. R. Soc. A Math. Phys. Eng. Sci. 2021, 477, 20200514. [Google Scholar] [CrossRef]
- McMillen, D.P. The return of centralization to Chicago: Using repeat sales to identify changes in house price distance gradients. Reg. Sci. Urban Econ. 2003, 33, 287–304. [Google Scholar] [CrossRef]
- Liu, X.; Derudder, B.; Wang, M. Polycentric urban development in China: A multi-scale analysis. Environ. Plan. B Urban Anal. City Sci. 2017, 45, 953–972. [Google Scholar] [CrossRef]
- McMillen, D.P. Identifying sub-centres using contiguity matrices. Urban Stud. 2003, 40, 57–69. [Google Scholar] [CrossRef]
- McMillen, D.P. Employment densities, spatial autocorrelation, and subcenters in large metropolitan areas. J. Reg. Sci. 2004, 44, 225–244. [Google Scholar] [CrossRef]
- Riguelle, F.; Thomas, I.; Verhetsel, A. Measuring urban polycentrism: A European case study and its implications. J. Econ. Geogr. 2007, 7, 193–215. [Google Scholar] [CrossRef]
- Garcia-López, M.À. Population suburbanization in Barcelona, 1991–2005: Is its spatial structure changing? J. Hous. Econ. 2010, 19, 119–132. [Google Scholar] [CrossRef]
- Lou, G.; Chen, Q.; He, K.; Zhou, Y.; Shi, Z. Using Nighttime Light Data and POI Big Data to Detect the Urban Centers of Hangzhou. Remote Sens. 2019, 11, 1821. [Google Scholar] [CrossRef] [Green Version]
- Elvidge, C.D.; Baugh, K.E.; Dietz, J.B.; Bland, T.; Sutton, P.C.; Kroehl, H.W. Radiance calibration of DMSP-OLS low-light imaging data of human settlements. Remote Sens. Environ. 1999, 68, 77–88. [Google Scholar] [CrossRef]
- Sun, L.; Tang, L.; Shao, G.; Qiu, Q.; Lan, T.; Shao, J. A Machine Learning-Based Classification System for Urban Built-Up Areas Using Multiple Classifiers and Data Sources. Remote Sens. 2019, 12, 91. [Google Scholar] [CrossRef] [Green Version]
- Hermosilla, T.; Palomar-Vazquez, J.; Balaguer-Beser, A.; Balsa-Barreiro, J.; Ruiz, L.A. Using street based metrics to characterize urban typologies. Comput. Environ. Urban Syst. 2014, 44, 68–79. [Google Scholar] [CrossRef] [Green Version]
- Mathews, A.J.; Frazier, A.E.; Nghiem, S.V.; Neumann, G.; Zhao, Y. Satellite scatterometer estimation of urban built-up volume: Validation with airborne lidar data. Int. J. Appl. Earth Obs. Geoinf. 2019, 77, 100–107. [Google Scholar] [CrossRef]
- Jun, Z.; Xiao-Die, Y.; Han, L. The Extraction of Urban Built-Up Areas by Integrating Night-Time Light and POI Data—A Case Study of Kunming, China. IEEE Access 2021, 9, 22417–22429. [Google Scholar] [CrossRef]
- Liu, H.; Luo, N.; Hu, C. Detection of County Economic Development Using LJ1-01 Nighttime Light Imagery: A Comparison with NPP-VIIRS Data. Sensors 2020, 20, 6633. [Google Scholar] [CrossRef]
- Zhang, X.; Li, P. A temperature and vegetation adjusted NTL urban index for urban area mapping and analysis. ISPRS J. Photogramm. Remote Sens. 2018, 135, 93–111. [Google Scholar] [CrossRef]
- Liu, Y.; Yang, Y.; Jing, W.; Yao, L.; Yue, X.; Zhao, X. A New Urban Index for Expressing Inner-City Patterns Based on MODIS LST and EVI Regulated DMSP/OLS NTL. Remote Sens. 2017, 9, 777. [Google Scholar] [CrossRef] [Green Version]
- Guo, L.; Deng, X.; Liu, Y.; He, H.; Lin, H.; Qiu, G.; Yang, W. Extraction of Dense Urban Buildings from Photogrammetric and LiDAR Point Clouds. IEEE Access 2021, 9, 111823–111832. [Google Scholar] [CrossRef]
- Liu, J.; Deng, Y.; Wang, Y.; Huang, H.; Du, Q.; Ren, F. Urban Nighttime Leisure Space Mapping with Nighttime Light Images and POI Data. Remote Sens. 2020, 12, 541. [Google Scholar] [CrossRef] [Green Version]
- Song, J.; Tong, X.; Wang, L.; Zhao, C.; Prishchepov, A. Monitoring finer-scale population density in urban functional zones: A remote sensing data fusion approach. Landsc. Urban Plan. 2019, 190, 103580. [Google Scholar] [CrossRef]
- Lu, C.; Pang, M.; Zhang, Y.; Li, H.; Lu, C.; Tang, X.; Cheng, W. Mapping Urban Spatial Structure Based on POI (Point of Interest) Data: A Case Study of the Central City of Lanzhou, China. ISPRS Int. J. Geo-Inf. 2020, 9, 92. [Google Scholar] [CrossRef] [Green Version]
- Zikirya, B.; He, X.; Li, M.; Zhou, C. Urban Food Takeaway Vitality: A New Technique to Assess Urban Vitality. Int. J. Environ. Res. Public Health 2021, 18, 3578. [Google Scholar] [CrossRef]
- Kamw, F.; Al-Dohuki, S.; Zhao, Y.; Eynon, T.; Sheets, D.; Yang, J.; Ye, X.; Chen, W. Urban Structure Accessibility Modeling and Visualization for Joint Spatiotemporal Constraints. IEEE Trans. Intell. Transp. Syst. 2019, 21, 104–116. [Google Scholar] [CrossRef]
- Li, F.; Yan, Q.; Bian, Z.; Liu, B.; Wu, Z. A POI and LST Adjusted NTL Urban Index for Urban Built-Up Area Extraction. Sensors 2020, 20, 2918. [Google Scholar] [CrossRef]
- He, X.; Zhou, C.; Wang, Y.; Yuan, X. Risk Assessment and Prediction of COVID-19 Based on Epidemiological Data from Spatiotemporal Geography. Front. Environ. Sci. 2021, 9, 634156. [Google Scholar] [CrossRef]
- Wang, Z.; Wang, H.; Qin, F.; Han, Z.; Miao, C. Mapping an Urban Boundary Based on Multi-Temporal Sentinel-2 and POI Data: A Case Study of Zhengzhou City. Remote Sens. 2020, 12, 4103. [Google Scholar] [CrossRef]
- Li, L.; Zhang, Y.; Liu, L.; Wang, Z.; Zhang, H.; Li, S.; Ding, M. Mapping Changing Population Distribution on the Qinghai–Tibet Plateau since 2000 with Multi-Temporal Remote Sensing and Point-of-Interest Data. Remote Sens. 2020, 12, 4059. [Google Scholar] [CrossRef]
- Wu, K.; Zhang, H.; Wang, Y.; Wu, Q.; Ye, Y. Identification and spatial pattern of Guangzhou multi-type commercial center. Progr. Geogr. 2016, 35, 963–974. [Google Scholar]
- Guo, J.; Lv, Y.; Shen, T. Urban Spatial structure based on point pattern analysis—Taking Beijing metropolitan area as a case. Econ. Geogr. 2015, 35, 68–74. [Google Scholar]
- Chen, Y.; Yue, W.; La Rosa, D. Which communities have better accessibility to green space? An investigation into environmental inequality using big data. Landsc. Urban Plan. 2020, 204, 103919. [Google Scholar] [CrossRef]
- Williams, S.; Xu, W.; Bin Tan, S.; Foster, M.J.; Chen, C. Ghost cities of China: Identifying urban vacancy through social media data. Cities 2019, 94, 275–285. [Google Scholar] [CrossRef]
- Chen, J.; Guo, X.; Pan, H.; Zhong, S. What determines city’s resilience against epidemic outbreak: Evidence from China’s COVID-19 experience. Sustain. Cities Soc. 2021, 70, 102892. [Google Scholar] [CrossRef] [PubMed]
- Wang, R.; Ji, C.; Jiang, Z.; Wu, Y.; Yin, L.; Li, Y. A Short-Term Prediction Model at the Early Stage of the COVID-19 Pandemic Based on Multisource Urban Data. IEEE Trans. Comput. Soc. Syst. 2021, 8, 938–945. [Google Scholar] [CrossRef]
- He, X.; Zhang, Z.; Yang, Z. Extraction of urban built-up area based on the fusion of night-time light data and point of interest data. R. Soc. Open Sci. 2021, 8, 210838. [Google Scholar] [PubMed]
- He, X.; Yuan, X.; Zhang, D.; Zhang, R.; Li, M.; Zhou, C. Delineation of Urban Agglomeration Boundary Based on Multisource Big Data Fusion—A Case Study of Guangdong–Hong Kong–Macao Greater Bay Area (GBA). Remote Sens. 2021, 13, 1801. [Google Scholar] [CrossRef]
- Yue, W.; Chen, Y.; Thy, P.T.M.; Fan, P.; Liu, Y.; Zhang, W. Identifying urban vitality in metropolitan areas of developing countries from a comparative perspective: Ho Chi Minh City versus Shanghai. Sustain. Cities Soc. 2020, 65, 102609. [Google Scholar] [CrossRef]
- Xu, Q.; Yang, R.; Zhuang, D.; Lu, Z. Spatial gradient differences of ecosystem services supply and demand in the Pearl River Delta region. J. Clean. Prod. 2020, 279, 123849. [Google Scholar] [CrossRef]
- Inoue, K.; Asami, T.; Shibata, T.; Furumai, H.; Katayama, H. Spatial and temporal profiles of enteric viruses in the coastal waters of Tokyo Bay during and after a series of rainfall events. Sci. Total Environ. 2020, 727, 138502. [Google Scholar] [CrossRef]
- Li, J.; Ouyang, X.; Zhu, X. Land space simulation of urban agglomerations from the perspective of the symbiosis of urban development and ecological protection: A case study of Changsha-Zhuzhou-Xiangtan urban agglomeration. Ecol. Indic. 2021, 126, 107669. [Google Scholar] [CrossRef]
- Wang, Y.; Shen, Z. Comparing Luojia 1-01 and VIIRS Nighttime Light Data in Detecting Urban Spatial Structure Using a Threshold-Based Kernel Density Estimation. Remote Sens. 2021, 13, 1574. [Google Scholar] [CrossRef]
- Zhang, J.; Yuan, X. COVID-19 Risk Assessment: Contributing to Maintaining Urban Public Health Security and Achieving Sustainable Urban Development. Sustainability 2021, 13, 4208. [Google Scholar] [CrossRef]
- Menaka, D.; Suresh, L.P.; Premkumar, S.S. Wavelet transform-based land cover classification of satellite images. In Artificial Intelligence and Evolutionary Algorithms in Engineering Systems; Springer: New Delhi, India, 2015; pp. 845–854. [Google Scholar]
- Huang, X.; Zhang, L. A multiscale urban complexity index based on 3D wavelet transform for spectral–spatial feature extraction and classification: An evaluation on the 8-channel WorldView-2 imagery. Int. J. Remote Sens. 2011, 33, 2641–2656. [Google Scholar] [CrossRef]
- Li, Y.; Derudder, B. Dynamics in the polycentric development of chinese cities, 2001–2016. Urban. Geogr. 2020, 42, 1–21. [Google Scholar] [CrossRef]
- Fuentes, C.M.; Hernández, V. The Spatial Evolution of Employment Subcenters in Ciudad Juárez, Chihuahua (1994–2004): An Analysis Using Global and Local Spatial Autocorrelation Indicators. Estud. Demográficos Urbanos 2015, 30, 433–467. [Google Scholar] [CrossRef]
- Deng, Y.; Liu, J.; Luo, A. Detecting Urban Polycentric Structure from POI Data. ISPRS Int. J. Geo-Inf. 2019, 8, 283. [Google Scholar] [CrossRef] [Green Version]
- Peng, J.; Hu, Y.; Liu, Y.; Ma, J.; Zhao, S. A new approach for urban-rural fringe identification: Integrating impervious surface area and spatial continuous wavelet transform. Landsc. Urban Plan. 2018, 175, 72–79. [Google Scholar] [CrossRef]
- Anselin, L. Local Indicators of Spatial Association-LISA. Geogr. Anal. 2010, 27, 93–115. [Google Scholar] [CrossRef]
- Zhou, Y.; Chen, J.; Guo, Q.; Cao, R.; Zhu, X. Restoration of Information Obscured by Mountainous Shadows Through Landsat TM/ETM+ Images without the Use of DEM Data: A New Method. IEEE Trans. Geosci. Remote. Sens. 2013, 52, 313–328. [Google Scholar] [CrossRef]
- Guobin, C.; Sun, Z.; Zhang, L. Road Identification Algorithm for Remote Sensing Images Based on Wavelet Transform and Recursive Operator. IEEE Access 2020, 8, 141824–141837. [Google Scholar] [CrossRef]
- Jiao, M.; Wang, Y.; Hu, M.; Xia, B. Spatial deconstruction and differentiation analysis of early warning for ecological security in the Pearl River Delta, China. Sustain. Cities Soc. 2020, 64, 102557. [Google Scholar] [CrossRef]
- Zhao, Y.; Zhang, G.; Zhao, H. Spatial Network Structures of Urban Agglomeration Based on the Improved Gravity Model: A Case Study in China’s Two Urban Agglomerations. Complexity 2021, 2021, 6651444. [Google Scholar] [CrossRef]
- Small, C.; Pozzi, F.; Elvidge, C. Spatial analysis of global urban extent from DMSP-OLS night lights. Remote Sens. Environ. 2005, 96, 277–291. [Google Scholar] [CrossRef]
- Li, S.; Sun, Z.; Wang, Y.; Wang, Y. Understanding Urban Growth in Beijing-Tianjin-Hebei Region over the Past 100 Years Using Old Maps and Landsat Data. Remote Sens. 2021, 13, 3264. [Google Scholar] [CrossRef]
- Shi, Y.; Liu, D. Excessive Urbanization and Rejuvenation in the Metropolitan City Center in Shanghai, China. J. Urban Plan. Dev. 2018, 144, 05018020. [Google Scholar] [CrossRef]
- Xu, R.; Yang, G.; Qu, Z.; Chen, Y.; Liu, J.; Shang, L.; Liu, S.; Ge, Y.; Chang, J. City components–area relationship and diversity pattern: Towards a better understanding of urban structure. Sustain. Cities Soc. 2020, 60, 102272. [Google Scholar] [CrossRef]
- Li, X. Recognition of Urban Polycentric Structure Based on Spatial Aggregation Characteristics of POI Elements: A Case of Zhengzhou City. Beijing Da Xue Xue Bao 2020, 56, 692–702. [Google Scholar]
- Ma, M.; Lang, Q.; Yang, H.; Shi, K.; Ge, W. Identification of Polycentric Cities in China Based on NPP-VIIRS Nighttime Light Data. Remote Sens. 2020, 12, 3248. [Google Scholar] [CrossRef]
- Cao, J. Measurement of urban integration degree of urban agglomeration under the background of regional integration: A case of Nanjing, Zhenjiang and Yangzhou. Int. J. Electr. Eng. Educ. 2020. [Google Scholar] [CrossRef]
- Feng, R.; Wang, F.; Wang, K.; Xu, S. Quantifying influences of anthropogenic-natural factors on ecological land evolution in mega-urban agglomeration: A case study of Guangdong-Hong Kong-Macao greater Bay area. J. Clean. Prod. 2020, 283, 125304. [Google Scholar] [CrossRef]
- Zheng, W.; Kuang, A.; Liu, Z.; Wang, X. Analysing the spatial structure of urban growth across the Yangtze River Middle reaches urban agglomeration in China using NPP-VIIRS night-time lights data. GeoJournal 2021, 86, 1–18. [Google Scholar] [CrossRef]
- Zhang, Z.; Wang, B.; Buyantuev, A.; He, X.; Gao, W.; Wang, Y.; Wang, Y.; Yang, D.; Yang, Z. Urban agglomeration of Kunming and Yuxi cities in Yunnan, China: The relative importance of government policy drivers and environmental constraints. Landsc. Ecol. 2019, 34, 663–679. [Google Scholar] [CrossRef]


| Data | Spatial | Data Sources | Date |
|---|---|---|---|
| Luojia-01 | 130 × 130 m | http://59.175.109.173:8888/index.html | 2018.10–2019.03 |
| POI Density | 100 × 100 m | www.amap.com | 2020.12 |
| Tencent Migration | 30 × 30 m | www.amap.com | 2020.01–2020.12 |
| Population Distribution PRD Overal lPlanning | 100 × 100 m PRD | http://www.geodata.cn/ http://www.scio.gov.cn/ztk/xwfb/52/9/Document/1057059/1057059.htm | 2020.12 2020.12 |
| Main Centers (km²) | Area/% | Number of Main Menters | Subcenters (km²) | Area/% | Number of Subcenters | |
|---|---|---|---|---|---|---|
| NTL | 1118.14 | 2.65% | 2 | 686.29 | 1.63% | 10 |
| NP | 1913.36 | 4.53% | 2 | 1001.73 | 2.37% | 11 |
| NPT | 3078.19 | 7.29% | 3 | 935.48 | 2.22% | 11 |
| Data | Relative Threshold | LMI+GWR | ||
|---|---|---|---|---|
| OA | Kappa | OA | Kappa | |
| NTL | 16.38% | 0.018 | 79.33% | 0.6264 |
| NP | 18.48% | 0.033 | 88.17% | 0.7911 |
| NPT | 19.72% | 0.037 | 92.48% | 0.8871 |
Publisher’s Note: MDPI stays neutral with regard to jurisdictional claims in published maps and institutional affiliations. |
© 2021 by the authors. Licensee MDPI, Basel, Switzerland. This article is an open access article distributed under the terms and conditions of the Creative Commons Attribution (CC BY) license (https://creativecommons.org/licenses/by/4.0/).
Share and Cite
He, X.; Cao, Y.; Zhou, C. Evaluation of Polycentric Spatial Structure in the Urban Agglomeration of the Pearl River Delta (PRD) Based on Multi-Source Big Data Fusion. Remote Sens. 2021, 13, 3639. https://0-doi-org.brum.beds.ac.uk/10.3390/rs13183639
He X, Cao Y, Zhou C. Evaluation of Polycentric Spatial Structure in the Urban Agglomeration of the Pearl River Delta (PRD) Based on Multi-Source Big Data Fusion. Remote Sensing. 2021; 13(18):3639. https://0-doi-org.brum.beds.ac.uk/10.3390/rs13183639
Chicago/Turabian StyleHe, Xiong, Yongwang Cao, and Chunshan Zhou. 2021. "Evaluation of Polycentric Spatial Structure in the Urban Agglomeration of the Pearl River Delta (PRD) Based on Multi-Source Big Data Fusion" Remote Sensing 13, no. 18: 3639. https://0-doi-org.brum.beds.ac.uk/10.3390/rs13183639