
An Investigation into Ground Movement on the Ventnor Landslide Complex, UK Using Persistent Scatterer Interferometry

 , ,
, ,  ,
,
Abstract
:
1. Introduction
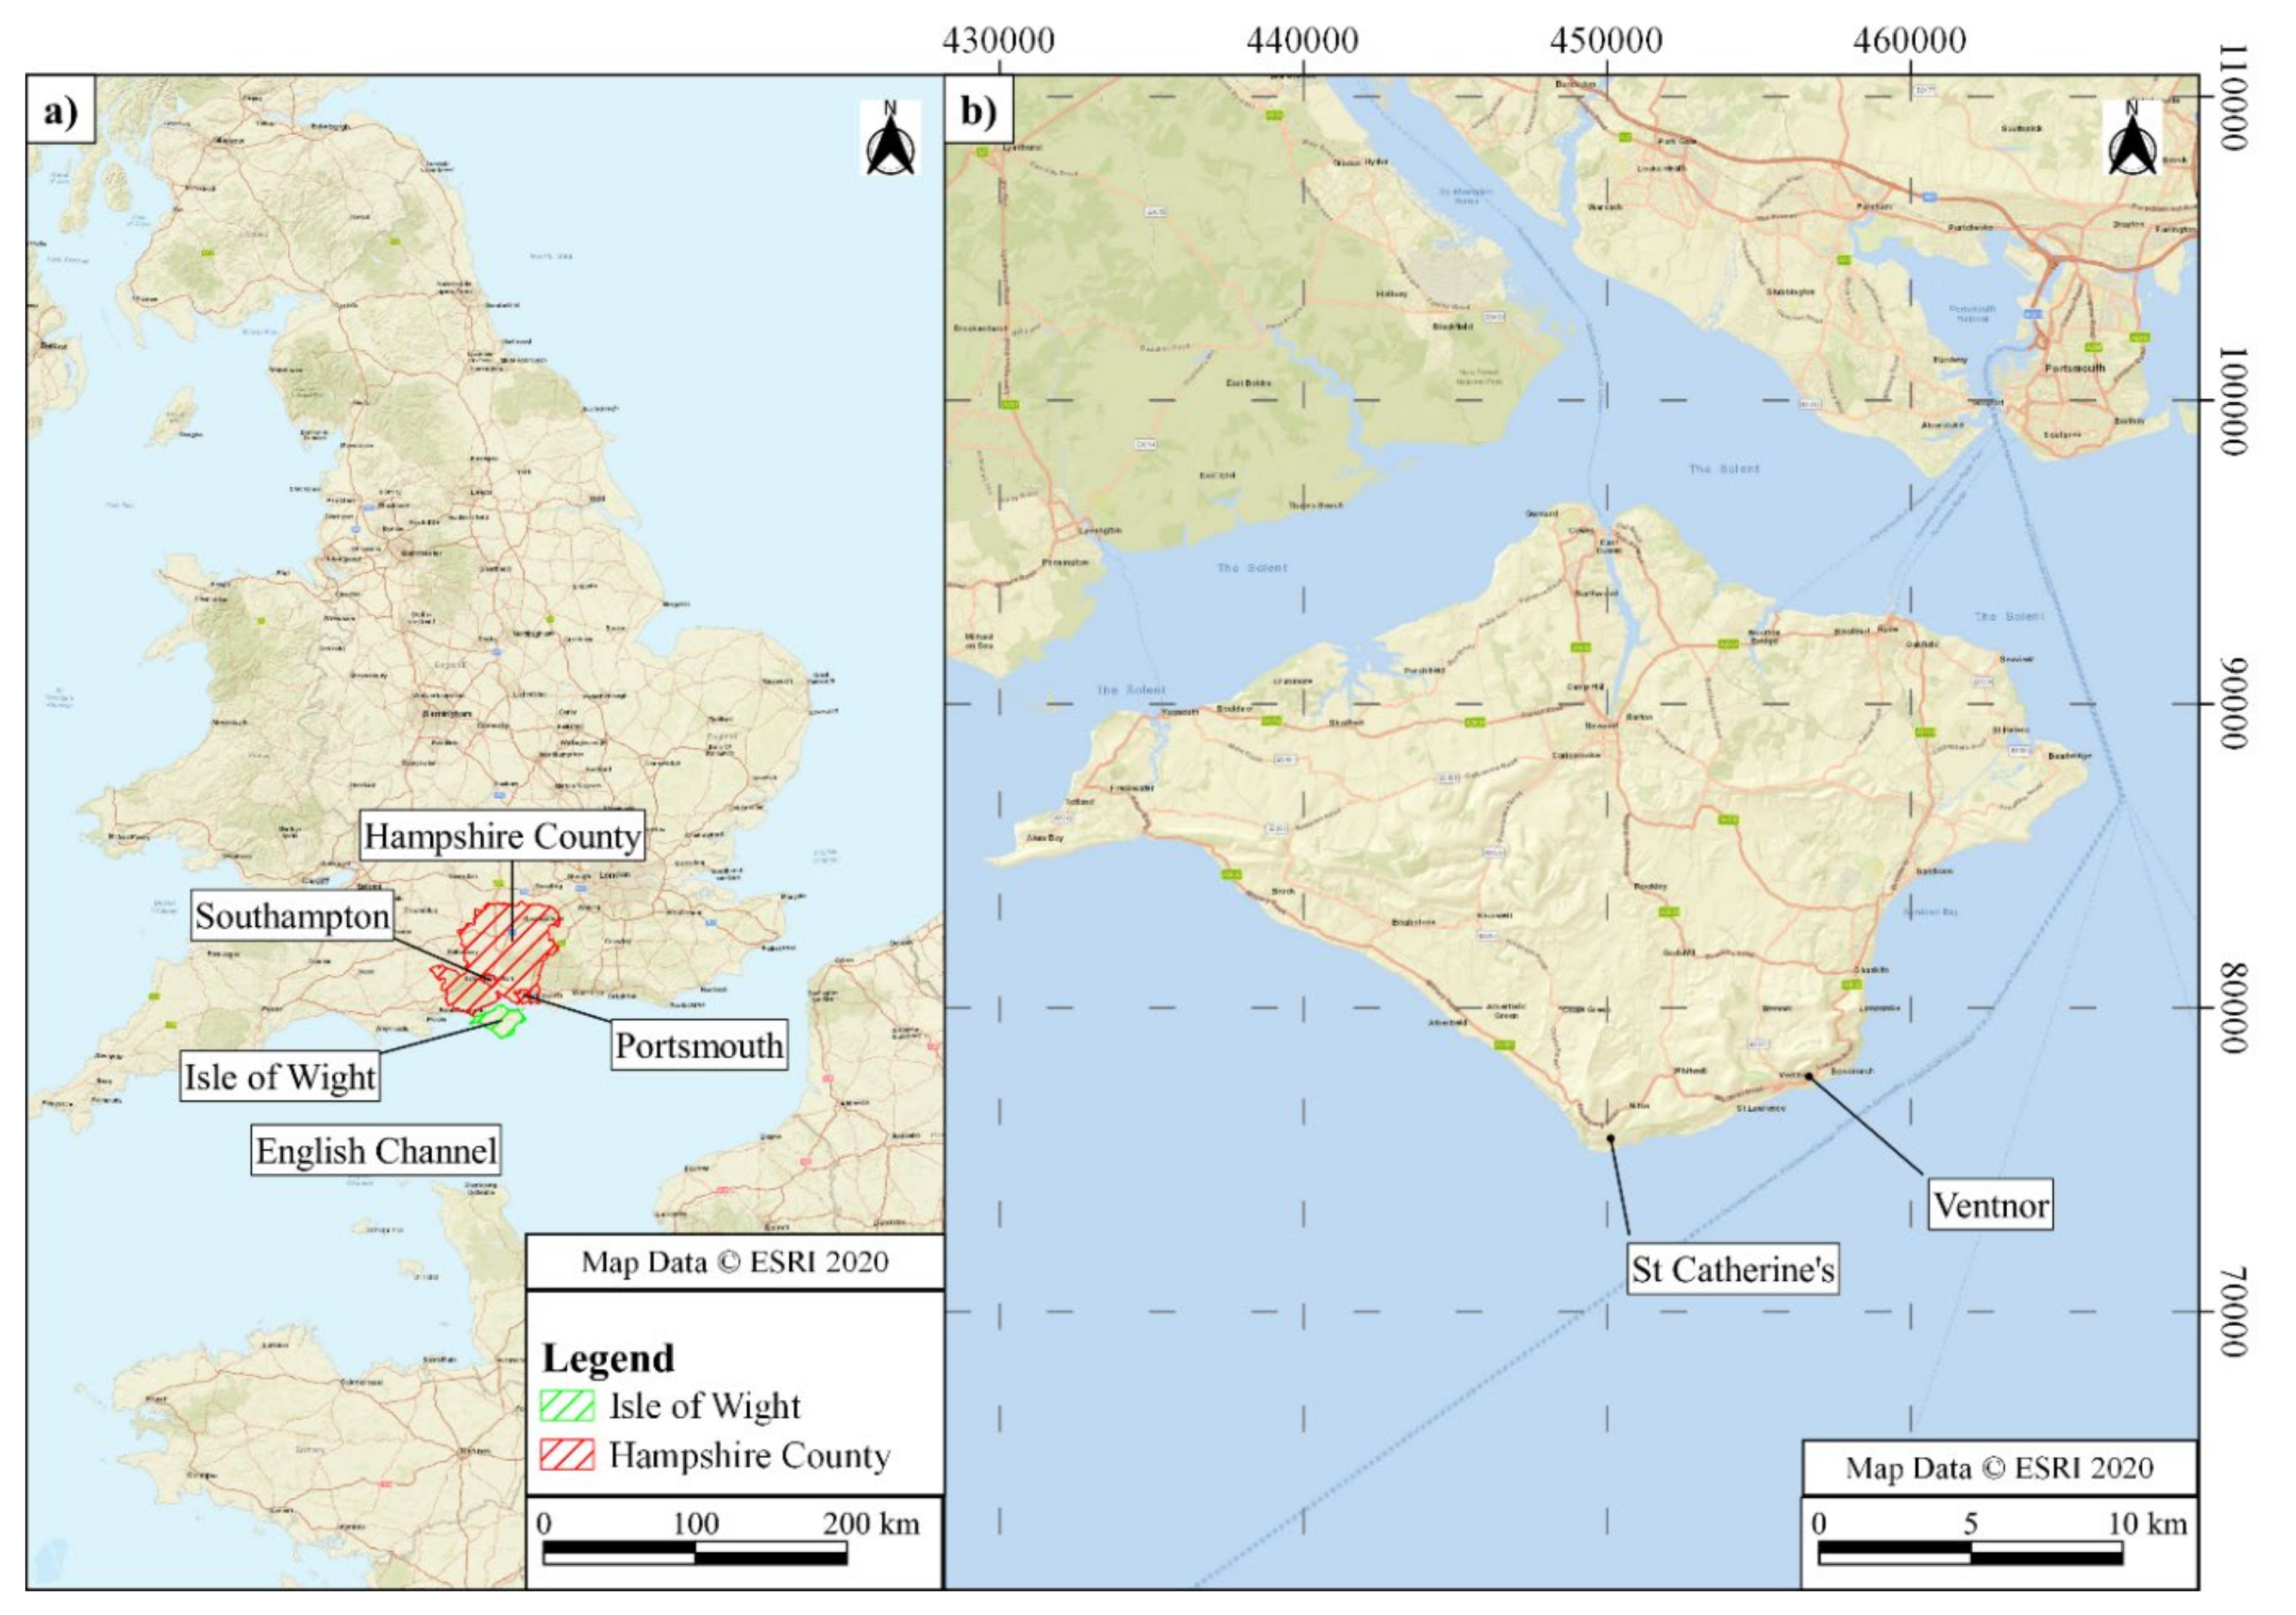
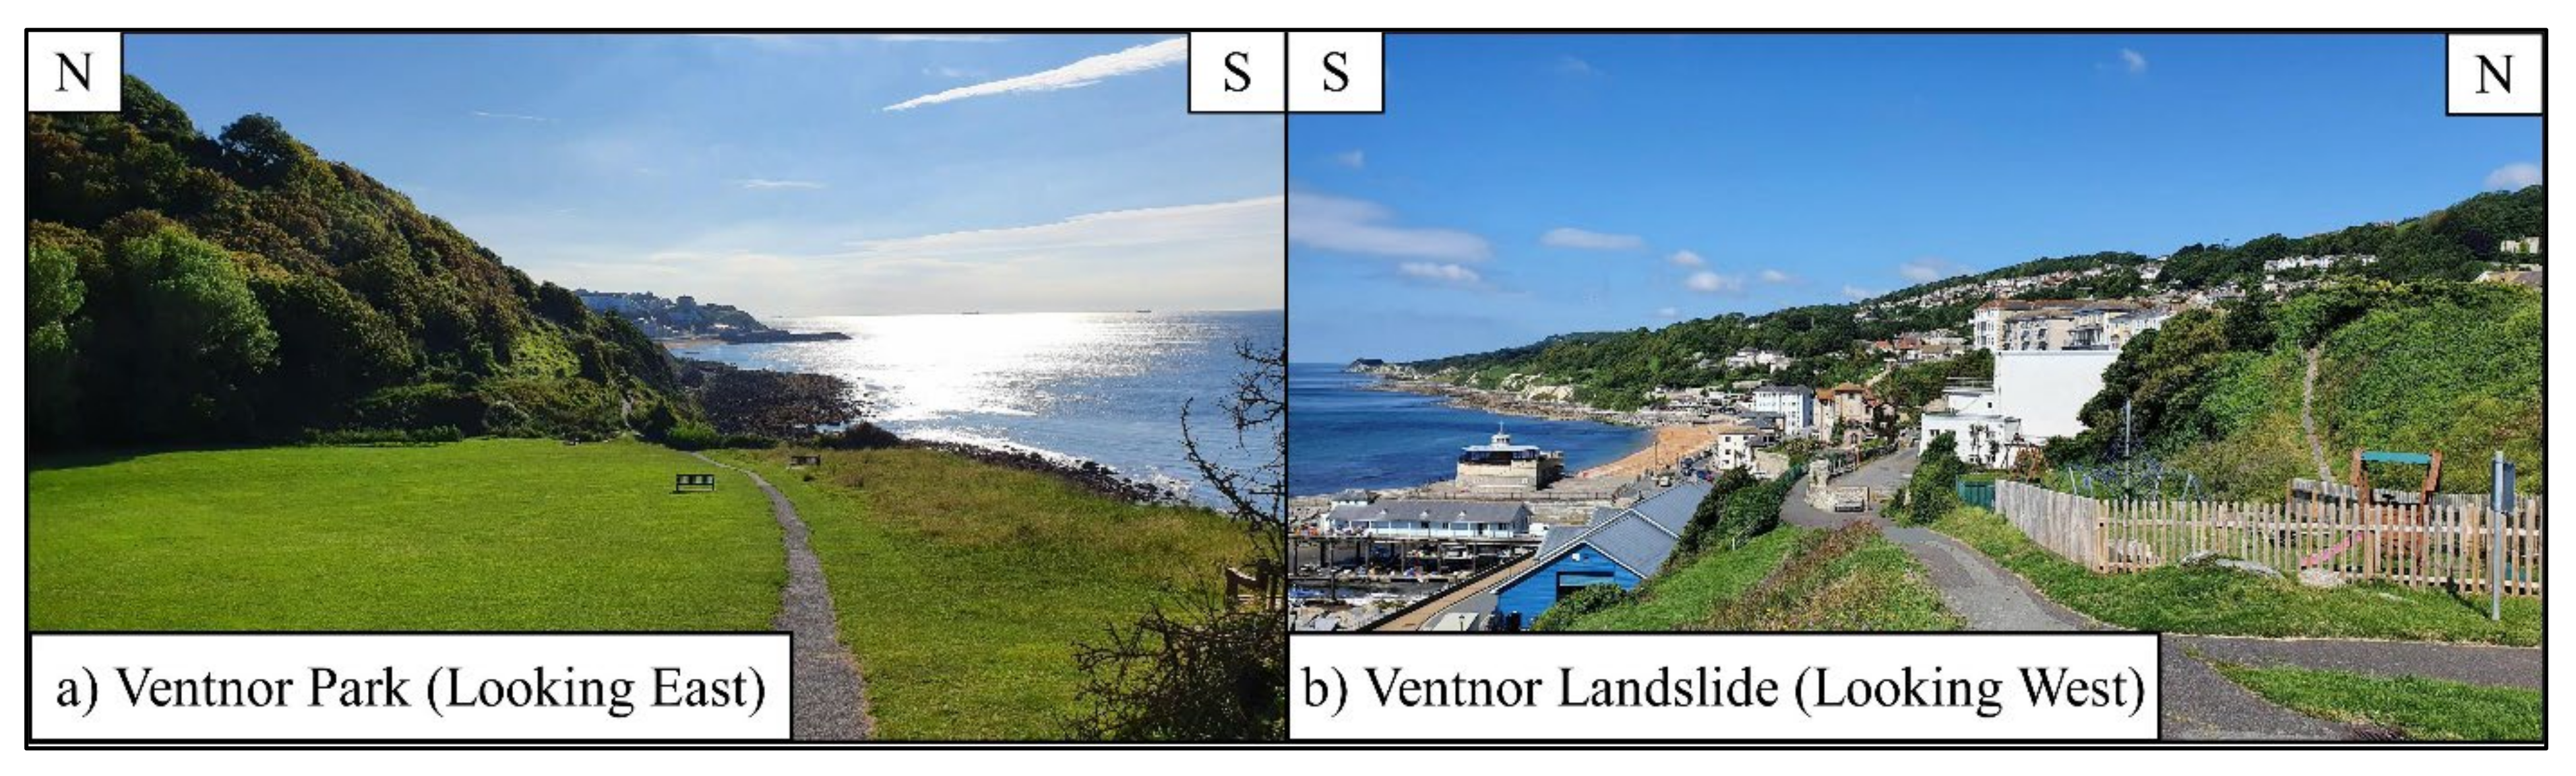
2. Study Region
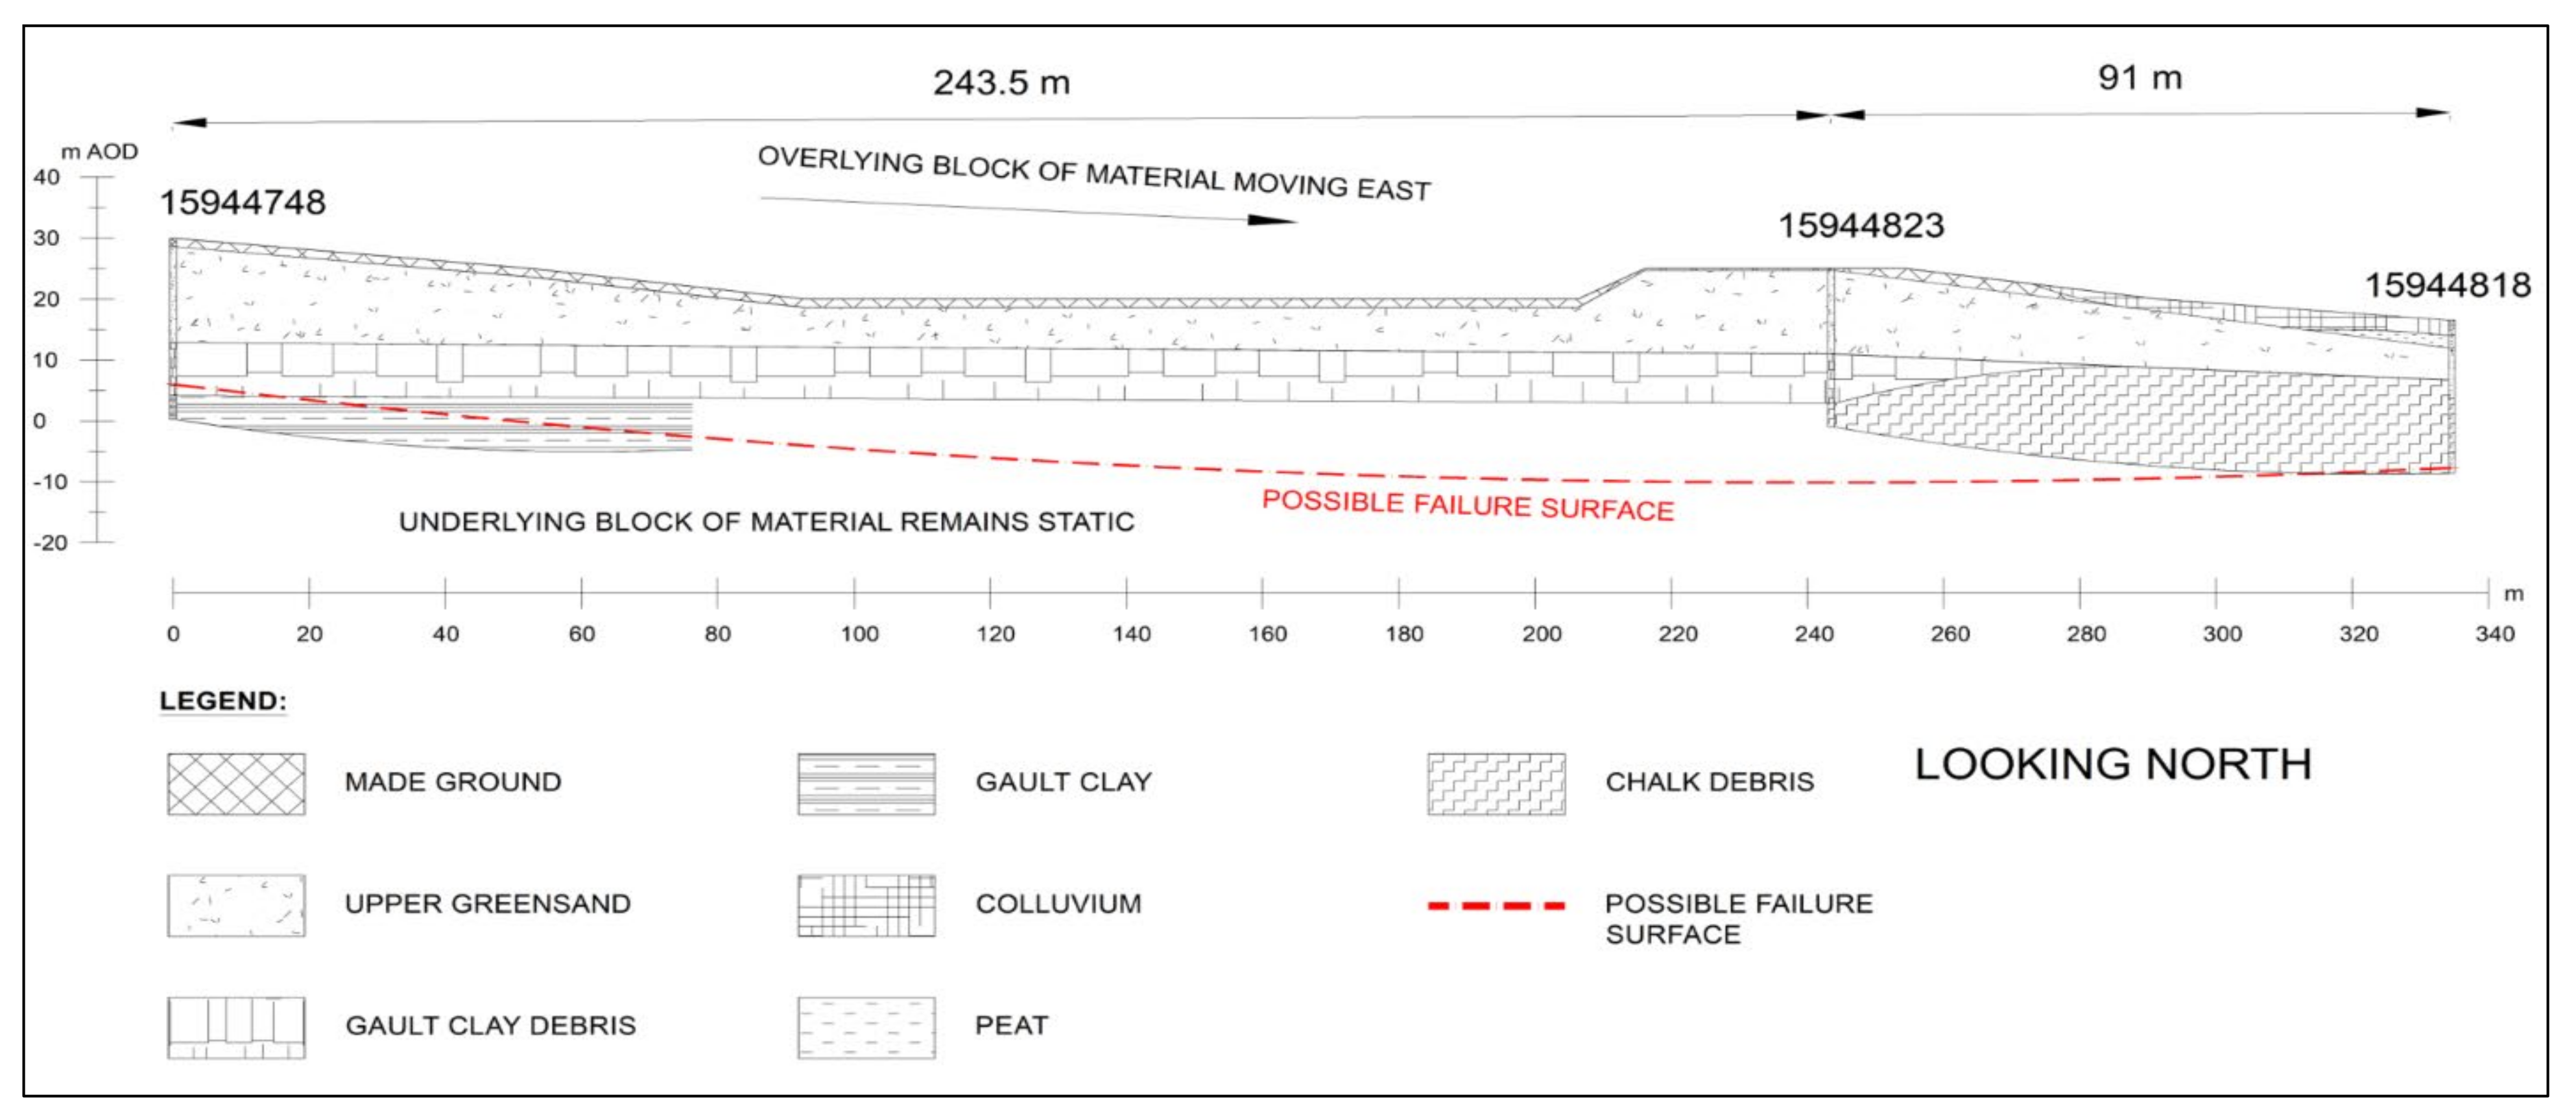
2.1. Overview and Bedrock Geology
- Gault formation—A mudstone containing laminae of fine-grained sand and silt, with some micaceous, shelly, phosphatic nodules.
- Upper Greensand formation—Generally described as fine-grained sand and sandstone, finely interbedded with glauconitic layers, resulting in weak to strong cementation. The beds can be split into upper beds, comprised of cherty sandstone, and lower beds described as the Passage Beds.
- Monk’s Bay Sandstone formation (Formerly known as Carstone)—A sandstone containing medium to coarse grains with some pebbly seams. Seams are ferruginous and micaceous.
- Sandrock formation—A weakly cemented sandstone comprised of medium-grained quartz sand. Thin, grey, micaceous mud laminae can be found mainly at the base.
- Grey Chalk debris—Grey Chalk formations encountered include Zig Zag Chalk and West Melbury Marly Chalk, characterized by their thin bedding, marly composition and off white to grey colour.
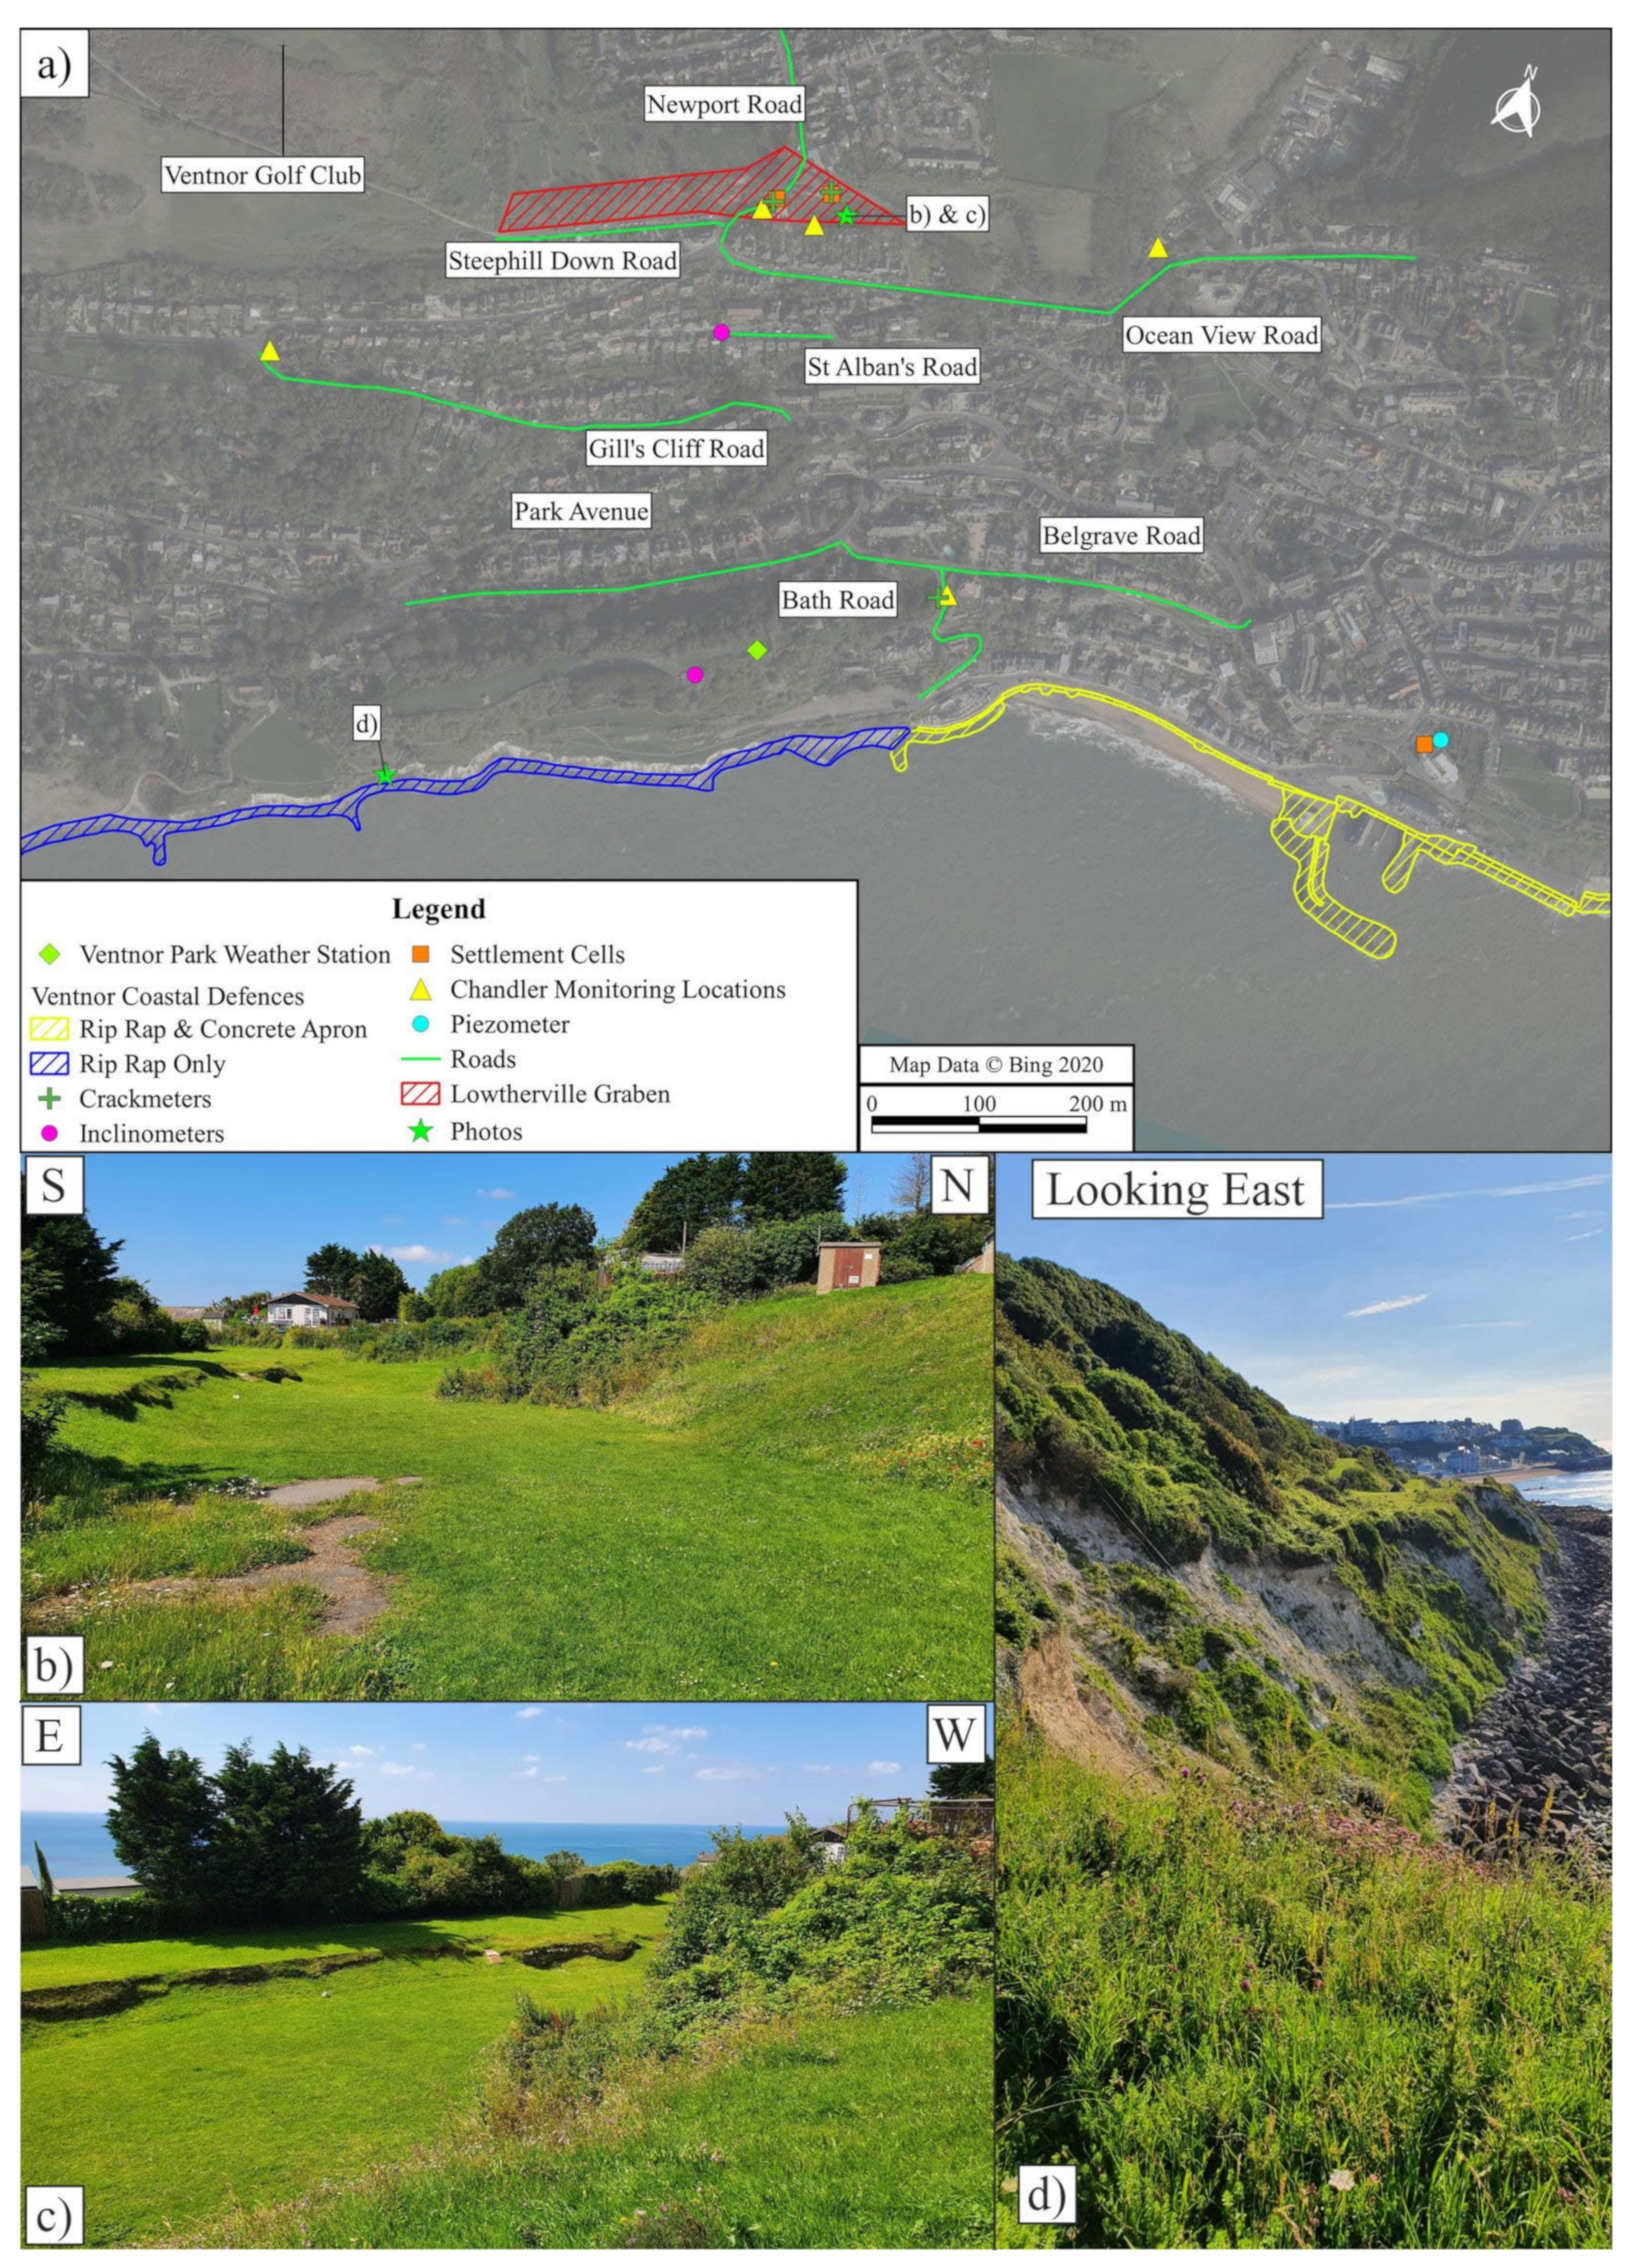
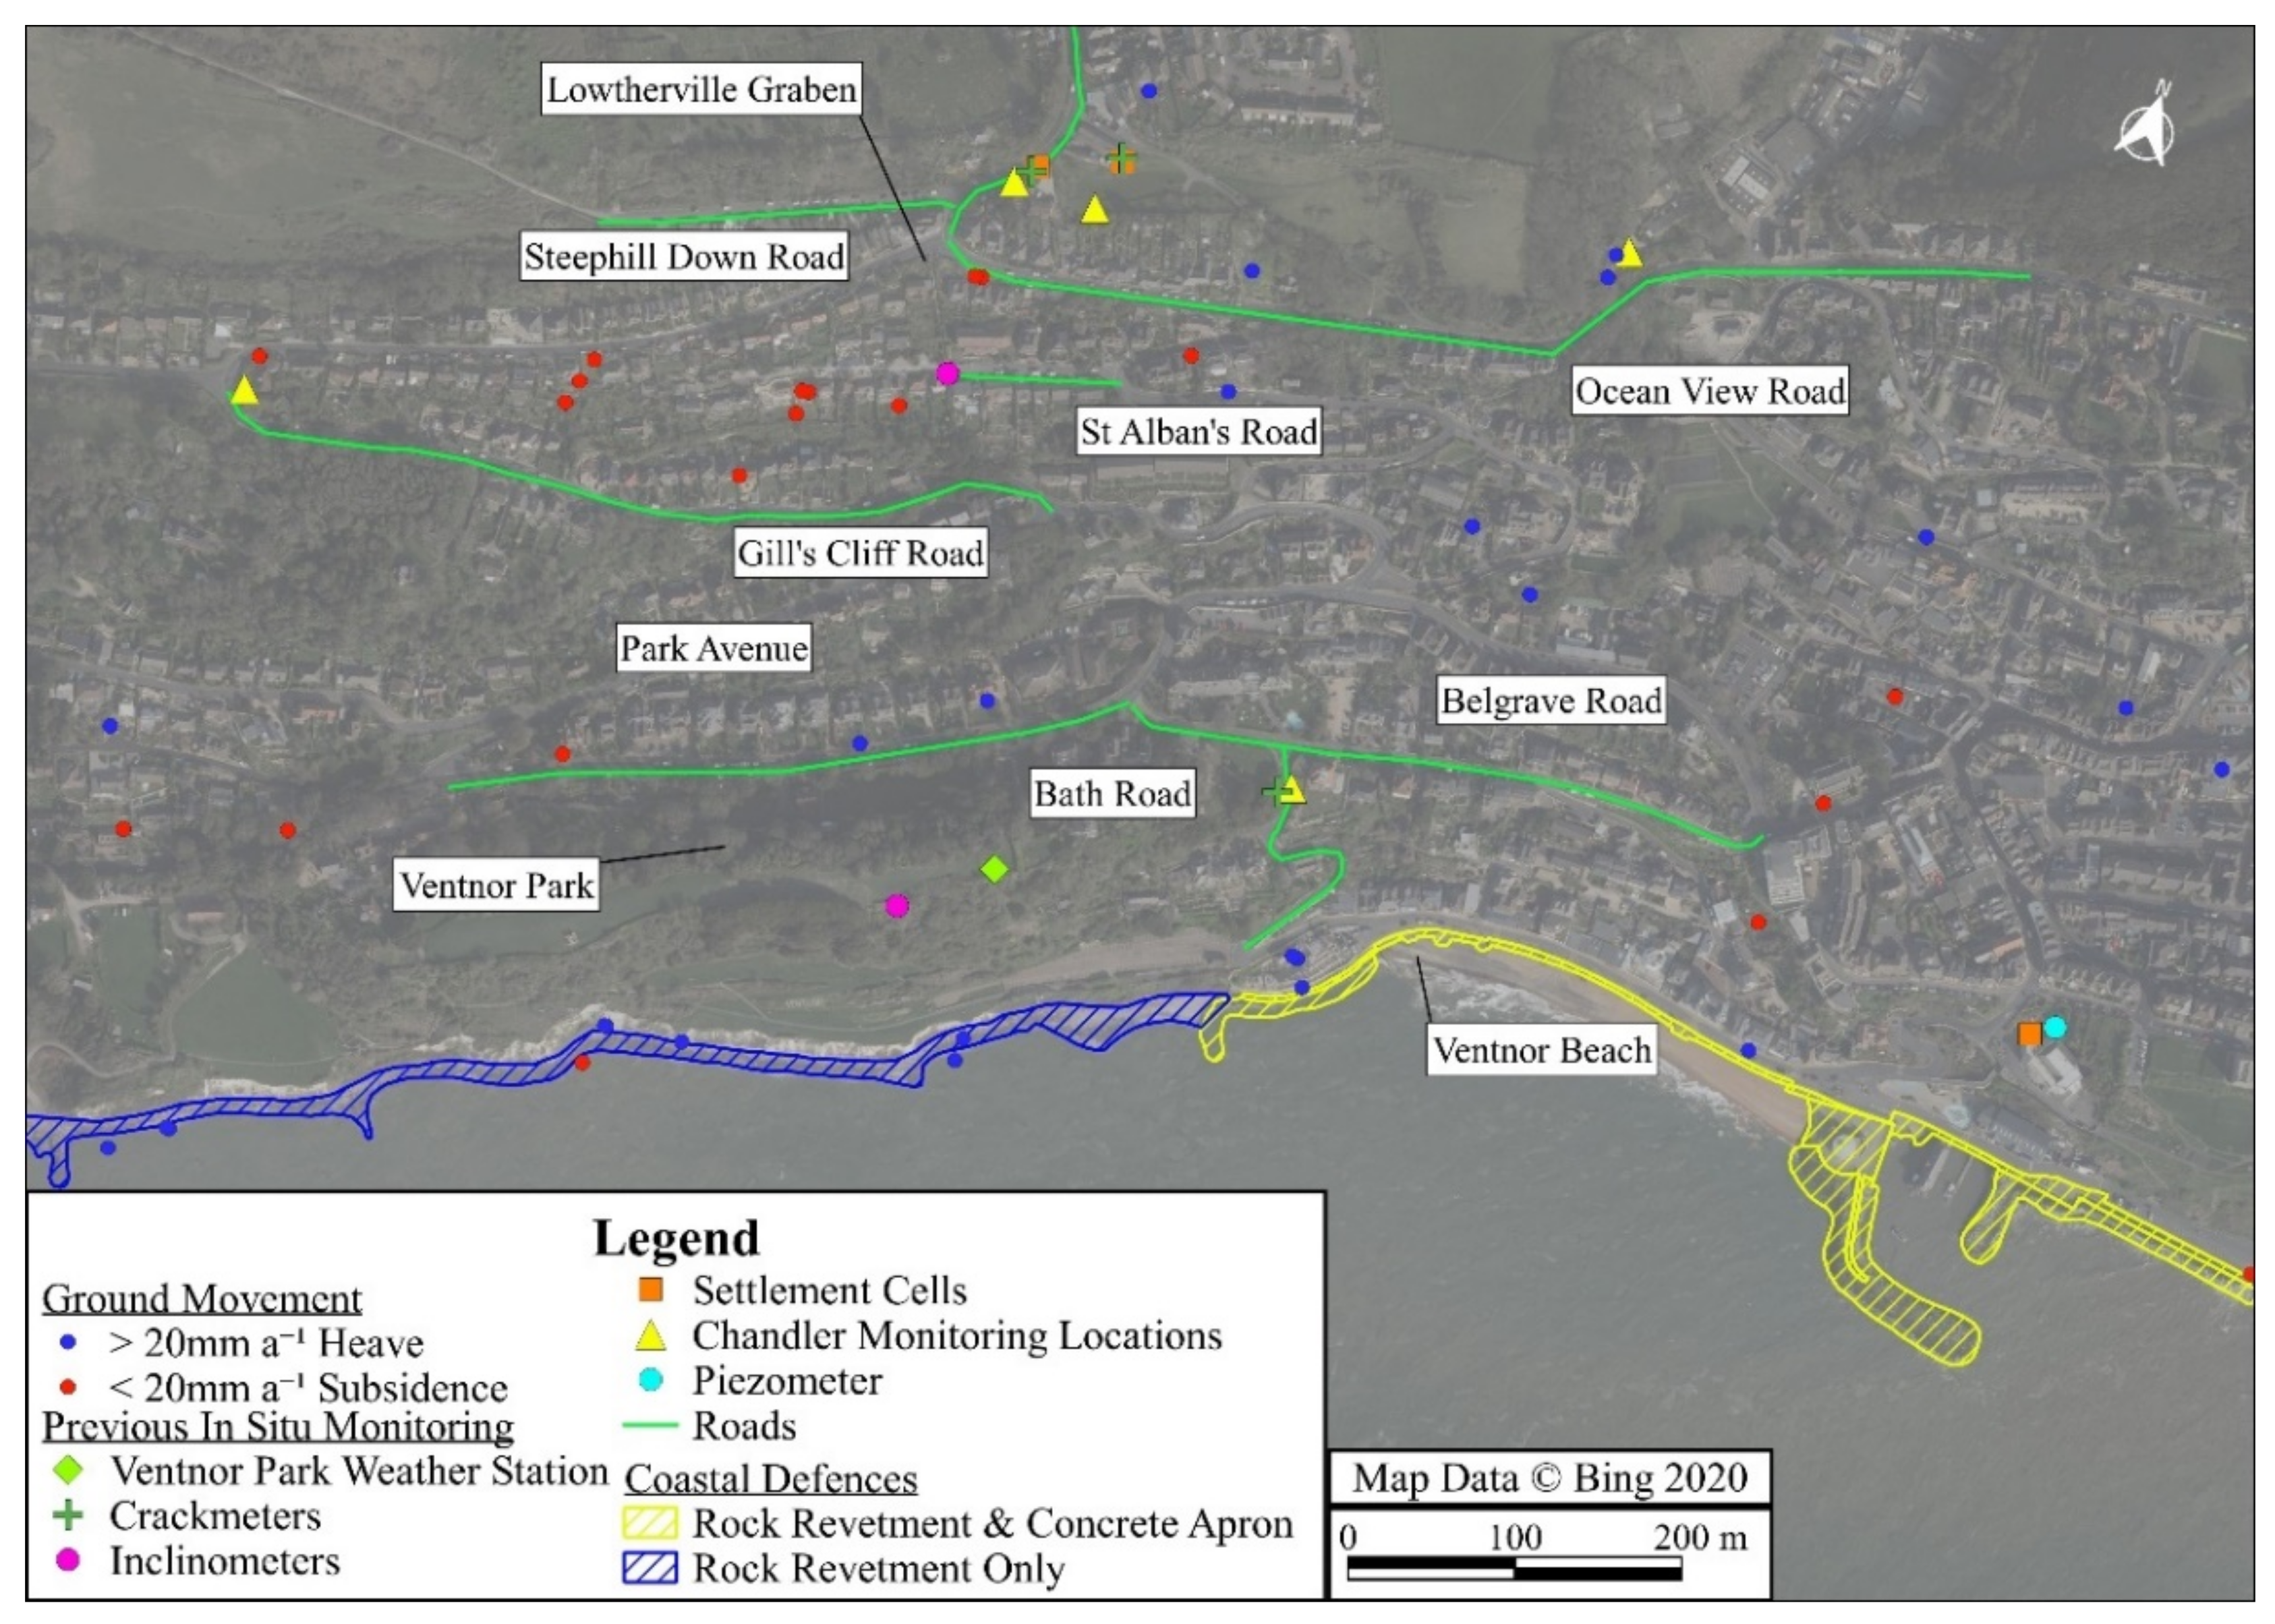
2.2. Historical Movement and Previous Monitoring Surveys at Ventnor
3. Methods
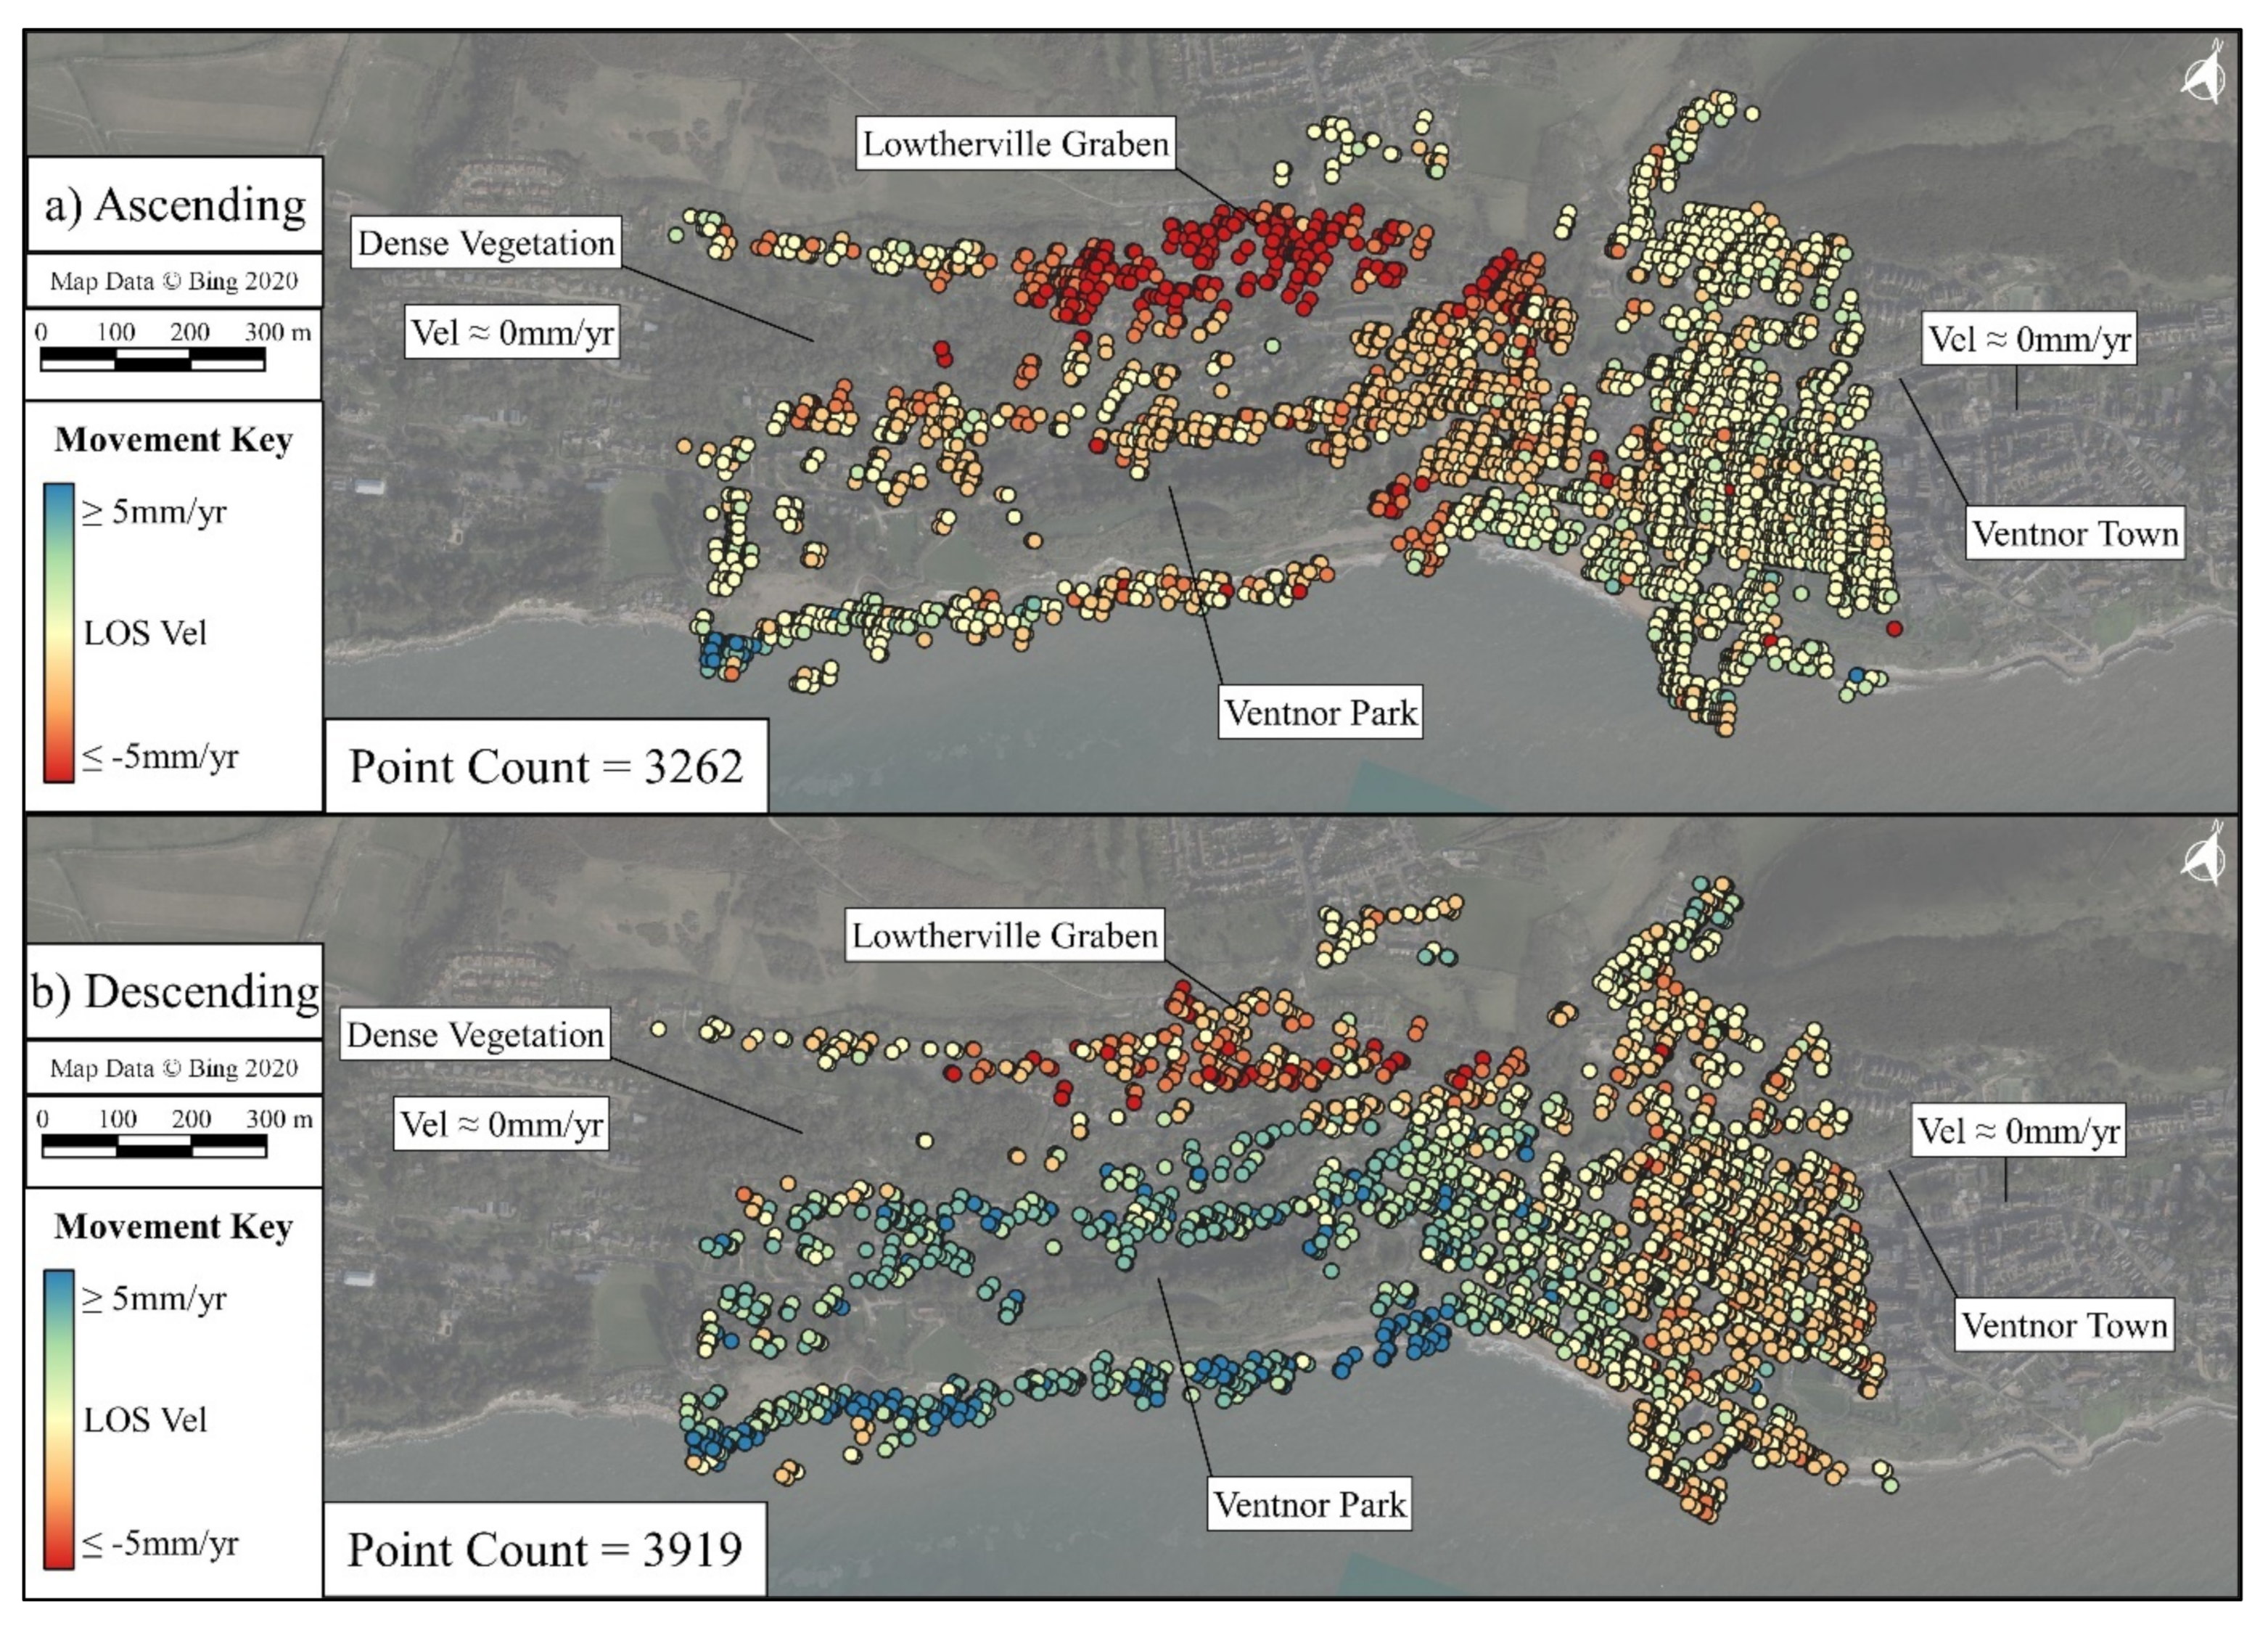
3.1. Sentinel-1 Data Processing
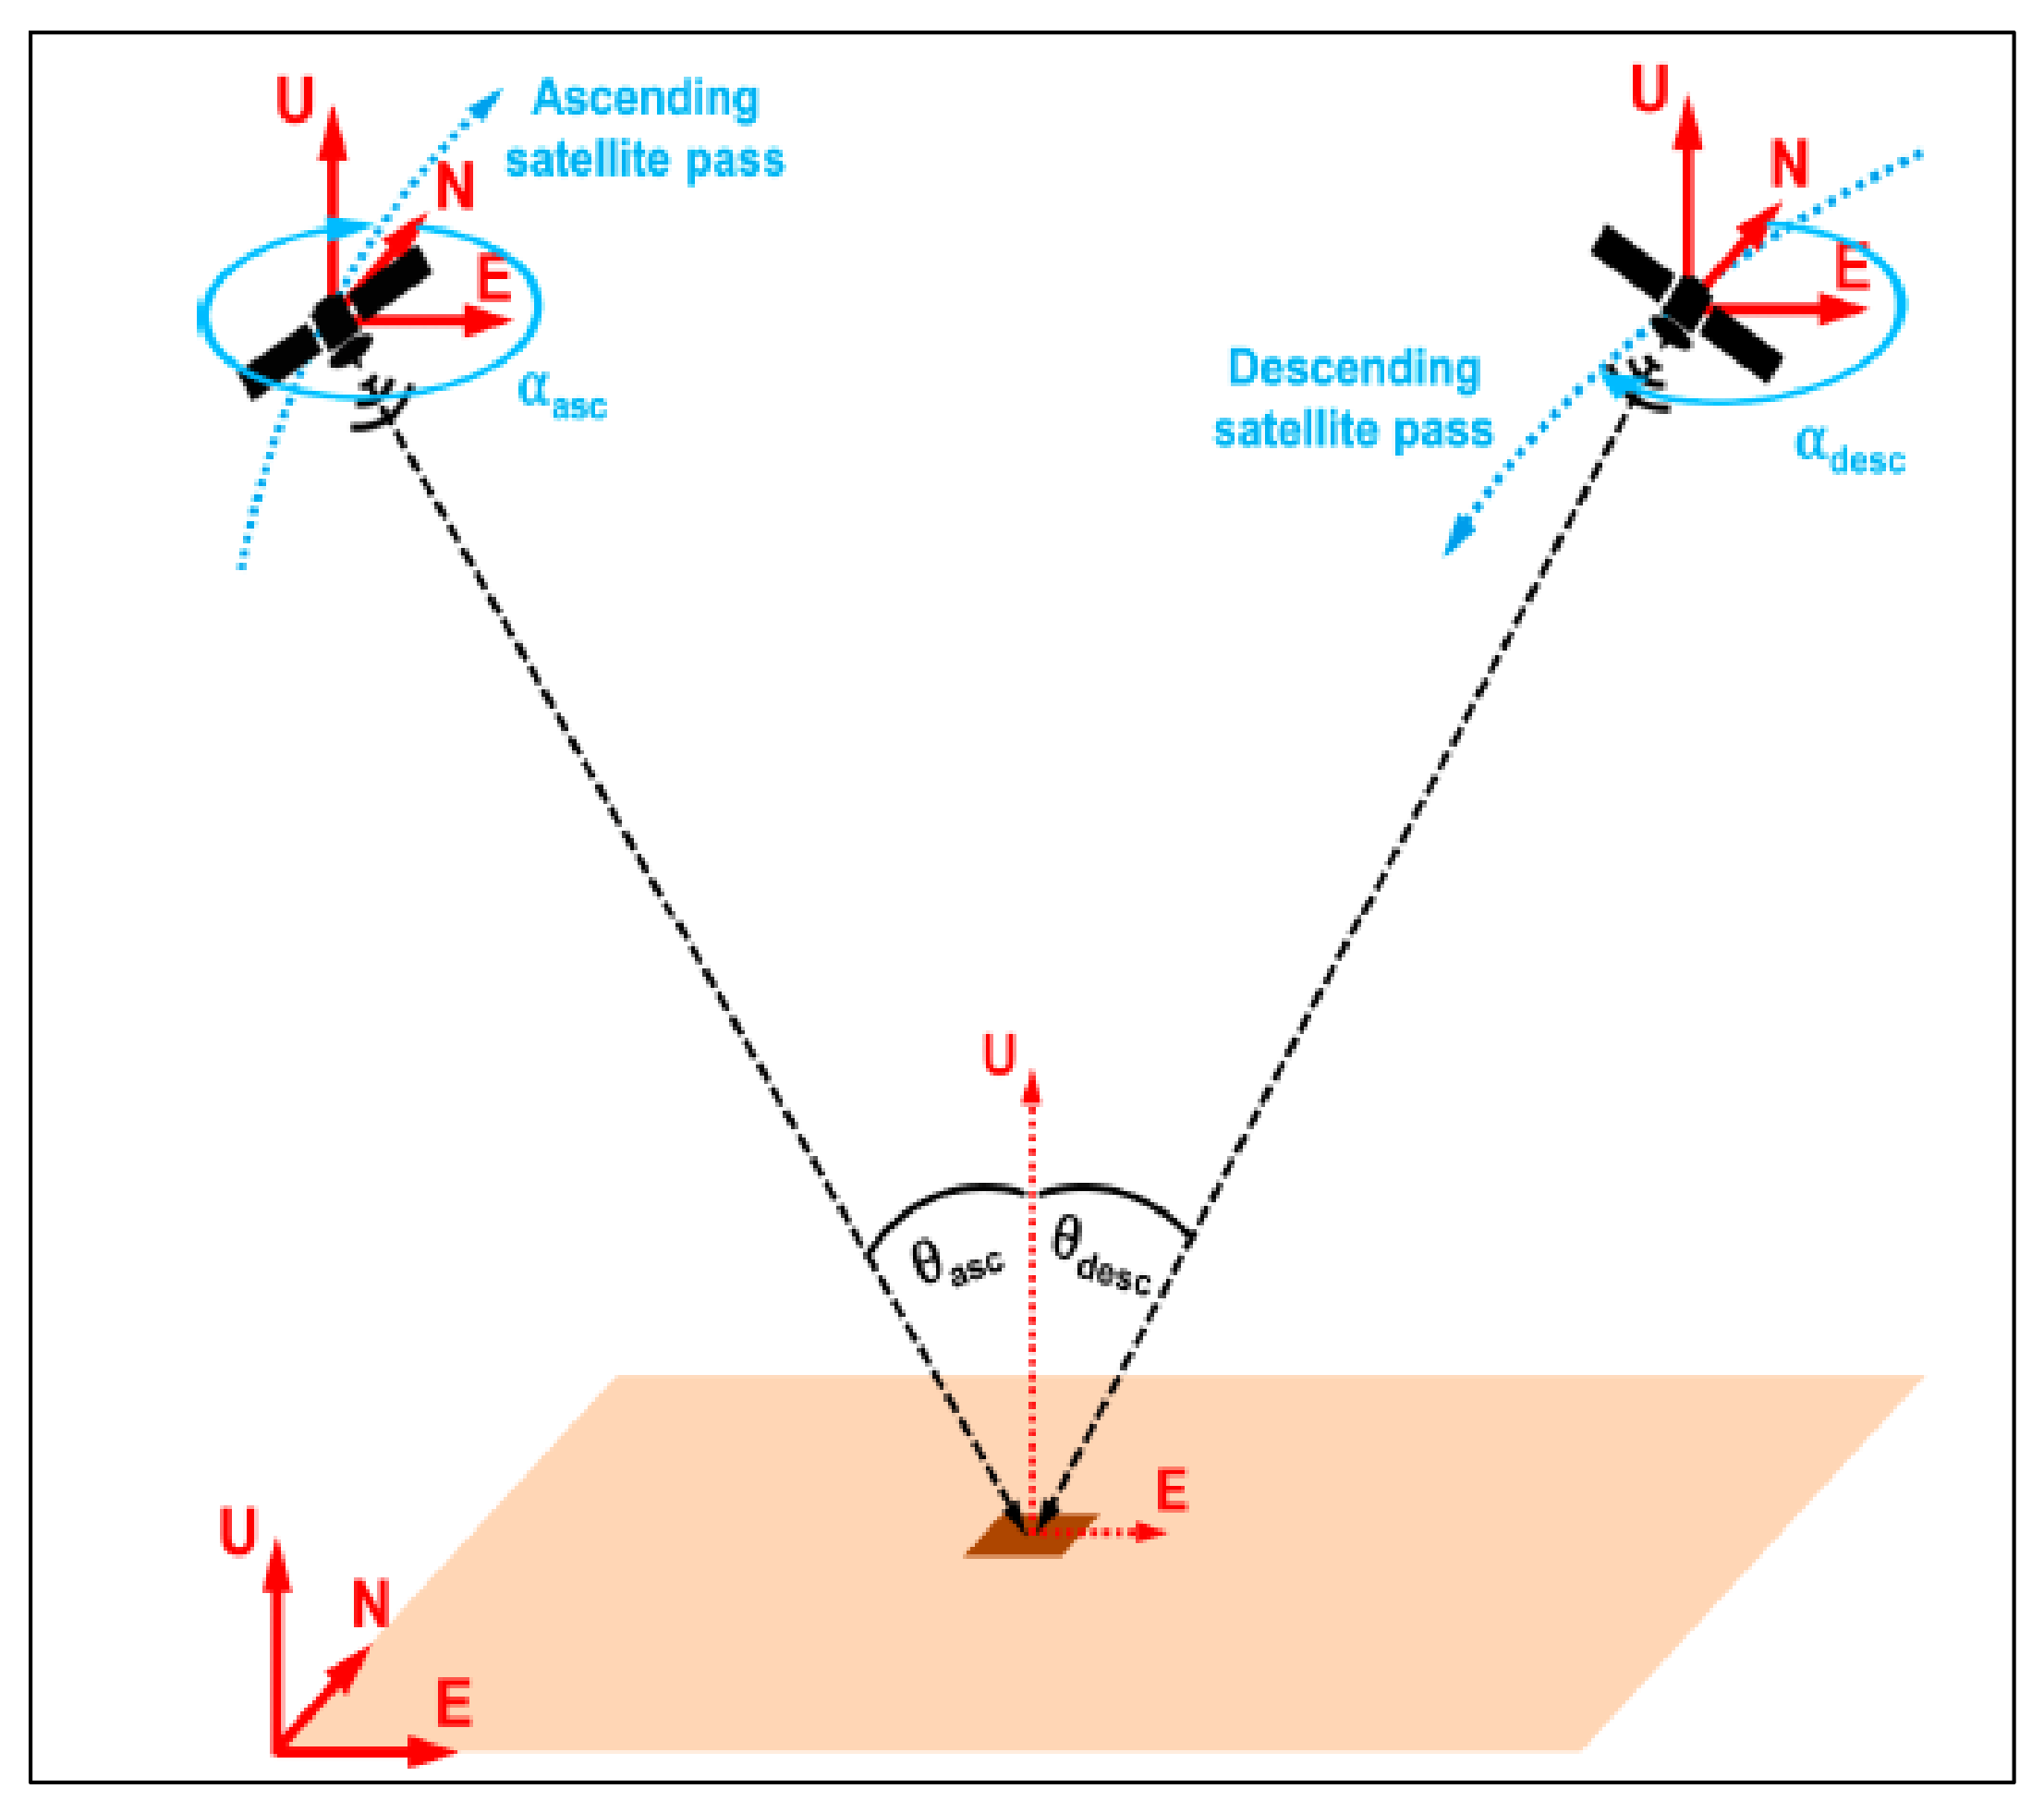
3.2. Obtaining Estimates of Vertical and Horizontal Velocity from InSAR


| Parameters | Direction (Value) | Colour |
|---|---|---|
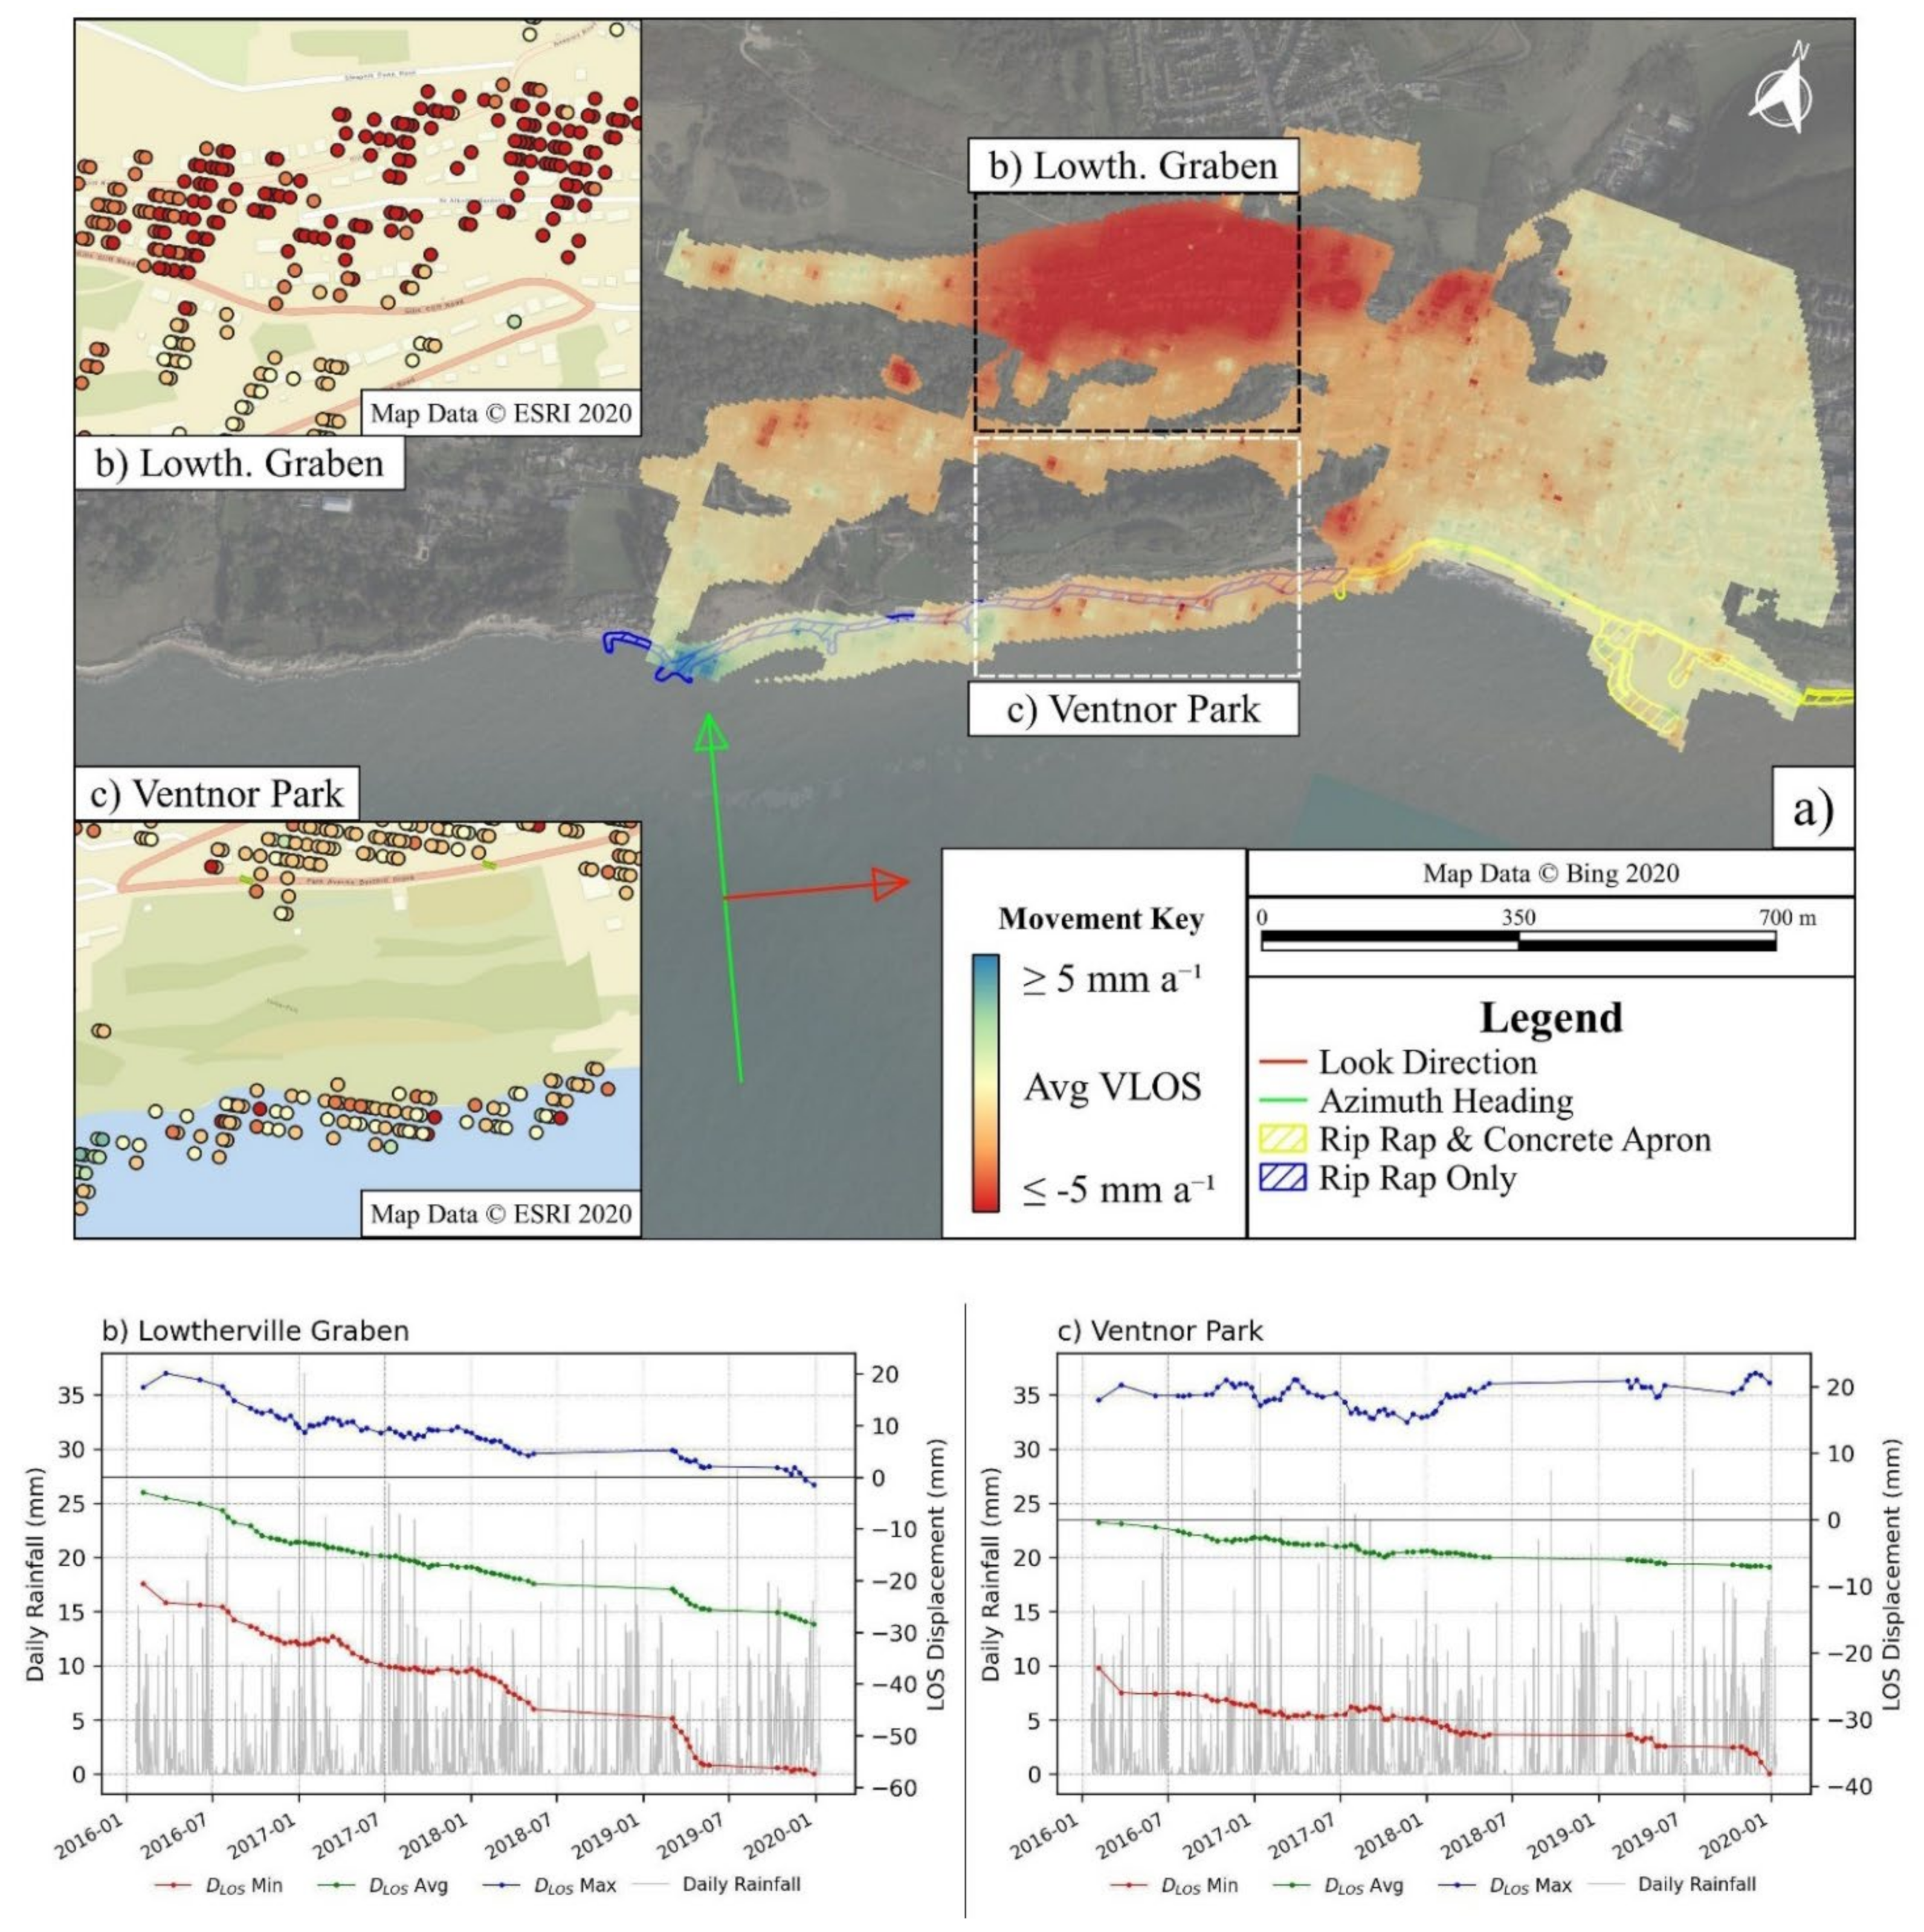
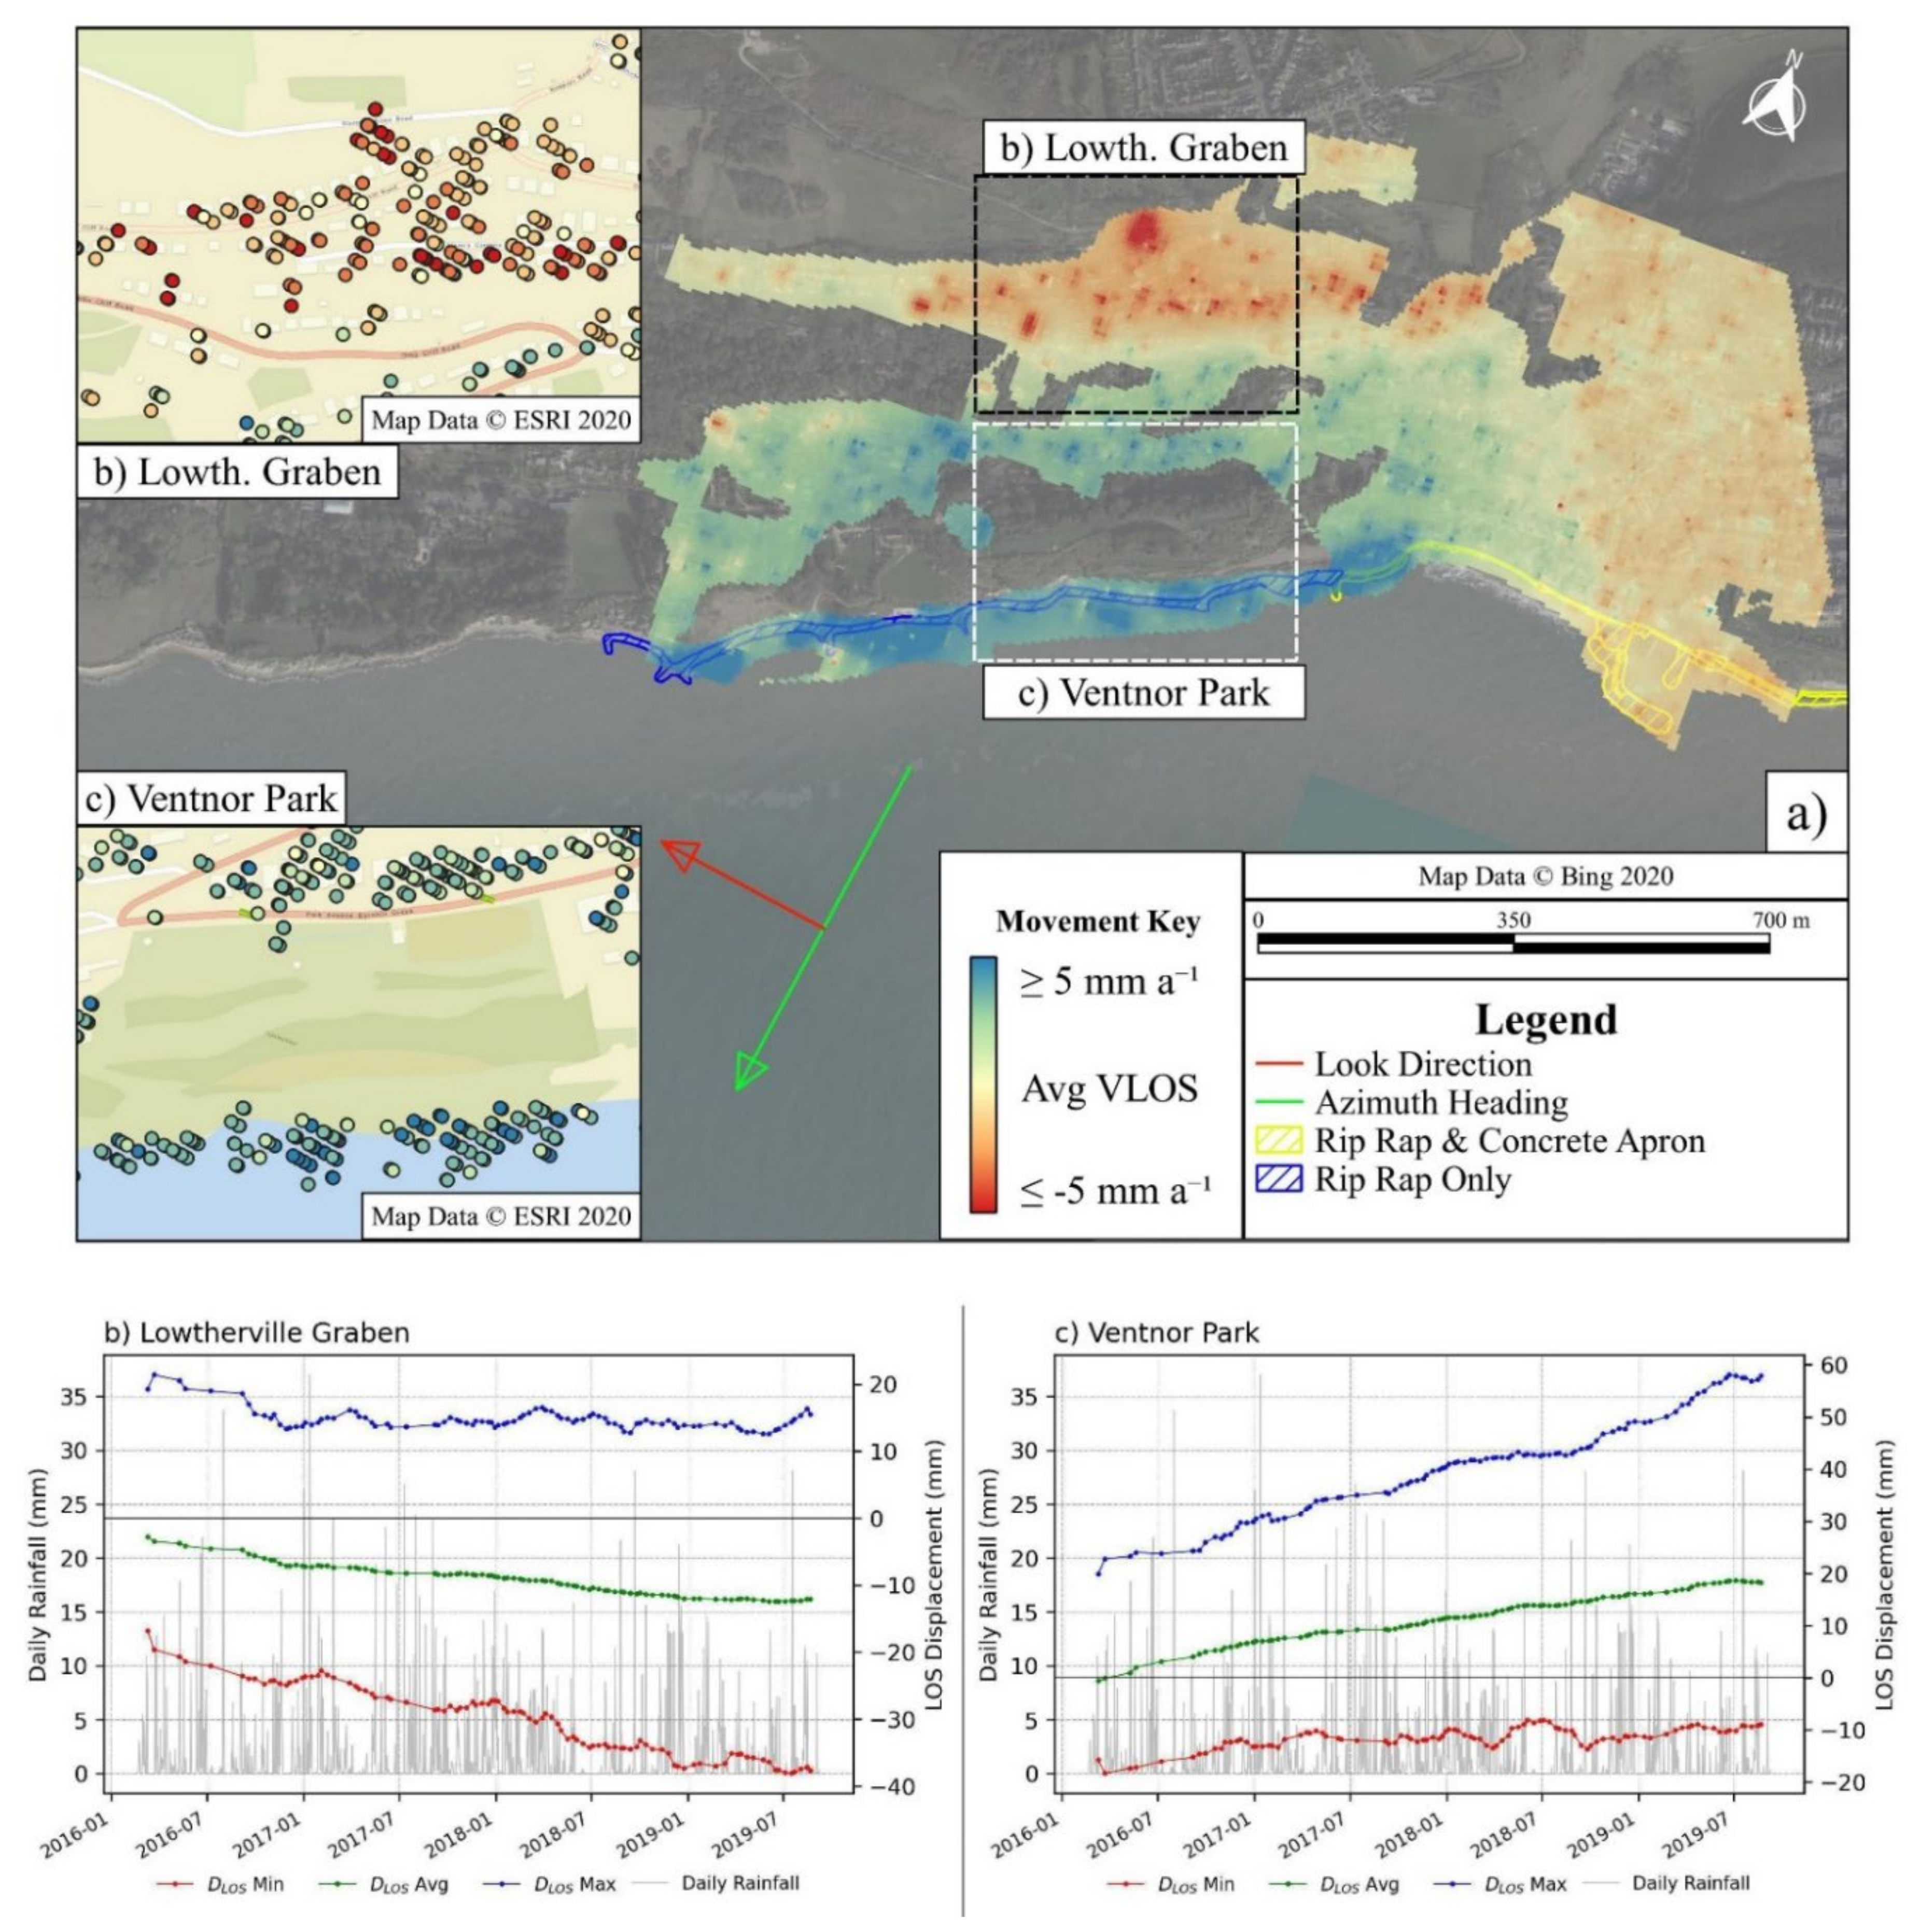
| VLOS and DLOS | Away from satellite (−ve) | Red |
| VLOS and DLOS | Towards satellite (+ve) | Blue |
| VU and VE | Toward origin (−ve) | Red |
| VU and VE | Away from origin (+ve) | Blue |
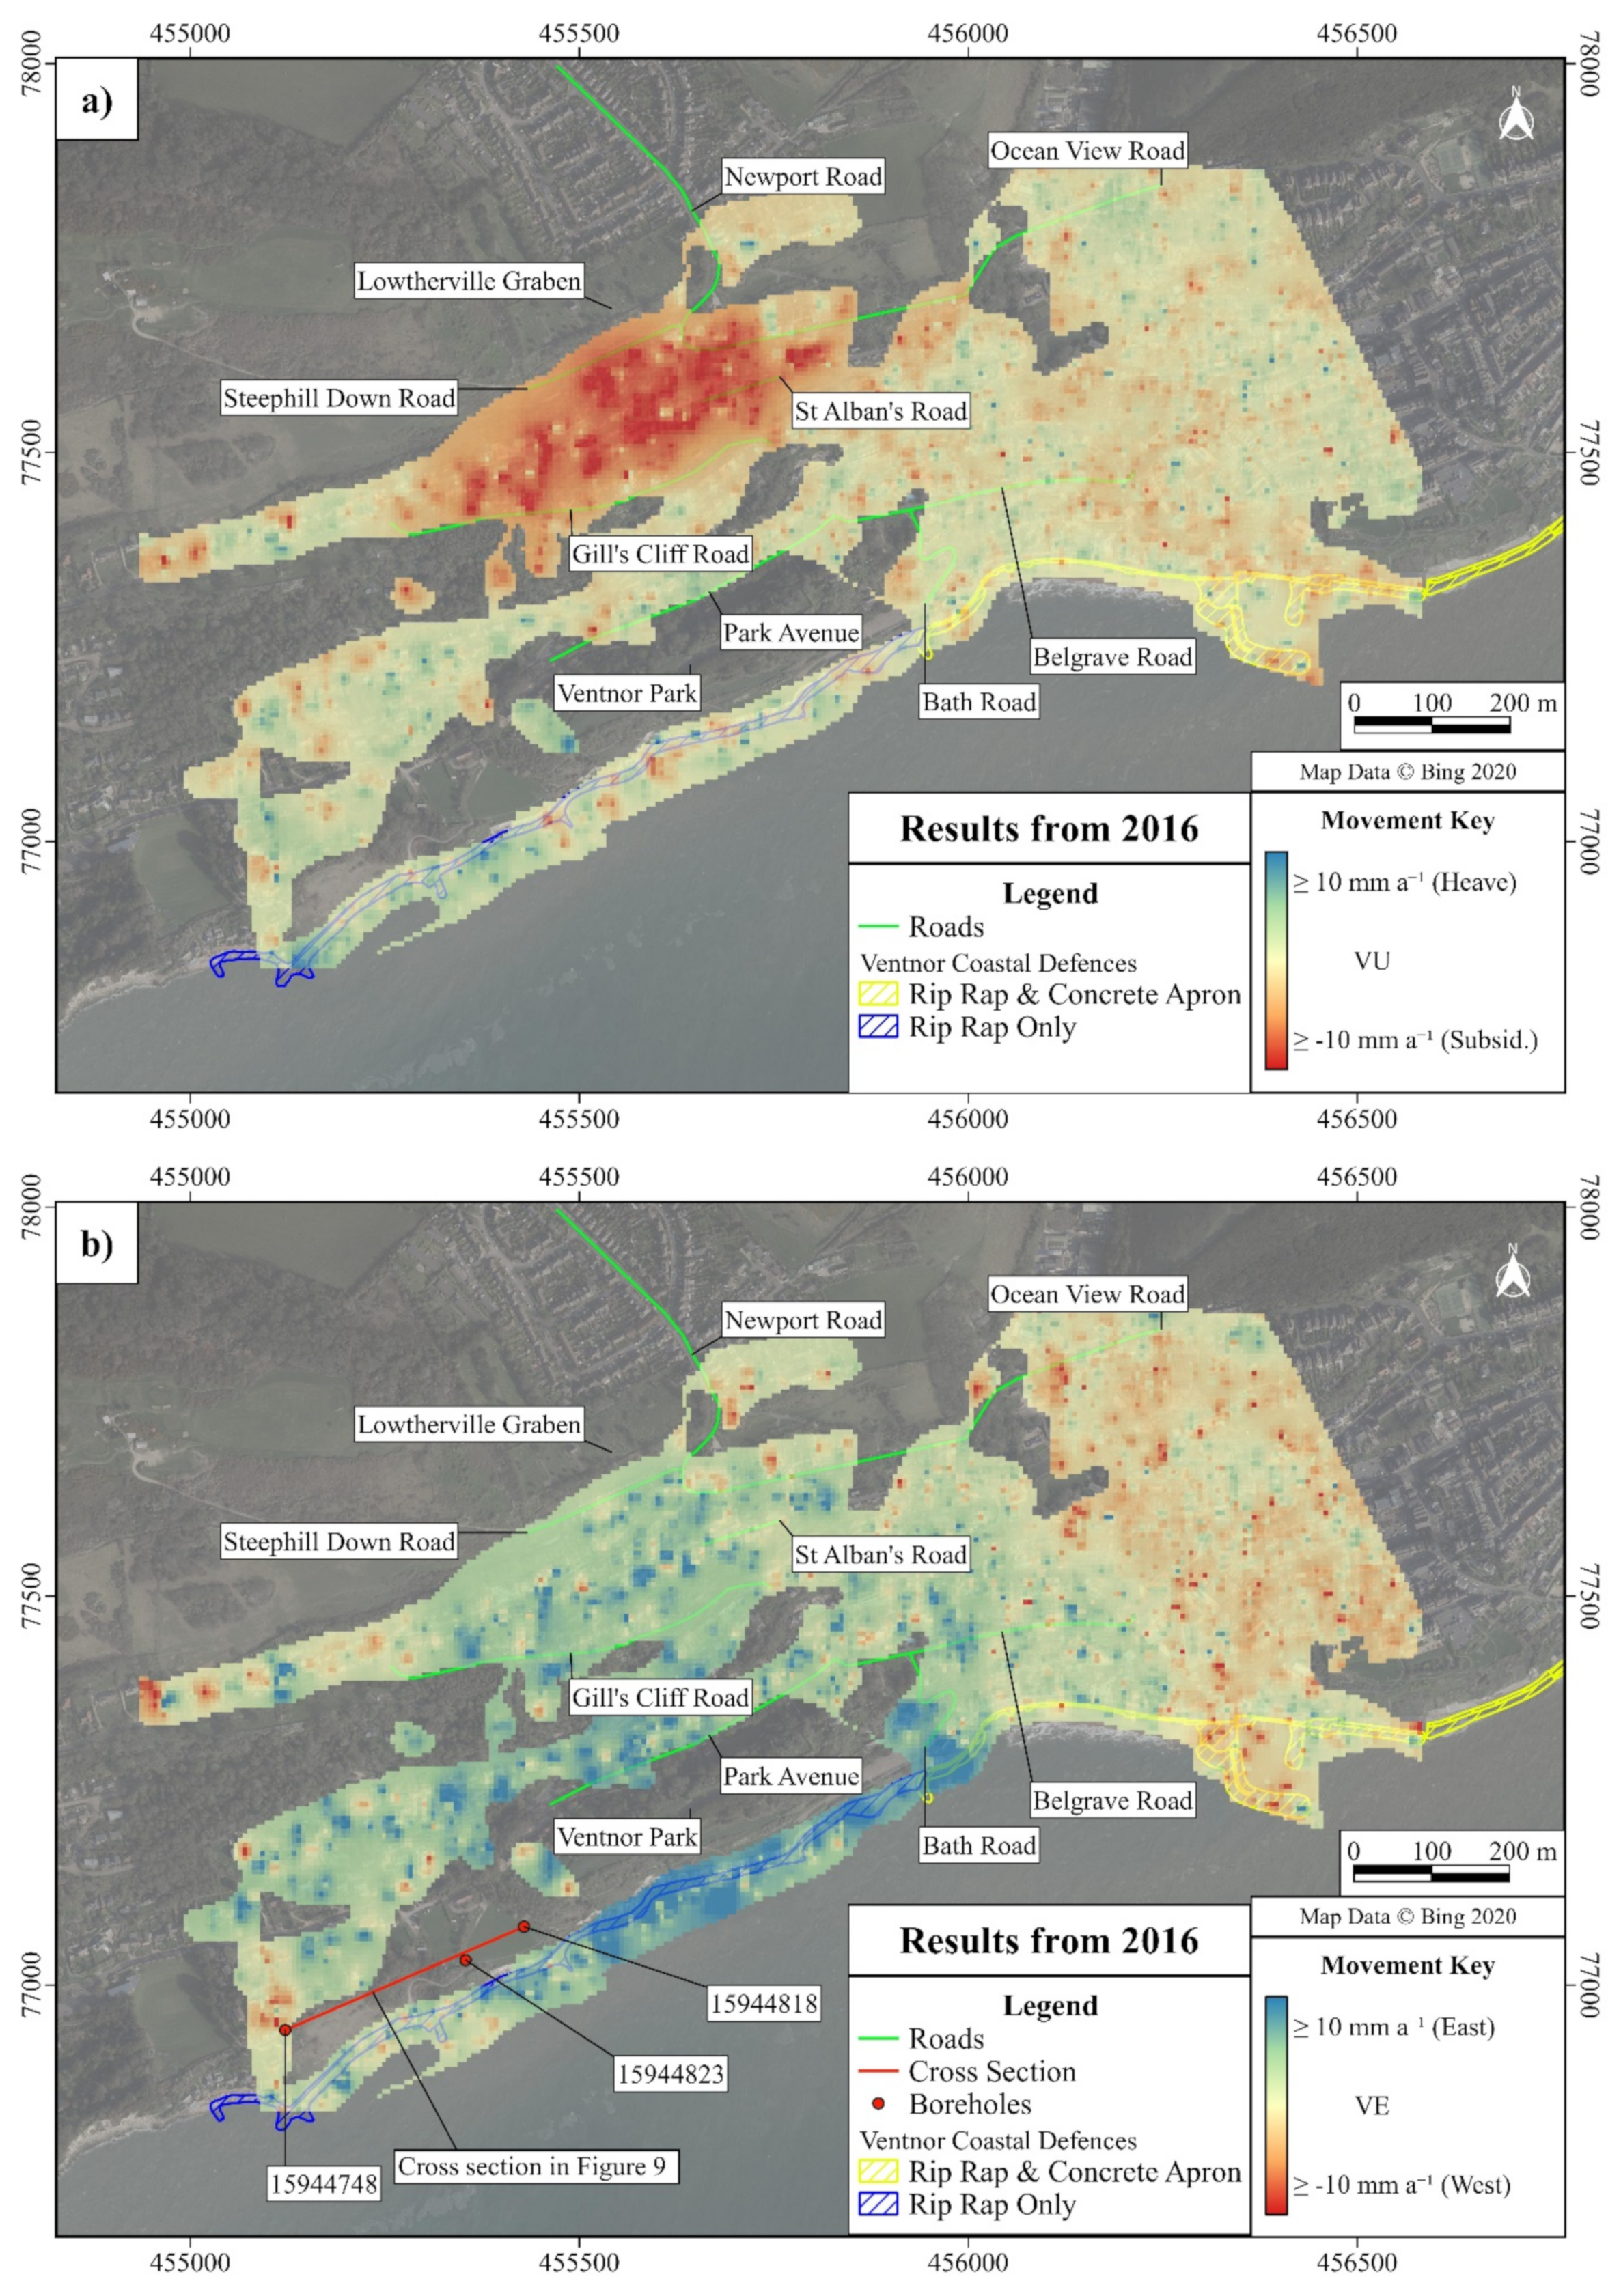
4. Results and Discussion
4.1. Results Verification
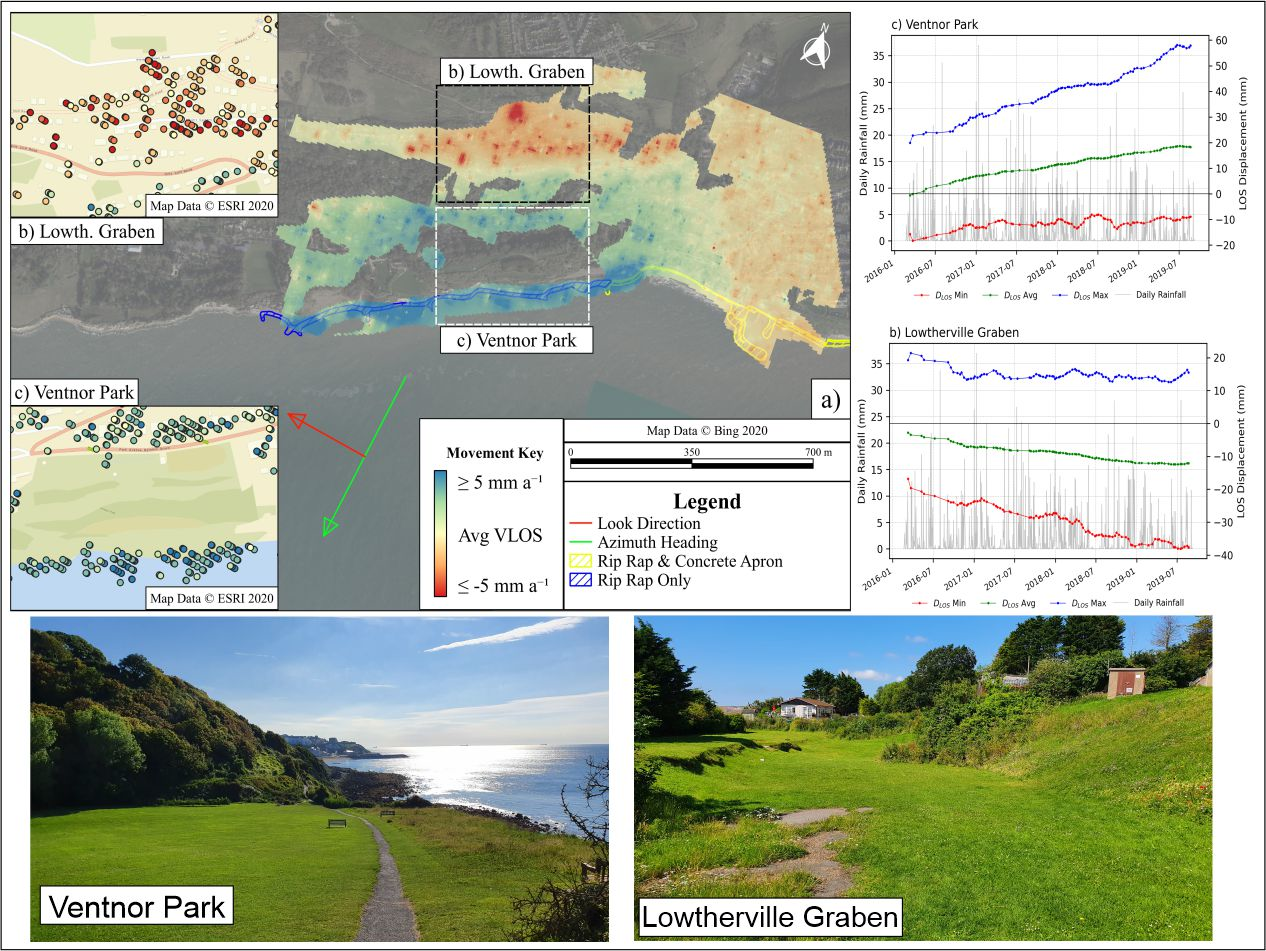
4.2. Full Time Series Analysis
5. Conclusions
Author Contributions
Funding
Institutional Review Board Statement
Informed Consent Statement
Conflicts of Interest
References
- Mentaschi, L.; Vousdoukas, M.I.; Pekel, J.; Voukouvalas, E.; Feyen, L. Global long-term observations of coastal erosion and accretion. Sci. Rep. 2018, 8, 12876. [Google Scholar] [CrossRef] [PubMed] [Green Version]
- European Commission. Living with Coastal Erosion in Europe—Sediment and Space for Sustainability; European Commission: Brussels, Belgium, 2004; p. 40. [Google Scholar]
- Miles, L.; Kingdom, L.; Lightbody, S. Rail Tunnels through Chalk Cliffs: The Importance of Remote Sensing and Geotechnical Mapping in Developing an Understanding of Cliff Regression. In Engineering in Chalk; ICE Publishing: London, UK, 2018; pp. 323–330. [Google Scholar] [CrossRef]
- Asoni, S.G.; Stavrou, A.; Lawrence, J.A. Developing a GIS Based Methodology for Coastal Chalk Cliff Retreat Using Multiple Datasets. In Engineering in Chalk; ICE Publishing: London, UK, 2018; pp. 369–374. [Google Scholar] [CrossRef]
- Stavrou, A.; Lawrence, J.A.; Mortimore, R.N.; Murphy, W. A geotechnical and GIS based method for evaluating risk exposition along coastal cliff environments: A case study of the chalk cliffs of southern England. Nat. Hazards Earth Syst. Sci. 2011, 11, 2997–3011. [Google Scholar] [CrossRef] [Green Version]
- Hutchinson, J.N.; Bromhead, E.N. Keynote Paper: Isle of Wight landslides. In Instability Planning and Management: Seeking Sustainable Solutions to Ground Movement Problems, Proceedings of the International Conference Organised by the Centre for the Coastal Environment, Isle of Wight Council, Ventnor, UK, 20–23 May 2002; McInnes, R.G., Jakeways, J., Eds.; Thomas Telford: Ventnor, UK, 2002; pp. 3–70. [Google Scholar]
- Isle of Wight Council. Isle of Wight Shoreline Management Plan 2; Isle of Wight Council: Newport, UK, 2010. Available online: http://www.coastalwight.gov.uk/smp/contents.htm (accessed on 25 May 2020).
- Liu, J.; Mason, P.J. Image Processing and GIS for Remote Sensing: Techniques and Applications, 2nd ed.; Wiley Blackwell: Chichester, UK, 2016; pp. 113–125. [Google Scholar]
- Sentinel-1—ESA EO Missions—Earth Online—ESA. Available online: https://earth.esa.int/web/guest/missions/esa-operational-eo-missions/sentinel-1 (accessed on 20 May 2020).
- Polcari, M.; Albano, M.; Montuori, A.; Bignami, C.; Tolomei, C.; Pezzo, G.; Falcone, S.; La Piana, C.; Doumaz, F.; Salvi, S.; et al. InSAR Monitoring of Italian Coastline Revealing Natural and Anthropogenic Ground Deformation Phenomena and Future Perspectives. Sustainability 2018, 10, 3152. [Google Scholar] [CrossRef] [Green Version]
- Yin, Y.; Zheng, W.; Liu, Y.; Zhang, J.; Li, X. Integration of GPS with InSAR to monitoring of the Jiaju landslide in Sichuan, China. Landslides 2010, 7, 359–365. [Google Scholar] [CrossRef]
- Ciampalini, A.; Raspini, F.; Lagomarsino, D.; Catani, F.; Casagli, N. Landslide susceptibility map refinement using PSInSAR data. Remote Sens. Environ. 2016, 184, 302–315. [Google Scholar] [CrossRef]
- Refice, A.; Spalluto, L.; Bovenga, F.; Fiore, A.; Miccoli, M.; Muzzicato, P.; Nitti, D.; Nutricato, R.; Pasquariello, G. Integration of persistent scatterer interferometry and ground data for landslide monitoring: The Pianello landslide (Bovino, Southern Italy). Landslides 2019, 16, 447–468. [Google Scholar] [CrossRef] [Green Version]
- Aslan, G.; Foumelis, M.; Raucoules, D.; Michele, M.D.; Bernardie, S.; Cakir, Z. Landslide Mapping and Monitoring Using Persistent Scatterer Interferometry (PSI) Technique in the French Alps. Remote Sens. 2020, 12, 1305. [Google Scholar] [CrossRef] [Green Version]
- Holtgrave, A.-K.; Röder, N.; Ackermann, A.; Erasmi, S.; Kleinschmit, B. Comparing Sentinel-1 and -2 Data and Indices for Agricultural Land Use Monitoring. Remote Sens. 2020, 12, 2919. [Google Scholar] [CrossRef]
- Sajinkumar, K.S.; Bincy, H.S.; Bouali, E.H.; Oommen, T.; Vishnu, C.L.; Anilkumar, Y.; Thrivikramji, K.P.; Keerthy, S. Picturing beach erosion and deposition trends using PSInSAR: An example from the non-barred southern west coast of India. Wetl. Ecol. Manag. 2020. [Google Scholar] [CrossRef]
- Crosetto, M.; Monserrat, O.; Cuevas-González, M.; Devanthéry, N.; Crippa, B. Persistent scatterer interferometry: A review. ISPRS J. Photogramm. Remote Sens. 2016, 115, 78–89. [Google Scholar] [CrossRef] [Green Version]
- Manconi, A.; Kourkouli, P.; Caduff, R.; Strozzi, T.; Loew, S. Monitoring Surface Deformation over a Failing Rock Slope with the ESA Sentinels: Insights from Moosfluh Instability, Swiss Alps. Remote Sens. 2018, 10, 672. [Google Scholar] [CrossRef] [Green Version]
- Mulas, M.; Corsini, A.; Cuozzo, G.; Callegari, M.; Hiebes, B.; Mair, V. Quantitative Monitoring of Surface Movements on Active Landslides by Multi-Temporal, High-Resolution X-Band SAR Amplitude Information: Preliminary Results. In Landslides and Engineered Slopes. Experience, Theory and Practice; CRC Press: Boca Raton, FL, USA, 2016; pp. 1511–1516. [Google Scholar] [CrossRef] [Green Version]
- New Maps from Old Photos: Measuring Coastal Erosion—USGS. Available online: https://www.usgs.gov/news/new-maps-old-photos-measuring-coastal-erosion (accessed on 20 May 2021).
- Shoreline Mapping History. Available online: https://shoreline.noaa.gov/intro/index.html (accessed on 15 July 2020).
- Jaboyedoff, M.; Oppikofer, T.; Abellán, A.; Derron, M.H.; Loye, A.; Metzger, R.; Pedrazzini, A. Use of LIDAR in landslide investigations: A review. Nat. Hazards 2012, 61, 1–24. [Google Scholar] [CrossRef] [Green Version]
- Mortimore, R. Structural geology of the Upper Cretaceous Chalk Central Mass, Isle of Wight, U.K. Proc. Geol. Assoc. 2011, 122, 298–331. [Google Scholar] [CrossRef]
- British Geological Survey. Digital Geological Map of Isle of Wight; BGS: Keyworth, UK, 2013. [Google Scholar]
- Borehole Scans. Available online: https://www.bgs.ac.uk/data/boreholescans/home.html (accessed on 10 July 2020).
- Isle of Wight Council. Halcrow, Ventnor Undercliff, Isle of Wight Coastal Instability Risk: Interpretative Report and Quantitative Risk Analysis; Technical report to the Isle of Wight Council; Isle of Wight Council: Newport, UK, 2006. [Google Scholar]
- BGS Lexicon of Named Rock Units. Available online: https://www.bgs.ac.uk/lexicon/home.html (accessed on 15 June 2020).
- Chandler, M.P. The Costal Landslides Forming the Undercliff of the Isle of Wight. Ph.D. Thesis, Imperial College of Science and Technology London, London, UK, 1984. [Google Scholar]
- Geomorphological Services Limited (For the Department of the Environment). Coastal Landslip Potential Assessment: Isle of Wight Undercliff; Research Contract PECD 7/1/272; Geomorphological Services Limited: Ventnor, UK, 1991. [Google Scholar]
- Moore, R.; Carey, J.; McInnes, R.; Houghton, J. Climate change, so what? Implications for ground movement and landslide event frequency in the Ventnor Undercliff, Isle of Wight. In Proceedings of the International Conference Landslides and Climate Change, Ventnor, UK, 21–24 May 2007; McInnes, R.J., Jakeways, J., Fairbank, H., Mathie, E., Eds.; Taylor & Francis: London, UK, 2007; pp. 335–344. [Google Scholar] [CrossRef]
- Environment Agency (Romsey District Office). Daily Rainfall Data for Locations on the Isle of Wight; Environment Agency: Romsey, UK, 2020. [Google Scholar]
- Carey, J.; Moore, R.; Petley, D. Patterns of movement in the Ventnor landslide complex, Isle of Wight, southern England. Landslides 2015, 12, 1107–1118. [Google Scholar] [CrossRef] [Green Version]
- Council Fully Close Newport Road, Ventnor Due to Ground Movement. Available online: https://onthewight.com/council-fully-close-newport-road-due-to-ground-movement/ (accessed on 5 June 2020).
- Landslip after Wall Collapses in Ventnor. Available online: https://www.bbc.com/news/uk-england-hampshire-51140199 (accessed on 23 May 2020).
- Family Evacuated After Landslide in Ventnor. Available online: https://www.islandecho.co.uk/family-evacuated-after-landslide-in-ventnor/ (accessed on 10 March 2021).
- Ferretti, A.; Prati, C.; Rocca, F. Permanent scatterers in SAR interferometry. IEEE Trans. Geosci. Remote Sens. 2001, 39, 8–20. [Google Scholar] [CrossRef]
- Ferretti, A.; Monti-Guarnieri, A.; Prati, C.; Rocca, F.; Massonnet, D. InSAR Principles: Guidelines for SAR Interferometry Processing and Interpretation; ESA Publications: Noordwijk, The Netherlands, 2007; pp. B11–B55. [Google Scholar]
- ASF Data Search—Vertex. Available online: https://search.asf.alaska.edu/#/ (accessed on 28 May 2020).
- British Oceanographic Data Centre. Sea Level Data Portal Data Request—Portsmouth; British Oceanographic Data Centre: Liverpool, UK, 2020. [Google Scholar]
- Mider, G.; Lawrence, J.; Mason, P.; Ghail, R. Monitoring Littoral Platform Downwearing Using Differential SAR Interferometry. Remote Sens. 2020, 12, 3243. [Google Scholar] [CrossRef]
- Raspini, F.; Cigna, F.; Moretti, S. Multi-temporal mapping of land subsidence at basin scale exploiting Persistent Scatterer Interferometry: Case study of Gioia Tauro plain (Italy). J. Maps 2012, 8, 514–524. [Google Scholar] [CrossRef] [Green Version]
- Fuhrmann, T.; Garthwaite, M.C. Resolving Three-Dimensional Surface Motion with InSAR: Constraints from Multi-Geometry Data Fusion. Remote Sens. 2019, 11, 241. [Google Scholar] [CrossRef] [Green Version]
- Ferretti, A.; Prati, C.; Rocca, F. Non-linear subsidence rate estimation using permanent scatterers in differential SAR interferometry. IEEE Trans. Geosci. Remote Sens. 2000, 38, 2202–2212. [Google Scholar] [CrossRef] [Green Version]


| Survey Method | Location | Monitoring Period | Estimated Annual Rate of Vertical Movement (mm a−1) |
|---|---|---|---|
| Benchmark Survey | Steephill Down Rd | 1960–1982 | 29 |
| Newport Rd | 1960–1982 | 28 | |
| Albert St | 1939–1960 | 27 | |
| Gills Cliff Rd | 1939–1982 | 19 | |
| Ocean View Rd | 1939–1982 | 12 | |
| Bath Rd | 1907–1982 | 11 | |
| Extensometer Survey | Newport Rd | 1981–1982 | 20 to 39 |
| Havenbush | 1981–1982 | 27 to 30 | |
| Gills Cliff Rd | 1981–1982 | 16 | |
| Ground Survey | Newport Rd | 1988 | 12 to 125 |
| Winter Gardens | 1988 | 30 | |
| Photogrammetry | Ocean View Rd | 1949–1988 | 67 |
| Bath Rd | 1949–1988 | 65 | |
| Esplanade | 1949–1988 | 20 | |
| Belle Vue Rd | 1949–1988 | 15 | |
| Council Records | Bath Rd | 1995–2005 | 33 |
| Newport Rd | 1995–2005 | 22 |
| Orbit | Ascending | Descending |
|---|---|---|
| Track Number | 132 | 81 |
| Heading Azimuth (°) | 344.89 | 188.26 |
| Look Angle (°) | 74.89 | 278.26 |
| Total Number Scenes in Time Period | 209 | 205 |
| Number of Scenes Post Tidal Comparison | 80 | 104 |
| Number PS Points Generated | 3262 | 3919 |
| Time Series | Value | VU (mm a−1) | VE (mm a−1) |
|---|---|---|---|
| 2016 | Min (Subsidence/West) | −16.9 | −18.7 |
| Max (Heave/East) | 14.5 | 30 |
| Time Series | Value | VU (mm a−1) | VE (mm a−1) |
|---|---|---|---|
| Full | Min (Subsidence/West) | −9.8 | −3.7 |
| Max (Heave/East) | 8.5 | 12.4 |
Publisher’s Note: MDPI stays neutral with regard to jurisdictional claims in published maps and institutional affiliations. |
© 2021 by the authors. Licensee MDPI, Basel, Switzerland. This article is an open access article distributed under the terms and conditions of the Creative Commons Attribution (CC BY) license (https://creativecommons.org/licenses/by/4.0/).
Share and Cite
O’Connor, W.; Mider, G.; Lawrence, J.A.; Agar, S.; Mason, P.J.; Ghail, R.; Scoular, J. An Investigation into Ground Movement on the Ventnor Landslide Complex, UK Using Persistent Scatterer Interferometry. Remote Sens. 2021, 13, 3711. https://0-doi-org.brum.beds.ac.uk/10.3390/rs13183711
O’Connor W, Mider G, Lawrence JA, Agar S, Mason PJ, Ghail R, Scoular J. An Investigation into Ground Movement on the Ventnor Landslide Complex, UK Using Persistent Scatterer Interferometry. Remote Sensing. 2021; 13(18):3711. https://0-doi-org.brum.beds.ac.uk/10.3390/rs13183711
Chicago/Turabian StyleO’Connor, William, Gosia Mider, James A. Lawrence, Stewart Agar, Philippa J. Mason, Richard Ghail, and Jennifer Scoular. 2021. "An Investigation into Ground Movement on the Ventnor Landslide Complex, UK Using Persistent Scatterer Interferometry" Remote Sensing 13, no. 18: 3711. https://0-doi-org.brum.beds.ac.uk/10.3390/rs13183711