Article

Quantitative Assessment of Riverbed Planform Adjustments, Channelization, and Associated Land Use/Land Cover Changes: The Ingauna Alluvial-Coastal Plain Case (Liguria, Italy)

1
Department of Earth Environment and Life Sciences, University of Genova, Corso Europa 26, 16132 Genova, Italy
2
Geoscape—Geo-Environmental Consulting, Spin-Off of the University of Genova, Via Varese 2, 16122 Genova, Italy
*
Author to whom correspondence should be addressed.
Remote Sens. 2021, 13(18), 3775; https://0-doi-org.brum.beds.ac.uk/10.3390/rs13183775
Submission received: 14 July 2021 / Revised: 10 September 2021 / Accepted: 15 September 2021 / Published: 20 September 2021
(This article belongs to the Special Issue Geomorphological Mapping and Process Monitoring Using Remote Sensing)

Abstract

:
The active-channel planform adjustments that have occurred along the Centa, lower Arroscia and lower Neva rivers since 1930, along with the riverbed channelization processes and the land-use and land-cover changes in disconnected riverine areas, were investigated through a multitemporal analysis based on remote sensing and geographical information systems (GIS). These watercourses flow through the largest Ligurian alluvial-coastal plain in a completely anthropogenic landscape. This research is based on the integrated use of consolidated and innovative metrics for riverbed planform analysis. Specific indices were introduced to assess active-channel lateral migration in relation to the active-channel area abandonment and formation processes. The Arroscia and Neva riverbeds experienced narrowing, progressive stabilization, and braiding phenomena disappearance from 1930 to the early 1970s, and then slight narrowing up to the late 1980s. Subsequently, generalized stability was observed. Conversely, the Centa was not affected by relevant planform changes. Recently, all rivers underwent a slight to very slight width increase triggered by the November 2016 high-magnitude flood. The active-channel adjustments outlined in this paper reflect the relevant role in conditioning the river morphology and dynamics played by channelization works built from the 1920s to the early 1970s. They (i) narrowed, straightened, and stabilized the riverbed and (ii) reduced the floodable surface over the valley-floor. Thus, large disconnected riverine areas were occupied by human activities and infrastructures, resulting in a progressive increase in vulnerable elements exposed to hydrogeomorphic hazards. The outlined morphological dynamics (i) display significant differences in terms of chronology, type, and magnitude of active-channel planform adjustments with respect to the medium- and short-term morphological evolution of most Italian rivers and (ii) reflect the widespread urbanization of Ligurian major valley floors that occurred over the 20th century. The outcomes from this study represent an essential knowledge base from a river management perspective; the novel metrics enlarge the spectrum of available GIS tools for active-channel planform analysis.

Graphical Abstract

1. Introduction

From the end of the 19th century, many European alluvial rivers [1,2,3,4,5,6,7,8,9,10,11,12,13], particularly in Mediterranean regions [14,15,16,17,18], underwent considerable morphological changes mainly consisting of riverbed narrowing, incision, and channel pattern variation. Several studies have identified their main causes to be severe human pressures, both at the basin and channel scale, namely in-channel sediment quarrying [4,19,20,21,22], dam closure [19,23,24,25,26], channelization [27,28,29], and land use changes [30,31,32]. These interventions, associated with a general economic growth, caused river systems to experience landform simplification, and thus the loss of habitats [9,14,15,33,34], geomorphological instability and related damage to in-channel structures [14,19,33,35,36,37], as well as floodable area reduction and progressive occupation of the areas of fluvial pertinence [14,27,38]. As a result, serious issues in terms of environmental quality, biodiversity conservation, and hydrogeomorphic hazards and risks arose.
Many studies have been published analysing Italian river adjustments over the last two centuries, e.g., [9,17,39,40,41,42,43,44,45,46,47,48,49,50,51,52,53]. Most of them agree that modifications overall occurred in three phases [9,14,15,34,45], even though differences in phase timing, dominant morphological processes, and magnitude were locally observed [15,27,52]. From the mid-19th century to the 1950s (Phase 1), no broad and well-defined common trends over Italy were documented. However, rivers in the northern and central parts of Italy mainly experienced riverbed stability and slight narrowing and incision. In this phase, channel adjustments were primarily associated with climate changes, land use changes, and dam construction [9,34]. From the 1950s to, on average, the end of the 1990s (Phase 2), generalized and intense channel narrowing, and incision processes affected the Italian rivers due to severe anthropogenic pressures consisting of in-channel sediment extractions, channelization, and dam closure [9,15,20,34,51]. Since the end of the 1990s (Phase 3), with advances or delays of approximately 10 years in some cases [14,15,44,52,53], less intense channel adjustments have been generally documented, and morphological recovery has occurred along several rivers [9,15,41,42,44,52,54]. This phase is still being investigated throughout Italy and has been fostered by the occurrence of large floods [14,15,34,41,42,44,45] and, in some cases, by sediment quarrying cessation [4,15,16,55].
The medium- and short-term [11] morphological evolution of Ligurian rivers has been scarcely investigated [56]. Recent works focused on the Entella [57,58,59] and Bisagno [60,61,62] rivers, close to Genova, whereas a preliminary overview of the recent morphological evolution of the floodplain-riverbed system in some Ligurian Tyrrhenian catchments was provided by Luino et al. [63]. Previous studies considered the Vara [16,64] and Magra rivers [55,65,66], located at the border between the Liguria and Toscana regions. Liguria is a mountainous region with mostly confined riverbeds along with small, narrow, and elongated alluvial or alluvial-coastal plains generally located in the downstream-most reach of major watercourses. In this setting, the lack of wide flat areas suitable for urban sprawl resulted in the progressive urbanization of major valley floors, which have been intensely modified, particularly since the 19th century [59,60,61,63,67,68,69,70,71]. Accordingly, during the 20th century, the Ligurian rivers in the major valley floors experienced narrowing, stabilization, and landform simplification, as they were channelized, rectified, and sometimes covered; simultaneously, their adjacent areas were modified to obtain usable land [56,59,61,63,67]. Furthermore, riverbed degradation and shoreline retreat, mainly associated with in-channel sediment quarrying, have been documented [58,72]. Thus, the Ligurian rivers of the major valley floors were incorporated into continuous urban fabric, and their morphological evolution did not follow the aforementioned Italian river general trends. Considering the high proneness to floods of this region due to its physiographical and climatic settings, these landscape changes resulted in serious issues in terms of management of hydrogeomorphic hazards and risks [62,69,73,74,75,76,77,78,79,80,81,82].
From a river management perspective, multitemporal analysis of river dynamics at the “management scale” [83] (p. 36), which is over the last 100–150 years, is widely known to be a fundamental tool to yield valuable information to understand ongoing dynamics and potential future evolutionary trends [11,84,85,86,87]. Earth observation based on remote sensing (RS) and geographical information systems (GIS) are essential for the qualitative and quantitative assessment of riverbed planform adjustments as well as land use and land cover (LULC) changes over time [88].
Historical maps and traditional aerial photographs have long been used in geomorphological monitoring of riverbeds e.g., [8,10,11,22,89,90,91,92,93,94,95,96]. Recently, the increasing availability of RS data, such as the aforementioned aerial photographs, unmanned aerial vehicle (UAV) photographs, satellite imagery (e.g., Landsat and Sentinel images), and free, high-spatial resolution images from web platforms (e.g., Google Earth, Microsoft Bing Maps), has substantially broadened multitemporal analysis feasibility worldwide, allowing high-temporal resolution and large-scale research to be performed e.g., [97,98,99,100,101,102,103,104,105,106,107,108,109,110].
However, the use of RS data (i.e., aerial or satellite images) is strictly limited by the spatial resolution of available imagery with respect to the dimension of elements investigated, the time span covered by image availability, and the prohibitive cost of purchasing each high-spatial resolution scene [97,100,101,106,111,112]. UAV photographs address some of these issues, but their use is generally limited to small areas [102,113,114,115].
Several studies based on a multitemporal analysis of RS data were performed to investigate LULC changes over time with different purposes [70,105,116,117,118,119,120,121]. However, these investigations rarely focused in detail on the LULC evolution of both areas of fluvial pertinence and former riverbed zones [27,52,53].
Last, GIS analysis of riverbed planform dynamics over time has usually considered well-established morphometric indices and parameters mainly focusing on channel width, sinuosity, and braiding e.g., [9,13,15,34,41,53,122,123]. Less attention has been given to channel shifting [42,45,98,103,106,107], and very few studies have investigated bank migration in relation to both active-channel dimension change and active-channel horizontal displacement [45,98,107].
In this paper, easily available and often ready-to-use data consisting of historical maps, aerial photographs and Google Earth images were used to outline in detail the active-channel planform adjustments that have occurred along the Centa River and the Arroscia and Neva Rivers floodplain reach (Albenga, NW, Italy) since 1930. Furthermore, the associated bank-stabilization process and LULC changes were investigated. These watercourses flow through the largest Ligurian alluvial-coastal plain in a completely human-modified landscape and have never been investigated from a geomorphological point of view. Motivated by the need to assess riverbed horizontal migration as a function of channel area formation and abandonment processes, two indices were developed to analyse these planform morphological adjustments. The aims of this study are to (i) provide new insights concerning GIS parameters for active-channel planform analysis based on FOSS GIS, (ii) present a case study of highly channelized riverbed morphological evolution in an anthropogenic landscape, (iii) increase the knowledge about Ligurian and Italian rivers, and (iv) provide useful information for river and land management under a river-related risk mitigation and environment restoration perspective.

2. Study Area

The study area covers the lower part of the Centa River basin, which is located in the western portion of the Liguria region (northwestern Italy) (Figure 1a). The whole catchment belongs geologically to a segment of the Ligurian Alps, and it shows a total area of approximately 435 km2. The basin largely develops in the territory of the Liguria region, except for very small northern portions situated close to the main watershed, which encompass the Piemonte region. To the west and north, the basin is bounded by elevations exceeding 1000 m a.s.l., with the highest peaks reached by Mt. Fronté (2151 m) and Mt. Galero (1708 m); to the east and south, the catchment is limited by peaks ranging between approximately 500 and 1000 m a.s.l., while gentle reliefs (i.e., lower than 200 m a.s.l.) occur towards the basin outlet (Figure 1a). Throughout the upper-middle sector of the basin, sedimentary rocks (e.g., limestones, marls, sandstones, siltstones, dolomites, shales, breccias, and radiolarites) and subordinately metamorphic rocks (e.g., quartzites, schists, and gneiss) crop out [124], while the lower part is characterized by soft rocks (i.e., marly clays and conglomerates) and alluvial deposits [125]. The tectonic uplift that occurred during the Plio-Quaternary strongly influenced the hydrographic network, controlling its orientation and arrangement [126,127]. The catchment is drained by three main watercourses: the Arroscia River, the Neva River, and the Centa River (Figure 1a). The Arroscia River, nearly east-west oriented, has a length of approximately 40 km, and it flows eastwards, receiving two main tributaries from the right side (i.e., the Giara di Rezzo and the Lerrone streams). The Neva River is approximately 19 km long and receives one principal right tributary (i.e., Pennavaire stream) along its almost NW-SE trending path. The Centa River originates from the confluence of the Arroscia and Neva rivers, and after a short stretch of approximately 3.3 km crossing the town of Albenga, it directly flows into the Ligurian Sea (Figure 1a). According to archive information and literature data [128,129], the average daily discharge is approximately 10, 3.7 and 2.6 m3/s for the Centa River, the Arroscia River, and the Neva River, respectively.
In general, the morphology of the basin is prevalently mountainous-hilly. The upstream parts of the basin show small and deeply incised valleys predominantly covered by woods, meadows, and pastures and secondarily by sparse agricultural lands, prevalently olive groves, and vineyards, along with small settlements. Approximately downstream of the Ortovero and Cisano sul Neva villages, the valley floors widen progressively, marking the beginning of the alluvial-coastal plain. This plain, locally known as the “Ingauna” plain, consists of recent and Quaternary alluvial deposits, showing different orders of fluvial terraces [127]. In terms of land use, it is currently intensively cultivated and covered by extensive urban areas that become increasingly widespread towards the mouth, where the main town centre of Albenga is located [130]. The climate setting of the basin is of the Mediterranean type, albeit some microclimate differences can be observed along the basin depending on local factors, such as the altitude and the distance from the sea. Both the average annual temperature and mean annual rainfall increase moving from the coastal zone (approximately 15 °C and 760 mm, respectively) to the hinterland (approximately 12 °C and 1170 mm, respectively) [131]. The highest rainfall levels are usually recorded in the autumn period (November is the wettest month) when intense rainfall events can frequently cause severe floods [132]. In the last thirty years, five main floods were documented (i.e., November 1994, October/November 2000, September 2006, October/November 2014, and November 2016) to have caused significant damage to infrastructure, economic activities, and settlements [81,130], especially in the town centre of Albenga [133].
The study presented here focused on the Centa River and the alluvial-coastal plain reaches of the Arroscia and Neva rivers (Figure 1b). The entire course of the Centa River up to its outlet (3.3 km) was investigated. The selected Arroscia reach (7.7 km) goes from approximately Ortovero village up to confluence with the Neva River, whose reach considered (4.4 km) stretches from downstream of the Cisano sul Neva village to the aforementioned confluence. Along these reaches, riverbed sediments are dominated by cobbles and pebbles and subordinately by finer fractions. The active channel is single-thread or transitional, quite narrow, and heavily channelized. Throughout the 20th century, it experienced widespread anthropic interventions mainly related to the construction of bank protections and levees, urban sprawl, land reclamation for agricultural purposes, and quarrying activities [72,81,134]. The riverine area is generally characterized by tight and discontinuous strips of stable land classifiable as recent terrace, active floodplain, or bench [135], located between channelization structures and the active channel.

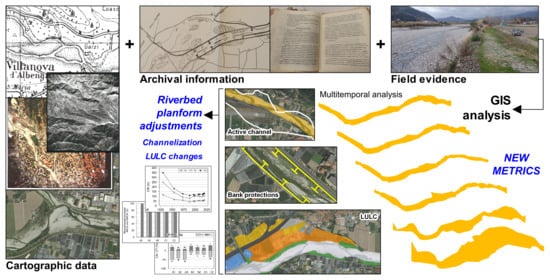
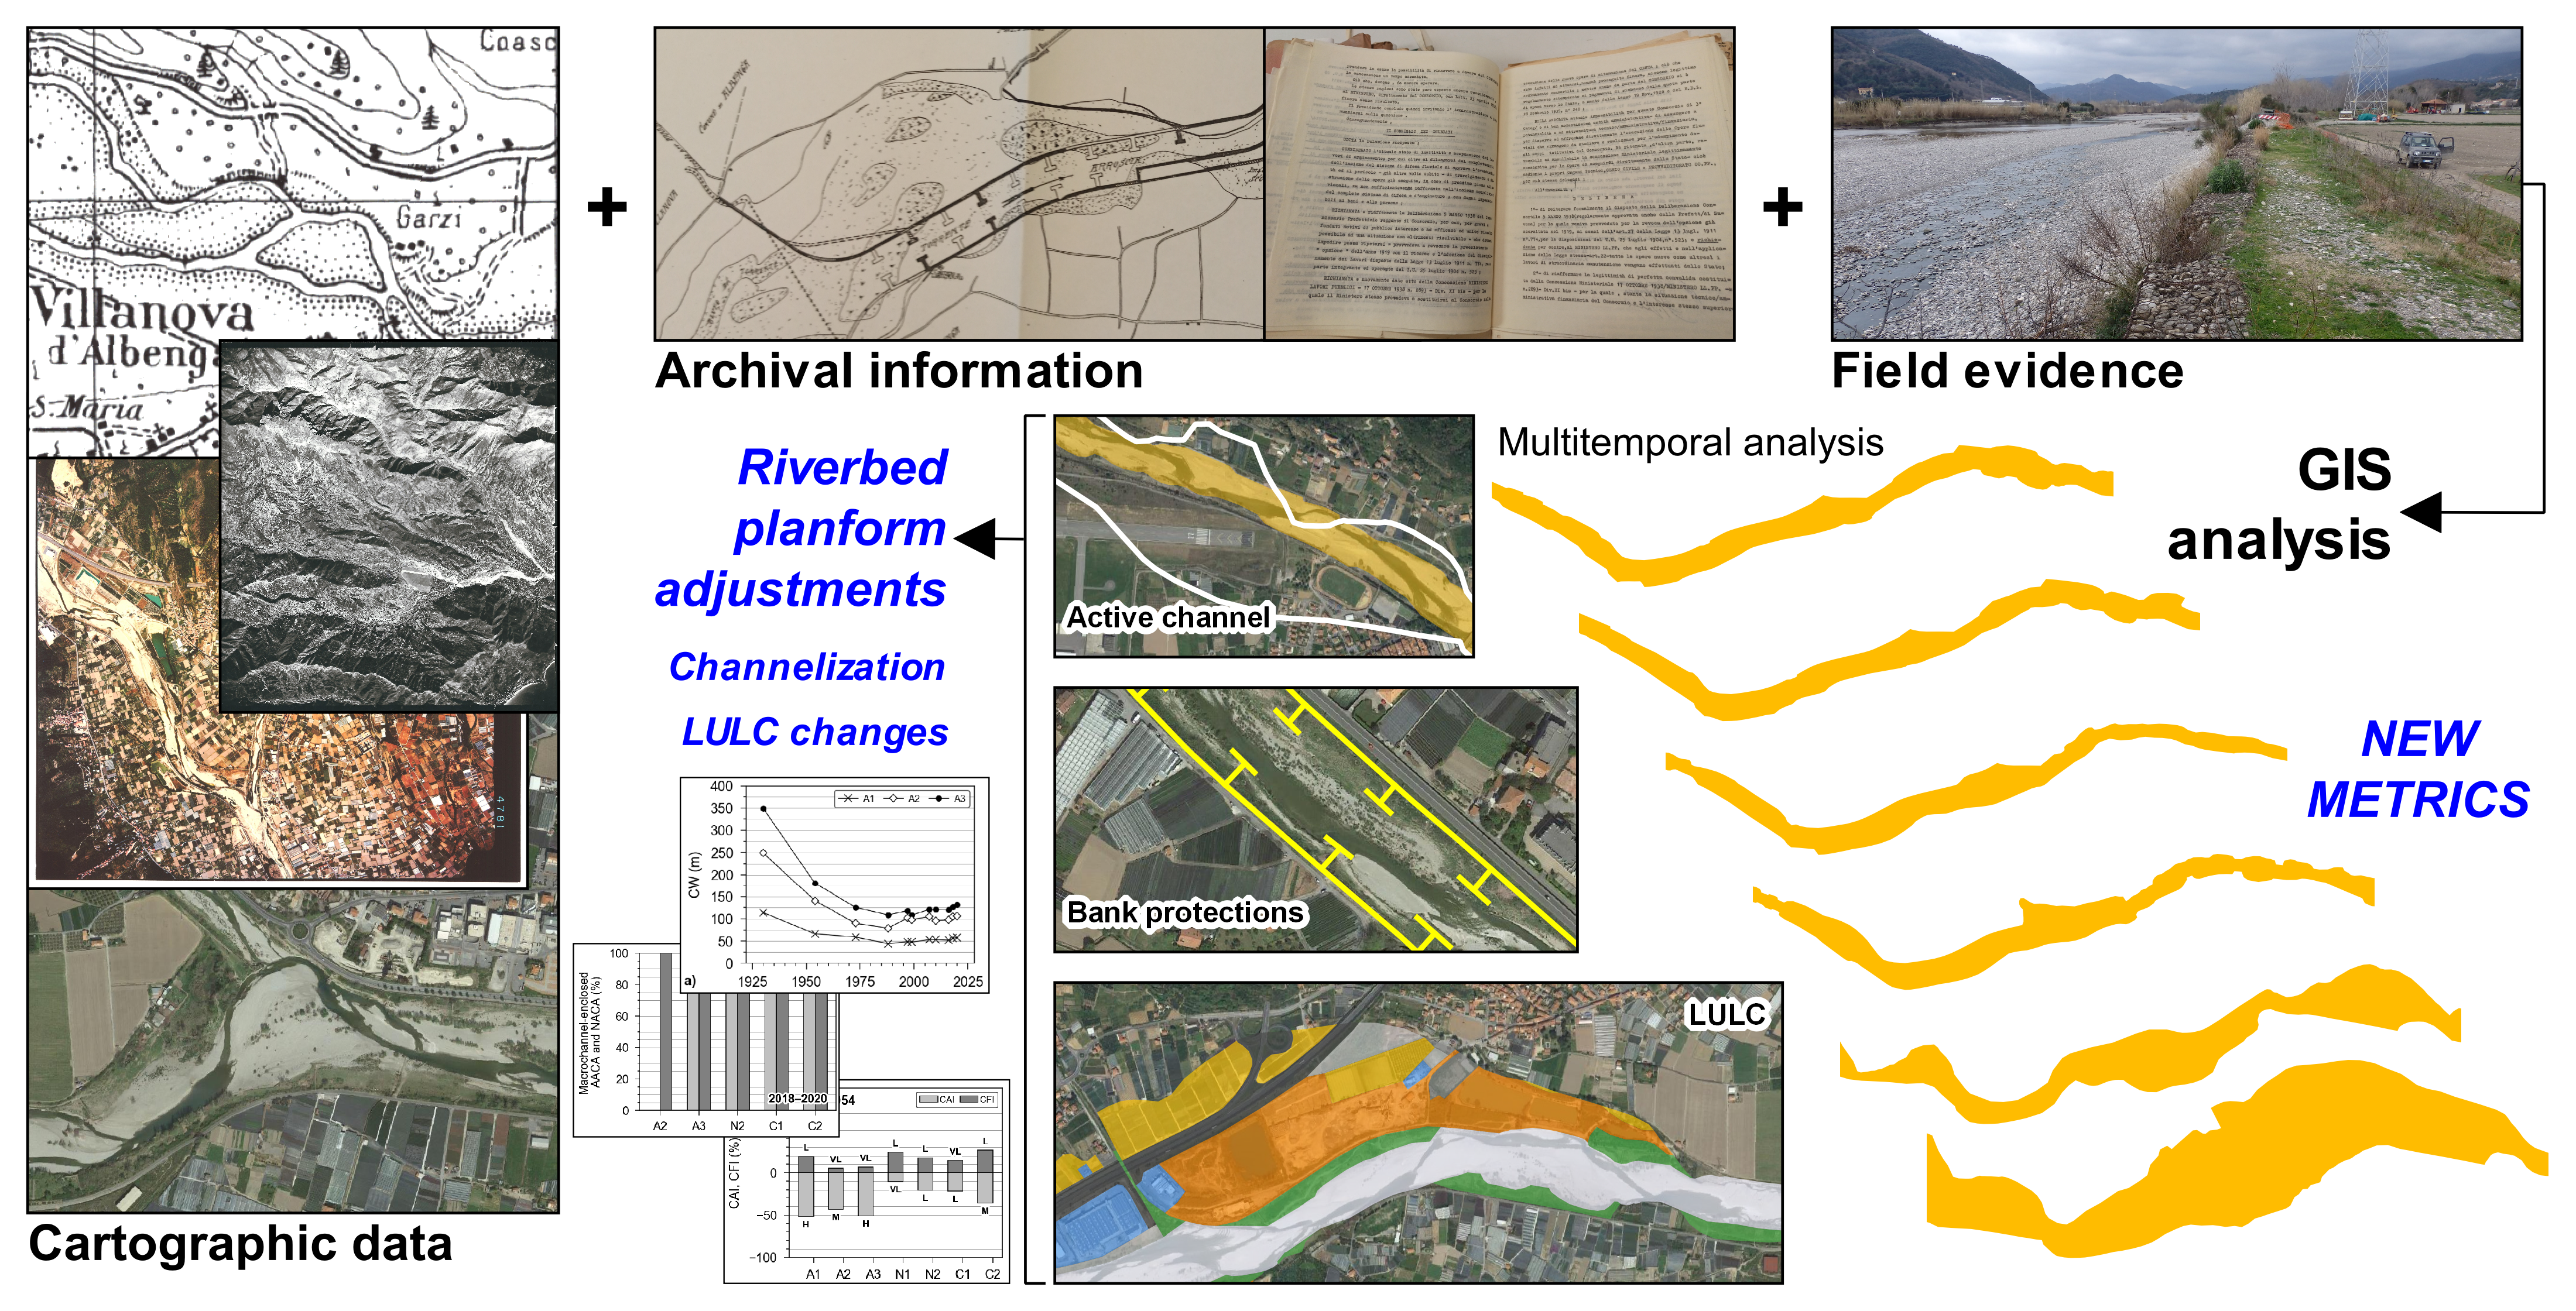
3. Materials and Methods

This research is based on a multitemporal analysis of historical maps, aerial photographs and Google Earth images carried out in a GIS environment using the free and open-source software QGIS [136]. Field surveys were conducted to support and validate the photointerpretation operations related to the active channel, bank protection, and LULC digitizing. Moreover, archival data collection and review were carried out to gain further historical information about the river evolution and to support and validate historical feature mapping. Figure 2 shows a general scheme of the methodological framework.

3.1. Data Sources

A set of eleven different data sources spanning the period 1930–2020 was considered to assess the active-channel planform changes over time (Table 1). The first three data sequences (i.e., 1930, 1954, and 1973) were georeferenced by applying a second-order polynomial transformation, the nearest neighbour as resampling method, and by using the 2010 orthophoto series as a base map for coregistration. Ground control points were located around the riverbed to obtain a better accuracy close to the feature of interest [42,45,137]. The analysis focused on floodplain reaches; thus, an orthorectification procedure was not necessary [14,138,139]. The orthophotos dated back to 1988 to 2016 were retrieved from public geoportals through the web map service function with guaranteed positional accuracy. The Google Earth images were imported by means of the Quick Map Service plug in and visualized at a fixed scale to constantly use the same images whose date was checked directly in Google Earth. The root mean square errors (RMSEs) for 1930 maps, as well as for 1954 and 1973 aerial photographs, were provided by the QGIS Georeferencer. Since each single image with the same date had its own RMSE, the highest value was assigned to all the images of a specific date. Furthermore, the differences in the positions of a series of control points selected on the 2010 orthophotos as a base and on Google Earth images were used to compute the RMSE of these data [11,45].
According to previous investigations [42,140], RMSEs were multiplied by 1.7308 to estimate positional accuracy (Table 1). Hence, the maximum positional error was estimated to be approximately 27 m for the 1930 map, 12 m for the 1954 aerial images, and approximately between 7 and 3 m for the other data, in compliance with previous similar studies [9,11,15,137,141].

3.2. Active Channel Mapping

The active channel was manually mapped as a polygon on each dataset (Table 1), including wetted channels and bare or partially vegetated bars (Figure 3a,b) [9,11,14,135,142,143,144]. This spatial unit reflects ongoing geomorphic processes independent of flow conditions at the time of the survey [45,138]. To maintain accuracy, digitizing was performed at a constant scale of 1:2500, and a single operator performed the whole process [103]. The active channel in 2016 was mapped first, as it refers to the most recent orthophoto available; then digitizing consisted of modifying polygons close in time. This approach was possible thanks to the high spatial accuracy and detailed overlay of images and allowed us to avoid introducing errors in riverbed migration assessment resulting from imprecision in active-channel identification. The active-channel centerline, namely, the line of points equidistant from the banks, was automatically generated by means of polygon skeletonization and line smoothing GIS tools [14,45,138].
The selected segments of the Centa, Arroscia and Neva rivers were divided into homogeneous reaches in terms of geomorphological features, thus considering channel patterns, channel width variations, confinement discontinuities, tributary confluences, and in-channel structures [145,146]. The 2020 banks were extracted and distinguished as “confined” or “not-confined” by natural factors such as slopes, landslide deposits, alluvial fans and ancient river terraces to define the reach-scale confinement degree [52,146].

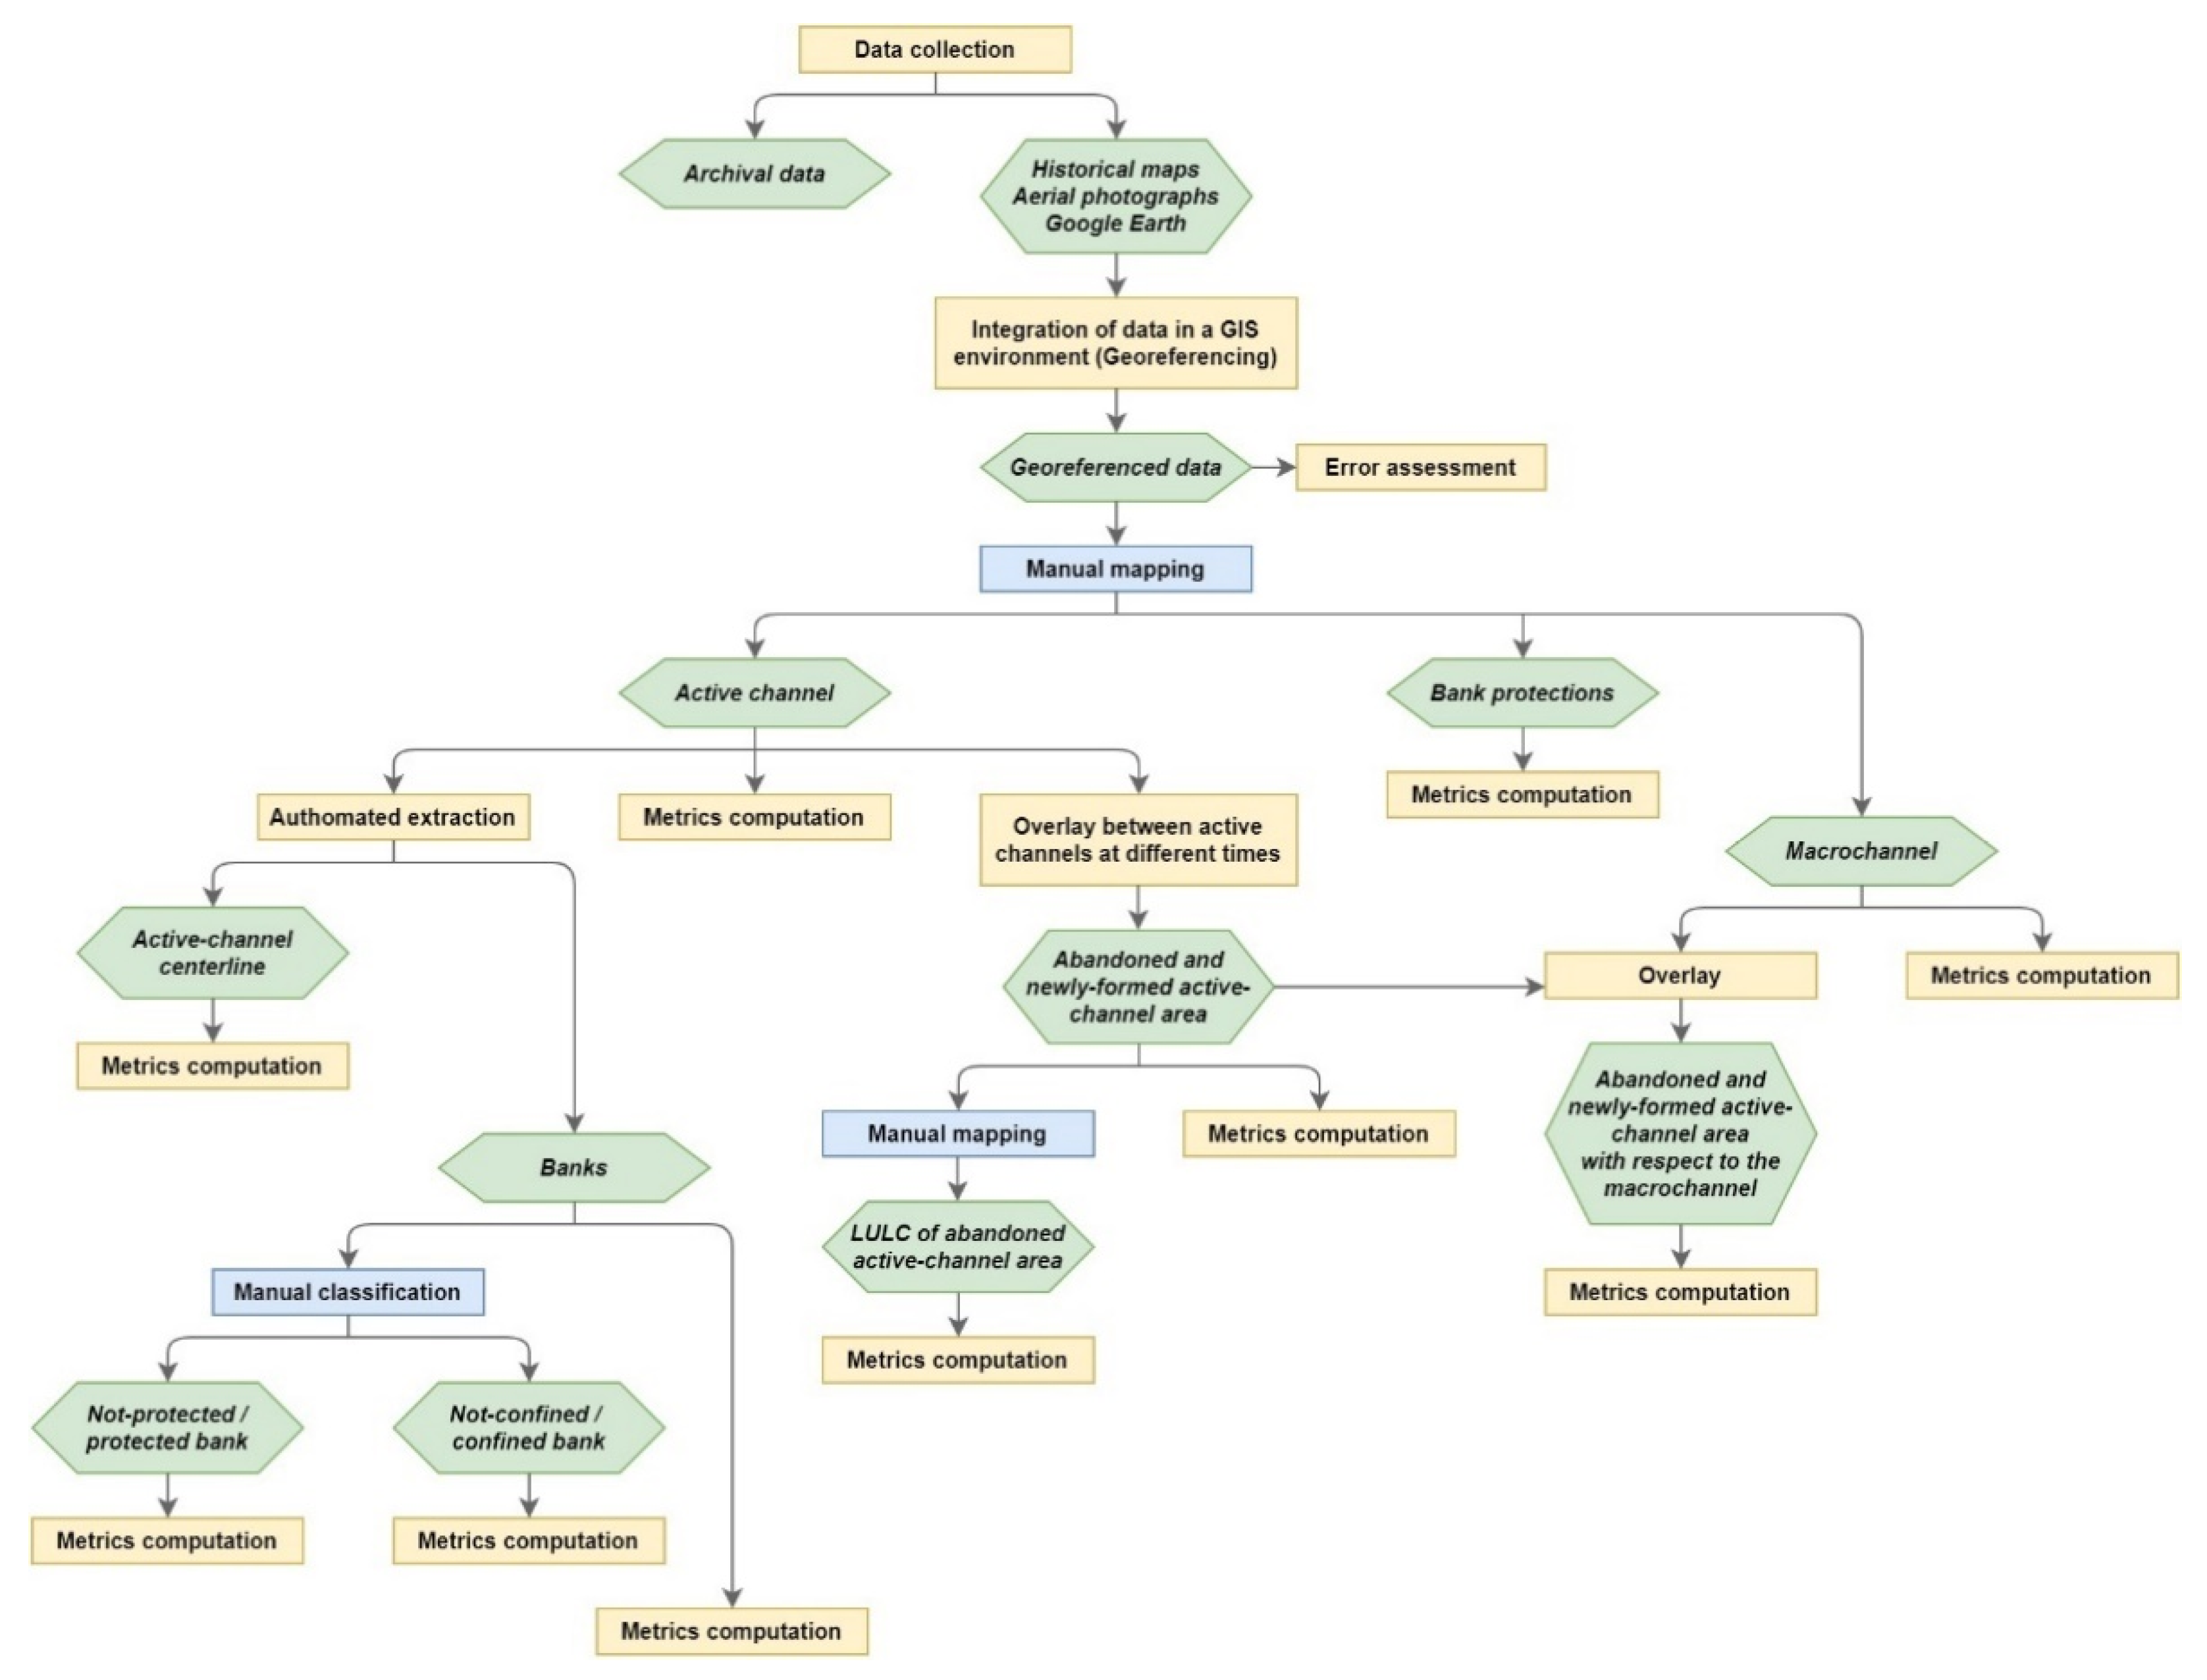
3.3. Bank Protection Assessment

To assess the extent of channelization structures over time, bank protections located along banks and close to them (i.e., no more distant than approximately 50 m) were digitized on images from 1954 onwards, following the procedure implemented for active-channel mapping. Thus, in this study, all defence structures for the prevention of active-channel lateral erosion located in the riverine corridor were considered and referred to as bank protections.
Gabionades, ripraps, and walls were classified as longitudinal bank protections, whereas groynes were classified as cross bank protections. Both were quantified at reach scale: the former as percentage length referred to double the active channel length, and the latter as number of structures per kilometre. The extent of longitudinal bank protection was referred to as very low (≤5%), low (>5% and ≤33%), moderate (>33% and ≤50%), high (>50% and ≤80%), and very high (>80%), according to indicator A6 of the Morphological Quality Index [146,147,148].
Considering the bank protection setting over the last two decades, the macrochannel was mapped (Figure 3a,b). This element was defined as the sum of the active channel and the surface located between banks and channelization works, which is generally a recent terrace, modern floodplain, or bench [135]. It is delimited by longitudinal bank protections or the straight line joining the outermost extremities of adjacent groynes (Figure 3b). Thus, the macrochannel was identifiable in reaches characterized by continuous or almost continuous longitudinal bank protections or numerous groynes.

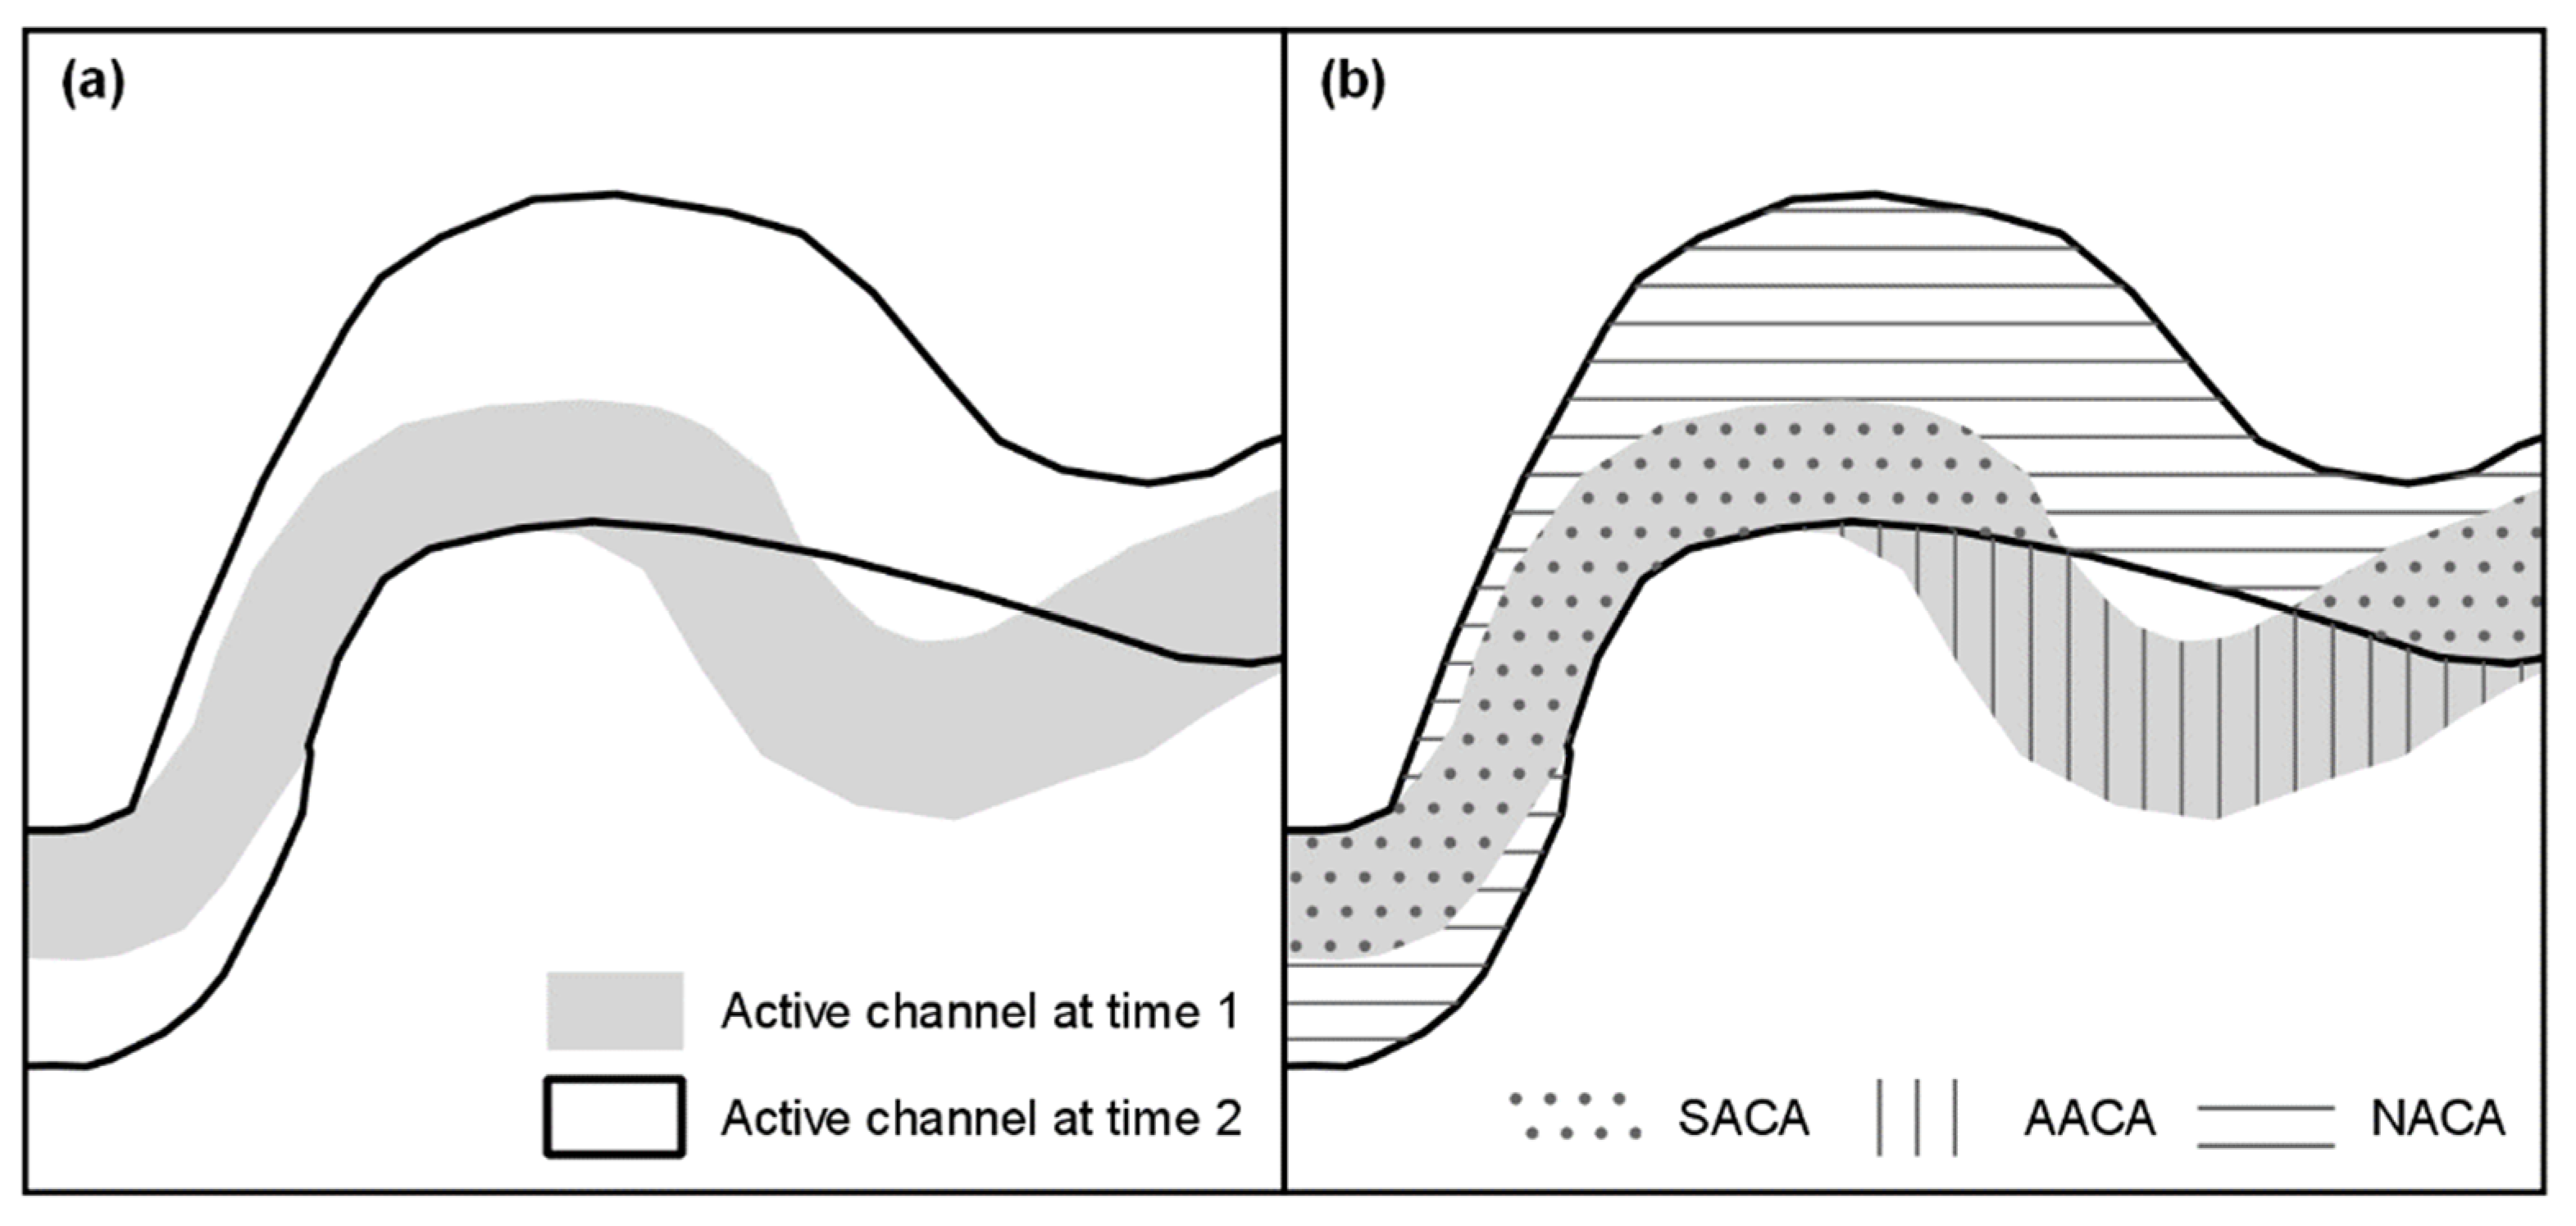
3.4. Active Channel Planform Changes Analysis

At the reach scale, a number of traditional parameters were computed: (i) active channel length (CL); (ii) active channel area (CA); (iii) active channel width (CW), which is defined as the ratio between the CA and CL [42,144,149]; (iv) braiding index (BI) [150,151]; and (i) sinuosity index (SI), defined as the ratio between CL and the length of the straight line merging the active channel centerline endpoints [44,152]. Furthermore, the active channel width changes were measured with respect to the 1930 and 1954 active channel widths using the channel width variation index (ΔW) [15,53] to compare different reaches. This parameter is defined as follows:
ΔW (%) = (CW/CWref × 100) − 100
where CWref is the CW at the reference time; namely, in 1930 and 1954 in this case.
Active-channel planform migration was assessed through specific indices focusing on the analysis of the active-channel location (Figure 4). The superimposition of two active-channel polygons referred to different times, hereafter called time 1 (t1) and time 2 (t2), allowed for the identification of stable active-channel areas (SACAs; Figure 4a,b). These planform elements were investigated at the reach scale by introducing the active channel abandonment index (CAI), which indicates the amount of abandoned active channel area referred to the oldest active-channel, and the active channel formation index (CFI), which reveals the extent of acquired active channel area referred to the most recent active-channel. These parameters were computed using the following equations:
CAI (%) = −((CAt1 − SACA)/CAt1) × 100
and
CFI (%) = ((CAt2 − SACA)/CAt2) × 100
where CAt1 and CAt2 are the active channel areas at t1 and t2, respectively, while SACA is the area of the stable active channel within the considered period. The CAI and CFI range between 0 and −100% and between 0 and 100%, respectively. The former (latter) is expressed through negative (positive) values to highlight that it denotes a surface loss (acquisition). CFI is an indicator of channel stability, namely, the lowest its value, the widest the active channel at t2 corresponding to the active channel at t1. To facilitate the assessment of computed values, ΔW, CAI in terms of absolute values, and CFI were referred to as very low (≤15%), low (>15% and ≤35%), moderate (>35% and ≤50%), high (>50% and ≤75%), and very high (>75%), considering intervals from the indicator CA2 of the Morphological Quality Index (146–148) and previous studies [15,153].
CAI and CFI classes were put into relation by means of a matrix, by which four different classes of active-channel planform migration were established: I: intense; M: moderate; S: slight; N: no/very slight (Table 2). Therefore, based on the quantitative assessment of both active channel area formation and abandonment processes, this classification scheme allowed the riverbed horizontal migration magnitude to be qualitatively outlined and possibly associated with a prevalent planform process (i.e., riverbed formation or abandonment).
Finally, the abandoned active channel areas (AACAs) and the newly formed active channel areas (NACAs) were identified by superimposing two active channel polygons at t1 and t2 (Figure 4a,b). This was done by considering all available periods and the entire intervals 1930–2020 and 1954–2020. AACAs and NACAs included within the macrochannel were quantitatively assessed through a superimposition procedure to investigate their location with respect to it.

3.5. LULC Change Analysis

The 2020 active channel was superimposed on each of the 1930, 1954, and 1973 active channels, and the abandoned areas, namely, the surfaces converted from riverbed to floodplain, were extracted. The current LULC of these surfaces was mapped through visual interpretation, following the approach adopted for active-channel mapping. The Google Earth image dated back to 2020 was used as a base. Eight LULC classes were considered: (i) urban area (U); (ii) industrial area (I); (iii) transport area (T), including roads, rail networks, and airports; (iv) quarry area (Q), including construction sites, active and abandoned quarries; (v) abandoned man-made area (M), representing periurban areas, abandoned agricultural areas, degraded areas, and partly worked surfaces; (vi) agricultural area (A), including every type of agricultural surface both outdoors and under greenhouses; (vii) natural and seminatural area (N); and (viii) sea (S). Thus, the extent of each LULC class referring to the overall abandoned area in each year considered and the extent of each LULC class included within the macrochannel were computed. The LULC classes were defined according to the local setting, and with the specific aim of assessing the anthropogenic use of riverine areas, the periods for comparison were chosen to investigate the LULC changes associated with the active-channel major planform adjustments.

4. Results

Seven homogeneous reaches, three of which along the Arroscia (i.e., A1, A2, and A3), two along the Neva (i.e., N1 and N2), and two along the Centa (i.e., C1 and C2), were identified (Figure 1b). Their present-day main morphological features are listed in Table 3.

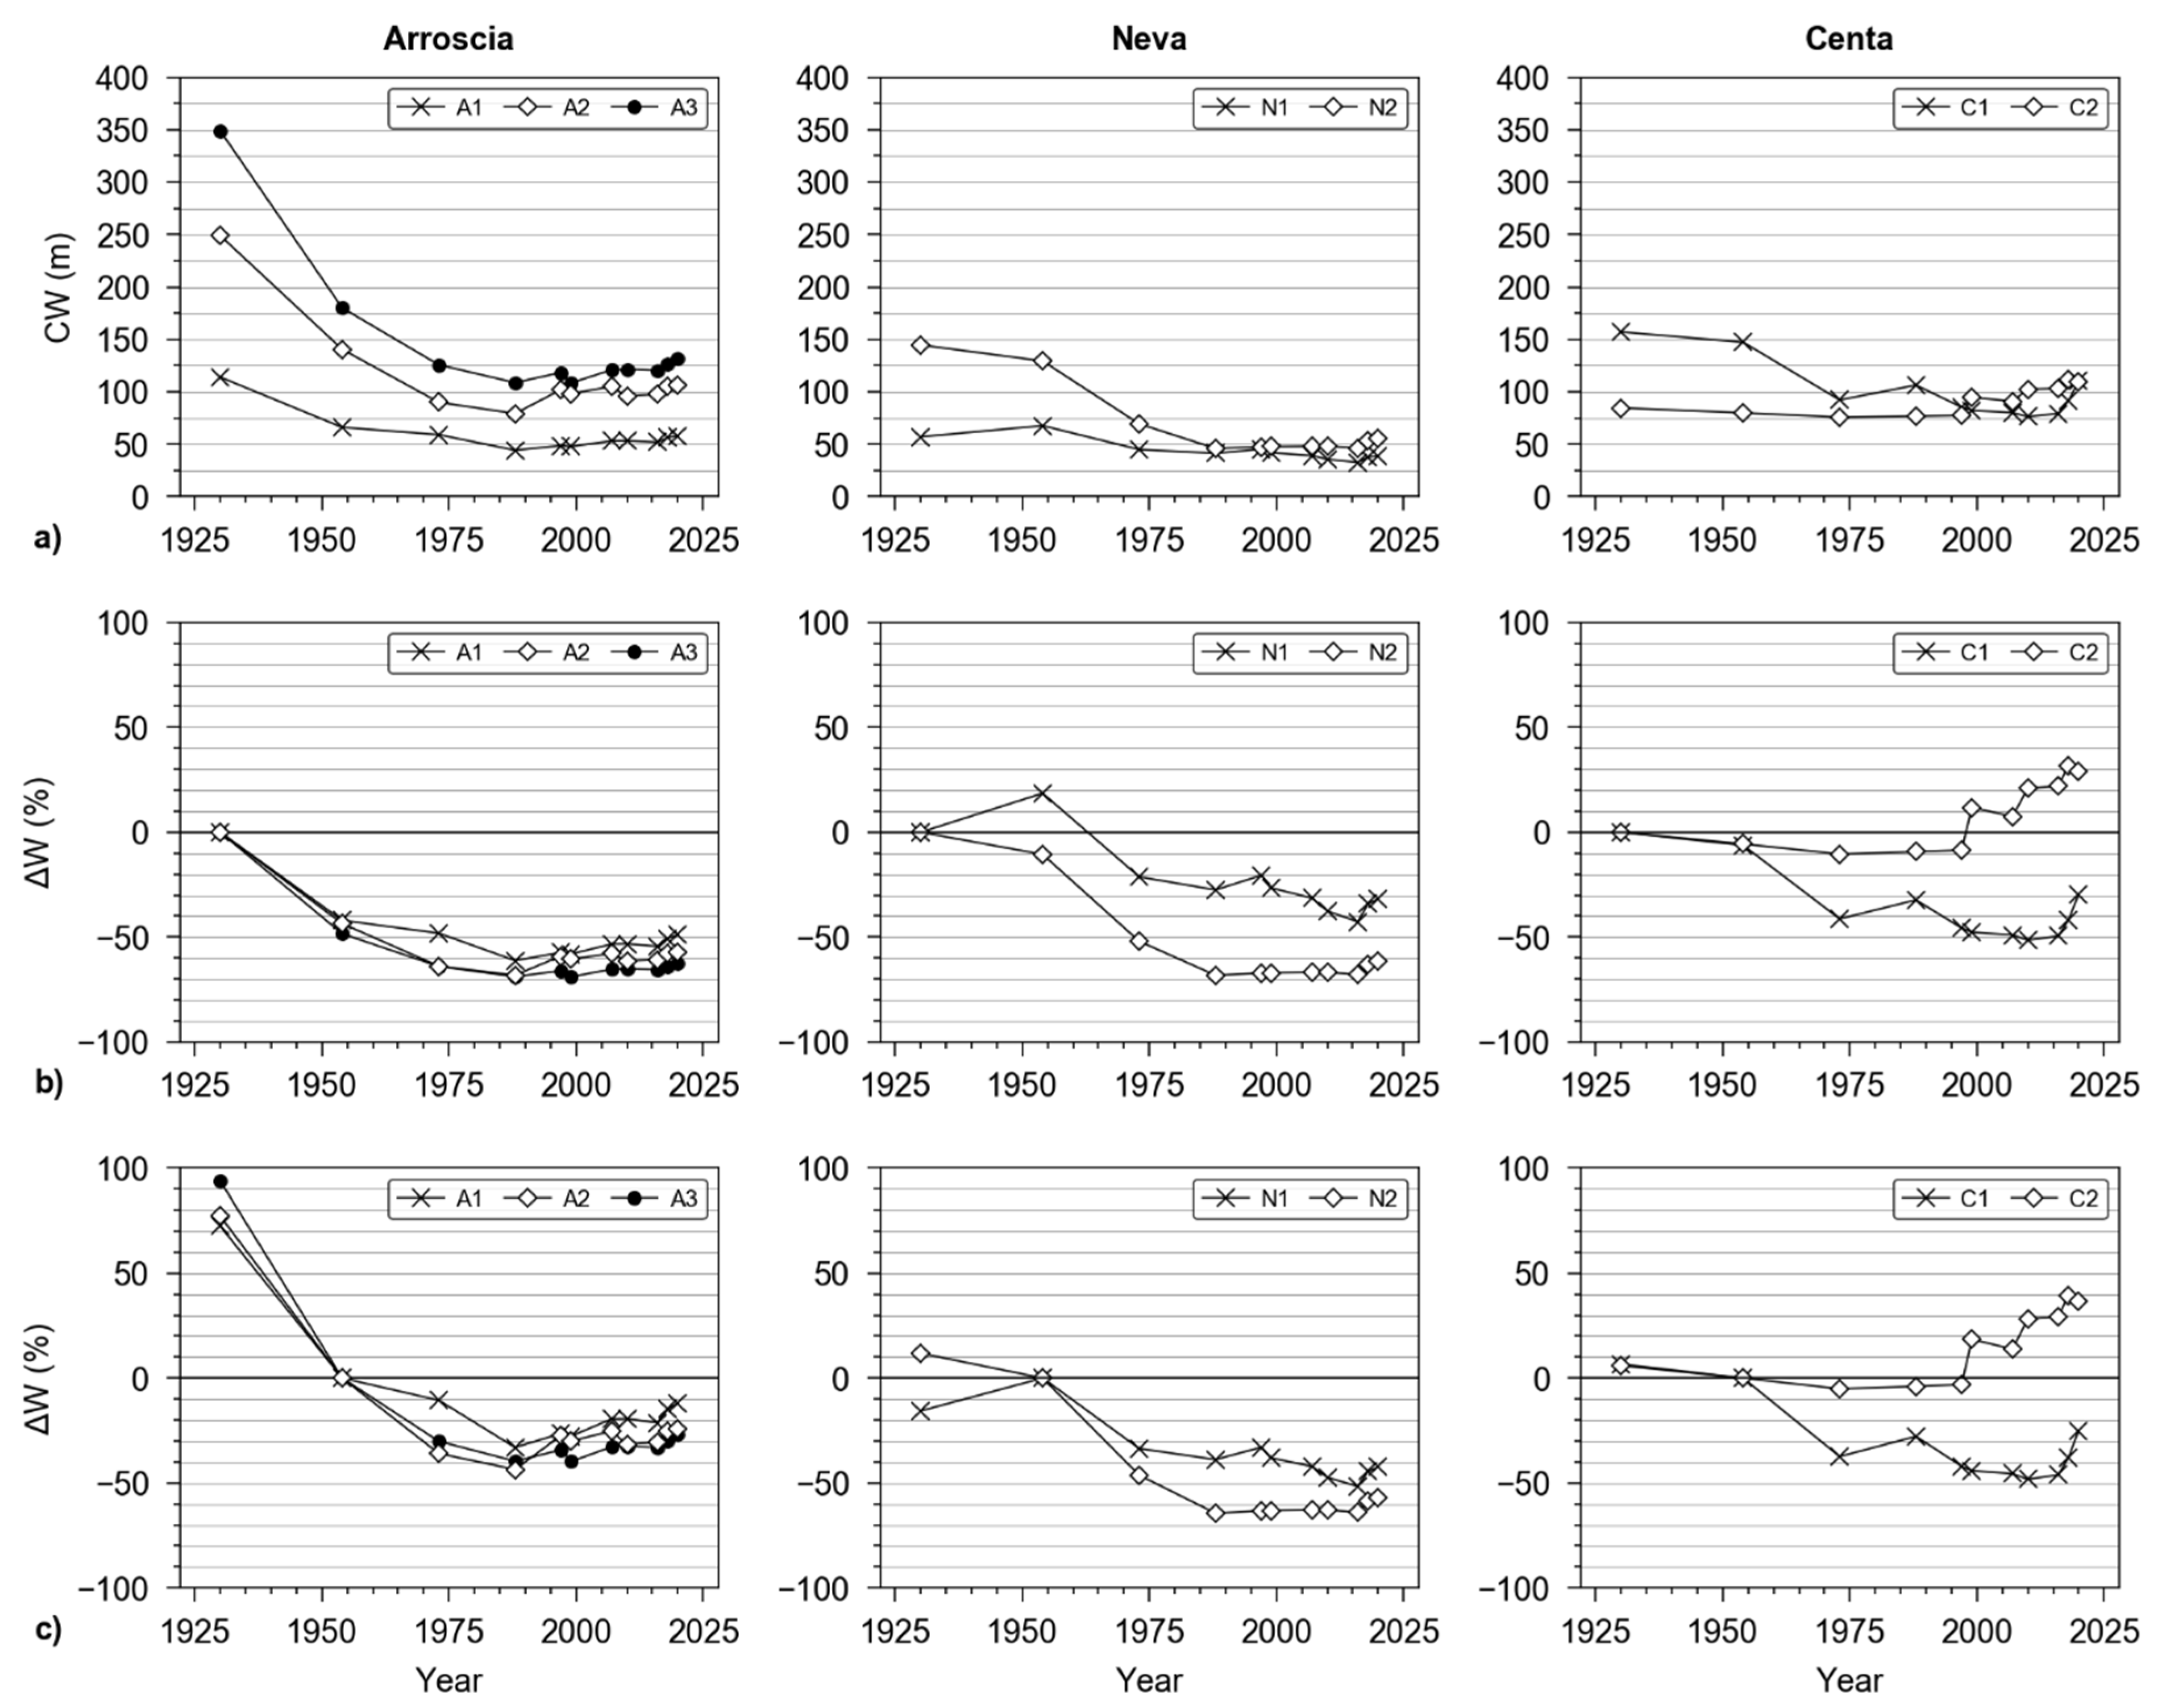
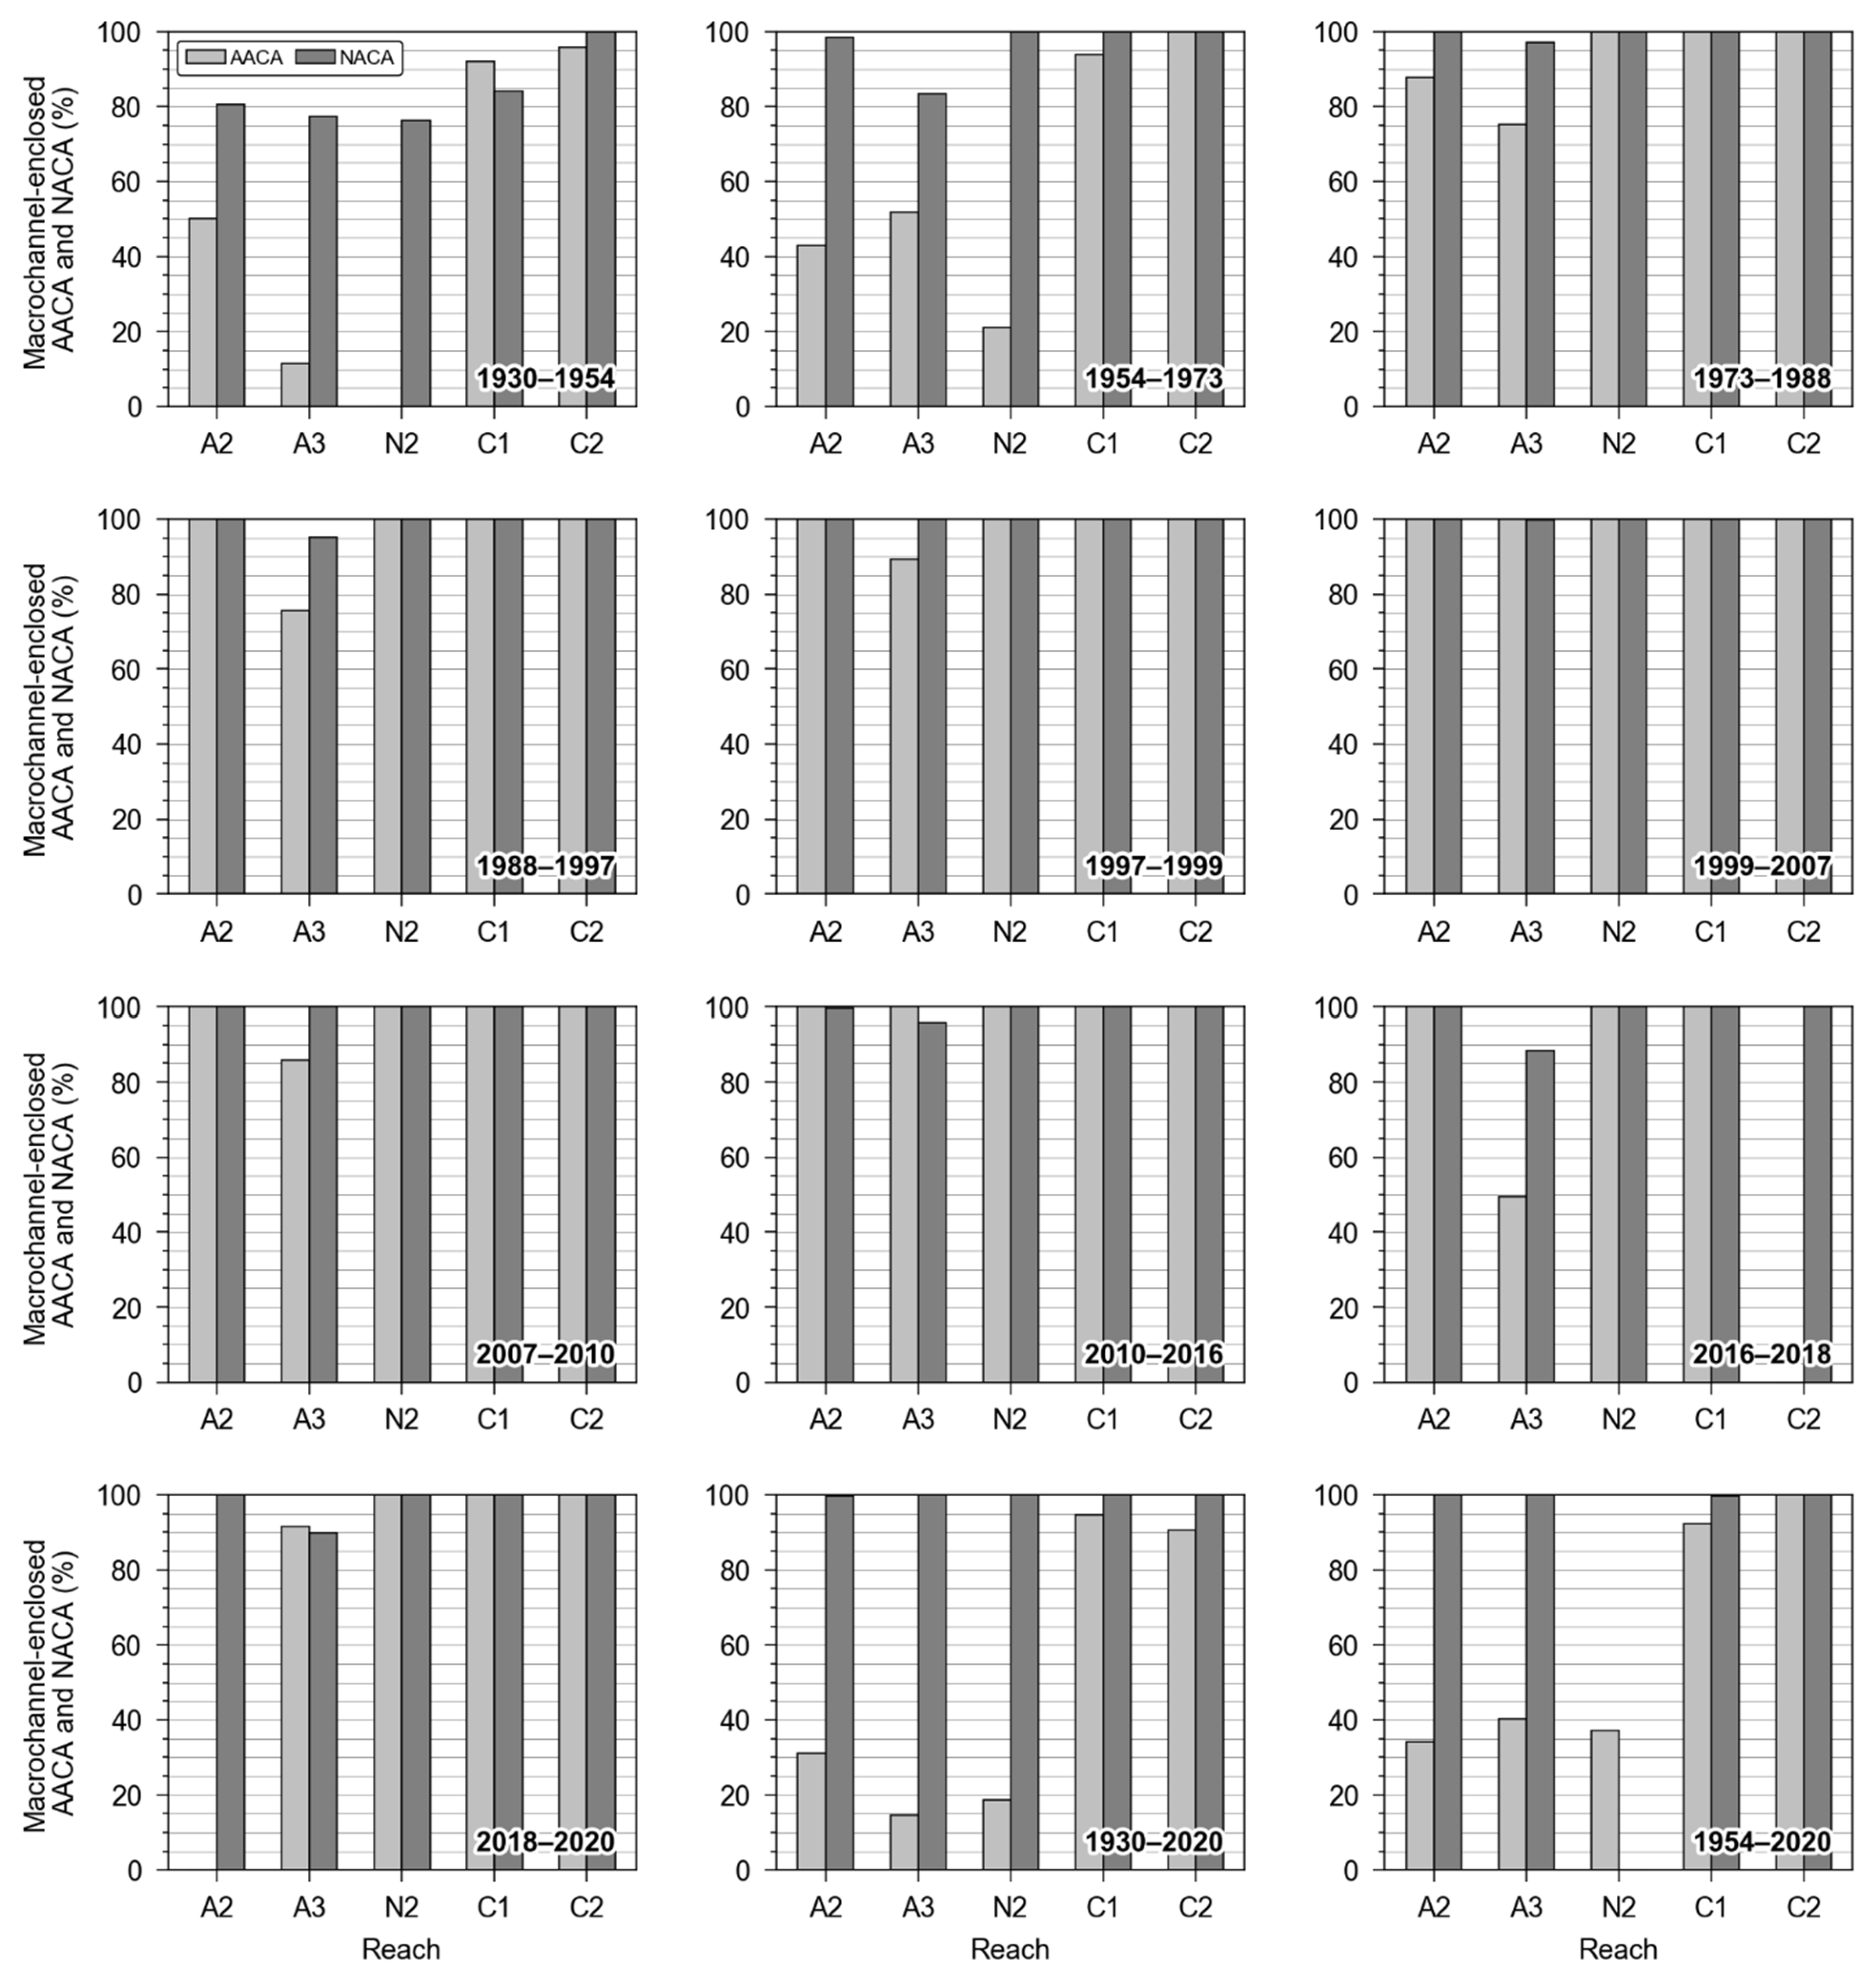
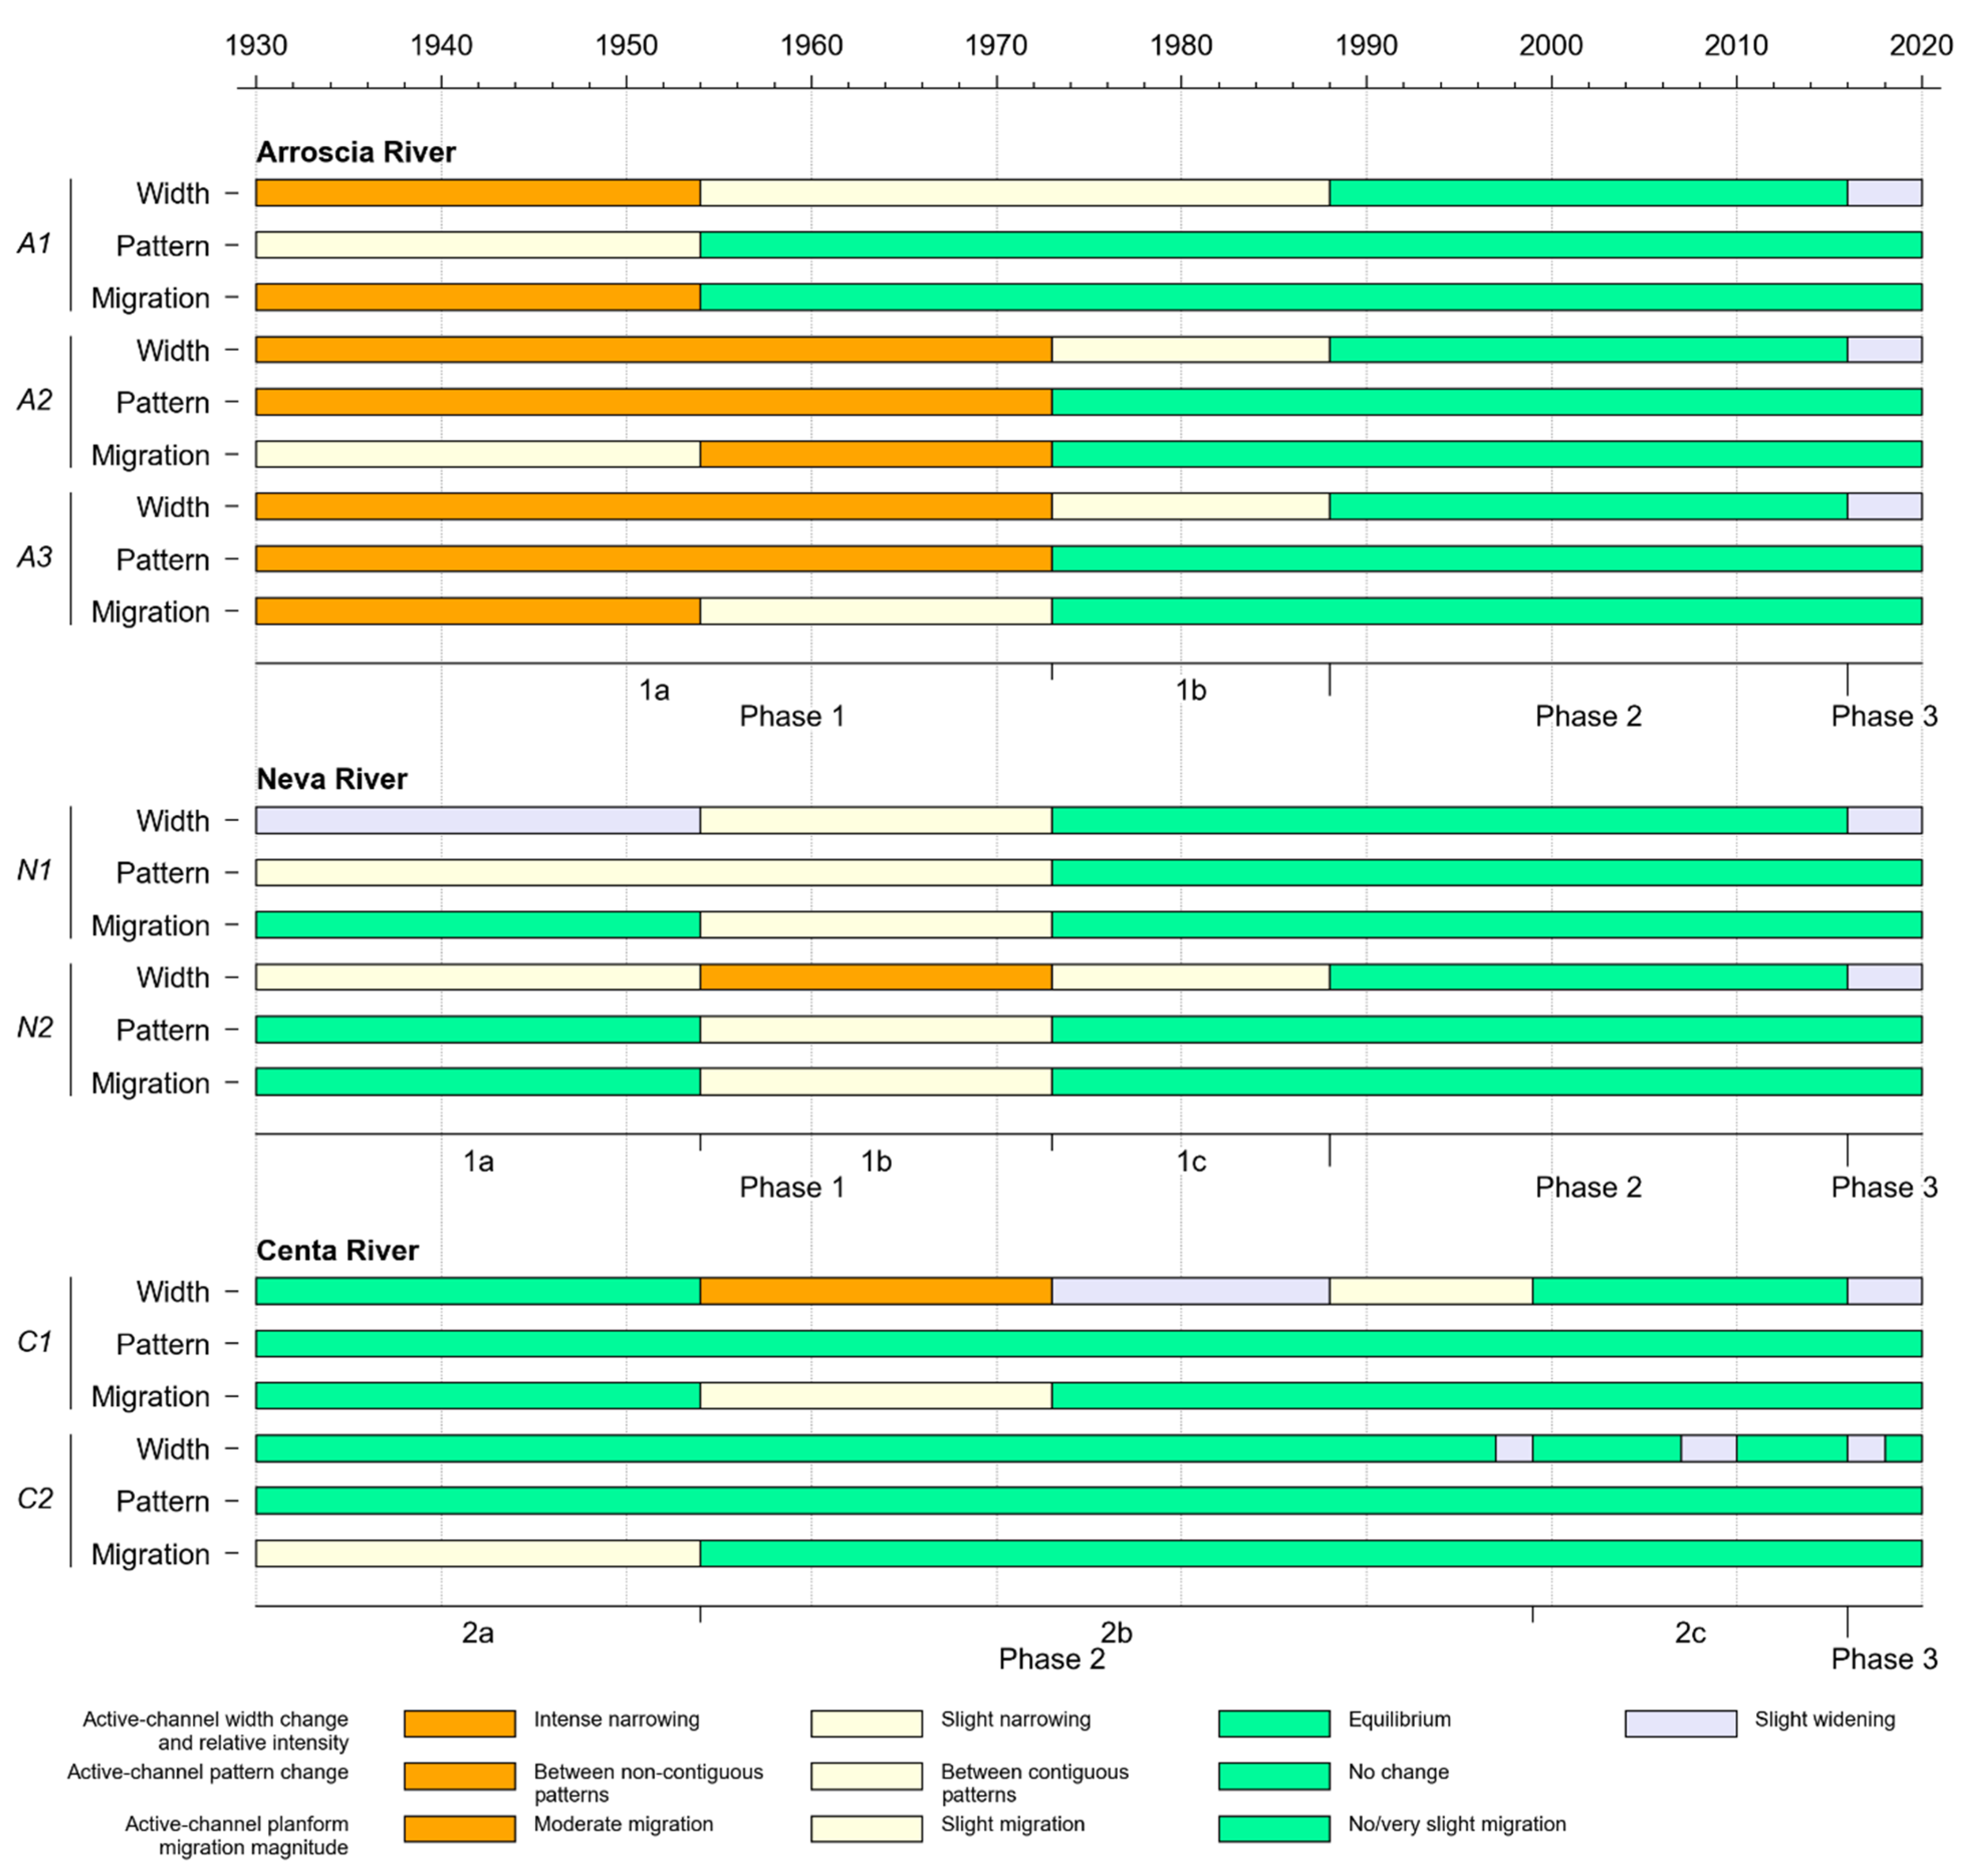
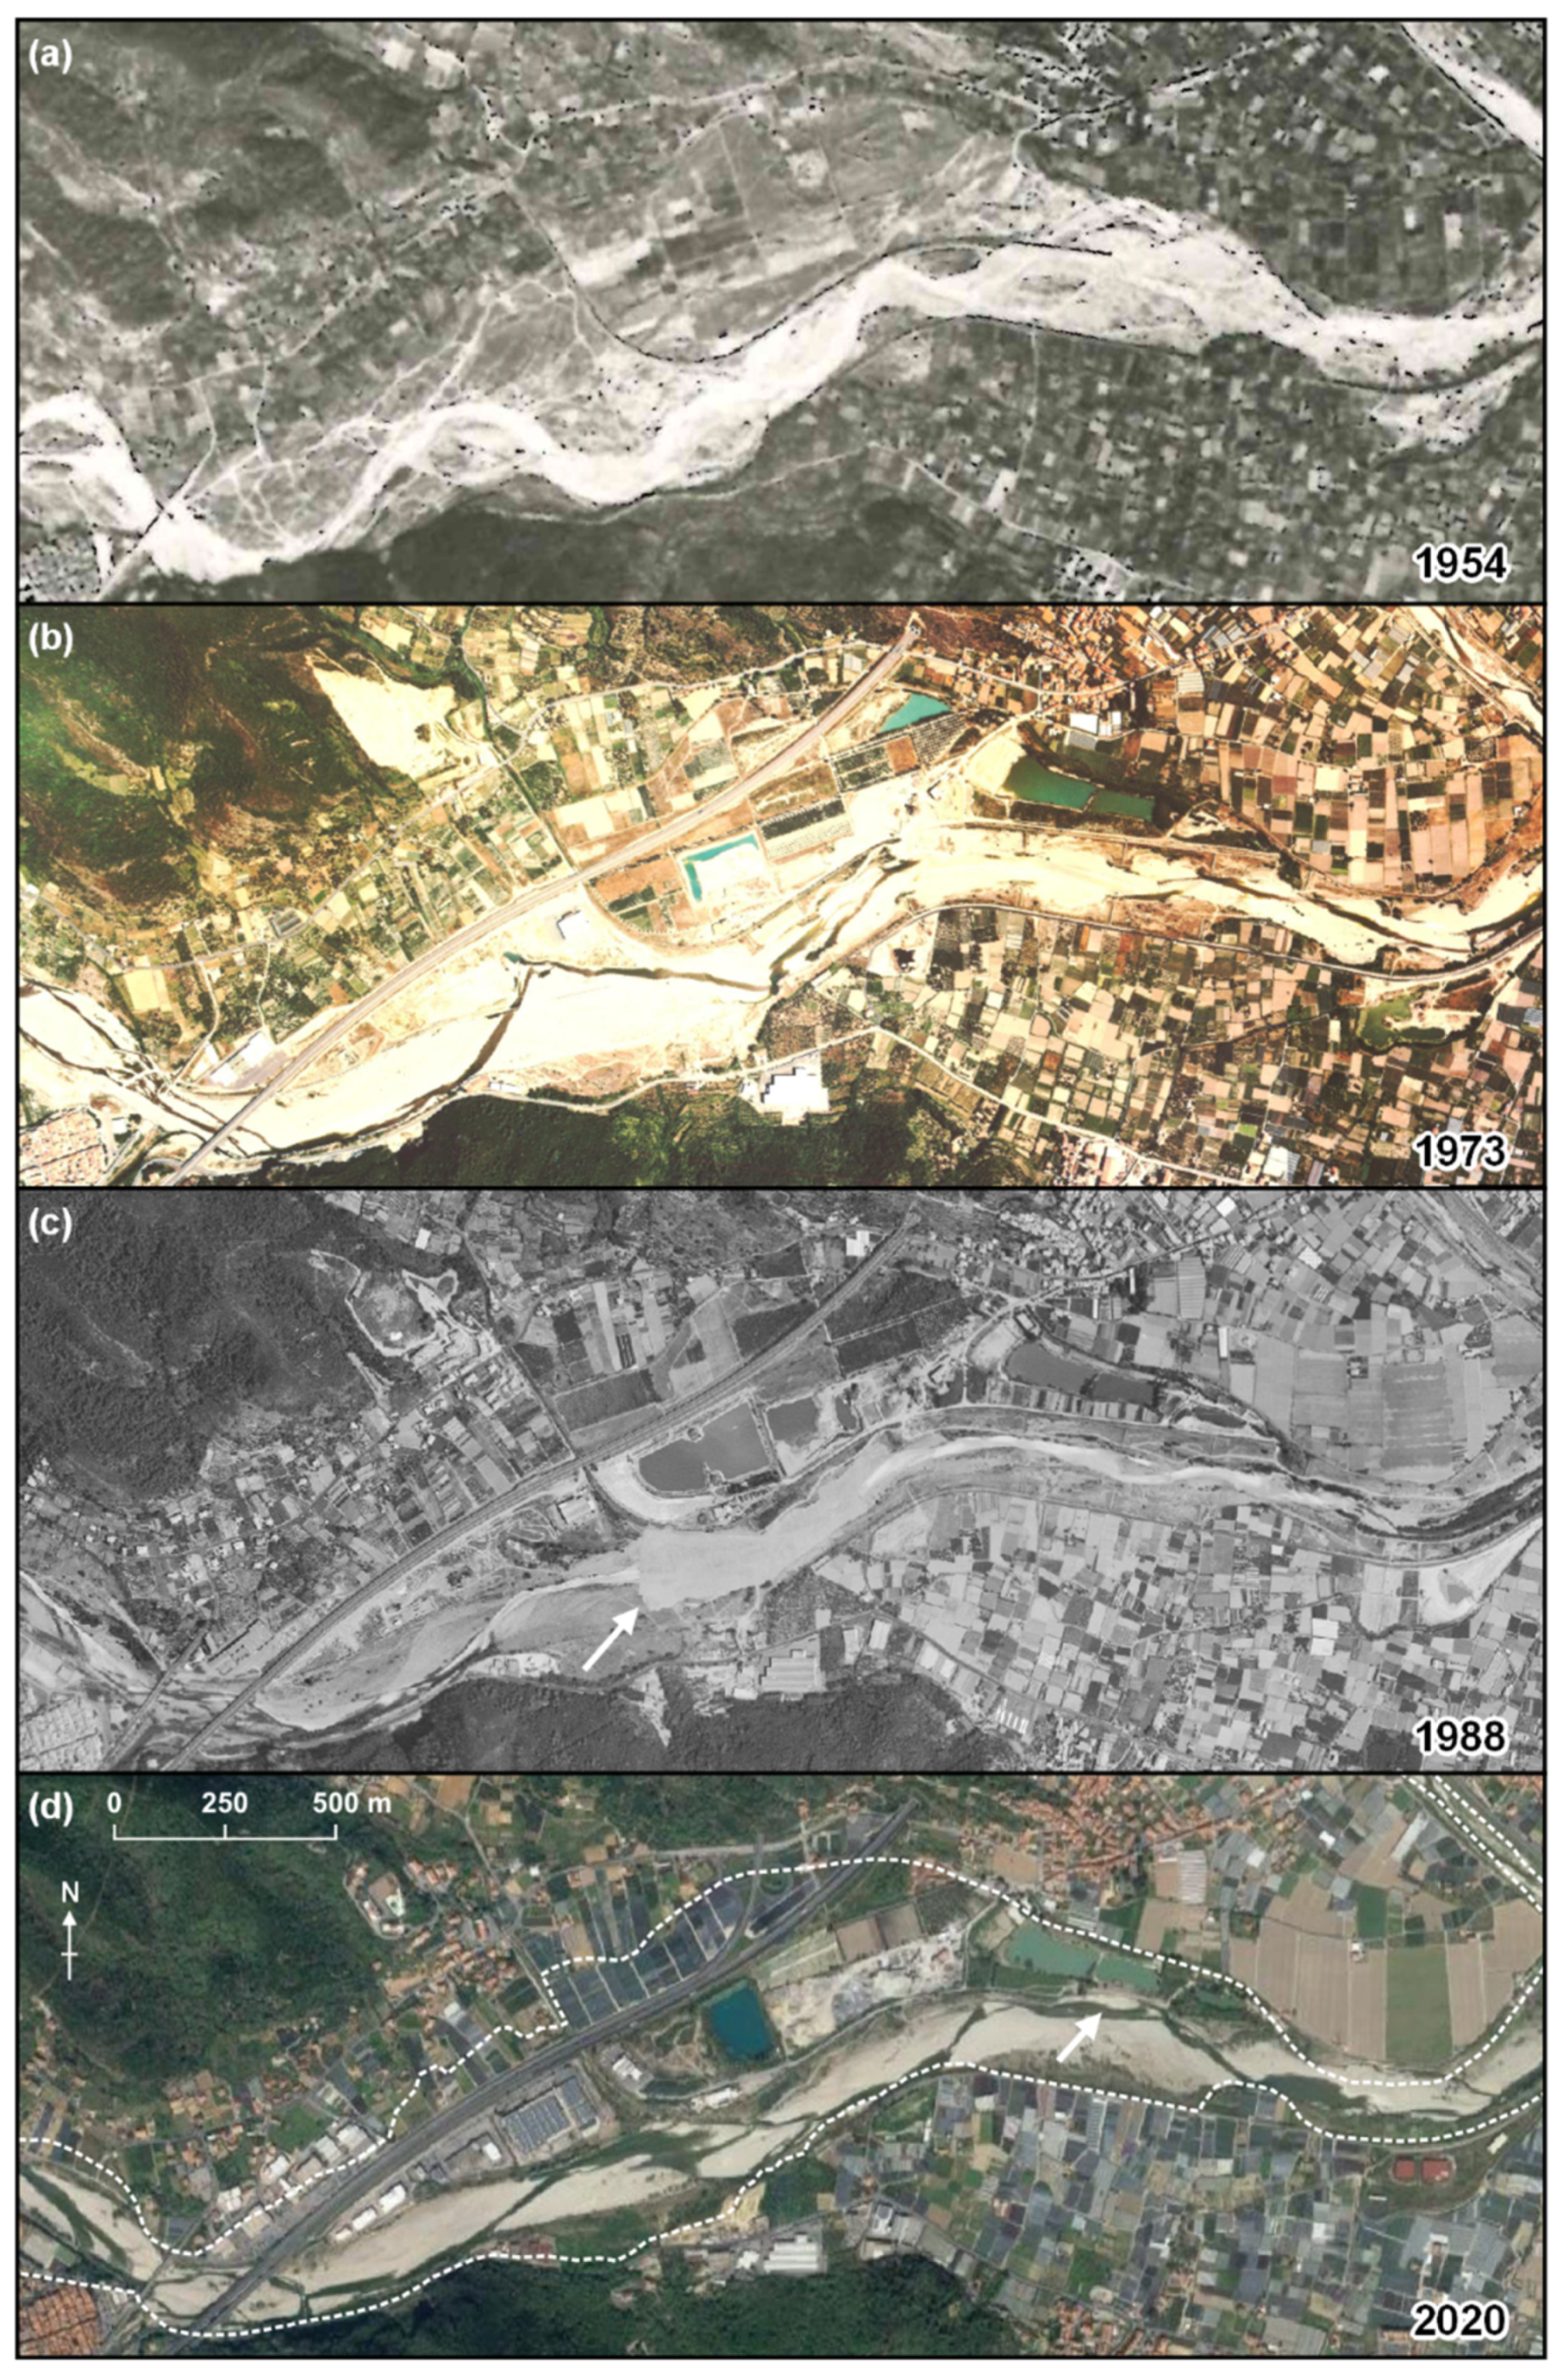
4.1. Active Channel Planform Adjustments

An overall CW reduction was documented from 1930 to 2020, except for reach C2 (Figure 5a). The highest CW variation occurred in reaches A2 and A3, where the CW ranges were 170 and 241 m, respectively. Lower ranges were observed along the other reaches: 99 m in N2, 81 m in C1, 70 m in A1, 36 m in C2, and 35 m in N1. Five of seven reaches showed the highest CW in 1930, and six of seven reaches showed the highest CW in 1930 or 1954. All reaches of the Arroscia experienced narrowing up to 1988. Subsequently, a discontinuous and very slight widening occurred in A2 and A3, while in A1, CW substantially did not change up to 2016. Similarly, N2 showed a CW reduction up to 1988, and no changes were documented up to 2016. In C1, the main narrowing occurred between 1930 and 1973, whereas after that, low fluctuations were observed. Fairly different trends were noticed in reaches N1 and C2. The former experienced very slight changes in CW consisting of widening from 1930 to 1954 and of narrowing up to 1973; then, CW remained overall stable. The latter did not experience changes in CW up to 1997 and then showed a stepped tendency towards widening. Channel widening was observed in all reaches from 2016 to 2018 and thereafter continued in A3 and C1 up to 2020, whereas CW remained constant in other reaches.
Similar ΔWs in terms of both values and temporal trends characterize the Arroscia reaches (Figure 5b,c). In contrast, differences in trends and values exist between N1 and N2 and between C1 and C2. For reaches A1, A2, and A3, the comparison between ΔWs referred to 1930 (Figure 5b) and 1954 (Figure 5c) highlighted that after the respective reference year (i.e., 1930 and 1954), the former mainly assumed high values, whereas the latter low values. In reach N1, 1930- and 1954-referred ΔWs were mainly low and moderate, respectively, because widening occurred between 1930 and 1954. Such changes were not observed in reaches N2, C1, and C2, as no relevant active channel width variations occurred before 1954.
In general, high and moderate ΔWs were noticed after 1954 in reaches N2 and C1, respectively, and very low values were observed overall in reach C2 up to 1997. Positive and generally low ΔWs were documented in reach C2 after 1997. In 2020, every reach showed a negative value of ΔW with reference to both 1930 and 1954 active channel widths, except for reach C2, which showed low (29.2%) and moderate (36.9%) increases in channel width, respectively. These negative ΔWs referred to 1930 ranged between −62.3% (reach A3) and −29.7% (reach C1), indicating high active channel width variations in three of seven reaches, moderate variations in one of seven reaches, and low variations in two of seven reaches. With respect to 1954, they range between −57.2% (N2) and −12% (A1), denoting high CW variations in one of seven reaches, moderate variations in two of seven reaches, low variations in three of seven reaches, and very low variations in one of seven reaches.
No large CL variations were documented at the reach scale over the investigated period (Figure 6a). The CL range was 40 and 42 m in reaches A1 and N1, respectively, 108 m in A3 and C1, 125 m in C2, 164 m in A2, and 189 m in N2. The most relevant changes are represented by CL increases in reaches N2 and A3 and reduction in C1 from 1930 to 1954. Moreover, a prevalent higher CL in 1954 than CLs in other years in reach A2, as well as a progressive shortening of N2 after 1999 with respective elongation of C1, were observed.
The CL temporal trend in C2 implies river-mouth front shifts and reveals that slight changes within a 107 m range occurred from 1930 to 2020. These variations consisted of 107 m shortening (i.e., shoreline retrogradation at the river mouth) from 1930 to 1954, 32 m lengthening (i.e., shoreline progradation at the river mouth) between 1954 and 1973, and 37 m shortening again from 1973 to 1988. Thereafter, weak fluctuations on the order of some tens of metres, with average values of 1267 m and 1313 m in the periods 1988–1999 and 2007–2020, respectively, were observed. From 2016 to 2018, CL in C2 increased by approximately 40 m. The 2020 CL was longer than the 1930 CL in reaches A1, A2, and N2 by no more than 3.2%. In contrast, CL reductions ranging between 1.6 and 4.3%, referred to the same period, were observed in reaches A3, N2, C1, and C2.
The main direction of reaches did not change over the considered period, and the outlined CL variations were extremely low and did not result in significant SI changes (Figure 6b). Indeed, SI remained constant and equal or very close to one in essentially all reaches during the examined period. Interestingly, large differences among reaches were documented in terms of BI temporal trends (Figure 6c). This parameter significantly decreased in all Arroscia reaches up to 1973; thereafter, low fluctuations were documented in A1 and A2, while in A3, it remained constant and recently displayed a slight increase. Thus, comparing 1930 and 2020, BI reductions of 0.38 in A1, 0.96 in A2, and 0.49 in A3 were observed. Very low BIs, equal or very close to one, were measured along the Neva and the Centa.
Considering SI and BI, the channel pattern in each investigated year was outlined (Figure 6d). The main changes occurred along the Arroscia before 1973. In particular, in reaches A2 and A3 at the turn of the mid-20th century, a general change between noncontiguous channel patterns occurred: in the period 1930–1954, the braided active channel became wandering, whereas between 1954 and 1973, it changed from wandering into sinuous with alternate bars. The other variations were between contiguous patterns. A1 changed from wandering to sinuous with alternate bars in the period 1930–1954; N2 was always sinuous with alternate bars except in 1954, when it was wandering; N2 changed from sinuous with alternate bars to straight between 1973 and 1988. In summary, these outcomes revealed that intense channel-pattern variations affected the Arroscia before 1973, limited changes were observed along the Neva before 1988, and no changes occurred along the Centa.
Between 1930 and 1954 the Arroscia reaches showed high and moderate CAIs, as, on average, −48.8% of the active channel was abandoned (Figure 7). Lower values, on average of −15.7% and −29.0%, were noticed in the Neva and Centa reaches, respectively. Referring to the same period, the newly formed area of the 1954 active channel was low in reaches A1, N1, N2, and C2 and very low in A2, A3, and C1. In the period 1954–1973, CAI was high in A2 and moderate in all Neva reaches, A3, and C1. Low and very low values were observed in A1 and C2, respectively. CFI was never higher than 12.3% (very low), except for A2, in which 27.1% (low) was registered (Figure 7). From 1973 to 1988, low CAIs, ranging between −17.5% and −34.9%, were documented in all Arroscia reaches and in N2, very low in the others; CFI was generally very low, usually with values < 10%, except for a low value (24.5%) observed in C1.
Excluding reach C1, which presented a low CAI in the period 1988–1997, all other reaches experienced very low (rarely >10%) active-channel abandonment from 1988 onwards. A similar result was documented for CFI even if some low values more were noticed. These values of CAI and CFI indicated the substantial lack of relevant active-channel adjustments, in terms of both changes in channel area and horizontal displacements, over the last decades. In the 2016–2018 and 2018–2020 periods, a clear and generalized prevalence of very low/low active-channel area acquisition (CFI between 1 and 17%), associated with the lack of migration (i.e., no abandonment, CAI overall <1%), was noticed.
By examining the long-term active-channel comparison, in the period 1930–2020, high CAIs (−56.9% in A1, −59.1% in A2, and −65.1% in A3) and very low/low CFIs (16.5% in A1, 6.1% in A2, and 6.1% in A3) were documented along the Arroscia. Similar trends were observed along the Neva, with moderate (−41.1% in N1) and high (−64% in N2) CAIs and very low CFIs (12% N1 and 9% N2). Moderate (−35.4% in C1) and low (−15.5% in C2) CAIs and very low (6.1% in C1) and low (31.7% in C2) CFIs characterized the Centa. In the span 1954–2020, the Arroscia reaches showed lower CAIs with respect to the previous period (25% in A1, 50.2% in A2, and 35.5% in A3) and very low (13.9% in A1, 9.2% in A3) and low (31.8% in A2) CFIs. The Neva reaches presented moderate (44.5% in N1) and high (58.9% in N2) CAIs and very low (2.3% in N1 e 0% in N2) CFIs, similar to the 1930–2020 period. The Centa reaches were characterized by low (32.4% in C1) and very low (4.5% in C2) CAIs and low (32.7% in C2) and very low (10.7% in C1) CFIs. Referring to the period 1930–2020, the CAI was high in four of seven reaches, moderate in two of seven reaches, and low in one of seven reaches. In 1954–2020, this parameter was high in two of seven reaches, moderate in two of seven, low in two of seven and very low in one of seven. The CFI was low in two of seven reaches and very low in five of seven reaches in both the aforementioned periods.
In general, CFI was always low and very low, never >27.1% in each of subsequent periods nor >32.7% in periods 1930–2020 and 1954–2020 (Figure 7). In terms of absolute values, the highest CAIs were 56.2% referring to the former periods and 65.1% referring to the latter.
The reach-scale active-channel planform migration based on the combination of CAI and CFI is shown in Table 4. All classes different from no/very slight migration, namely, moderate and slight, were registered up to 1973 and reflected the occurrence of migration processes associated with the abandonment of active-channel area. In the period 1930–2020, four of seven reaches showed moderate planform migration, two of seven showed slight planform migration, and one of seven showed no/very slight planform migration. Considering the period 1954–2020, these values changed into two of seven reaches experiencing moderate planform migration, two of seven reaches experiencing slight planform migration, and three of seven reaches experiencing no/very slight planform migration.
Referring to reaches A2, A3, N2, C1, and C2, most of the active-channel horizontal displacements occurred within the macrochannel (Figure 8). From 1930 to 1973 and 1988, N2 and the Arroscia reaches, respectively, showed the greatest variability in AACA and NACA, suggesting that large active channel portions were abandoned out of the macrochannel and that most of the newly formed surfaces were within it. Null AACA values correspond to no AACA both within the macrochannel and outside it, except for N2 in 1930–1954 in which 20.7% of the active channel was abandoned (Figure 7), but only 0.1% of the AACA was within it. Planform dynamics remained totally enclosed within the macrochannel from 1988 onwards, except for A3.
With reference to the overall long-term periods 1930–2020 and 1954–2020, it is evident that the Centa planform adjustments occurred almost completely within the macrochannel and that NACA is totally included within it in almost all reaches. The only exception is represented by N2 in the period 1954–2020, in which no NACA both within and out of the macrochannel was observed.

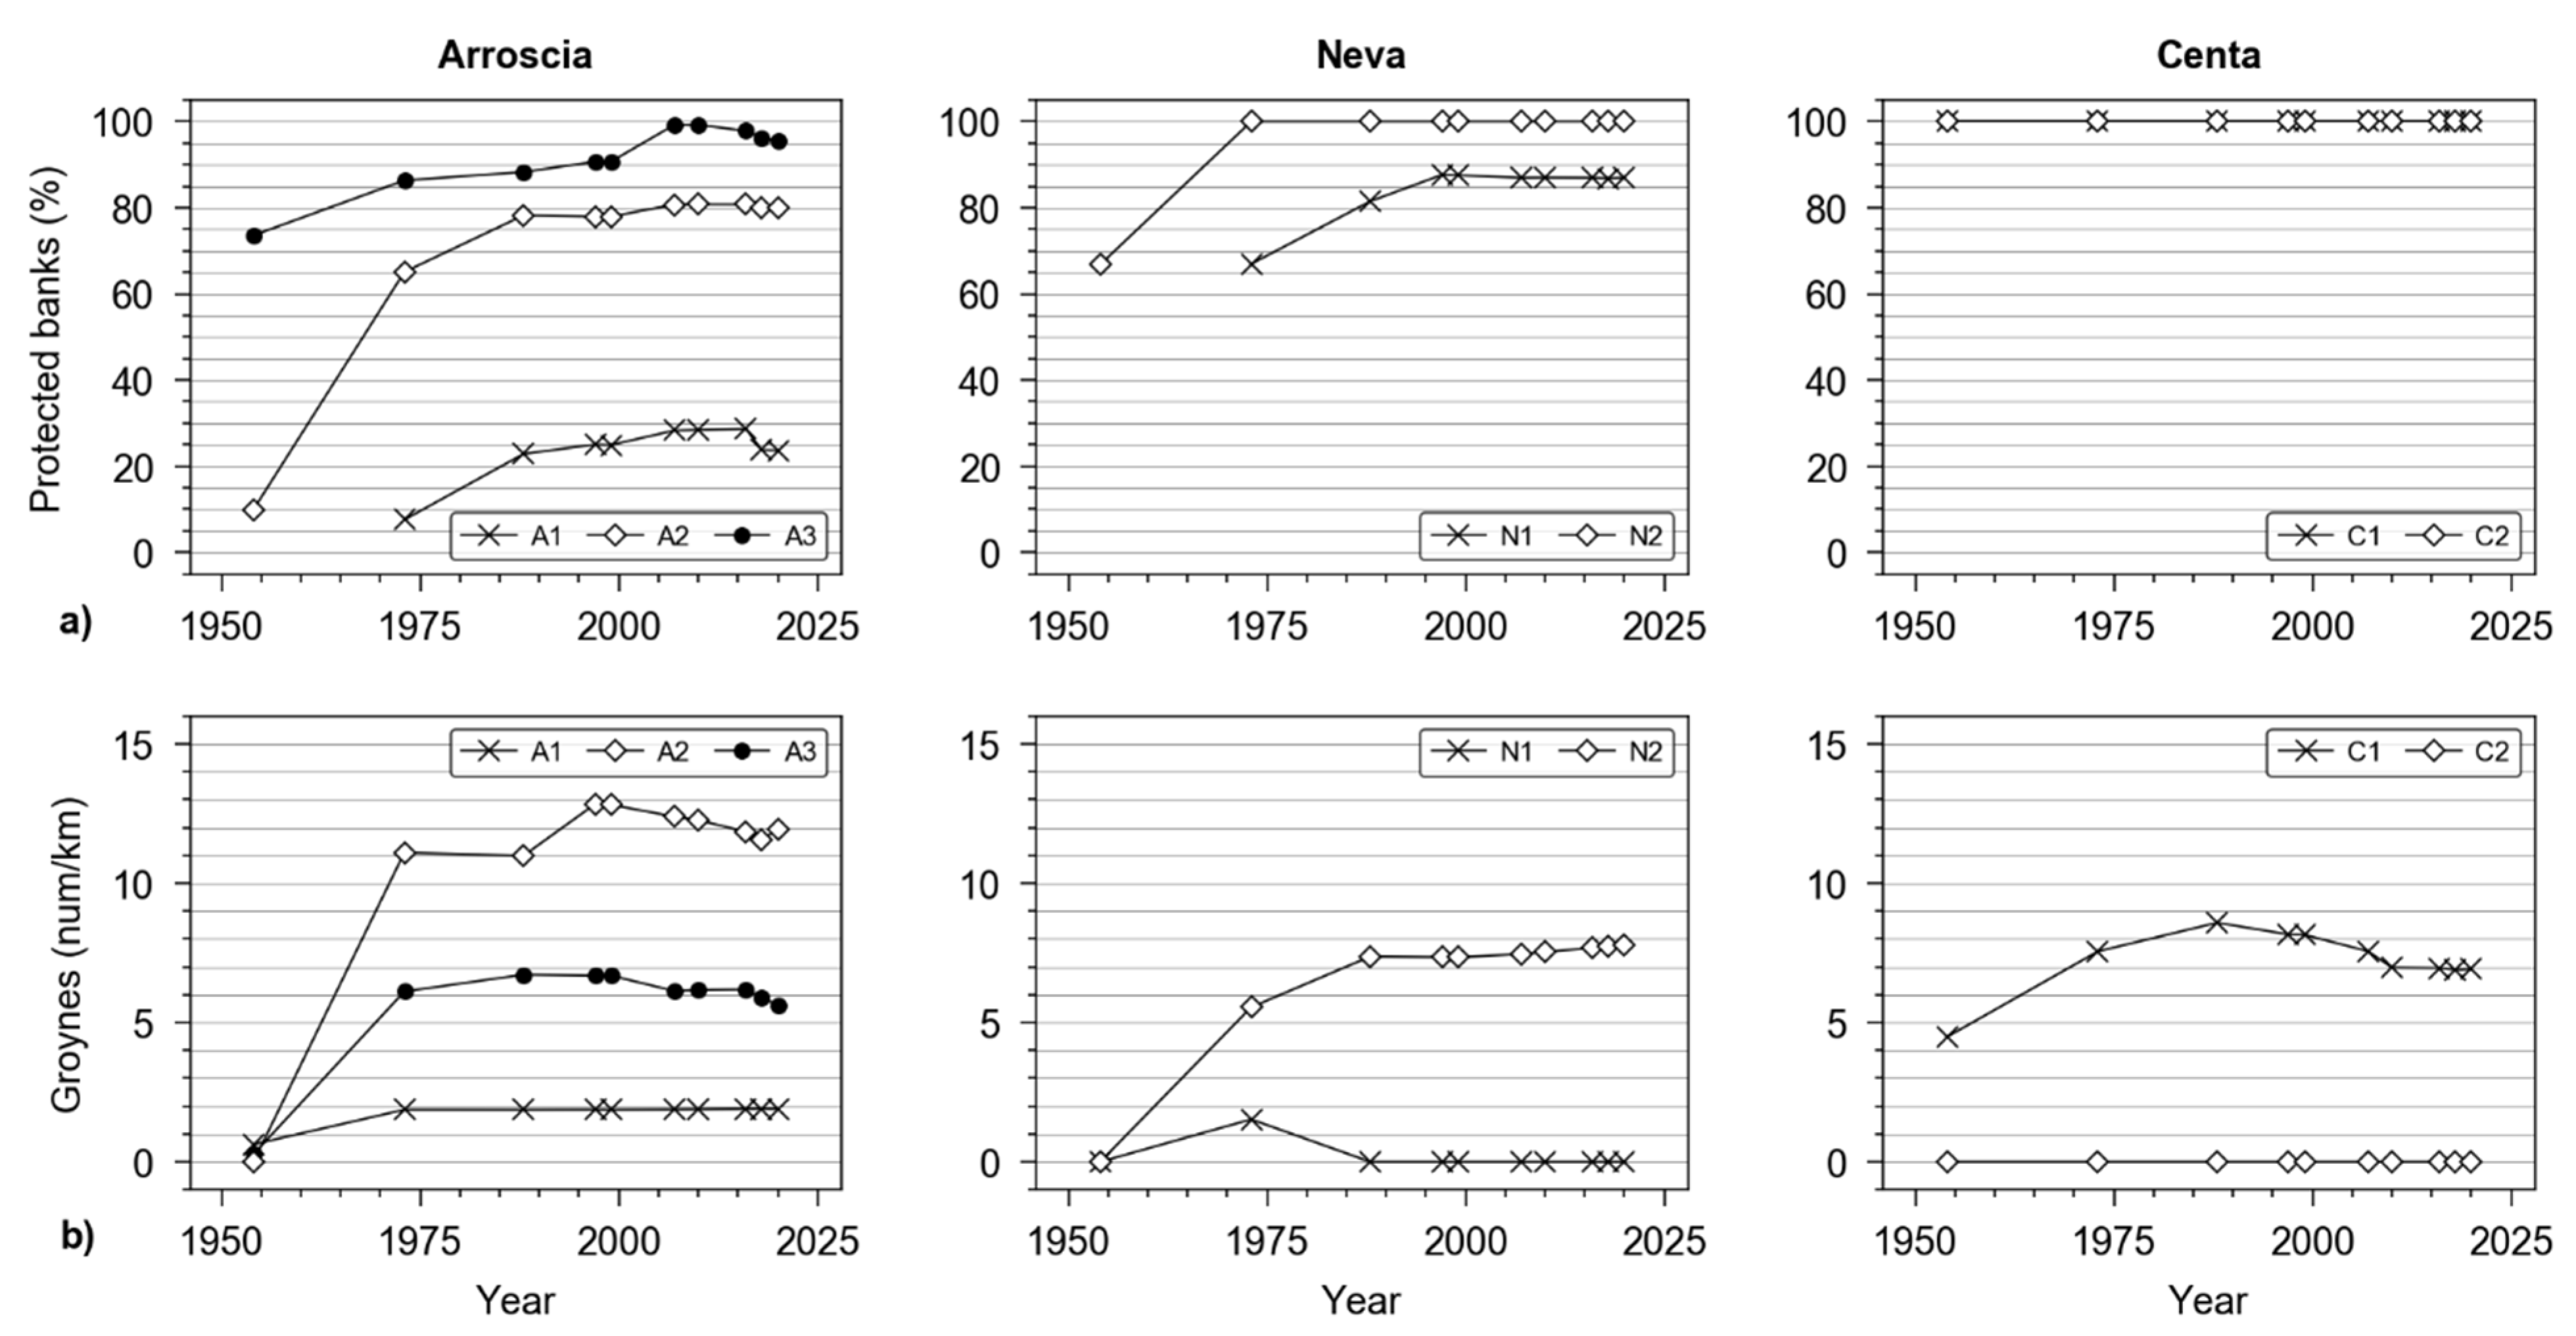
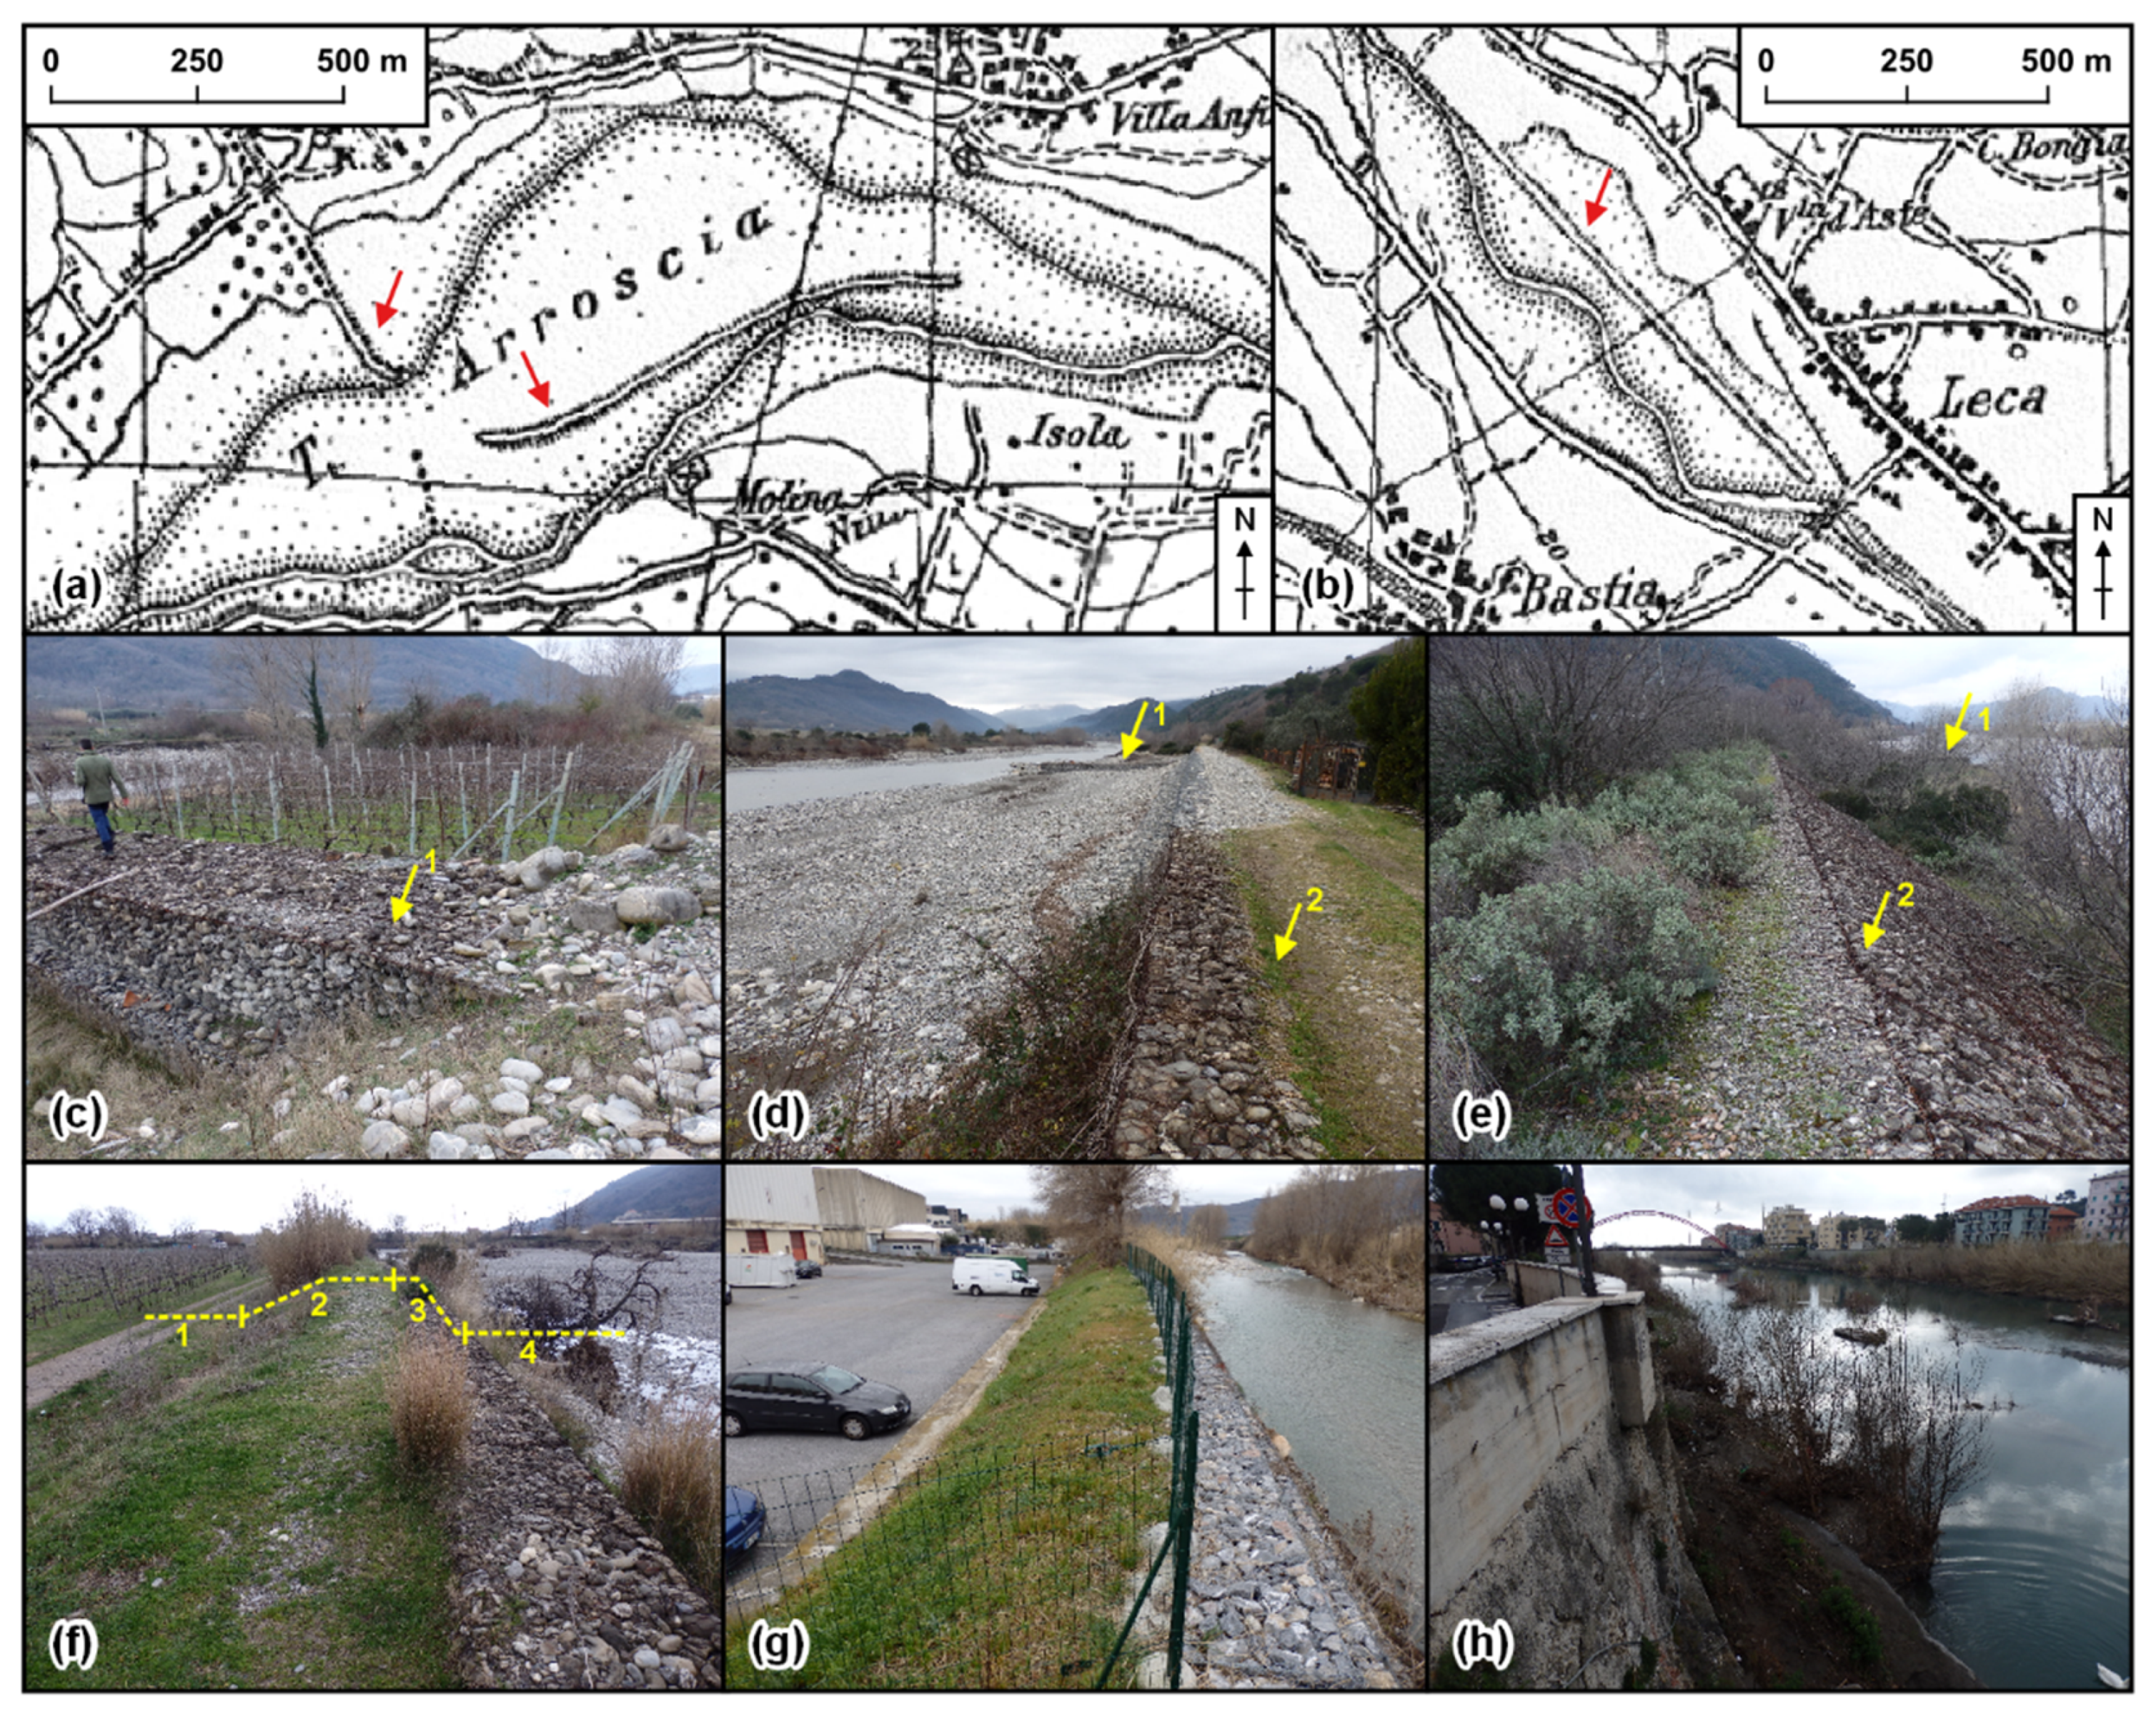
4.2. Channelization Works
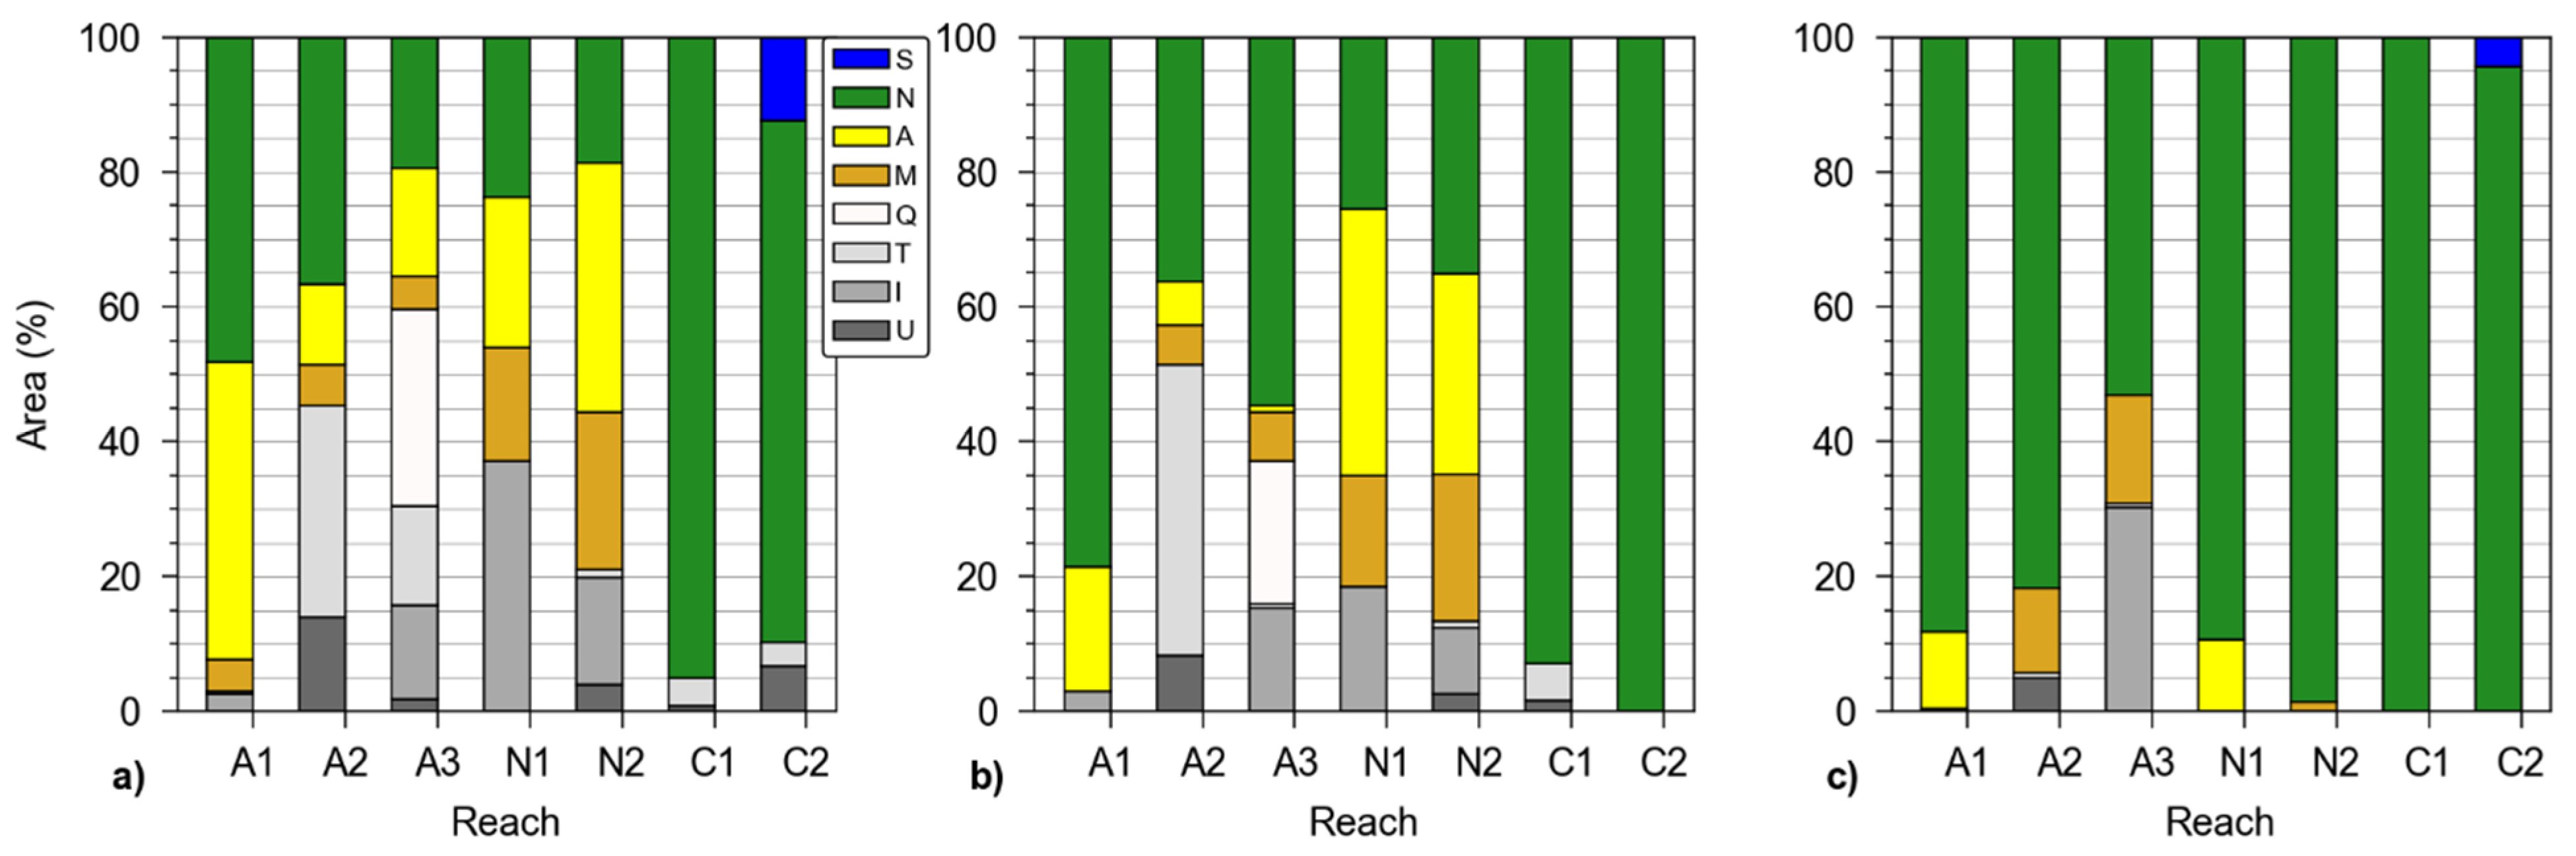
The longitudinal bank protection extent ranged between 8% and 29% in reach A1, 10% and 81% in reach A2, and 74% and 99% in reach A3 (Figure 9a). From 1954 to 1988, an increase was evident along the Arroscia, especially in reach A2, where a marked variation from 10% to 78% occurred. After 1988, overall stability was documented, except for the period 1999–2007, when a slight increment affected all reaches of the Arroscia. Moreover, in A1 and A3, a very low reduction in longitudinal defences was noticed from 2016 to 2018 and from 2016 to 2020, respectively. In reach N1, a relevant increase (i.e., from 67% to 88%) was documented only between 1973 and 1997. Similarly, reach N2 experienced an increase from 67% to 100% in the period 1954–1973, after which there were no changes. The Centa banks were completely covered by protections in 1954, and nothing had yet changed. Currently, five of seven reaches are affected by very high (>87%, in three reaches = 100%) percentages of longitudinal bank protections, while they are high (80%) and low (24%) in reaches A2 and A1, respectively.
The highest values of groyne density were noticed in reaches A2, A3, N2, and C1 (Figure 9b). In all Arroscia reaches, an increment was observed from 1954 to 1973. In this period, the number of groynes per km changed from 0 to 11.1 and from 0.3 to 6.1 km−1 in reaches A2 and A3, respectively. Fluctuations were observed after 1973 in reaches A2 and A3, where a slight decreasing trend was observable after 2000. Conversely, no changes were documented in A1. No groynes affected reach N1, except in 1973. In reach N2, the groyne density changed from 0 to 7.4 km−1, between 1954 and 1988 and then it remained rather constant. C1 is the only reach already affected by a certain number of groynes in 1954 (4.5 km−1). Subsequently, an increment occurred up to 1988, while a decrease (i.e., from 8.6 to 7 km−1) was registered between 1988 and 2010. After 2010 no changes were observed. C2 was never affected by groynes between 1954 and 2020. In 2020, the highest groyne density was observed in reaches A2 (11.9 km−1), N2 (7.8 km−1), C1 (6.9 km−1), and A3 (5.6 km−1), whereas the lowest values were documented in reaches A1 (1.9 km−1), N1 (0 km−1), and C2 (0 km−1).

4.3. LULC Changes

The assessment of LULC variation in the 1930 active-channel abandoned areas highlighted relevant differences at the reach scale (Figure 10a). By grouping M, Q, T, I, and U LULC classes in a single category, the entire artificial area can be considered. This was quite low in reaches A1 (7.6%), C1 (4.9%), and C2 (10.2%), while in the other reaches, it ranged between 44.3% (N2) and 64.6% (A3), with an average value of 53.6%. The active-channel abandoned areas turned into agricultural areas, especially in reaches A1 (44.2%) and N2 (37.1%). In contrast, this change was not documented along the Centa reaches. Natural and seminatural areas were prevalent in reaches C1 (95.1%) and C2 (77.3%). Lower values were observed along the Neva (approximately 20%) and Arroscia (from 19.5% to 48.2%) reaches.
Very few areas of the 1954 abandoned active channel changed into artificial areas in reaches A1 (3%), C1 (7.2), and C2 (0%) (Figure 10b). In A2 and A3, they were 57.2% and 44.3%, respectively, while in Neva reaches, they were approximately 35%. Agricultural areas mainly developed in A1 (18.4%), N1(39.7%), and N2 (29.8%) but not in A3 and in the Centa reaches. The abandoned active channel evolved into mostly natural and seminatural area in C1 (92.8%), C2 (100.0%), and A1 (78.6%). This LULC change was approximately 36% in A2 and N2 and 54.8% and 25.4% in A3 and N1, respectively.
In the 1973–2020 period (Figure 10c) much more homogeneous data were documented, as the abandoned active channel prevalently changed into natural and seminatural areas. The N class was >80% in six of seven reaches and >88% in five of seven reaches. The overall artificial area was zero or close to zero in all reaches except for A2 (18.3%) and A3 (46.8%). The agricultural area was registered only in A1 (11.4%) and N1 (10.6%). The comparison of the average values of LULC classes identified in each reach and referring to every selected period highlighted a progressive reduction in LULC classes. In fact, they decreased from 4.9 for the 1930–2020 period, to 2.7 for the 1973–2020 period.
Table 5 reports the percentage of each LULC class included within the macrochannel, with reference to the abandoned areas of 1930 (Figure 10a), 1954 (Figure 10b), and 1973 (Figure 10c) active channels. In all considered periods, the N class presented the highest values, generally never <72.6%. In particular, it was never <97.9% in N2, and it ranged between 97.9% and 100.0% in the Centa reaches. These results indicated that most of the N class was included within the macrochannel. In general, the other classes presented very low or null values, namely, they were not included within the macrochannel. Some exceptions were represented by the T class in C2 (22.1%) in the 1930–2020 period, the class A in A2 (43.2%) and U in C1 (100%) in the 1954–2020 period, and the class M in A2 (9.2%) in the 1973–2020 period. The S class areas, when existing, were necessarily located totally within the macrochannel.

5. Discussion

5.1. Data and Metrics for the Analysis of Active-Channel Planform Adjustments

In this study, the traditional approach adopted to obtain the input data, namely, the manual digitizing of the active-channel polygon on maps and remote sensing images in a GIS environment, allowed us to investigate a large area with a high level of accuracy and substantially no costs for data acquisition and processes. On the one hand, this consolidated method was the most suitable and effective. On the other hand, it was the only possible approach to quantitatively assess the medium- and short-term active-channel planform adjustments [11] of the Arroscia, Neva, and Centa rivers for the following reasons: (i) the active channel was too narrow to be investigated by means of freely available satellite imagery whose use is conditioned by the low resolution with respect to the considered object; (ii) the assessment of the medium-term morphological changes implied the need to consider a long time series of data; (iii) this research aimed to perform a low-cost analysis based mostly on freely available data retrieved from public geoportals and free and open source GIS software to be largely replicable; and (iv) the high artificialization of both the alluvial-coastal plain and riverbed along with the need for highly accurate data made the operator-driven photograph interpretation essential to map active channels, bank protections and LULC classes.
Along with traditional metrics that provided a snapshot of the active channel at a specific time (i.e., CL, CA, CW, SI, and BI), ΔW was considered to quantify the variations that occurred with respect to a reference condition; this is particularly useful to make changes more tangible, to compare width changes among different reaches and to implement methods developed for river management purposes [147]. These parameters focus on active-channel planform features and do not consider riverbed horizontal displacements over time. Other metrics are available to investigate active channel shifts, such as migration rate [26,42,44,154,155,156,157,158], migration distance [87,155,156,159,160,161], and cumulative migration [42,44,138,155,162]. They express the horizontal displacement of a linear element, generally the active-channel centerline [42,138] and rarely the bank [45], in absolute terms, thus providing the extent of the occurred shift as a rate or a distance. However, active-channel planform migration may occur in either stable or changing active-channel-width conditions. In the former case, the active-channel centerline migration follows banks migration, reflecting effective active-channel displacement (Figure 11a). Conversely, in the latter case, the active-channel centerline migration conveys the influence of active-channel narrowing or widening; therefore, the measured horizontal displacement could derive from width changes of a substantially stationary riverbed rather than represent proper active-channel lateral migration processes (Figure 11b).
The channel activity and the net channel change [144] are indicators of channel stability and they furtherly express the rate of channel migration and the planform prevalent process, respectively. They indicate the sum of and the difference between, respectively, the area of erosion (formation) and deposition (abandonment) of the active channel per year per unit of longitudinal distance [144]. Although they consider the overall areal variation of the active channel, thus combining both active-channel dimension change and migration, they do not explicitly provide the extent of surfaces involved in the aforementioned processes (i.e., active-channel formation and abandonment). Null or close-to-zero values of net channel change, namely, no prevalence of one of the two processes, could correspond to either no AC area formation and abandonment (i.e., no migration) or large areas of the same extent involved in both processes (i.e., migration). Thus, this parameter must be interpreted considering the channel activity jointly. This issue, along with the unit of measurement, overall makes the use and comprehension of channel activity and net channel change quite complex for nonexperts, particularly from a river management perspective.
In this light, CAI and CFI are introduced because they provide information about the amount of abandoned and formed active channels in a given period at the reach scale. These metrics do not consider time; hence, the comparison of CAI and CFI values of different reaches is appropriate provided that referred to a specific period. Accordingly, it is not completely suitable to compare data among periods of different durations. However, this does not mean that comparison is not possible but that this limit must be considered to avoid misinterpretation. In contrast, these novel metrics are quite easy to understand in terms of meaning and unit of measurement, and the definition of qualitative classes makes their potential for use even broader.
Finally, the combination of CAI and CFI led to the assessment of active-channel planform migration based on active-channel area formation and abandonment. In particular, the proposed classification scheme allowed us to qualitatively define the degree of migration, as well as the potential prevalent planform process in terms of either active-channel area formation or abandonment, at the reach scale and over a specific time span. The integrated use of CAI and CFI along with active-channel width data enabled us to obtain an overall knowledge frame concerning variations in active-channel dimension and location.
The overall method implemented in this study, including metrics, is not limited to specific geographical areas and can be applied to all channel patterns, except in the case of anabranching channels and, in general, in the case the active channel presents islands, namely, the active-channel polygon presents holes. In these cases, CAI and CFI can be considered, but the migration matrix based on their combination (Table 2) cannot as it does not consider in detail island planform dynamics. Moreover, BI should be accompanied by anabranching index [83,148] and total CA and CW, namely, including islands, can be computed [9]. No need for large founding and specific instruments and the comprehensibility of the results represent evident advantages of the method and parameters applied. Furthermore, the outcomes are essential for river management, as they outline the medium- and short-term river morphological evolution. Its knowledge allows ongoing morphological dynamics to be understood and put in perspective, future trends to be predicted, and thus appropriate management measures to be developed [84,85,86,145]. In contrast, (i) the manual digitizing process is rather time-consuming, (ii) riverbeds that are too narrow and densely-covered do not allow digitizing to be performed, and (iii) remote-sensing data availability, in terms of spatiotemporal coverage and adequate resolution, strictly limits the analysis [112,161]. Historical documents and field surveys allow validation of photointerpretation operations and can provide relevant information.

5.2. Active-Channel Morphological Evolution

Considering the spatial distribution, magnitude, and chronology of the documented active-channel planform adjustments, both common trends and notable differences in the morphological evolution of the rivers investigated were noticed. Therefore, different evolutionary phases for each water course were identified (Figure 12).
For Arroscia, from 1930 to 1988 (phase 1), the active channel experienced morphological degradation overall, namely, generalized narrowing, braiding-phenomenon disappearance, and progressive stabilization. In this phase, two sub-phases (i.e., 1a and 1b) were recognized. In the former (1930–1973), the most intense active channel narrowing occurred, and as a result, large riverbed areas were lost; channel planform migration was associated with changes in channel width. In reach A1, a variation between contiguous patterns was observed in the period 1930–1954; in other reaches, contiguous pattern changes in periods 1930–1954 and 1954–1973 resulted in an overall transformation between noncontiguous patterns, namely, from braided to sinuous with alternate bars channels (Figure 12). The latter subphase (1973–1988) was characterized by minor active-channel adjustments, essentially related to slight narrowing. Between 1988 and 2016 (phase 2), no changes in the active-channel dimension, pattern, and location substantially occurred.
Phases 1 and 2 of the Neva morphological evolution are overall in compliance with those of Arroscia, except for some differences noticed in subphase features and chronology between 1930 and 1988 (phase 1). From 1930 to 1954 (subphase 1a), no homogeneous trends were documented at the reach scale, apart from the absence of planform migration. N1 experienced slight widening and pattern change from sinuous with alternate bars to wandering, whereas N2 experienced slight narrowing and no change in channel pattern. Between 1954 and 1973 (subphase 1b), the most relevant adjustments were documented. Pattern changes characterized by the disappearance of braiding phenomena and straightening occurred in reaches N1 and N2, respectively, and slight migration associated with narrowing was noticed. The active channel width decreased especially in N2. In the period 1973–1988 (subphase 1c), no active-channel adjustments were documented, except for a further slight narrowing that affected N2.
Conversely, the Centa experienced a much more stable morphological evolution, namely, no large active-channel planform changes were substantially observed from 1930 onwards. Major active-channel planform adjustments most likely occurred before 1930. For C1, after channel planform stability from 1930 to 1954 (subphase 2a), in the period 1954–1999 (subphase 2b) a notable narrowing up to 1973 was observed and slight widening and narrowing, both supposed to be associated with in-channel bulldozer interventions, were noticed from 1973 to 1988 and from 1988 to 1999, respectively. From 1999 to 2016 (subphase 2c), overall morphological stability was documented again. The two small widening stages registered in C2 just before 2000 and between 2007 and 2010 are both related to anthropogenic works for active-channel enlargement and in-channel bulldozer interventions.
A common morphological trend characterized by riverbed widening was displayed by all reaches from 2016 onwards (phase 3).
A long history of channelization and riverbed anthropogenic variations characterizes the Centa River close to Albenga, as this area has been inhabited since the pre-Roman period [163,164,165]. For the period investigated, some structures are well recognizable on the 1930 map in reaches A3 (Figure 13a), N2 (Figure 13b), and C2. Most likely, discontinuous and localized defences already existed along all reaches for a long time.
According to archival documents and the outcomes from this study, the largest, most generalized, and substantially irreversible channelization works were realized in the 1920s and 1930s, in reaches A3, N2, C1, and C2, and between 1954 and 1973 in reaches A1, A2, A3, N1, and N2. These structures generally had the double function of both erosion and flood prevention; therefore, on the one hand, they narrowed, straightened, and stabilized the riverbed, and on the other hand, they reduced the floodable surface over the valley floor (Figure 13c–h). The Centa appeared completely channelized in 1954, when reaches A3 and N2 presented approximately 70% protected banks, and most likely, some defences already existed in reaches A1 and N1. Between 1954 and 1973, several longitudinal bank protections were built in reaches A2, A3 and N2, and many groynes were realized in all reaches. In N1, eight bed sills, along a stretch approximately 1350 m long, were executed between 1973 and 1988. Moreover, two bed sills were built in the aforementioned period and between 1988 and 1997 in A3.
In this context, the major cause of active-channel low mobility and narrowing was overall identified into the constraints exerted by channelization works for decades [27,166,167,168,169,170,171]. Furthermore, in reaches A1 and N1, low mobility was associated with the proximity of valley sides and terraces [172].
As a result of channelization, large active-channel surfaces remained behind bank protections and were thus excluded from channel dynamics, especially in reach A3 (period 1930–1954) and in reaches A2, A3, and N2 (period 1954–1973). Accordingly, many riverine areas were anthropogenically reshaped.
From the 1930s to the late 1980s, especially after the 1954, the defence-disconnected active channel was progressively occupied mainly by (i) agricultural areas in A1 (Figure 13c), (ii) airports, cultivated fields, and urban fabrics in A2, (iii) agricultural areas, road infrastructures, industrial sheds, and quarries in A3 (Figure 14), and (iv) agricultural and industrial areas in N1 and N2 (Figure 13g). Currently, some areas already allocated to human activities are abandoned and degraded. Over the considered period, the long-term defence-induced stability of the Centa River resulted in substantially scarce active-channel abandoned areas outside the macrochannel, which became transport and urban areas. The urban sprawl of Albenga that occurred during the second half of the 20th century led to the urbanization of most of the floodplain adjacent to reaches C1 and C2.
Urbanization that affected the Arroscia-Neva-Centa alluvial-coastal plain resulted in a progressive increase in vulnerable elements exposed to hydrogeomorphic hazards, particularly in reaches A2, A3, N2, C1, and C2 (Figure 14).
The active-channel planform dynamics characterizing phases 1b of reaches A2 and A3, 1c of N2, and phase 2 of all rivers investigated took place entirely within the macrochannel, where narrow and discontinuous strips of stable land, assimilable to bench, active floodplain, and recent terrace [135], and corresponding to natural and seminatural areas, were cyclically formed and eroded. Thus, although it seemed that large active-channel abandoned areas turned into natural and seminatural areas (Figure 10), these last areas were mostly included within the macrochannel, particularly since the 1970s (Table 5). This outcome highlighted that, at present, there are substantially no natural and seminatural areas outside the macrochannel.
The generalized active-channel slight-to-very-slight widening process that characterized phase 3 was triggered by the November 24th, 2016, high-magnitude flood, which caused damage to bank protections, prevalently groynes, and promoted lateral erosion processes. Bank retreat, mainly associated with undercut bank protection collapses, was widespread in reach A1, in which it involved natural and seminatural areas located on the recent terrace. In N1, minor effects were documented, and the active channel substantially reshaped narrow strips of recently formed or incipient active floodplains and benches. In the other reaches, channel widening occurred completely within the macrochannel, thus involving the aforementioned natural and seminatural areas developed between bank protections. The localized lateral erosion process in A3, resulting from the collapse of erosion- and flood-defence structures that affected former quarries and caused the flooding of a large area, is the only exception (Figure 14d).
Floods occurred after 2016, especially the 2–3 October 2020 extreme event, exacerbated these processes and highlighted the vulnerability of the floodplain system, where there are substantially no rooms for river dynamics left.
Changes in length in reach C2 revealed that the river-mouth front moved within a 100-m-wide belt defined by the 1930 and 1954 shoreline locations. The marked retrogradation measured from 1930 to 1954 was most likely mainly triggered by in-channel sediment quarrying activity [72,173]. Hereafter, slighter fluctuations towards overall progradation occurred. The advance of the Centa mouth observed in the period 2016–2018 is most likely associated with the occurrence of the November 2016 high-magnitude flood.
The outlined morphological evolutionary phases related to the active-channel planform adjustments correspond to the common medium- and short-term morphological evolution of Italian rivers only partially [9,15,34,53]. This last presents two phases of channel degradation that lasted approximately from the late 19th century to the 1950s and from the 1950s to the 1990s. They were characterized by multi- to single-thread channel pattern variation and slight (the former) and severe (the latter) active-channel narrowing. These phases resulted substantially reversed along the Arroscia and Neva and were not documented along the Centa. Furthermore, an inversion of the channel-degradation tendency consisting of active channel widening was documented along several Italian rivers after the most intense narrowing phase, namely, on average, at the end of the 1990s [9,14,15,34,45]. Conversely, all the Arroscia, Neva, and Centa reaches underwent a period of marked planform stability from the late 1980s to 2016. After 2016, channel widening, triggered and fostered by the occurrence of high-magnitude floods, became the dominant process, as documented in other cases [14,34,41,42,44]. Further investigations will be necessary to define whether the current processes represent either a new long-lasting morphological phase or a temporary condition associated with impulsive events. Moreover, future assessment of bed-level changes over time and analysis of natural and anthropogenic controlling factors will lead to display the complete frame concerning the medium- and short-term morphological evolution of the Arroscia, Neva, and Centa rivers.

6. Conclusions

This research outlined the active-channel planform adjustments that occurred along the Centa, the lower Arroscia and the lower Neva rivers since 1930 in terms of active-channel dimension, pattern, and migration, along with the spatiotemporal distribution of channelization works and LULC changes of abandoned active-channel areas over time.
The outcomes revealed that Arroscia and Neva experienced the most relevant active-channel planform adjustments consisting of narrowing, progressive stabilization, and braiding-phenomena disappearance from 1930 to the early 1970s and slight narrowing up to the late 1980s. Between the late 1980s and 2016, generalized active-channel stability was noticed. Conversely, the Centa River was not affected by relevant active channel width changes and substantially did not experience either significant channel pattern changes or lateral migration. All reaches experienced a slight-to-very-slight width increase after 2016. This process was (i) mainly associated with the reacquisition of former active channel areas almost completely included within the macrochannel, (ii) triggered by the November 2016 high-magnitude flood, and (iii) fostered by subsequent events. Further assessments will be necessary to define whether the ongoing widening trend represents either a new long-lasting morphological phase or a temporary condition associated with impulsive events.
The active-channel adjustments outlined reflect the relevant role in conditioning the river morphology and dynamics played by channelization works built in the 1920s and 1930s along the Centa and the Arroscia and Neva at their confluence with the Centa and between the early 1950s and the early 1970s along the Arroscia and the Neva. They narrowed, straightened, and stabilized the riverbed and reduced the floodable surface over the valley floor. As a result, large riverine areas disconnected from the active channel were progressively occupied by human activities and infrastructures from the 1930s to the late 1980s, largely after the early 1950s. The urbanization process that affected the Arroscia-Neva-Centa alluvial-coastal plain resulted in a progressive increase in vulnerable elements exposed to hydrogeomorphic hazards.
The outlined morphological dynamics (i) show significant differences in terms of chronology, type, and magnitude of active-channel planform adjustments with respect to the medium- and short-term morphological evolution of most Italian rivers and (ii) reflect the widespread urbanization of Ligurian major valley floors and the associated riverbed channelization that occurred over the 20th century.
Further analyses focusing on historical and recent bed level changes and on catchment- and reach-scale controlling factors would be appropriate to define the complete frame concerning the medium- and short-term morphological evolution of the Arroscia, Neva, and Centa rivers and predict future morphological dynamics according to different scenarios of management.
The synergistic use of consolidated and innovative metrics allowed the active-channel planform adjustments to be quantitatively assessed in detail. The novel CAI and CFI provided readily comprehensible information on the amount of abandoned and formed active channels in a given period at the reach scale. Additionally, their combination allowed the riverbed horizontal migration magnitude to be outlined and associated with the prevalent planform process in terms of either active channel area formation or abandonment. The introduction of these metrics enlarged the spectrum of available GIS tools for active-channel planform analysis. Furthermore, this research highlighted the great relevance of high-resolution freely available aerial and satellite images and free and open source software to perform repeatable, low-cost, and highly accurate hydrogeomorphic investigations based on long-term remote sensing data. Limitations of this research and the procedure proposed, including metrics, are essentially related to data availability, time-consuming manual digitizing phase, and riverbed morphology suitability. Furthermore, the approach that was adopted for active-channel planform change analysis investigates changes between the dates considered but, necessarily, can only assume a linear transition in the channel position and appearance in the intervening period, even if abrupt changes or reversions of trend could have happened one or more times [161].
The outcomes from this study represent an essential knowledge base for the assessment of hydrogeomorphic hazards and risks and for planning effective and sustainable river management measures to recover the fluvial environment and mitigate river-related risks.

Author Contributions

Conceptualization, A.M., G.P., A.C. and P.B.; methodology, A.M.; investigation, A.M. and G.P.; data curation, A.M.; writing—original draft preparation, A.M. and G.P.; writing—review and editing, A.M. and G.P.; supervision, A.C. and P.B. All authors have read and agreed to the published version of the manuscript.

Funding

This research received no external funding.

Acknowledgments

The authors are grateful to Lola Palmieri, whose Master’s Degree thesis in Nature Conservation and Management resulted in the occasion to realize this study, for archival data collection and review, and Carlo Cavallo (Regione, Liguria, Italy), for sharing materials. They also thank three anonymous reviewers and the academic editor for their constructive comments and suggestions.

Conflicts of Interest

The authors declare no conflict of interest.

References

  1. Baena-Escudero, R.; Rinaldi, M.; García-Martínez, B.; Guerrero-Amador, I.C.; Nardi, L. Channel adjustments in the lower Guadalquivir River (Southern Spain) over the last 250 years. Geomorphology 2019, 337, 15–30. [Google Scholar] [CrossRef]
  2. Gilvear, D.J.; Winterbottom, S.J. Channel change and flood events since 1783 on the regulated river tay, Scotland: Implications for flood hazard management. Regul. Rivers Res. Manag. 1992, 7, 247–260. [Google Scholar] [CrossRef]
  3. Gob, F.; Houbrechts, G.; Hiver, J.M.; Petit, F. River dredging, channel dynamics and bedload transport in an incised meandering river (the River Semois, Belgium). River Res. Appl. 2005, 21, 791–804. [Google Scholar] [CrossRef]
  4. Gurnell, A.; Surian, N.; Zanoni, L. Multi-thread river channels: A perspective on changing European alpine river systems. Aquat. Sci. 2009, 71, 253. [Google Scholar] [CrossRef]
  5. Kiss, T.; Andrási, G.; Hernesz, P. Morphological alteration of the Dràva as the result of human impact. AGD Landsc. Environ. 2011, 5, 58–75. [Google Scholar]
  6. Lapuszek, M. Riverbed erosion estimation in the selected cross-sections of the upper Vistula River. Infrastrukt. I Ekol. Teren. Wiej. 2013, 2, 109–123. [Google Scholar]
  7. Liébault, F.; Piégay, H. Causes of 20th century channel narrowing in mountain and piedmont rivers of southeastern France. Earth Surf. Proc. Landf. 2002, 27, 425–444. [Google Scholar] [CrossRef]
  8. Petts, G.E.; Möller, H.; Roux, A.L. Historical Change of Large Alluvial Rivers: Western Europe; Wiley: Chichester, UK, 1989; Volume 75, p. 355. [Google Scholar]
  9. Surian, N.; Rinaldi, M.; Pellegrini, L.; Audisio, C.; Maraga, F.; Teruggi, L. Channel adjustments in northern and central Italy over the last 200 years. In Management and Restoration of Fluvial Systems with Broad Historical Changes and Human Impacts; Geological Society of America Special Papers; James, L.A., Rathburn, S.L., Whittecar, G.R., Eds.; Geological Society of America: Boulder, CO, USA, 2009; Volume 451, pp. 83–95. [Google Scholar]
  10. Uribelarrea, D.; Pérez-González, A.; Benito, G. Channel changes in the Jarama and Tagus rivers (Central Spain) over the past 500 years. Quat. Sci. Rev. 2003, 22, 2209–2221. [Google Scholar] [CrossRef]
  11. Winterbottom, S.J. Medium and short-term channel planform changes on the Rivers Tay and Tummel, Scotland. Geomorphology 2000, 34, 195–208. [Google Scholar] [CrossRef]
  12. Wyżga, B.; Zawiejska, J.; Hajdukiewicz, H. Multi-thread rivers in the Polish Carpathians: Occurrence, decline and possibilities of restoration. Quat. Int. 2016, 415, 344–356. [Google Scholar] [CrossRef]
  13. Zawiejska, J.; Wyżga, B. Twentieth-century channel change on the Dunajec River, southern Poland: Patterns, causes and controls. Geomorphology 2010, 117, 234–246. [Google Scholar] [CrossRef]
  14. Cencetti, C.; De Rosa, P.; Fredduzzi, A. Geoinformatics in morphological study of River Paglia, Tiber River basin, Central Italy. Environ. Earth Sci. 2017, 76, 128. [Google Scholar] [CrossRef]
  15. Scorpio, V.; Aucelli, P.P.C.; Giano, S.I.; Pisano, L.; Robustelli, G.; Rosskopf, C.M. River channel adjustments in Southern Italy over the past 150years and implications for channel recovery. Geomorphology 2015, 251, 77–90. [Google Scholar] [CrossRef]
  16. Rinaldi, M.; Simoncini, C.; Sogni, D. Variazioni morfologiche recenti di due alvei ghiaiosi appenninici: Il F. Trebbia ed il F. Vara. Geogr. Fis. Din. Quat. 2005, 7, 313–319. [Google Scholar]
  17. Magliulo, P.; Bozzi, F.; Pignone, M. Assessing the planform changes of the Tammaro River (Southern Italy) from 1870 to 1955 using a GIS-aided historical map analysis. Environ. Earth Sci. 2016, 75, 355. [Google Scholar] [CrossRef]
  18. Rovira, A.; Batalla, R.J.; Sala, M. Response of a river sediment budget after historical gravel mining (the lower Tordera, NE Spain). River Res. Appl. 2005, 21, 829–847. [Google Scholar] [CrossRef]
  19. Kondolf, G.M. Hungry Water: Effects of Dams and Gravel Mining on River Channels. Environ. Manag. 1997, 21, 533–551. [Google Scholar] [CrossRef]
  20. Marchetti, M. Environmental changes in the central Po Plain (northern Italy) due to fluvial modifications and anthropogenic activities. Geomorphology 2002, 44, 361–373. [Google Scholar] [CrossRef]
  21. Parrinello, G.; Bizzi, S.; Surian, N. The retreat of the delta: A geomorphological history of the Po river basin during the twentieth century. Water Hist. 2021, 13, 117–136. [Google Scholar] [CrossRef]
  22. Wishart, D.; Warburton, J.; Bracken, L. Gravel extraction and planform change in a wandering gravel-bed river: The River Wear, Northern England. Geomorphology 2008, 94, 131–152. [Google Scholar] [CrossRef]
  23. Brandt, S.A. Classification of geomorphological effects downstream of dams. Catena 2000, 40, 375–401. [Google Scholar] [CrossRef]
  24. Ibisate, A.; Díaz, E.; Ollero, A.; Acín, V.; Granado, D. Channel response to multiple damming in a meandering river, middle and lower Aragón River (Spain). Hydrobiologia 2013, 712, 5–23. [Google Scholar] [CrossRef]
  25. Kondolf, G.M.; Rubin, Z.K.; Minear, J.T. Dams on the Mekong: Cumulative sediment starvation. Water Resour. Res. 2014, 50, 5158–5169. [Google Scholar] [CrossRef]
  26. Shields, F.D.; Simon, A.; Steffen, L.J. Reservoir Effects on Downstream River Channel Migration. Environ. Conserv. 2000, 27, 54–66. [Google Scholar] [CrossRef] [Green Version]
  27. Mandarino, A.; Maerker, M.; Firpo, M. ‘The stolen space’: A history of channelization, reduction of riverine areas and related management issues. The lower Scrivia River case study (NW Italy). Int. J. SDP 2019, 14, 118–129. [Google Scholar] [CrossRef]
  28. Wyzga, B. Changes in the Magnitude and Transformation of Flood Waves Subsequent to the Channelization of the Raba River, Polish Carpathians. Earth Surf. Process. Landf. 1996, 21, 749–763. [Google Scholar] [CrossRef]
  29. Lajczak, A. The impact of river regulation, 1850-1990, on the channel and floodplain of the upper Vistula River, southern Poland. In River Geomorphology; Hickin, E.J., Ed.; Wiley: Chichester, UK, 1995; pp. 209–233. [Google Scholar]
  30. García-Ruiz, J.M.; White, S.; Lasanta, T.; Marti, C.; Gonzalez, C.; Errea, M.P. Assessing the effects of land-use changes on sediment yield and channel dynamics in the central Spanish Pyrenees. Proc. Rabat Symp. 1997, 245, S6. [Google Scholar]
  31. Keesstra, S.D.; van Huissteden, J.; Vandenberghe, J.; Van Dam, O.; de Gier, J.; Pleizier, I.D. Evolution of the morphology of the river Dragonja (SW Slovenia) due to land-use changes. Geomorphology 2005, 69, 191–207. [Google Scholar] [CrossRef]
  32. Piégay, H.; Walling, D.; Landon, N.; He, Q.; Liébault, F.; Petiot, R. Contemporary changes in sediment yield in an alpine montane basin due to afforestation (the Upper-Drome in France). Catena 2004, 55, 183–212. [Google Scholar] [CrossRef]
  33. Bravard, J.P.; Amoros, C.; Pautou, G.; Bornette, G.; Bournaud, M.; Creuzé des Châtelliers, M. River incision in south-east France: Morphological phenomena and ecological effects. Regul. Rivers Res. Manag. 1997, 13, 75–90. [Google Scholar] [CrossRef]
  34. Pellegrini, L.; Maraga, F.; Turitto, O.; Audisio, C.; Duci, G. Evoluzione morfologica di alvei fluviali mobili nel settore occidentale del bacino padano. Ital. J. Quat. Sci. 2008, 21, 251–266. [Google Scholar]
  35. Diodato, N.; Santoni, G.; Cevasco, A.; Fiorillo, F.; Bellocchi, G. Damaging hydrological events during the exiting of the Little Ice Age in a highland area of Southern Italy. Int. J. Hydrol. Sci. Technol. 2021, 11, 136–165. [Google Scholar] [CrossRef]
  36. Diodato, N.; Soriano, M.; Bellocchi, G.; Fiorillo, F.; Cevasco, A.; Revellino, P. Historical evolution of slope instability in the Calore River Basin, Southern Italy. Geomorphology 2017, 282, 74–84. [Google Scholar] [CrossRef]
  37. Preciso, E.; Salemi, E.; Billi, P. Land use changes, torrent control works and sediment mining: Effects on channel morphology and sediment flux, case study of the Reno River (Northern Italy). Hydrol. Process. 2012, 26, 1134–1148. [Google Scholar] [CrossRef]
  38. Mandarino, A.; Luino, F.; Faccini, F. Flood-induced ground effects and flood-water dynamics for hydro-geomorphic hazard assessment: The 21–22 October 2019 extreme flood along the lower Orba River (Alessandria, NW Italy). J. Maps 2021, 17, 136–151. [Google Scholar] [CrossRef]
  39. Surian, N.; Rinaldi, M. Morphological response to river engineering and management in alluvial channels in Italy. Geomorphology 2003, 50, 307–326. [Google Scholar] [CrossRef]
  40. Surian, N.; Rinaldi, M. Dinamica recente ed attuale degli alvei fluviali in Italia: Stato dell’arte e prospettive. Ital. J. Quat. Sci. 2008, 21, 233–240. [Google Scholar]
  41. Bollati, I.M.; Pellegrini, L.; Rinaldi, M.; Duci, G.; Pelfini, M. Reach-scale morphological adjustments and stages of channel evolution: The case of the Trebbia River (Northern Italy). Geomorphology 2014, 221, 176–186. [Google Scholar] [CrossRef] [Green Version]
  42. Clerici, A.; Perego, S.; Chelli, A.; Tellini, C. Morphological changes of the floodplain reach of the Taro River (Northern Italy) in the last two centuries. J. Hydrol. 2015, 527, 1106–1122. [Google Scholar] [CrossRef]
  43. Mandarino, A.; Luino, F.; Turconi, L.; Faccini, F. Urban geomorphology of a historical city straddling the Tanaro River (Alessandria, NW Italy). J. Maps 2020, 17, 1–13. [Google Scholar] [CrossRef] [Green Version]
  44. Mandarino, A.; Pepe, G.; Maerker, M.; Cevasco, A.; Brandolini, P. Short-Term GIS Analysis for the Assessment of the Recent Active-Channel Planform Adjustments in a Widening, Highly Altered River: The Scrivia River, Italy. Water 2020, 12, 514. [Google Scholar] [CrossRef] [Green Version]
  45. Mandarino, A.; Maerker, M.; Firpo, M. Channel planform changes along the Scrivia River floodplain reach in northwest Italy from 1878 to 2016. Quat. Res. 2019, 91, 620–637. [Google Scholar] [CrossRef]
  46. Comiti, F.; Da Canal, M.; Surian, N.; Mao, L.; Picco, L.; Lenzi, M.A. Channel adjustments and vegetation cover dynamics in a large gravel bed river over the last 200 years. Geomorphology 2011, 125, 147–159. [Google Scholar] [CrossRef]
  47. Marchese, E.; Scorpio, V.; Fuller, I.; McColl, S.; Comiti, F. Morphological changes in Alpine rivers following the end of the Little Ice Age. Geomorphology 2017, 295, 811–826. [Google Scholar] [CrossRef]
  48. Moretto, J.; Rigon, E.; Mao, L.; Picco, L.; Delai, F.; Lenzi, M.A. Channel Adjustments and Island Dynamics in the Brenta River (italy) Over the Last 30 Years. River Res. Appl. 2014, 30, 719–732. [Google Scholar] [CrossRef]
  49. Rinaldi, M.; Simon, A. Bed-level adjustments in the Arno River, central Italy. Geomorphology 1998, 22, 57–71. [Google Scholar] [CrossRef]
  50. Rinaldi, M. Recent channel adjustments in alluvial rivers of Tuscany, central Italy. Earth Surf. Process. Landf. 2003, 28, 587–608. [Google Scholar] [CrossRef]
  51. Rinaldi, M.; Surian, N.; Pellegrini, L.; Maraga, F.; Turitto, O. Attuali conoscenze sull’evoluzione recente di corsi d’acqua del Bacino Padano ed implicazioni per la gestione e riqualificazione fluviale. Biol. Ambient. 2010, 24, 29–40. [Google Scholar]
  52. de Musso, N.M.; Capolongo, D.; Caldara, M.; Surian, N.; Pennetta, L. Channel Changes and Controlling Factors over the Past 150 Years in the Basento River (Southern Italy). Water 2020, 12, 307. [Google Scholar] [CrossRef] [Green Version]
  53. Scorpio, V.; Piégay, H. Is afforestation a driver of change in italian rivers within the Anthropocene era? Catena 2020, 10, 105031. [Google Scholar] [CrossRef]
  54. Campana, D.; Marchese, E.; Theule, J.I.; Comiti, F. Channel degradation and restoration of an Alpine river and related morphological changes. Geomorphology 2014, 221, 230–241. [Google Scholar] [CrossRef]
  55. Rinaldi, M.; Simoncini, C.; Piégay, H. Scientific design strategy for promoting sustainable sediment management: The case of the Magra River (Central-Northern Italy). River Res. Appl. 2009, 25, 607–625. [Google Scholar] [CrossRef]
  56. Paliaga, G.; Faccini, F.; Luino, F.; Roccati, A.; Turconi, L. A clustering classification of catchment anthropogenic modification and relationships with floods. Sci. Total Environ. 2020, 740, 139915. [Google Scholar] [CrossRef]
  57. Roccati, A.; Mandarino, A.; Perasso, L.; Robbiano, A.; Luino, F.; Faccini, F. Large-scale geomorphology of the Entella River floodplain (Italy) for coastal urban areas management. J. Maps 2020, 17, 1–15. [Google Scholar] [CrossRef] [Green Version]
  58. Roccati, A.; Faccini, F.; Luino, F.V.; De Graff, J.; Turconi, L. Morphological changes and human impact in the Entella River floodplain (Northern Italy) from the 17th century. Catena 2019, 182, 104–122. [Google Scholar] [CrossRef]
  59. Roccati, A.; Luino, F.; Turconi, L.; Piana, P.; Watkins, C.; Faccini, F. Historical Geomorphological Research of a Ligurian Coastal Floodplain (Italy) and Its Value for Management of Flood Risk and Environmental Sustainability. Sustainability 2018, 10, 3727. [Google Scholar] [CrossRef] [Green Version]
  60. Faccini, F.; Paliaga, G.; Piana, P.; Sacchini, A.; Watkins, C. The Bisagno stream catchment (Genoa, Italy) and its major floods: Geomorphic and land use variations in the last three centuries. Geomorphology 2016, 273, 14–27. [Google Scholar] [CrossRef]
  61. Mandarino, A.; Faccini, F.; Terrone, M.; Paliaga, G. Anthropogenic landforms and geo-hydrological hazards of the Bisagno Stream catchment (Liguria, Italy). J. Maps 2021, 17, 122–135. [Google Scholar] [CrossRef]
  62. Piana, P.; Faccini, F.; Luino, F.; Paliaga, G.; Sacchini, A.; Watkins, C. Geomorphological Landscape Research and Flood Management in a Heavily Modified Tyrrhenian Catchment. Sustainability 2019, 11, 4594. [Google Scholar] [CrossRef] [Green Version]
  63. Luino, F.; Paliaga, G.; Roccati, A.; Sacchini, A.; Turconi, L.; Faccini, F. Anthropogenic changes in the alluvial plains of the Tyrrhenian Ligurian basins. Rend. Online Soc. Geol. Ital. 2019, 48, 10–16. [Google Scholar] [CrossRef]
  64. Rinaldi, M.; Simoncini, C. Studio geomorfologico del Fiume Magra e del Fiume Vara finalizzato alla gestione dei sedimenti e della fascia di mobilità. In Nuovi Approcci per la Comprensione dei Processi Fluviali e la Gestione dei Sedimenti. Applicazioni nel Bacino del Magra; Autorità, B.M., Ed.; Atti Delle Giornate di Studio: Sarzana, Italy, 2006; pp. 93–109. [Google Scholar]
  65. Dufour, S.; Rinaldi, M.; Piégay, H.; Michalon, A. How do river dynamics and human influences affect the landscape pattern of fluvial corridors? Lessons from the Magra River, Central–Northern Italy. Landsc. Urban Plan. 2015, 134, 107–118. [Google Scholar] [CrossRef]
  66. Nardi, L.; Rinaldi, M. Spatio-temporal patterns of channel changes in response to a major flood event: The case of the Magra River (central–northern Italy). Earth Surf. Process. Landf. 2015, 40, 326–339. [Google Scholar] [CrossRef]
  67. Brandolini, P.; Mandarino, A.; Paliaga, G.; Faccini, F. Anthropogenic landforms in an urbanized alluvial-coastal plain (Rapallo city, Italy). J. Maps 2020, 18, 1–12. [Google Scholar] [CrossRef]
  68. Brandolini, P.; Cappadonia, C.; Luberti, G.M.; Donadio, C.; Stamatopoulos, L.; Di Maggio, C. Geomorphology of the Anthropocene in Mediterranean urban areas. Progr. Phys. Geogr. 2019, 44, 461–494. [Google Scholar] [CrossRef]
  69. Cevasco, A.; Diodato, N.; Revellino, P.; Fiorillo, F.; Grelle, G.; Guadagno, F.M. Storminess and geo-hydrological events affecting small coastal basins in a terraced Mediterranean environment. Sci. Total Environ. 2015, 532, 208–219. [Google Scholar] [CrossRef]
  70. Pepe, G.; Mandarino, A.; Raso, E.; Scarpellini, P.; Brandolini, P.; Cevasco, A. Investigation on Farmland Abandonment of Terraced Slopes Using Multitemporal Data Sources Comparison and Its Implication on Hydro-Geomorphological Processes. Water 2019, 11, 1552. [Google Scholar] [CrossRef] [Green Version]
  71. Raso, E.; Mandarino, A.; Pepe, G.; Calcaterra, D.; Cevasco, A.; Confuorto, P. Geomorphology of Cinque Terre National Park (Italy). J. Maps 2020, 17, 171–184. [Google Scholar] [CrossRef]
  72. Fierro, G.; Berriolo, G.; Ferrari, M. Le Spiagge Della Liguria Occidentale: Analisi Evolutiva; Regione Liguria: Genova, Italy, 2010; p. 174. [Google Scholar]
  73. Brandolini, P.; Faccini, F.; Robbiano, A.; Terranova, R. Relationship between flood hazards and geomorphology applied to land planning in the upper Aveto Valley (Liguria, Italy). Geogr. Fis. Din. Quat. 2008, 31, 73–82. [Google Scholar]
  74. Brandolini, P.B.; Canepa, G.; Faccini, F.; Robbiano, A.; Terranova, R. Geomorphological and geo-environmental features of the Graveglia Valley (Ligurian Apennines, Italy). Geogr. Fis. Din. Quat. 2007, 30, 99–116. [Google Scholar]
  75. Brandolini, P.; Cevasco, A. Geo-hydrological risk mitigation measures and land-management in a highly vulnerable small coastal catchment. In Engineering Geology for Society and Territory-Urban Geology, Sustainable Planning and Landscape Exploitation; Lollino, G., Manconi, A., Guzzetti, F., Culshaw, M., Bobrowsky, P., Luino, F., Eds.; Springer International Publishing: Berlin/Heidelberg, Germany, 2015; pp. 759–762. [Google Scholar] [CrossRef]
  76. Cevasco, A.; Pepe, G.; D’Amato Avanzi, G. Preliminary analysis of the November 10, 2014 rainstorm and related landslides in the lower Lavagna valley (Eastern Liguria). Ital. J. Eng. Geol. Environ. 2017, 1, 5–15. [Google Scholar] [CrossRef]
  77. Cevasco, A.; Pepe, G.; D’Amato Avanzi, G.; Giannecchini, R. A study on the 10 November 2014 intense rainfall and the related landslides in the lower Lavagna valley (eastern Liguria). Rend. Online Soc. Geol. Ital. 2015, 35, 66–69. [Google Scholar] [CrossRef]
  78. Cevasco, A.; Pepe, G.; Brandolini, P. Geotechnical and stratigraphic aspects of shallow landslides at Cinque Terre (Liguria, Italy). Rend. Online Soc. Geol. Ital. 2013, 24, 52–54. [Google Scholar]
  79. Faccini, F.; Luino, F.; Paliaga, G.; Roccati, A.; Turconi, L. Flash Flood Events along the West Mediterranean Coasts: Inundations of Urbanized Areas Conditioned by Anthropic Impacts. Land 2021, 10, 620. [Google Scholar] [CrossRef]
  80. Faccini, F.; Luino, F.; Sacchini, A.; Turconi, L.; De Graff, J.V. Geohydrological hazards and urban development in the Mediterranean area: An example from Genoa (Liguria, Italy). Nat. Hazards Earth Syst. Sci. 2015, 15, 2631–2652. [Google Scholar] [CrossRef] [Green Version]
  81. Pepe, G.; Mandarino, A.; Raso, E.; Cevasco, A.; Firpo, M.; Casagli, N. Extreme flood and landslides triggered in the Arroscia Valley (Liguria Region, Northwestern Italy) during the November 2016 rainfall event. In Engineering Geology for a Sustainable World; Shakoor, A., Cato, K., Eds.; Springer International Publishing: Cham, Switzerland, 2019; pp. 171–175. [Google Scholar] [CrossRef]
  82. Zingaro, M.; Refice, A.; Giachetta, E.; D’Addabbo, A.; Lovergine, F.; De Pasquale, V. Sediment mobility and connectivity in a catchment: A new mapping approach. Sci. Total Environ. 2019, 672, 763–775. [Google Scholar] [CrossRef]
  83. Rinaldi, M.; Surian, N.; Comiti, F.; Bussettini, M. IDRAIM–Sistema di Valutazione Idromorfologica, Analisi e Monitoraggio dei Corsi D’acqua; ISPRA-Manuali e Linee Guida: Roma, Italy, 2016.
  84. Brierley, G.J.; Fryirs, K.A.; Boulton, A.; Cullum, C. Working with change: The importance of evolutionary perspectives in framing the trajectory of river adjustment. In River Futures: An Integrative Scientific Approach to River Repair; Brierley, G.J., Fryirs, K.A., Eds.; Island Press: Washington, DC, USA, 2008; pp. 65–84. [Google Scholar]
  85. Dufour, S.; Piégay, H. From the myth of a lost paradise to targeted river restoration: Forget natural references and focus on human benefits. River Res. Appl. 2009, 25, 568–581. [Google Scholar] [CrossRef]
  86. Grabowski, R.C.; Surian, N.; Gurnell, A.M. Characterizing geomorphological change to support sustainable river restoration and management. WIREs Water 2014, 1, 483–512. [Google Scholar] [CrossRef]
  87. Leys, K.F.; Werritty, A. River channel planform change: Software for historical analysis. Geomorphology 1999, 29, 107–120. [Google Scholar] [CrossRef]
  88. Sohl, T.; Sleeter, B. Role of remote sensing for land-use and land-cover change modeling. In Remote Sensing of Land Use and Land Cover: Principles and Applications; Giri, C.P., Ed.; Earth Resources Observation and Science (EROS) Center: Sioux Falls, SD, USA; CRC Press: Boca Raton, FL, USA, 2012; pp. 225–239. [Google Scholar]
  89. Gurnell, A.M. Channel change on the River Dee meanders, 1946–1992, from the analysis of air photographs. Regul. Rivers Res. Manag. 1997, 13, 13–26. [Google Scholar] [CrossRef]
  90. Hooke, J.M. Changes in Meander Morphology. In International Geomorphology 1986 Proc 1st Conference; Gardiner, V., Ed.; Wiley: Chichester, UK, 1987; Volume 1, pp. 591–609. [Google Scholar]
  91. Nicoll, T.J.; Hickin, E.J. Planform geometry and channel migration of confined meandering rivers on the Canadian prairies. Geomorphology 2010, 116, 37–47. [Google Scholar] [CrossRef]
  92. Passmore, D.G.; Macklin, M.G.; Brewer, P.A.; Lewin, J.; Rumsby, B.T.; Newson, M.D. Variability of late Holocene braiding in Britain. Geol. Soc. Lond. Spec. Publ. 1993, 75, 205–229. [Google Scholar] [CrossRef]
  93. Tiegs, S.D.; Pohl, M. Planform channel dynamics of the lower Colorado River: 1976–2000. Geomorphology 2005, 69, 14–27. [Google Scholar] [CrossRef]
  94. Toone, J.; Rice, S.P.; Piégay, H. Spatial discontinuity and temporal evolution of channel morphology along a mixed bedrock-alluvial river, upper Drôme River, southeast France: Contingent responses to external and internal controls. Geomorphology 2014, 205, 5–16. [Google Scholar] [CrossRef]
  95. Trimble, S.W.; Cooke, R.U. Historical Sources for Geomorphological Research in the United States. Prof. Geogr. 1991, 43, 212–228. [Google Scholar] [CrossRef]
  96. Werritty, A.; Ferguson, R.I. Pattern changes in a Scottish braided river over 1, 30 and 200 years. In Timescales in Geomorphology; Cullingford, R.A., Davidson, D.A., Lewin, J., Eds.; Wiley: Chichester, UK, 1980; pp. 53–68. [Google Scholar]
  97. Dingle, E.H.; Paringit, E.C.; Tolentino, P.L.; Williams, R.D.; Hoey, T.B.; Barrett, B. Decadal-scale morphological adjustment of a lowland tropical river. Geomorphology 2019, 333, 30–42. [Google Scholar] [CrossRef] [Green Version]
  98. Dewan, A.; Corner, R.; Saleem, A.; Rahman, M.M.; Haider, M.R.; Rahman, M.M. Assessing channel changes of the Ganges-Padma River system in Bangladesh using Landsat and hydrological data. Geomorphology 2017, 276, 257–279. [Google Scholar] [CrossRef]
  99. Dixon, S.J.; Sambrook Smith, G.H.; Best, J.L.; Nicholas, A.P.; Bull, J.M.; Vardy, M.E. The planform mobility of river channel confluences: Insights from analysis of remotely sensed imagery. Earth-Sci. Rev. 2018, 176, 1–18. [Google Scholar] [CrossRef]
  100. Fisher, G.B.; Bookhagen, B.; Amos, C.B. Channel planform geometry and slopes from freely available high-spatial resolution imagery and DEM fusion: Implications for channel width scalings, erosion proxies, and fluvial signatures in tectonically active landscapes. Geomorphology 2013, 194, 46–56. [Google Scholar] [CrossRef]
  101. Fisher, G.B.; Amos, C.B.; Bookhagen, B.; Burbank, D.W.; Godard, V. Channel widths, landslides, faults, and beyond: The new world order of high-spatial resolution Google Earth imagery in the study of earth surface processes. In Google Earth and Virtual Visualizations in Geoscience Education and Research; Whitmeyer, S.J., Bailey, J.E., De paor, D.G., Ornduff, T., Eds.; Geological Society of America Special Papers; Geological Society of America: Boulder, CO, USA, 2012; Volume 492, pp. 1–22. [Google Scholar]
  102. Gracchi, T.; Rossi, G.; Tacconi Stefanelli, C.; Tanteri, L.; Pozzani, R.; Moretti, S. Tracking the Evolution of Riverbed Morphology on the Basis of UAV Photogrammetry. Remote Sens. 2021, 13, 829. [Google Scholar] [CrossRef]
  103. Nawfee, S.M.; Dewan, A.; Rashid, T. Integrating subsurface stratigraphic records with satellite images to investigate channel change and bar evolution: A case study of the Padma River, Bangladesh. Environ. Earth Sci. 2018, 77, 1–14. [Google Scholar] [CrossRef]
  104. Gupta, N.; Atkinson, P.M.; Carling, P.A. Decadal length changes in the fluvial planform of the River Ganga: Bringing a mega-river to life with Landsat archives. Remote Sens. Lett. 2013, 4, 1–9. [Google Scholar] [CrossRef]
  105. Hazarika, N.; Das, A.K.; Borah, S.B. Assessing land-use changes driven by river dynamics in chronically flood affected Upper Brahmaputra plains, India, using RS-GIS techniques. Egypt. J. Remote Sens. Space Sci. 2015, 18, 107–118. [Google Scholar] [CrossRef] [Green Version]
  106. Hossain, M.A.; Gan, T.Y.; Baki, A.B.M. Assessing morphological changes of the Ganges River using satellite images. Quat. Int. 2013, 304, 142–155. [Google Scholar] [CrossRef]
  107. Kuo, C.W.; Chen, C.F.; Chen, S.C.; Yang, T.C.; Chen, C.W. Channel Planform Dynamics Monitoring and Channel Stability Assessment in Two Sediment-Rich Rivers in Taiwan. Water 2017, 9, 84. [Google Scholar] [CrossRef] [Green Version]
  108. Martha, T.R.; Sharma, A.; Kumar, K.V. Development of meander cutoffs—A multi-temporal satellite-based observation in parts of Sindh River, Madhya Pradesh, India. Arab. J. Geosci. 2015, 8, 5663–5668. [Google Scholar] [CrossRef]
  109. Peixoto, J.M.A.; Nelson, B.W.; Wittmann, F. Spatial and temporal dynamics of river channel migration and vegetation in central Amazonian white-water floodplains by remote-sensing techniques. Remote Sens. Environ. 2009, 113, 2258–2266. [Google Scholar] [CrossRef]
  110. Yao, Z.; Xiao, J.; Ta, W.; Jia, X. Planform channel dynamics along the Ningxia–Inner Mongolia reaches of the Yellow River from 1958 to 2008: Analysis using Landsat images and topographic maps. Environ. Earth Sci. 2013, 70, 97–106. [Google Scholar] [CrossRef]
  111. Henshaw, A.J.; Gurnell, A.M.; Bertoldi, W.; Drake, N.A. An assessment of the degree to which Landsat TM data can support the assessment of fluvial dynamics, as revealed by changes in vegetation extent and channel position, along a large river. Geomorphology 2013, 202, 74–85. [Google Scholar] [CrossRef]
  112. Rowland, J.C.; Shelef, E.; Pope, P.A.; Muss, J.; Gangodagamage, C.; Brumby, S.P. A morphology independent methodology for quantifying planview river change and characteristics from remotely sensed imagery. Remote Sens. Environ. 2016, 184, 212–228. [Google Scholar] [CrossRef] [Green Version]
  113. Akay, S.S.; Özcan, O.; Şanlı, F.B.; Görüm, T.; Şen, Ö.L.; Bayram, B. UAV-based evaluation of morphological changes induced by extreme rainfall events in meandering rivers. PLoS ONE 2020, 15, e0241293. [Google Scholar] [CrossRef]
  114. Gomez, C.; Purdie, H. UAV- based Photogrammetry and Geocomputing for Hazards and Disaster Risk Monitoring—A Review. Geoenviron. Dis. 2016, 3, 23. [Google Scholar] [CrossRef] [Green Version]
  115. Özcan, O.; Özcan, O. Multi-temporal UAV based repeat monitoring of rivers sensitive to flood. J. Maps 2020, 17, 163–170. [Google Scholar] [CrossRef]
  116. Lei, C.; Zhu, L. Spatio-temporal variability of land use/land cover change (LULCC) within the Huron River: Effects on stream flows. Clim. Risk Manag. 2018, 19, 35–47. [Google Scholar] [CrossRef]
  117. Matysik, M.; Absalon, D.; Habel, M.; Maerker, M. Surface Water Quality Analysis Using CORINE Data: An Application to Assess Reservoirs in Poland. Remote Sens. 2020, 12, 979. [Google Scholar] [CrossRef] [Green Version]
  118. Meek, C.S.; Richardson, D.M.; Mucina, L. A river runs through it: Land-use and the composition of vegetation along a riparian corridor in the Cape Floristic Region, South Africa. Biol. Conserv. 2010, 143, 156–164. [Google Scholar] [CrossRef]
  119. Muyibul, Z.; Jianxin, X.; Muhtar, P.; Qingdong, S.; Run, Z. Spatiotemporal changes of land use/cover from 1995 to 2015 in an oasis in the middle reaches of the Keriya River, southern Tarim Basin, Northwest China. Catena 2018, 171, 416–425. [Google Scholar] [CrossRef]
  120. Prasad, G.; Ramesh, M.V. Spatio-Temporal Analysis of Land Use/Land Cover Changes in an Ecologically Fragile Area—Alappuzha District, Southern Kerala, India. Nat. Resour. Res. 2019, 28, 31–42. [Google Scholar] [CrossRef]
  121. Szatten, D.; Habel, M. Effects of Land Cover Changes on Sediment and Nutrient Balance in the Catchment with Cascade-Dammed Waters. Remote Sens. 2020, 12, 3414. [Google Scholar] [CrossRef]
  122. Baena-Escudero, R.; Guerrero-Amador, I.C.; Rinaldi, M.; Sayago, A.G. Hydrological and geomorphic effects upstream of the Cantillana Dam along the Guadalquivir River (Southern Spain). Geomorphology 2021, 388, 107786. [Google Scholar] [CrossRef]
  123. Pavlek, K.; Faivre, S. Geomorphological changes of the Cetina River channels since the end of the nineteenth century, natural vs anthropogenic impacts (the Dinarides, Croatia). Environ. Earth Sci. 2020, 79, 482. [Google Scholar] [CrossRef]
  124. Decarlis, A.; Dallagiovanna, G.; Lualdi, A.; Maino, M.; Seno, S. Stratigraphic evolution in the Ligurian Alps between Variscan heritages and the Alpine Tethys opening: A review. Earth-Sci. Rev. 2013, 125, 43–68. [Google Scholar] [CrossRef]
  125. Boni, P.; Peloso, G.F.; Vercesi, P.L. Nuovi dati e considerazioni sulla stratigrafia del bacino pliocenico di Albenga (Alpi Marittime). Mem. Soc. Geol. Ital. 1986, 28, 385–396. [Google Scholar]
  126. Boni, P. Il Pliocene e la Neotettonica nelle Alpi Liguri. Mem. Soc. Geol. Ital. 1984, 28, 229–265. [Google Scholar]
  127. Fanucci, F.; Firpo, M.; Ramella, A. Genesi ed evoluzione di piane costiere del Mediterraneo: Esempi di piccole piane della Liguria. Geogr. Fis. Din. Quat. 1987, 10, 193–203. [Google Scholar]
  128. Agenzia Regionale per la Protezione dell’Ambiente Ligure. Annali Idrologici. 2011. Available online: https://www.arpal.liguria.it/homepage/meteo/pubblicazioni/annali-idrologici.html (accessed on 1 May 2021).
  129. Capello, M.; Cutroneo, L.; Ferranti, M.P.; Budillon, G.; Bertolotto, R.M.; Ciappa, A. Simulations of dredged sediment spreading on a Posidonia oceanica meadow off the Ligurian coast, Northwestern Mediterranean. Mar. Pollut. Bull. 2014, 79, 196–204. [Google Scholar] [CrossRef] [PubMed]
  130. Autorità di Bacino Regionale. Piano di Bacino Stralcio per l’assetto Idrogeologico del Torrente Centa. 2019. Available online: http://www.pianidibacino.ambienteinliguria.it/SV/03centa/centa.html (accessed on 15 January 2021).
  131. Agrillo, G.; Bonati, V. Atlante Climatico Della Liguria; ARPAL-Centro Funzionale Meteoidrologico di Protezione Civile: Genova, Italy, 2013; p. 128. [Google Scholar]
  132. National Group for Prevention of Hydrological Hazards (GNDCI) of the National Research Council. Inventory of Areas Affected by Landslides and Floods in Italy from 1918 to 2000. AVI («Aree Vulnerabili Italiane») Project. 2000. Available online: http://avi.gndci.cnr.it/ (accessed on 15 January 2021).
  133. Cuca, B.; Barazzetti, L. Damages from extreme flooding events to cultural heritage and landscapes: Water component estimation for Centa River (Albenga, Italy). Adv. Geosci. 2018, 45, 389–395. [Google Scholar] [CrossRef] [Green Version]
  134. Bartzas, G.; Tinivella, F.; Medini, L.; Zaharaki, D.; Komnitsas, K. Assessment of groundwater contamination risk in an agricultural area in north Italy. Inf. Process. Agric. 2015, 2, 109–129. [Google Scholar] [CrossRef] [Green Version]
  135. Rinaldi, M.; Belletti, B.; Comiti, F.; Nardi, L.; Bussettini, M.; Mao, L.; Gurnell, A.M. The Geomorphic Units Survey and Classification System (GUS); Deliverable 6.2, Part 4, of REFORM (REstoring Rivers FOR Effective Catchment Management), a Collaborative Project (Large-Scale Integrating Project) Funded by the European Commission within the 7th Framework Programme under Grant Agreement 282656. 2015. Available online: https://www.researchgate.net/publication/283539400_The_Geomorphic_Units_survey_and_classification_System_GUS_Deliverable_62_Part_4_of_REFORM_REstoring_rivers_FOR_effective_catchment_Management_a_Collaborative_project_large-scale_integrating_project_fu (accessed on 13 July 2021).
  136. QGIS Development Team. QGIS [Internet]. 2021. Available online: https://qgis.org/en/site/# (accessed on 10 January 2021).
  137. Hughes, M.L.; McDowell, P.F.; Marcus, W.A. Accuracy assessment of georectified aerial photographs: Implications for measuring lateral channel movement in a GIS. Geomorphology 2006, 74, 1–16. [Google Scholar] [CrossRef]
  138. Block, D.L. Historical channel-planform change of the Little Colorado River near Winslow, Arizona; Scientific Investigations Report No.: 2014–5112; U.S. Geological Survey: Reston, VA, USA, 2014; p. 35.
  139. Neteler, M.; Mitasova, H. Open Source GIS: A GRASS GIS Approach; Springer: New York, NY, USA, 2008; p. 406. [Google Scholar]
  140. LMIC. Positional Accuracy Handbook-Using the National Standard for Spatial Data Accuracy to Measure and Report Geographic Data Quality; Minnesota Governor’s Council on Geographic Information; Minnesota Land Management Information Center (LMIC): St. Paul, MI, USA, 1999; p. 33.
  141. Michalková, M.; Piégay, H.; Kondolf, G.M.; Greco, S.E. Lateral erosion of the Sacramento River, California (1942–1999), and responses of channel and floodplain lake to human influences. Earth Surf. Process. Landf. 2011, 36, 257–272. [Google Scholar] [CrossRef]
  142. Jautzy, T.; Herrault, P.A.; Chardon, V.; Schmitt, L.; Rixhon, G. Measuring river planform changes from remotely sensed data—A Monte Carlo approach to assessing the impact of spatially variable error. Earth Surf. Dyn. 2020, 8, 471–484. [Google Scholar] [CrossRef]
  143. Liébault, F.; Piégay, H. Assessment of channel changes due to long-term bedload supply decrease, Roubion River, France. Geomorphology 2001, 36, 167–186. [Google Scholar] [CrossRef]
  144. Nelson, N.C.; Erwin, S.O.; Schmidt, J.C. Spatial and temporal patterns in channel change on the Snake River downstream from Jackson Lake dam, Wyoming. Geomorphology 2013, 200, 132–142. [Google Scholar] [CrossRef]
  145. Brierley, G.J.; Fryirs, K.A. Geomorphology and River Management: Applications of the River Styles Framework; Blackwell Publishing: Oxford, UK, 2005; p. 416. [Google Scholar]
  146. Rinaldi, M.; Surian, N.; Comiti, F.; Bussettini, M. A method for the assessment and analysis of the hydromorphological condition of Italian streams: The Morphological Quality Index (MQI). Geomorphology 2013, 180, 96–108. [Google Scholar] [CrossRef]
  147. Rinaldi, M.; Belletti, B.; Bussettini, M.; Comiti, F.; Golfieri, B.; Lastoria, B. New tools for the hydromorphological assessment and monitoring of European streams. J. Environ. Manag. 2017, 202, 363–378. [Google Scholar] [CrossRef] [PubMed]
  148. Rinaldi, M.; Surian, N.; Comiti, F.; Bussettini, M. A methodological framework for hydromorphological assessment, analysis and monitoring (IDRAIM) aimed at promoting integrated river management. Geomorphology 2015, 251, 122–136. [Google Scholar] [CrossRef]
  149. Surian, N.; Rinaldi, M.; Pellegrini, L. Linee Guida per l´Analisi Geomorfologica Degli Alvei Fluviali e Delle loro Tendenze Evolutive; Cleup: Padova, Italy, 2009; p. 78. [Google Scholar]
  150. Ashmore, P. Channel Morphology and Bed Load Pulses in Braided, Gravel-Bed Streams. Geogr. Ann. A 1991, 73, 37–52. [Google Scholar] [CrossRef]
  151. Egozi, R.; Ashmore, P. Defining and measuring braiding intensity. Earth Surf. Process. Landf. 2008, 33, 2121–2138. [Google Scholar] [CrossRef]
  152. Malavoi, J.R.; Bravard, J.P. Éléments d’hydromorphologie fluviale. Onema (Office national de l’eau et des milieux aquatiques), 2010; Volume 5, p. 224. Available online: https://www.documentation.eauetbiodiversite.fr/notice/00000000015dd1c55f01fd71f480da33 (accessed on 13 July 2021).
  153. Surian, N.; Ziliani, L.; Comiti, F.; Lenzi, M.A.; Mao, L. Channel adjustments and alteration of sediment fluxes in gravel-bed rivers of North-Eastern Italy: Potentials and limitations for channel recovery. River Res. Appl. 2009, 25, 551–567. [Google Scholar] [CrossRef]
  154. Hooke, J.M. Temporal variations in fluvial processes on an active meandering river over a 20-year period. Geomorphology 2008, 100, 3–13. [Google Scholar] [CrossRef]
  155. Mount, N.; Louis, J. Estimation and propagation of error in measurements of river channel movement from aerial imagery. Earth Surf. Process. Landf. 2005, 30, 635–643. [Google Scholar] [CrossRef]
  156. Rapp, C.F.; Abbe, T.B. A Framework for Delineating Channel Migration Zones; Ecology Publication No. 03-06–027; Washington State Department of Ecology and Department of Transportation: Lacey, WA, USA, 2003.
  157. Urban, M.A.; Rhoads, B.L. Catastrophic Human-Induced Change in Stream-Channel Planform and Geometry in an Agricultural Watershed, Illinois, USA. Ann. Am. Assoc. Geogr. 2003, 93, 783–796. [Google Scholar] [CrossRef]
  158. Zhou, M.; Xia, J.; Lu, J.; Deng, S.; Lin, F. Morphological adjustments in a meandering reach of the middle Yangtze River caused by severe human activities. Geomorphology 2017, 285, 325–332. [Google Scholar] [CrossRef]
  159. Das, S.; Pal, S. Character and Cardinality of Channel Migration of Kalindri River, West Bengal, India. Int. Res. J. Earth Sci. 2016, 4, 13–26. [Google Scholar]
  160. Giardino, J.R.; Lee, A.A. Rates of Channel Migration on the Brazos River; Final Report; Texas A&M University: College Station, TX, USA, 2011; p. 45. [Google Scholar]
  161. Gurnell, A.M.; Downward, S.R.; Jones, R. Channel planform change on the river dee meanders, 1876–1992. Regul. Rivers Res. Manag. 1994, 9, 187–204. [Google Scholar] [CrossRef]
  162. Clerici, A.; Perego, S. A Set of GRASS GIS-Based Shell Scripts for the Calculation and Graphical Display of the Main Morphometric Parameters of a River Channel. Int. J. Geosci. 2016, 07, 135. [Google Scholar] [CrossRef] [Green Version]
  163. Costa Restagno, J. Problemi territoriali, carte e cartografi nell’Ingauna medievale e moderna. In Carte e Cartografi in Liguria; Quaini, M., Ed.; Sagep Editrice: Genova, Italy, 1986. [Google Scholar]
  164. Previtali, M. A virtual logbook for the documentation of a continuously changing archaeological site: The San Clemente site in Albenga (Italy). Virtual Archaeol. Rev. 2019, 10, 56–66. [Google Scholar] [CrossRef] [Green Version]
  165. Roascio, S. The site of San Calocero di Albenga (SV). An inter-disciplinary methodological training ground. Int. Arch. Photogramm. Remote Sens. Spat. Inf. Sci. 2019, XLII-2/W11, 1011–1016. [Google Scholar] [CrossRef] [Green Version]
  166. Dépret, T.; Gautier, E.; Hooke, J.; Grancher, D.; Virmoux, C.; Brunstein, D. Causes of planform stability of a low-energy meandering gravel-bed river (Cher River, France). Geomorphology 2017, 285, 58–81. [Google Scholar] [CrossRef]
  167. Florsheim, J.L.; Mount, J.F.; Chin, A. Bank Erosion as a Desirable Attribute of Rivers. BioScience 2008, 58, 519–529. [Google Scholar] [CrossRef]
  168. Kiss, T.; Fiala, K.; Sipos, G. Alterations of channel parameters in response to river regulation works since 1840 on the Lower Tisza River (Hungary). Geomorphology 2008, 98, 96–110. [Google Scholar] [CrossRef]
  169. Kiss, T.; Blanka, V. River channel response to climate- and human-induced hydrological changes: Case study on the meandering Hernád River, Hungary. Geomorphology 2012, 175–176, 115–125. [Google Scholar] [CrossRef]
  170. Ollero, A. Channel changes and floodplain management in the meandering middle Ebro River, Spain. Geomorphology 2010, 117, 247–260. [Google Scholar] [CrossRef]
  171. Vandenberghe, J.; de Moor, J.J.W.; Spanjaard, G. Natural change and human impact in a present-day fluvial catchment: The Geul River, Southern Netherlands. Geomorphology 2012, 159–160, 1–14. [Google Scholar] [CrossRef]
  172. Hooke, J.M. Spatial variability, mechanisms and propagation of change in an active meandering river. Geomorphology 2007, 84, 277–296. [Google Scholar] [CrossRef]
  173. Regione Liguria. Piano di Tutela dell’Ambiente Marino e Costiero per l’Ambito Costiero 08. 2016. Available online: https://www.regione.liguria.it/homepage/ambiente/ambiente-piani-programmi/ambiente-piani-programmi-6tutelamare.html (accessed on 20 January 2021).
Figure 1. Location of the study reach. (a) The Centa River catchment. The Liguria Region is depicted in red; the red arrow indicates the Centa catchment location. (b) The investigated reaches of the Arroscia, Neva and Centa rivers.
Remotesensing 13 03775 g001
Figure 2. Schematization of the methodological framework. Hexagon (rectangle) indicates input/output data (process). Blue rectangle indicates that field surveys and, for historical features, archival data supported and validated the process.
Remotesensing 13 03775 g002
Figure 3. Active channel and macrochannel definition: (a) Google Earth image dated back to 2020 showing the Centa River upstream of Albenga and (b) the corresponding sketch of bank protections, active channel, and macrochannel. The blue arrow indicates the flow direction.
Remotesensing 13 03775 g003
Figure 4. (a) Overlapping of a couple of active channels referring to two different times and (b) definition of stable (SACA), abandoned (AACA) and newly formed (NACA) active channel area.
Remotesensing 13 03775 g004
Figure 5. (a) Active channel width (CW) and channel width variation index (∆W) referring to the active channel width in (b) 1930 and (c) 1954 at the reach scale.
Remotesensing 13 03775 g005
Figure 6. (a) Active-channel centerline length (CL), (b) sinuosity index (SI), (c) braiding index (BI), and (d) channel pattern at the reach scale over the period 1930–2020. NC: no change; C: change; W: wandering; B: braided; SAB: sinuous with alternate bars; ST: straight.
Remotesensing 13 03775 g006
Figure 7. The channel abandonment index (CAI) and channel formation index (CFI) referred to each investigated period and to the periods 1930–2020 and 1954–2020. Letters on bars indicate the qualitative class for metrics: VL: very low (≤15%); L: low (>15% and ≤35%); M: moderate (>35% and ≤50%); H: high (>50% and ≤75%); VH: very high (>75%).
Remotesensing 13 03775 g007
Figure 8. Abandoned (AACA) and newly formed (NACA) active channel areas included within the macrochannel referred to each period investigated and to the periods 1930–2020 and 1954–2020. The macrochannel was mapped in reaches A2, A3, N2, C1, and C2. A1 and N1 were excluded due to the lack of continuous or almost continuous longitudinal bank protections or numerous groynes that allow the macrochannel to be mapped.
Remotesensing 13 03775 g008
Figure 9. (a) Longitudinal bank protection extent and (b) groyne density over time at the reach scale. The lack of data referring to the 1954 longitudinal bank protection extent in reaches A1 and N1 is associated with the impossibility of mapping them with a certain degree of accuracy.
Remotesensing 13 03775 g009
Figure 10. Current LULC in the abandoned areas of the (a) 1930, (b) 1954 and (c) 1973 active-channels. S: sea; N: natural and seminatural area; A: agricultural area; M: abandoned man-made area; Q: quarry area; T: transport area; I: industrial area; U: urban area.
Remotesensing 13 03775 g010
Figure 11. Active-channel planform migration in (a) stable and (b) changing active-channel width conditions, referring to the period t1-t2. Black arrows indicate the active-channel centerline horizontal displacement.
Remotesensing 13 03775 g011
Figure 12. Time chart of reach-scale active channel morphological adjustments and related magnitudes. The terms “contiguous” and “noncontiguous” pattern refer to [52,148]. The active-channel planform migration magnitude was defined according to the combined analysis of CAI and CFI (see Table 2).
Remotesensing 13 03775 g012
Figure 13. Channelization structures depicted on the 1930 map along the (a) Arroscia (reach A3) and (b) Neva (reaches N1 and N2) rivers. The present-day channelization structures along reaches (c) A1, (d) A2, (e) A3, (f) A3, (g) N1, and (h) C2. The yellow arrows marked with 1 and 2 indicate groynes and longitudinal bank protections, respectively. In (f), the dotted line represents a schematic topographic section of the most common channelization structure in reaches A2, A3, N2, and C1. 1: ground level of cultivated fields; 2: embankment for flood protection; 3 gabions for erosion protection; 4: active channel. Photographs: Andrea Mandarino.
Remotesensing 13 03775 g013
Figure 14. LULC evolution in reach A3: (a) 1954, (b) 1973, (c) 1988, (d) 2020. The flow is from left to right. The progressive occupation by human activities and structures of the left side of the valley floor is evident. The white arrow in (c) indicates an approximatively 500 m long reach where active-channel forms were obliterated by bulldozers. The white arrow in (d) pinpoints the after-2016 bank retreat process that involved some areas out of the macrochannel. The white dotted line in (d) represents the active channel in 1930.
Remotesensing 13 03775 g014
Table 1. Data sources used in the present study. The scale values marked with * indicate the scale of visualization. ** Plugin source: https://nextgis.com/blog/quickmapservices/ (accessed on 13 January 2021). B/W = black/white; C = coloured; WMS = Web Map Service.
YearDatumScaleData Source for GISPositional
Accuracy (m)
1930Historical map—sheet n. 92-3-SE Alassio of the “Carta d’Italia”1:25,000Digital image27
1954Aerial photographs (B/W)—national coverage1:65,000Digital image12
1973Aerial photographs (C)—regional coverage1:8000Digital image7
1988Orthophotos (B/W)—national coverage1:10,000National Geoportal WMS≤4
1997Orthophotos (B/W)—national coverage1:10,000National Geoportal WMS≤4
1999Orthophotos (C)—national coverage1:10,000National Geoportal WMS≤4
2007Orthophotos (C)—national coverage1:10,000National Geoportal WMS≤4
2010Orthophotos (C)—national coverage1:10,000Liguria Region Geoportal WMS≤4
2016Orthophotos (C)—regional coverage1:5000Liguria Region Geoportal WMS≤4
2018Google Earth images (C)1:2500 *QGIS plugin Quick Map Services **3
2020Google Earth images (C)1:2500 *QGIS plugin Quick Map Services **3
Table 2. Active-channel planform migration matrix (I: intense; M: moderate; S: slight; N: no/very slight) obtained from the combination of CAI and CFI classes (VH: very high; H: high; M: moderate; L. low; VL: very low). Each class includes its upper limit.
CAI (%)>7550–7535–5015–35≤15
CFI (%)ClassVHHMLVL
>75VHIII *I *I *
50–75HIII *M *M *
35–50MI **I **MS *S *
15–35LI **M **S **NN
≤15VLI **M **S **NN
* (**) The active-channel migration process is mainly associated with the formation (abandonment) of active-channel area and does not correspond to an overall active-channel displacement.
Table 3. Main morphological features of identified reaches referred to the 2020 active channel. The sinuosity index (SI) and braiding index (BI) are dimensionless parameters. PC: partly confined; U: unconfined; SAB: sinuous with alternate bars; ST: straight.
ReachLength (km)Average Width (m)Area (ha)ConfinementSIBIChannel Pattern
A11.58589.19PC1.11SAB
A22.6010627.58U1.11.1SAB
A33.5513246.79U1.11.2SAB
N11.96397.64PC1.11SAB
N22.065511.39U11ST
C12.0311022.36U11.1SAB
C21.3210914.48U11ST
Table 4. Reach-scale active-channel planform migration based on the combination of CAI and CFI. M: moderate; S: slight; N: no/very slight (Table 2).
PeriodA1A2A3N1N2C1C2
1930–1954M **S **M **NNNS **
1954–1973NM **S **S **S **S **N
1973–1988NNNNNNN
1988–1997NNNNNNN
1997–1999NNNNNNN
1999–2007NNNNNNN
2007–2010NNNNNNN
2010–2016NNNNNNN
2016–2018NNNNNNN
2018–2020NNNNNNN
1930–2020M **M **M **S **M **S **N
1954–2020NM **S **S **M **NN
** The active-channel migration process is mainly associated with the abandonment of active-channel area.
Table 5. Area (%) of each LULC class of the abandoned areas of 1930, 1954, and 1973 active channels (Figure 10) that is included within the macrochannel. Reaches A1 and N1 were not considered as they do not display the macrochannel. Zero indicates that the active-channel abandoned areas showing the LULC class which this value refers to are not included within the macrochannel; the absence of value indicates that no active-channel abandoned areas showing the LULC class which the null value refers to were mapped in the whole reach.
LULC1930–20201954–20201973–2020
A2A3N2C1C2A2A3N2C1C2A2A3N2C1C2
S 100.0 100.0
N83.574.797.998.7100.085.572.698.597.9100.099.083.6100.099.8100.0
A2.40.00.0 43.20.00.0
M1.40.01.2 2.90.02.1 9.20.0100.0
Q 0.2 1.1 0.8
T0.10.00.21.422.10.10.03.90.4 0.0
I 0.00.0 0.00.0 0.0
U0.00.00.00.00.00.0 0.0100.0 0.0
Publisher’s Note: MDPI stays neutral with regard to jurisdictional claims in published maps and institutional affiliations.

