
Progress and Trends in the Application of Google Earth and Google Earth Engine


1
School of Geography and Ocean Science, Nanjing University, Nanjing 210023, China
2
Ministry of Education Key Laboratory for Earth System Modeling, Department of Earth System Science, Tsinghua University, Beijing 100084, China
3
Ministry of Education Ecological Field Station for East Asian Migratory Birds, Beijing 100084, China
4
College of Land Science and Technology, China Agricultural University, Beijing 100083, China
5
Key Laboratory of Digital Earth Science, Chinese Academy of Sciences Aerospace Information Research Institute, Beijing 100083, China
6
Department of Geography, The University of Hong Kong, Hong Kong, China
7
Department of Earth Sciences, The University of Hong Kong, Hong Kong, China
*
Author to whom correspondence should be addressed.
Remote Sens. 2021, 13(18), 3778; https://0-doi-org.brum.beds.ac.uk/10.3390/rs13183778
Submission received: 5 August 2021
/
Revised: 9 September 2021
/
Accepted: 13 September 2021
/
Published: 21 September 2021
(This article belongs to the Special Issue Feature Papers for Remote Sensing Image Processing Section)
Abstract
:Earth system science has changed rapidly due to global environmental changes and the advent of Earth observation technology. Therefore, new tools are required to monitor, measure, analyze, evaluate, and model Earth observation data. Google Earth (GE) was officially launched by Google in 2005 as a ”geobrowser”, and Google Earth Engine (GEE) was released in 2010 as a cloud computing platform with substantial computational capabilities. The use of these two tools or platforms in various applications, particularly as used by the remote sensing community, has developed rapidly. In this paper, we reviewed the applications and trends in the use of GE and GEE by analyzing peer-reviewed articles, dating up to January 2021, in the Web of Science (WoS) core collection using scientometric analysis (i.e., by using CiteSpace) and meta-analysis. We found the following: (1) the number of articles describing the use of GE or GEE increased substantially from two in 2006 to 530 in 2020. The number of GEE articles increased much faster than those concerned with the use of GE. (2) Both GE and GEE were extensively used by the remote sensing community as multidisciplinary tools. GE articles covered a broader range of research areas (e.g., biology, education, disease and health, economic, and information science) and appeared in a broader range of journals than those concerned with the use of GEE. (3) GE and GEE shared similar keywords (e.g., “land cover”, “water”, “model”, “vegetation”, and “forest”), which indicates that their application is of great importance in certain research areas. The main difference was that articles describing the use of GE emphasized its use as a visual display platform, while those concerned with GEE placed more emphasis on big data and time-series analysis. (4) Most applications of GE and GEE were undertaken in countries, such as the United States, China, and the United Kingdom. (5) GEE is an important tool for analysis, whereas GE is used as an auxiliary tool for visualization. Finally, in this paper, the merits and limitations of GE and GEE, and recommendations for further improvements, are summarized from an Earth system science perspective.
1. Introduction
Global environmental change is one of the most critical challenges facing attempts to achieve sustainable development. The concept of Earth system science was first proposed by the Earth System Sciences Committee of NASA (National Aeronautics and Space Administration) in the 1990s [1]. This interdisciplinary science emerged to address global environmental change in a way that was systematic and integrated. Yu and Gong [2] identified three challenges facing traditional geographic information science (GIS): (1) the 3D global representation and visualization of geospatial data from local to global scales; (2) the preprocessing and mining of geographic big data; and (3) spatial-temporal techniques for research into geographic processes. There is an urgent need to make significant technological advances to solve global environmental problems [2]. In connection with this, the use of Google Earth (GE) and Google Earth Engine (GEE) to analyze environmental problems at global scales is becoming common.
Released in 2005 by Google, GE has become the most popular and successful virtual globe tool and can effectively address the first challenge mentioned above [2]. Later, similar products, such as NASA World Wind (released in 2004), Microsoft Virtual Earth (released in 2005, now Bing Maps Platform), ESRI ArcGIS Explorer (released in 2006), and Cesium (released in 2012), emerged [2,3]. The concept of Digital Earth (Virtual Earth) was initially proposed by former U.S. vice president Al Gore in 1998 and was described as a computer-generated three-dimensional virtual globe with visualization functions that was easy to use, was interoperable, and could be used for modeling and simulation [4]. Among the virtual globe tools described above, GE has proved to be the most popular and has advantages in terms of visualization, ease of access to a wide range of geospatial data, and a unified coordinate system; however, it still lacks extendibility [2]. In recent years, GE was used for research on geomorphology [5,6,7,8], ecology [9,10,11,12], geology [13,14,15,16], the atmosphere [17,18], disasters [19,20,21,22,23,24,25], social science [26], and urban studies [27,28,29,30,31,32], and has served as an essential tool in studies of global environmental change. In addition, GE was also widely used in education, especially in the teaching of geography, because of its great ability to provide virtual visualizations of the Earth [33,34,35]. According to the reviews by Yu and Gong [2], Goodchild [4], and Liang et al. [3], the advantages of GE can be divided into six categories related to visualization and data exploration, data collection, validation, data integration and interoperability, simulation, and ease of use. Although the use of GE as a digital globe is thriving because it provides easy-to-use visualizations, GE also has many limitations, including inconsistent image quality, a limited capability for making quantitative measurements, a lack of analytical functionality, and the inability to support precise global spatial simulations [2]. GE can effectively address the first of the challenges described at the beginning of the Introduction, but not the other two.
Google Earth Engine (GEE) is a cloud computing platform that was launched by Google in 2010 [36]. Since then, GEE has demonstrated its capacity to address the second challenge listed at the beginning of this section. GEE enables cloud computation and is an effective tool for carrying out the analysis of global geospatial big data. Other cloud platforms that can be used for processing geospatial big data include Amazon Web Services (AWS, released in 2006) and Microsoft Azure (released in 2010) [37]. Compared with other cloud platforms, GEE supports more types of geospatial data (for example, Sentinel and early Landsat data) and provide services free to all users, which is especially important in less developed countries. GEE is currently the most popular cloud computing platform in Earth system science (see Section 4.1) and was extensively used to process data related to a variety of fields concerned with environmental change, including agriculture [38,39,40,41,42], water [43,44,45,46,47], land cover/land use [48,49,50,51], disasters [52,53,54,55,56], climate change [57,58], soil [59,60,61,62], wetland [63,64,65,66,67,68], forest [69,70], and urbanization [71,72,73,74] as well as other fields [37,75]. GEE provides users with publicly downloadable Earth observation data at the petabyte scale, advanced algorithms for analyzing geographic big data, and an interactive programming environment. GEE also hosts long time-series of Earth observation records and plays a vital role in environmental monitoring and analysis [36]. However, in contrast to GE, GEE can only display global geospatial data in two dimensions and lacks the more advanced visualization capabilities of GE.
GE and GEE can be combined to use as a coupled platform for conducting Earth system science studies and both are effective tools for addressing the challenges facing traditional GIS that were proposed by Yu and Gong [2]. Although GE and GEE meet the needs of research on global environmental change to a certain extent, tools that can fully address the challenges proposed by Yu and Gong [2] have yet to emerge, and the progress of Earth system science still faces challenges. Analyzing these two effective Earth system science tools is of significance to the development of tools that can address these challenges. In this review, the similarities and differences between GE and GEE are systematically examined using scientometric analysis (e.g., by using CiteSpace) and meta-analysis. This analysis covers the development process, the publications and journals in which relevant articles were published, application fields, and research focuses. The merits and limitations of GEE and GE are identified and a comprehensive comparison with other similar tools is made. Finally, we identify possible further tools for use in Earth system science. We hope this review will promote the future development of GE and GEE, and provide innovative ideas that will aid the development of improved tools for use in Earth system science.
2. Materials and Methods
2.1. Data Collection and Processing
We used “Google Earth” and “Google Earth Engine” as keywords to retrieve relevant articles and review articles from the Web of Science (WoS) (https://www.webofscience.com/, accessed on 31 May 2021) core collection, including the SCIE (Science Citation Index Expanded) and SSCI (Social Sciences Citation Index), dated up to January 2021. After screening, 1334 articles related to “Google Earth” and 565 articles related to “Google Earth Engine” were obtained (see Supplementary Material).
2.2. Scientometric Analysis
Most of the analysis in this article is based on CiteSpace, a powerful bibliometric analysis software [76]. CiteSpace can analyze document co-citations, keyword co-occurrences, and cooperative maps, thus enabling the exploration of knowledge base, structural frameworks, and research frontiers in research that is based on GE and GEE. These types of analyses can provide a basis for the subsequent application and development of GE and GEE.
3. Scientometric Analysis
3.1. Statistical Characteristics
As shown in Figure 1, the number of published papers describing the use of GE and GEE, and the number of times these papers were cited, have both increased significantly in recent decades. In the case of GE, there were three main stages: stage one (2006–2008), which was a period of slow development; stage two (2009–2015), which was a period of rapid development; and stage three (since 2016), which is a period of proliferation. In stage one–prior to 2008–the application of GE and related research developed slowly as GE was not yet fully explored and its functions were limited. For example, many vital functions (e.g., historical imagery and support for 3D imagery) were not introduced until after 2008 (https://en.wikipedia.org/wiki/Google_Earth, accessed on 31 May 2021). Later, GE gradually became more widely used: dozens of articles were published every year, and the mean increase of citations increased to about 300 times per year. This trend of increased use continued after 2016 and, in 2020, 231 papers on GE were published and there were 5115 citations.
GEE was launched in 2010; however, it was difficult to make use of GEE in scientific research until 2015. As a result, there were few relevant publications or citations made during the period of 2010–2015. After 2015, the number of publications and citations increased exponentially due to the significantly improved interface, data cube, and programming environment. In 2020, the number of GEE publications (299) exceeded the number related to GE, indicating its great potential for use in scientific research.
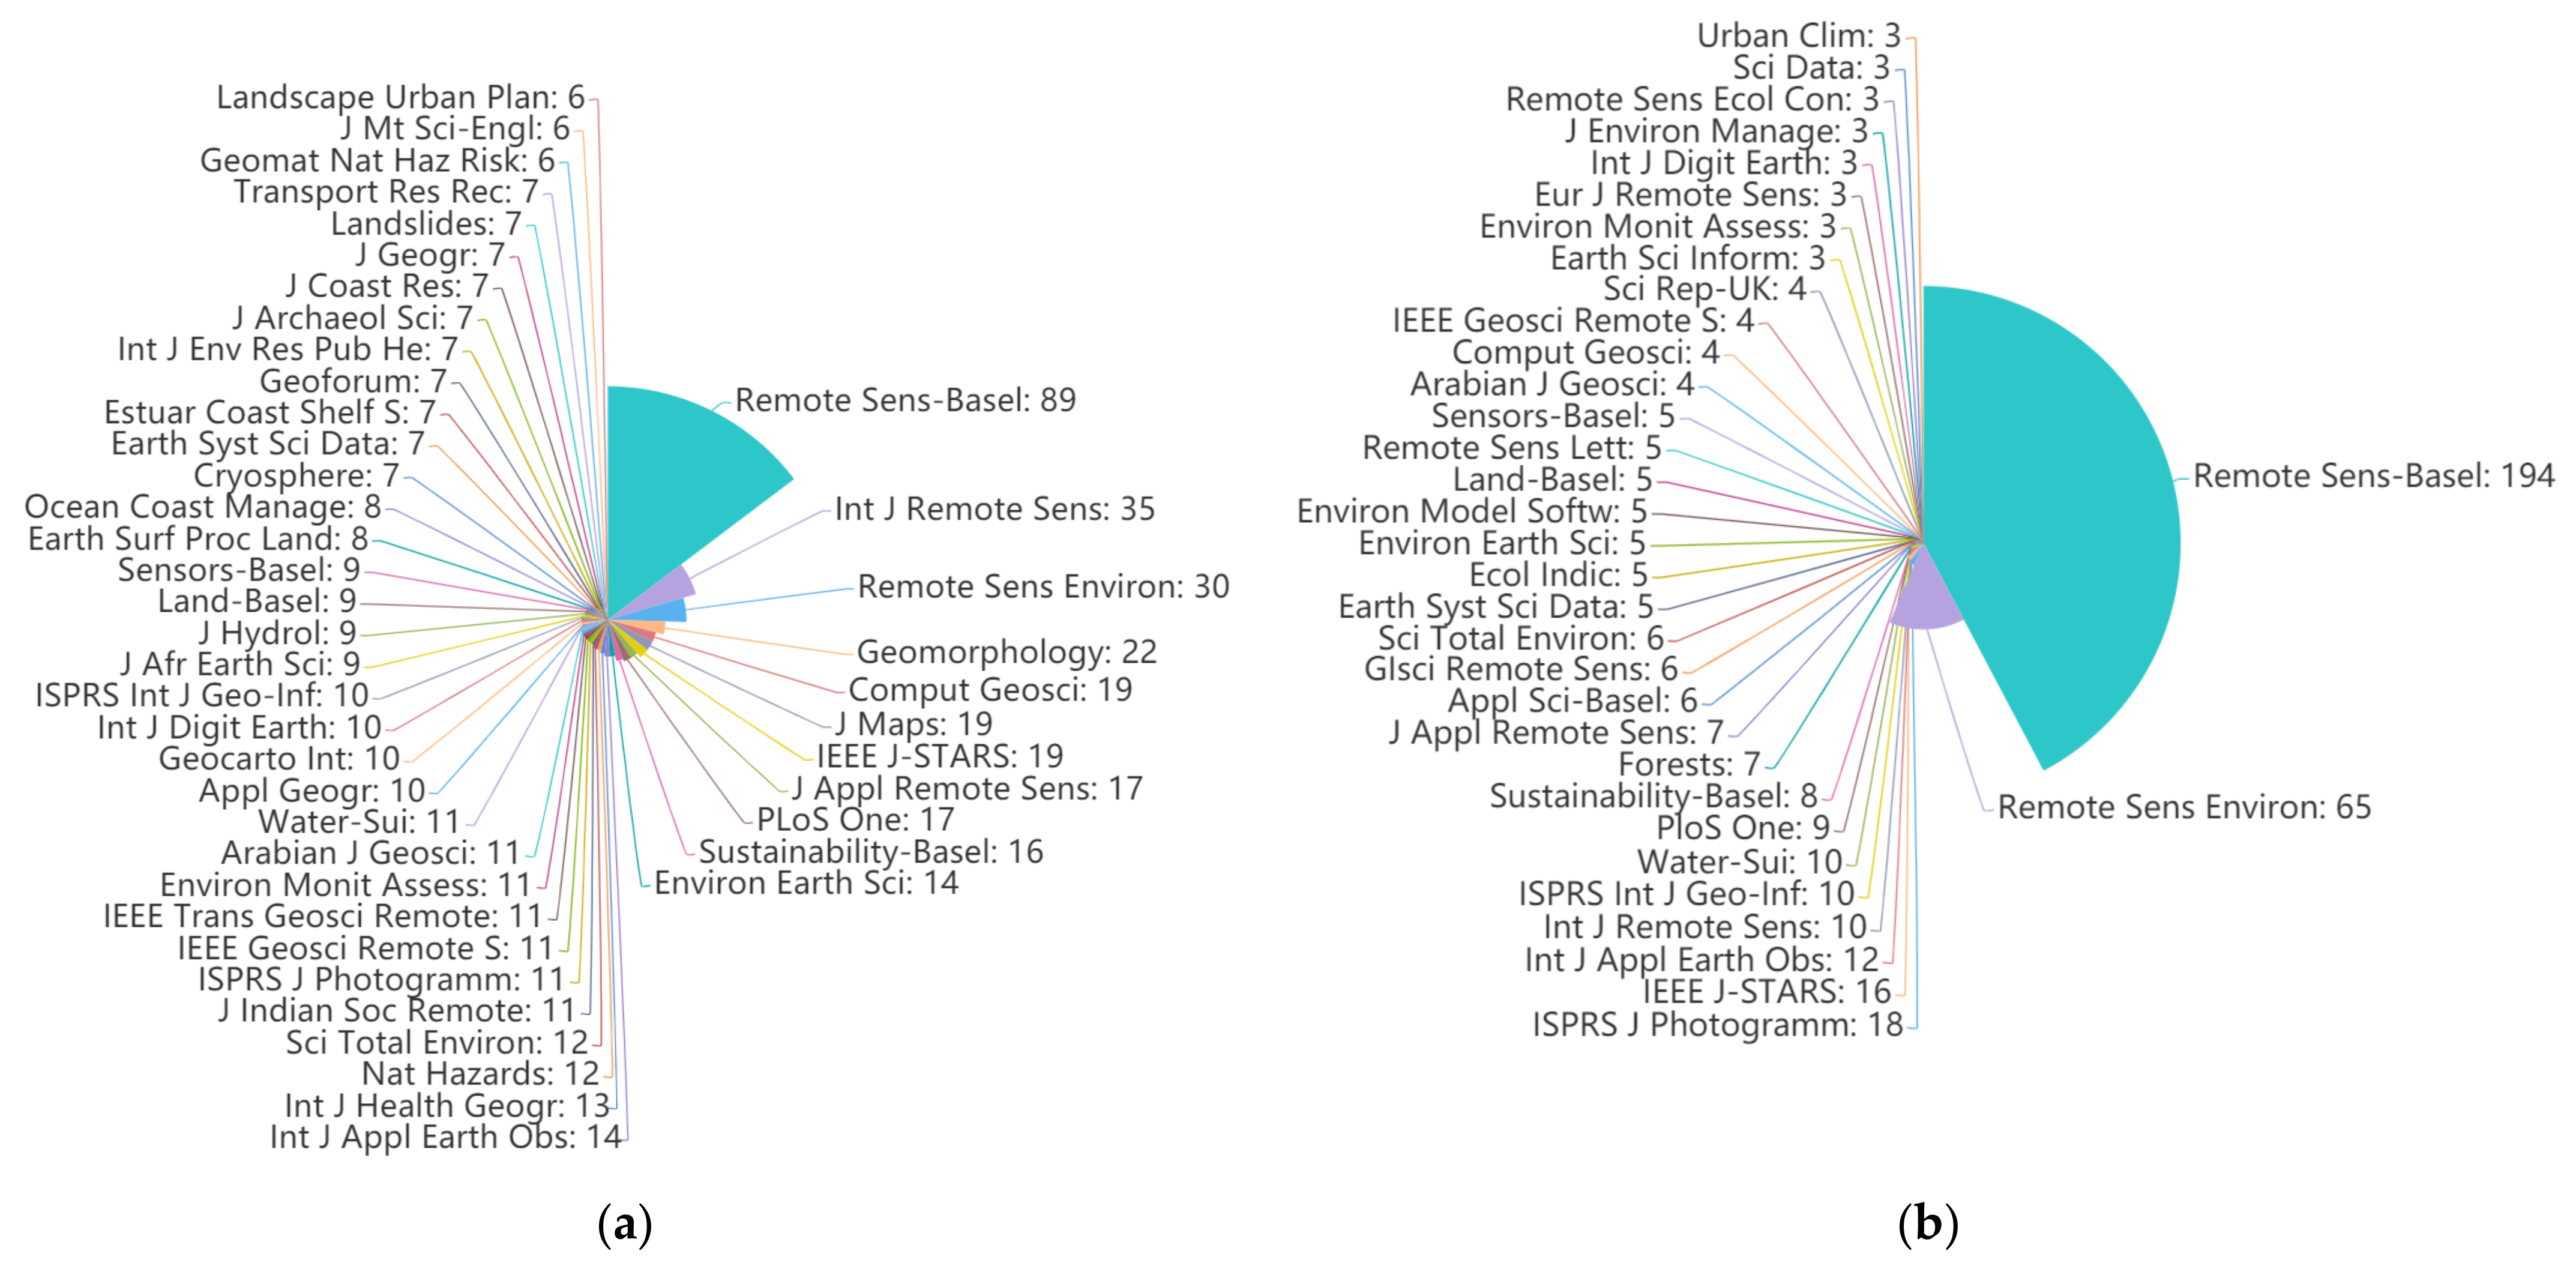
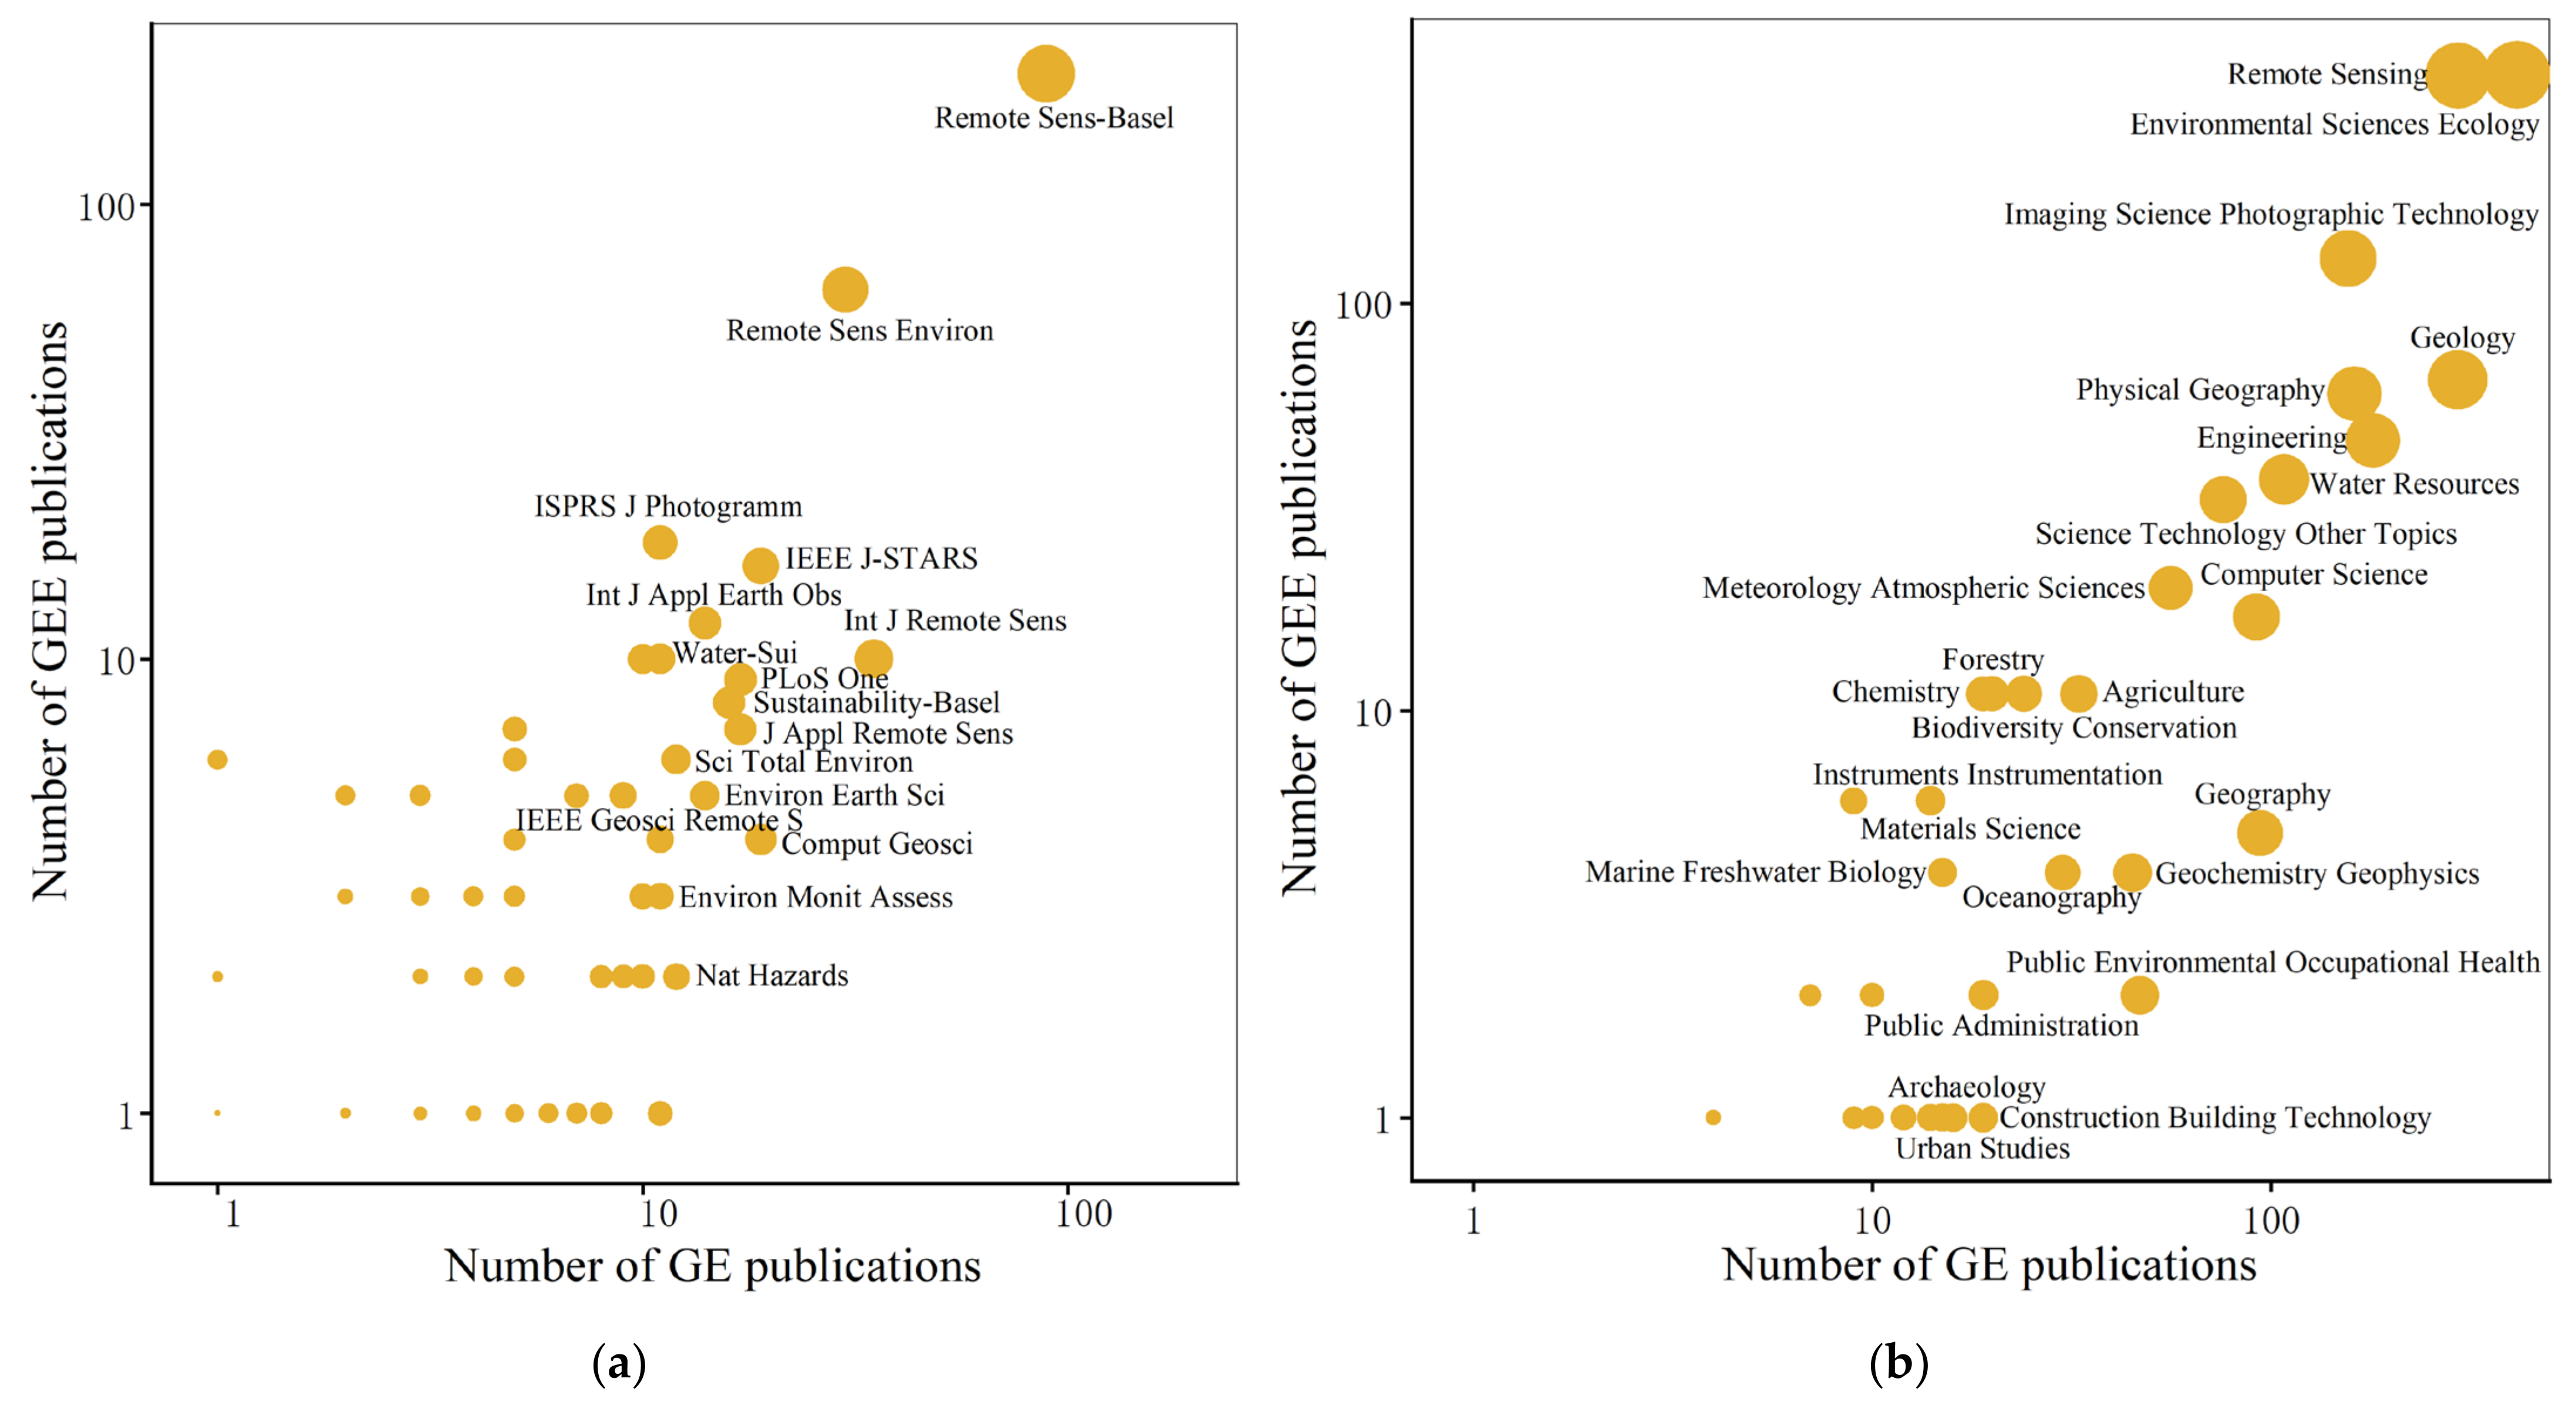
A total of 1334 articles describing the use of GE were published in 547 journals relating to fields such as remote sensing, computer science, the environment, and GIS (Figure 2a). The top ten journals were Remote Sensing (89), The International Journal of Remote Sensing (35), Remote Sensing of Environment (30), Geomorphology (22), Computers and Geosciences (19), The IEEE Journal of Selected Topics in Applied Earth Observations and Remote Sensing (19), The Journal of Maps (19), The Journal of Applied Remote Sensing (17), PloS One (17), and Sustainability (16). The publications referencing GE spanned a broad spectrum of journals. However, more than half of all journals (376) published just one article on GE, and only 22 journals published more than ten (Figure 2a). The journals that published papers on GEE were mainly thematic. A total of 565 papers referencing GEE were published in 121 journals, and the top ten journals accounted for 62% of the total (Figure 2b. These top ten journals were Remote Sensing (194), Remote Sensing of Environment (65), The ISPRS Journal of Photogrammetry and Remote Sensing (18), The IEEE Journal of Selected Topics in Applied Earth Observations and Remote Sensing (16), The International Journal of Applied Earth Observation and Geoinformation (12), The International Journal of Remote Sensing (10), The ISPRS International Journal of Geo-Information (10), Water (10), PloS One (9), and Sustainability (8). This meant that the journals Remote Sensing and Remote Sensing of Environment accounted for 46% of the total. Of the 121 journals, 68 published only one paper on GEE. Publications on GEE were mostly about remote sensing, geo-information, and the environment. The GEE papers were concentrated in a smaller number of journals than the GE papers, and six out of the top ten journals were the same in both cases. Although the GE and GEE papers were distributed among a wide range of journals, the actual number of articles posted in most of these journals was small.
GE had a wider impact than GEE in terms of the interdisciplinary nature of applications and users. The most influential journals that published only GE papers included Geomorphology, The International Journal of Health Geographics, Cryosphere, and Transportation Research Record. These journals focus on the expression of land surface morphology, as well as social and economic information, fields in which GE has a number of considerable advantages over GEE due to its 3D presentation of geographic information.
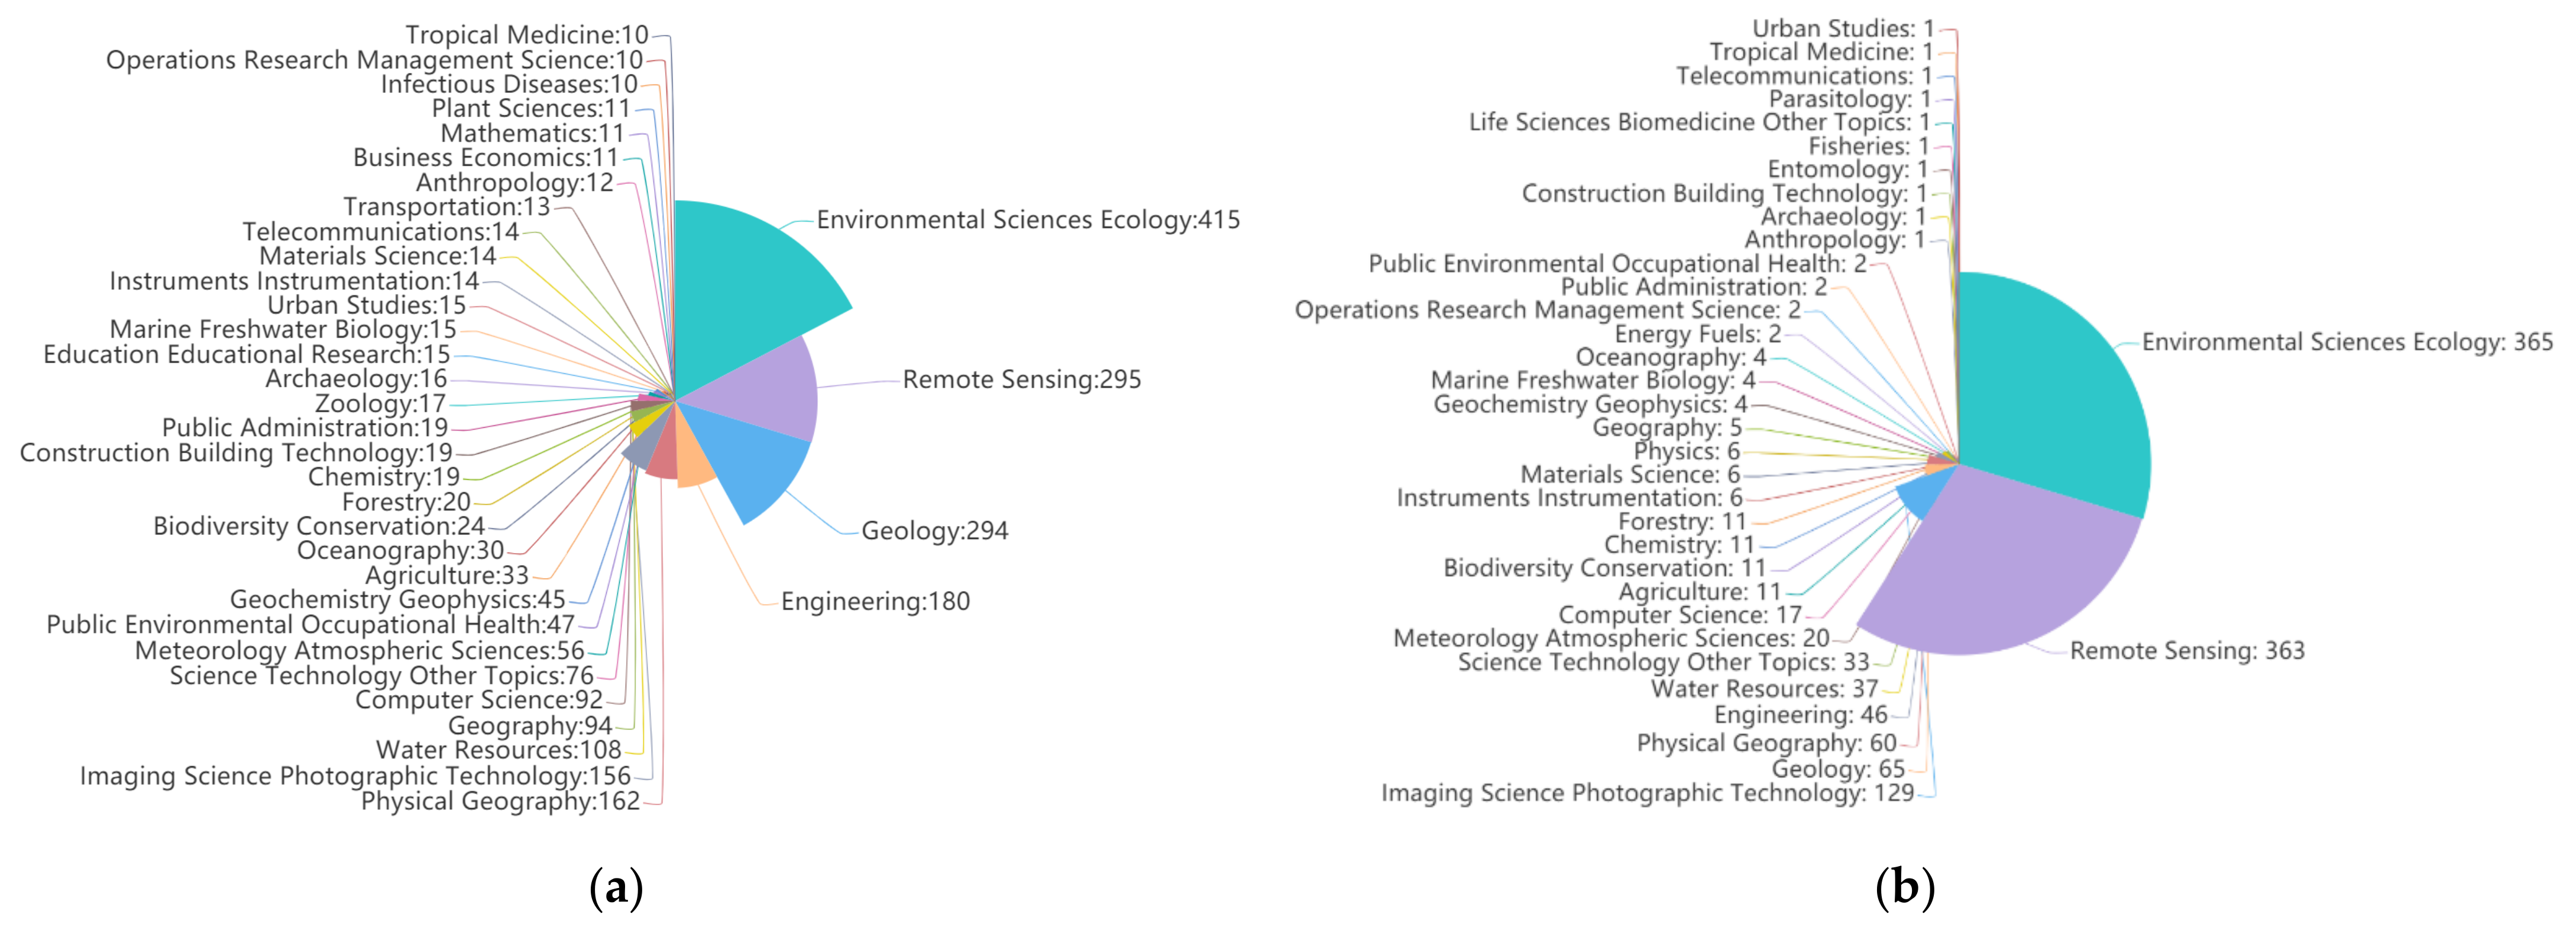
The main areas of research related to the GE and GEE papers were obtained from the WoS website using subject categories (Figure 3). The WoS schema is comprised of 252 subject areas, such as science, social sciences, and arts and humanities (https://incites.help.clarivate.com/Content/Research-Areas/research-areas.htm, accessed on 31 May 2021). The GE publications found related to 102 different disciplines (Figure 3a). The research areas with more than 100 related articles were in environmental sciences and ecology (415), remote sensing (295), geology (294), engineering (180), physical geography (162), imaging science and photographic technology (156), and water resources (108). These seven categories accounted for 62% of the total (Figure 3a). In relation to the 102 disciplines, 48 research areas were found one or two times, and 66 were found fewer than ten times. The number of research disciplines covered by the GEE publications were far fewer. The 565 papers on GEE covered only 35 of the WoS disciplines and were concentrated in fewer disciplines than the GE papers. The research areas with more than 100 publications were environmental sciences and ecology (365), remote sensing (363), and imaging science and photographic technology (129). These three research areas alone accounted for 70% of the total (Figure 3b). It is noteworthy that the top seven research disciplines for GE and GEE were the same, which indicates that GE and GEE have similar application domains.
The published GE and GEE articles were related to similar research areas. However, GE was found to have applications in a more extensive range of research areas than GEE. For example, the GE publications were concentrated in the fields of biology, education, disease and health, economics, and information science, whereas there was almost no application of GEE in these research areas.
3.2. Knowledge Base Analysis
A total of 1334 articles referencing GE and 565 articles referencing GEE were exported from the core WoS collection and analyzed using the CiteSpace bibliometric software [76]. We conducted a literature co-citation analysis, co-occurrence keyword analysis, and cooperative mapping analysis [76]. The knowledge base, subject structure, research focus, and cooperative relationships of the published GE and GEE papers were explored in-depth to provide a foundation for the application of GE and GEE in the future.
Based on the co-citation analysis of the cited papers, we carried out an analysis of the relationship between the cited references related to the application of GE and GEE [76]. A total of six GE clusters were identified, and these included papers on ship detection, the virtual globe, the mapping of land conversion, Earth’s lithosphere, glacial geomorphology, and Google Earth. A total of ten GEE clusters were identified, and these included papers related to tidal flats, Landsat time series, land surface temperature, wetlands, the recursive hierarchical segmentation method (RHSEG), central Asia, land-use change, nighttime lights, the NDVI, and yield estimation. The clustering results suggested that GE was widely applied as a virtual Earth in studies on ship detection [77,78,79,80,81,82,83], land-conversion mapping [84,85,86], glacial geomorphology [6,87,88,89,90,91], and the Earth’s lithosphere [92].
The use of GE is preferred when simple observations of the land surface are made; e.g., the Keyhole Markup Language (KML) has significantly improved the visualization capability of GE. The KML became an Open Geospatial Consortium (OGC) standard in 2008, making GE more interoperable and applicable to a wider range of geospatial data sets [2]. GEE is used to analyze surface conditions and to perform more in-depth processing of geographic big data. Although GEE does not have an advantage in terms of visualization, GEE can process substantial amounts of geospatial data as it supports a range of image processing algorithms, can process geospatial data on a large scale, and can be used for the segmentation of remote sensing imagery as well as the analysis of surface conditions.
3.3. Subject Structure Analysis
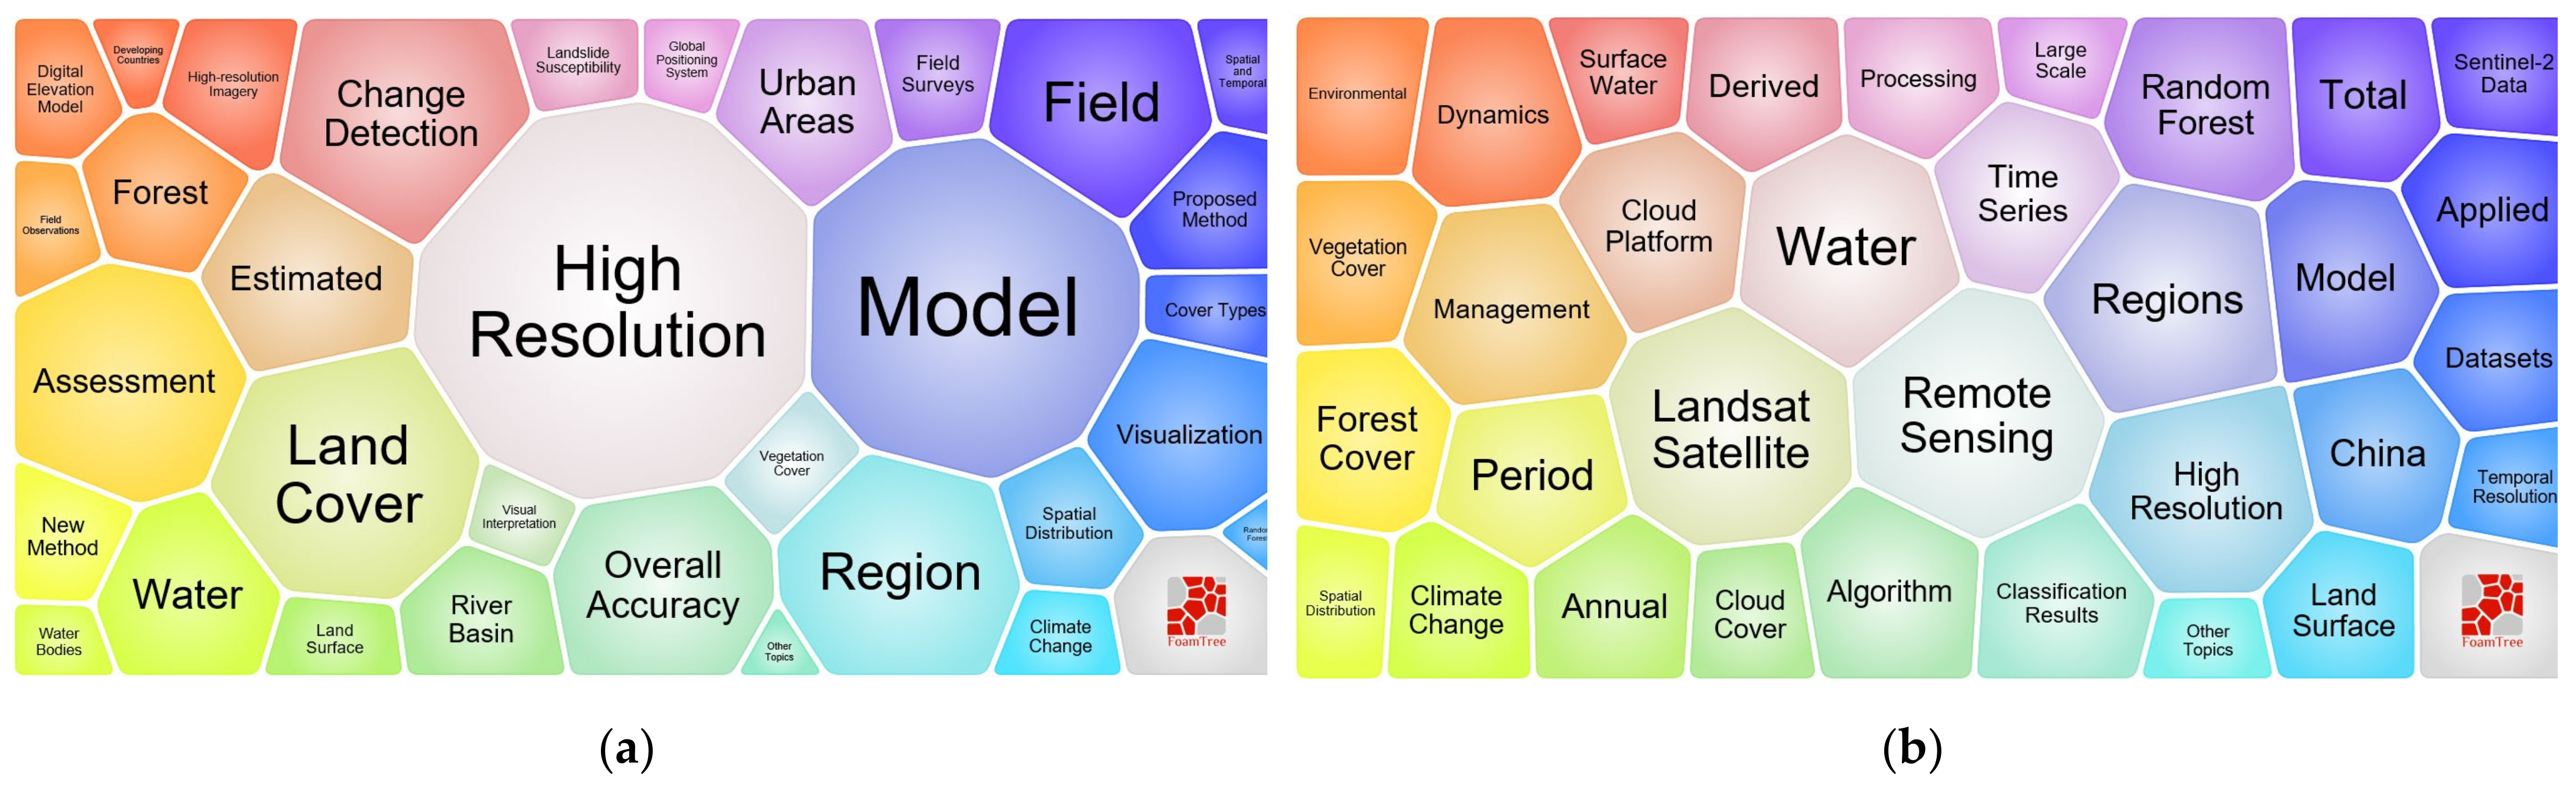
Based on the analysis of keywords conducted on the literature related to GE (Figure 4a), it was found that “high resolution” (referring to spatial resolution) had the highest frequency, with 1039 occurrences. GE provides free, easy, and stable high-spatial resolution satellite data of the whole globe. These data have good horizontal positional accuracy [93], but improvements to the consistency of the image quality are still required [2]. From Figure 4a, it can be seen that the keywords with a large number of occurrences (larger areas in the figure) included “model”, “land cover”, “change detection”, “region”, “assessment”, “field”, “overall accuracy”, “estimated”, and “visualization”; these occur 743, 431, 412, 377, 356, 332, 307, 259, and 258 times, respectively. It can be observed from the keywords that 3D modeling based on the data provided by GE is one of the main ways in which GE was applied. That is, GE was the primary data provider for various land-cover observations. In addition, GE also served as a platform for displaying a wide range of geographic information, including information on water, forests, urban and other land cover types, vegetation indices, sample data, and other derived products. Sphere visualization is one of GE’s most distinctive techniques and enables GE to display heterogeneous data sets for use in academic communication. Thus, Earth system scientists can use GE as a tool to more easily conduct Earth system science research from a global perspective.
According to the analysis of keywords in the literature on GEE (Figure 4b), it was found that “remote sensing”, “regions”, and “Landsat satellite” appeared most frequently, for a total of203, 197, and 189 times, respectively. GEE was used to collect various types of open-source geographic information, including remote sensing data, data on land-surface conditions, and other relevant derived products that are freely accessible to users. However, there are several limitations on the use of datasets in GEE: e.g., the data sets stored in GEE are not comprehensive (for example, complex SAR is not included), and there is a limit to the amount of user-uploaded data that can be stored. From Figure 4b, it is evident that the most frequently occurring keywords include “water”, “high resolution”, “management”, “random forest”, “algorithm”, “cloud platform”, and “model”, which appear 174, 165, 154, 134, 129, 126 and 124 times, respectively. The machine-learning algorithms in GEE allow for convenient data processing and information extraction. However, there are still some types of image-processing algorithms that are not supported by GEE, such as Gaussian and Laplacian filters, edge-detection methods, and frequency domain algorithms [36]. Due to the advantages that GEE has in processing geographic big data, the use of GEE makes it simpler and more efficient to obtain annual regional geographical information [37]. The GEE keywords were found to be different from those found for GE and included words related to large-scale or global research and regional temporality (keywords: “time series”, “annual”, “period”, “regions”, and “large scale”). GEE has wider applications in climate and the environment than GE; however, many keywords–such as “land cover”, “water”, “model”, “vegetation”, and “forest”–commonly occurred in relation to both.
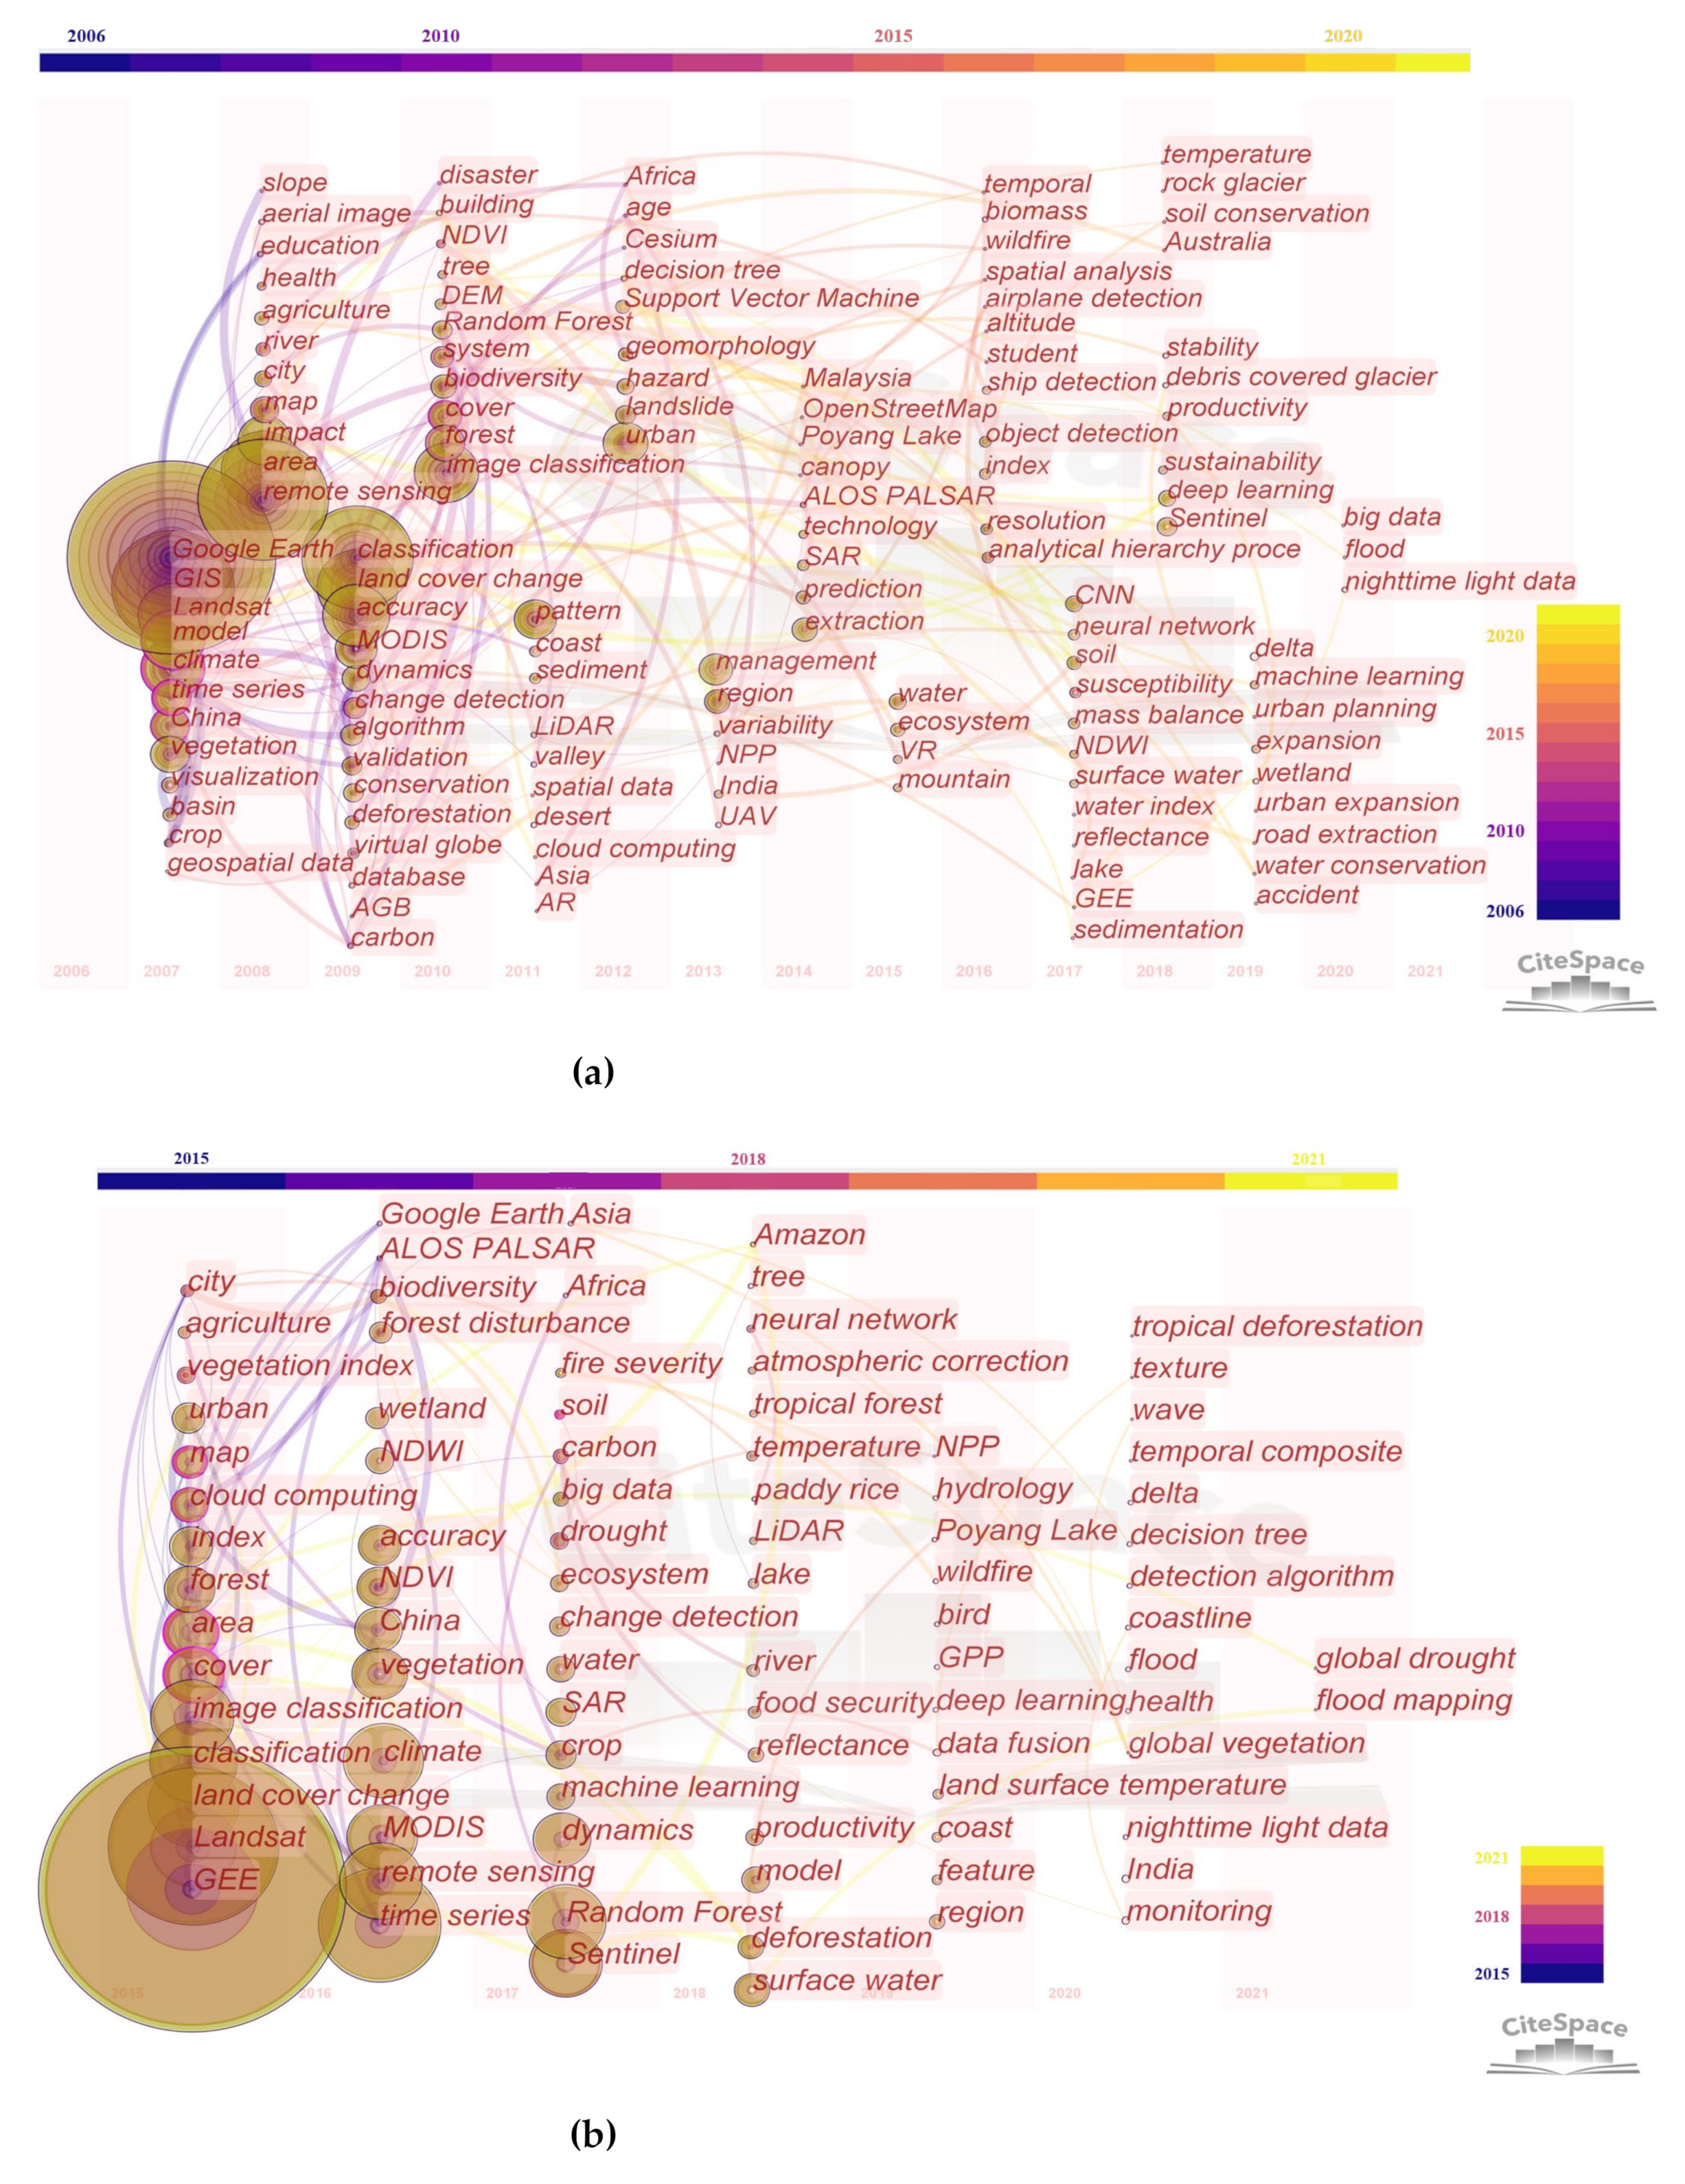
Based on the three stages that were discussed in relation to Figure 1, we divided the occurrence frequencies shown in Figure 5a into three stages for analysis. During stage one (2006–2008), although the application of GE was then still in its infancy, many of the keywords used were consistent with future applications and included “Google Earth”, “GIS”, “model”, “Landsat”, “climate”, “China”, “time series”, and “remote sensing”. These keywords had a relatively high frequency, or betweenness centrality. In stage two (2009–2015), the application of GE entered a period of stable development. Again, many keywords that appeared during this period determined the primary research direction, and included “classification”, “land cover change”, “MODIS”, “change detection”, “accuracy”, “pattern”, “image classification”, “forest”, and “cover”. These keywords represented the main applications of GE during this period. In stage three (since 2016), the application of GE has boomed, and many new keywords were used. Among these new keywords, the ones that appeared most frequently were “CNN”, “neural network”, “soil”, “deep learning”, and “Sentinel”, which reflects the use of high-resolution images and artificial intelligence during this period.
GEE was released later than GE, which means that it was some time before applications of GEE appeared in the literature; since then, however, the number of appearances has increased rapidly. Papers describing the application of GEE began to appear in 2015 (Figure 5b), and, since then, many keywords have appeared, including “GEE”, “Landsat”, “land cover change”, “classification”, “cover”, “image classification”, “area”, “forest”, “map”, “cloud computing”, “time series”, “remote sensing”, “MODIS”, “vegetation”, “China”, “algorithm”, “climate”, “random forest”, “Sentinel”, and “dynamics”. Many similar keywords were used in relation to GEE and GE, especially in studies of land cover/land use, such as those on vegetation, water, soil, and rivers and lakes, as well as in studies on classification methods (e.g., machine learning). The main difference was that GEE applications focused more on time series, cloud computing, and geographic big data.
3.4. Research Contribution Analysis
Table 1 and Table 2 show the top ten key papers on GE and GEE applications that were obtained using the burst detection tool in the CiteSpace software. The burst detection tool identifies literature that makes an outstanding contribution to a particular research area. Terms such as strength, begin, and end of papers are also obtained using burst detection tool. The strength of the burst represents the importance of the study, while the start and end years represent the range of its influence [76].
Table 1 lists the cited papers that were found to correspond to the strongest citation bursts in GE articles. This list consists of papers that were important to the promotion, development and application of GE. In 2006, Butler [94] published a paper that described a systematic evaluation of the GE platform. He stated that GE was changing the world because it made the communication of spatial information between stakeholders and government agencies feasible. GE’s data-sharing capability was an essential property for global climate change studies. Potere [93] verified the horizontal positioning accuracy of high-resolution GE imagery by selecting 436 control points in 109 cities worldwide. The results obtained using GE imagery were found to be sufficiently accurate for most urban research and the reliability of this imagery for use in subsequent applications was verified. Yu and Gong [2] published the first review of GE in 2012; this review examined the progress made in using GE, prospects for its use, and identified the merits and limitations of GE when applied to Earth science. This review was instructive in terms of the consideration of future applications of GE and the development of the virtual globe platform. Other important papers discussed new types of global geographic data [95,96,97,98] and image processing or accuracy assessment algorithms that had a significant impact on the application of GE [99,100] and Earth system science. Chang et al. [101] built a dengue surveillance system that was based on GE images and geographic information related to the incidence of dengue fever. This proved to be a successful GE application.

Table 1.
GE papers with the strongest citation bursts.
| Article | Author | Year | Strength | Begin | End |
|---|---|---|---|---|---|
| The web-wide world [94] | Butler, D | 2006 | 10.13 | 2008 | 2011 |
| Google Earth as a virtual globe tool for Earth science applications at the global scale: progress and perspectives [2] | Yu, L | 2012 | 9.92 | 2013 | 2017 |
| Horizontal Positional Accuracy of Google Earth’s High-Resolution Imagery Archive [93] | Potere, D | 2008 | 6.74 | 2009 | 2013 |
| MODIS Collection 5 global land cover: Algorithm refinements and characterization of new datasets [95] | Friedl, MA | 2010 | 6.14 | 2012 | 2015 |
| Finer resolution observation and monitoring of global land cover: first mapping results with Landsat TM and ETM+ data [96] | Gong, P | 2013 | 5.94 | 2015 | 2018 |
| Deep Residual Learning for Image Recognition [99] | He, KM | 2016 | 5.64 | 2018 | 2021 |
| High-Resolution Global Maps of 21st-Century Forest Cover Change [97] | Hansen, MC | 2013 | 5.61 | 2014 | 2018 |
| Good practices for estimating area and assessing accuracy of land change [100] | Olofsson, P | 2014 | 5.2 | 2017 | 2019 |
| Global land cover mapping at 30 m resolution: A POK-based operational approach [98] | Chen, J | 2015 | 5.12 | 2017 | 2018 |
| Combining Google Earth and GIS mapping technologies in a dengue surveillance system for developing countries [101] | Chang, AY | 2009 | 4.8 | 2012 | 2014 |
Table 2 lists the cited papers that were found to have the strongest citation bursts in GEE articles. Three papers overlapped with the list of GE papers shown in Table 1. The overlapped three papers (i.e., [96,97,100]) reported on progress in using global land-cover products and other related findings, including the methods used for global product construction and accuracy assessment. Although these three documents were more focused on GE, in these studies, GE was only used as a data provider for assessment and display. In contrast, GEE is a cloud computing platform that has the capacity to provide and process geographic big data, and provides an excellent platform for carrying out global land cover research [96,97,100]. Landsat data are a vital source of satellite imagery that is available on GEE. Roy et al. [102] evaluated the capabilities of Landsat 8 data and identified new opportunities for scientific research and applications using these data. This paper also laid a solid foundation for the application of Landsat 8 remote sensing data in resource management and global change studies using GEE. An important characteristic of GEE is the availability of geographic big data. Wulder et al. [103] explained the role of free data in promoting new scientific research, applications, and international collaboration on Earth observation. GEE’s integration of a range of accessible geographic data (including Landsat [102], Sentinel [104], and MODIS [105] data) also promoted progress in Earth system science. Studies on various image processing and geophysical dataset acquisition methods became the main driving force behind the promotion of the application of GEE [106,107,108,109].
Table 2.
GEE papers with the strongest citation bursts.
| Article | Author | Year | Strength | Begin | End |
|---|---|---|---|---|---|
| High-Resolution Global Maps of 21st-Century Forest Cover Change [97] | Hansen, MC | 2013 | 24.13 | 2015 | 2018 |
| Finer resolution observation and monitoring of global land cover: first mapping results with Landsat TM and ETM+ data [96] | Gong, P | 2013 | 6.46 | 2016 | 2018 |
| Good practices for estimating area and assessing accuracy of land change [100] | Olofsson, P | 2014 | 5.36 | 2016 | 2019 |
| Landsat-8: Science and product vision for terrestrial global change research [102] | Roy, DP | 2014 | 5.06 | 2016 | 2019 |
| Opening the archive: How free data has enabled the science and monitoring promise of Landsat [103] | Wulder, MA | 2012 | 4.39 | 2016 | 2017 |
| Object-based cloud and cloud shadow detection in Landsat imagery [106] | Zhu, Z | 2012 | 4.39 | 2016 | 2017 |
| Development of gridded surface meteorological data for ecological applications and modelling [107] | Abatzoglou, JT | 2013 | 3.7 | 2015 | 2018 |
| Automated Water Extraction Index: A new technique for surface water mapping using Landsat imagery [108] | Feyisa, GL | 2014 | 3.65 | 2018 | 2019 |
| Sentinel-2: ESA’s Optical High-Resolution Mission for GMES Operational Services [104] | Drusch, M | 2012 | 3.09 | 2015 | 2017 |
| Multitemporal settlement and population mapping from Landsat using Google Earth Engine [109] | Patel, NN | 2015 | 2.75 | 2015 | 2017 |
3.5. Cooperation Network Analysis
At the institutional level, Chinese scientific institutions have dominated the application of GE and GEE. The top ten scientific institutions in terms of the application of GE were the Chinese Academy of Sciences (101), the University of Chinese Academy of Sciences (39), Wuhan University (28), Beijing Normal University (17), Tsinghua University (13), Ghent University (12), China University of Geosciences (11), Beihang University (11), the University of California, Berkeley (10), and the Catholic University of Leuven (10). In terms of the application of GEE, the top ten institutions were the Chinese Academy of Sciences (102), the University of Chinese Academy of Sciences (53), the United States Geological Survey (23), Tsinghua University (20), Google Incorporated (18), the National Aeronautics and Space Administration (17), Wuhan University (17), the University of Oklahoma (15), the United States Forest Service (13), and the China University of Geosciences (12). The number of published papers from Chinese scientific institutions was far greater than that from institutions in other countries.
At the national level, the number of publications was more concentrated. The top five countries published 1022 GE papers (including duplicates), which accounted for 51.8% of the total number of published papers. The top five countries were the USA (397), China (357), the United Kingdom (115), India (82), and Germany (71). The top five countries published 526 GEE papers (including duplicates), which accounted for 57.9% of the total number of published papers. The top five countries, in this case, were the USA (229), China (203), the United Kingdom (43), Australia (31), and Canada (31). In summary, the United States and China have dominated the application of GE and GEE, and have published a considerable number of related papers, as compared to other countries. According to Nature Index (https://www.natureindex.com/, accessed on 31 May 2021), the United States and China have the largest number of scientific institutions (2637 and 1485, respectively) and published articles (29,207 and 19,084, respectively in 2020) in high-quality peer-reviewed journals. These top-ranking countries produce high-quality research output and participate in high-quality collaboration, which supports our results. Although the United States is not as prominent in terms of the number of published papers at the institutional level, it has many high-level scientific institutions and is important in terms of the number of published papers at the national level.
4. Discussion
4.1. Important Virtual Globes and Remote Sensing Cloud Computing Platforms
Virtual globes were in development for a long time, and, here, we describe several of the popular virtual globes that were first mentioned above. World Wind is a completely open-source virtual globe that is different from GE in that it is a software development kit (SDK) that provides a geographic rendering engine: users can build their own geospatial applications to solve problems specific to their own domains (https://worldwind.arc.nasa.gov/, accessed on 31 May 2021). Bing Maps (https://cn.bing.com/maps, accessed on 31 May 2021) and ArcGIS Explorer (https://www.esri.com/zh-cn/arcgis/products/arcgis-explorer, accessed on 31 May 2021) are more akin to web-maps or map-browsers, and mainly provide real-time navigation and positioning rather than 3D globe visualization. Cesium and OpenWebGlobe are open-source 3D geospatial virtual globes based on JavaScript and WebGL that support multiple scene modes (3D, 2.5D, and 2D). World Wind, Cesium, and OpenWebGlobe are superior to GE in terms of multi-dimensional visualization and extendibility, but do not have GE’s ease of use and stable high-spatial resolution images. We used the same method used for GE and GEE articles to retrieve articles related to these virtual globes and found that the number of articles was far less than for GE:World Wind (18), Bing Maps (43), ArcGIS Explorer (3), Cesium (6) and OpenWebGlobe (0). The results found by Yu and Gong [2] confirmed this.
Cloud computing has emerged as a popular research topic in recent years [110,111]. It was widely applied to geospatial big data, and a large number of remote sensing cloud computing platforms were launched. AWS is a comprehensive and widely adopted cloud platform that was developed earlier than GEE and provides a large number of application program interfaces (APIs) [36,112]. Microsoft Azure is a platform contemporary with GEE that provides machine-learning services [36,37]. AWS and Microsoft Azure are both pay-as-you-go platforms [36]. NASA Earth Exchange (NEX) works in a virtual environment to ensure maximum ease-of-use and reproducibility [113]. GEE provides a larger number of geospatial data sets than all of these platforms [112]. Although the API of GEE includes only JavaScript and Python, it is able to meet the needs of most users [112]. Gomes et al. [114] made detailed comparisons of other cloud computing platforms, such as Sentinel Hub (SH), Open Data Cube (ODC), and OpenEO. They believed that GEE is an easy-to-use and mature remote sensing cloud computing platform, and that the data abstraction, physical infrastructure abstraction, processing scalability, and storage scalability provided by GEE stand out as advantages over existing platforms. ODC is currently the best available solution for geospatial big data and has significant advantages over GEE in terms of open governance, infrastructure replicability, data access interoperability, and extendibility. Due to the ease-of-use and maturity of GEE, it was used more widely in Earth system science than other platforms (with the number of relevant articles retrieved from WoS being 14 for AWS, 3 for Microsoft Azure, 34 for NASA Earth Exchange, 5 for SH, and 3 for ODC).
4.2. Correlation Analysis between Published GE and GEE Papers
Figure 6a shows the number of GE and GEE articles that were published in a range of journals. As a peer-reviewed open-access academic journal focused on remote sensing and other geographic disciplines (https://en.wikipedia.org/wiki/Remote_Sensing_(journal), accessed on 31 May 2021), Remote Sensing has published the largest number of papers overall. There are many other journals that have published GE and GEE papers in fields that are related to remote sensing, including land-cover classification, agriculture management, the atmosphere, and climate research. It can be seen, therefore, that GE and GEE are important tools for remote sensing research.
Figure 6b shows the number of GE and GEE papers related to different research areas that were published. The research areas in which GE and GEE were applied frequently include environmental sciences and ecology, remote sensing, imaging science, photographic technology, geology, engineering, and physical geography. Although general patterns in the application of GE and GEE can be seen from these common research areas, the specific ways in which GE and GEE are applied are not clear.
We selected 14 papers describing studies in which both GE and GEE were used from WoS to analyze the relationship between how GE and GEE are used (Table 3). We found that, in most of these studies, GE was used to verify the accuracy of the processed results. This is because GE provides imagery with a high-spatial resolution and thus can be used to examine the ground surface quickly, accurately, and efficiently. GEE was mainly used as the primary data provider and image processing platform. GEE was the most important tool in many of these studies, with GE being used as an auxiliary tool. The lack of GIS analysis functions limits the application of GE, and this deficiency can be significantly compensated for by using GEE. Thus, the combination of GE and GEE can significantly aid geospatial data collection and analysis.
Table 3.
Articles describing studies in which both GE and GEE were used.
| Article Title | Author | Year of Publication | GE Application | GEE Application |
|---|---|---|---|---|
| Mapping global urban boundaries from the global artificial impervious area (GAIA) data [115] | Li, X | 2020 | Data validation | Image-processing platform |
| Nation-scale mapping of coastal aquaculture ponds with Sentinel-1 SAR data using Google Earth Engine [116] | Sun, Z | 2020 | Data validation | Image- processing platform |
| Remote sensing estimation of catchment-scale reservoir water impoundment in the upper Yellow River and implications for river discharge alteration [117] | Deng, X | 2020 | Primary data sources (visual interpretation) | Primary data sources |
| Incorporating synthetic aperture radar and optical images to investigate the annual dynamics of anthropogenic impervious surface at a large scale [118] | Lin, Y | 2020 | Data validation | Image- processing platform |
| Mapping coastal wetlands of China using time-series Landsat images in 2018 and Google Earth Engine [119] | Wang, X | 2020 | Data validation | Image- processing platform |
| Spatial detection of alpine treeline ecotones in the Western United States [120] | Wei, C | 2020 | Data validation | Image- processing platform |
| Rapid generation of global forest cover map using Landsat based on the forest ecological zones [121] | Zhang, X | 2020 | Data validation | Image- processing platform |
| The migration of training samples towards dynamic global land cover mapping [122] | Huang, H | 2020 | Data validation | Image- processing platform |
| Detecting forest disturbance and recovery in Primorsky Krai, Russia, using annual Landsat time series and multi-source land cover products [123] | Hu, Y | 2020 | Data validation | Image- processing platform |
| From woody cover to woody canopies: how Sentinel-1 and Sentinel-2 data advance the mapping of woody plants in savannas [124] | Zhang, W | 2019 | Training samples | Image- processing platform |
| Automating offshore infrastructure extractions using synthetic aperture radar and Google Earth Engine [125] | Wong, B A | 2019 | Data validation | Image- processing platform |
| Long-term surface water dynamics analysis based on Landsat imagery and the Google Earth Engine Platform: a case study in the middle Yangtze river basin [43] | Wang, C | 2018 | Data validation | Image- processing platform |
| Landsat-based classification in the cloud: an opportunity for a paradigm shift in land cover monitoring [50] | Azzari, G | 2017 | Data validation | Image- processing platform |
| Mapping the dynamics of eastern redcedar encroachment into grasslands during 1984–2010 through PALSAR and time series Landsat images [126] | Wang, J | 2017 | Data validation | Image- processing platform |
4.3. Merits and Limitations of GEE and GE
The potential of both GE and GEE for use in studies of global environmental change was demonstrated soon after their appearance [59,109,127,128]. Although GE and GEE are both products of Google Inc., almost all of the functions on these two platforms are freely available (although GE also has premium versions of PRO and Enterprise with additional functions that are designed to meet particular user needs). The advantages of GE lay in its ability to visualize global scenes, whereas its computational and analytical capacities are limited. For example, although it can be considered to be a virtual Earth, GE cannot simulate social and environmental phenomena through modeling and simulation, and has not fully satisfied Gore’s vision of what a virtual Earth should be. This deficiency can be compensated for by GEE due to the advantages that GEE has in terms of data collection, analysis, and modeling, thus extending the ways in which GE and GEE are applied in global environmental change studies. However, it should be noted that the geospatial data and algorithms available in GEE do not cover a wide range. It is still a challenge to model complex geographic processes, and the issues commonly encountered in the use of cloud platforms, such as the network transmission rate, computing power allocation problems, and storage limitations, also exist in GEE. In addition, GE and GEE are both commercial products, and the security of individual, institutional, and national data remains a concern.
GE is a data fusion platform that has visualization as its primary function (Table 4). However, GE does not possess real-time modeling capabilities. Its use of the KML language means that there is great potential for the use of GE in geospatial studies in the future. The most significant limitation of GE is the lack of GIS analysis, which makes it difficult to improve the data preprocessing and analysis. GE can serve as a virtual world or “natural” earth; by using GE, users can observe global real-time changes or predict future conditions [2]. These functions could be improved by combining GE with cloud-computing technology. GE would then become a browser on which users would only need to initiate a request before receiving the processed results from the server [4]. Yu and Gong [2] envisioned that GE could generate artwork or statistical reports for use in scientific papers and reports. The reconstruction of historical relics and cities based on 3D/4D visualization techniques is also a trend. For some time now, studies were carried out on the application of GE as a geography teaching tool [34,129]. It is possible that GE could be made into an effective teaching tool by adding teaching content; GE would then greatly assist the development of geospatial thinking.
Table 4.
Merits and limitations of GEE and GE.
| Google Earth | Google Earth Engine | |
|---|---|---|
| Merits |
|
|
| Limitations |
|
Compared with GE, GEE is a more advanced platform that has stronger cloud computing power (Table 4). Although GEE is not a virtual Earth, the technologies available in GEE can support the development and improvement of the virtual Earth. The main part of GEE (the Earth Engine (EE) Code Editor) is a web-based interactive development environment (IDE) for the Earth Engine JavaScript API, which develops complex geospatial workflows. At present, GEE supports a web APP (EE Explorer), which has limited functionality. In the future, it may be possible to develop an APP that is convenient for all users by, for example, optimizing the visualization of GEE and adding more data interfaces that can accept different types of geospatial data (such as geospatial data collected in real-time). GEE runs calculations as scripts, which is not convenient for users carrying out complex procedures or who require transitional data sets. It would be an improvement if users could control more of the data processing and if there was an interface of modules that could directly combine different tools. It is also important to increase the necessary data and algorithms mentioned in Table 4.
5. Conclusions
In this review, the peer-reviewed literature on GE and GEE in the WoS core collection was analyzed using scientometric analysis and meta-analysis. We comprehensively summarized the ways in which GE and GEE were applied, and the trends in these applications, as well as the differences and similarities in the way that the two tools were used. In addition, the merits and limitations of GE and GEE were also discussed. Our most significant findings, which will be of use to the wider remote sensing community, include the following: (1) GE and GEE are multidisciplinary tools. Published papers on GE have appeared in a wider range of journals covering a wider range of research areas than GEE papers (Section 3.1). Compared to GEE, GE papers covered a broader range of research areas, such as biology, education, disease and health, economics, and information science. (2) Many similar keywords were used in GE and GEE papers (including “land cover”, “water”, “model”, “vegetation”, and “forest”), which indicates that GE and GEE are used in similar research areas (Section 3.3). The main difference is that GE is mainly used as a visual display platform, whereas GEE is mainly used for big data and time-series analysis. (3) Most of the applications of GE and GEE were concentrated in a small number of countries, including the United States, China, and the United Kingdom (Section 3.5). As far as current applications are concerned, GE is used more as an auxiliary tool in scientific research owing to the lack of a GIS spatial analysis function. In contrast, its geographic big data processing and cloud-computing capabilities make GEE an effective tool for the remote sensing community (Section 4.3).
In summary, because of GE’s and GEE’s abilities to display or analyze global geospatial data, they have obvious advantages in terms of global integration and dynamic research (Section 3.3). Both platforms have their advantages and limitations (Section 4.3). Although GE has a significant advantage in terms of visualization, ease-of-use, and interoperability, it is limited by its lack of a GIS function, inconsistent image quality, and security issues. GEE has a more comprehensive range of functions. It also has the capability to analyze geospatial big data, provides a greater number of geospatial data sets, and supports various image-processing algorithms. Still, the visualization capability of GEE is not an advantage. GEE’s modeling capabilities (simulation of complex geographical/ecological processes, such as urban expansion modeling and vegetation dynamic modeling) are limited. It also lacks complex SAR and high-resolution geospatial data sets and the ability to perform optimization.Complex algorithms are difficult to implement, and optimization algorithms are implemented locally. At present, the development of GEE is still in its infancy. Nonetheless, it is undeniable that GEE has the potential to become an effective tool for use in Earth system science. Significant improvements in the supporting technology are needed, however. The addition of more computing resources, more open-source data sets, more image-processing algorithms, and the contributions of more Earth system scientists will allow GEE to become an effective tool that combines monitoring, modeling, analysis, assessment, and management decisions that can be applied to solve global environmental problems.
The spherical visualization provided by GE is an advantage. Although GEE provides near real-time data, it is limited by its computing resources and the supported algorithms (Section 4.3). As a result, its capabilities relating to modelling and simulating the global environment are also still limited. The ideal virtual Earth that was described in Gore’s speech had the capacity to model and simulate the global environment and to dynamically display the environment in real-time as well as the future. Such a virtual Earth would display the Earth’s morphology using the advanced technologies of cloud computing, 3D and virtual reality (VR), and would have the capability to process big data. In this way, people would be able to observe global real-time (e.g., it will be very useful for Asian elephant’s migration in China very recently [133]) or simulated future environmental changes using internet-connected devices, and scientists would easily be able to obtain details of environmental conditions or other geo-information at any place and time. Such a virtual Earth would meet the challenges proposed by Yu and Gong [2] and would be an effective tool for use in Earth system science.
Supplementary Materials
The following are available online at https://0-www-mdpi-com.brum.beds.ac.uk/article/10.3390/rs13183778/s1: Table S1 (the list of all analyzed papers).
Author Contributions
Conceptualization, L.Y.; methodology, Q.Z. and L.Y.; software, Q.Z.; formal analysis, Q.Z., L.Y., X.L., D.P., Y.Z. and P.G.; resources, L.Y. and Y.Z.; writing—original draft preparation, Q.Z. and L.Y.; writing—review and editing, Q.Z., L.Y., X.L., D.P., Y.Z. and P.G.; supervision, L.Y. and Y.Z.; project administration, L.Y.; funding acquisition, L.Y. All authors have read and agreed to the published version of the manuscript.
Funding
This research was funded by the National Key R&D Program of China (grant number: 2019YFA0606601; 2019YFE0115200) and the National Key Scientific and Technological Infrastructure project “Earth System Science Numerical Simulator Facility” (EarthLab).
Institutional Review Board Statement
Not applicable.
Informed Consent Statement
Not applicable.
Data Availability Statement
This study does not contain reports on any data.
Conflicts of Interest
The authors declare no conflict of interest.
References
- NASA Advisory Council, Earth System Sciences Committee. Earth System Science Overview: A Program for Global Change; National Aeronautics and Space Administration: Washington, DC, USA, 1986.
- Yu, L.; Gong, P. Google Earth as a virtual globe tool for Earth science applications at the global scale: Progress and perspectives. Int. J. Remote Sens. 2012, 33, 3966–3986. [Google Scholar] [CrossRef]
- Liang, J.; Gong, J.; Li, W. Applications and impacts of Google Earth: A decadal review (2006–2016). ISPRS J. Photogramm. Remote Sens. 2018, 146, 91–107. [Google Scholar] [CrossRef]
- Goodchild, M.F. The use cases of digital earth. Int. J. Digit. Earth 2008, 1, 31–42. [Google Scholar] [CrossRef]
- Gabrielli, S.; Spagnolo, M.; De Siena, L. Geomorphology and surface geology of Mount St. Helens volcano. J. Maps 2020, 16, 585–594. [Google Scholar] [CrossRef]
- Yildirim, C. Geomorphology of Horseshoe Island, Marguerite Bay, Antarctica. J. Maps 2020, 16, 56–67. [Google Scholar] [CrossRef] [Green Version]
- Fathy, I.; Abd-Elhamid, H.; Zelenakova, M.; Kaposztasova, D. Effect of topographic data accuracy on watershed management. Int. J. Environ. Res. Public Health 2019, 16, 4245. [Google Scholar] [CrossRef] [Green Version]
- Yang, J.; Dong, Z.; Liu, Z.; Shi, W.; Chen, G.; Shao, T.; Zeng, H. Migration of barchan dunes in the western Quruq Desert, northwestern China. Earth Surf. Process. Landf. 2019, 44, 2016–2029. [Google Scholar] [CrossRef]
- Harris, L.; Nel, R.; Holness, S.; Sink, K.; Schoeman, D. Setting conservation targets for sandy beach ecosystems. Estuar. Coast. Shelf Sci. 2014, 150, 45–57. [Google Scholar] [CrossRef]
- Chen, L. A quantitative simulation based method for reclamation plan of marine ecological constraints. J. Coast. Res. 2020, 107, 13–16. [Google Scholar] [CrossRef]
- Tao, T.; Abades, S.; Teng, S.; Huang, Z.Y.X.; Reino, L.; Chen, B.J.W.; Zhang, Y.; Xu, C.; Svenning, J.-C. Macroecological factors shape local-scale spatial patterns in agriculturalist settlements. Proc. R. Soc. B Biol. Sci. 2017, 284. [Google Scholar] [CrossRef] [Green Version]
- Mendenhall, C.D.; Wrona, A.M. Improving tree cover estimates for fine-scale landscape ecology. Landsc. Ecol. 2018, 33, 1691–1696. [Google Scholar] [CrossRef]
- McCaffrey, K.J.W.; Feely, M.; Hennessy, R.; Thompson, J. Visualization of folding in marble outcrops, Connemara, western Ireland: An application of virtual outcrop technology. Geosphere 2008, 4, 588–599. [Google Scholar] [CrossRef] [Green Version]
- Martinez-Grana, A.M.; Goy, J.L.; Cimarra, C.A. A virtual tour of geological heritage: Valourising geodiversity using Google Earth and QR code. Comput. Geosci. 2013, 61, 83–93. [Google Scholar] [CrossRef]
- Schicker, R.; Moon, V. Comparison of bivariate and multivariate statistical approaches in landslide susceptibility mapping at a regional scale. Geomorphology 2012, 161, 40–57. [Google Scholar] [CrossRef]
- Tavani, S.; Granado, P.; Corradetti, A.; Girundo, M.; Iannace, A.; Arbues, P.; Munoz, J.A.; Mazzoli, S. Building a virtual outcrop, extracting geological information from it, and sharing the results in Google Earth via Open Plot and Photoscan: An example from the Khaviz Anticline (Iran). Comput. Geosci. 2014, 63, 44–53. [Google Scholar] [CrossRef]
- Wright, T.E.; Burton, M.; Pyle, D.M.; Caltabiano, T. Visualising volcanic gas plumes with virtual globes. Comput. Geosci. 2009, 35, 1837–1842. [Google Scholar] [CrossRef]
- Sharma, A.; Wang, J.; Lennartson, E.M. Intercomparison of MODIS and VIIRS fire products in Khanty-Mansiysk Russia: Implications for characterizing gas flaring from space. Atmosphere 2017, 8, 95. [Google Scholar] [CrossRef] [Green Version]
- Nourbakhsh, I.; Sargent, R.; Wright, A.; Cramer, K.; McClendon, B.; Jones, M. Mapping disaster zones. Nature 2006, 439, 787–788. [Google Scholar] [CrossRef]
- Giselle Murillo-Garcia, F.; Alcantara-Ayala, I.; Ardizzone, F.; Cardinali, M.; Fiourucci, F.; Guzzetti, F. Satellite stereoscopic pair images of very high resolution: A step forward for the development of landslide inventories. Landslides 2015, 12, 277–291. [Google Scholar] [CrossRef]
- Lang, D.H.; Gutierrez Corea, F.V. RISe: Illustrating georeferenced data of seismic risk and loss assessment studies using Google Earth. Earthq. Spectra 2010, 26, 295–307. [Google Scholar] [CrossRef] [Green Version]
- Liu, C.-C.; Chen, P.-L.; Matsuo, T.; Chen, C.-Y. Rapidly responding to landslides and debris flow events using a low-cost unmanned aerial vehicle. J. Appl. Remote Sens. 2015, 9. [Google Scholar] [CrossRef]
- Akbar, M.; Aliabadi, S.; Patel, R.; Watts, M. A fully automated and integrated multi-scale forecasting scheme for emergency preparedness. Environ. Modell. Softw. 2013, 39, 24–38. [Google Scholar] [CrossRef]
- Wen, Q.; Jiang, K.; Wang, W.; Liu, Q.; Guo, Q.; Li, L.; Wang, P. Automatic building extraction from Google Earth images under complex backgrounds based on deep instance segmentation network. Sensors 2019, 19, 333. [Google Scholar] [CrossRef] [PubMed] [Green Version]
- Zhang, J.; Gurung, D.R.; Liu, R.; Murthy, M.S.R.; Su, F. Abe Barek landslide and landslide susceptibility assessment in Badakhshan Province, Afghanistan. Landslides 2015, 12, 597–609. [Google Scholar] [CrossRef]
- Clarke, P.; Ailshire, J.; Melendez, R.; Bader, M.; Morenoff, J. Using Google Earth to conduct a neighborhood audit: Reliability of a virtual audit instrument. Health Place 2010, 16, 1224–1229. [Google Scholar] [CrossRef] [PubMed] [Green Version]
- Wu, H.; He, Z.; Gong, J. A virtual globe-based 3D visualization and interactive framework for public participation in urban planning processes. Comput. Environ. Urban Syst. 2010, 34, 291–298. [Google Scholar] [CrossRef]
- Du, H.; Cai, W.; Xu, Y.; Wang, Z.; Wang, Y.; Cai, Y. Quantifying the cool island effects of urban green spaces using remote sensing Data. Urban For. Urban Green. 2017, 27, 24–31. [Google Scholar] [CrossRef]
- Pandey, B.; Joshi, P.K.; Seto, K.C. Monitoring urbanization dynamics in India using DMSP/OLS night time lights and SPOT-VGT data. Int. J. Appl. Earth Obs. Geoinf. 2013, 23, 49–61. [Google Scholar] [CrossRef]
- Schneider, A. Monitoring land cover change in urban and pen-urban areas using dense time stacks of Landsat satellite data and a data mining approach. Remote Sens. Environ. 2012, 124, 689–704. [Google Scholar] [CrossRef]
- Potere, D.; Schneider, A.; Angel, S.; Civco, D.L. Mapping urban areas on a global scale: Which of the eight maps now available is more accurate? Int. J. Remote Sens. 2009, 30, 6531–6558. [Google Scholar] [CrossRef]
- Singh, P.; Kikon, N.; Verma, P. Impact of land use change and urbanization on urban heat island in Lucknow city, Central India. A remote sensing based estimate. Sust. Cities Soc. 2017, 32, 100–114. [Google Scholar] [CrossRef]
- Xiang, X.; Liu, Y. Understanding ’change’ through spatial thinking using Google Earth in secondary geography. J. Comput. Assist. Learn. 2017, 33, 65–78. [Google Scholar] [CrossRef]
- Patterson, T.C. Google Earth as a (not just) geography education tool. J. Geogr. 2007, 106, 145–152. [Google Scholar] [CrossRef]
- Miguel Martinez-Grana, A.; Angel Gonzalez-Delgado, J.; Pallares, S.; Luis Goy, J.; Civis Llovera, J. 3D virtual itinerary for education using Google Earth as a tool for the recovery of the geological heritage of natural areas: Application in the ‘Las Batuecas Valley’ nature park (Salamanca, Spain). Sustainability 2014, 6, 8567–8591. [Google Scholar] [CrossRef] [Green Version]
- Amani, M.; Ghorbanian, A.; Ahmadi, S.A.; Kakooei, M.; Moghimi, A.; Mirmazloumi, S.M.; Moghaddam, S.H.A.; Mahdavi, S.; Ghahremanloo, M.; Parsian, S.; et al. Google Earth Engine cloud computing platform for remote sensing big data applications: A comprehensive review. IEEE J. Sel. Top. Appl. Earth Observ. Remote Sens. 2020, 13, 5326–5350. [Google Scholar] [CrossRef]
- Tamiminia, H.; Salehi, B.; Mahdianpari, M.; Quackenbush, L.; Adeli, S.; Brisco, B. Google Earth Engine for geo-big data applications: A meta-analysis and systematic review. ISPRS J. Photogramm. Remote Sens. 2020, 164, 152–170. [Google Scholar] [CrossRef]
- Lobell, D.B.; Thau, D.; Seifert, C.; Engle, E.; Little, B. A scalable satellite-based crop yield mapper. Remote Sens. Environ. 2015, 164, 324–333. [Google Scholar] [CrossRef]
- Xiong, J.; Thenkabail, P.S.; Tilton, J.C.; Gumma, M.K.; Teluguntla, P.; Oliphant, A.; Congalton, R.G.; Yadav, K.; Gorelick, N. Nominal 30-m cropland extent map of continental Africa by integrating pixel-based and object-based algorithms using Sentinel-2 and Landsat-8 data on Google Earth Engine. Remote Sens. 2017, 9, 1065. [Google Scholar] [CrossRef] [Green Version]
- Shelestov, A.; Lavreniuk, M.; Kussul, N.; Novikov, A.; Skakun, S. Exploring Google Earth Engine platform for big data processing: Classification of multi-temporal satellite imagery for crop mapping. Front. Earth Sci. 2017, 5, 1–10. [Google Scholar] [CrossRef] [Green Version]
- Xiong, J.; Thenkabail, P.S.; Gumma, M.K.; Teluguntla, P.; Poehnelt, J.; Congalton, R.G.; Yadav, K.; Thau, D. Automated cropland mapping of continental Africa using Google Earth Engine cloud computing. ISPRS J. Photogramm. Remote Sens. 2017, 126, 225–244. [Google Scholar] [CrossRef] [Green Version]
- Teluguntla, P.; Thenkabail, P.S.; Oliphant, A.; Xiong, J.; Gumma, M.K.; Congalton, R.G.; Yadav, K.; Huete, A. A 30-m landsat-derived cropland extent product of Australia and China using random forest machine learning algorithm on Google Earth Engine cloud computing platform. ISPRS-J. Photogramm. Remote Sens. 2018, 144, 325–340. [Google Scholar] [CrossRef]
- Wang, C.; Jia, M.; Chen, N.; Wang, W. Long-term surface water dynamics analysis based on Landsat imagery and the Google Earth Engine platform: A case study in the middle Yangtze River basin. Remote Sens. 2018, 10, 1635. [Google Scholar] [CrossRef] [Green Version]
- Wang, Y.; Ma, J.; Xiao, X.; Wang, X.; Dai, S.; Zhao, B. Long-term dynamic of Poyang Lake surface water: A mapping work based on the Google Earth Engine cloud platform. Remote Sens. 2019, 11, 313. [Google Scholar] [CrossRef] [Green Version]
- Busker, T.; de Roo, A.; Gelati, E.; Schwatke, C.; Adamovic, M.; Bisselink, B.; Pekel, J.-F.; Cottam, A. A global lake and reservoir volume analysis using a surface water dataset and satellite altimetry. Hydrol. Earth Syst. Sci. 2019, 23, 669–690. [Google Scholar] [CrossRef] [Green Version]
- Huang, Q.; Long, D.; Du, M.; Zeng, C.; Qiao, G.; Li, X.; Hou, A.; Hong, Y. Discharge estimation in high-mountain regions with improved methods using multisource remote sensing: A case study of the Upper Brahmaputra River. Remote Sens. Environ. 2018, 219, 115–134. [Google Scholar] [CrossRef]
- Zhou, Y.; Dong, J.; Xiao, X.; Liu, R.; Zou, Z.; Zhao, G.; Ge, Q. Continuous monitoring of lake dynamics on the Mongolian Plateau using all available Landsat imagery and Google Earth Engine. Sci. Total Environ. 2019, 689, 366–380. [Google Scholar] [CrossRef]
- Huang, H.; Chen, Y.; Clinton, N.; Wang, J.; Wang, X.; Liu, C.; Gong, P.; Yang, J.; Bai, Y.; Zheng, Y.; et al. Mapping major land cover dynamics in Beijing using all Landsat images in Google Earth Engine. Remote Sens. Environ. 2017, 202, 166–176. [Google Scholar] [CrossRef]
- Midekisa, A.; Holl, F.; Savory, D.J.; Andrade-Pacheco, R.; Gething, P.W.; Bennett, A.; Sturrock, H.J.W. Mapping land cover change over continental Africa using Landsat and Google Earth Engine cloud computing. PLoS ONE 2017, 12, e0184926. [Google Scholar] [CrossRef]
- Azzari, G.; Lobell, D.B. Landsat-based classification in the cloud: An opportunity for a paradigm shift in land cover monitoring. Remote Sens. Environ. 2017, 202, 64–74. [Google Scholar] [CrossRef]
- Zurqani, H.A.; Post, C.J.; Mikhailova, E.A.; Schlautman, M.A.; Sharp, J.L. Geospatial analysis of land use change in the Savannah River Basin using Google Earth Engine. Int. J. Appl. Earth Obs. Geoinf. 2018, 69, 175–185. [Google Scholar] [CrossRef]
- Kakooei, M.; Baleghi, Y. A two-level fusion for building irregularity detection in post-disaster VHR oblique images. Earth Sci. Inform. 2020, 13, 459–477. [Google Scholar] [CrossRef]
- DeVries, B.; Huang, C.; Armston, J.; Huang, W.; Jones, J.W.; Lang, M.W. Rapid and robust monitoring of flood events using Sentinel-1 and Landsat data on the Google Earth Engine. Remote Sens. Environ. 2020, 240, 111664. [Google Scholar] [CrossRef]
- Singha, M.; Dong, J.; Sarmah, S.; You, N.; Zhou, Y.; Zhang, G.; Doughty, R.; Xiao, X. Identifying floods and flood-affected paddy rice fields in Bangladesh based on Sentinel-1 imagery and Google Earth Engine. ISPRS J. Photogramm. Remote Sens. 2020, 166, 278–293. [Google Scholar] [CrossRef]
- Tiwari, V.; Kumar, V.; Matin, M.A.; Thapa, A.; Ellenburg, W.L.; Gupta, N.; Thapa, S. Flood inundation mapping- Kerala 2018; Harnessing the power of SAR, automatic threshold detection method and Google Earth Engine. PLoS ONE 2020, 15, e0237324. [Google Scholar] [CrossRef]
- Meilianda, E.; Pradhan, B.; Syamsidik; Comfort, L.K.; Alfian, D.; Juanda, R.; Syahreza, S.; Munadi, K. Assessment of post-tsunami disaster land use/land cover change and potential impact of future sea-level rise to low-lying coastal areas: A case study of Banda Aceh coast of Indonesia. Int. J. Disaster Risk Reduct. 2019, 41. [Google Scholar] [CrossRef]
- Hao, B.; Ma, M.; Li, S.; Li, Q.; Hao, D.; Huang, J.; Ge, Z.; Yang, H.; Han, X. Land use change and climate variation in the three gorges reservoir catchment from 2000 to 2015 based on the Google Earth Engine. Sensors 2019, 19, 2118. [Google Scholar] [CrossRef] [PubMed] [Green Version]
- Workie, T.G.; Debella, H.J. Climate change and its effects on vegetation phenology across ecoregions of Ethiopia. Glob. Ecol. Conserv. 2018, 13. [Google Scholar] [CrossRef]
- Padarian, J.; Minasny, B.; McBratney, A.B. Using Google’s cloud-based platform for digital soil mapping. Comput. Geosci. 2015, 83, 80–88. [Google Scholar] [CrossRef]
- Poppiel, R.R.; Lacerda, M.P.C.; Safanelli, J.L.; Rizzo, R.; Oliveira, M.P., Jr.; Novais, J.J.; Dematte, J.A.M. Mapping at 30 m resolution of soil attributes at multiple depths in midwest Brazil. Remote Sens. 2019, 11, 2905. [Google Scholar] [CrossRef] [Green Version]
- Ivushkin, K.; Bartholomeus, H.; Bregt, A.K.; Pulatov, A.; Kempen, B.; de Sousa, L. Global mapping of soil salinity change. Remote Sens. Environ. 2019, 231. [Google Scholar] [CrossRef]
- Padarian, J.; Minasny, B.; McBratney, A.B. Chile and the Chilean soil grid: A contribution to GlobalSoilMap. Geoderma Reg. 2017, 9, 17–28. [Google Scholar] [CrossRef]
- Alonso, A.; Munoz-Carpena, R.; Kennedy, R.E.; Murcia, C. Wetland landscape spatio-temporal degradation dynamics using the new Google Earth Engine cloud-based platform: Opportunities for non-specialists in remote sensing. Trans. ASABE 2016, 59, 1333–1344. [Google Scholar]
- Wu, Q.; Lane, C.R.; Li, X.; Zhao, K.; Zhou, Y.; Clinton, N.; DeVries, B.; Golden, H.E.; Lang, M.W. Integrating LiDAR data and multi-temporal aerial imagery to map wetland inundation dynamics using Google Earth Engine. Remote Sens. Environ. 2019, 228, 1–13. [Google Scholar] [CrossRef] [Green Version]
- Hird, J.N.; DeLancey, E.R.; McDermid, G.J.; Kariyeva, J. Google Earth Engine, open-access satellite data, and machine learning in support of large-area probabilistic wetland mapping. Remote Sens. 2017, 9, 1315. [Google Scholar] [CrossRef] [Green Version]
- Mahdianpari, M.; Salehi, B.; Mohammadimanesh, F.; Homayouni, S.; Gill, E. The first wetland inventory map of newfoundland at a spatial resolution of 10 m using Sentinel-1 and Sentinel-2 data on the Google Earth Engine cloud computing platform. Remote Sens. 2019, 11, 43. [Google Scholar] [CrossRef] [Green Version]
- Amani, M.; Mahdavi, S.; Afshar, M.; Brisco, B.; Huang, W.; Mirzadeh, S.M.J.; White, L.; Banks, S.; Montgomery, J.; Hopkinson, C. Canadian wetland inventory using Google Earth Engine: The first map and preliminary results. Remote Sens. 2019, 11, 842. [Google Scholar] [CrossRef] [Green Version]
- Tang, Z.; Li, Y.; Gu, Y.; Jiang, W.; Xue, Y.; Hu, Q.; LaGrange, T.; Bishop, A.; Drahota, J.; Li, R. Assessing Nebraska playa wetland inundation status during 1985-2015 using Landsat data and Google Earth Engine. Environ. Monit. Assess. 2016, 188, 1–14. [Google Scholar] [CrossRef]
- Bullock, E.L.; Woodcock, C.E.; Olofsson, P. Monitoring tropical forest degradation using spectral unmixing and Landsat time series analysis. Remote Sens. Environ. 2020, 238. [Google Scholar] [CrossRef]
- Chen, B.; Xiao, X.; Li, X.; Pan, L.; Doughty, R.; Ma, J.; Dong, J.; Qin, Y.; Zhao, B.; Wu, Z.; et al. A mangrove forest map of China in 2015: Analysis of time series Landsat 7/8 and Sentinel-1A imagery in Google Earth Engine cloud computing platform. ISPRS-J. Photogramm. Remote Sens. 2017, 131, 104–120. [Google Scholar] [CrossRef]
- Goldblatt, R.; Stuhlmacher, M.F.; Tellman, B.; Clinton, N.; Hanson, G.; Georgescu, M.; Wang, C.; Serrano-Candela, F.; Khandelwal, A.K.; Cheng, W.-H.; et al. Using Landsat and nighttime lights for supervised pixel-based image classification of urban land cover. Remote Sens. Environ. 2018, 205, 253–275. [Google Scholar] [CrossRef]
- Liu, X.; Hu, G.; Chen, Y.; Li, X.; Xu, X.; Li, S.; Pei, F.; Wang, S. High-resolution multi-temporal mapping of global urban land using Landsat images based on the Google Earth Engine Platform. Remote Sens. Environ. 2018, 209, 227–239. [Google Scholar] [CrossRef]
- Goldblatt, R.; You, W.; Hanson, G.; Khandelwal, A.K. Detecting the boundaries of urban areas in India: A dataset for pixel-based image classification in Google Earth Engine. Remote Sens. 2016, 8, 634. [Google Scholar] [CrossRef] [Green Version]
- Gong, P.; Li, X.; Wang, J.; Bai, Y.; Cheng, B.; Hu, T.; Liu, X.; Xu, B.; Yang, J.; Zhang, W.; et al. Annual maps of global artificial impervious area (GAIA) between 1985 and 2018. Remote Sens. Environ. 2020, 236. [Google Scholar] [CrossRef]
- Gorelick, N.; Hancher, M.; Dixon, M.; Ilyushchenko, S.; Thau, D.; Moore, R. Google Earth Engine: Planetary-scale geospatial analysis for everyone. Remote Sens. Environ. 2017, 202, 18–27. [Google Scholar] [CrossRef]
- Chen, C.; Ibekwe-SanJuan, F.; Hou, J. The structure and dynamics of cocitation clusters: A multiple-perspective cocitation analysis. J. Am. Soc. Inf. Sci. Technol. 2010, 61, 1386–1409. [Google Scholar] [CrossRef] [Green Version]
- Gong, W.; Shi, Z.; Wu, Z.; Luo, J. Arbitrary-oriented ship detection via feature fusion and visual attention for high-resolution optical remote sensing imagery. Int. J. Remote Sens. 2021, 42, 2622–2640. [Google Scholar] [CrossRef]
- Wang, Q.; Shen, F.; Cheng, L.; Jiang, J.; He, G.; Sheng, W.; Jing, N.; Mao, Z. Ship detection based on fused features and rebuilt YOLOv3 networks in optical remote-sensing images. Int. J. Remote Sens. 2021, 42, 520–536. [Google Scholar] [CrossRef]
- Tang, G.; Liu, S.; Fujino, I.; Claramunt, C.; Wang, Y.; Men, S. H-YOLO: A single-shot ship detection approach based on region of interest preselected network. Remote Sens. 2020, 12, 4192. [Google Scholar] [CrossRef]
- Zhang, Y.; Guo, L.; Wang, Z.; Yu, Y.; Liu, X.; Xu, F. Intelligent ship detection in remote sensing images based on multi-layer convolutional feature fusion. Remote Sens. 2020, 12, 3316. [Google Scholar] [CrossRef]
- Bi, F.; Hou, J.; Chen, L.; Yang, Z.; Wang, Y. Ship detection for optical remote sensing images based on visual attention enhanced network. Sensors 2019, 19, 2271. [Google Scholar] [CrossRef] [Green Version]
- Li, Q.; Mou, L.; Liu, Q.; Wang, Y.; Zhu, X.X. HSF-Net: Multiscale deep feature embedding for ship detection in optical remote sensing imagery. IEEE Trans. Geosci. Remote Sens. 2018, 56, 7147–7161. [Google Scholar] [CrossRef]
- Yang, X.; Sun, H.; Fu, K.; Yang, J.; Sun, X.; Yan, M.; Guo, Z. Automatic ship detection in remote sensing images from Google Earth of complex scenes based on multiscale rotation dense feature pyramid networks. Remote Sens. 2018, 10, 132. [Google Scholar] [CrossRef] [Green Version]
- Richard Furumo, P.; Mitchell Aide, T. Characterizing commercial oil palm expansion in Latin America: Land use change and trade. Environ. Res. Lett. 2017, 12, 024008. [Google Scholar] [CrossRef]
- Zhao, F.R.; Meng, R.; Huang, C.; Zhao, M.; Zhao, F.A.; Gong, P.; Yu, L.; Zhu, Z. Long-term post-disturbance forest recovery in the greater yellowstone ecosystem analyzed using Landsat time series stack. Remote Sens. 2016, 8, 898. [Google Scholar] [CrossRef] [Green Version]
- Liu, T.; Zhang, S.; Xu, X.; Bu, K.; Ning, J.; Chang, L. High resolution land cover datasets integration and application based on Landsat and Globcover data from 1975 to 2010 in Siberia. Chin. Geogr. Sci. 2016, 26, 429–438. [Google Scholar] [CrossRef] [Green Version]
- Dubey, J.; Ali, S.N.; Sharma, A.; Morthekai, P.; Singh, R.; Sharma, R.K.; Pandey, P.; Thakur, B.; Srivastava, V. Glacial Geomorphology and Landscape Evolution of the Thangu Valley, North Sikkim Himalaya, India. J. Indian Soc. Remote Sens. 2019, 47, 821–837. [Google Scholar] [CrossRef]
- Orkhonselenge, A. Glacial geomorphology of Mt. Munkh Saridag in the Khuvsgul Mountain Range, Northern Mongolia. Geomorphologie 2016, 22, 389–398. [Google Scholar] [CrossRef]
- Chen, R.; Zhou, S.; Li, Y.; Deng, Y. Glacial geomorphology of the Parlung Zangbo Valley, southeastern Tibetan Plateau. J. Maps 2016, 12, 716–724. [Google Scholar] [CrossRef]
- Stroeven, A.P.; Hattestrand, C.; Heyman, J.; Kleman, J.; Moren, B.M. Glacial geomorphology of the Tian Shan. J. Maps 2013, 9, 505–512. [Google Scholar] [CrossRef]
- Brown, V.H.; Evans, D.J.A.; Evans, I.S. The glacial geomorphology and surficial geology of the south-west English lake district. J. Maps 2011, 7, 221–243. [Google Scholar] [CrossRef]
- Zhu, L.; Kan, W.; Zhang, Y.; Sun, J. Visualizing the structure of the Earth’s lithosphere on the Google Earth virtual-globe platform. ISPRS Int. Geo Inf. 2016, 5, 26. [Google Scholar] [CrossRef] [Green Version]
- Potere, D. Horizontal positional accuracy of Google Earth’s high-resolution imagery archive. Sensors 2008, 8, 7973–7981. [Google Scholar] [CrossRef] [PubMed]
- Butler, D. The web-wide world. Nature 2006, 439, 776–778. [Google Scholar] [CrossRef]
- Friedl, M.A.; Sulla-Menashe, D.; Tan, B.; Schneider, A.; Ramankutty, N.; Sibley, A.; Huang, X. MODIS Collection 5 global land cover: Algorithm refinements and characterization of new datasets. Remote Sens. Environ. 2010, 114, 168–182. [Google Scholar] [CrossRef]
- Gong, P.; Wang, J.; Yu, L.; Zhao, Y.; Zhao, Y.; Liang, L.; Niu, Z.; Huang, X.; Fu, H.; Liu, S.; et al. Finer resolution observation and monitoring of global land cover: First mapping results with Landsat TM and ETM+ data. Int. J. Remote Sens. 2013, 34, 2607–2654. [Google Scholar] [CrossRef] [Green Version]
- Hansen, M.C.; Potapov, P.V.; Moore, R.; Hancher, M.; Turubanova, S.A.; Tyukavina, A.; Thau, D.; Stehman, S.V.; Goetz, S.J.; Loveland, T.R.; et al. High-resolution global maps of 21st-century forest cover change. Science 2013, 342, 850–853. [Google Scholar] [CrossRef] [PubMed] [Green Version]
- Chen, J.; Chen, J.; Liao, A.; Cao, X.; Chen, L.; Chen, X.; He, C.; Han, G.; Peng, S.; Lu, M.; et al. Global land cover mapping at 30m resolution: A POK-based operational approach. ISPRS J. Photogramm. Remote Sens. 2015, 103, 7–27. [Google Scholar] [CrossRef] [Green Version]
- He, K.; Zhang, X.; Ren, S.; Sun, J. Deep residual learning for image recognition. In Proceedings of the 2016 IEEE Conference on Computer Vision and Pattern Recognition, Las Vegas, NV, USA, 27–30 June 2016; pp. 770–778. [Google Scholar]
- Olofsson, P.; Foody, G.M.; Herold, M.; Stehman, S.V.; Woodcock, C.E.; Wulder, M.A. Good practices for estimating area and assessing accuracy of land change. Remote Sens. Environ. 2014, 148, 42–57. [Google Scholar] [CrossRef]
- Chang, A.Y.; Parrales, M.E.; Jimenez, J.; Sobieszczyk, M.E.; Hammer, S.M.; Copenhaver, D.J.; Kulkarni, R.P. Combining Google Earth and GIS mapping technologies in a dengue surveillance system for developing countries. Int. J. Health Geogr. 2009, 8, 49. [Google Scholar] [CrossRef] [Green Version]
- Roy, D.P.; Wulder, M.A.; Loveland, T.R.; Woodcock, C.E.; Allen, R.G.; Anderson, M.C.; Helder, D.; Irons, J.R.; Johnson, D.M.; Kennedy, R.; et al. Landsat-8: Science and product vision for terrestrial global change research. Remote Sens. Environ. 2014, 145, 154–172. [Google Scholar] [CrossRef] [Green Version]
- Wulder, M.A.; Masek, J.G.; Cohen, W.B.; Loveland, T.R.; Woodcock, C.E. Opening the archive: How free data has enabled the science and monitoring promise of Landsat. Remote Sens. Environ. 2012, 122, 2–10. [Google Scholar] [CrossRef]
- Drusch, M.; Del Bello, U.; Carlier, S.; Colin, O.; Fernandez, V.; Gascon, F.; Hoersch, B.; Isola, C.; Laberinti, P.; Martimort, P.; et al. Sentinel-2: ESA’s optical high-resolution mission for GMES operational services. Remote Sens. Environ. 2012, 120, 25–36. [Google Scholar] [CrossRef]
- Parente, L.; Ferreira, L. Assessing the spatial and occupation dynamics of the Brazilian pasturelands based on the automated classification of MODIS images from 2000 to 2016. Remote Sens. 2018, 10, 606. [Google Scholar] [CrossRef] [Green Version]
- Zhu, Z.; Woodcock, C.E. Object-based cloud and cloud shadow detection in Landsat imagery. Remote Sens. Environ. 2012, 118, 83–94. [Google Scholar] [CrossRef]
- Abatzoglou, J.T. Development of gridded surface meteorological data for ecological applications and modelling. Int. J. Climatol. 2013, 33, 121–131. [Google Scholar] [CrossRef]
- Feyisa, G.L.; Meilby, H.; Fensholt, R.; Proud, S.R. Automated Water Extraction Index: A new technique for surface water mapping using Landsat imagery. Remote Sens. Environ. 2014, 140, 23–35. [Google Scholar] [CrossRef]
- Patel, N.N.; Angiuli, E.; Gamba, P.; Gaughan, A.; Lisini, G.; Stevens, F.R.; Tatem, A.J.; Trianni, G. Multitemporal settlement and population mapping from Landsat using Google Earth Engine. Int. J. Appl. Earth Obs. Geoinf. 2015, 35, 199–208. [Google Scholar] [CrossRef] [Green Version]
- Wang, L.Z.; von Laszewski, G.; Younge, A.; He, X.; Kunze, M.; Tao, J.; Fu, C. Cloud computing: A perspective study. New Gener. Comput. 2010, 28, 137–146. [Google Scholar] [CrossRef] [Green Version]
- Wang, L.; Yan, J.; Ma, Y. Cloud Computing in Remote Sensing; CRC Press: Boca Raton, FL, USA, 2019. [Google Scholar]
- Fu, D.; Xiao, H.; Su, F.; Zhou, C.; Dong, J.; Zeng, Y.; Yan, K.; Li, S.; Wu, J.; Wu, W.; et al. Remote sensing cloud computing platform development and Earth science application. J. Remote Sens. 2021, 25, 220–230. [Google Scholar]
- Nemani, R.; Votava, P.; Michaelis, A.; Melton, F.; Milesi, C. Collaborative supercomputing for global change science. Eos Trans. Am. Geophys. Union 2011, 92, 109–110. [Google Scholar] [CrossRef]
- Gomes, V.; Queiroz, G.; Ferreira, K. An overview of platforms for big Earth observation data management and analysis. Remote Sens. 2020, 12, 1253. [Google Scholar] [CrossRef] [Green Version]
- Li, X.; Gong, P.; Zhou, Y.; Wang, J.; Bai, Y.; Chen, B.; Hu, T.; Xiao, Y.; Xu, B.; Yang, J.; et al. Mapping global urban boundaries from the global artificial impervious area (GAIA) data. Environ. Res. Lett. 2020, 15. [Google Scholar] [CrossRef]
- Sun, Z.; Luo, J.; Yang, J.; Yu, Q.; Zhang, L.; Xue, K.; Lu, L. Nation-scale mapping of coastal aquaculture ponds with Sentinel-1 sar data using Google Earth Engine. Remote Sens. 2020, 12, 3086. [Google Scholar] [CrossRef]
- Deng, X.; Song, C.; Liu, K.; Ke, L.; Zhang, W.; Ma, R.; Zhu, J.; Wu, Q. Remote sensing estimation of catchment-scale reservoir water impoundment in the upper Yellow River and implications for river discharge alteration. J. Hydrol. 2020, 585. [Google Scholar] [CrossRef]
- Lin, Y.; Zhang, H.; Lin, H.; Gamba, P.E.; Liu, X. Incorporating synthetic aperture radar and optical images to investigate the annual dynamics of anthropogenic impervious surface at large scale. Remote Sens. Environ. 2020, 242. [Google Scholar] [CrossRef]
- Wang, X.; Xiao, X.; Zou, Z.; Hou, L.; Qin, Y.; Dong, J.; Doughty, R.B.; Chen, B.; Zhang, X.; Chen, Y.; et al. Mapping coastal wetlands of China using time series Landsat images in 2018 and Google Earth Engine. ISPRS J. Photogramm. Remote Sens. 2020, 163, 312–326. [Google Scholar] [CrossRef] [PubMed]
- Wei, C.; Karger, D.N.; Wilson, A.M. Spatial detection of alpine treeline ecotones in the Western United States. Remote Sens. Environ. 2020, 240. [Google Scholar] [CrossRef]
- Zhang, X.; Long, T.; He, G.; Guo, Y.; Yin, R.; Zhang, Z.; Xiao, H.; Li, M.; Cheng, B. Rapid generation of global forest cover map using Landsat based on the forest ecological zones. J. Appl. Remote Sens. 2020, 14. [Google Scholar] [CrossRef]
- Huang, H.; Wang, J.; Liu, C.; Liang, L.; Li, C.; Gong, P. The migration of training samples towards dynamic global land cover mapping. ISPRS J. Photogramm. Remote Sens. 2020, 161, 27–36. [Google Scholar] [CrossRef]
- Hu, Y.; Hu, Y. Detecting forest disturbance and recovery in Primorsky Krai, Russia, using annual Landsat time series and multi–source land cover products. Remote Sens. 2020, 12, 129. [Google Scholar] [CrossRef] [Green Version]
- Zhang, W.; Brandt, M.; Wang, Q.; Prishchepov, A.V.; Tucker, C.J.; Li, Y.; Lyu, H.; Fensholt, R. From woody cover to woody canopies: How Sentinel-1 and Sentinel-2 data advance the mapping of woody plants in savannas. Remote Sens. Environ. 2019, 234. [Google Scholar] [CrossRef]
- Wong, B.A.; Thomas, C.; Halpin, P. Automating offshore infrastructure extractions using synthetic aperture radar & Google Earth Engine. Remote Sens. Environ. 2019, 233, 111412. [Google Scholar] [CrossRef]
- Wang, J.; Xiao, X.; Qin, Y.; Dong, J.; Geissler, G.; Zhang, G.; Cejda, N.; Alikhani, B.; Doughty, R.B. Mapping the dynamics of eastern redcedar encroachment into grasslands during 1984–2010 through PALSAR and time series Landsat images. Remote Sens. Environ. 2017, 190, 233–246. [Google Scholar] [CrossRef] [Green Version]
- Boulos, M.N.K. Web GIS in practice III: Creating a simple interactive map of England’s Strategic Health Authorities using Google Maps API, Google Earth KML, and MSN Virtual Earth Map Control. Int. J. Health Geogr. 2005, 4, 22. [Google Scholar] [CrossRef] [Green Version]
- Compieta, P.; Di Martino, S.; Bertolotto, M.; Ferrucci, F.; Kechadi, T. Exploratory spatio-temporal data mining and visualization. J. Vis. Lang. Comput. 2007, 18, 255–279. [Google Scholar] [CrossRef]
- Bodzin, A.M. Integrating instructional technologies in a local watershed investigation with urban elementary learners. J. Environ. Educ. 2008, 39, 47–57. [Google Scholar] [CrossRef]
- Luo, L.; Wang, X.; Guo, H.; Lasaponara, R.; Shi, P.; Bachagha, N.; Li, L.; Yao, Y.; Masini, N.; Chen, F.; et al. Google Earth as a powerful tool for archaeological and cultural heritage applications: A review. Remote Sens. 2018, 10, 1558. [Google Scholar] [CrossRef]
- Amani, M.; Brisco, B.; Afshar, M.; Mirmazloumi, S.M.; Mahdavi, S.; Mirzadeh, S.M.J.; Huang, W.; Granger, J. A generalized supervised classification scheme to produce provincial wetland inventory maps: An application of Google Earth Engine for big geo data processing. Big Earth Data 2019, 3, 378–394. [Google Scholar] [CrossRef]
- Liang, J.Y.; Xie, Y.C.; Sha, Z.Y.; Zhou, A. Modeling urban growth sustainability in the cloud by augmenting Google Earth Engine (GEE). Comput. Environ. Urban Syst. 2020, 84, 14. [Google Scholar] [CrossRef]
- Wang, H.; Wang, P.; Zhao, X.; Zhang, W.; Xie, P. What triggered the Asian elephant’s northward migration across southwestern Yunnan? Innovation 2021, 2. [Google Scholar] [CrossRef]
Figure 1.
Change in the number of publications and citations relevant to GE and GEE (dated up to January 2021).
Figure 1.
Change in the number of publications and citations relevant to GE and GEE (dated up to January 2021).

Figure 2.
Journals in which papers related to (a) GE and (b) GEE were published.

Figure 3.
Research disciplines in which (a) GE and (b) GEE were applied.

Figure 4.
Keywords related to (a) GE and (b) GEE.

Figure 5.
Co-occurrence keywords were used in relation to (a) GE and (b) GEE. The size of the node represents the frequency of the occurrence of the keyword, the connecting lines indicate the co-occurrence relationships for the keyword, and a purple outer circle indicates that the node is a key node (betweenness centrality > 0.1).

Figure 6.
Numbers of published GE and GEE papers shown by (a) journal and (b) research area.

Publisher’s Note: MDPI stays neutral with regard to jurisdictional claims in published maps and institutional affiliations. |
© 2021 by the authors. Licensee MDPI, Basel, Switzerland. This article is an open access article distributed under the terms and conditions of the Creative Commons Attribution (CC BY) license (https://creativecommons.org/licenses/by/4.0/).
Share and Cite
MDPI and ACS Style
Zhao, Q.; Yu, L.; Li, X.; Peng, D.; Zhang, Y.; Gong, P. Progress and Trends in the Application of Google Earth and Google Earth Engine. Remote Sens. 2021, 13, 3778. https://0-doi-org.brum.beds.ac.uk/10.3390/rs13183778
AMA Style
Zhao Q, Yu L, Li X, Peng D, Zhang Y, Gong P. Progress and Trends in the Application of Google Earth and Google Earth Engine. Remote Sensing. 2021; 13(18):3778. https://0-doi-org.brum.beds.ac.uk/10.3390/rs13183778
Chicago/Turabian StyleZhao, Qiang, Le Yu, Xuecao Li, Dailiang Peng, Yongguang Zhang, and Peng Gong. 2021. "Progress and Trends in the Application of Google Earth and Google Earth Engine" Remote Sensing 13, no. 18: 3778. https://0-doi-org.brum.beds.ac.uk/10.3390/rs13183778
Note that from the first issue of 2016, this journal uses article numbers instead of page numbers. See further details here.