
Investigation of Antarctic Precipitable Water Vapor Variability and Trend from 18 Year (2001 to 2018) Data of Four Reanalyses Based on Radiosonde and GNSS Observations

 , , ,
, , ,  and
and
Abstract
:
1. Introduction
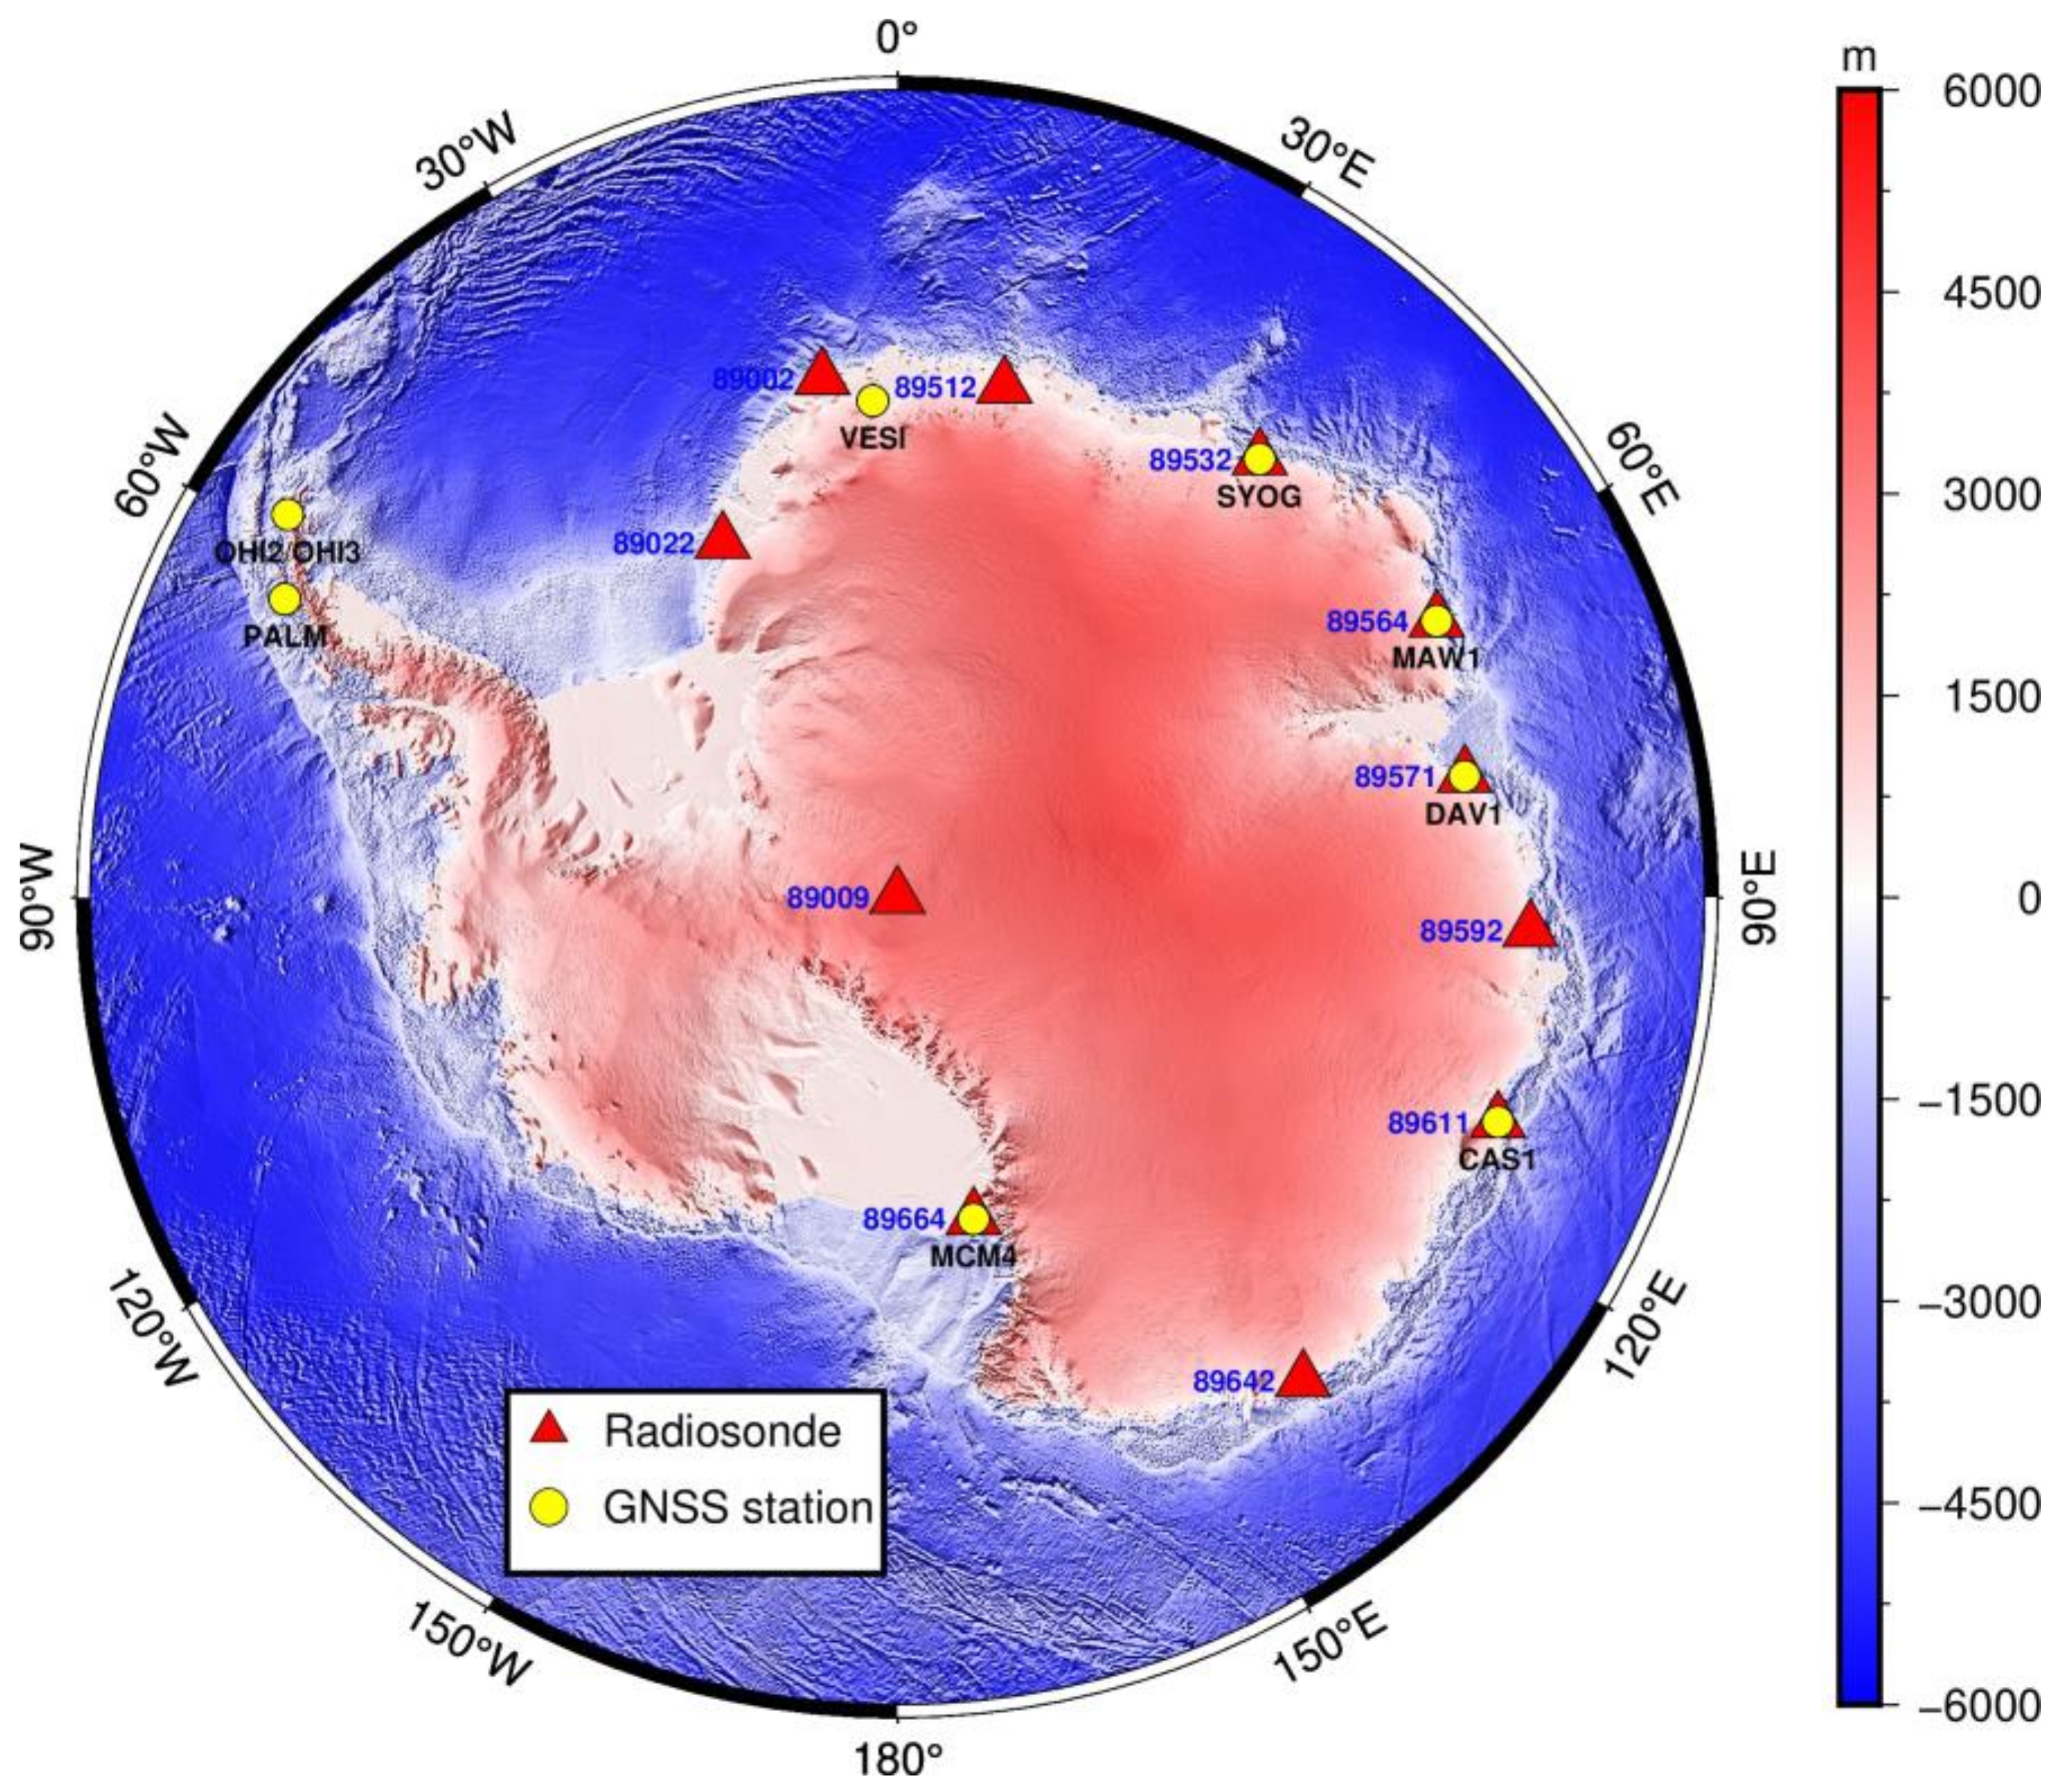
2. Data and Methods
2.1. Four Reanalysis Products
2.2. PWV Retrieval from Radiosonde Profiles
2.3. PWV Retrieval from GNSS
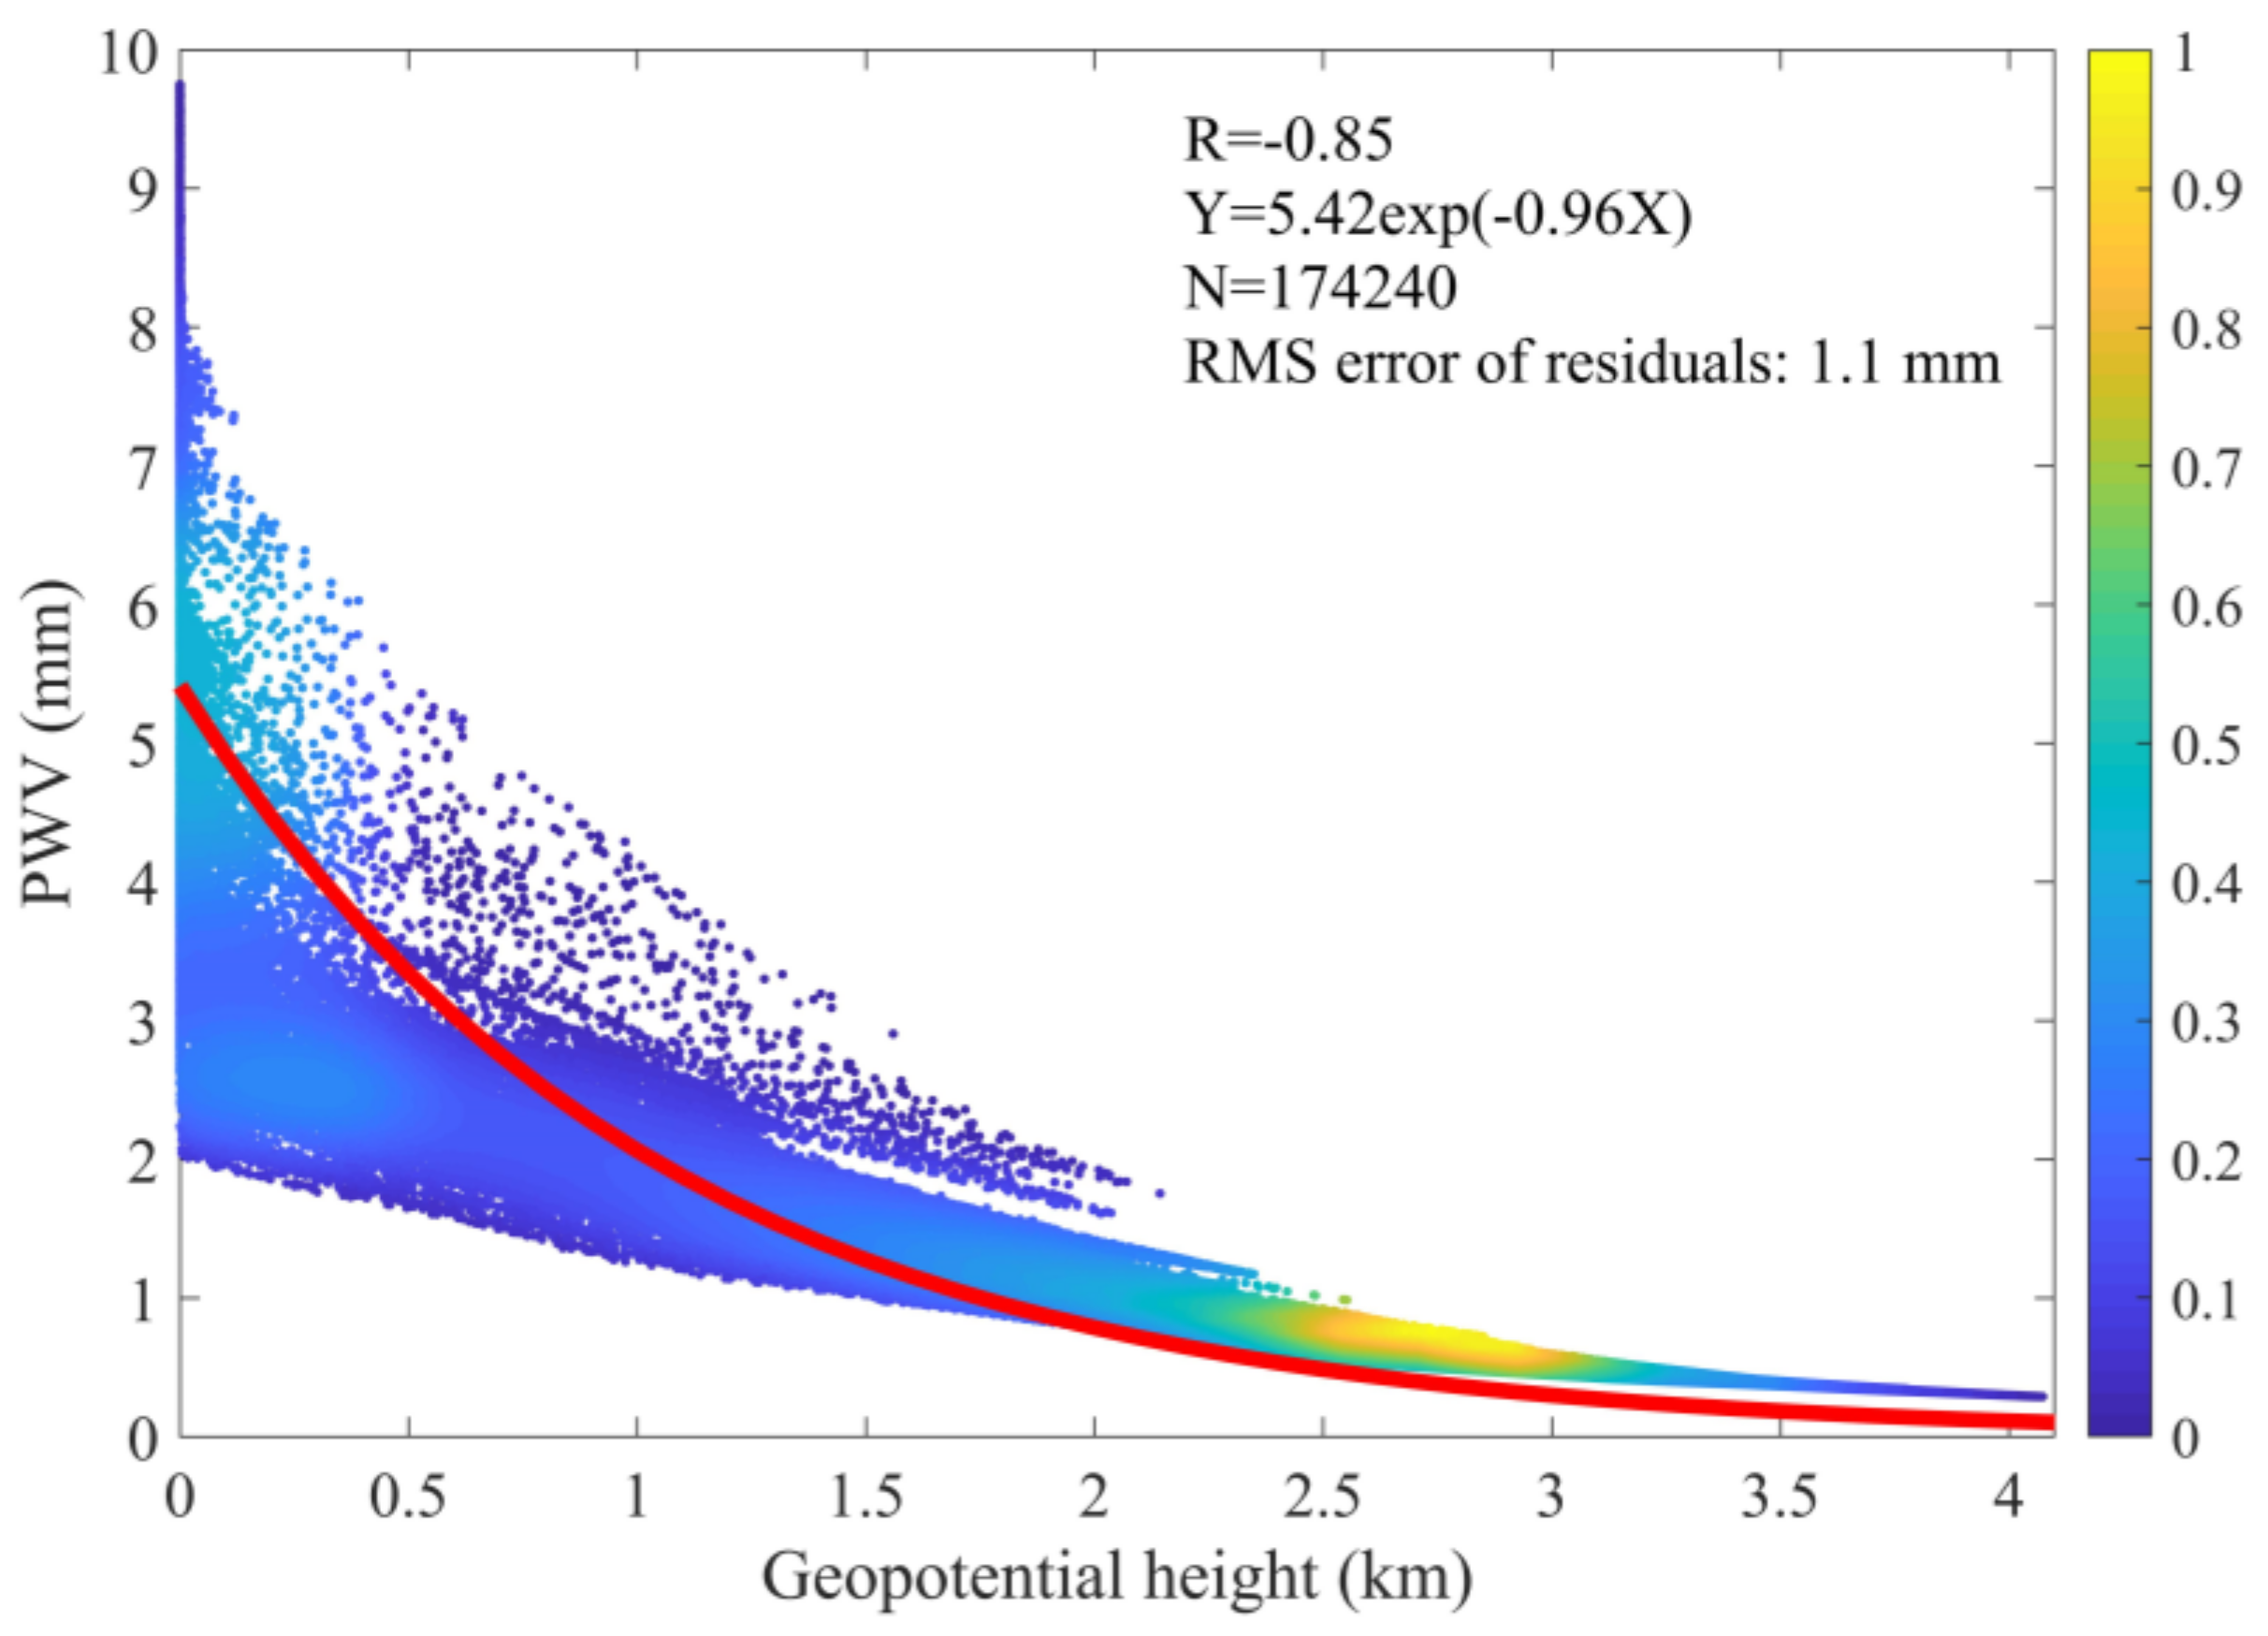
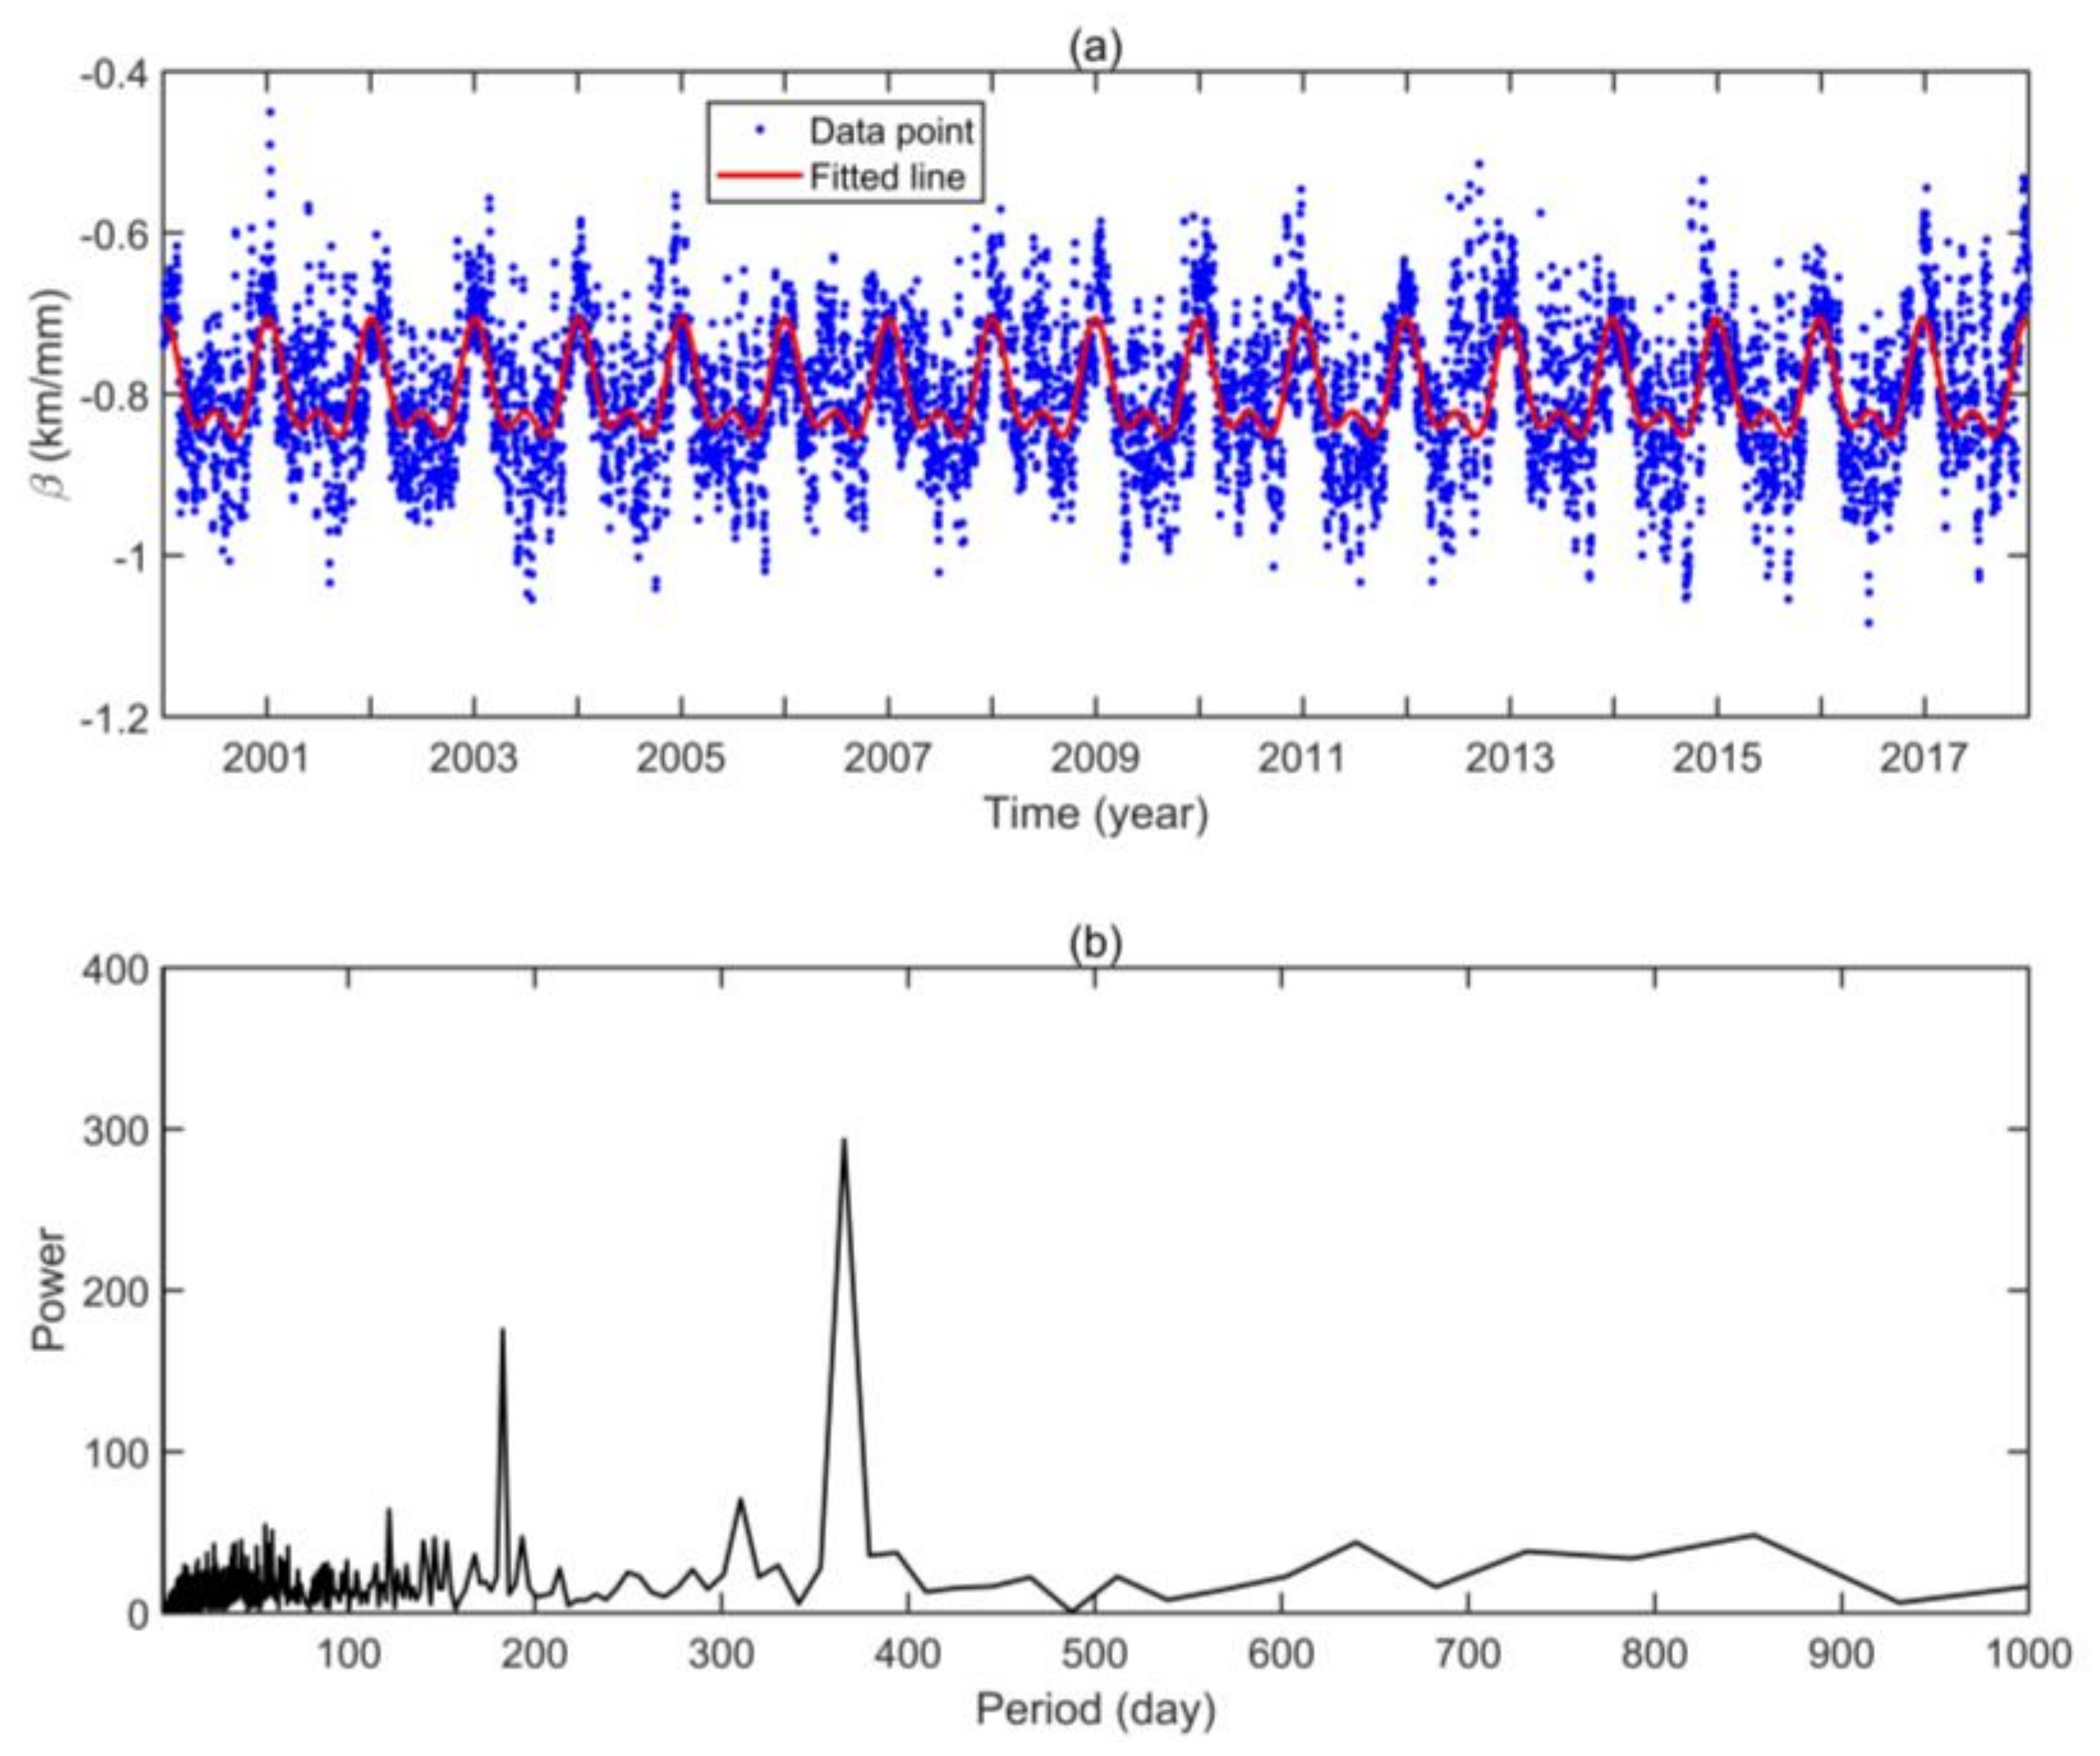
2.4. Spatial Adjustments for Meteorological Data
2.5. Method for Linear Trend Estimation
3. Assessment of PWV from Reanalyses by Radiosonde and GNSS Observations
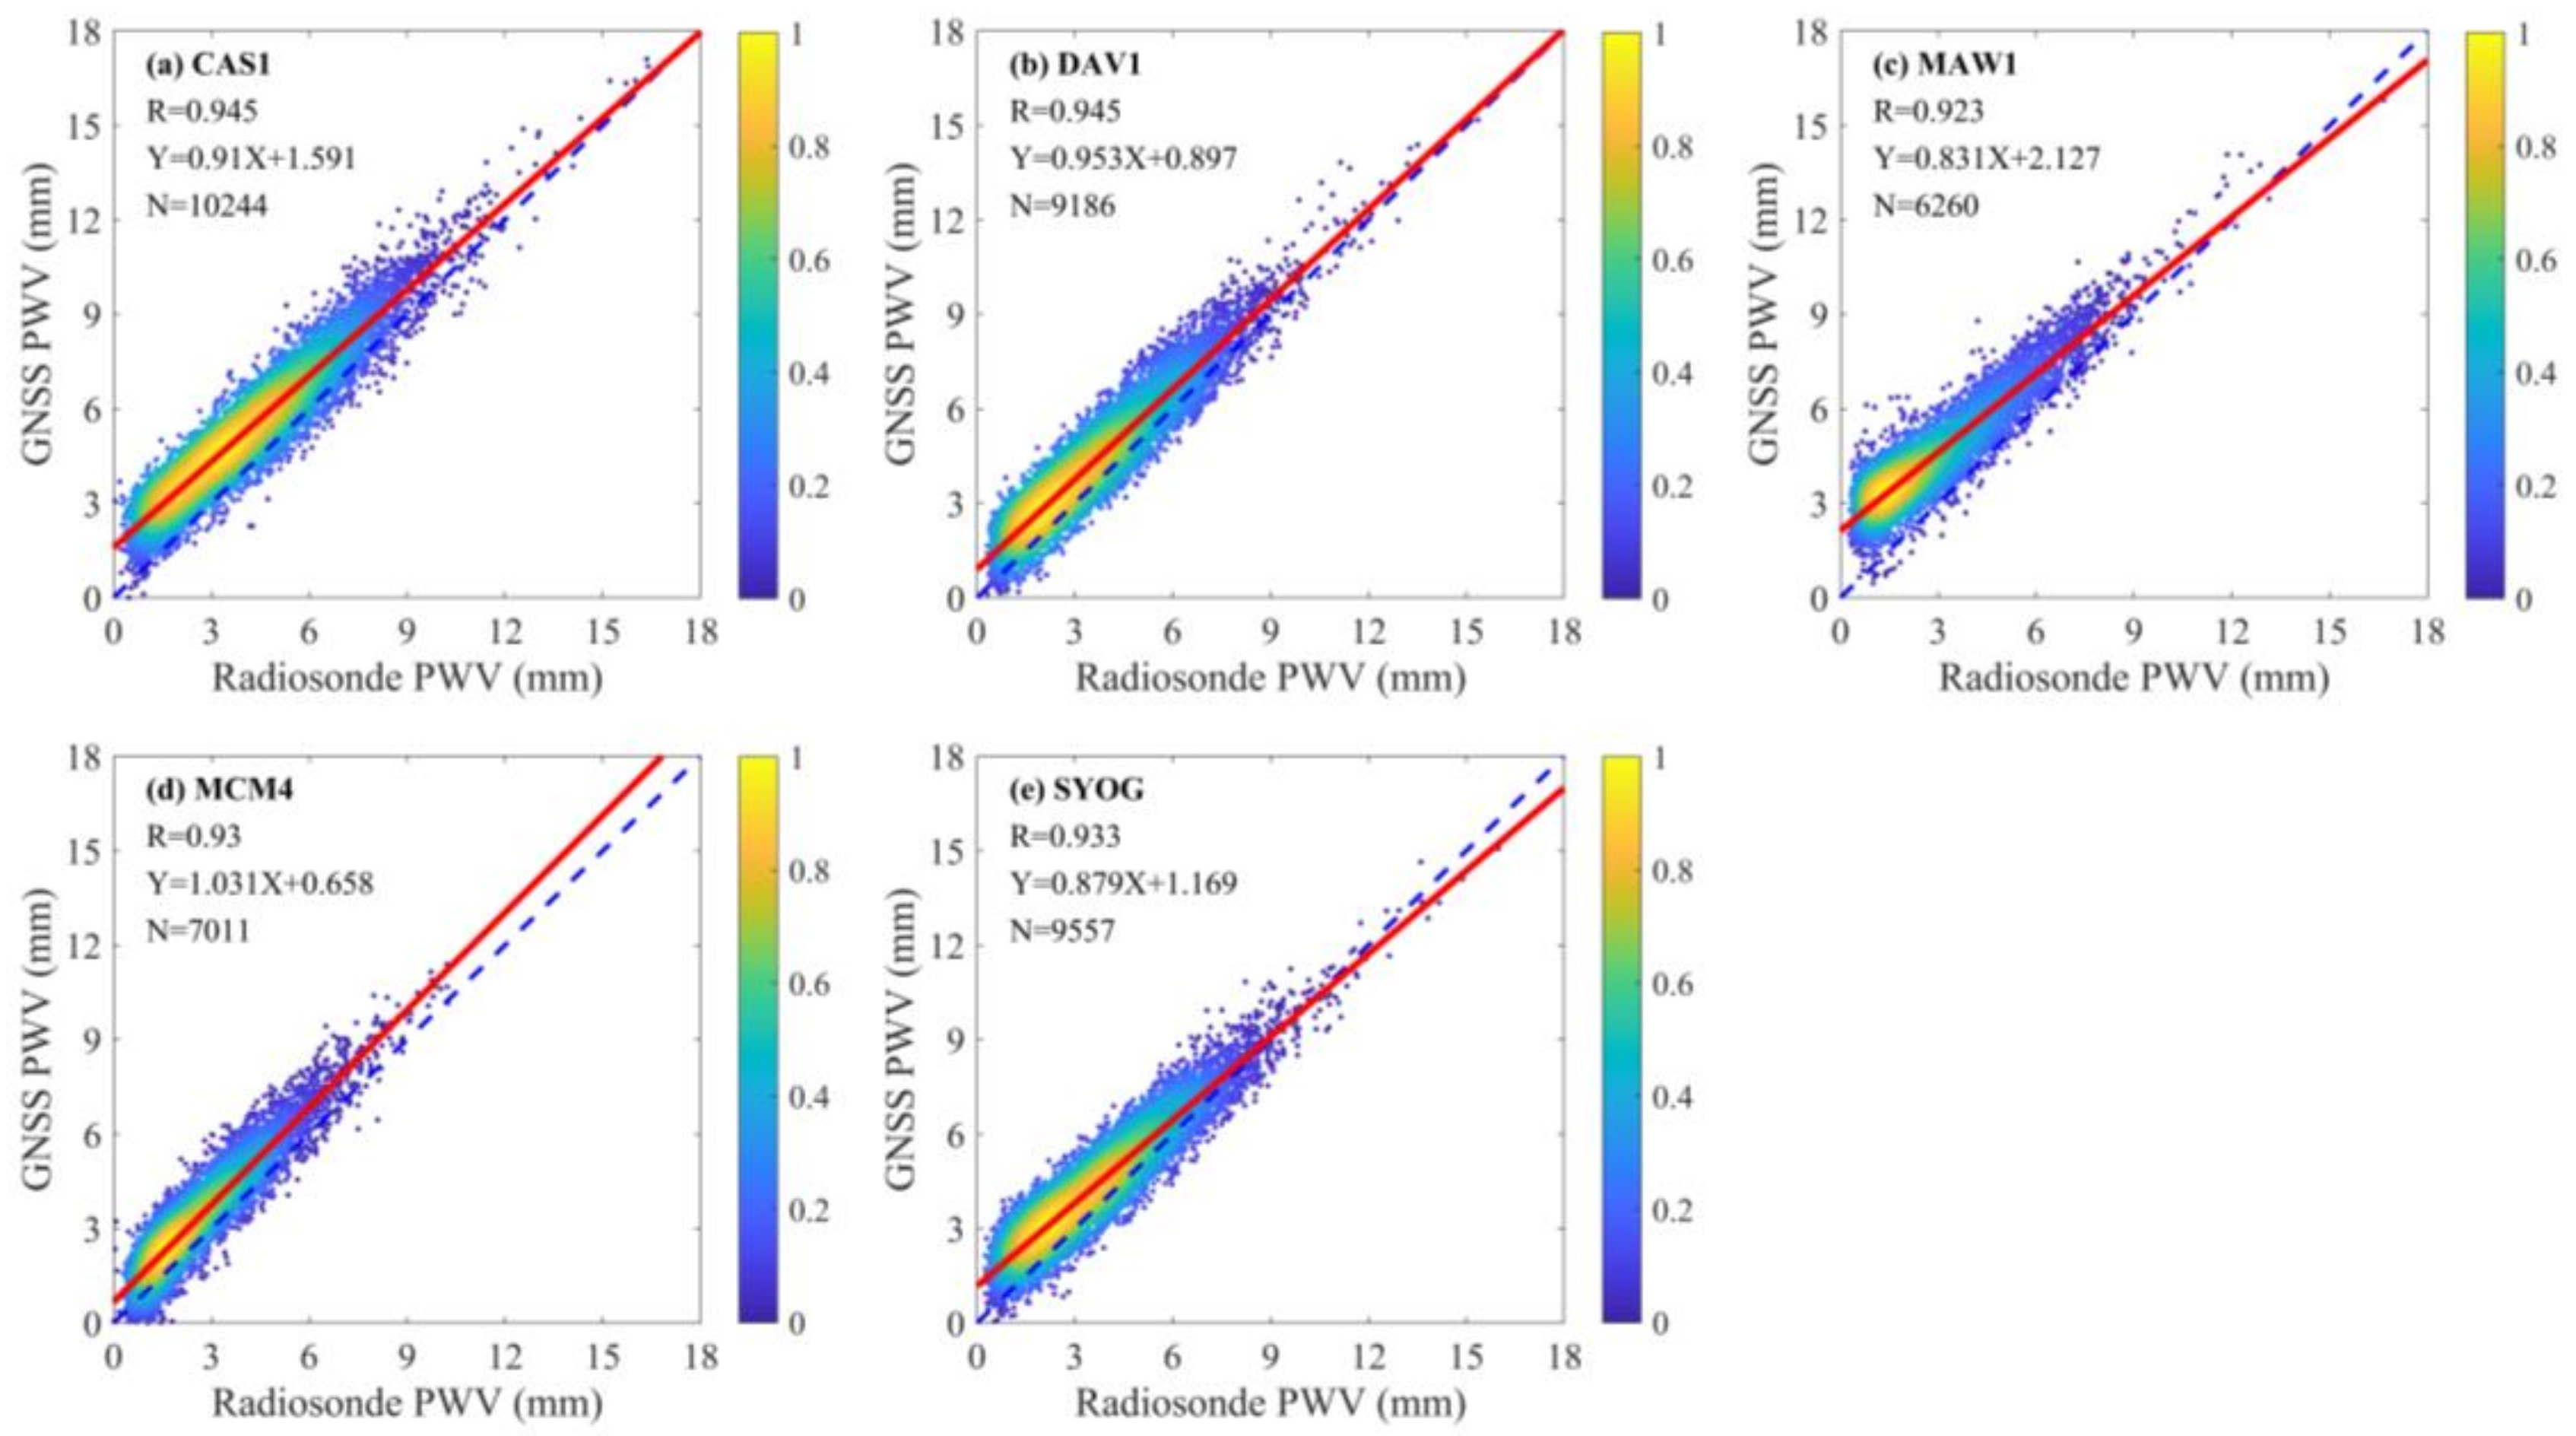
3.1. Comparison of GNSS-Derived PWV with Radiosonde Observations
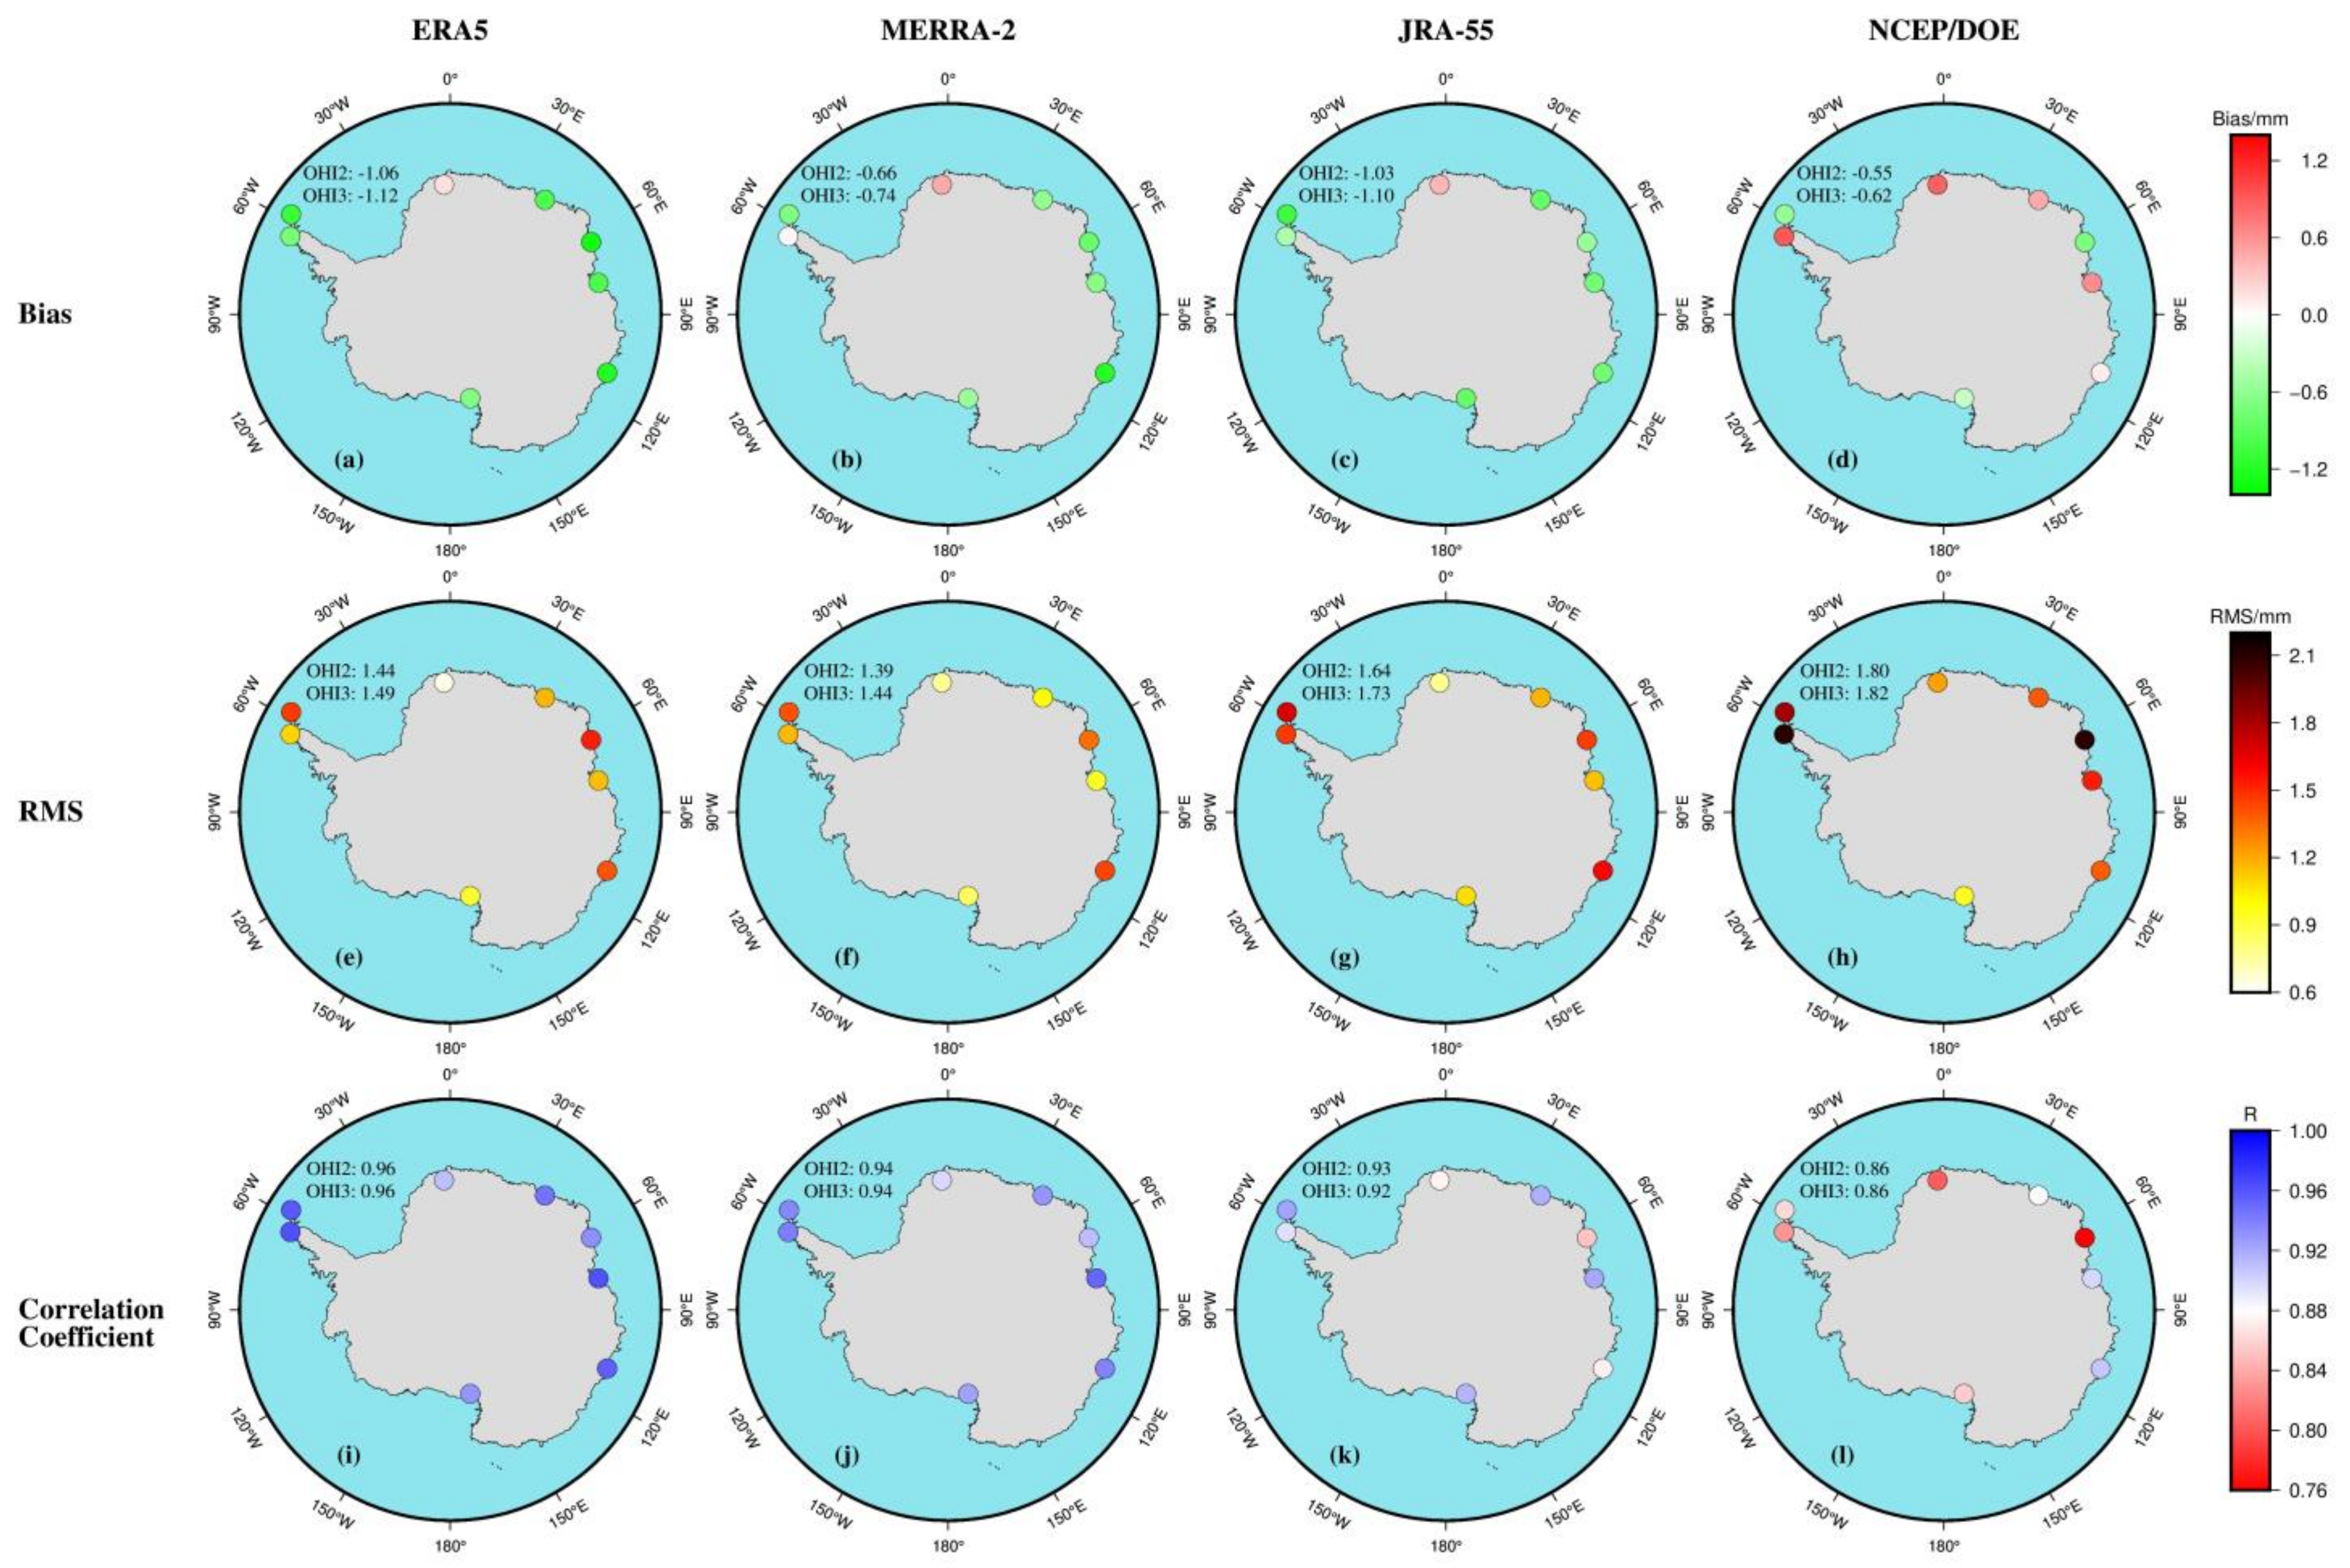
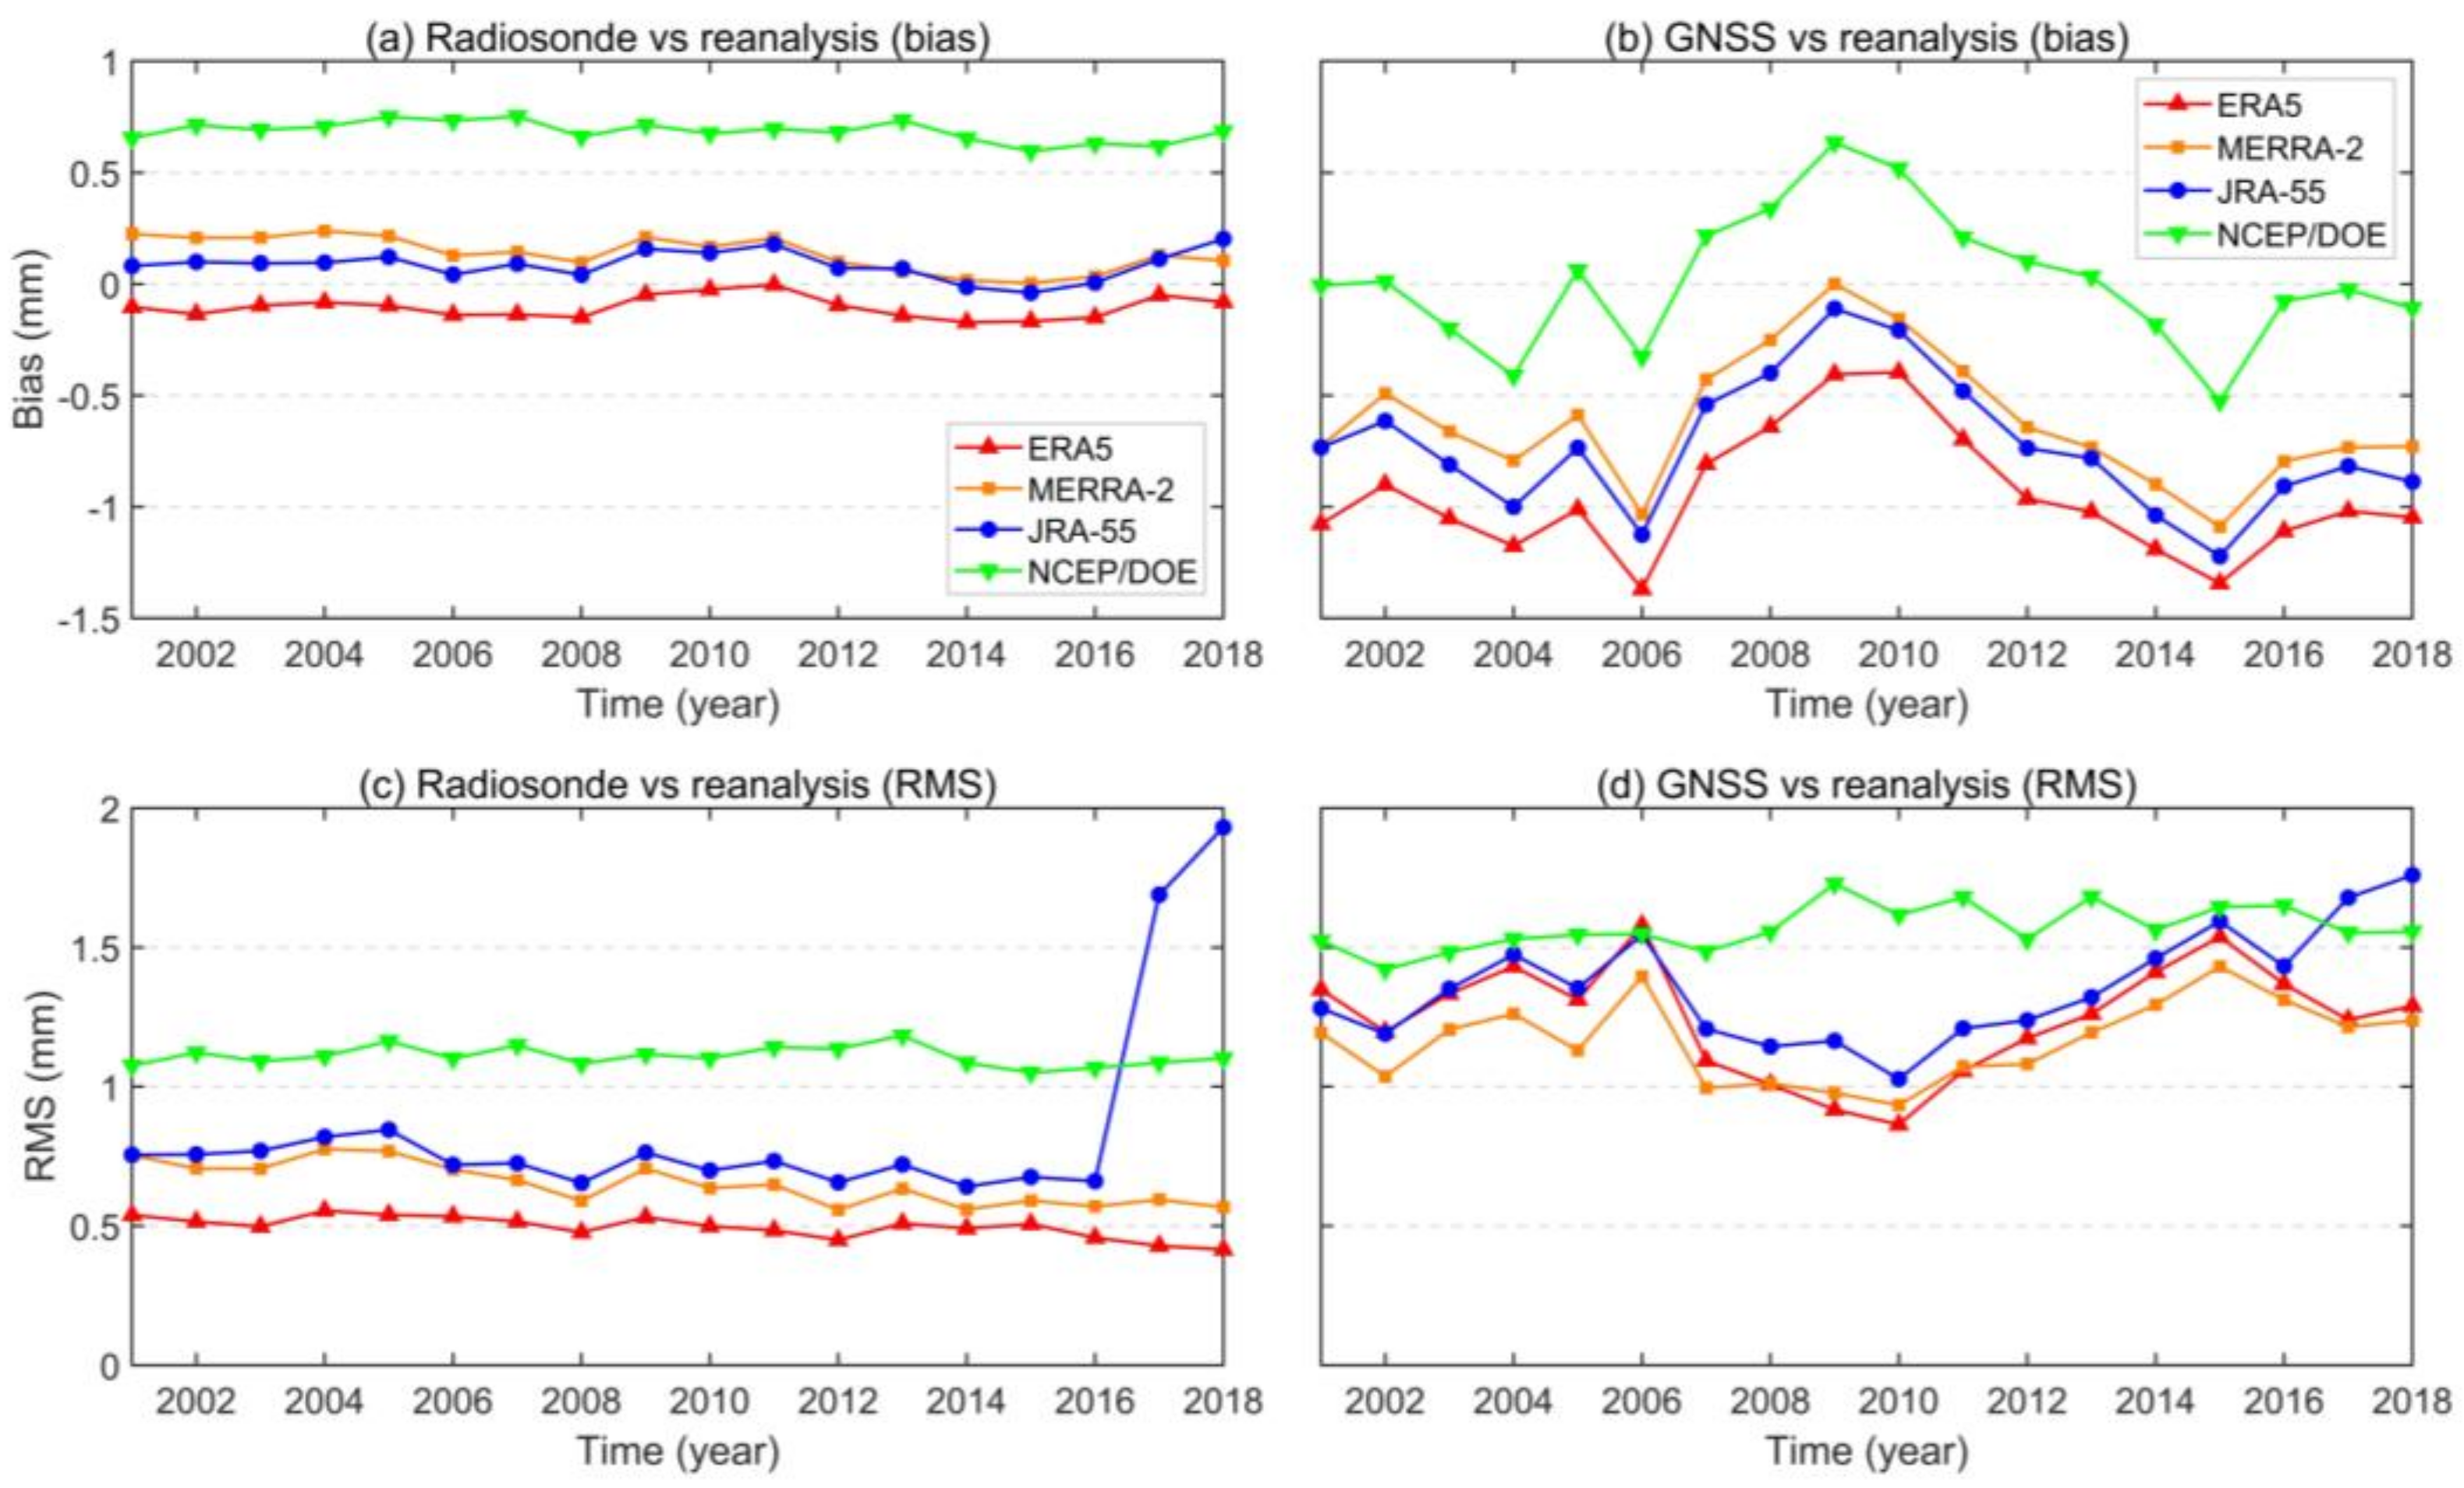
3.2. Verification of Reanalysis-Derived PWV by Radiosonde and GNSS Observations
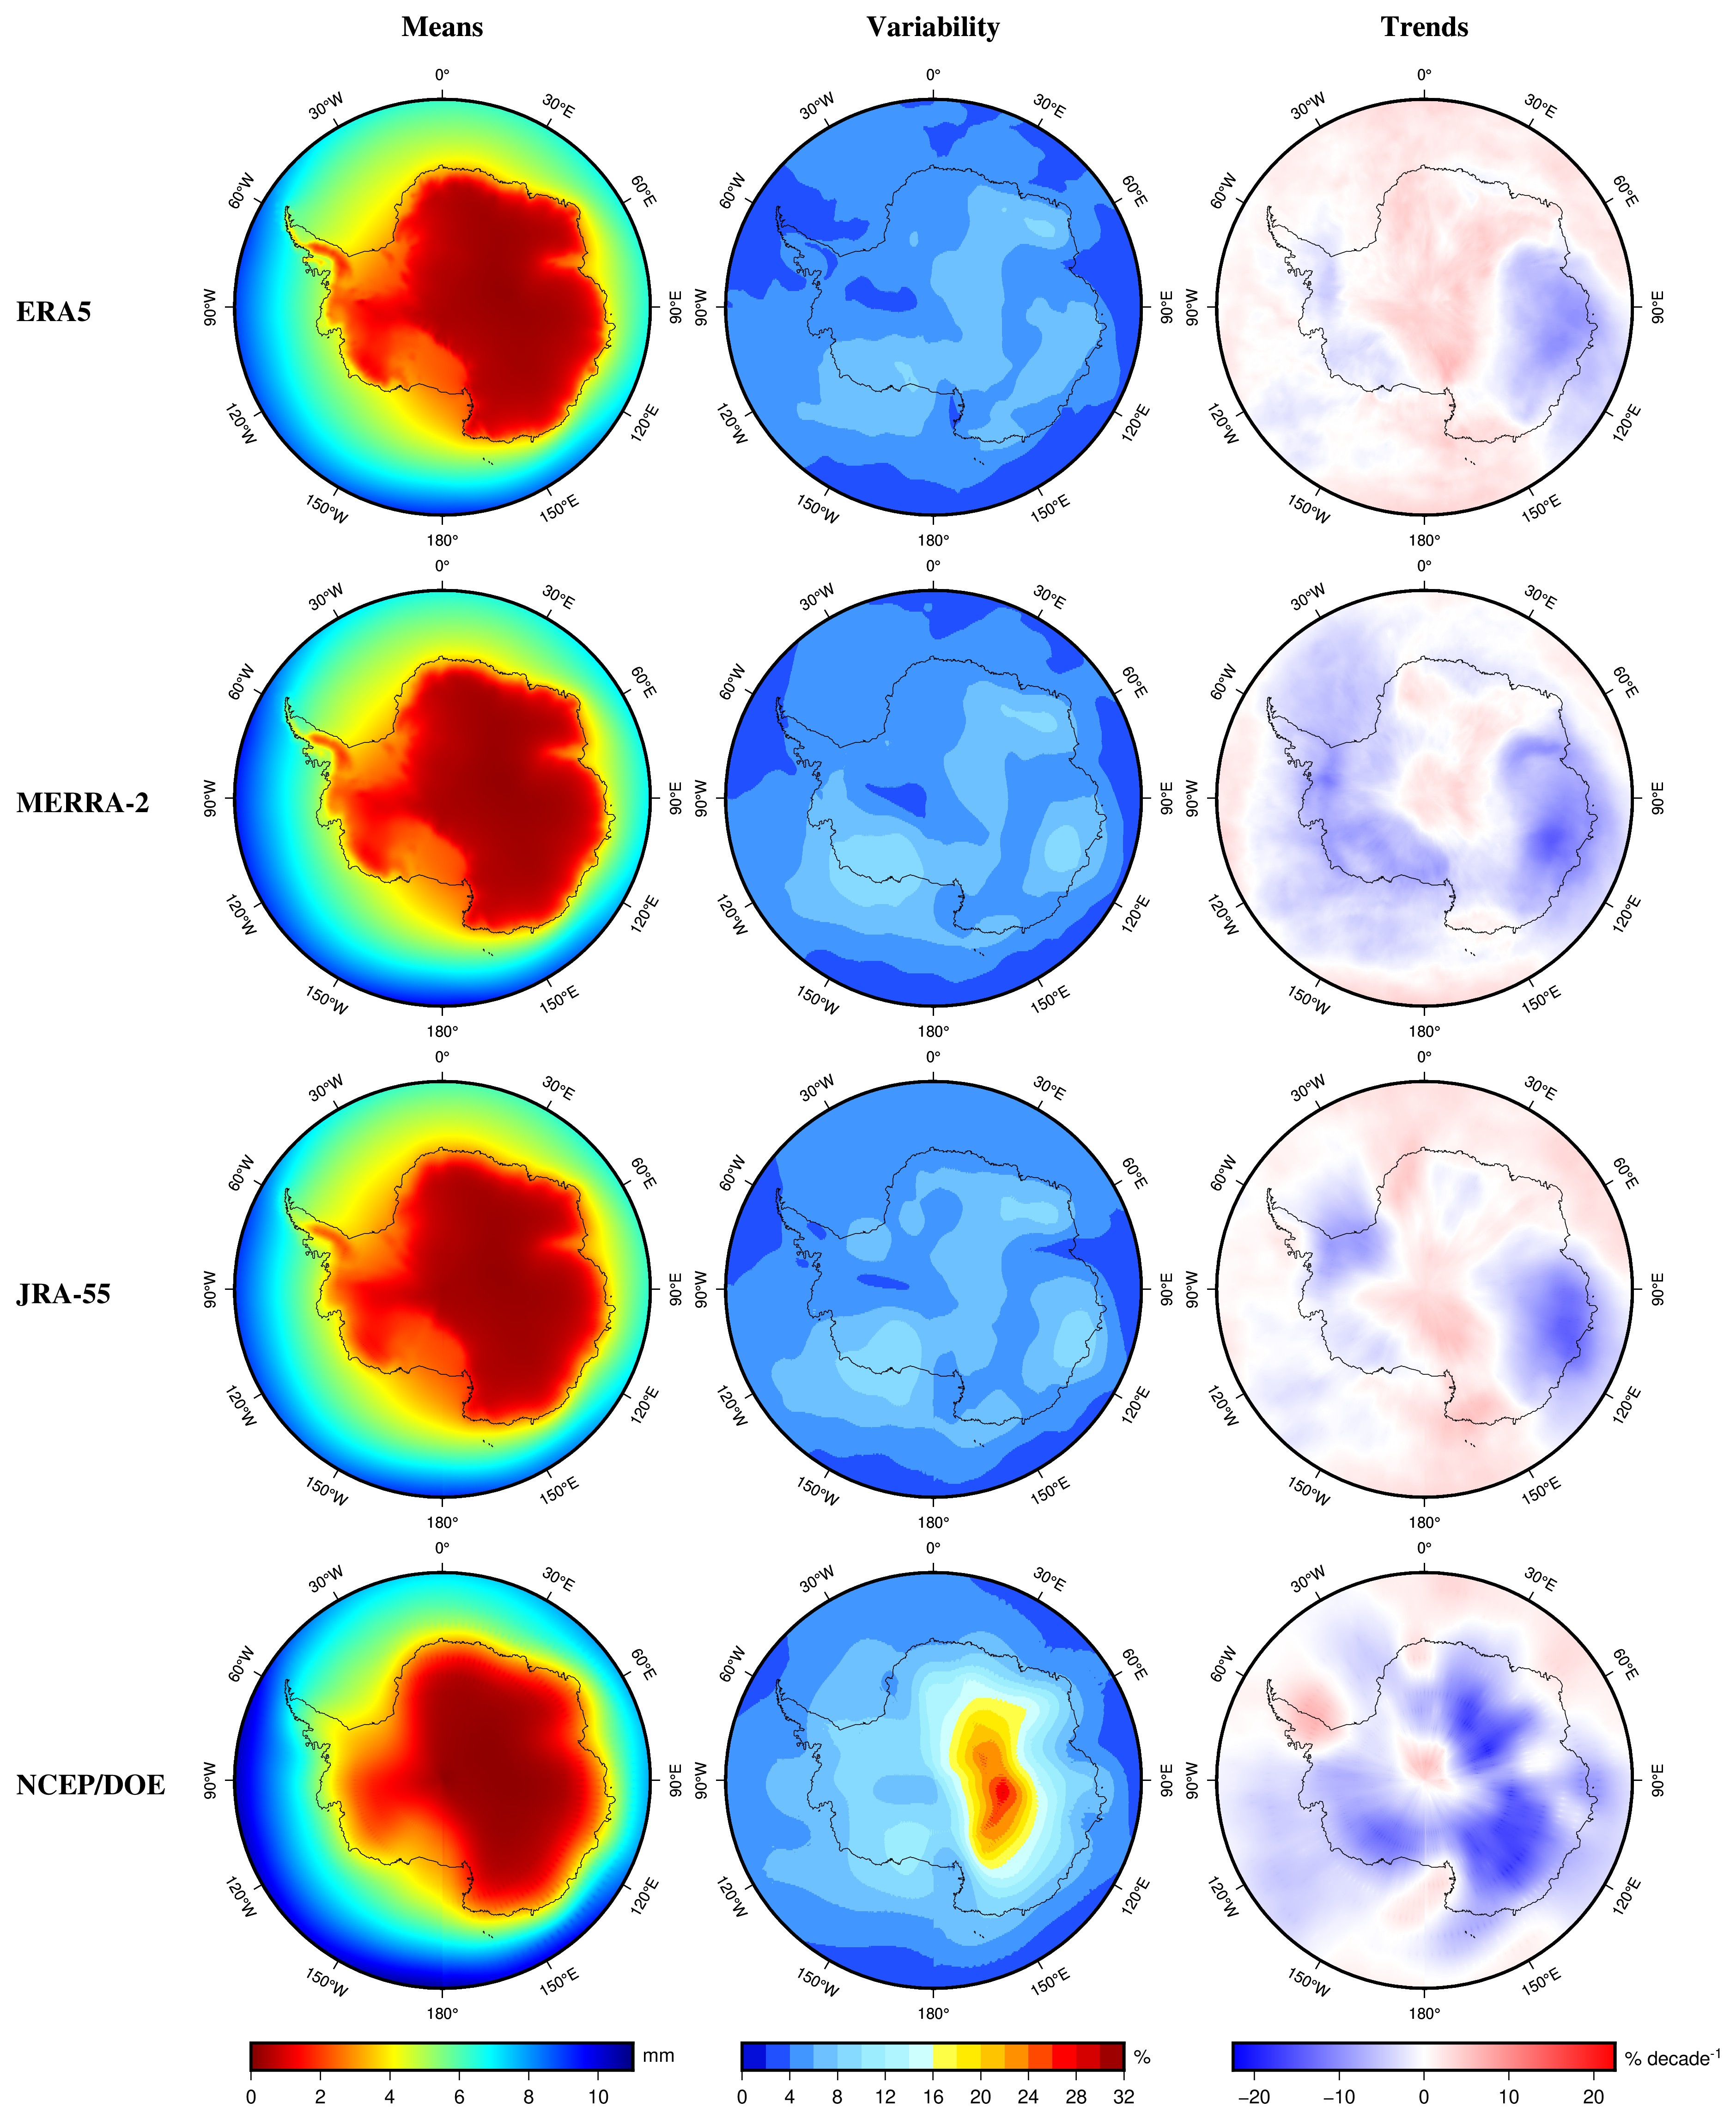
4. PWV Means, Variability and Trend
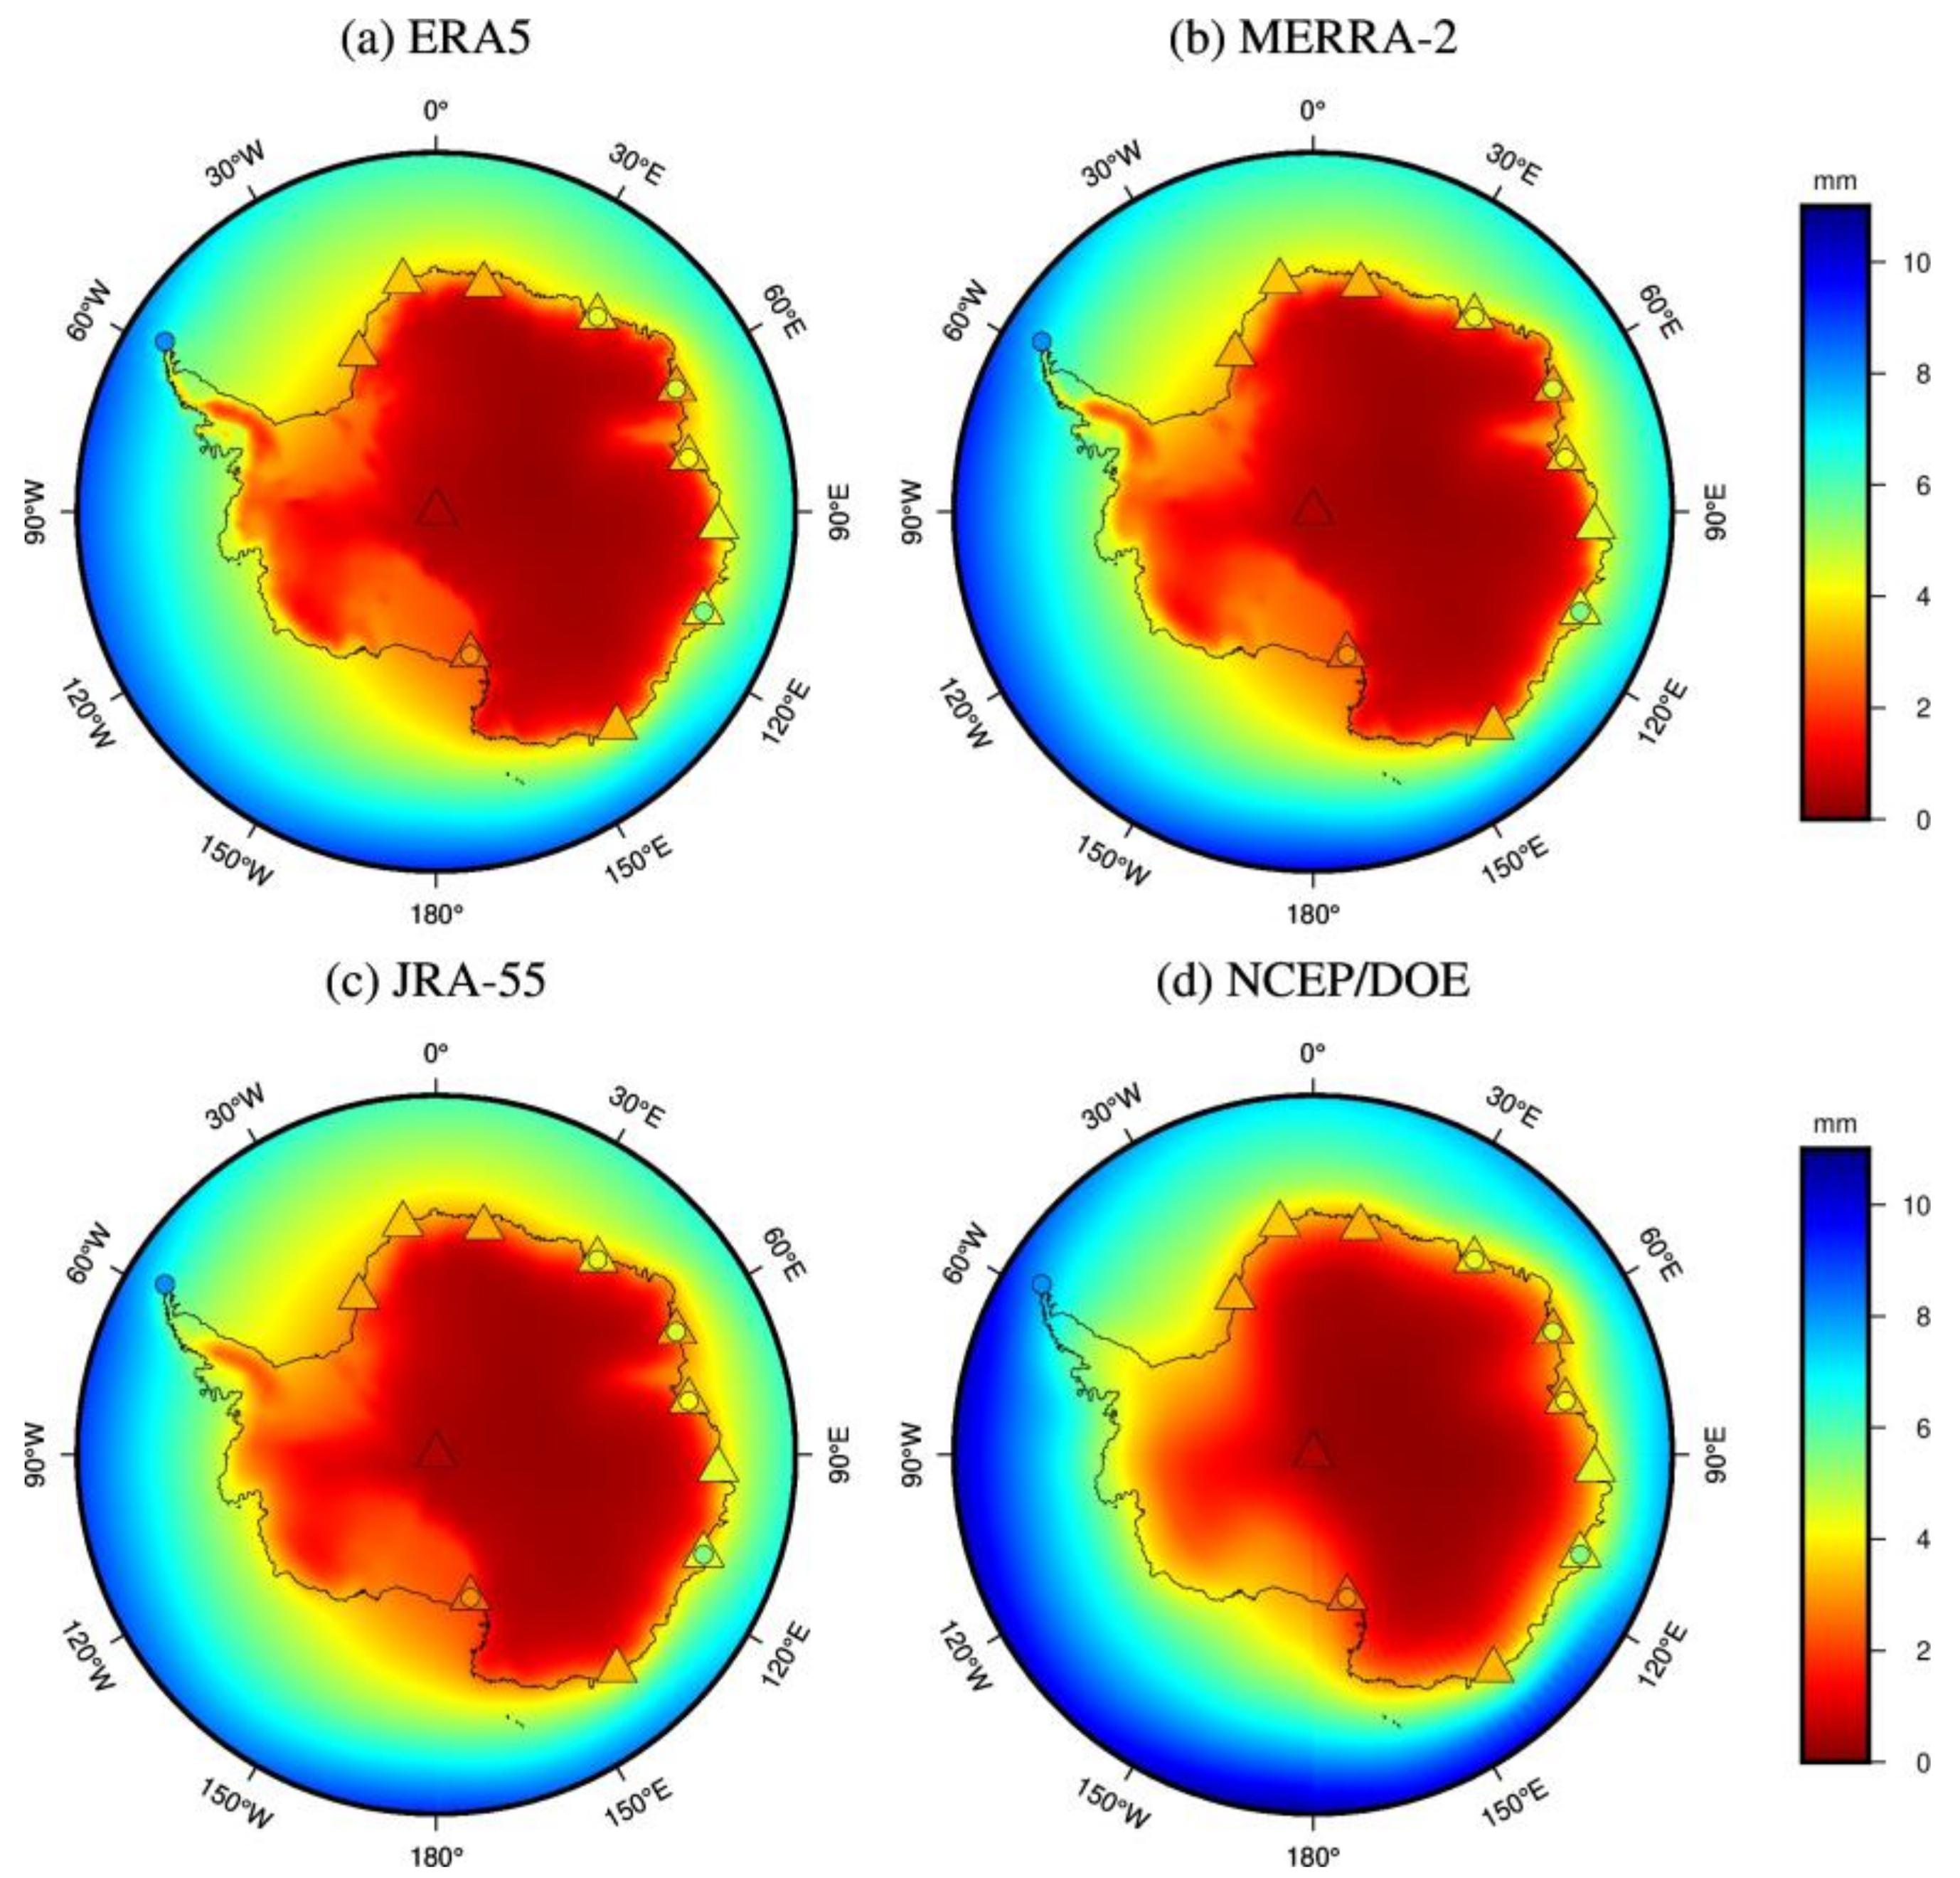
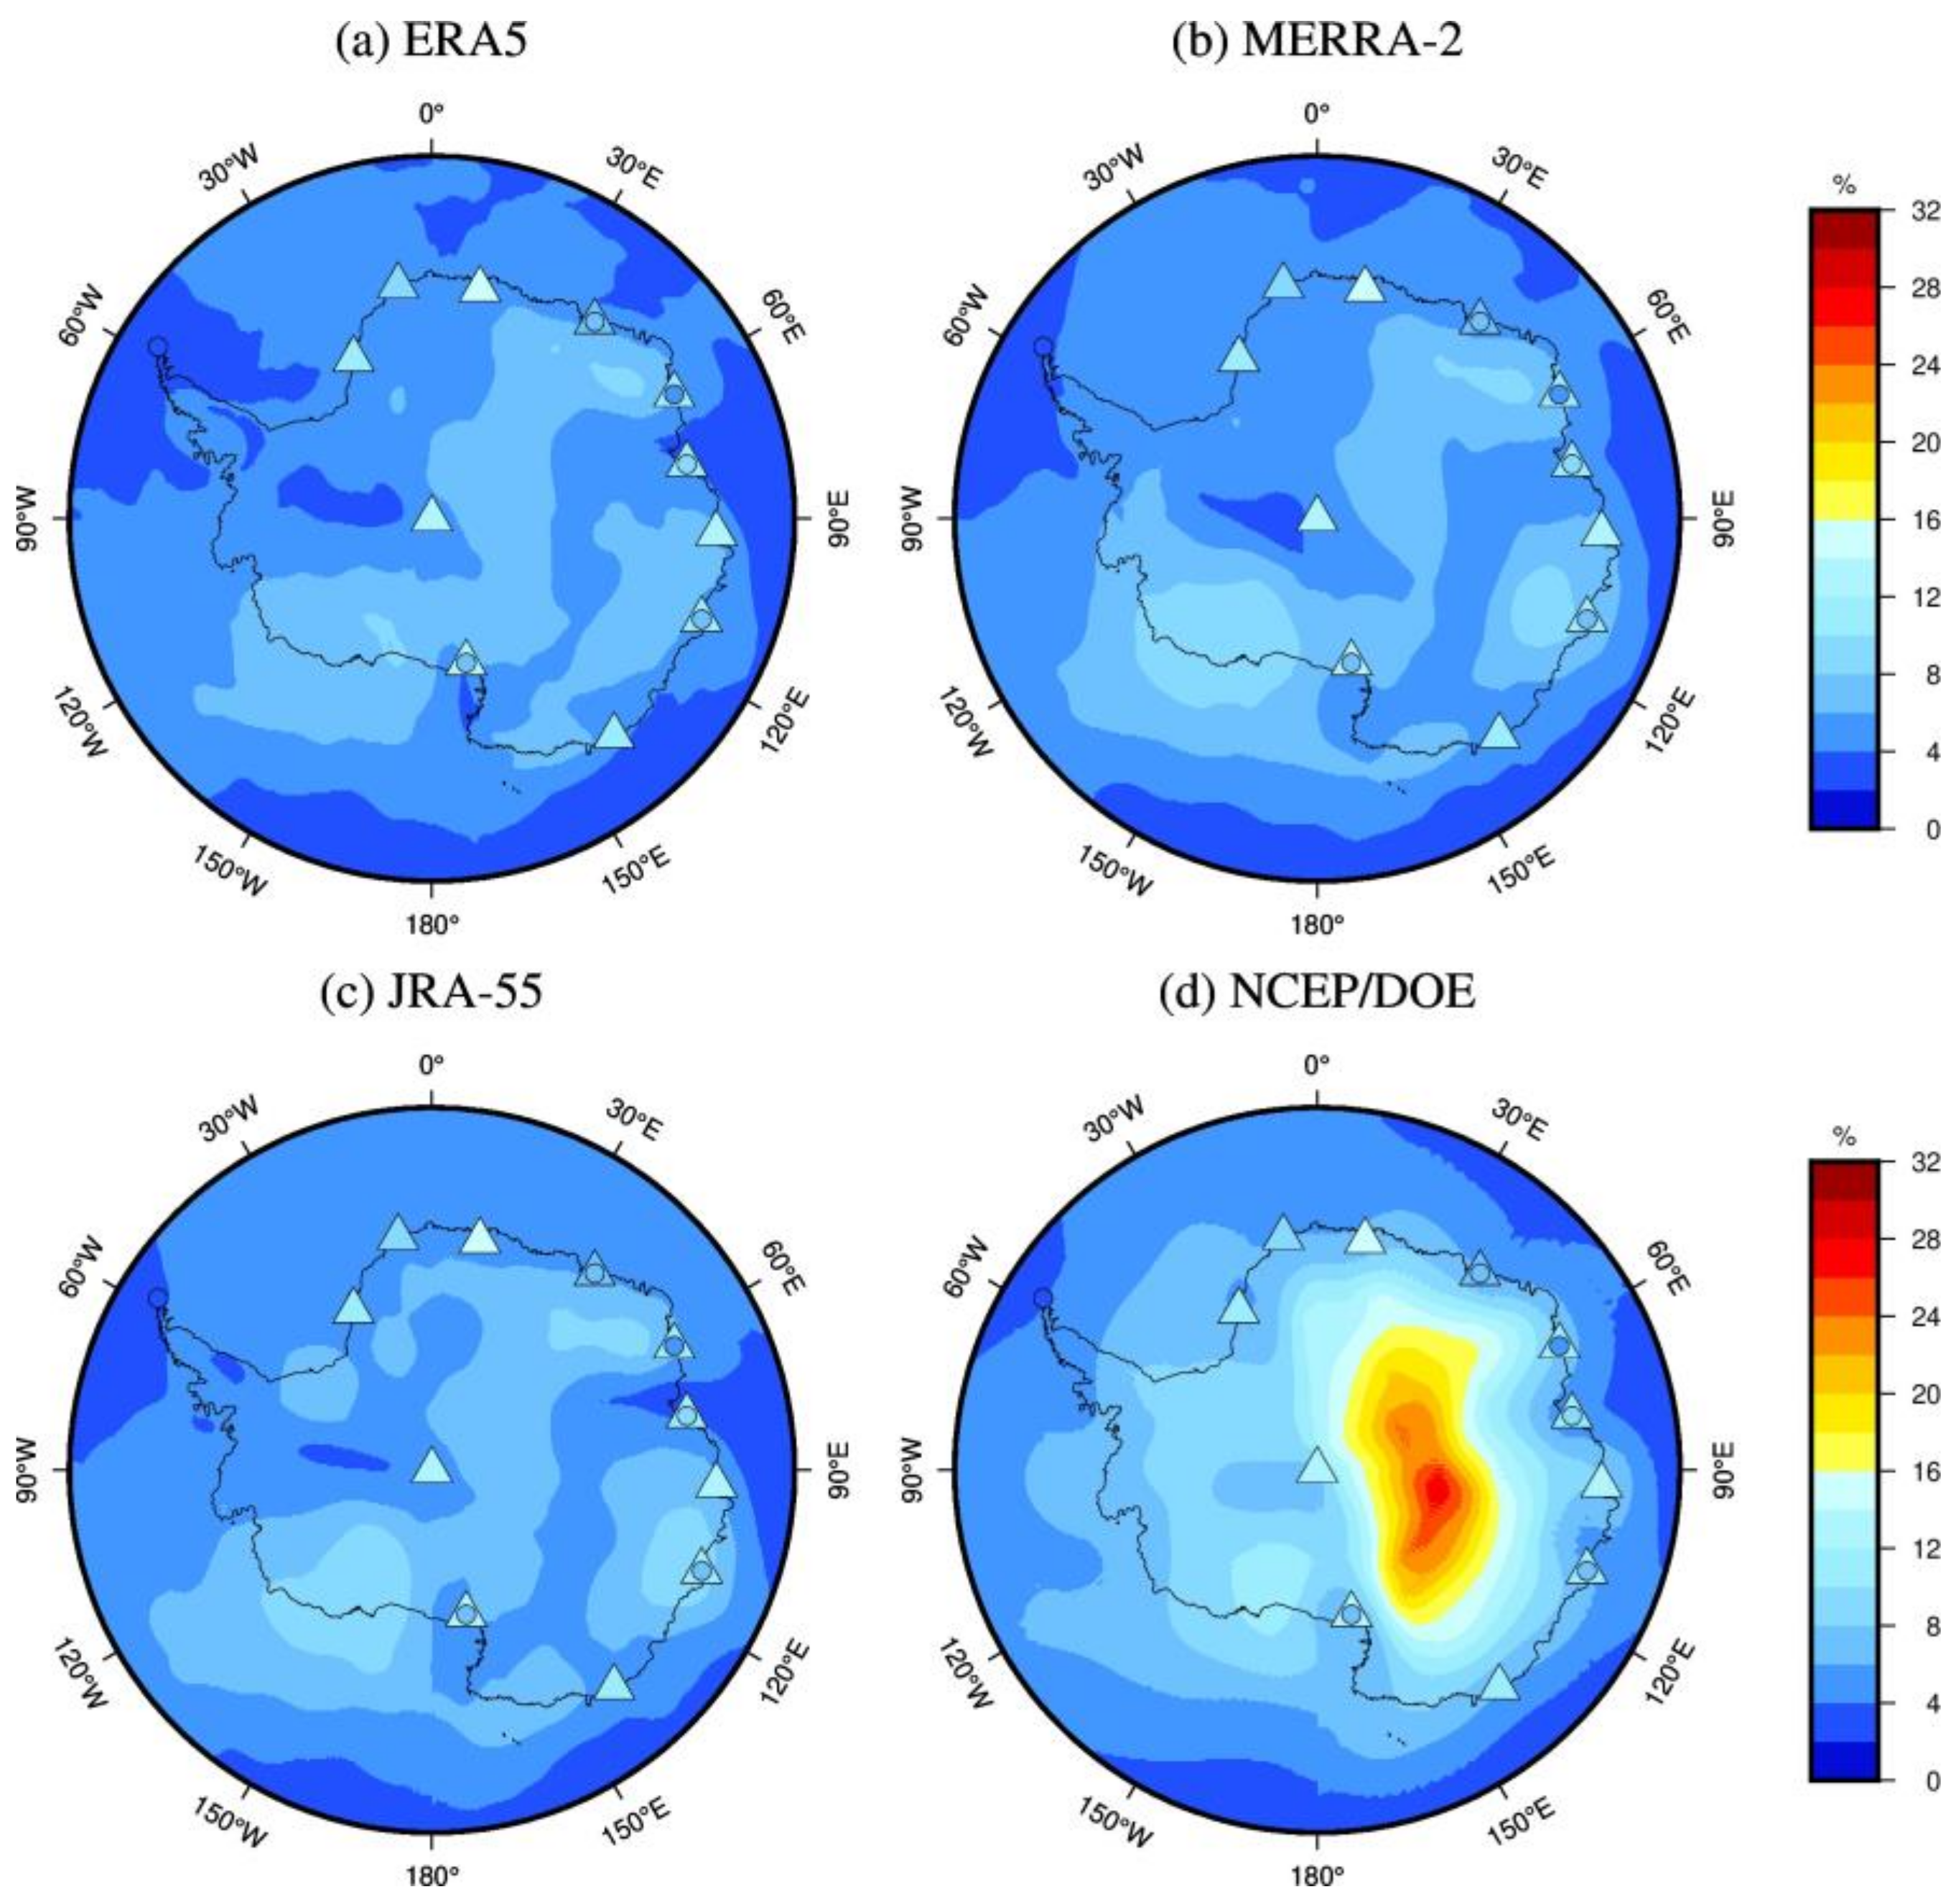
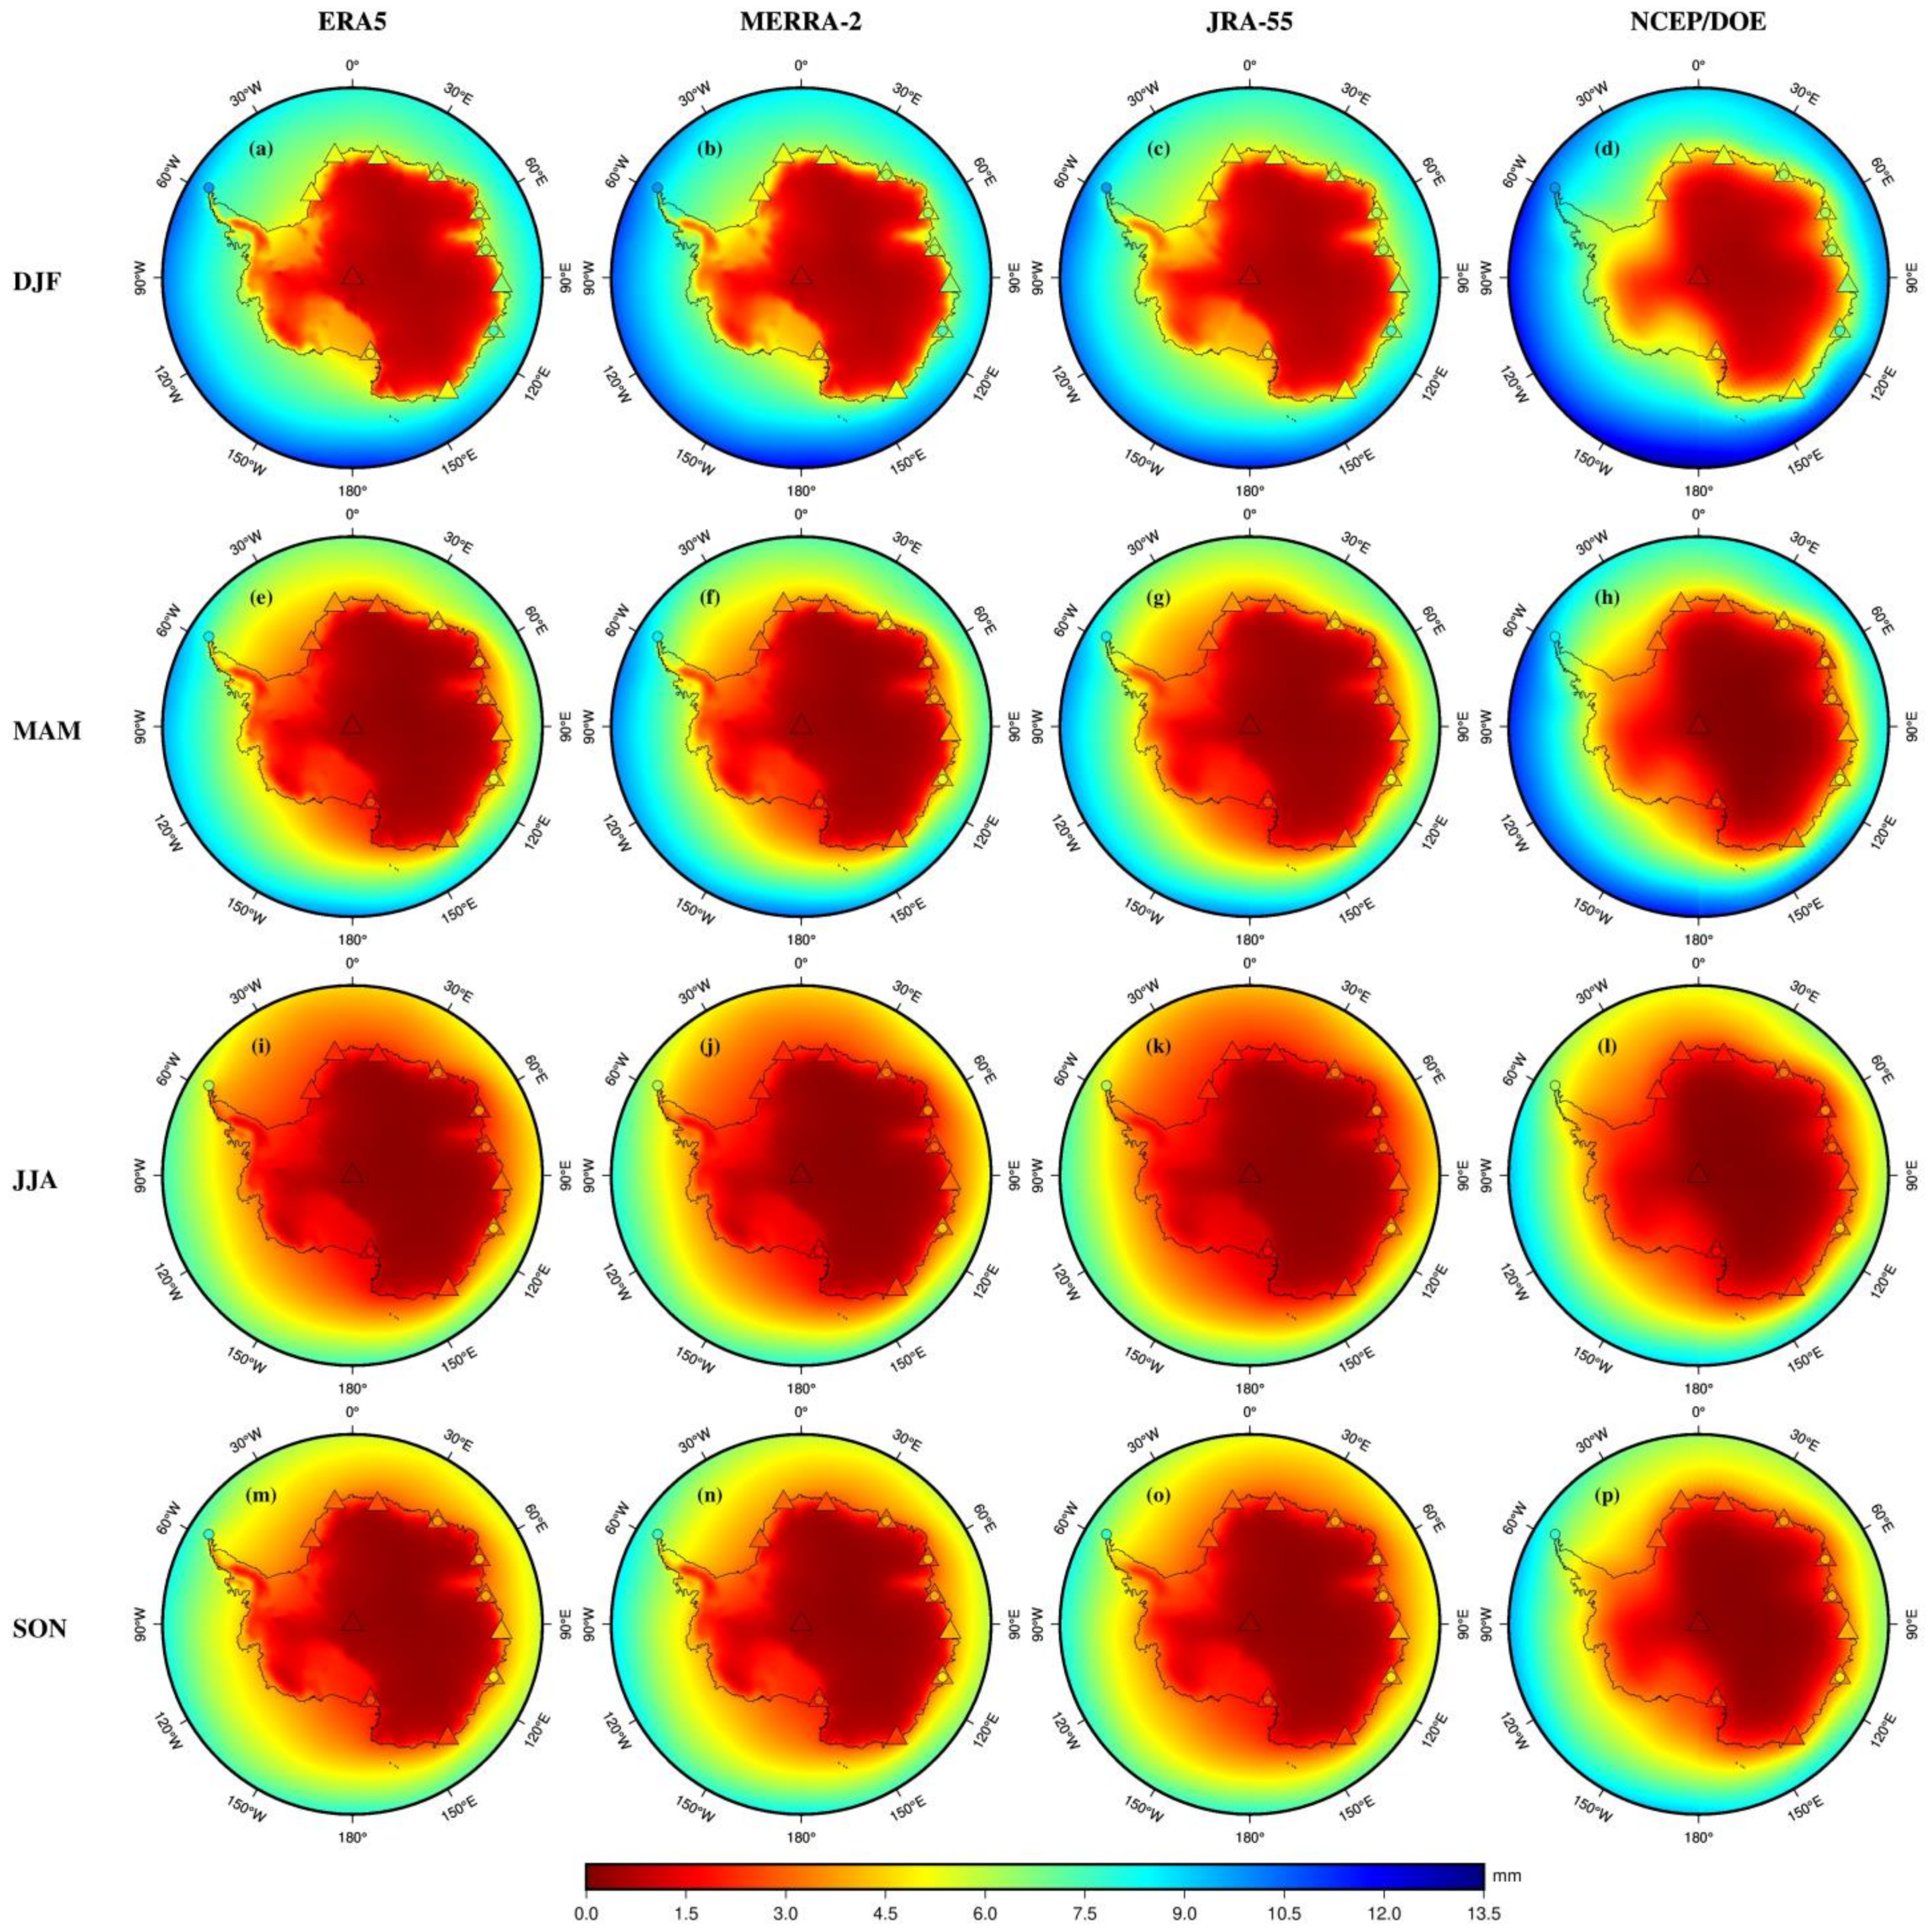
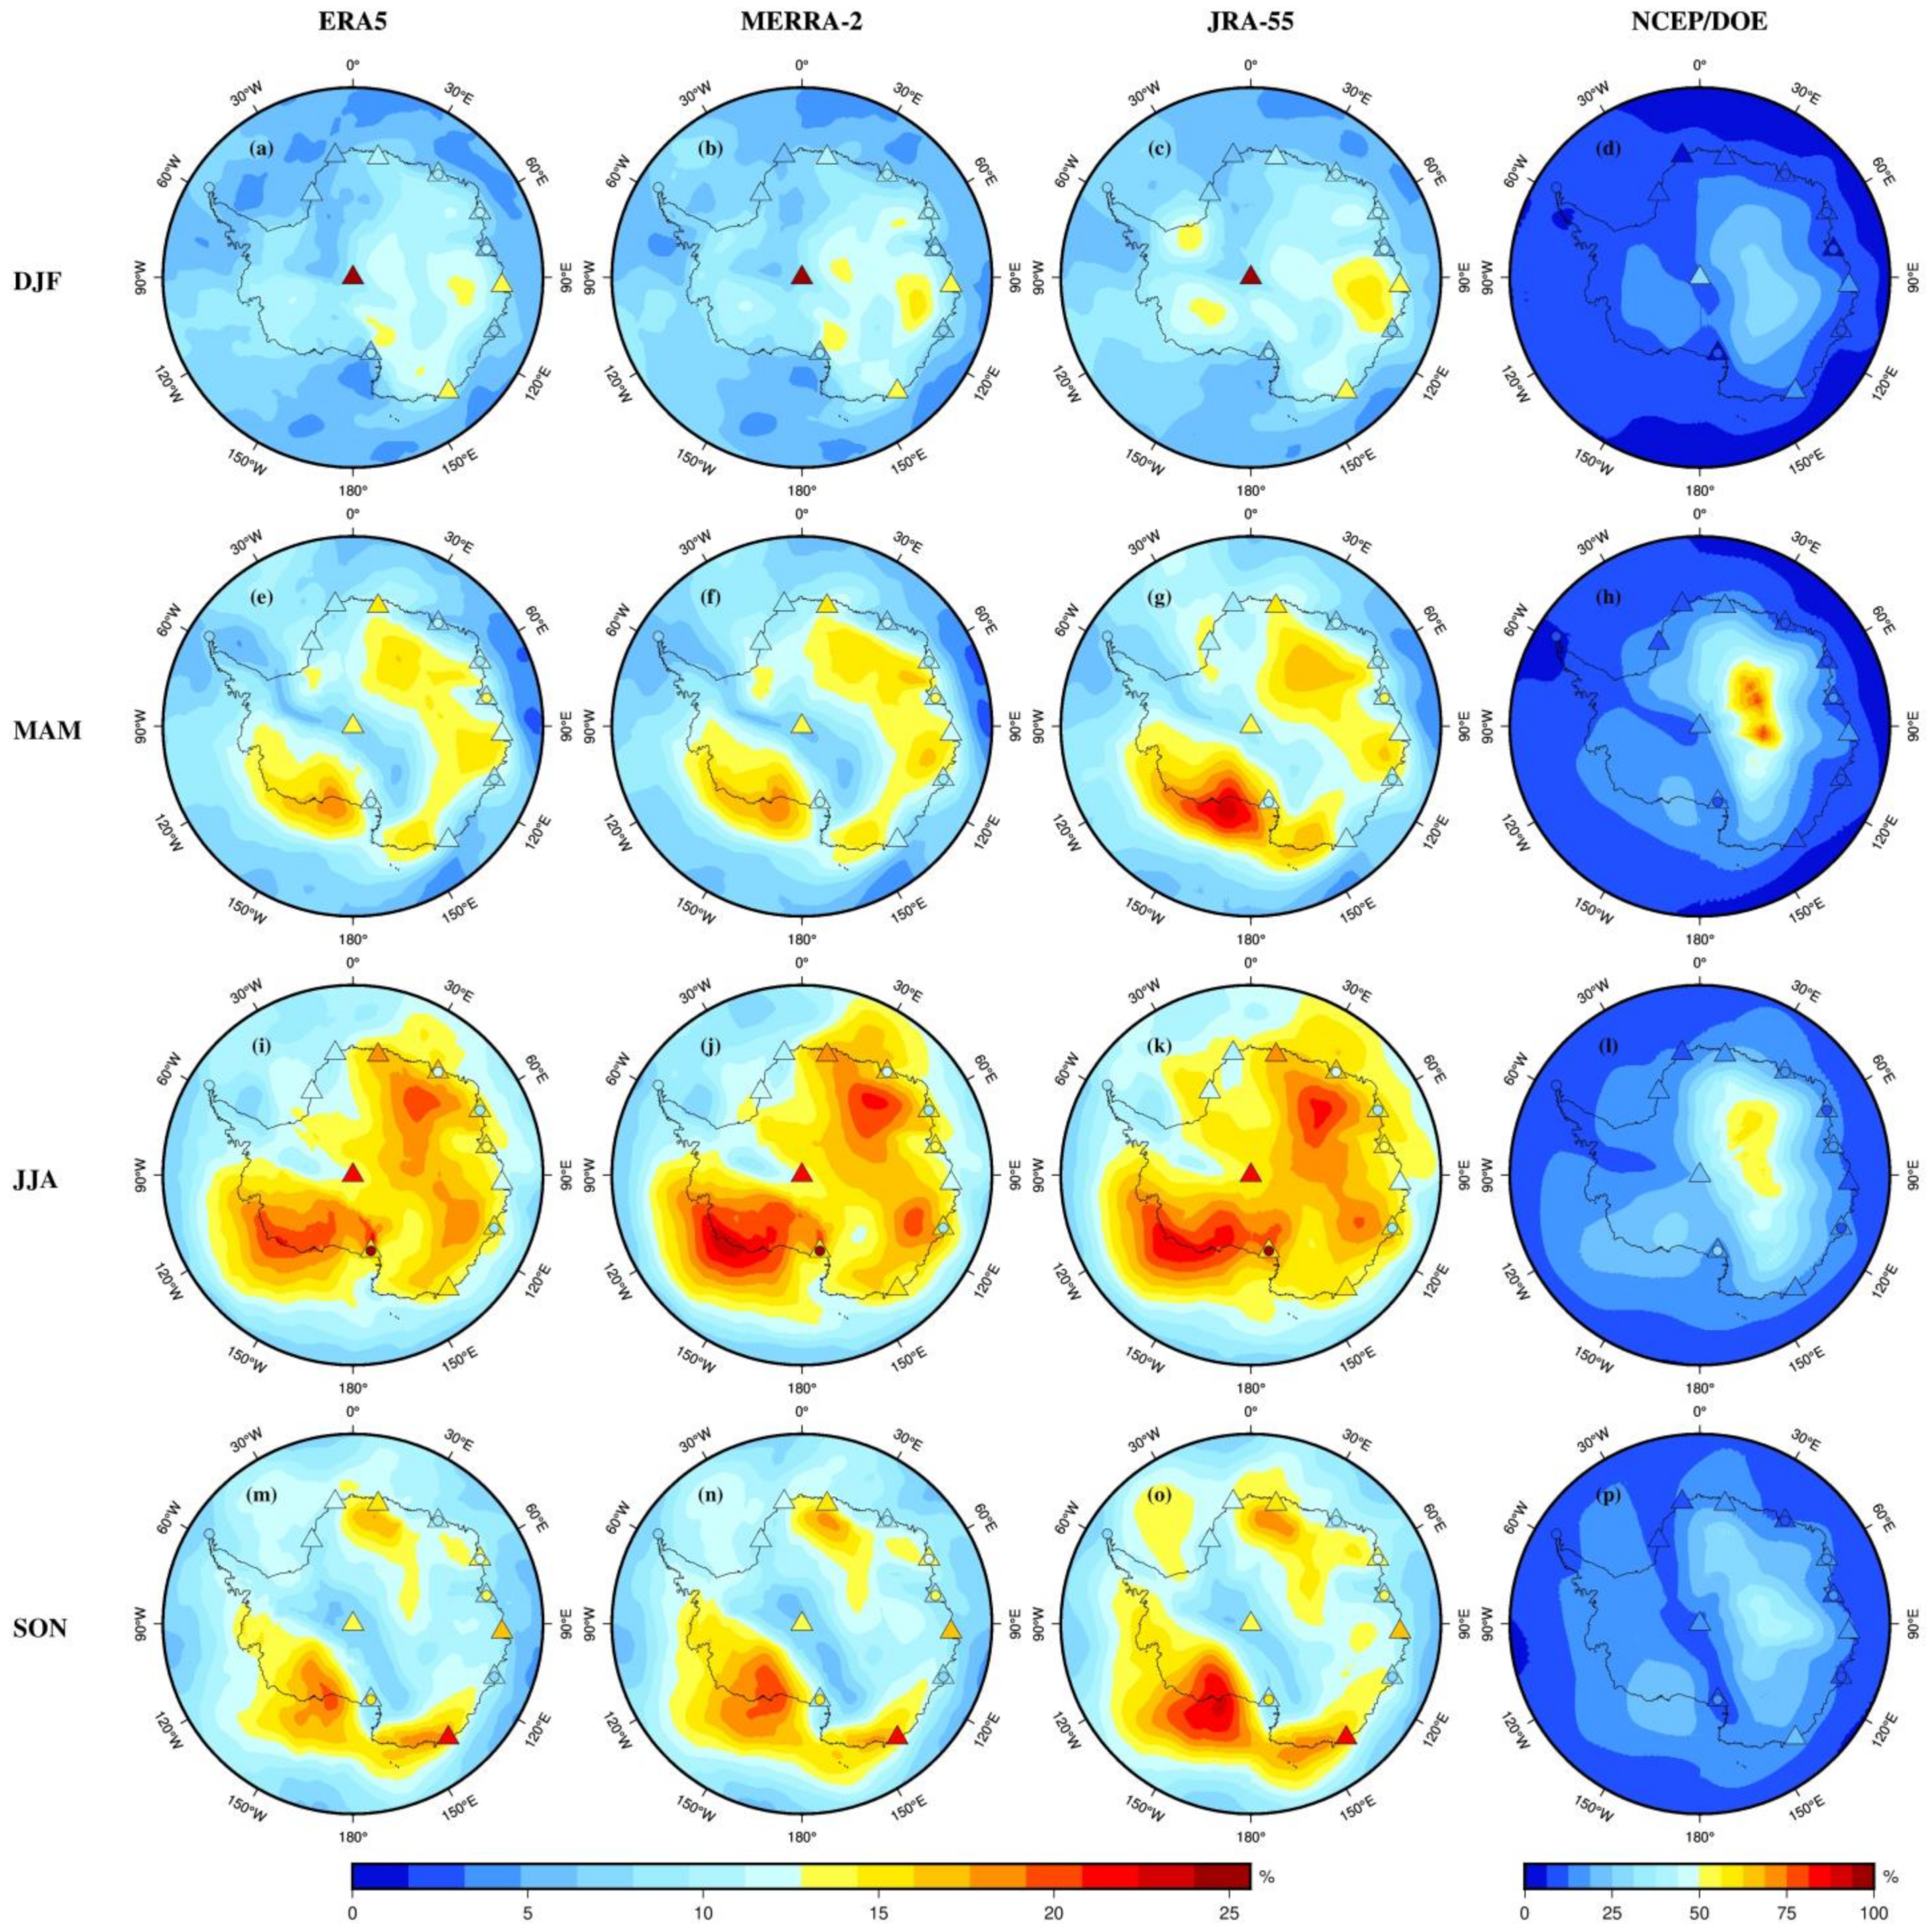
4.1. PWV Means and Variability
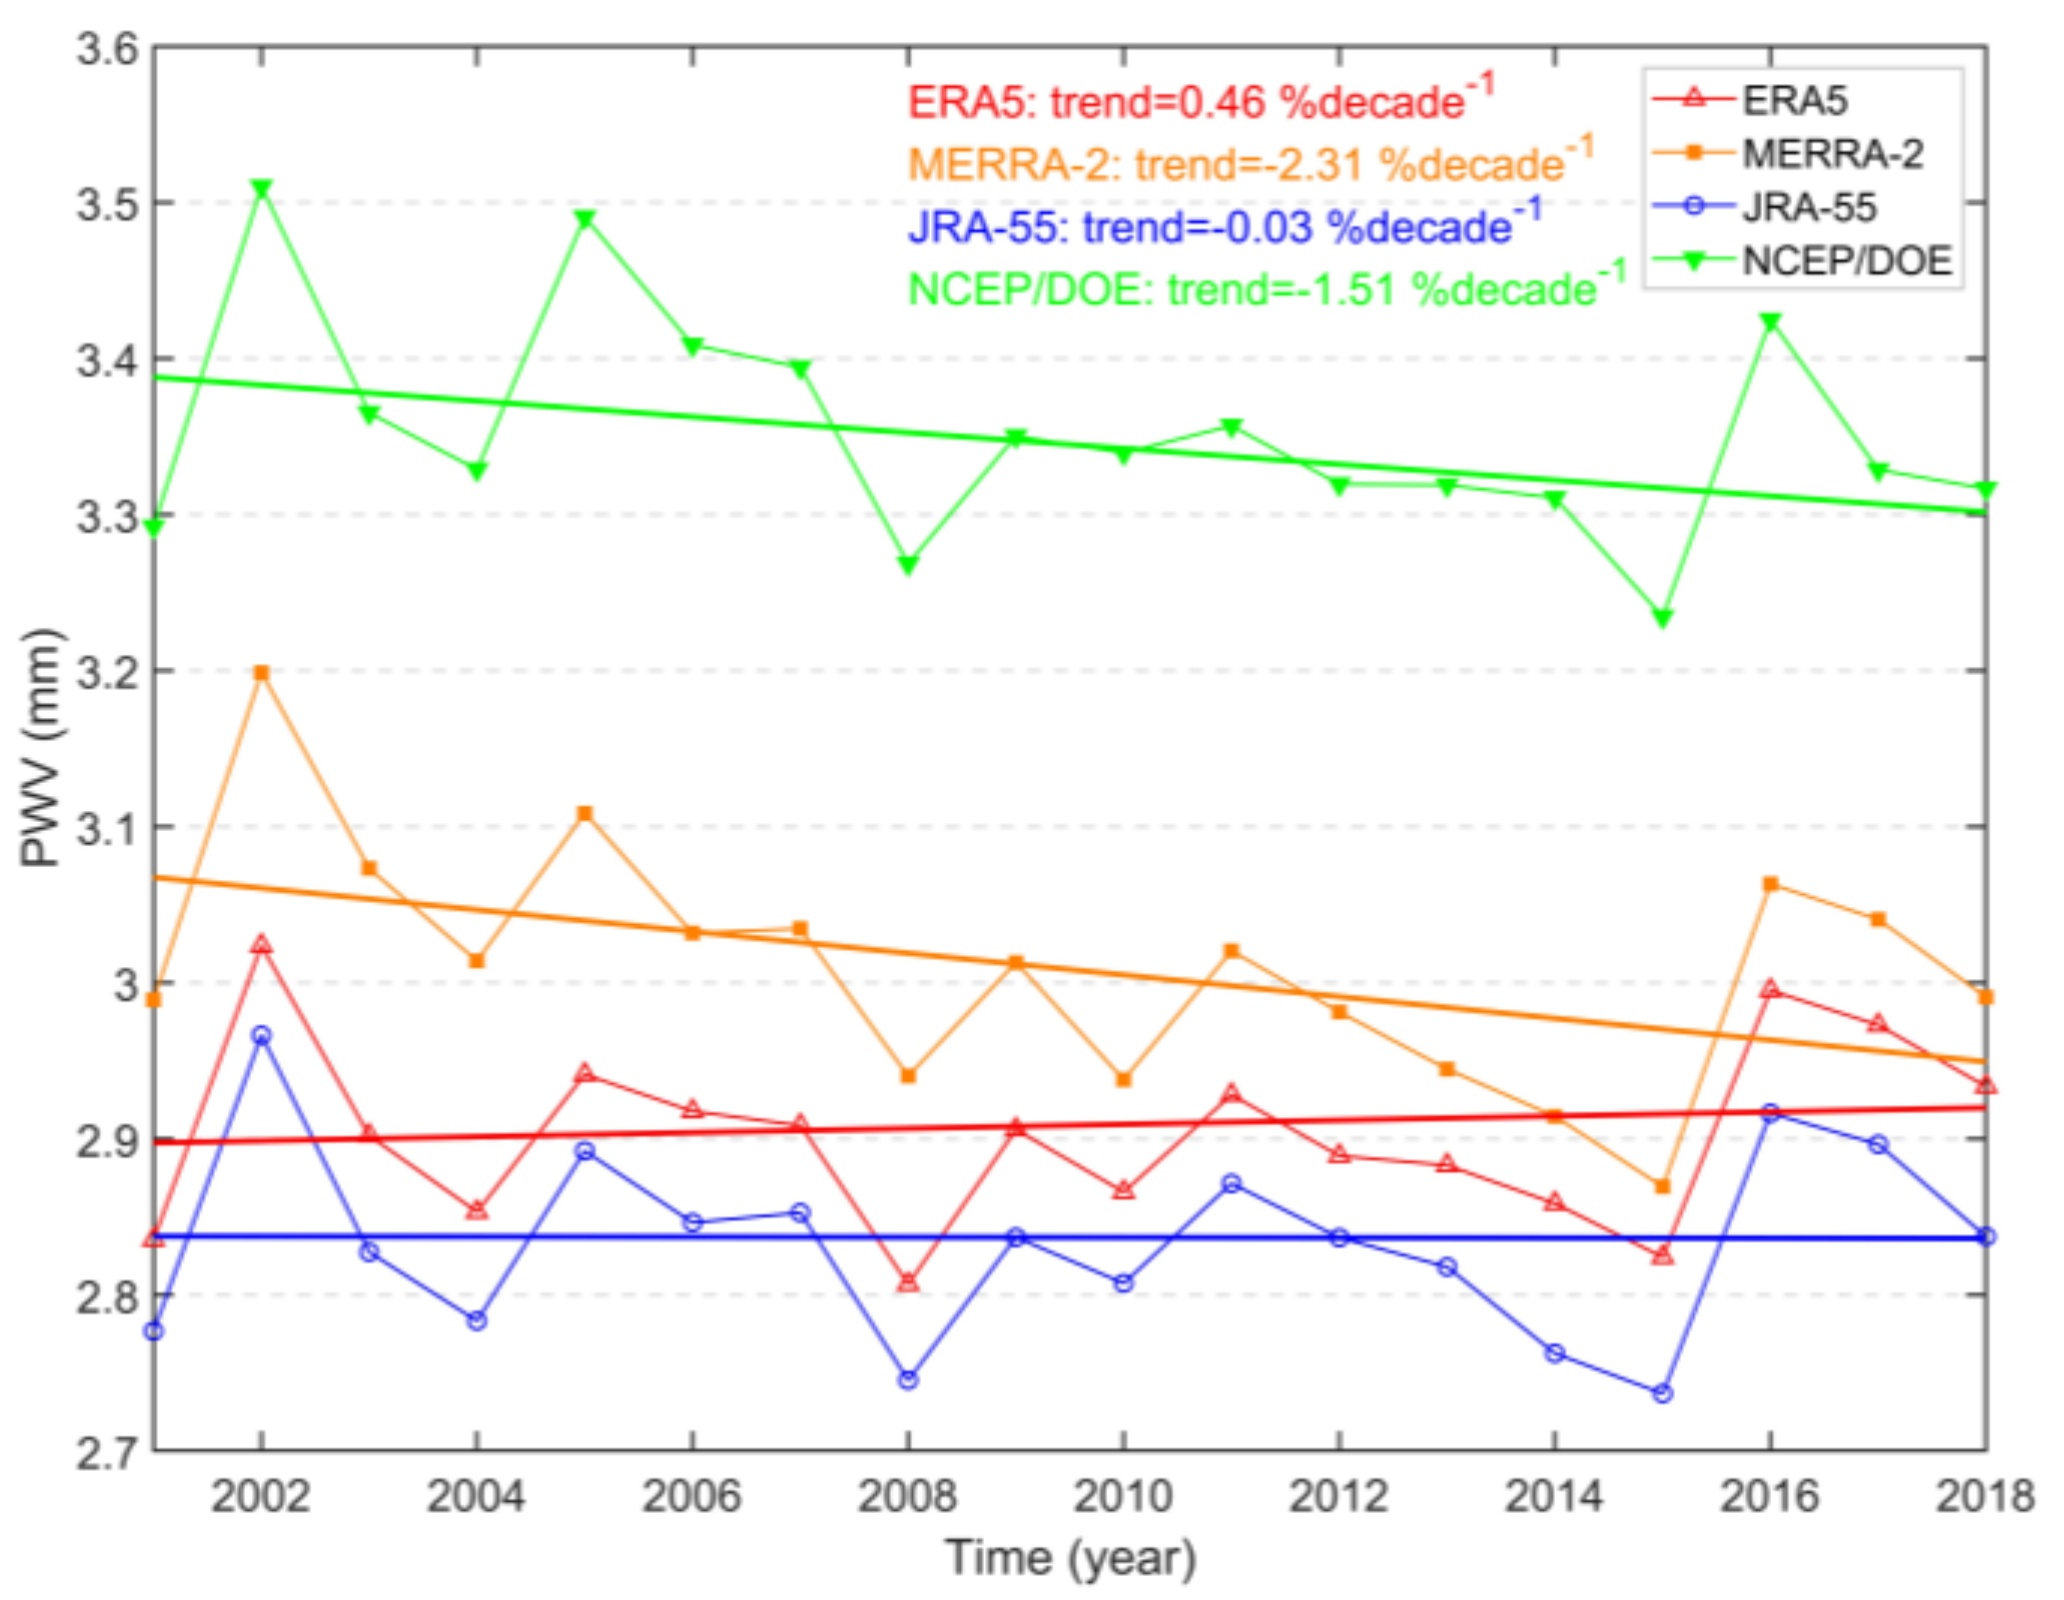
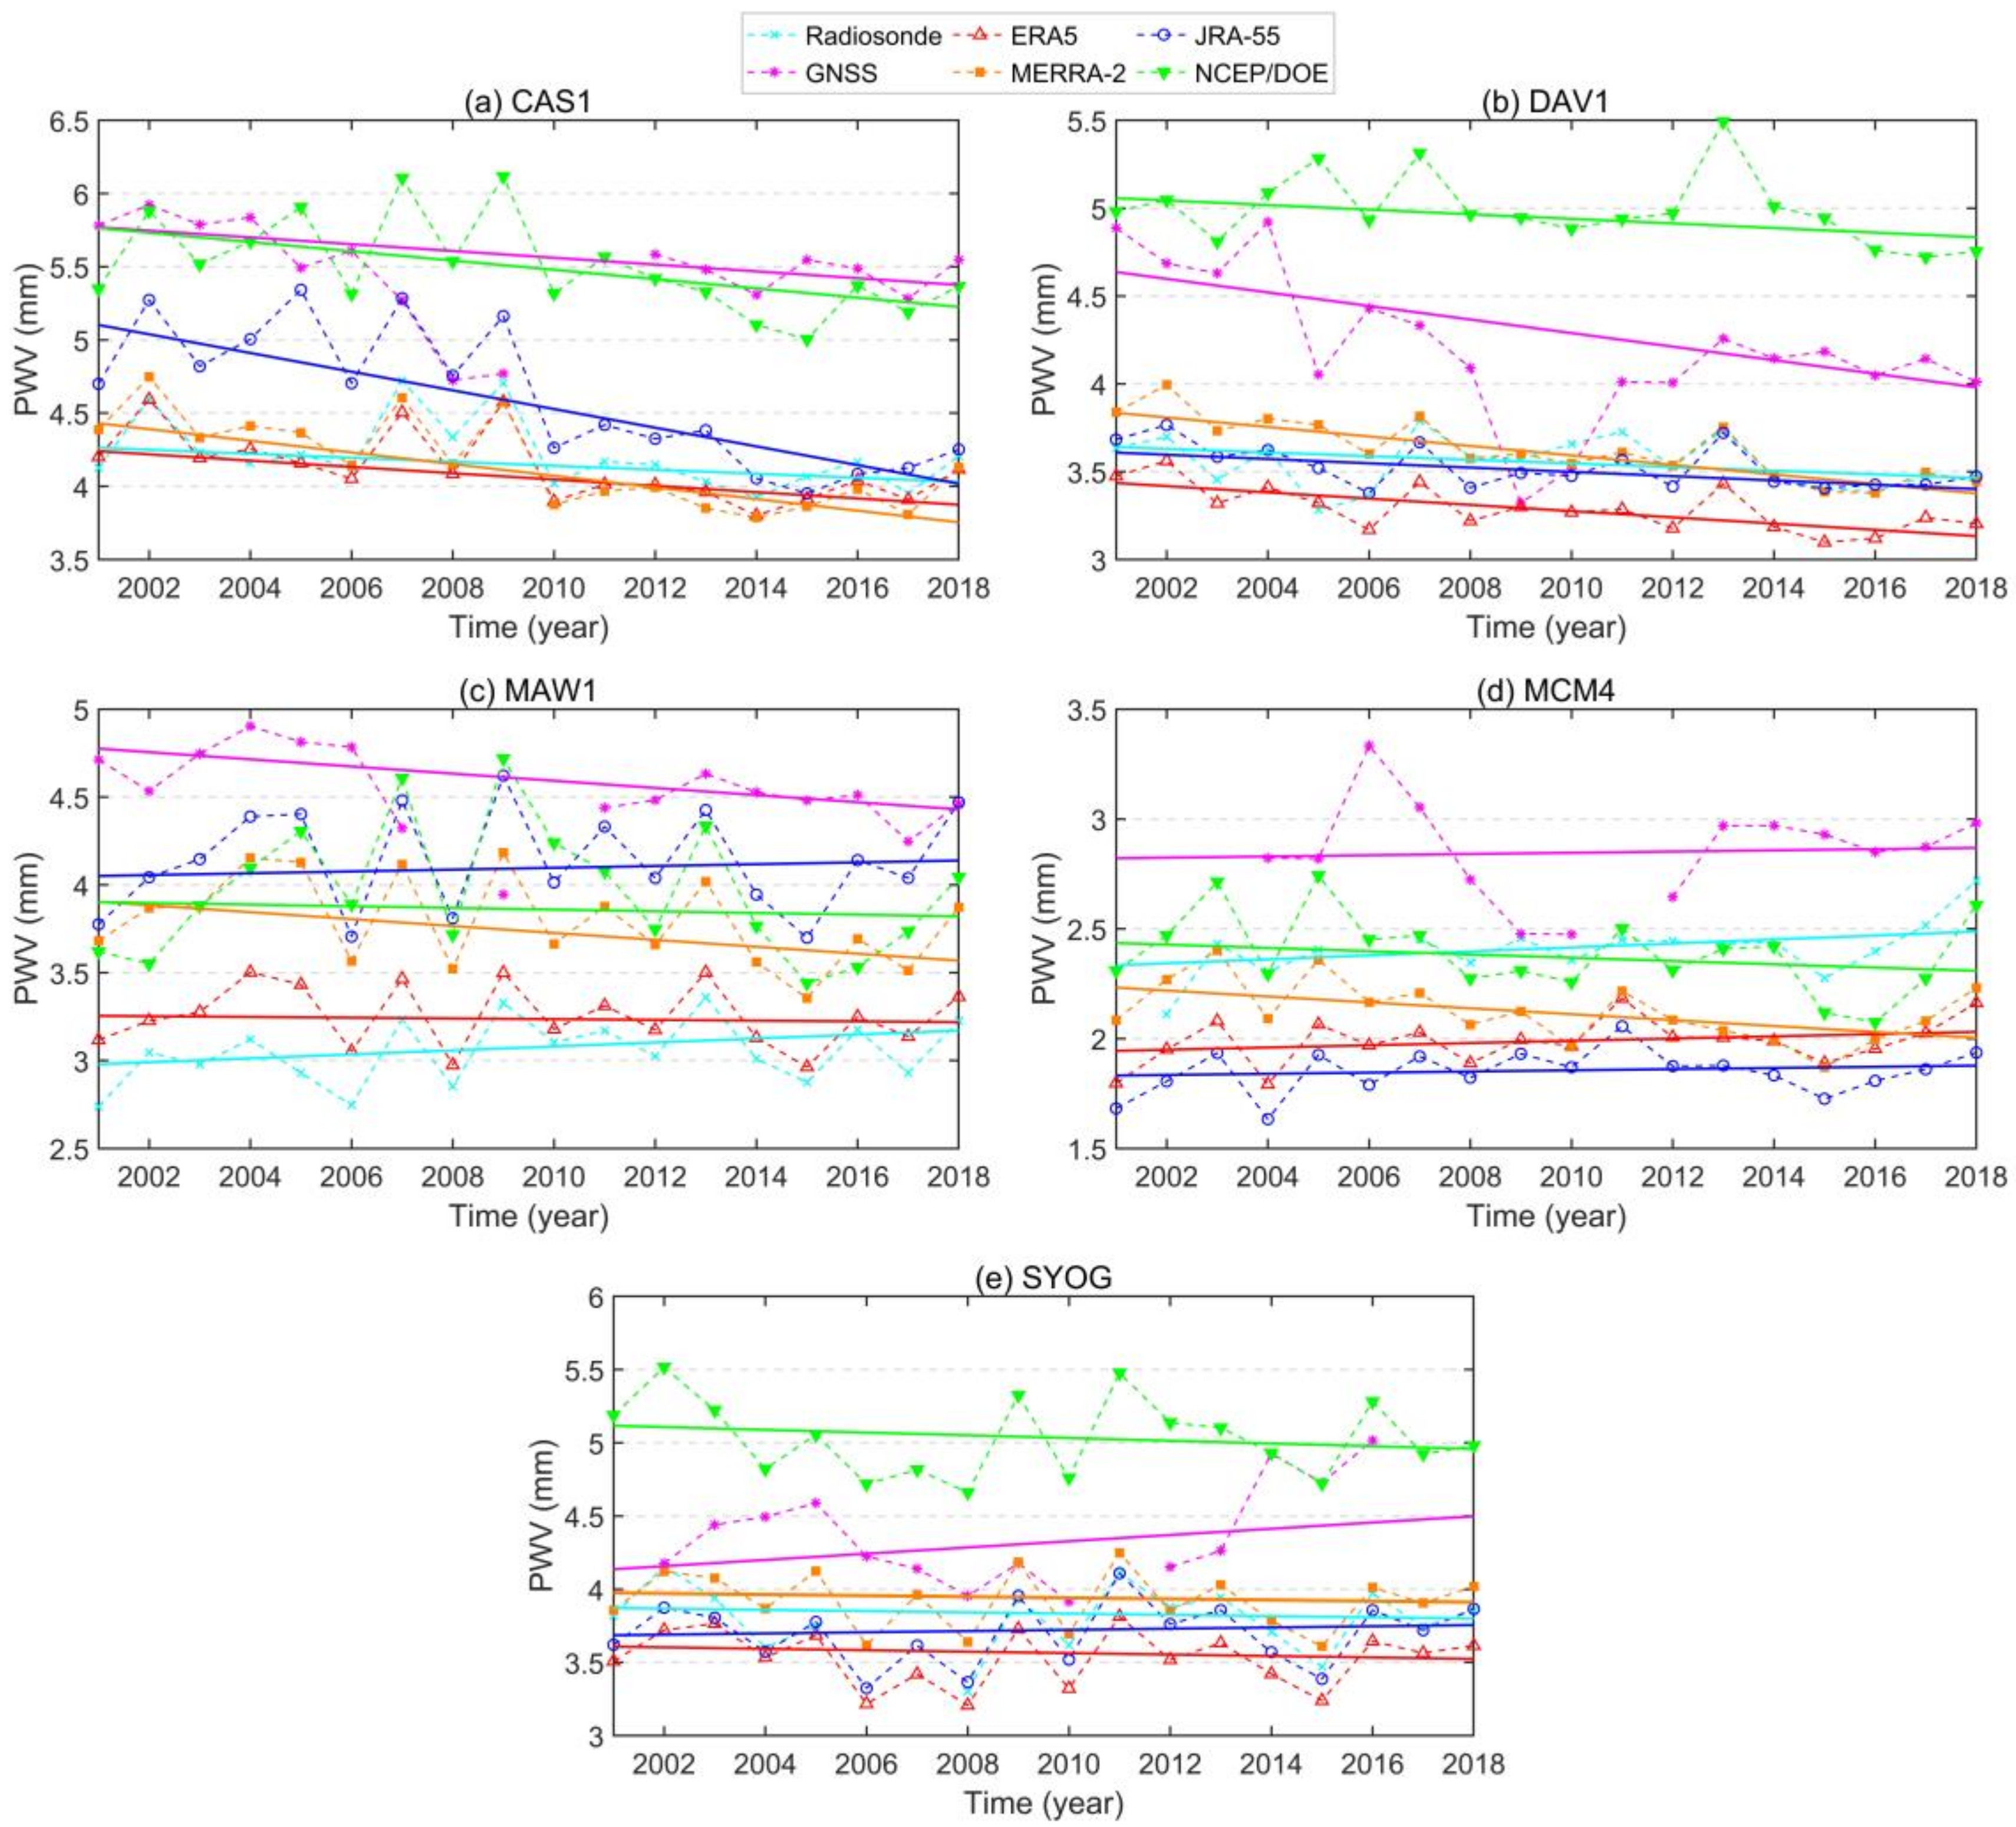
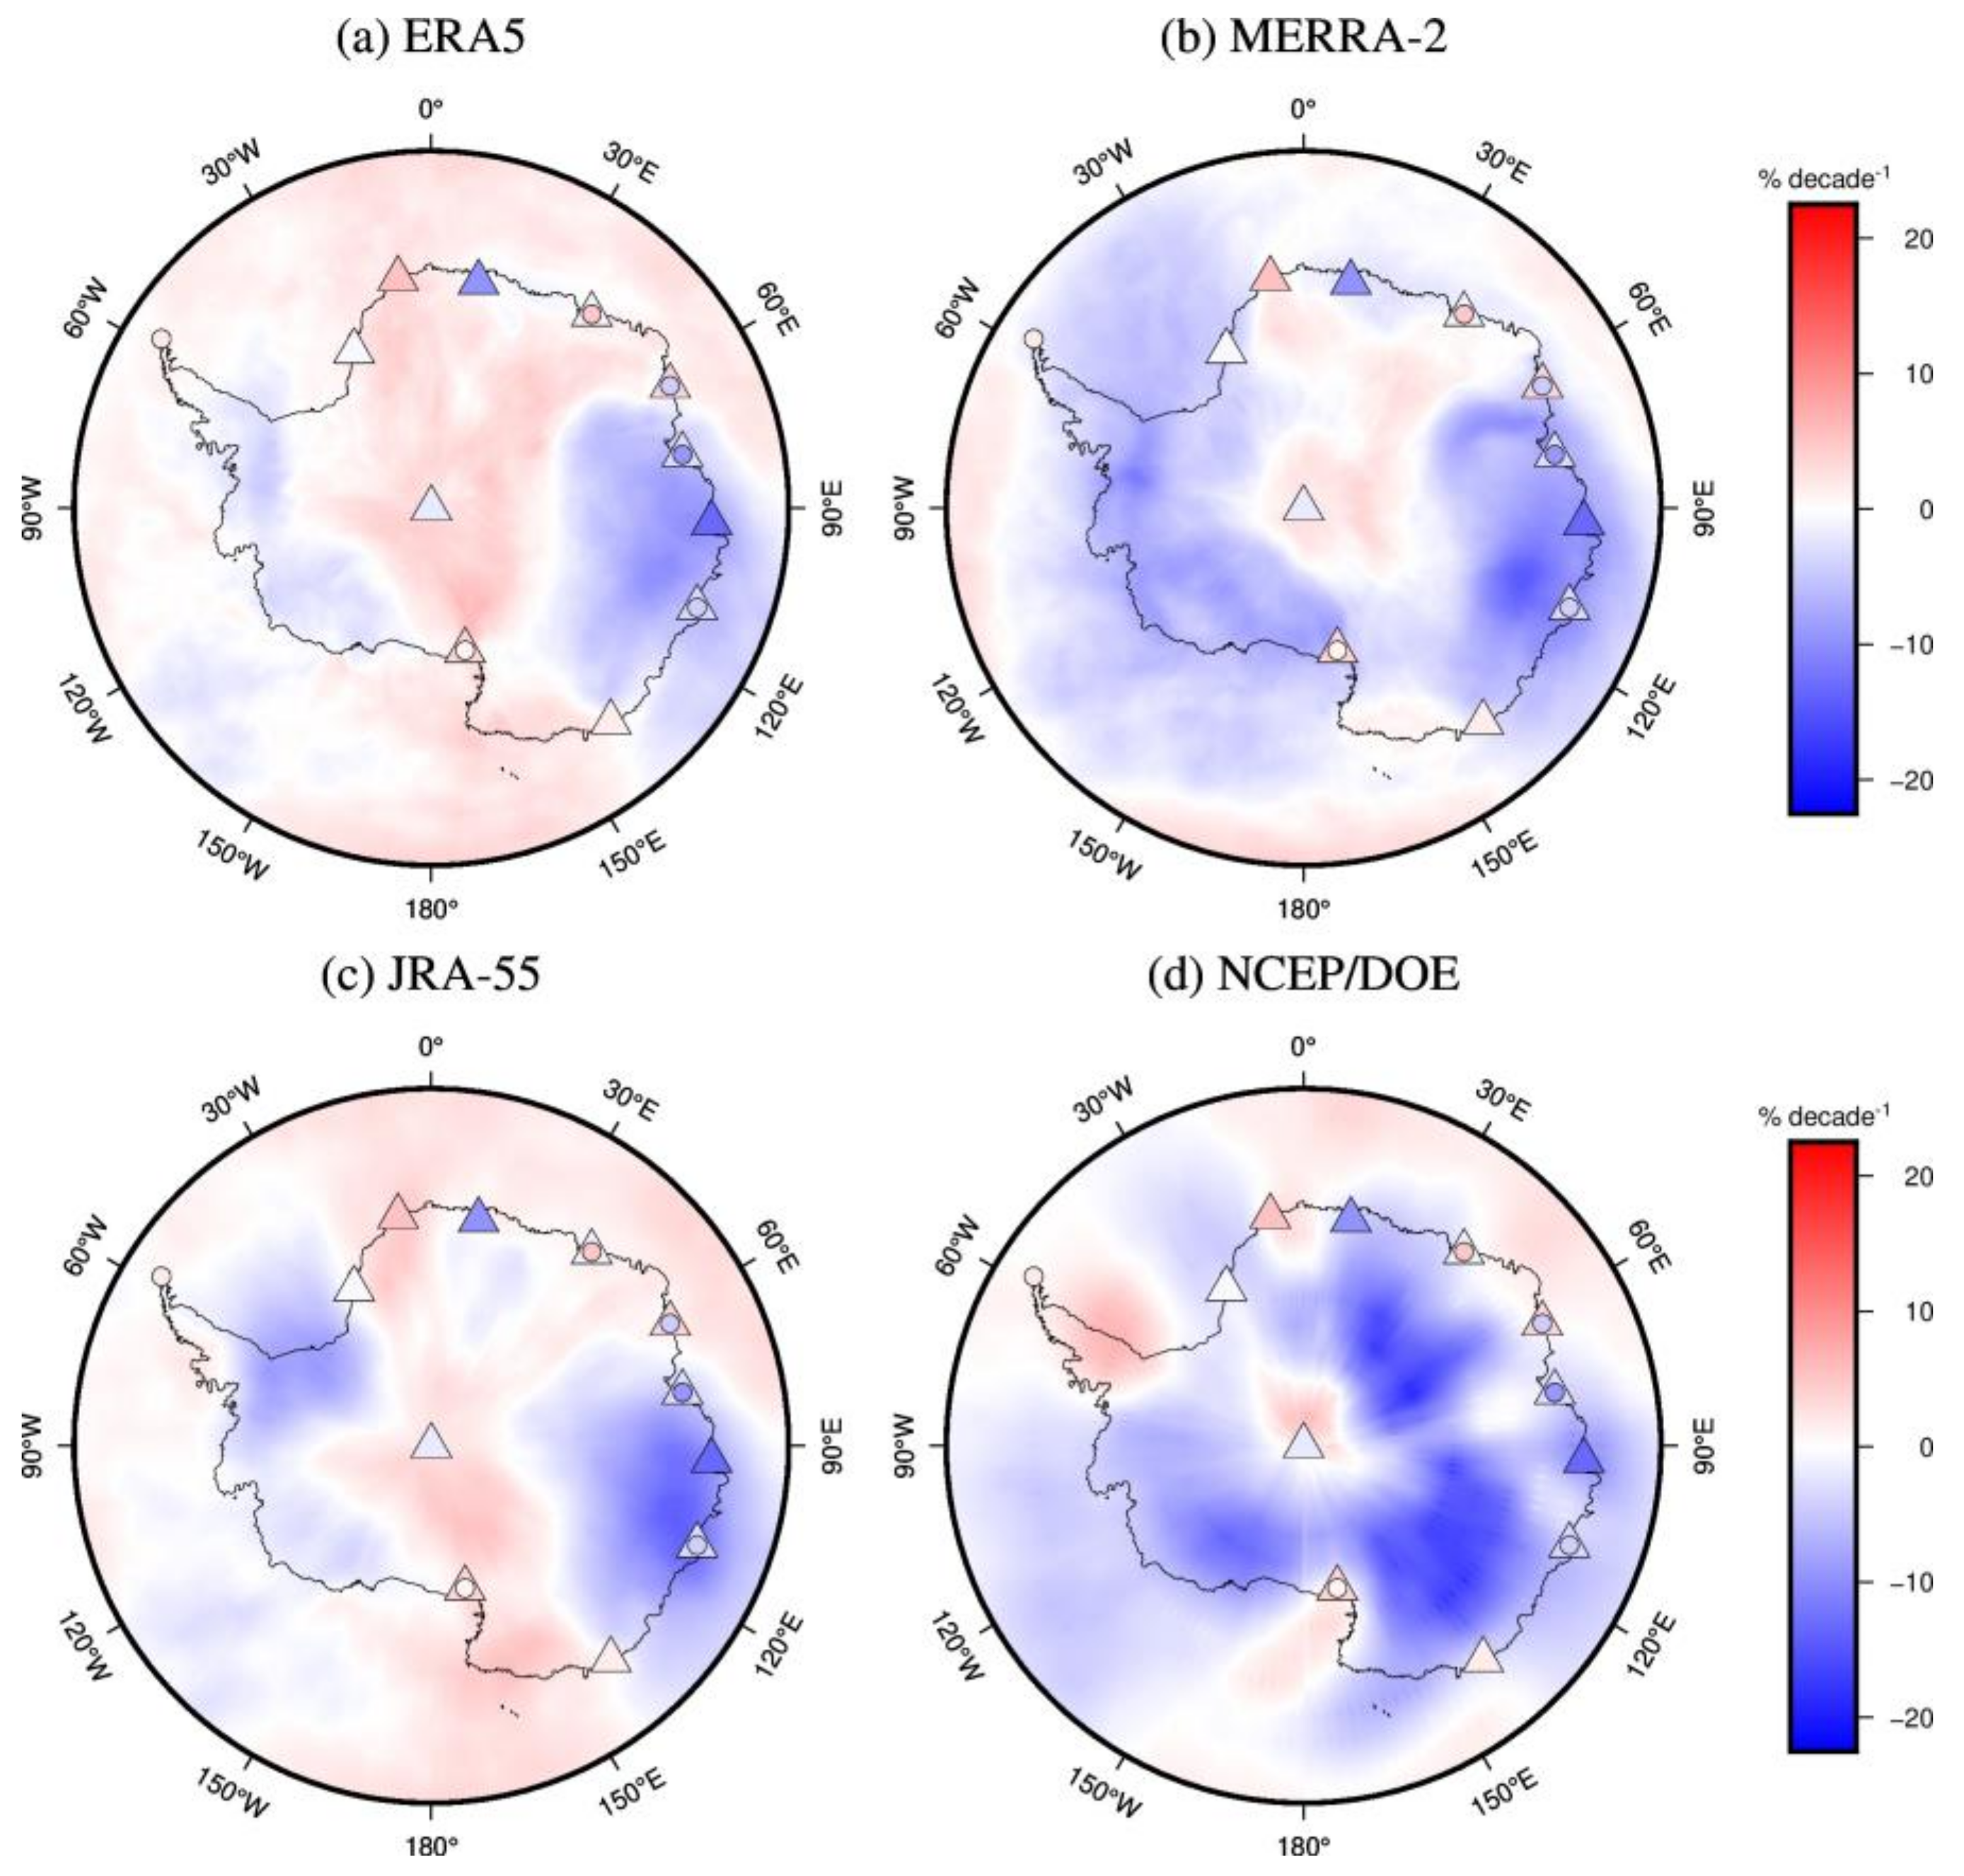
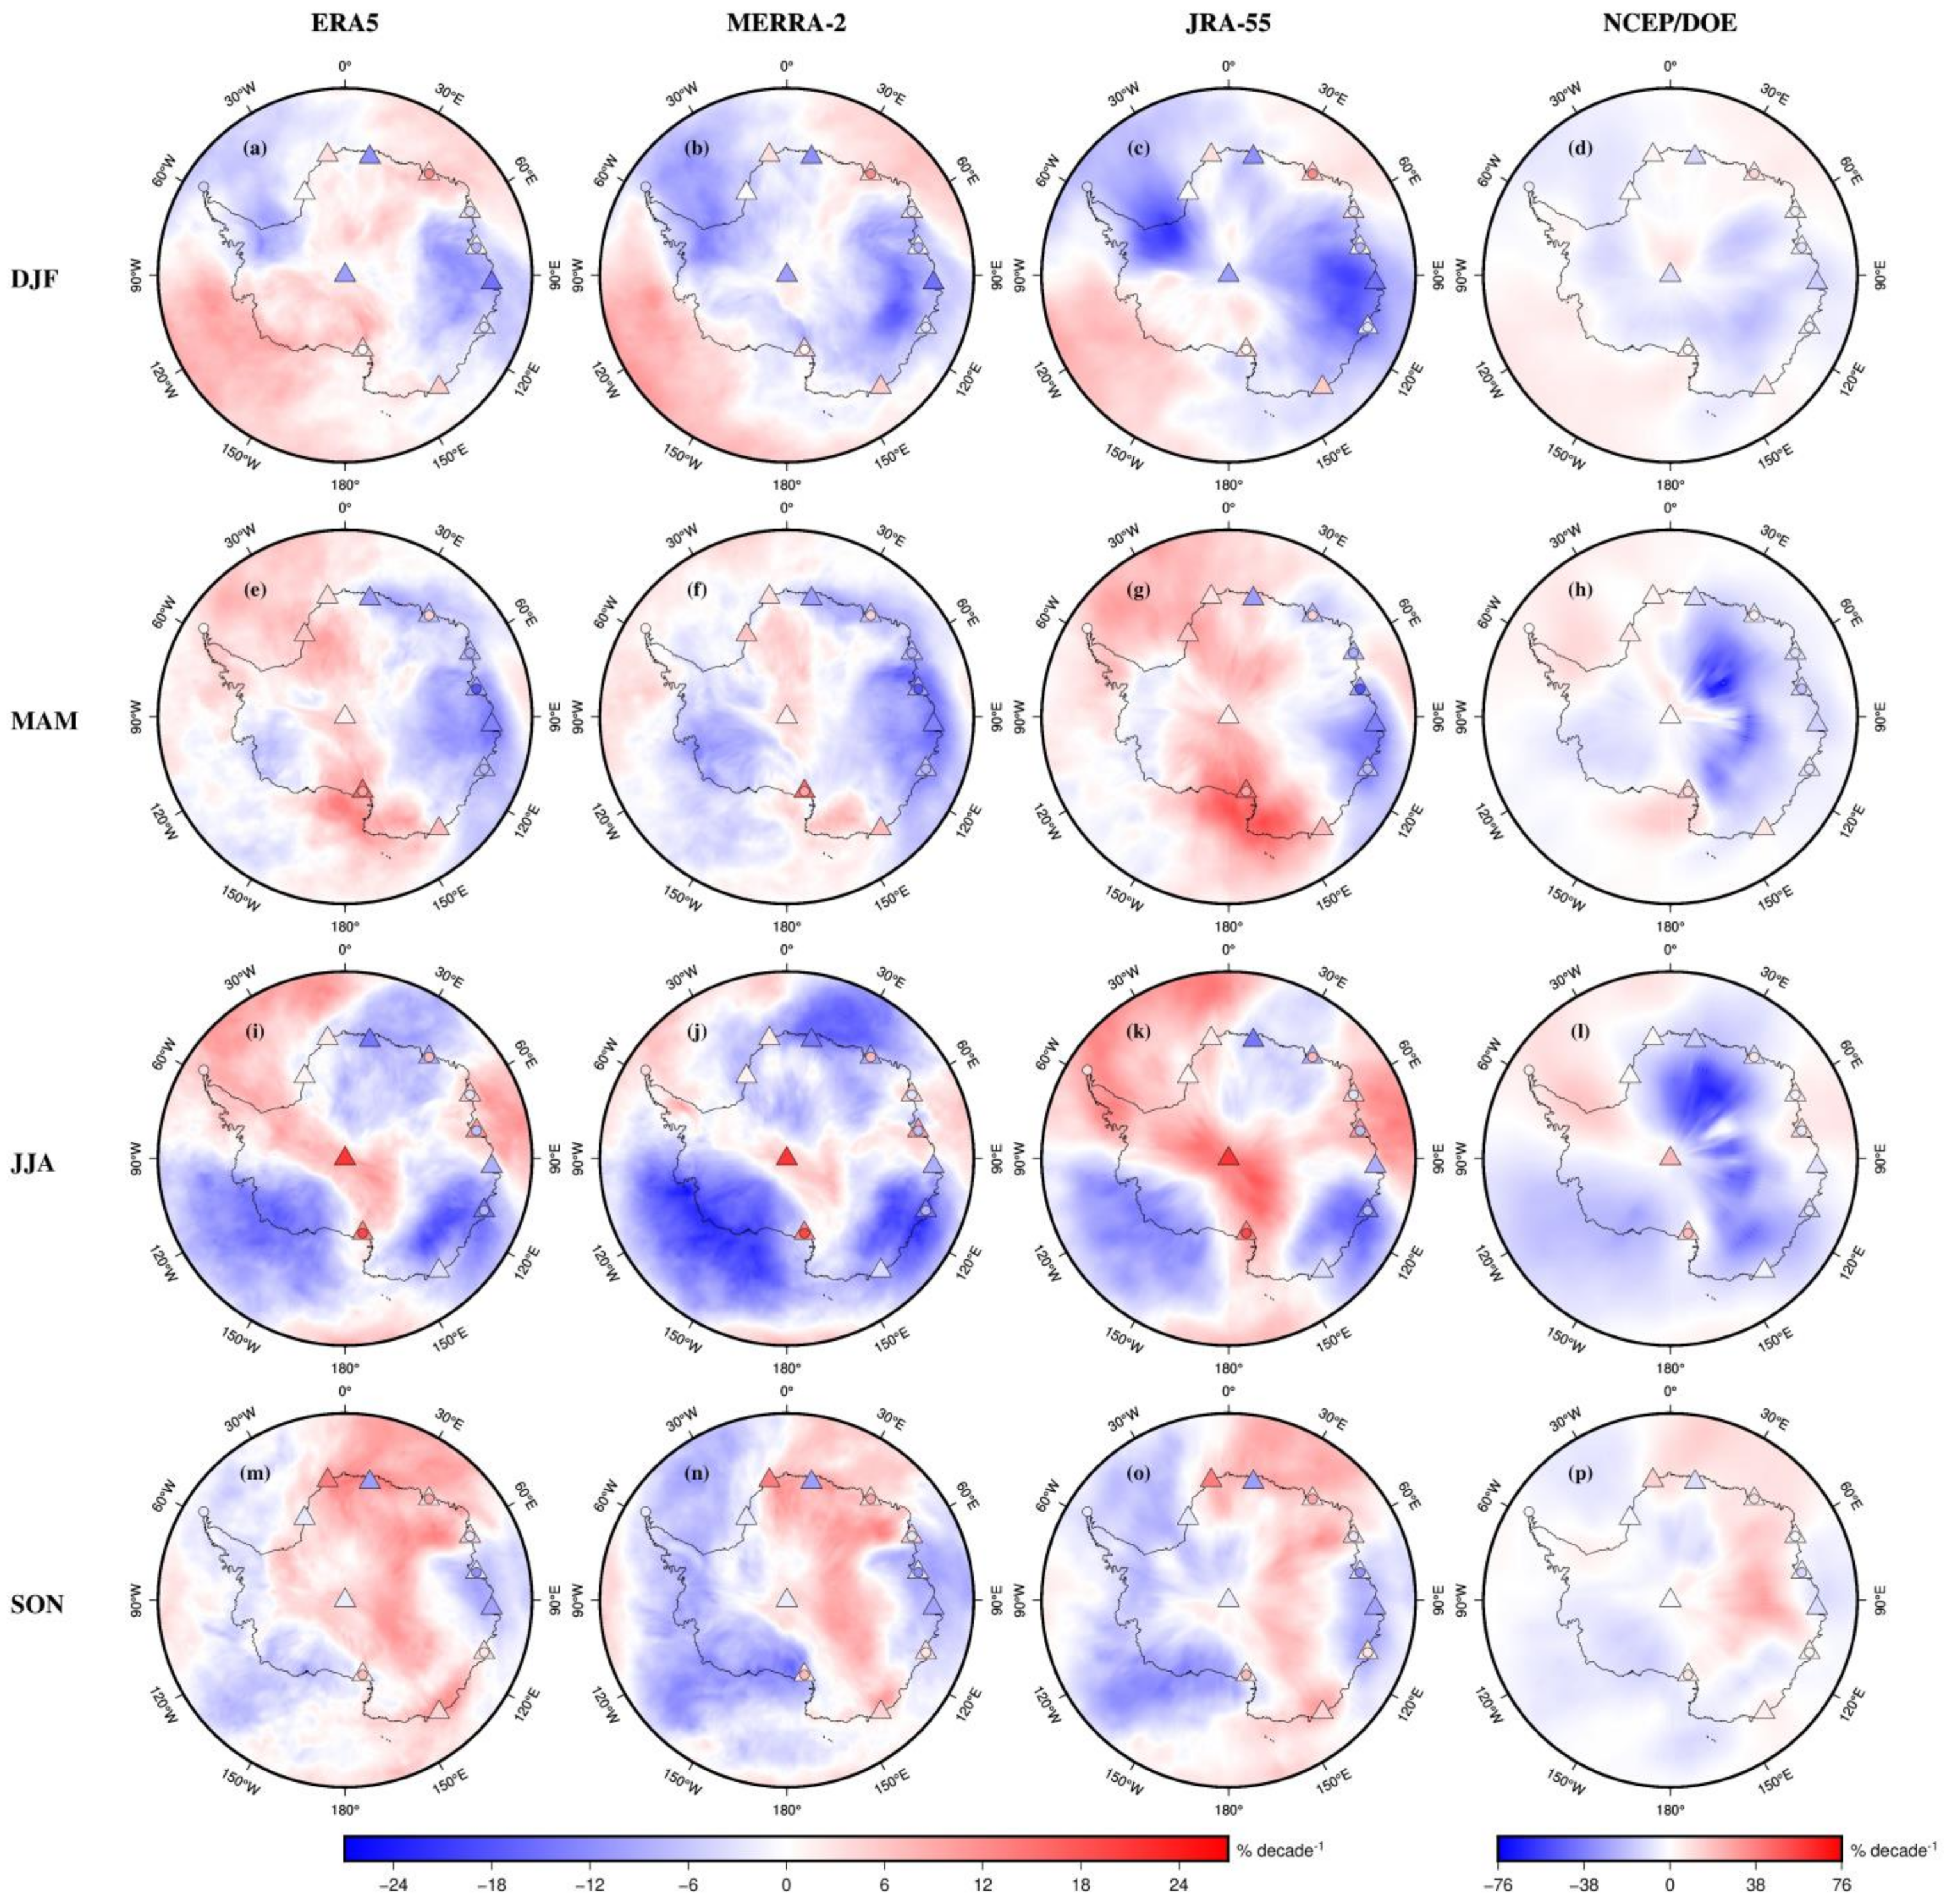
4.2. PWV Trends
5. Discussion and Conclusions
Author Contributions
Funding
Institutional Review Board Statement
Informed Consent Statement
Data Availability Statement
Acknowledgments
Conflicts of Interest
References
- Trenberth, K.E.; Fasullo, J.; Smith, L. Trends and variability in column-integrated atmospheric water vapor. Clim. Dyn. 2005, 24, 741–758. [Google Scholar] [CrossRef]
- Schneider, T.; O’Gorman, P.A.; Levine, X.J. Water vapor and the dynamics of climate changes. Rev. Geophys. 2010, 48, RG3001. [Google Scholar] [CrossRef] [Green Version]
- Held, I.M.; Soden, B.J. Robust responses of the hydrological cycle to global warming. J. Clim. 2006, 19, 5686–5699. [Google Scholar] [CrossRef]
- Allan, R.P.; Soden, B.J. Atmospheric warming and the amplification of precipitation extremes. Science 2008, 321, 1481–1484. [Google Scholar] [CrossRef] [PubMed] [Green Version]
- Connolley, W.M.; King, J.C. Atmospheric water vapor transport to Antarctica, inferred from radiosondes. Q. J. R. Meteorol. Soc. 1993, 119, 325–342. [Google Scholar] [CrossRef]
- King, M.D.; Kaufman, Y.J.; Menzel, W.P.; Tanré, D. Remote sensing of cloud, aerosol, and water vapor properties from the moderate resolution imaging spectrometer (MODIS). IEEE Trans. Geosci. Remote Sens. 1992, 30, 2–27. [Google Scholar] [CrossRef] [Green Version]
- Sharifi, M.A.; Azadi, M.; Khaniani, A.S. Numerical simulation of rainfall with assimilation of conventional and GPS observations over north of Iran. Ann. Geophys. 2016, 59, 0322. [Google Scholar]
- Rohm, W.; Guzikowski, J.; Wilgan, K.; Kryza, M. 4DVAR assimilation of GNSS zenith path delays and precipitable water into a numerical weather prediction model WRF. Atmos. Meas. Tech. 2019, 12, 345–361. [Google Scholar] [CrossRef] [Green Version]
- Xiong, Z.; Sang, J.; Sun, X.; Zhang, B.; Li, J. Comparisons of performance using data assimilation and data fusion approaches in acquiring precipitable water vapor: A case study of a Western United States of America area. Water 2020, 12, 2943. [Google Scholar] [CrossRef]
- Dai, A. Recent climatology, variability, and trends in global surface humidity. J. Clim. 2006, 19, 3589–3606. [Google Scholar] [CrossRef] [Green Version]
- Niell, A.E.; Coster, A.J.; Solheim, F.S.; Mendes, V.B.; Toor, P.C.; Langley, R.B.; Upham, C.A. Comparison of measurements of atmospheric wet delay by radiosonde, water vapor radiometer, GPS, and VLBI. J. Atmos. Ocean. Technol. 2001, 18, 830–850. [Google Scholar] [CrossRef] [Green Version]
- Gui, K.; Che, H.; Chen, Q.; Zeng, Z.; Liu, H.; Wang, Y.; Zheng, Y.; Sun, T.; Liao, T.; Wang, H.; et al. Evaluation of radiosonde, MODIS-NIR-Clear, and AERONET precipitable water vapor using IGS ground-based GPS measurements over China. Atmos. Res. 2017, 197, 461–473. [Google Scholar] [CrossRef]
- Zeng, Z.; Mao, F.; Wang, Z.; Guo, J.; Gui, K.; An, J.; YIM, S.H.L.; Yang, Y.; Zhang, B.; Hu, J. Preliminary evaluation of the atmospheric infrared sounder water vapor over China against high-resolution radiosonde measurements. J. Geophys. Res. Atmos. 2019, 124, 3871–3888. [Google Scholar] [CrossRef]
- Huang, L.; Peng, H.; Liu, L.; Xiong, S.; Xie, S.; Chen, J.; Li, J.; He, H. GNSS precipitable water vapor retrieval with the aid of NWM data for China. Earth Space Sci. 2021, 8, e2020EA001550. [Google Scholar] [CrossRef]
- Huang, L.; Mo, Z.; Xie, S.; Liu, L.; Chen, J.; Kang, C.; Wang, S. Spatiotemporal characteristics of GNSS-derived precipitable water vapor during heavy rainfall events in Guilin, China. Satell. Navig. 2021, 2, 13. [Google Scholar] [CrossRef]
- Zhang, B.; Teunissen, P.J.G.; Odijk, D. A novel un-differenced PPP-RTK concept. J. Navig. 2011, 64, S180–S191. [Google Scholar] [CrossRef] [Green Version]
- Zhang, B.; Chen, Y.; Yuan, Y. PPP-RTK based on undifferenced and uncombined observations: Theoretical and practical aspects. J. Geod. 2018, 93, 1011–1024. [Google Scholar] [CrossRef]
- Trenberth, K.E.; Smith, L. The mass of the atmosphere: A constraint on global analyses. J. Clim. 2005, 18, 864–875. [Google Scholar] [CrossRef]
- Dessler, A.E.; Davis, S.M. Trends in tropospheric humidity from reanalysis systems. J. Geophys. Res. 2010, 115, D19127. [Google Scholar] [CrossRef]
- Suparta, W.; Rashid, Z.A.A.; Ali, M.A.M.; Yatim, B.; Fraser, G.J. Observations of Antarctic precipitable water vapor and its response to the solar activity based on GPS sensing. J. Atmos. Sol.-Terr. Phys. 2008, 70, 1419–1447. [Google Scholar] [CrossRef]
- Suparta, W.; Ali, M.A.M.; Yatim, B.; Fraser, G.J. Analysis of GPS-sensed atmospheric water vapour variability and its response to the terrestrial winds over Antarctica. Phys. Chem. Earth Parts A/B/C 2009, 34, 72–87. [Google Scholar] [CrossRef]
- Suparta, W. Using a global positioning system to estimate precipitable water vapor in Antarctica. Polar Geo. 2010, 33, 63–79. [Google Scholar] [CrossRef]
- Chen, B.; Liu, Z. Global water vapor variability and trend from the latest 36 year (1979 to 2014) data of ECMWF and NCEP reanalyses, radiosonde, GPS, and microwave satellite. J. Geophys. Res. Atmos. 2016, 121, 11442–11462. [Google Scholar] [CrossRef]
- Parracho, A.C.; Bock, O.; Bastin, S. Global IWV trends and variability in atmospheric reanalyses and GPS observations. Atmos. Chem. Phys. 2018, 18, 16213–16237. [Google Scholar] [CrossRef] [Green Version]
- Ricaud, P.; Grigioni, P.; Roehrig, R.; Durand, P.; Veron, D.E. Trends in atmospheric humidity and temperature above Dome C, Antarctica evaluated from observations and reanalyses. Atmosphere 2020, 11, 836. [Google Scholar] [CrossRef]
- Wang, S.; Xu, T.; Nie, W.; Jiang, C.; Yang, Y.; Fang, Z.; Li, M.; Zhang, Z. Evaluation of precipitable water vapor from five reanalysis products with ground-based GNSS observations. Remote Sens. 2020, 12, 1817. [Google Scholar] [CrossRef]
- Zhao, Q.; Yang, P.; Yao, W.; Yao, Y. Hourly PWV dataset derived from GNSS observations in China. Sensors 2019, 20, 231. [Google Scholar] [CrossRef] [Green Version]
- Yuan, P.; Hunegnaw, A.; Alshawaf, F.; Awange, J.; Klos, A.; Teferle, F.N.; Kutterer, H. Feasibility of ERA5 integrated water vapor trends for climate change analysis in continental Europe: An evaluation with GPS (1994–2019) by considering statistical significance. Remote Sens. Environ. 2021, 260, 112416. [Google Scholar] [CrossRef]
- Molod, A.; Takacs, L.; Suarez, M.; Bacmeister, J. Development of the GEOS-5 atmospheric general circulation model: Evolution from MERRA to MERRA2. Geosci. Model Dev. 2015, 8, 1339–1356. [Google Scholar] [CrossRef] [Green Version]
- Kleist, D.T.; Parrish, D.F.; Derber, J.C.; Treadon, R.; Errico, R.M.; Yang, R. Improving incremental balance in the GSI 3DVAR analysis system. Mon. Weather Rev. 2009, 137, 1046–1060. [Google Scholar] [CrossRef]
- Wu, W.-S.; Purser, R.J.; Parrish, D.F. Three-dimensional variational analysis with spatially inhomogeneous covariances. Mon. Weather Rev. 2002, 130, 2905–2916. [Google Scholar] [CrossRef] [Green Version]
- Kobayashi, S.; Ota, Y.; Harada, Y.; Ebita, A.; Moriya, M.; Onoda, H.; Onogi, K.; Kamahori, H.; Kobayashi, C.; Endo, H. The JRA-55 reanalysis: General specifications and basic characteristics. J. Meteorol. Soc. Jpn. 2015, 93, 5–48. [Google Scholar] [CrossRef] [Green Version]
- Harada, Y.; Kamahori, H.; Kobayashi, C.; Endo, H.; Kobayashi, S.; Ota, Y.; Onoda, H.; Onogi, K.; Miyaoka, K.; Takahashi, K. The JRA-55 Reanalysis: Representation of atmospheric circulation and climate variability. J. Meteorol. Soc. Jpn. 2016, 94, 269–302. [Google Scholar] [CrossRef] [Green Version]
- Kanamitsu, M.; Ebisuzaki, W.; Woollen, J.; Yang, S.-K.; Hnilo, J.; Fiorino, M.; Potter, G. Ncep–doe amip-ii reanalysis (r-2). Bull. Am. Meteorol. Soc. 2002, 83, 1631–1644. [Google Scholar] [CrossRef]
- Gui, K.; Che, H.; Chen, Q.; Zeng, Z.; Zheng, Y.; Long, Q.; Sun, T.; Liu, X.; Wang, Y.; Liao, T.; et al. Water vapor variation and the effect of aerosols in China. Atmos. Environ. 2017, 165, 322–335. [Google Scholar] [CrossRef]
- Zhang, W.; Zhang, H.; Liang, H.; Lou, Y.; Cai, Y.; Cao, Y.; Zhou, Y.; Liu, W. On the suitability of ERA5 in hourly GPS precipitable water vapor retrieval over China. J. Geod. 2019, 93, 1897–1909. [Google Scholar] [CrossRef]
- Byun, S.; Bar-Sever, Y. A new type of troposphere zenith path delay product of the international GNSS service. J. Geod. 2009, 83, 367–373. [Google Scholar] [CrossRef] [Green Version]
- Huang, L.; Liu, L.; Chen, H.; Jiang, W. An improved atmospheric weighted mean temperature model and its impact on GNSS precipitable water vapor estimates for China. GPS Solut. 2019, 23, 51. [Google Scholar] [CrossRef]
- Guo, L.; Huang, L.; Li, J.; Liu, L.; Huang, L.; Fu, B.; Xie, S.; He, H.; Ren, C. A comprehensive evaluation of key tropospheric parameters from ERA5 and MERRA-2 reanalysis products using radiosonde data and GNSS measurements. Remote Sens. 2021, 13, 3008. [Google Scholar] [CrossRef]
- Bock, O.; Bosser, P.; Pacione, R.; Nuret, M.; Fourrié, N.; Parracho, A. A high-quality reprocessed ground-based GPS dataset for atmospheric process studies, radiosonde and model evaluation, and reanalysis of HyMeX Special Observing Period. Q. J. R. Meteorol. Soc. 2016, 142, 56–71. [Google Scholar] [CrossRef]
- Askne, J.; Nordius, H. Estimation of tropospheric delay for microwaves from surface weather data. Radio Sci. 1987, 22, 379–386. [Google Scholar] [CrossRef]
- Bevis, M.; Businger, S.; Chiswell, S.; Herring, T.A.; Anthes, R.A.; Rocken, C.; Ware, R.H. GPS Meteorology: Mapping zenith wet delays onto precipitable water. J. Appl. Meteorol. 1994, 33, 379–386. [Google Scholar] [CrossRef]
- Saastamoinen, J. Atmospheric correction for the troposphere and stratosphere in radio ranging satellites. Use Artif. Satell. Geod. 1972, 15, 247–251. [Google Scholar]
- Huang, L.; Jiang, W.; Liu, L.; Chen, H.; Ye, S. A new global grid model for the determination of atmospheric weighted mean temperature in GPS precipitable water vapor. J. Geod. 2019, 93, 159–176. [Google Scholar] [CrossRef]
- Böhm, J.; Moller, G.; Schindelegger, M.; Pain, G.; Weber, R. Development of an improved empirical model for slant delays in the troposphere (GPT2w). GPS Solut. 2015, 19, 433–441. [Google Scholar] [CrossRef] [Green Version]
- Feng, P.; Li, F.; Yan, J.; Zhang, F.; Barriot, J.-P. Assessment of the accuracy of the Saastamoinen model and VMF1/VMF3 mapping functions with respect to ray-tracing from radiosonde data in the framework of GNSS meteorology. Remote Sens. 2020, 12, 3337. [Google Scholar] [CrossRef]
- Wang, X.; Zhang, K.; Wu, S.; Fan, S.; Cheng, Y. Water vapor-weighted mean temperature and its impact on the determination of precipitable water vapor and its linear trend. J. Geophys. Res. Atmos. 2016, 121, 833–852. [Google Scholar] [CrossRef]
- Böehm, J.; Heinkelmann, R.; Schuh, H. Short note: A global model of pressure and temperature for geodetic applications. J. Geod. 2007, 81, 679–683. [Google Scholar] [CrossRef]
- Leckner, B. The spectral distribution of solar radiation at the earth’s surface—Elements of a model. Sol. Energy 1978, 20, 143–150. [Google Scholar] [CrossRef]
- KOUBA, J. Implementation and testing of the gridded Vienna Mapping Function 1 (VMF1). J. Geod. 2008, 82, 193–205. [Google Scholar] [CrossRef]
- Huang, L.; Mo, Z.; Liu, L.; Zeng, Z.; Chen, J.; Xiong, S.; He, H. Evaluation of hourly PWV products derived from ERA5 and MERRA-2 over the Tibetan Plateau using ground-based GNSS observations by two enhanced models. Earth Space Sci. 2021, 8, e2020EA001516. [Google Scholar] [CrossRef]
- Sen, P.K. Estimates of the regression coefficient based on Kendall’s tau. J. Am. Stat. Assoc. 1968, 63, 1379–1389. [Google Scholar] [CrossRef]
- Zhang, W.; Lou, Y.; Huang, J.; Zheng, F.; Cao, Y.; Liang, H.; Shi, C.; Liu, J. Multiscale variations of precipitable water over China based on 1999–2015 ground-based GPS observations and evaluations of reanalysis products. J. Clim. 2018, 31, 945–962. [Google Scholar] [CrossRef]
- Zhai, P.; Eskridge, R.E. Atmospheric water vapor over China. J. Clim. 1997, 10, 2643–2652. [Google Scholar] [CrossRef]
- Hamed, K.H.; Rao, A.R. A modified Mann-Kendall trend test for autocorrelated data. J. Hydrol. 1998, 204, 182–196. [Google Scholar] [CrossRef]
- Vázquez B, G.E.; Grejner-Brzezinska, D.A. GPS-PWV estimation and validation with radiosonde data and numerical weather prediction model in Antarctica. GPS Solut. 2013, 17, 29–39. [Google Scholar] [CrossRef]
- Zhang, W.; Lou, Y.; Haase, J.S.; Zhang, R.; Zheng, G.; Huang, J.; Shi, C.; Liu, J. The use of ground-based GPS precipitable water measurements over China to assess radiosonde and ERA-Interim moisture trends and errors from 1999 to 2015. J. Clim. 2017, 30, 7643–7667. [Google Scholar] [CrossRef]
- Jiang, P.; Ye, S.; Chen, D.; Liu, Y.; Xia, P. Retrieving precipitable water vapor data using GPS zenith delays and global reanalysis data in China. Remote Sens. 2016, 8, 389. [Google Scholar] [CrossRef] [Green Version]
- Thomas, I.D.; King, M.A.; Clarke, P.J.; Penna, N.T. Precipitable water vapor estimates from homogeneously reprocessed GPS data: An intertechnique comparison in Antarctica. J. Geophys. Res. 2011, 116, D04107. [Google Scholar] [CrossRef] [Green Version]
- Lloyd, A.J.; Wiens, D.A.; Nyblade, A.A.; Anandakrishnan, S.; Aster, R.C.; Huerta, A.D.; Wilson, T.J.; Dalziel, I.W.D.; Shore, P.J.; Zhao, D. A seismic transect across West Antarctica: Evidence for mantle thermal anomalies beneath the Bentley Subglacial Trench and the Marie Byrd Land Dome. J. Geophys. Res. Solid Earth 2015, 120, 8439–8460. [Google Scholar] [CrossRef]
- Bock, O.; Willis, P.; Wang, J.; Mears, C. A highquality, homogenized, global, long-term (1993–2008) DORIS precipitable water data set for climate monitoring and model verification. J. Geophys. Res. Atmos. 2014, 119, 7209–7230. [Google Scholar] [CrossRef]
- Ning, T.; Wickert, J.; Deng, Z.; Heise, S.; Dick, G.; Vey, S.; Schöne, T. Homogenized time series of the atmospheric water vapour content obtained from the GNSS reprocessed data. J. Clim. 2016, 29, 2443–2456. [Google Scholar] [CrossRef]


| Reanalysis | Horizontal Resolution (Lon. × Lat.) | Temporal Resolution | Assimilation System | Source |
|---|---|---|---|---|
| ERA5 | 0.25° × 0.25° | 1 h | 4D-VAR | ECMWF |
| MERRA-2 | 0.625° × 0.5° | 1 h | 3D-VAR | NASA GES DISC |
| JRA-55 | 1.25° × 1.25° | 6 h | 4D-VAR | JMA/CRIEPI |
| NCEP/DOE | 2.5° × 2.5° | 6 h | 3D-VAR | NCEP/DOE |
| Site | Bias (mm) | RMS (mm) | R |
|---|---|---|---|
| CAS1 | 1.18 | 1.35 | 0.945 |
| DAV1 | 0.72 | 0.94 | 0.945 |
| MAW1 | 1.54 | 1.68 | 0.923 |
| MCM4 | 0.73 | 0.97 | 0.93 |
| SYOG | 0.73 | 1 | 0.933 |
| Comparison | Bias (mm) | RMS (mm) | Relative RMS | R | |
|---|---|---|---|---|---|
| Radiosonde versus | ERA5 | −0.1 | 0.5 | 15.45% | 0.97 |
| MERRA-2 | 0.14 | 0.65 | 20.56% | 0.95 | |
| JRA-55 | 0.09 | 0.85 | 26.54% | 0.91 | |
| NCEP/DOE | 0.69 | 1.11 | 34.88% | 0.95 | |
| GNSS versus | ERA5 | −0.88 | 1.2 | 26% | 0.96 |
| MERRA-2 | −0.52 | 1.15 | 25.08% | 0.94 | |
| JRA-55 | −0.66 | 1.34 | 28.83% | 0.92 | |
| NCEP/DOE | 0.09 | 1.59 | 35.31% | 0.88 | |
| Comparison | Differences | Seasons | ERA5 | MERRA-2 | JRA-55 | NCEP/DOE |
|---|---|---|---|---|---|---|
| Radiosonde | PWV mean (mm) | DJF | 0.32 | 0.35 | 0.43 | 1.35 |
| MAM | 0.21 | 0.16 | 0.22 | 0.79 | ||
| JJA | 0.13 | 0.10 | 0.18 | 0.62 | ||
| SON | 0.24 | 0.22 | 0.25 | 0.69 | ||
| Average | 0.22 | 0.21 | 0.27 | 0.86 | ||
| PWV relative variability (%) | DJF | 3.10 | 3.53 | 3.49 | 3.89 | |
| MAM | 1.80 | 1.84 | 1.90 | 2.43 | ||
| JJA | 1.94 | 1.76 | 2.43 | 2.30 | ||
| SON | 2.27 | 2.44 | 2.14 | 3.01 | ||
| Average | 2.28 | 2.39 | 2.49 | 2.91 | ||
| GNSS | PWV mean (mm) | DJF | 0.98 | 0.57 | 0.73 | 0.59 |
| MAM | 1.13 | 0.78 | 0.88 | 0.50 | ||
| JJA | 1.01 | 0.78 | 0.93 | 0.39 | ||
| SON | 1.15 | 0.89 | 1.09 | 0.48 | ||
| Average | 1.07 | 0.75 | 0.91 | 0.49 | ||
| PWV relative variability (%) | DJF | 1.27 | 1.17 | 1.67 | 1.07 | |
| MAM | 1.79 | 2.26 | 3.02 | 3.51 | ||
| JJA | 3.56 | 4.16 | 3.95 | 4.37 | ||
| SON | 2.56 | 2.17 | 3.22 | 3.15 | ||
| Average | 2.30 | 2.44 | 2.97 | 3.03 |
| Date | Sites | ||||
|---|---|---|---|---|---|
| CAS1 | DAV1 | MAW1 | MCM4 | SYOG | |
| Radiosonde | −3.24 | −2.92 | 3.70 | 3.75 | −1.12 |
| GNSS | −4.25 | −9.78 | −4.49 | 0.98 | 4.87 |
| ERA5 | −5.21 | −5.40 | −0.65 | 2.56 | −1.40 |
| MERRA-2 | −9.55 | −7.44 | −5.19 | −6.33 | −0.96 |
| JRA-55 | −13.85 | −3.46 | 1.25 | 1.43 | 1.10 |
| NCEP/DOE | −5.76 | −2.62 | −1.20 | −3.12 | −1.86 |
| Comparison | Seasons | ERA5 | MERRA-2 | JRA-55 | NCEP/DOE |
|---|---|---|---|---|---|
| Radiosonde | DJF | 2.63 | 3.05 | 3.09 | 3.43 |
| MAM | 1.54 | 1.61 | 1.79 | 2.36 | |
| JJA | 1.69 | 1.53 | 2.23 | 2.23 | |
| SON | 1.91 | 2.06 | 1.88 | 2.76 | |
| Average | 1.94 | 2.06 | 2.25 | 2.69 | |
| GNSS | DJF | 3.44 | 3.49 | 4.11 | 4.27 |
| MAM | 4.11 | 5.48 | 6.46 | 5.88 | |
| JJA | 8.31 | 8.49 | 9.11 | 9.59 | |
| SON | 2.85 | 5.42 | 5.82 | 4.93 | |
| Average | 4.68 | 5.48 | 6.37 | 6.17 |
Publisher’s Note: MDPI stays neutral with regard to jurisdictional claims in published maps and institutional affiliations. |
© 2021 by the authors. Licensee MDPI, Basel, Switzerland. This article is an open access article distributed under the terms and conditions of the Creative Commons Attribution (CC BY) license (https://creativecommons.org/licenses/by/4.0/).
Share and Cite
Mo, Z.; Zeng, Z.; Huang, L.; Liu, L.; Huang, L.; Zhou, L.; Ren, C.; He, H. Investigation of Antarctic Precipitable Water Vapor Variability and Trend from 18 Year (2001 to 2018) Data of Four Reanalyses Based on Radiosonde and GNSS Observations. Remote Sens. 2021, 13, 3901. https://0-doi-org.brum.beds.ac.uk/10.3390/rs13193901
Mo Z, Zeng Z, Huang L, Liu L, Huang L, Zhou L, Ren C, He H. Investigation of Antarctic Precipitable Water Vapor Variability and Trend from 18 Year (2001 to 2018) Data of Four Reanalyses Based on Radiosonde and GNSS Observations. Remote Sensing. 2021; 13(19):3901. https://0-doi-org.brum.beds.ac.uk/10.3390/rs13193901
Chicago/Turabian StyleMo, Zhixiang, Zhaoliang Zeng, Liangke Huang, Lilong Liu, Ling Huang, Lv Zhou, Chao Ren, and Hongchang He. 2021. "Investigation of Antarctic Precipitable Water Vapor Variability and Trend from 18 Year (2001 to 2018) Data of Four Reanalyses Based on Radiosonde and GNSS Observations" Remote Sensing 13, no. 19: 3901. https://0-doi-org.brum.beds.ac.uk/10.3390/rs13193901