Article

Contribution of Biophysical Factors to Regional Variations of Evapotranspiration and Seasonal Cooling Effects in Paddy Rice in South Korea

1
Department of Ecology and Environmental Sciences, School of Life Sciences, State Key Laboratory of Grassland Agroecosystems, Lanzhou University, Lanzhou 730000, China
2
Korea Aerospace Research Institute, Daejeon 305806, Korea
3
Department of Applied Plant Science, Chonnam National University, Gwangju 500757, Korea
*
Author to whom correspondence should be addressed.
Remote Sens. 2021, 13(19), 3992; https://0-doi-org.brum.beds.ac.uk/10.3390/rs13193992
Submission received: 25 August 2021 / Revised: 21 September 2021 / Accepted: 27 September 2021 / Published: 6 October 2021

Abstract

:
Previous studies have observed seasonal cooling effects in paddy rice as compared to temperate forest through enhanced evapotranspiration (ET) in Northeast Asia, while rare studies have revealed biophysical factors responsible for spatial variations of ET and its cooling effects. In this study, we adopted a data fusion method that integrated MODIS 8-day surface reflectance products, gridded daily climate data of ground surface, and a remote sensing pixel-based Penman-Monteith ET model (i.e., the RS–PM model) to quantify ET patterns of paddy rice in South Korea from 2011 to 2014. Results indicated that the regional variations of the rice-growing season ET (RGS-ET, the sum of daily ET from the season onset of rapid canopy expansion (SoS) to the end of the rice-growing season (EGS)) were primarily influenced by phenological factors (i.e., the length of growing period-LGP), followed by growing season mean climatic factors (i.e., vapor pressure deficit-VPD, and air temperature). For regional variations of the paddy field ET (PF-ET, the sum of daily ET from the field flooding and transplanting date detected by satellite observations (FFTDsat) to SoS, and to EGS), the extents were substantially reduced, only accounting for 54% of the RGS-ET variations. The FFTDsat and SoS were considered critical for the reduced PF-ET variations. In comparison to the temperate forest, changes in monthly ground surface air temperature (Ts) in paddy fields showed the V-shaped seasonal pattern with significant cooling effects found in late spring and early summer, primarily due to a large decline in daytime Ts that exceeded the nighttime warming. Bringing FFTDsat towards late spring and early summer was identified as vital field management practices, causing significant declines in daytime Ts due to enhanced ET. Results highlighted climate-warming mitigation by paddy fields due to early flooding practices.

Graphical Abstract

1. Introduction

The FAO’s annual proceedings have reported that around 167 million hectares of global land were plowed for paddy rice plantation in 2017, and more than 90% of global paddy rice areas were distributed in Northeast and Southeast Asia [1]. Rice is conventionally grown in fields that are flooded at different depths during the land preparation period (i.e., the first date of field flooding and transplanting detected by satellite observations-FFTDsat, herein referred to as the FFTDsat nominated surrogate of paddy rice land preparation, as commonly seen in the remote sensing research on regional paddy rice) until the end of the rice-growing season (EGS). Paddy rice with a water layer on the soil surface develops a wetland environment, which increases the water availability for evapotranspiration (ET). As a major component of surface energy balance, ET can facilitate the removal of the absorbed shortwave energy during the daytime, leading to a non-radiative surface cooling effect [2,3]. The positive effects of paddy fields on hydrological processes and ground surface climate changes through ET highlight the necessity for carrying out studies to disentangle important biophysical factors responsible for ET spatial variations and ET-related changes in the ground surface air temperature (Ts).
A large number of reports focusing on the ET in paddy rice has indicated that the daily ET of the rice-growing season was strongly regulated by the incident solar radiation [4,5,6,7,8,9,10,11,12,13,14]. They found marginal contributions of air temperature to daily ET, at least not as important as the incident solar radiation. The strong dependence of daily ET on the leaf area index (LAI) in the dry and cool season was reported by Alberto et al. [10]. Nevertheless, the LAI explanatory power observed in the dry and cold season was not recorded in the wet and warm season in the same site. They found that the early flooding and transplanting in the warm wet season resulted in constantly high ET during the land preparation and early vegetative stages, minimizing the strong impacts of LAI on daily ET. Except for the land preparation, substantial regulating effects of LAI on daily ET through the control of canopy transpiration existed when LAI was still rapidly increasing [15]. Paddy rice in Asian countries is commonly associated with small-scale subsistence production systems [16,17]. Various irrigation schedules regarding the FFTD evolve among rice land parcels in South Korea, North China, and Japan [18,19,20,21]. The LAI seasonal effects might be concealed by advancing the FFTD. Bringing the FFTD forward likely cause more water loss through the paddy field total ET (PF-ET, the sum of daily ET from the FFTD to the EGS), thereby amplifying PF-ET spatial variations due to temporal changes in the FFTD among paddy fields. The dependence of daily ET on environmental conditions and biotic factors might be rather complicated in broad spatial dimensions when different FFTDs are present among rice paddy fields.
Owing to differences in surface reflectance of incident radiation (albedo–α) and ET among different land cover types, the sign and magnitude of monthly Ts in response to land cover and management changes greatly varied [2,3,22]. Recent studies on the historical land expansion from forest to farmland, including paddy rice, in global low and mid-latitude areas reported a significant warming effect by farming [2,3,23]. The forest in mid-latitude areas served as an important cooling system to mitigate the warming effects of farmland in the context of global warming [2,3,24]. Lobell et al. [24] used the community atmosphere model (CAM) parameterized with a unified irrigation scheme, reporting minimal effects of irrigation on Ts among paddy rice fields and rainfed farmlands in Northeast Asia. Nevertheless, recent studies exploring climatic effects of the conversion from rainfed farmland to paddy rice reported strong cooling effects in spring seasons in Northeast Asia [25,26,27,28]. The agronomic cycle of paddy rice from the FFTD to the EGS is featured by irrigation and fertilization management changes and crop development. Biophysical properties of rainfed uplands would change substantially after field flooding, which may cause obvious shifts in the proportional allocation of radiation energy and subsequently the sign and magnitude of the Ts response.
Until now, few reports have advanced our understandings of important biophysical factors responsible for regional variations of ET in paddy rice fields and seasonal differences in monthly Ts between paddy fields and temperate forest in a Northeast Asian country. In our previous study [12], the FAO-56 Penman-Monteith (FAO-56 PM) model was integrated with the data of close-range remote sensing for the estimation of ET in paddy rice pixels in Gwangju, South Korea (here abbreviated as the pixel-based RS-PM model). In this paper, the pixel-based RS-PM model with MODIS datasets was applied to estimate the ET of paddy rice fields in entire South Korea from 2011 to 2014. To guarantee the accuracy of the RS-PM model, the comprehensive calibration was performed and model validation was done under a wide range of climate conditions. Geographical variations of the estimated paddy field ET together with the gridded daily meteorological data of ground surface, the MODIS albedo product, and phenological metrics derived from MODIS reflectance product, were fused to quantify correlations among paddy field ET and biophysical factors, evaluating the two hypotheses as follows:
(1)
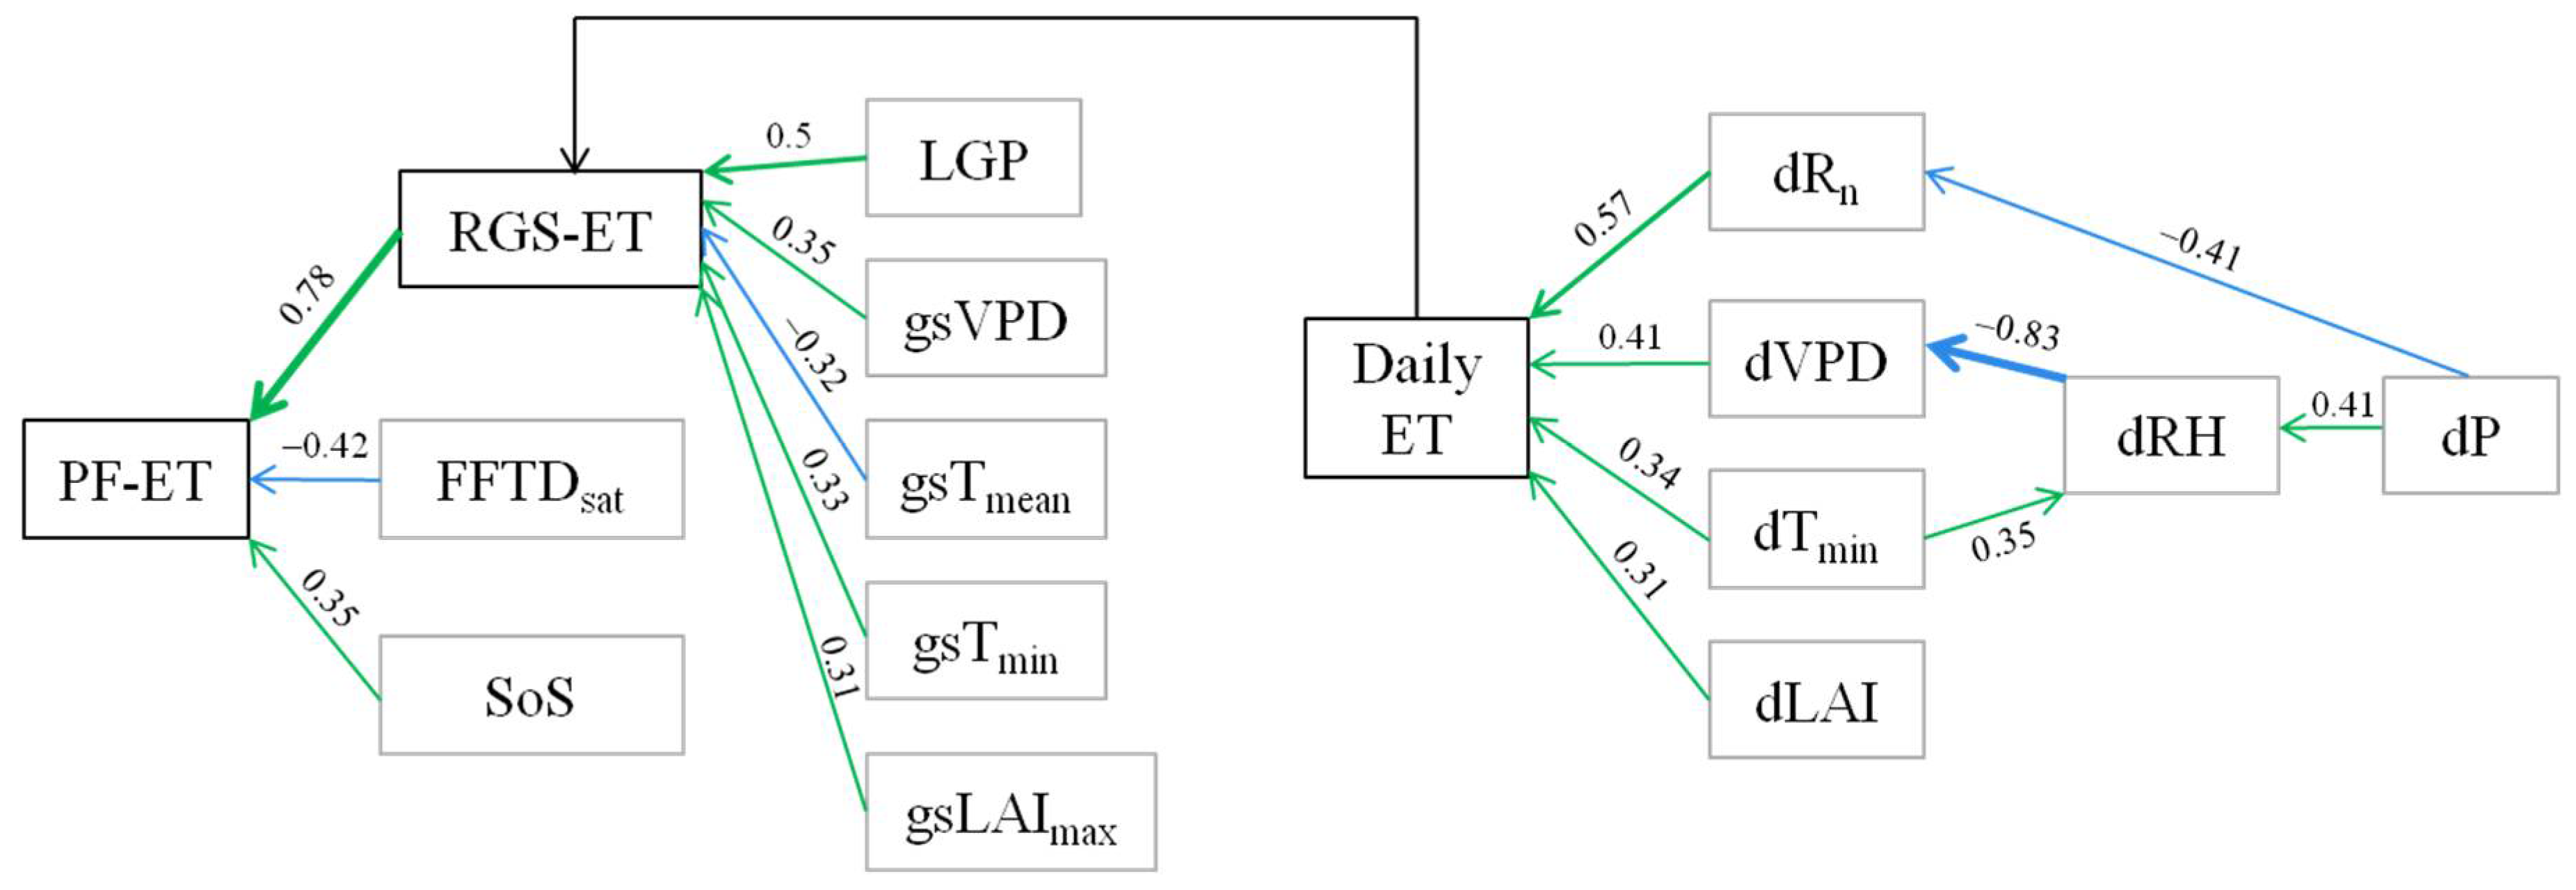
Field-to-field changes in the FFTD could become an important biophysical factor influencing spatial and temporal variations of ET among paddy fields.
(2)
Considering the temperate forest being adjacent to paddy rice planting areas, the monthly Ts of paddy fields may not always be higher than that of the temperate forest.

2. Materials and Methods

The pathway diagram of earth observations and numerical simulations to test the two hypotheses through analyzing the correlations among geographical variations of the ET, Ts, and biophysical factors of paddy field is illustrated in Figure 1. The flooding single classification method using the Moderate Resolution Imaging Spectroradiometer 8-day surface reflectance products (MOD09A1) was adopted to detect the extent of paddy rice fields and quantify the FFTD of paddy field in South Korea from 2011 to 2014. Potential paddy rice pixels, detected by the flooding single classification approach [29], were geographically overlapped by a 5m resolution land use and land cover map (Supplementary Materials SP1 and Figure S1); such pixels with homogeneity percentage ≥90% (i.e., rice area of an individual grid cell was ≥90%) were filtered. Daily vegetation indices (VIs) per paddy pixel were produced using the double logistic model, which help develop daily LAI and Kcb per paddy pixel according to field relationships among the VI of interest, LAI, and Kcb. Geographical variations of the ET of paddy fields were obtained via fusing daily LAI, Kcb, and meteorological variables to drive the RS-PM model that was comprehensively calibrated and validated using eddy covariance observations. Phenological metrics of paddy rice were extracted from the MODIS VIs data using the TIMESAT (i.e., a software package for analysing time-series of satellite sensor data) that was validated by field observations. The detailed processes involved by earth observations and numerical simulations are stated in the following sections.

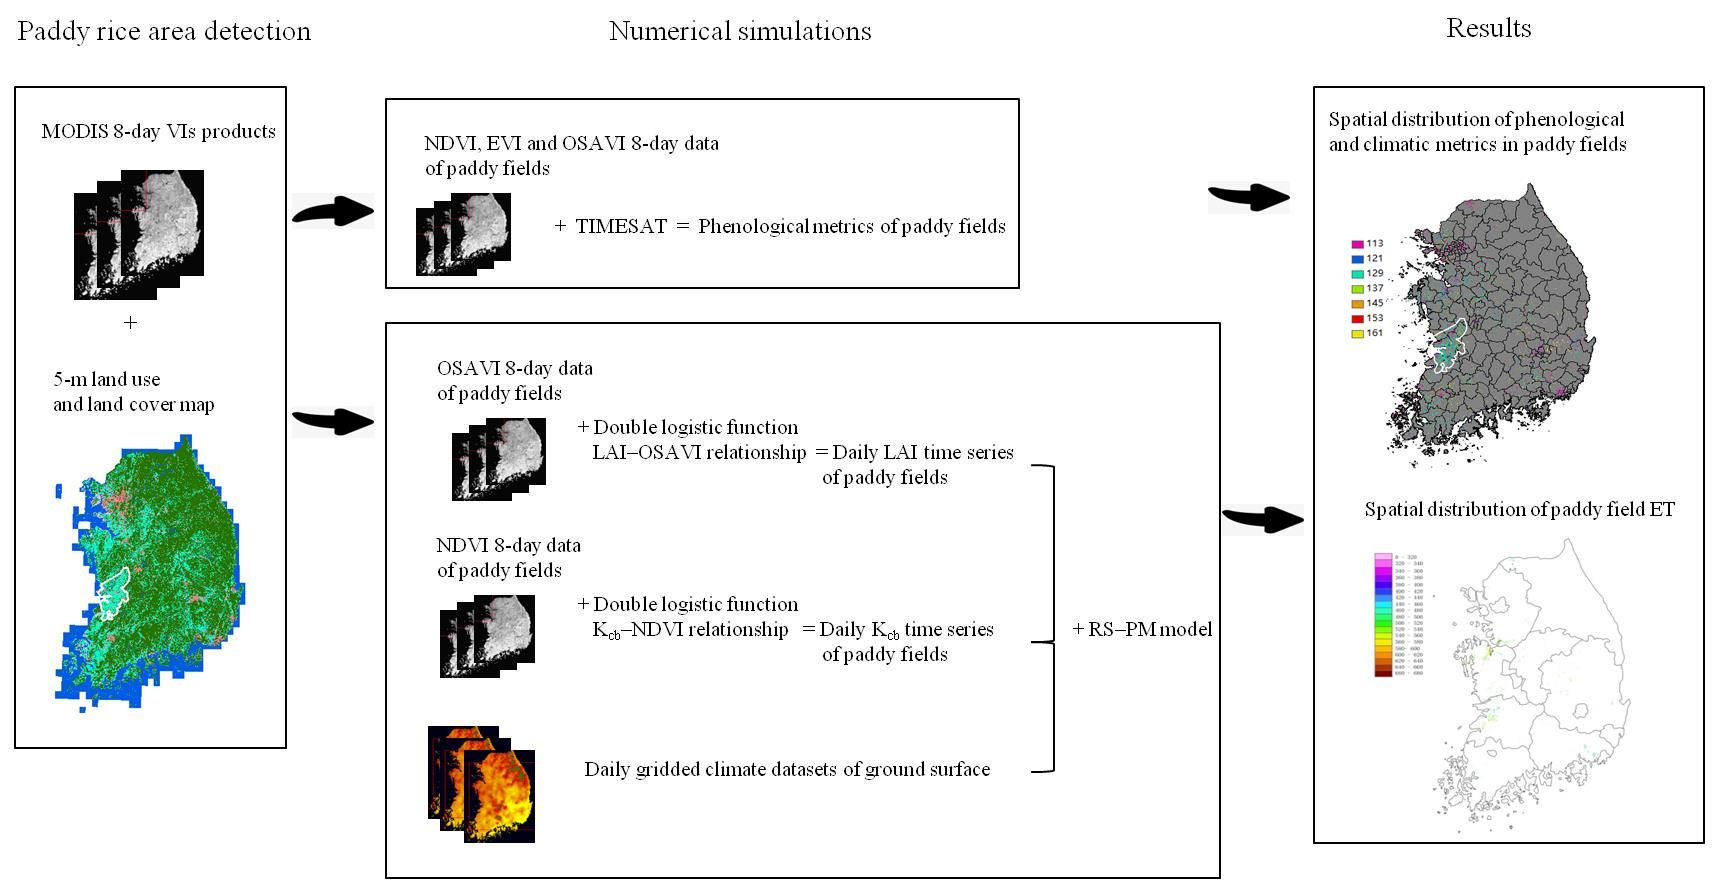
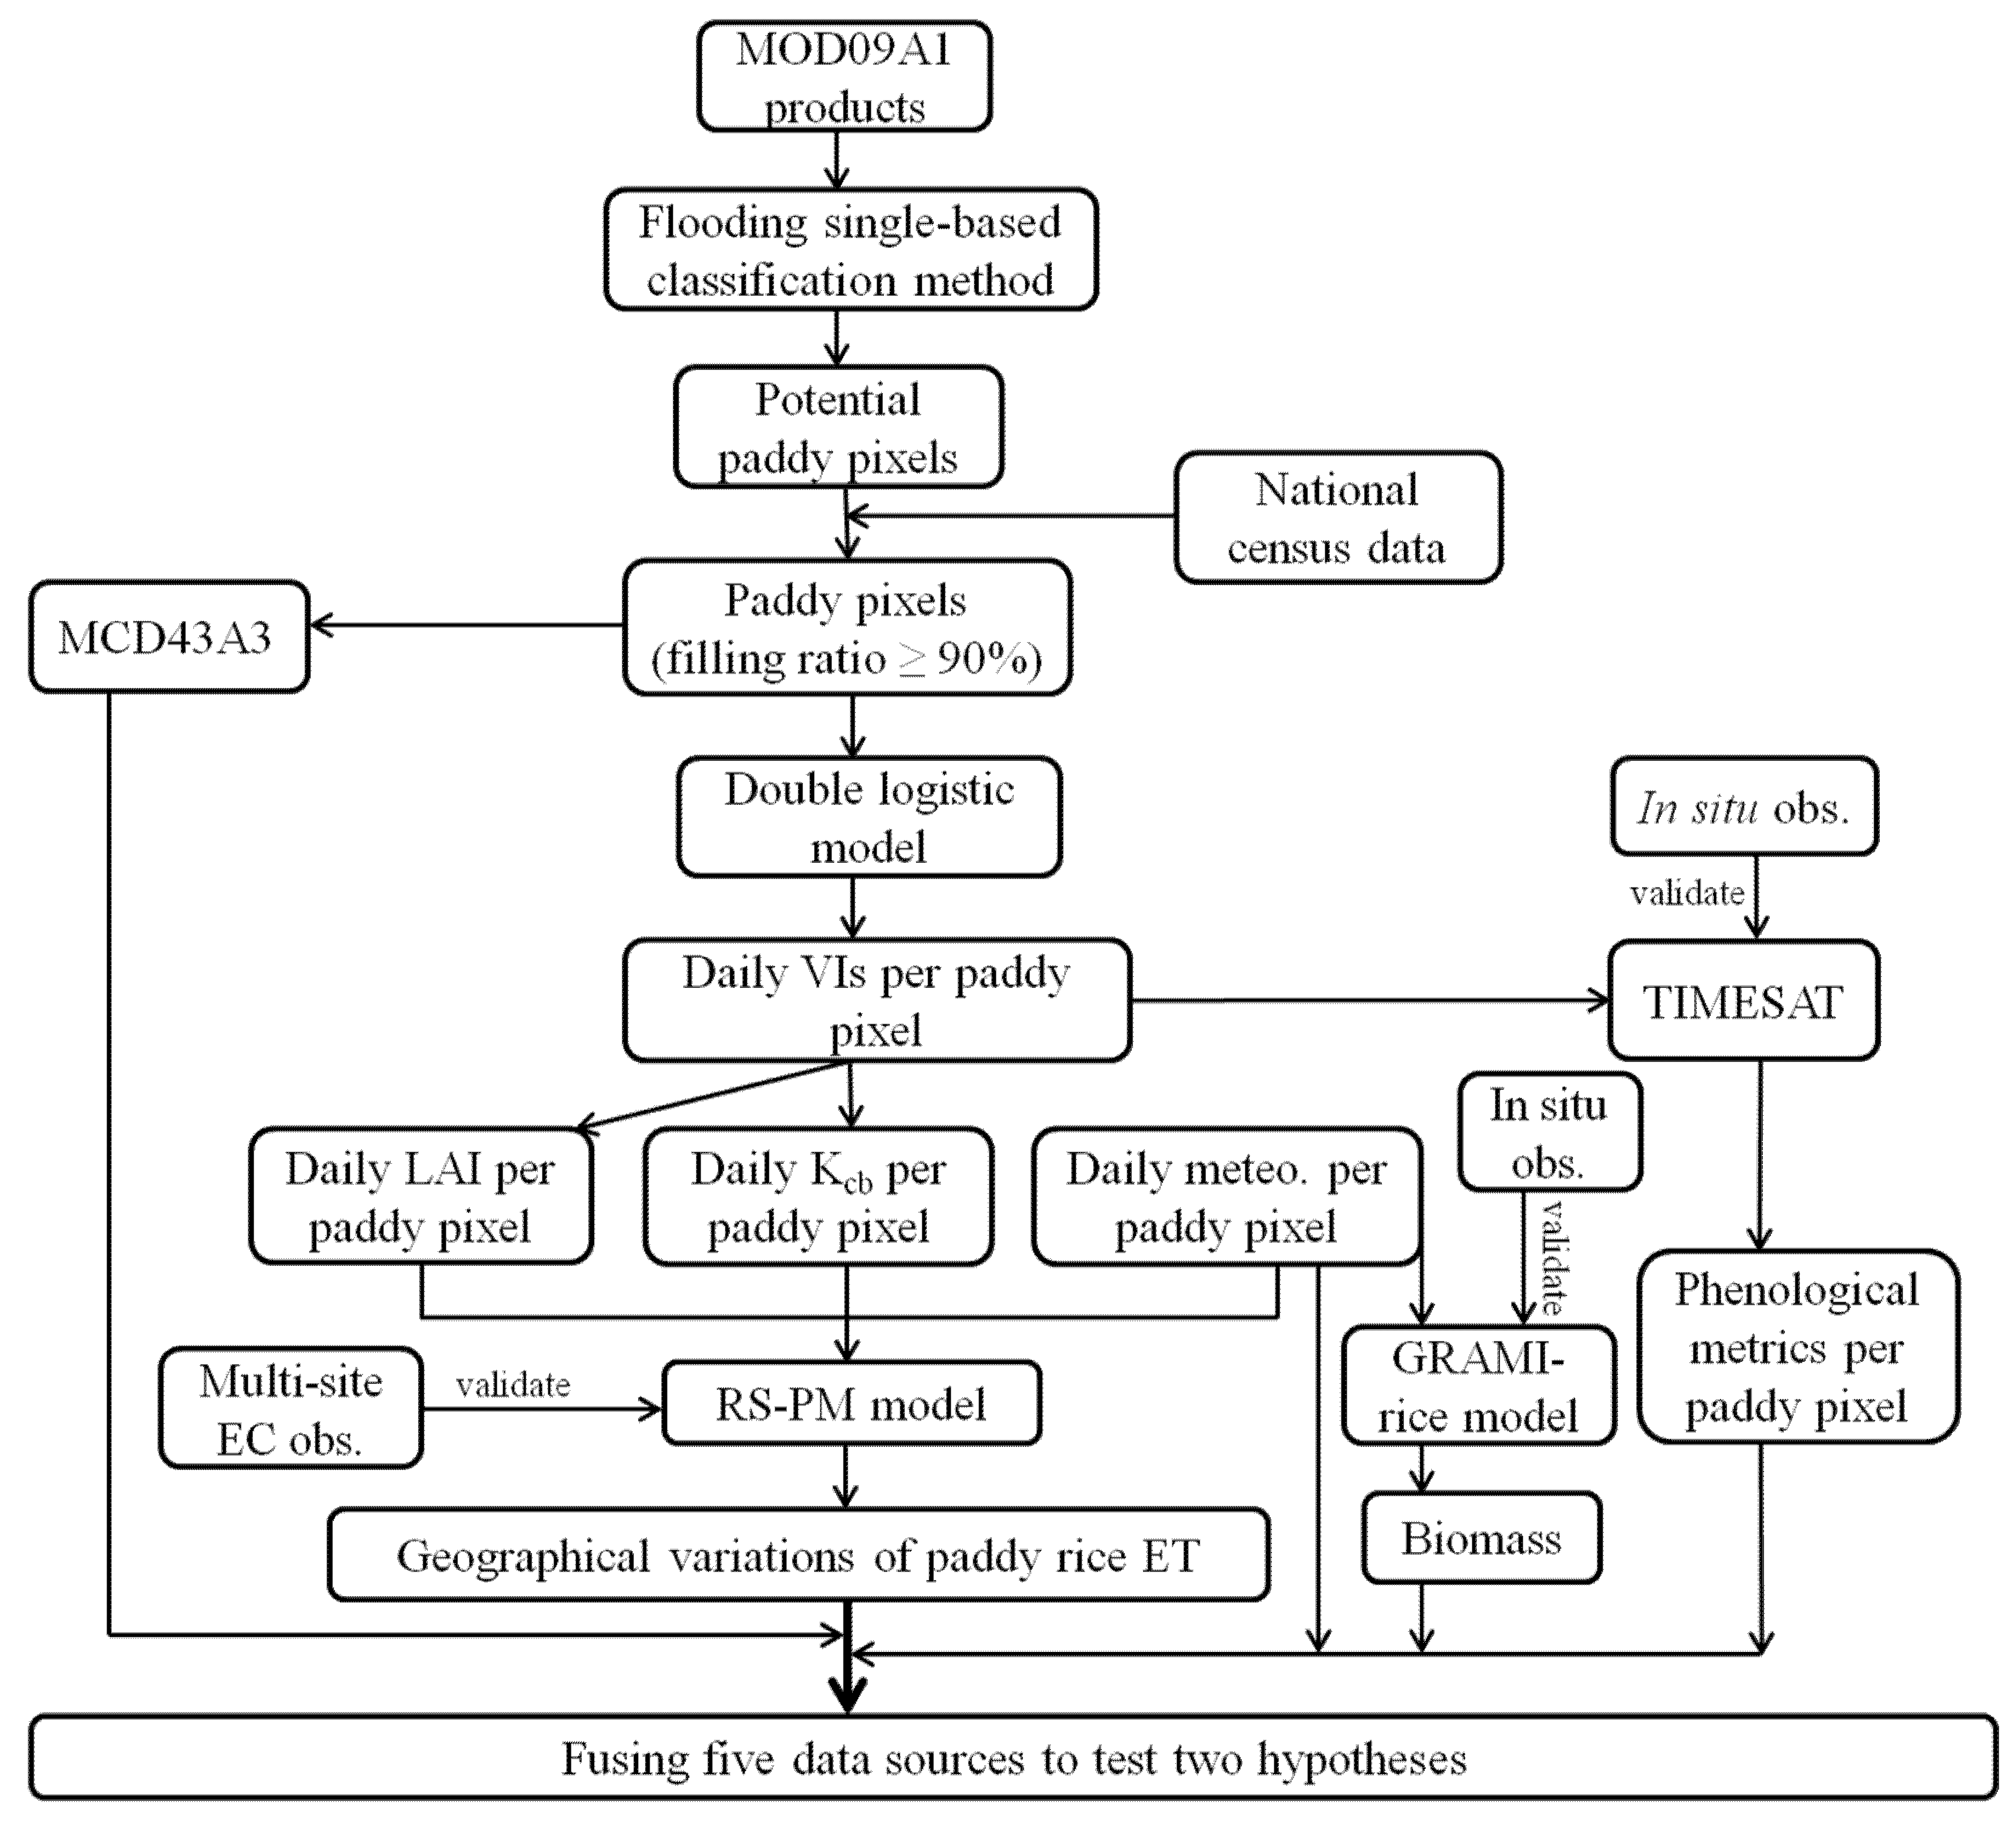
2.1. Mapping the Extent of Paddy Rice Using MOD09A1 and National Census Datasets

The online repository of MOD09A1 product from 2011 to 2014 provides the information about the quality assurance (QA) for each geo-reference correcting surface reflectance imagery, indicating the presence of cloud cover and other variables. To minimize the error associated with cloud or aerosol contamination, per-pixel data with poor QA and/or blue reflectance of ≥0.2 were considered as outliers [29]. Such abnormal data were replaced with the mean of the subsequent and previous reflectance datasets. Reflectance data in blue (ρblue, 459–479 nm), red (ρred, 620–670 nm), near-infrared (ρnir, 841–876 nm) and short-wave infrared (ρswir, 1628–1652 nm) bands were used to calculate VIs, i.e., the enhanced vegetation index (EVI) [30], the normalized difference vegetation index (NDVI) [31], the land surface water index (LSWI) [29], and the optimized soil-adjusted vegetation index (OSAVI) [32]. EVI is the vegetation index sensitive to vegetation greenness, whereas LSWI is highly sensitive to land surface moisture content.
N D V I = ρ n i r ρ r e d ρ n i r + ρ r e d
L S W I = ρ nir ρ s w i r ρ n i r + ρ s w i r
E V I = 2 . 5 ρ nir ρ r e d 1.0 + ρ n i r + 6.0 ρ r e d 7.5 ρ b l u e
O S A V I = 1 . 16 ρ nir ρ r e d ρ n i r + ρ r e d + 0.16
It is required to distinguish permanent water bodies from seasonally flooded rice fields. We defined a pixel covered by a water body when the year-round VIs value of that pixel had both the NDVI < 0.10 and LSWI [29]. Rice cropping systems are practiced primarily on great flat plains in the western part of South Korea. There are considerable changes in the elevation of the forested lands surrounding rice plains. A digital elevation map (GTOPO30, Global 30-Arc Second Elevation Dataset, https://rda.ucar.edu/datasets/ds758.0/, accessed date: 21 October 2020) was used to retrieve the slope of each pixel by the ArcGIS 10.2 (Environmental Systems Research Institute, Redlands, CA, USA). Areas with a slope of over 10% were considered as non-paddy rice zones.
In a previous study, Xiao et al. [29] proposed a flooding single classification method (LSWI + TEVI, T is a threshold parameter) with a constant T of 0.05 to identify paddy rice areas and evaluate the FFTDsat [33]. They designated the first date of the EVI 8-day period meeting the flooding single classification approach at a paddy pixel as the FFTDsat of the paddy pixel. Paddy pixels, obtained by the flooding single classification method, were denoted as potential paddy pixels, as they may still contain numerous small landholdings of subpixels. We assumed that the land cover and land use type (agriculture, forest, and grassland) throughout South Korea were relatively stable from 2011 to 2014 (Figure S2). A spatial information system embedded in the ArcGIS 10.2 software was used to stack the 5-m land cover map and the map of potential paddy pixels, aiming to count the number of paddy rice fields within each potential paddy pixel. The 5m spatial resolution land cover map of the raster form was developed by the Ministry of the Environment Republic of Korea through the comprehensive county field census and remote sensing retrieval by visual interpretation (For detailed information, please refer to Jeong et al., 2012 [18] and Figure S1). The Figure S3 in Supplementary Materials SP1 shows an example of the selection of homogenous paddy pixels in the Charyeong rice plain. Potential paddy pixels with homogeneity of ≥90% throughout South Korea were regarded as pure paddy pixels. Meanwhile, we assumed that the influences of other land-use types that were less than 10% in each pure paddy pixel would be randomly detrended. The same method for selecting pure paddy pixels was used to identify pure forest pixels. The filling ratio of ≥90% was set as a filter to single out the pixels in which rice paddies were almost completely covered.

2.2. Estimations of Phenological Metrics and Daily LAI Time Series in Paddy Fields

TIMESAT is a program that uses sophisticated statistical techniques to smooth satellite time-series data and retrieve key phenological parameters (http://www.nateko.lu.se/TIMESAT/timesat.asp, access date: 15 September 2021) [34,35], which has been integrated in the processing of MODIS data into a phenology product (MOD09PHN and MOD15PHN) by the North American Carbon Program [36]. Boschetti et al. [37] compared the LGP and SoS derived from the TIMESAT and field census, respectively, by rice farmers, indicating a good correlation (R2 = 0.92). Meanwhile, Son et al. [38] proved that rice sowing and harvesting dates could be exactly retrieved from MODIS VIs using the double logistic-based method. In line with these studies, the built-in noise reduction techniques in the TIMESAT program were used in this study to process time series of MODIS VIs, i.e., the spike method of median filtering, envelope iterations, minimum of 0.25, 0.1, and 0.05 in NDVI, EVI, and OSAVI, respectively, the fitting method based on the double logistic-based model, and the start of season method (i.e., STL trend). The study of forest ecosystems with remote sensing by Wu et al. [39] suggests that a better estimation of LGP and SoS was achieved by taking multiple VIs rather than one into account. Hence, NDVI, EVI and OSAVI were used to estimate seasonality parameters of paddy pixels. We defined the LGP per pixel, exceeding 160 days and less than 96 days, as outliers, because the modern semi-dwarf rice varieties in South Korea do not have LGP outside of the time range. Each seasonality index was determined using the average of three VIs estimates to lessen the impacts of random factors. In general, the changes in the LGP derived from the TIMESAT along with the growing season mean air temperature (gsTmean) matched well with the regression line fitting the in-situ LGP-gsTmean data (Figure S4a in Supplementary Materials SP2). The paired in-situ LGP and gsTmean datasets were collected from paddy rice fields [40]. A full agreement between the TIMESAT LGP and field observations suggests that the phenological metrics estimations of paddy rice using the TIMESAT were acceptable.
The daily LAI per-paddy pixel was generated according to the statistical relationships between VIs and LAI in paddy rice fields. Four-year measurements of ground surface LAI and VIs in three paddy sites in South Korea enabled us to perform a robust statistical correlation between the LAI and VI of interest. Three VIs (i.e., NDVI, EVI, and OSAVI), commonly used to retrieve LAI, were selected for comparison with field LAI observations. Results revealed the best fitting curve for the ln(LAI)-ln(OSAVI) correlation (R2 = 0.72), followed by the ln(LAI)-ln(EVI) correlation (R2 = 0.68), and the ln(LAI)-ln(NDVI) correlation (R2 = 0.61) (Figure S5 in Supplementary Materials SP3). Importantly, the variations of LAI > 1.0 m2 m−2 (i.e., log(LAI) = 0) could be better explained by OSAVI. The same phenomenon for the raw data of LAI and OSAVI was also evident (The intent of Figure S5c). Therefore, seasonal courses of daily LAI for each paddy pixel in each year were estimated through the OSAVI time series. Beck et al. [41] demonstrated that the double logistic function can more accurately show seasonal changes of VIs by effectively removing outliers. Gonsamo et al. [42] and Wu et al. [39] examined a useful application of the double logistic model for noise reduction using remote sensing time series data. In our analysis, the double logistic model was fitted to time series of MODIS VIs data for each rice paddy and year, thereby yielding daily VIs as followings:
f t , x 1 , x 2 , x 3 , x 4 = 1 1 + exp x 1 t x 2 1 1 + exp x 3 t x 4
where x1 and x3 are the locations of the left (the increasing phase) and right (the decreasing phase) inflection points respectively, and x2 and x4 determine the rates of changes at these points. Daily VIs values for each paddy field and year were then converted to LAI values based on the correlation between OSAVI and LAI.

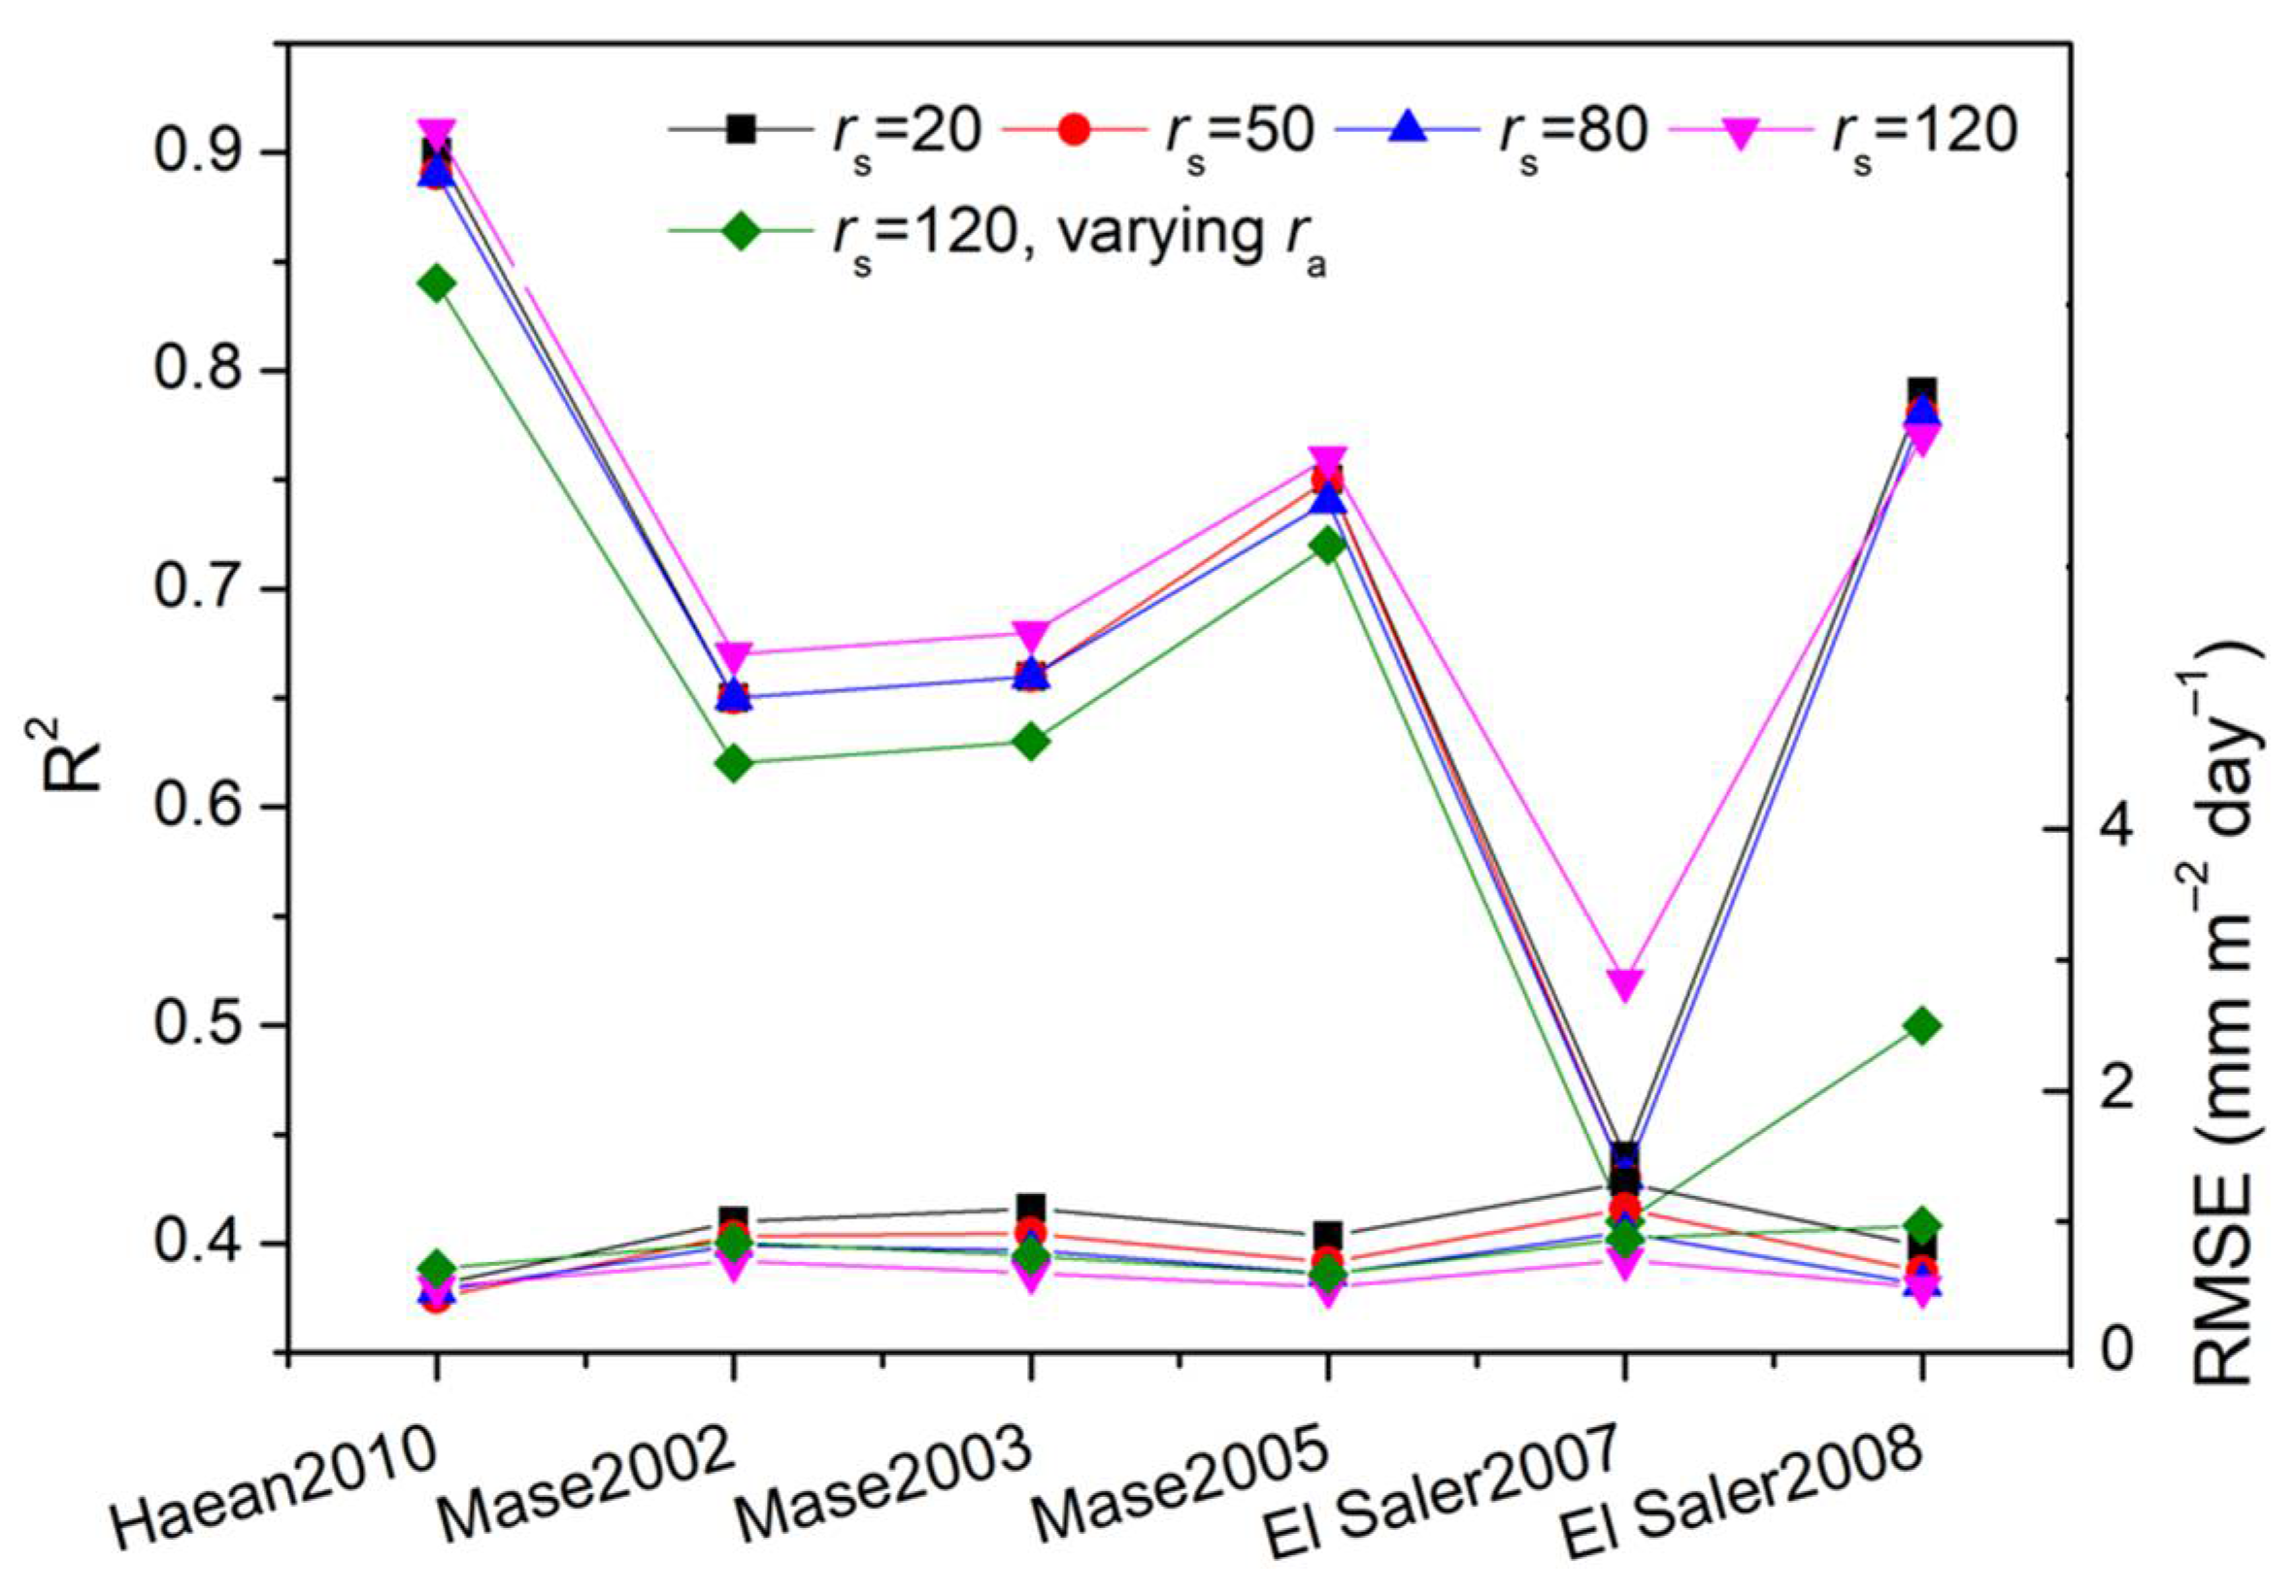
2.3. Evaluation and Application of the Pixel-Based RS-PM Model for the ET Estimation in Paddy Fields

Daily ET in each paddy pixel was estimated by the pixel-based RS-PM model. The core principle for ET estimation in the pixel-based RS-PM model is the Penman-Monteith-type ET model modified by the FAO (i.e., FAO-56 PM model) [43]. It estimates ET based on a reference crop evapotranspiration (ETo) multiplied by the sum of the transpiration coefficient (Kcb) and the evaporation coefficient (Ke) of the crop of interest. Our previous study proposed the pixel-based RS-PM model that integrated the FAO-56 PM model and the close-range unmanned aerial vehicle (UAV) based multispectral remote sensing for paddy rice grown at four fertilizer application rates in Gwangju, South Korea [12], thereby developing parameter retrieval formulas for Kcb and Ke. Detailed descriptions of the pixel-based RS-PM model structure with Kcb and Ke retrieval formulas can be found in the Supplementary Materials SP3.
To extract the spatial information on rice field ET over a large space with high simulation accuracy, the optimum configuration of key parameters for the FAO-56 PM model was necessary. As suggested by Allen et al. [43], the FAO-56 PM model could be performed well at the point and regional scales with the reasonable parameterization of independent weather and physiological variables. Sensitivity analyses of three important physiological parameters (i.e., aerodynamic resistance-ra, bulk surface resistance-rs, and Kcb) to estimate the daily ET estimate were performed in theory before field evaluations (Table 1). The ra and rs describe the resistance of evaporating and transpiring surfaces to water vapor transport through the reference heights. The variation of ra from 20 s m−1 to 120 s m−2 caused a slight decline of daily ET by 10.02% (ranging from 4.09 mm m−2 day−1 to 3.68 mm m−2 day−1) under high-level radiation and the daily mean air temperature of 17.5 °C. The extents of ET constraint by escalating ra were 9.04%, 8.39% and 7.71% under varying daily air temperatures of 22.5 °C, 27.5 °C, and 32.5 °C, respectively. Results implied that configuring ra according to field conditions would not yield large errors for daily ET estimates. The varying rs values that affect ET through canopy transpiration caused a decline in daily ET at the same extent as increasing the ra. Significant impacts on daily ET estimates were evident in scenario 3 of Table 1, wherein varying Kcb values, ranging from 0.58 to 0.30 caused a large decline in ET by almost 50%.
For the determination of the robust rs that is reliable for paddy rice ET estimation throughout South Korea, rs values increased from 20, 50, and 80 to 120 s m−1, and the varying rs values fell within the ranges reported for paddy rice. Varying ra values were calculated on the basis of the seasonal crop height, according to the FAO-56 PM model instruction. The height of the rice crop was calculated using a relationship between LAI and plant height reported by Confalonieri et al. [44]. Field assessments of the FAO-56 PM model with varying rs and ra values based on ET observations using eddy covariance (EC) systems are shown in Figure 2. An archived dataset of daily lateral heat fluxes and meteorological factors, including global incident radiation (MJ m−2 day−1), air temperature (°C), wind speed (m s−1), and relative humidity (%), recorded at a time interval of 30 min in paddy rice fields using the EC systems, was collected from the Haean in 2010, Mase in 2002, 2003, and 2005, and El Saler-Sueca in 2007 and 2008 (for more information about site descriptions, please refer to Table S2 in Supplementary Materials SP4). A time series of NDVI from 2002 to 2010 was obtained from gridded L3G (level3) composite data at 250 m spatial resolution (MODIS Terra Surface Reflectance products, MOD13Q1). The daily NDVI of each site was estimated through Equation (5) and used to evaluate seasonal Kcb and Ke. Comparisons between ET predictions and observations showed that the greater the rs, the smaller the root mean square error (RMSE). The FAO-56 PM model with a constant rs value of 120 s m−1 and the constant ra (called as FAO-56 PMrs = 120) had the best accuracy, with R2 = 0.91 and RMSE = 0.50 mm m−2 day−1 in the Haean, R2 = 0.71 and RMSE = 0.60 mm m−2 day−1 in the Mase, and R2 = 0.64 and RMSE = 0.60 mm m−2 day−1 in the El Saler-Sueca. Relatively poor performances were observed when considering the variable ra and constant rs (120 s m−1) (termed FAO-56 PM120,ra). The RMSE of the FAO-56 PMrs = 120 model was 0.56 mm m−2 day−1, accounting for around 17.5% of the mean daily ET (~3.2 mm m−2day−1). As demonstrated in Table 1, we found that rs estimates would cause ET simulation errors of less than 10%. We found that estimation errors due to uncertainties in other model variables including ra would be lower than 10% as well; this is in agreement with sensitivity analyses of model parameters reported by our previous study [12]. Daily ET estimates in the Haean, Mase, and El Saler-Sueca over six years were compared favorably with EC observations (a in Supplementary Materials SP5). It was reasonable to infer that the pixel-based RS-PM model with optimization of parameter, including rs and ra enabled the efficient capture of the overall variation of rice field ET across South Korea.
Daily Rs↓ (MJ m−2 day−1) was estimated with data on weighted slopes, surface, and atmospheric moisture data by using multispectral imagery from the MI (Meteorological Imager) on COMS (Communication, Ocean and Meteorological Satellite), along with VEGETATION sensor data from SPOT (Système Pour l’Observation de la Terre) based on the Kawamura physical model [45]. The estimated daily Rs↓ was validated by observations made from 37 ground pyranometers, and the results showed a high correspondence between predictions and observations under all sky conditions [45,46]. Daily maximum and minimum air temperatures (Tmax, Tmin, respectively, °C) and the relative humidity (RH, %) obtained from the Korea Local Analysis and Prediction System (KLAPS) were used. The KLAPS, which constitutes the data collection and analysis modules, is designed to predict the weather conditions of the Korea Peninsula with a spatial resolution of 5.0 km at fine timescales. Weather products at high-resolution (1.5 km) from reanalysis data at 2.0 m height were generated by the KLAPS based on its analysis scheme using 470 automated weather systems throughout the Korea Peninsula [46,47]. Daily Ts at 2.0 m height was the mean of daily Tmax and Tmin. Daily vapor pressure deficit (VPD, kPa) is a product of Ts and RH. The same climate data as in our study were used for the estimation of ET and yield in paddy rice in South Korea by Yeom et al. [45] and Jeong et al. [46]. Wind speed grid data (m s−1) at a spatial resolution of 0.25° and 1-day time intervals in South Korea were accessed from the Global Land Data Assimilation System Version 2 (GLDAS-2.0, Li et al., 2018) and downscaled with high-resolution covariates of advanced spaceborne thermal emission and reflection radiometer (ASTER) global digital elevation model (GDEM), slope, and aspect attributes through comprehensive statistical analyses using the thin plate smoothing splines and machine learning assembling (MACHISPLIN package in R software). The MACHISPLIN statistical technique was used to downscale the temperature and relative humidity products to match them spatially with MODIS VI products. Methods for daily Rn estimation in this study were aligned with the FAO-56PM model.

2.4. The Monthly Estimation of ΔTs between Paddy Field and Temperate Forest

α is an important component of surface energy balance, explaining the warming and cooling effects of paddy field. Daily values of α in paddy rice and temperate forest in South Korea were retrieved from MODIS MCD43A3 products. Daily Ts and α values were aggregated into a value for the month (mean). In line with methods reported by Li et al. [3], the impacts of varying FFTDsat values of paddy field on monthly Ts were expressed as the monthly Ts difference of paddy rice minus that of the temperate forest.
Δ T s = T s , rice T s , f o r e s t
Positive or negative ΔTs indicates a warming or cooling effect of paddy rice, respectively. Intensive paddy rice cultivation is primarily done in flat plains of the western part of South Korea (e.g., the Charyeong rice plain in Figure S1) as well as in mountainous areas. Therefore, we chose the Charyeong rice plain and surrounding forest ecosystems as two comparative groups (the rectangle extent: LL 35°8′N, 126°2′E, UR 37°3′N, 127°7′E;area: 1.8 × 10⁶ ha−1; elevation range: 1 to 543 m; 337 forest pixels and 210 rice pixels in ). The average value of monthly ΔTs over four years is presented. Paddy rice is commonly raised on flat plains and forests at a wide range of elevations and slopes. Topography-induced differences in daily Ts may enlarge or narrow ΔTs between paddy field and temperate forest. To correct the topography-induced biases in ΔTs estimation, we performed an elevation-aspect-slope adjustment by subtracting the elevation/aspect/slope-induced ΔTs from the original value, which was in line with the topography correction method proposed by Li et al. [3]. Δα was the product of paddy field α minus that of the temperate forest. Spatial analysis indicated that cooling or warming effects on paddy rice were independent of the spatial extent selected for comparisons in South Korea.
Structural equation modeling (SEM) is a label for a diverse set of methods used in experimental and observational research, implying a structure for the covariances between the observed variables [48]. It was applied here for assessing relative importance of biophysical factors to regional variations of paddy field ET. All statistical analyses including SEM and coefficient of variation (CV) were analyzed by the R software (R Core Team, 2020) [49]. Spatial data processing was made by the ENVI-IDL 5.3 software (Exelis Visual Information Solutions Inc., Boulder, CO, USA).

3. Results

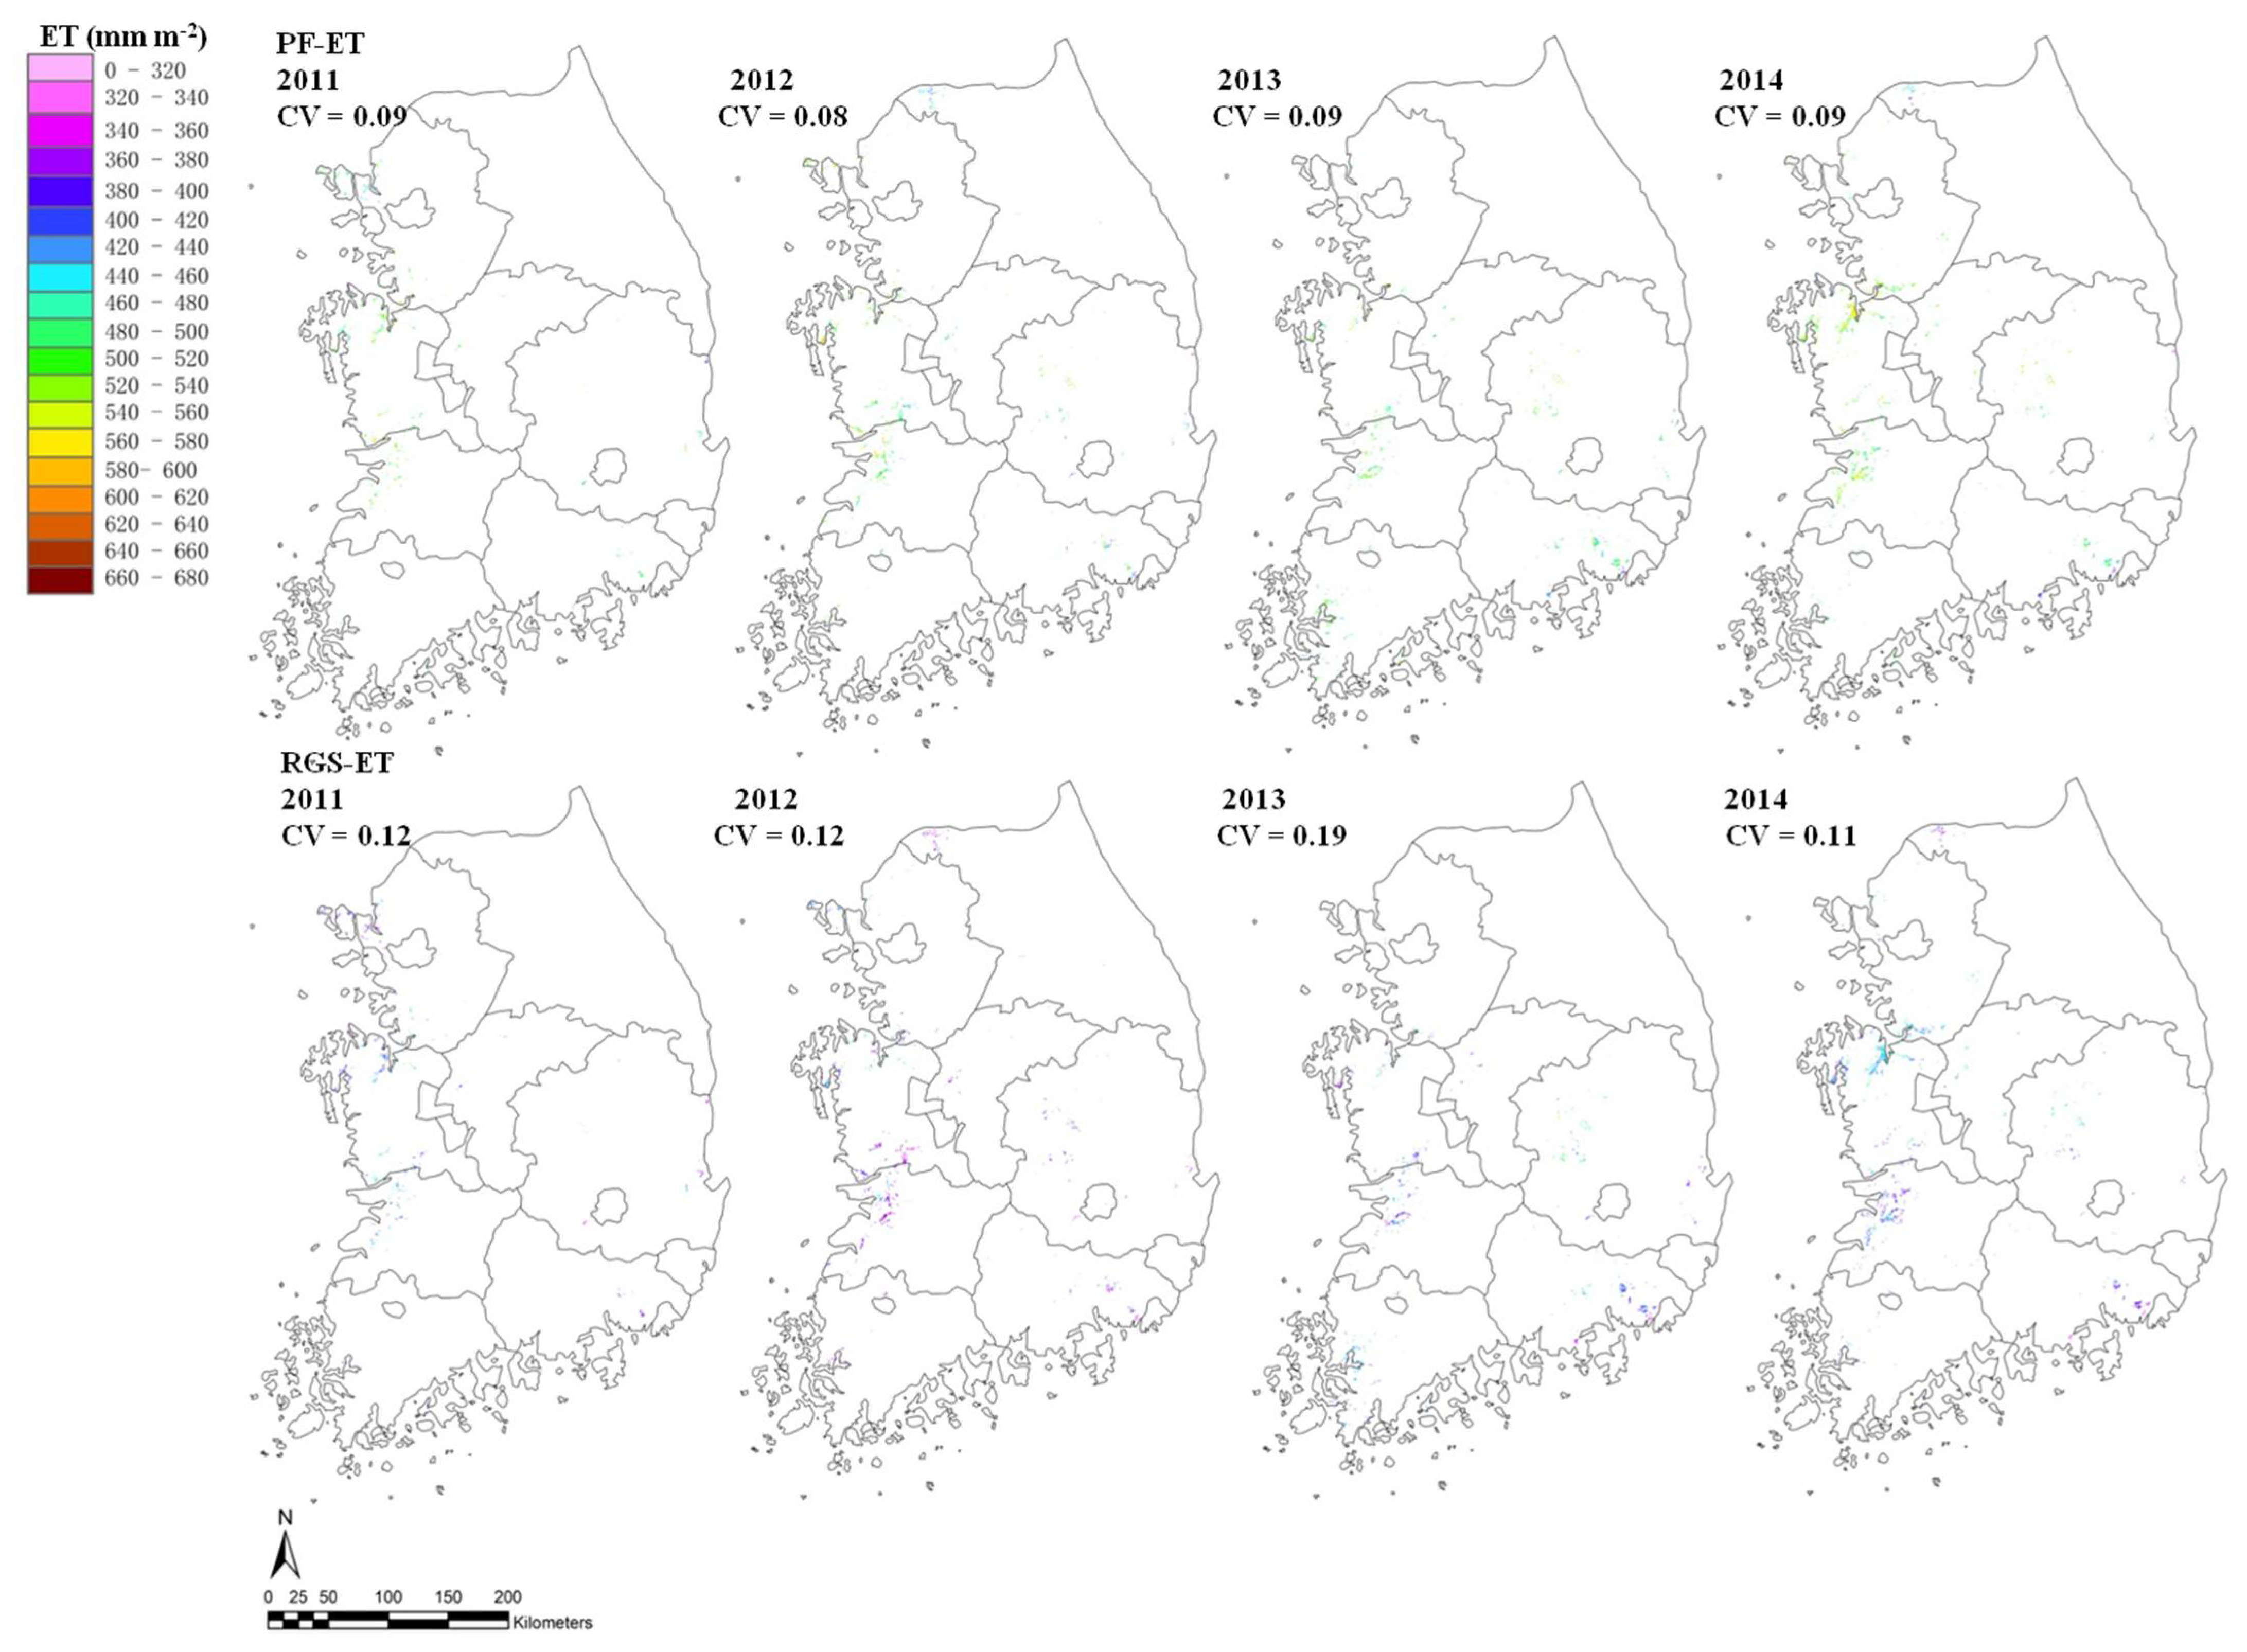
3.1. Spatial Variations of ET in Paddy Fields, South Korea

The contribution of various biophysical factors to spatial variations of PF-ET and the rice-growing season total ET (RGS-ET, the sum of daily ET from the SoS to the EGS) is disentangled in this and the next paragraphs. The SEM was applied to evaluate the magnitude and importance of the causal connection between the RF-ET and nine biophysical factors (Figure 3), including RGS-ET, biomass production (estimation methods for biomass production referred to Supplementary Materials SP3), daily mean net radiation from the FFTDsat to the EGS, FFTDsat, daily mean and minimum air temperatures of the same period as the net radiation, SoS, LGP, the maximum LAI of the rice-growing season, and daily mean vapor pressure deficit during the same period. Explanatory power by the error item (PF-ET variations that could not be explained by the nine variables) was 0.024, suggesting that almost all spatial variations of PF-ET, reaching up to 98%, had been explained by these nine variables. The determination coefficient (DC), a product of the squared path coefficient, is a powerful indicator of the relative strength of an independent variable in determining the target variable. The DC value of ≥0.1 conventionally indicates a stronger correlation [48]. The DCs for the RGS-ET, SoS, and FFTDsat were 0.61, 0.12, and 0.18, respectively, remarkably greater than other values. A negative path coefficient between the PF-ET and FFTDsat was found, indicating that advancing the FFTDsat resulted in a greater PF-ET value. Positive signs for PF-ET and RGS-ET and for PF-ET and SoS suggested that the reductions in values of the two variables led to lower PF-ET value. The RGS-ET, FFTDsat, and SoS variables were critical (listed in order of importance) for measuring spatial variations of PF-ET, which was in agreement with the H1.
Spatial variations of RGS-ET could be well explained by eight biophysical factors (i.e., biomass production, daily mean net radiation during the rice-growing seasons-gsRn, daily mean minimum air temperature during the rice growing seasons-gsTmin, SoS, daily mean air temperature during the rice growing seasons-gsTmean, LGP, growing season LAImaxgsLAImax, and growing season mean VPDgsVPD), with an explanatory power up to 0.97. The DCs for the LGP, gsVPD, gsTmean, gsTmin, and gsLAImax were 0.25, 0.13, 0.10, 0.11 and 0.10, respectively (Figure 3), suggesting that the LGP, gsVPD, gsTmean, gsTmin and gsLAImax were the critical biophysical factors responsible for regional variations of RGS-ET.
The spatial CVs of PF-ET and RGS-ET and main biophysical factors causing differences in the CV between PF-ET and RGS-ET were quantified and explained in this paragraph. Figure 4 shows the regional variations of PF-ET and RGS-ET from 2011 to 2014. Clearly, the annual CVs of PF-ET tended to be conservative and constant at 0.09 throughout the four years. The annual CV of RGS-ET fluctuated from 0.11 to 0.19. Greater spatial variations of RGS-ET by 54.28% than those of PF-ET were observed. PF-ET was the summation of the rice-growing season total ET (i.e., RGS-ET) and the non-growing season ET (i.e., the period from the FFTDsat to the SoS). Results suggest that the field-to-field differences in the FFTDsat did not contribute to spatial variations of PF-ET. Nevertheless, the observed site-to-site differences in FFTDsat indeed lessen the expanding effects of RGS-ET spatial variations on PF-ET, as the spatial variations of RGS-ET were amplified by climatic and phenological factors, while the main regulating factors for PF-ET were FFTDsat and SoS.
No significant effects of spatial changes in FFTDsat on the LGP were observed (Figure S4b), implying that the initial flooding activities would not bring about positive effects on RGS-ET through their impacts on LGP.

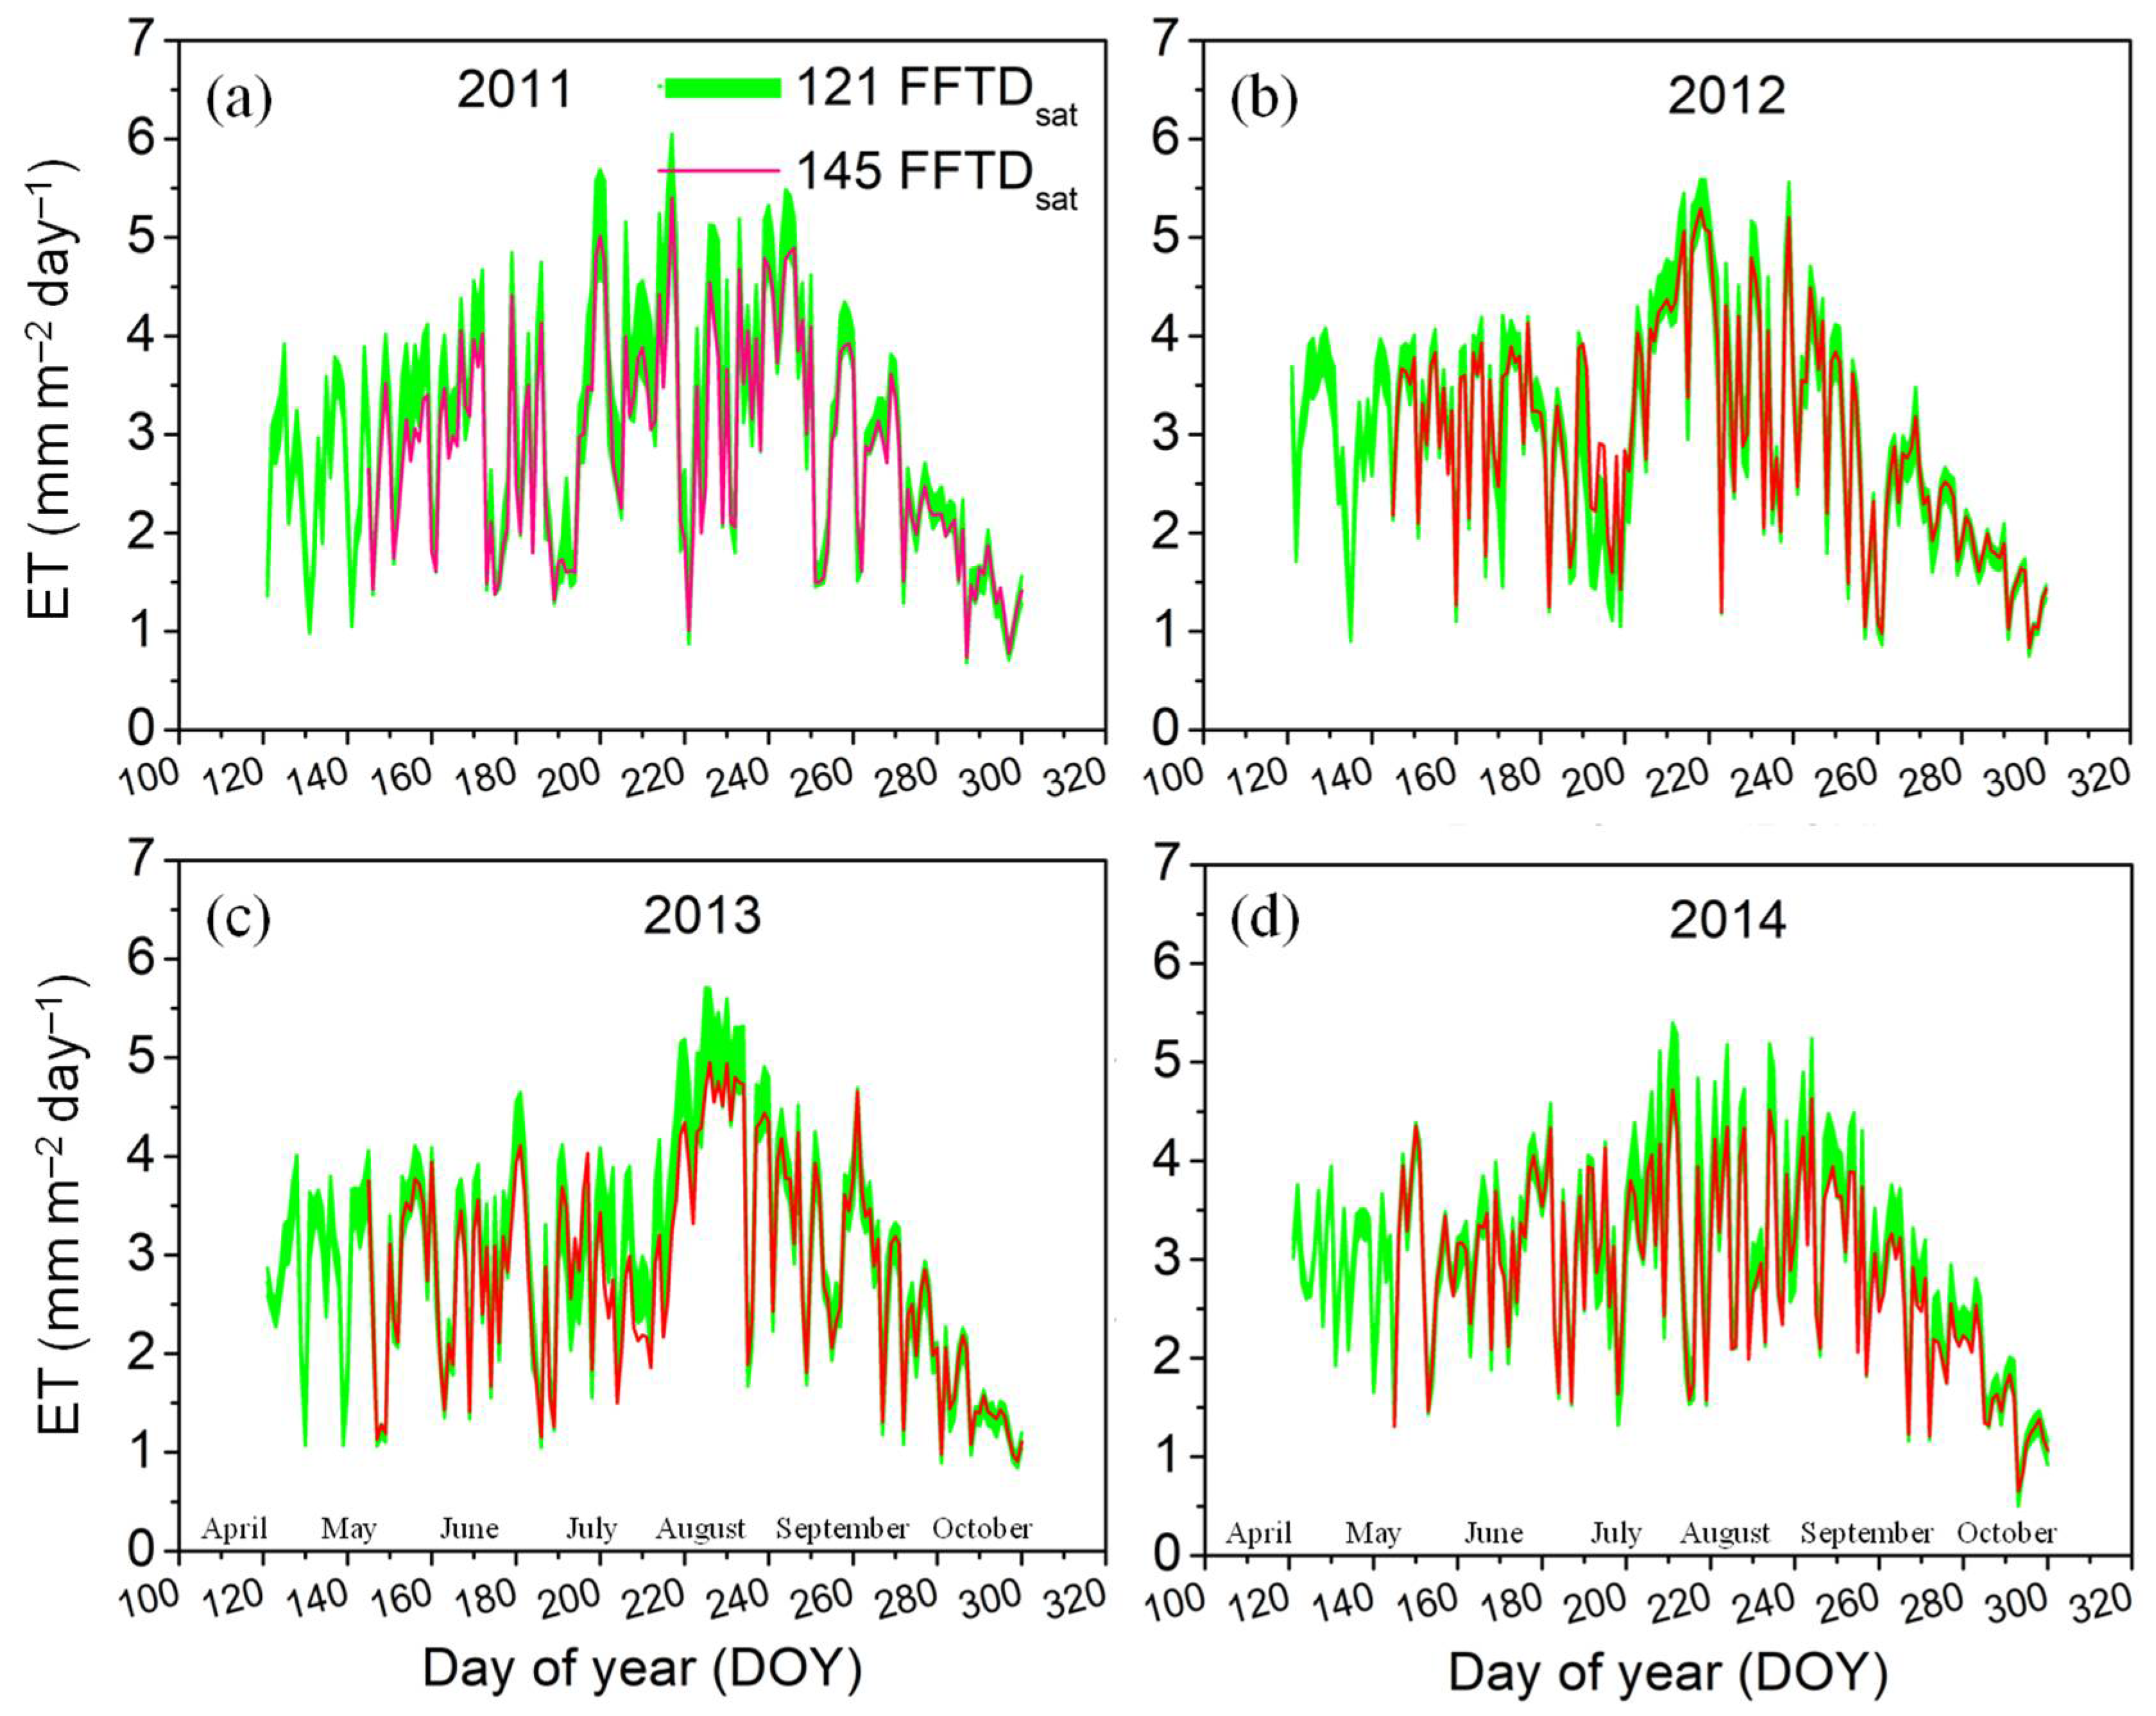
3.2. Seasonal Variations of ET in Paddy Rice Fields, South Korea

The contribution of various biophysical factors to seasonal variations of ET in regional paddy rice fields was disentangled in this paragraph. The analysis of the SEM model for daily ET during the rice-growing seasons indicated that seasonal variations were primarily related to dLAI, dVPD, dTmin and dRn (Figure 3), with the relative importance scores in the following order: dRn > dVPD > dTmin > dLAI. To take account of the potential effects of other meteorological factors such as soil temperature and daily rainfall that were not available for the gridded ET products, ground-surface measurements in the Haean, Mase, and El Saler-Sueca were supplemented. New SEM analysis based on in-situ observations showed that the daily ET was mainly controlled by dVPD and dRn, followed by dTmin and dLAI. The latter two parameters made smaller contributions to daily ET from the FFTD to the EGS. Results derived from the RS-PM model were comparable to those of SEM analysis based on EC observations. Additionally, the significantly negative and positive signs for the dVPD-dRH and dRH-dTmin relationships, respectively, were found. The causal coefficient for the dTmin-dVPD relationship was much smaller (data are not presented). Hence, the positive effects of dTmin on daily ET resulted by its influences on dRH thereby dVPD. We speculate that the significant effects of air temperature on spatial variations of RGS-ET were produced through their controls on dVPD.
In this and the following paragraphs, daily ET time series from the FFTDsat to the EGS in paddy field with two kinds of FFTDsat and biophysical mechanisms causing differences in ET variation between the rice-growing and the non-growing seasons were quantified. The seasonal pattern of daily ET was generated by taking the average of seasonal ET value in all rice paddies across South Korea. Temporal changes of daily ET in 145 DOY-first flooding paddies (145 FFTDsat) were compared with those in 121 DOY-first flooding paddies (121 FFTDsat) (Figure 5). The maximum daily ET of ~6.0 mm m−2 day−1 was recorded in the mid-season. Daily ET in two types of flooding fields fluctuated greatly from the FFTDsat to the EGS and throughout the four years. LAI rapidly increases after rice transplanting, arrived at the maximum values around mid-July (200 DOY), and decline thererafter. Seasonal daily ET change in 2012 and 2013 did not matched well with LAI development. Decoupling between daily ET and LAI in Figure 5d was consistent with EC observations in the Haean and Mase sites (Figure S6a–d).
SoS, as an indication of the rapid development of canopy leaf area, was intensively distributed between 160 DOY and 180 DOY (Figure S8 in Supplementary Materials SP6). Hence, we chose SoS at the leftmost boundary of 160 DOY as a criterion to separate the rice-growing season from the non-growing season. The non-growing season from the FFTDsat to 160 DOY was characterized by low LAI value, and thereby a large proportion of land surface was directly exposed to air. For seasonal variations of daily ET in the 121 FFTDsat paddies, the CV of ET during the non-growing season was 0.28 that was substantially lower (by 28.2%) than that during the rice-growing season ET (CV = 0.39) (the rice-growing season was from 160 DOY to the EGS) in 2011. The CVs of ET during the non-growing season in 2012, 2013, and 2014 were 0.23, 0.29, and 0.21, respectively, significantly lower than the corresponding CV of ET during the rice-growing season. Greater seasonal variations of ET during the rice-growing season compared to that during the non-growing season ET were repeatedly observed for the 145 FFTDsat paddies in the same years. The extending effects of greater spatial and seasonal variations of ET during the rice-growing season on the PF-ET were significantly minimized by advancing the FFTDsat.

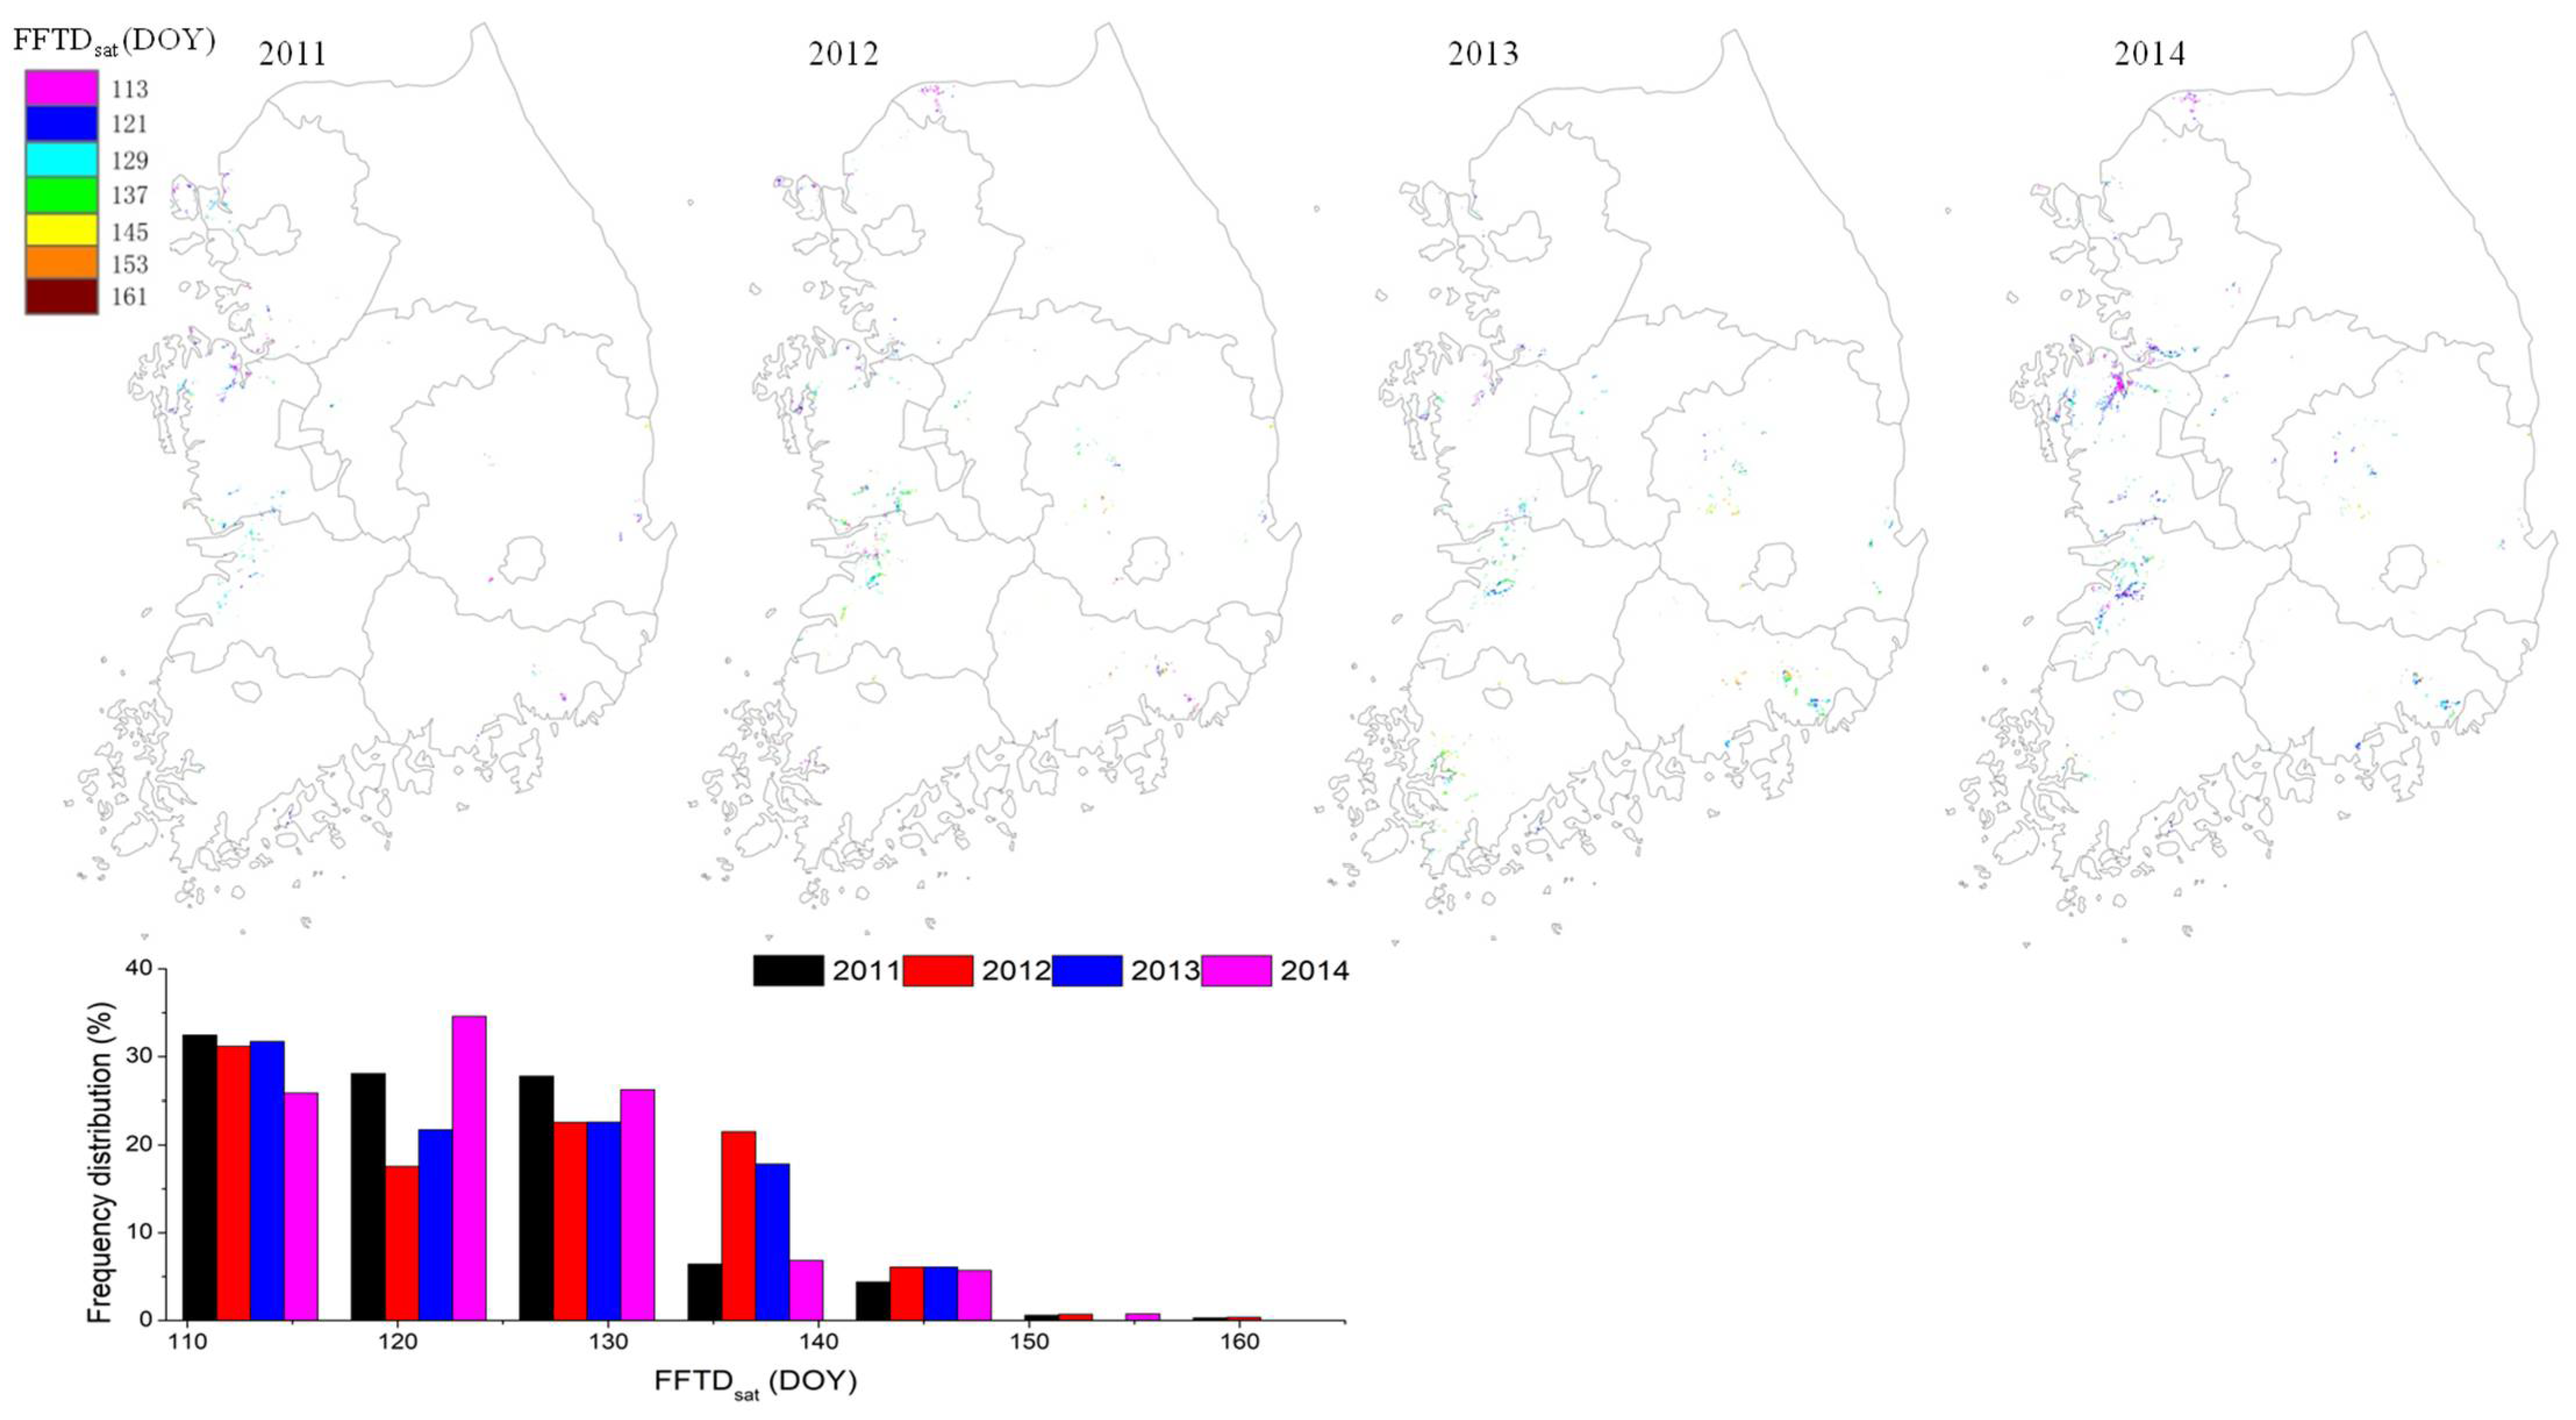
3.3. Spatial Distribution Attributes of Paddy Field FFTDsat in South Korea

Spatial distribution of the FFTDsat over paddy rice fields of South Korea was mapped in Figure 6. Each 8-day increment was marked with a different color, with color gradients marking from the beginning of May (113 DOY) to the beginning of June (161 DOY). In the case of the field irrigation management in 2011, red, blue, and cyan dots were dominant color types and the other three were interspersed with wide space. Intensive rice paddy systems were found on the midwestern plains where the elevation was lower than 100 m. Some rice paddies had the FFTDsat scheduled on 129 DOY on midwestern plains in 2011, while the FFTDsat for most rice paddies in 2012 shifted to 113 DOY and 137 DOY, as the surface areas of red and cyan dots were greater in the same area. Apparently, red, blue, and cyan dots co-existed on the mid-west plains in 2013 and 2014, indicating the range of FFTDsat from late April to the end of May; this was in agreement with our previous research reports for the same area and year (please refer to Jeong et al., 2018) [46]. Meanwhile, FFTDsat frequency distribution in Figure 6 indicated that 90% of sampling paddy fields had the FFTDsat values ranged from 110 DOY to 140 DOY, suggesting that field flooding and transplanting campaigns were intensively initiated from the end of April to the end of May in most paddy fields in South Korea.

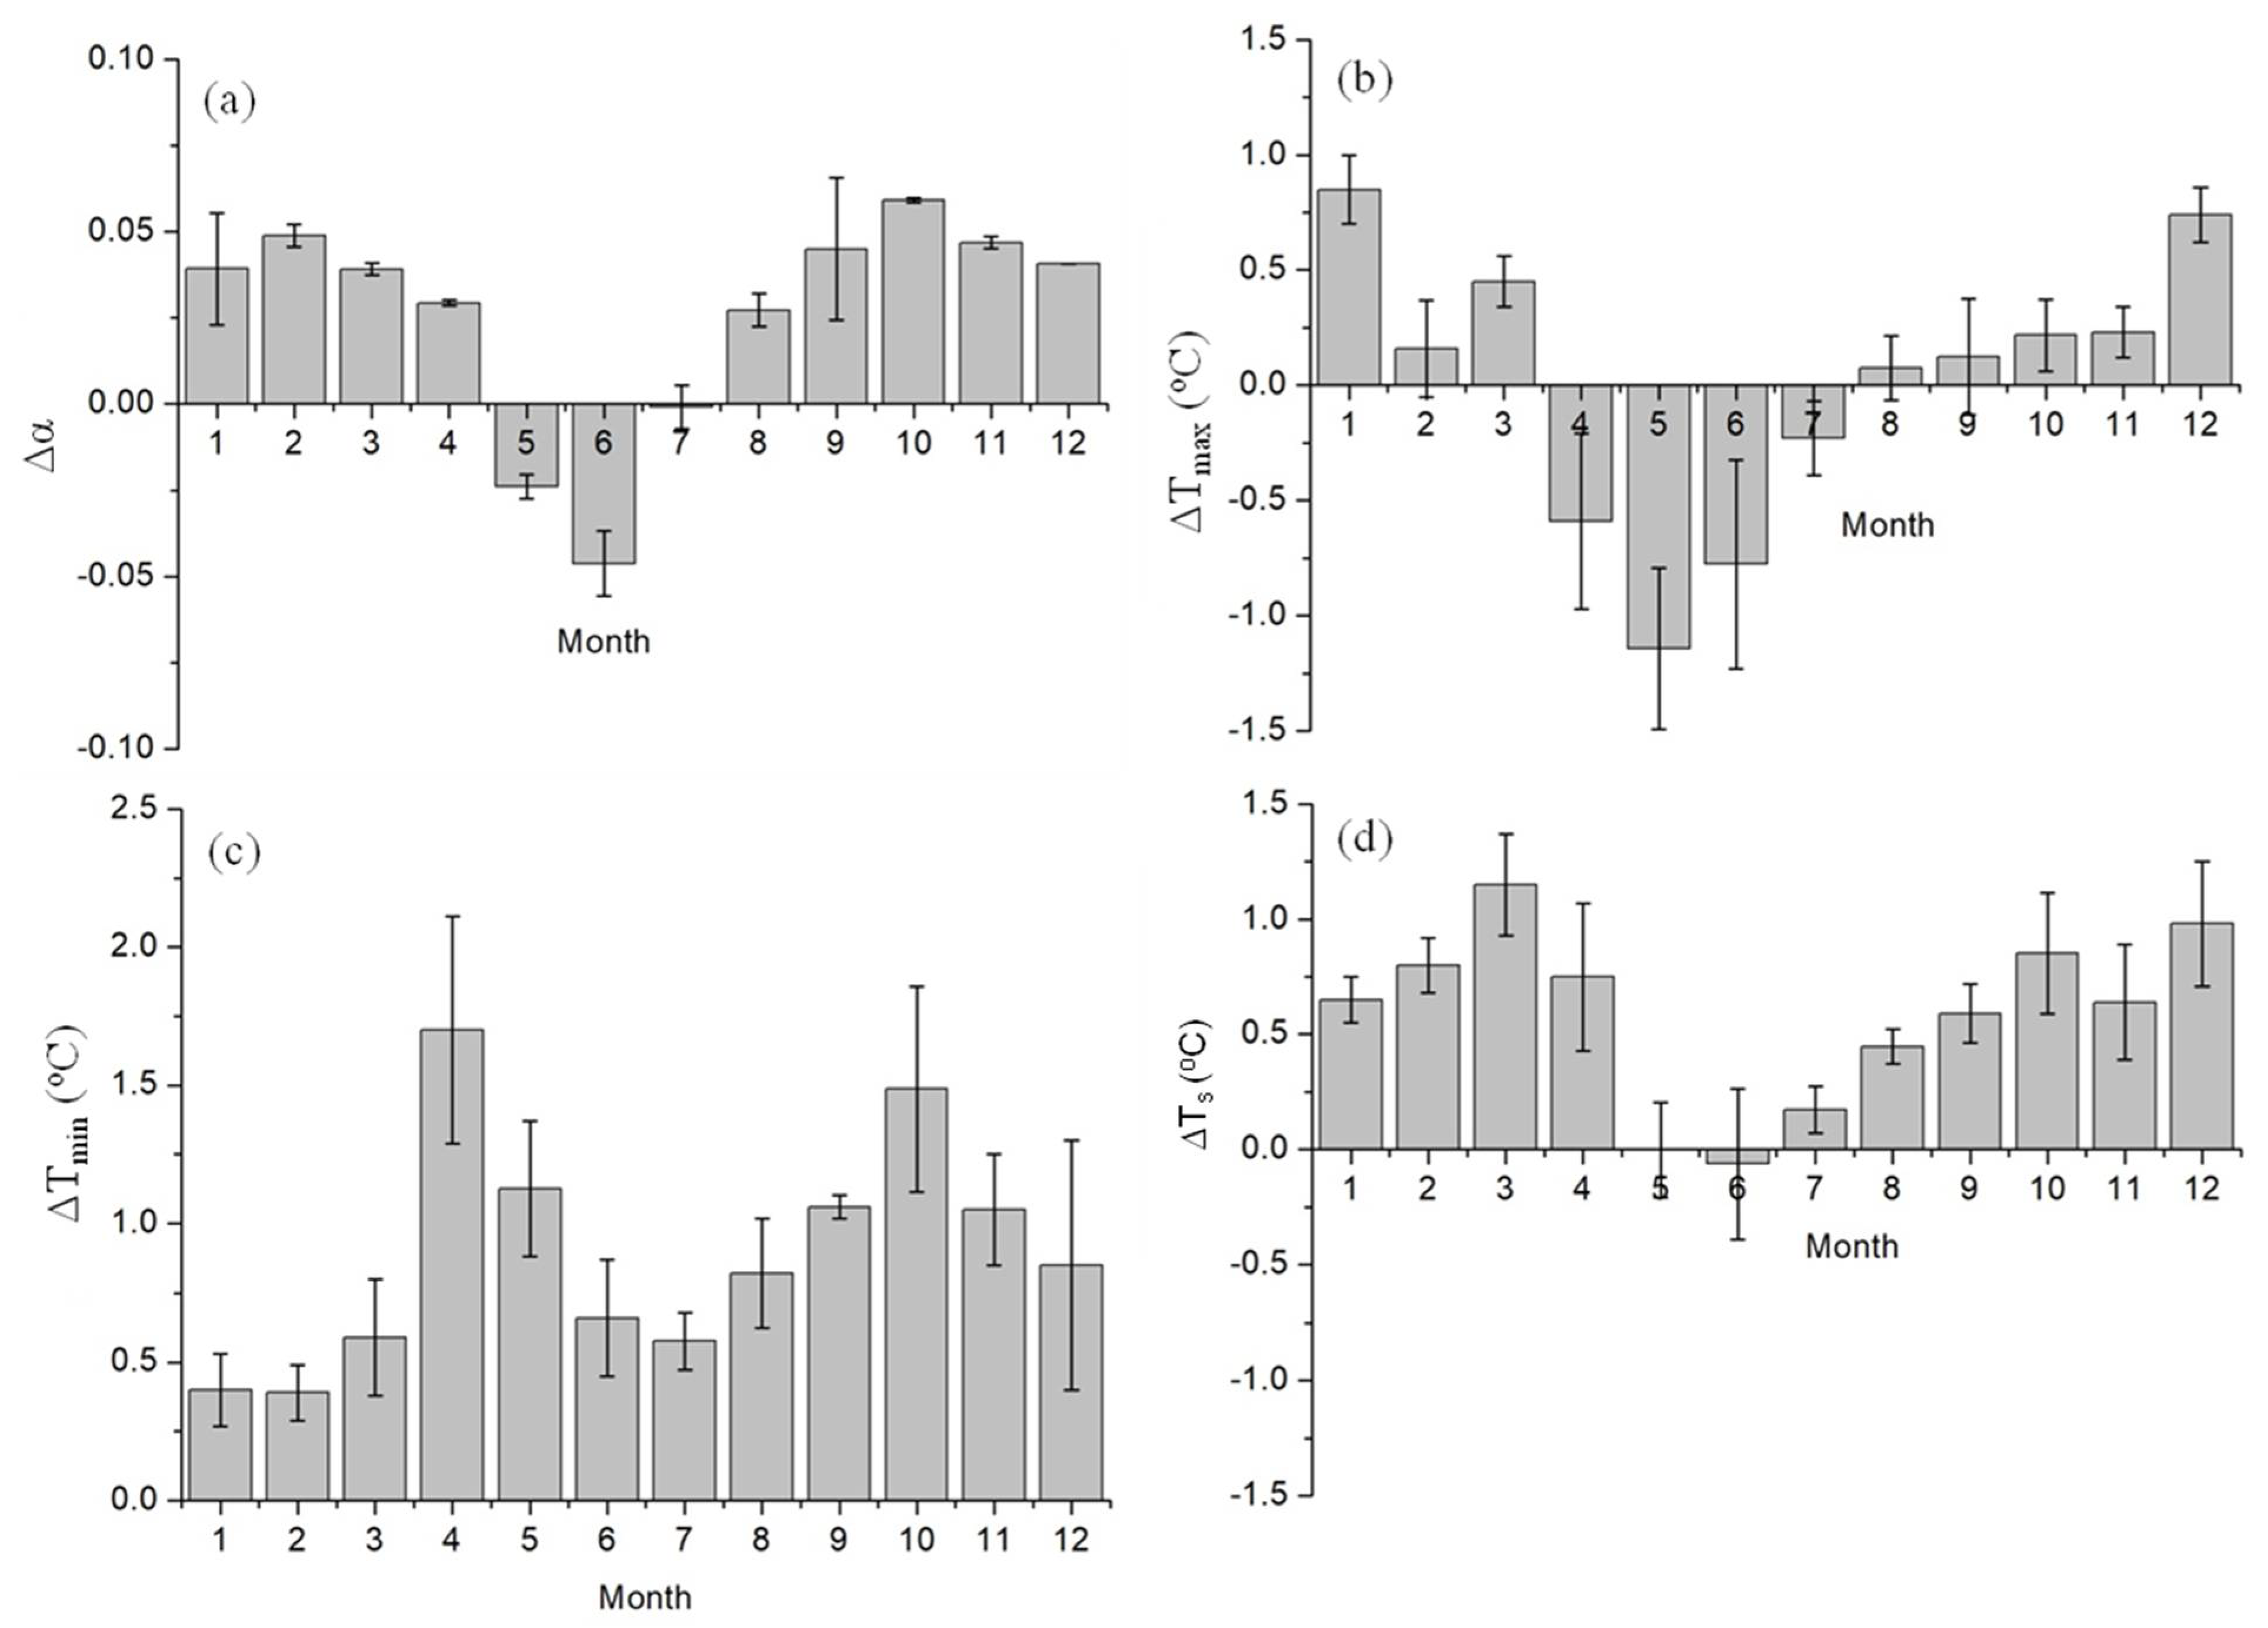
3.4. Seasonal Characteristics of ΔTs Between Paddy Rice and Temperate Forest

α, Ts, and ET are three key attributes of the land surface energy balance. α values of 113 FFTDsat paddies were 0.104 in May and 0.130 for the temperate forest (Figure S9 in Supplementary Materials SP7), causing the negative sign of Δα between them (Figure 7a). The 145 FFTDsat paddies had a higher α value (28.8%) than 113 FFTDsat fields in May, implying that advancing the FFTDsat could result in a low surface reflectance and more solar energy absorption. In June, the α value of the temperate forest increased to 0.143, while it remained at a lower level (37.1%) in the 113 FFTDsat fields, with a negative Δα (Figure 7a). The α value of 145 FFTDsat fields experienced a dramatic decline (16.4%) from May to June, as the 145 FFTDsat fields were barren/fallow in May and changed to flooding paddies thereafter in June. Large differences in α value between 113 FFTDsat and 145 FFTDsat fields in May narrowed in June without a statistical significance at 0.05 level (p-value = 0.10). From July to September, α value reached its peak (0.168), while it did not show significant differences between 113 FFTDsat and 145 FFTDsat fields thereafter (p-value > 0.05).
Intra-annual changes in the maximum/minimum air temperature difference (ΔTmax, ΔTmin, respectively) between paddy rice and the temperate forest are presented in Figure 7b,c. The monthly ΔTmax had a bottom-down bowl curve or V-shaped pattern with positive values at the start and end of the year and negative values from April to July. The lowest negative value (−1.25 °C) was recorded in May when flooding had started or finished in most paddy rice fields. The time node when the negative sign of ΔTmax shifted to positive was August. Although positive signs were found in August and September, the ΔTmax values in the two months were relatively lower than 0.25 °C. The ΔTmin value remained positive from January to the end of the year, with the highest values recorded in April and October (Figure 7c). Except for the winter, ΔTmin values were greater than 0.5 °C in the other three seasons. Taking the mean of ΔTmax and ΔTmin into consideration, seasonal changes in profiles of ΔTs were observed (Figure 7d), showing a shallow bottom-down bowl shape similar to that for the ΔTmax. However, negative ΔTs values were found in May and June, and a positive value slightly lower than 0.25 °C was observed in July, wherein ΔTmax was negative. It was obvious that the nighttime warming amplitudes in April and July outpaced the daytime cooling, resulting in the positive ΔTs values in two months.
This paragraph compared the ET values in paddy rice and the temperate forest. We cut outthe MOD16A2grid ET data for the 3 × 3 pixels surrounding the EC tower of each site. Seasonal changing profiles of 8-day ET (the sum of daily ET for every eight days) derived from three data sources (EC tower, MOD16A2 aET-actual ET, and RS-PM estimations) are shown in Figure S10 in Supplementary Materials SP7. A close correspondence in 8-day ET between EC observations and RS-PM simulations was observed. However, MOD16A2 aET products could not accurately regenerate 8-day ET of paddy rice in three sites, especially during the land preparation process and early growth stages of rice with distinct underestimations by two to three times (the shaded area in Figure S10). The daily mean ET values of the forest land derived from the MOD16A2 products were 1.85 mm m−2 day−1 in May and 3.10 mm m−2day−1 in rice paddies according to the RS-PM model and EC observations. The daily mean ET value of the temperate forest in August and September was 2.1 mm m−2 day−1 according to the MOD16A2 aET, which was higher than that of senescing rice plants, aligning with actual recognitions. Although MOD16A2 products failed to capture daily ET values of rice paddies, we confidently believe that the daily ET value of the temperate forest in May might be lower than that of flooded paddy fields, as the abundant water resources were available for rice paddies which facilitate the water loss through ET, and the forest was going through the greening stage during the spring with small green leaf surface area in canopies featured by low canopy transpiration rates. The partial flooding of paddy fields in April and the intensive flooding in May incur water loss at daytime through higher ET values, dissipating excess energy absorbed during the daytime. Relative higher ET fluxes of rice paddies in May and June caused the decline of daytime air temperature that exceeded night-time warming amplitudes, leading to strong cooling effects in May and June. The results of the present study support and interpret the H2 stating that the monthly Ts value of paddy fields was not always higher than that of the temperate forest. Increasing ET capability in August, September and October by forest ecosystems narrowed the differences in ΔTmax, which further increased the positive ΔTs value in the three months in the context of positive ΔTmin.

4. Discussion

4.1. Field-to-Field Variations of FFTDsat Among Paddy Fields

Paddy rice plains are primarily distributed in the western part of the Korean Peninsula with flat topography and a land slope of lower than 10%. Some small-scale paddy fields are located in the middle and eastern parts, where the forest is the dominant land-use type. Paddy rice areas per county quantified by the flooding single classification method had a strong correlation with national census data with R2 of up to 0.85 (Figure S11 in Supplementary Materials SP8). Differences in monthly surface albedo between 113 FFTDsat, 145 FFTDsat paddy fields, and the forest due to the initial flooding serve as important evidence to support the capability of the flooding single classification method for accurate identification of FFTDsat in paddy rice fields. Small paddy rice landholdings and their FFTD values were characterized by the flooding single classification method in paddy rice fields.
Small paddy rice landholdings in East and Southeast Asia commonly receive various irrigation and fertilizer management practices. The water requirement for land preparation is theoretically 150–200 mm, but can be as high as 650–900 mm when its duration is prolonged to 30 days [50]. Jeong et al. [18] mapped the spatial distribution of FFTDsat in paddy rice in South Korea but did not analyze the reasons. The land preparation process of paddy fields represented by the FFTDsat data started from the end of April until the beginning of June, during which the weather was moderately dry with monthly average precipitation of less than 80 mm [51], that makes it impossible to provide enough water for land preparation; thus, water sources except for precipitation are indispensable for rice land preparation. The spatial analysis for rice paddies and river/stream systems showed that approximately half of the rice paddies (52%) were located within a 3.0 km range centered on permanent river/stream systems (Figure S12a in Supplementary Materials SP9); however, another half is distributed far alway from the permanent river/stream systems. The statistical analysis for FFTDsat and the linear distance from river systems indicated no significant correlation between them (Figure S12b). Pearson’s correlations for FFTDsat and the daily air temperature averaged over a window size of 15 days ahead of the FFTDsat indicated the positive correlations between the two with correlation coefficients greater than 0.7 for all time windows in 2011 and greater than 0.93 in 2013 (Table S3). Nevertheless, significant correlations for the FFTDsat and the daily air temperature of 15-day time windows were not repeatedly presented in 2014. There was no significant correlation between FFTDsat and the air temperature before the first flooding date. It may suggest that the spatial distance of rice fields from river/stream systems may not be the main factor affecting the time of rice land preparation.
The previous study reported the effect of the observed site-to-site variations on the transplanting date due to prior adverse weather conditions such as frost risk [19]. In northern temperate areas, the rice land preparation usually starts when the daily air temperature is stably higher than 12 °C [52]. This indicates that the first flooding of paddy rice can be initiated at any day of daily air temperature stably >12 °C. As suggested by Jeong et al. [18] and Xiao et al. [29], personal preference, the empirical knowledge of individual farmers, was the key factor influencing the FFTD. However, our results showed that FFTD did not have a strong and consistent relationship with the daily air temperature during the land preparation from 2011 to 2014 (Table S3). It suggested that the air temperature in earlier days may not be the key factor considered by farmers when taking the initial flooding into account.
According to the annual statistical report for 2018 by OECD, the general service support transfers, which were linked to measures setting out enabling conditions for primary agricultural sectors through the development of water infrastructure and private or public services, amounted to 3639 million USD; thus, ranking third among the thirty-five OECD member countries [53]. Approximately, more than 80% of Korea’s paddy production is supported by over 18,000 agricultural reservoirs and 70,000 other irrigation facilities [20]. The well-maintained and accessible water infrastructure in the agricultural sector could protect cropland against water-deficit stress caused by prolonged dry periods, which might be one reason for the weak correlations between FFTD, the linear distance of rice fields from river/stream systems, and air temperature. Another reason might be the difference in the ability of seedling to tolerate cold [54]. They found the pattern of latitude-dependent variation in cold tolerance in cultivated rice. Cold-tolerant cultivars might be introduced in early spring, which could result in weak correlations between FFTD and the air temperature during the early days. Further investigation to explain why the first flooding time over space spanned a long period (i.e., from the beginning of May to the beginning of June) was useful.

4.2. Spatiotemporal Variations of ET in Paddy Fields

Several studies have been conducted on daily ET during the rice-growing season [5,6,7,9,11,12,13,14,15]. Researchers have arrived at the consensus regarding the daily ET at the initial stage of rice growth with the low leaf area index, mainly depending on climatic factors. During the mid and late-season stages in a closed canopy with a high leaf area index, transpiration through the rice leaf and stem is the dominant component of daily ET. The daily variability of ET during the two stages is considered to be dependent on climatic factors, canopy structure, and stomatal conductance. Among meteorological factors, incident solar radiation was considered to be critical, and leaf area index had a significant regulating effect on daily ET when it kept increasing. Our results showed that the daily ET during the rice-growing season was strongly correlated with the net radiation and water vapor pressure deficit; these findings were in agreement with those of other studies. Evaporation, as the main component of ET during the early growing stage and the non-growing period (from the FFTD to the SoS), was comparable to and even higher than the ET at mid-growth stage when LAI reached its maximum value. Hence, there was no considerable difference in daily ET between the non-growing period and the mid-growth stage, resulting in a weak relationship between daily ET and LAI. Seasonal effects of LAI on daily ET during the rice-growing season were concealed by meteorological factors due to the prolonged non-growing period as a result of advancing the FFTD.
The spatial variation of RGS-ET was larger than that of the PF-ET by 54.28%. Site-to-site changes in RGS-ET were primarily interpreted by the differences in LGP, gsVPD, gsTmean, gsTmin, and gsLAImax. LGP had the greatest contribution to spatial changes of RGS-ET, followed by VPD and air temperature. This finding was consistent with the results of a recent study on the spatial distribution of ET during the mid-season by Han et al. [55], who reported the temperature as an important meteorological factor. Nevertheless, the attribution of these factors to spatial variations of PF-ET followed the order of importance as follows: FFTD > SoS. Delaying the SoS and advancing the FFTD increased the PF-ET. The water loss through the evaporation from the FFTD to the SoS (i.e., the non-growing season) was the dominant component of ET since rice canopy was relative short, and a large proportion of land surface was directly exposed to the air during the non-growing season. Advancing the FFTD resulted in greater PF-ET via a prolonged day length during the non-growing season, which subsequently caused a decline in the mass proportion of RGS-ET to PF-ET. Temporal fluctuations of daily ET during the non-growing season were much smaller than those during the rice-growing season, as the relatively stable incident solar radiation was the main factor controlling daily ET during the non-growing season. Greater spatial changes in RGS-ET that were not observed for PF-ET, were alleviated by prolonging the non-growing season via advancing the FFTD. It was reasonable to infer that human activities (i.e., the varying FFTD) alleviated spatiotemporal changes in evapotranspiration, which were amplified by the climatic and phenological changes in paddy rice ecosystems.
Wang et al. [19] reported that the earlier shift of the transplanting date (−2.0 ± 4.8 days/decade) alone prolonged the LGP of early rice by 1.3 ± 5.5 days/decade. They defined LGP as the number of days from the transplanting date to the end of the growing season, different from that reported in ours and others’ studies on the flux ecology [39] and global change ecology [56]. We found a negative correlation between gsTmean and LGP (Figure S4a), namely for each one-degree increase in the daily air temperature, and a decrease in LGP by 3.4 days was observed. This was supported by the phenology growing degree days theory that the accumulation of effective heat units accelerates the phenological development and lessens the LGP [57]. The LGP in our research was not correlated with FFTD, partially due to the marginal effects of FFTD on spatial variations of the air temperature during the rice-growing season.
Bringing the FFTD towards early spring induced a great water loss via ET during the non-growing season. The earliest flooding date reported in our analysis was around 113 DOY, almost 40 days earlier than that of paddy fields, with the first flooding dates scheduled at the end of May (e.g., 150 DOY). Nevertheless, grain production was not significantly influenced by the site-to-site differences in FFTDsat (Figure S13 in Supplementary Mat SP10). On average, the amount of water loss by ET was ~3.7 mm m−2 day−1, which induced an annual unproductive water loss of 9.53 × 10⁶ tons in South Korea. We recommended that flooding the rice fields followed by seedling transplantation in mid or late May might be the controllability measures to minimize the unproductive water loss in South Korea.

4.3. Human-Induced Seasonal Perturbations of Cooling and Warming Effects in Paddy Fields

The paddy rice cropping system differs substantially from any other upland non-irrigated or irrigated croplands. The distribution characteristics of small rice paddies mosaic within agroforestry basins and the large-scale intensive cropping are believed to bring about substantial influences on seasonal and annual dynamics of surface energy budgets, thereby affecting surface climate. Non-radiative warming of annual surface temperature by 0.5 °C was observed as a result of the global assessment of the forest conversion to cropland (including paddy rice) in the mid-latitudes [2,3]. As compared to cropland, the forest land in low and mid-latitude areas was considered to reduce the land surface temperature more significantly than the crops. In our research, the effects of the flooding campaign in rice paddies on intra-annual changes of the monthly Ts were determined.
We found the difference in the monthly mean air temperatures between paddy rice and the temperate forest of −0.02 °C in May, −0.07 °C in June, and 0.15 °C in July, which were comparable to those in the temperate forest, implying a significant cooling effect of the paddy fields within the three months. Weather station observations between the wetland and alfalfa land in California reported seasonal oscillations of ΔTs between 1.0 and −1.0 °C [58]. Using station observations, Christy et al. [59] found no significant changes in time series of air temperature during the past century in the California Central Valley, on account of a counteracting effect by an approximate 3 °C decrease in the maximum near-surface temperature and a 3 °C increase in the minimum temperature. The maximum daytime air temperature in rice paddies was reduced by 1.25 °C in May, while the minimum night-time air temperature increased by 1.23 °C. The remarkable daytime cooling and night-time warming effects of rice paddies in May were also reported by Liu et al. [25] and Yu and Liu [26]. Significant daytime cooling effects were canceled out in summer and autumn from August to October. Daytime warming effects in paddy fields vs. the temperate forest in September were observed, likely due to the lower ET in senescing rice canopy and enhanced ET in the temperate forest. As suggested by Li et al. [3], the ongoing evapotranspiration at night-time in the temperate forest dissipated more energy that was absorbed during the daytime, causing an annual net cooling effect as compared to the cropland. We observed the year-round night-time warming in paddy fields compared to the temperate forest, which might be due to the ongoing evapotranspiration at night in the temperate forest.
The differences in land surface temperature are a result of changes in attributes of surface energy balance, including soil heat flux, surface albedo, roughness, and the energy partitioning between latent and sensible heat flux [22]. The soil heat flux was supposed to be neglected when it lasted over 24 h or for a longer time [43], especially in paddy fields [9,11]. Fallow lands showed substantial declines in the surface albedo and improvement of daily ET after field flooding in May and June. A reduction of 22% in surface albedo was observed in early flooded paddy fields. With lower albedo in May and June, paddy fields absorbed more shortwave radiation during the daytime, potentially leading to a warming effect. However, this net energy gain was offset by a greater latent heat loss in the form of higher ET in flooded paddy fields, resulting in a daytime cooling effect of up to 2.1 °C as compared with the non-flooded barren fields. Paddy fields with the standing water layer and an open water surface serve as a large-size water body with a high heat capacity. The high heat capacity allows the puddled fields to lose heat more slowly while still staying warm at night. If the available solar energy is more, the paddy fields receive more energy via the lower surface reflectance during the daytime, resulting in a stronger night-time warming effect. Finally, we concluded that the early flooding schemes in rice fields have gained cooling benefits in the late spring and early summer, primarily due to a significant decline in the daytime air temperature as a result of the enhanced latent heat fluxes through ET.

5. Conclusions

The spatial analysis technique based on earth observations and numerical analyses is a relatively new approach to explore the spatiotemporal patterns of vegetation ET at large spatial scales. In our research, a data fusion technique that integrated earth observations (i.e., the MODIS surface reflectance, albedo and daily ground surface climate datasets) and numerical algorithms (i.e., the flooding single paddy rice classification method and the RS-PM model) provided us with new insights. A large number of studies have found seasonal cooling effects of paddy rice in Northeast and Southeast China, especially in May and June [25,26,27,28]. They reported that changes in cropland structure from the rain-fed farmland to the paddy field could profoundly modify land-surface thermal processes. Significant cooling effects of paddy rice in May and June were also found in South Korea in our research. Results in our study quantified the relative importance and contributions of biophysical factors to regional variations of ET and seasonal effects of temperature fluctuations in paddy fields, which advances our understandings of the impacts of land use and management change on regional climate change.
Results revealed that the spatial variations of PF-ET were substantially lower than those of RGS-ET. SoS and FFTDsat were the most important factors responsible for the spatial variations of PF-ET, while LGP, gsVPD, gsTmean, gsTmin, and gsLAImax were predominant factors controlling spatial variations of RGS-ET. Spatial variations of PF-ET that were not as high as those of RGS-ET were mainly attributed to bringing the FFTDsat forward, as it prolonged the non-growing season during which the variation of daily ET was much lower than that during the rice-growing season. There was a significant cooling effect by early flooding in paddy fields compared to the temperate forest, primarily due to the large decline in maximum daytime air temperature. The magnitude of the monthly cooling effect in paddy fields was equal to that of the temperature forest, especially from May to June. Human activity-induced cooling effects in paddy fields showed equal importance as compared to the temperate forest, which could largely mask the ongoing global warming in spring. Further field studies designed to evaluate the social and biophysical factors influencing the site-to-site differences in FFTD in paddy fields across space would be useful, especially for deepening our understandings of spatiotemporal variations of ET in regional paddy fields and their impacts on climate change.

Supplementary Materials

The following are available online at https://0-www-mdpi-com.brum.beds.ac.uk/article/10.3390/rs13193992/s1, Figure S1: 5-m resolution raster image of main land-cover types in 2011, South Korea; Figure S2: Annual changes of paddy rice land use in main rice plain of Western Korea; Figure S3: Comparisons between map of MODIS potential paddy pixels and map of paddy rice land use and cover at 5-m spatial resolution; Figure S4: (a) Linear correlation between the length of growing period (LGP, days) and mean air temperature of the rice-growing season (gsTmean, °C) and (b) effects of the field first flooding and transplanting date detected by satellite observations (FFTDsat) on the LGP; Statistical correlations between (a) ln(NDVI) and ln(LAI), (b) ln(EVI) and ln(LAI), (c) ln(OSAVI) and ln(LAI) in paddy fields in South Korea; Table S1: Selected equations involved in the GRAMI-rice model and its description; Table S2: Climate conditions at Haean (South Korea), Mase (Japan), and El Saler-Sueca (Spain); Figure S6: Seasonal changing courses of daily ET derived from EC systems installed in Haean, Mase, El Saler-Suecasites and the optimized RS-PMrs=120 model simulation for each site and year; Figure S7: Comparisons between predictions and observations of daily ET and grain yield in Japan_Mase, Korea_Haean, Spain_El Saler-Sueca, and Korean_Gwangju; Figure S8: Histogram charts of growing season onset (SoS) in paddy fields. Each seasonal metric corresponding to one flood date was the mean over 2011-2014; Figure S9: Surface albedo (α) responses to land cover and management change; Figure S10: Comparisons of 8-day ET of paddy fields in Haean, Mase, and El Saler-Sueca between EC observations, MOD16A2 products (aET and pET: actual ET and potential ET), and RS-PMrs=120 simulations; Figure S11: Comparison in paddy rice area per county between national statistic census and estimations by the flooding single-based classification method; Table S3: Pearson correlations for the first flooding and transplanting date estimated by satellite observations (FFTDsat) and daily air temperature over different time windows; Figure S12: (a) Percentage of rice paddy with buffer distance away from permanent river/stream systems and (b) spatial correlation for the first flooding and transplanting date (FFTDsat) and linear distance away from river/stream systems; Figure S13: Effects of the first flooding and transplanting date (FFTDsat) on grain yield, PF-ET and WUEagro in 2011, 2012, 2013 and 2014, South Korea.

Author Contributions

W.X.: conceptualization, funding acquisition, investigation, methodology, supervision, writing—original draft; S.J., J.K. and J.-M.Y.: data curation, writing—review and editing. All authors have read and agreed to the published version of the manuscript.

Funding

This work was financially supported by the Fundamental Research Funds for the Central Universities (lzujbky-2020-28), the National Natural Science Foundation of China (32001129), 111 Programme (BP0719040) and the Tanchi Hundred Talent Program of Xinjiang Uygur Autonomous Region of China (2017).

Institutional Review Board Statement

Not applicable.

Informed Consent Statement

Not applicable.

Data Availability Statement

Data supporting reported results can be accessed vis directly contacting the correspondence author.

Acknowledgments

We acknowledge the help in the field by Seung Hyun Jo, Toncheng Fu, Mijeong Kim and Jinsil Choi at Chonnam National University.

Conflicts of Interest

The authors have no competing interest to declare.

References

  1. FAOSTAT. Statistical Database of the Food and Agricultural Organization of the United Nations. 2017. Available online: http://www.fao.org/statistics/en/ (accessed on 25 August 2021).
  2. Bright, R.M.; Davin, E.L.; Ohalloran, T.L.; Pongratz, J.; Zhao, K.; Cescatti, A. Local temperature response to land cover and management change driven by non-radiative processes. Nat. Clim. Chang. 2017, 7, 296–302. [Google Scholar] [CrossRef]
  3. Li, Y.; Zhao, M.; Motesharrei, S.; Mu, Q.; Kalnay, E.; Li, S. Local cooling and warming effects of forests based on satellite observations. Nat. Commun. 2015, 6, 6603. [Google Scholar] [CrossRef] [PubMed] [Green Version]
  4. De Datta, S.K. Principles and Practices of Rice Production; IRRI: Los Banos, Philippines, 1981; p. 618. [Google Scholar]
  5. Sakuratani, T.; Horie, T. Studies on Evapotranspiration from Crops (1) On seasonal changes, varietal differences and the simplified methods of estimate in evapotranspiration of paddy rice. J. Agric. Meteorol. 1985, 41, 45–55. [Google Scholar] [CrossRef]
  6. Tyagi, N.K.; Sharma, D.K.; Luthra, S.K. Determination of evapotranspiration and crop coefficients of rice and sunflower with lysimeter. Agric. Water Manag. 2000, 45, 41–54. [Google Scholar] [CrossRef]
  7. Vu, S.H.; Watanabe, H.; Takagi, K. Application of FAO-56 for evaluating evapotranspiration in simulation of pollutant runoff from paddy rice field in Japan. Agric. Water Manag. 2005, 76, 195–210. [Google Scholar] [CrossRef]
  8. Zhao, X.; Huang, Y.; Jia, Z.; Liu, H.; Song, T.; Wang, Y.; Shi, L.; Song, C.; Wang, Y. Effects of the conversion of marshland to crop land on water and energy exchanges in northeastern China. J. Hydrol. 2008, 355, 181–191. [Google Scholar] [CrossRef]
  9. Alberto, M.C.R.; Wassmann, R.; Hirano, T.; Miyata, A.; Hatano, R.; Kumar, A.; Padre, A.; Amante, M. Comparisons of energy balance and evapotranspiration between flooded and aerobic rice fields in the Philippines. Agric. Water Manag. 2011, 98, 1417–1430. [Google Scholar] [CrossRef]
  10. Alberto, M.C.R.; Buresh, R.J.; Hirano, T.; Miyata, A.; Wassmann, R.; Quilty, J.R.; Correa Jr, T.Q.; Sandro, J. Carbon uptake and water productivity for dry-seeded rice and hybrid maize grown with overhead sprinkler irrigation. Field Crop. Res. 2013, 146, 51–65. [Google Scholar] [CrossRef]
  11. Timm, A.U.; Roberti, D.R.; Streck, N.A.; de Goncalves, L.G.G.; Acevedo, O.C.; Moraes, O.L.L.; Moreira, V.S.; Degrazia, G.A.; Ferlan, M.; Toll, D.L. Energy partitioning and evapotranspiration over a rice paddy in southern Brazil. J. Hydrometeorol. 2014, 15, 1975–1988. [Google Scholar] [CrossRef]
  12. Nay-Htoon, B.; Xue, W.; Lindner, S.; Cuntz, M.; Ko, J.; Tenhunen, J.; Werner, C.; Dubbert, M. Quantifying differences in water and carbon cycling between paddy and rain fed rice (Oryzasativa L.) by flux partitioning. PLoS ONE 2018, 13, e0195238. [Google Scholar] [CrossRef] [Green Version]
  13. Diaz, M.B.; Roberti, D.R.; Carneiro, J.V.; Souza, V.D.A.; de Moraes, O.L.L. Dynamics of the superficial fluxes over a flooded rice paddy in southern Brazil. Agric. For. Meteorol. 2019, 276–277, 107650. [Google Scholar] [CrossRef]
  14. Liu, B.; Cui, Y.; Luo, Y.; Shi, Y.; Liu, M.; Liu, F. Energy partitioning and evapotranspiration over a rotated paddy field in Southern China. Agric. For. Meteorol. 2019, 276–277, 107626. [Google Scholar] [CrossRef]
  15. Wei, Z.; Lee, X.; Wen, X.; Xiao, W. Evapotranspiration partitioning for three agro-ecosystems with contrasting moisture conditions: A comparison of an isotope method and a two-source model calculation. Agri. For. Meteorol. 2018, 252, 296–310. [Google Scholar] [CrossRef]
  16. Pookpakdi, A. Sustainable Agriculture for Small-Scale Farmers: A Farming Systems Perspective; Extension Bulletin; Food and Fertilizer Technology Center: Taipei, Taiwan, 1992. [Google Scholar]
  17. Seo, B.; Bogner, C.; Poppenborg, P.; Martin, E.; Hoffmeister, M.; Jun, M.; Koellner, T.; Reineking, B.; Shope, C.L.; Tenhunen, J. Deriving a per-field land use and land cover map in an agricultural mosaic catchment. Earth Syst. Sci. Data 2014, 6, 339–352. [Google Scholar] [CrossRef] [Green Version]
  18. Jeong, S.; Kang, S.; Jang, K.; Lee, H.; Hong, S.; Ko, D. Development of variable threshold models for detection of irrigated paddy rice fields and irrigation timing in heterogeneous land cover. Agric. Water Manag. 2012, 115, 83–91. [Google Scholar] [CrossRef]
  19. Wang, X.; Ciais, P.; Li, L.; Ruget, F.; Vuichard, N.; Viovy, N.; Zhou, F.; Chang, J.; Wu, X.; Zhao, H. Management outweighs climate change on affecting length of rice growing period for early rice and single rice in China during 1991–2012. Agric. For. Meteorol. 2017, 233, 1–11. [Google Scholar] [CrossRef] [Green Version]
  20. Cho, G.H.; Ahmad, M.L.; Lee, S.; Choi, K.S.; Nam, W.H.; Kwon, H.J. Influence mechanism of climate change on paddy farming practices and irrigation water demand. Paddy Water Environ. 2019, 17, 359–371. [Google Scholar] [CrossRef]
  21. Bhuiyan, S.I.; Sattar, M.A.; Khan, M.A.K. Improving water use efficiency in rice through wet seeding. Irrig. Sci. 1995, 16, 1–8. [Google Scholar] [CrossRef]
  22. Lee, X.; Goulden, M.L.; Hollinger, D.Y.; Barr, A.; Black, T.A.; Bohrer, G.; Bracho, R.; Drake, B.; Goldstein, A.; Gu, L.; et al. Observed increase in local cooling effect of deforestation at higher latitudes. Nature 2011, 479, 384–387. [Google Scholar] [CrossRef]
  23. Duveiller, G.; Hooker, J.; Cescatti, A. The mark of vegetation change on Earth’s surface energy balance. Nat. Commun. 2018, 9, 679. [Google Scholar] [CrossRef] [Green Version]
  24. Lobell, D.; Bala, G.; Mirin, A.; Phillips, T.; Maxwell, R.; Rotman, D. Regional differences in the influence of irrigation on climate. J. Clim. 2009, 22, 2248–2255. [Google Scholar] [CrossRef]
  25. Liu, T.; Yu, L.; Bu, K.; Yan, F.; Zhang, S. Seasonal local temperature responses to paddy field expansion from rain-fed farmland in the cold and humid Sanjiang Plain of China. Remote Sens. 2018, 10, 2009. [Google Scholar] [CrossRef] [Green Version]
  26. Yu, L.X.; Liu, T.X. The impact of artificial wetland expansion on local temperature in the growing season—The case study of the Sanjiang Plain, China. Remote Sens. 2019, 11, 2915. [Google Scholar] [CrossRef] [Green Version]
  27. Pan, T.; Zhang, C.; Kuang, W.; Luo, G.; Du, G.; Yin, Z. Large-scale rain-fed to paddy farmland conversion modified land-surface thermal properties in Cold China. Sci. Total Environ. 2020, 722, 137917. [Google Scholar] [CrossRef]
  28. Chiueh, Y.-W.; Tan, C.-H.; Hsu, H.-Y. The value of a decrease in temperature by one degree celsius of the regional micro climate—The cooling effect of the paddy field. Atmosphere 2021, 12, 353. [Google Scholar] [CrossRef]
  29. Xiao, X.; Boles, S.; Liu, J.; Zhuang, D.; Frolking, S.; Li, C.; Salas, W.; Moore, B. Mapping paddy rice agriculture in southernChina using multi-temporal MODIS images. Remote Sens. Environ. 2005, 95, 480–492. [Google Scholar] [CrossRef]
  30. Huete, A.; Didan, K.; Miura, T.; Rodriguez, E.P.; Gao, X.; Ferreira, L.G. Overview of the radio metric and biophysical performance of the MODIS vegetation indices. Remote Sens. Environ. 2002, 83, 195–213. [Google Scholar] [CrossRef]
  31. Rouse, J.W.; Haas, R.H.; Schell, J.A.; Deering, D.W.; Harlan, J. Monitoring the Vernal Advancements and Retrogradation of Natural Vegetation; Final Report; NASA/GSFC: Greenbelt, MD, USA, 1974; pp. 1–137. [Google Scholar]
  32. Rondeaux, G.; Steven, M.; Baret, F. Optimization of soil-adjusted vegetation indices. Remote Sens. Environ. 1996, 55, 95–107. [Google Scholar] [CrossRef]
  33. Zhang, G.; Xiao, X.; Dong, J.W.; Xin, F.F.; Zhang, Y.; Qin, Y.W.; Doughty, R.B.; Moore, B. Fingerprint of rice paddies in spatial-temporal dynamics of atmospheric methane concentration in monsoon Asia. Nat. Commun. 2020, 11, 554. [Google Scholar] [CrossRef] [Green Version]
  34. Jönsson, P.; Eklundh, L. Seasonality extraction by function fitting to time-series of satellite sensor data. IEEET. Geosci. Remote Sens. 2002, 40, 1824–1832. [Google Scholar] [CrossRef]
  35. Jönsson, P.; Eklundh, L. TIMESAT—A program for analyzing time-series of satellite sensor data. Comput. Geosci. 2004, 30, 833–845. [Google Scholar] [CrossRef] [Green Version]
  36. Gao, F.; Morisette, J.T.; Wolfe, R.E.; Ederer, G.; Pedelty, J.; Masuoka, E.; Myneni, R.; Tan, B.; Nightingale, J. Analgorithm to produce temporally and spatially continuous MODIS-LAI time-series. IEEE Geosci. Remote. Sens. Lett. 2008, 5, 60–64. [Google Scholar] [CrossRef]
  37. Boschetti, M.; Stroppiana, D.; Brivio, P.; Bocchi, S. Multi-year monitoring of rice crop phenology through time series analysis of MODIS images. Int. J. Remote Sens. 2009, 30, 4643–4662. [Google Scholar] [CrossRef]
  38. Son, N.; Chen, C.; Chang, L.; Chen, C.; Sobue, S.; Minh, V.; Chiang, S.; Nguyen, L.; Lin, Y.; Dinh, M. A logistic-based method for rice monitoring from multi-temporal MODIS-Lands at fusion data. Eur. J. Remote Sens. 2016, 49, 39–56. [Google Scholar] [CrossRef] [Green Version]
  39. Wu, C.; Gonsamo, A.; Gough, C.M.; Chen, J.M.; Xu, S. Modeling growing season phenology in North American forests using seasonal mean vegetation indices from MODIS. Remote Sens. Environ. 2014, 147, 79–88. [Google Scholar] [CrossRef]
  40. Xue, W.; Lindner, S.; Dubbert, M.; Otieno, D.; Ko, J.; Muraoka, H.; Werner, C.; Tenhunen, J. Supplement understanding of the relative importance of biophysical factors in determination of photosynthetic capacity and photosynthetic productivity inrice ecosystems. Agric. For. Meteorol. 2017, 232, 550–565. [Google Scholar] [CrossRef]
  41. Beck, P.S.A.; Atzberger, C.; Hogda, K.A.; Johansen, B.; Skidmore, A.K. Improved monitoring of vegetation dynamics at very high latitudes: A new method using MODISNDVI. Remote Sens. Environ. 2006, 100, 321–334. [Google Scholar] [CrossRef]
  42. Gonsamo, A.; Chen, J.M.; Price, D.T.; Kurz, W.A.; Wu, C. Land surface phenology from optical satellite measurement and CO2 eddy covariance technique. J. Geophys. Res. 2012, 117. [Google Scholar] [CrossRef]
  43. Allen, R.G.; Pereira, L.S.; Raes, D.; Smith, M. Crop evapo transpiration-Guidelines for computing crop water requirements FAO Irrigation and rain age paper 56. Irrig. Drain. 1998, 300, D05109. [Google Scholar]
  44. Confalonieri, R.; Bregaglio, S.; Rosenmund, A.S.; Acutis, M.; Savin, I. Amodel for simulating the height of rice plants. Eur. J. Agron. 2011, 34, 20–25. [Google Scholar] [CrossRef]
  45. Yeom, J.M.; Seo, Y.K.; Kim, D.S.; Han, K.S. Solar radiation received by slopes using COMS imagery, aphysically based radiation model, and GLOBE. J. Sens. 2016, 2016, 4834579. [Google Scholar] [CrossRef] [Green Version]
  46. Jeong, S.; Ko, J.; Yeom, J.M. National wide projection of rice yield using a crop model integrated with geostationary satellite imagery: A case study in South Korea. Remote Sens. 2018, 10, 1665. [Google Scholar] [CrossRef] [Green Version]
  47. Abers, S.C.; McGinley, J.A.; Birkenheour, D.L.; Smart, J.R. The Local Analysis and Prediction System: Analysis of clouds, precipitation, and temperature. Weather Forecast 1996, 11, 273–287. [Google Scholar] [CrossRef] [Green Version]
  48. Kurmangozhnov, A.; Xue, W.; Li, X.; Zeng, F.; Sabit, R.; Tusun, T. High biomass production with abundant leaf litter falliscritical to amelio rating soil quality and productivity in reclaimed sandy desertification land. J. Environ. Manag. 2020, 263, 110373. [Google Scholar] [CrossRef]
  49. R Core Team. R: A Language and Environment for Statistical Computing; R Foundationfor Statistical Computing: Vienna, Austria, 2020; Available online: https://www.R-project.org/ (accessed on 25 August 2021).
  50. Bouman, B.A.M.; Tuong, T.P. Field water management to save water and increase its productivity in irrigated lowland rice. Agric. Water Manag. 2001, 49, 11–30. [Google Scholar] [CrossRef]
  51. Choi, I.C.; Shin, H.J.; Nguyen, T.T.; Tenhunen, J. Water policy reforms in South Korea: A historical review and ongoing challenges for sustainable water governance and management. Water 2017, 9, 717. [Google Scholar] [CrossRef] [Green Version]
  52. Yoshida, S. Rice Crop Science; The International Rice Research Institute: Manila, Philippines, 1981; p. 279. [Google Scholar]
  53. Organisation for Economic Co-operationand Development (OECD). 2018. Available online: https://data.oecd.org/agrpolicy/agricultural-support.htm (accessed on 25 August 2021).
  54. Xie, H.J.; Han, Y.H.; Li, X.L.; Dai, W.M.; Song, X.L.; Olsen, K.M.; Qiang, S. Climate-depend entvariation in cold tolerance of weedy rice and rice mediated by OsICE1 promoter methylation. Mol. Ecol. 2019, 29, 121–137. [Google Scholar] [CrossRef]
  55. Han, H.; Cui, Y.; Wang, S.; Duan, Q.; Zhang, L. Impacts of the channel/barrier effect and three-dimension alclimate-A case study of rice water requirement and irrigation quota in Yunnan, China. Agric. Water Manag. 2019, 212, 317–327. [Google Scholar] [CrossRef]
  56. Cleland, E.E.; Chuine, I.; Menzel, A.; Mooney, H.A.; Schwartz, M.D. Shifting plant phenology in response to global change. Trends Ecol. Evol. 2007, 22, 357–365. [Google Scholar] [CrossRef]
  57. Bouman, B.A.M.; Kropff, M.J.; Tuong, T.P.; Wopereis, M.C.S.; Berge, H.F.M.; Laar, H.H. Oryza 2000: Modeling Lowland Rice; IRRI: Los Baños, Philippines, 2001; p. 241. [Google Scholar]
  58. Hemes, K.S.; Eichelmann, E.; Chamberlain, S.D.; Knox, S.H.; Oikawa, P.Y.; Sturtevant, C.; Verfaillie, J.; Szutu, D.; Baldocchi, D.D. Aunique combination of aerodynamic and surface properties contribute to surface cooling in restored wetlands of the Sacramento-San Joaquin Delta, California. J. Geophys. Res. Biogeo. 2018, 123, 2072–2090. [Google Scholar] [CrossRef]
  59. Christy, J.R.; Norris, W.B.; Redmond, K.; Gallo, K.P. Methodology and results of calculating central California surface temperature trends: Evidence of human-induced climate change? J. Clim. 2006, 19, 548–563. [Google Scholar] [CrossRef] [Green Version]
Figure 1. The schematic route of earth observations and numerical simulations to evaluate two hypotheses through correlation analysis among geographical variations of ET, Ts, and biophysical factors. meteo.: daily meteorological variables of ground surface [i.e., daily incident solar radiation (MJ m−2 day−1), daily maximum and minimum air temperatures (°C), relative humidity (%), and wind speed grid data (m s−1)]; VIs: vegetation indices; LAI: leaf area index (m2 m−2); Kcb: transpiration coefficient; ET: evapotranspiration (mm m−2 day−1); EC: eddy covariance system; obs.: field observations.
Remotesensing 13 03992 g001
Figure 2. Multi-site evaluations of the FAO-56PM model of the pixel-based RS-PM model with the constant aerodynamic resistance (ra) of 208.0/WS for varying bulk surface resistances values (rs), ranging from 20, 50, and 80 to 120 s m−1 and varying ra values with a constant rs value of 120 s m−1 in the Haean in South Korea in 2010, Mase in Japan from 2002 to 2005, and El Saler-Sueca in Spain from 2007 to 2008. R2: the determination coefficient; RMSE: the root mean square error (mm m−2 day−1); WS: wind speed (m s−1).
Remotesensing 13 03992 g002
Figure 3. Apath diagram presenting significant relationships and the causal direction for the paddy field total ET (PF-ET, the sum of daily ET from the FFTDsat to the EGS, mm m−2), and the rice-growing season total ET (RGS-ET, the sum of daily ET from the SoS to the EGS, mm m−2), with various biophysical factors, including the growing season onset of rapid canopy expansion (SoS, DOY), the first date of field flooding and transplanting identified by satellite observations (FFTDsat, DOY), the length of the growing period (LGP, days), the mean vapor pressure deficit (gsVPD, kPa) during the growing season, the daily mean air temperature (gsTmean, °C) during the growing season, the mean minimum air temperature (gsTmin, °C) during the growing season, the maximum leaf area index (gsLAImax, m2 m−2) during the growing season, the daily net radiation over the rice-growing season (dRn, MJ m−2 day−1), the daily VPD(dVPD, kPa), the daily Tmin (dTmin, °C), the daily LAI (dLAI, m2 m−2), the daily relative humidity (dRH, %) and the daily precipitation (dP, mm). Numerical value attached to the arrow symbol was path coefficient. Green (blue) sign indicated a positive (negative) correlation. DOY: the day of year.
Remotesensing 13 03992 g003
Figure 4. Spatial variations of paddy field total ET (PF-ET) and the rice-growing season total ET (RGS-ET) from 2011 to 2014 in South Korea. PF-ET: the sum of daily ET from the FFTDsat to the EGS (mm m−2); RGS-ET: the sum of daily ET from the SoS to the EGS (mm m−2); CV: the coefficient of variation. EGS: the seasonal onset of the rapid canopy expansion (DOY); FFTDsat: the first flooding and transplanting date detected by satellite remote sensing (DOY); DOY: the day of year.
Remotesensing 13 03992 g004
Figure 5. Seasonal courses of daily ET (mm m−2 day−1) in paddy fields in which the first dates of field flooding and transplanting (FFTDsat) were 121 DOY and 145 DOY in 2011 (a), 2012 (b), 2013 (c), and 2014 (d). DOY: the day of year.
Remotesensing 13 03992 g005
Figure 6. The spatial distribution map of the first date of field flooding and transplanting detected by satellite observations (FFTDsat) and FFTDsat frequency distribution map in paddy rice fields in South Korea from 2011 to 2014. DOY: the day of year.
Remotesensing 13 03992 g006
Figure 7. Seasonal perturbations of monthly Δα (a), ΔTmax (b), ΔTmin (c) and ΔTs (d) values between paddy fields and the temperate deciduous forest in South Korea. Datasets used were averaged over four years 2011–2014.
Remotesensing 13 03992 g007
Table 1. The sensitivity analysis indicated the effects of parameterization themes of different models on daily ET estimates (mm m−2 day−1). The background environment in scenario 1 included incident solar radiation (Rs↓) of 19.0 MJ m−2 day−1, daily relative humidity (RH) of 70% and the flooded bare land. Other model parameters were set at optimal levels except for the one used for the specific scenario analysis. In scenario 2, to evaluate the effects of canopy resistance (rs, s m−1), Rs↓ was set at 19.0 MJ m−2 day−1, with daily RH of 70%, surface albedo of 0.18, and leaf area index (LAI) of 4.0 m2 m−2. In scenario 3, there were the same climate variables as in scenario 1 but with variying Kcb values.
Scenario 1: raScenario 2: rsScenario 3: Kcb
2060120501202400.580.30
Tdaytime = 20 °C
Tnight = 15 °C
4.093.923.684.013.823.673.821.91
Tdaytime = 25 °C
Tnight = 20 °C
4.204.033.824.424.224.054.222.23
Tdaytime = 30 °C
Tnight = 25 °C
4.174.023.824.804.594.404.592.29
Tdaytime = 35 °C
Tnight = 30 °C
4.023.883.715.154.944.734.942.47
Publisher’s Note: MDPI stays neutral with regard to jurisdictional claims in published maps and institutional affiliations.

