Article

Day–Night Monitoring of Volcanic SO2 and Ash Clouds for Aviation Avoidance at Northern Polar Latitudes

by
Nickolay Krotkov
1,*,
Vincent Realmuto
2,
Can Li
3,
Colin Seftor
4,
Jason Li
4,
Kelvin Brentzel
5,
Martin Stuefer
6,
Jay Cable
7,
Carl Dierking
7,
Jennifer Delamere
7,
David Schneider
8,
Johanna Tamminen
9,
Seppo Hassinen
9,
Timo Ryyppö
10,
John Murray
11,
Simon Carn
12,
Jeffrey Osiensky
13,
Nate Eckstein
13,
Garrett Layne
14 and
Jeremy Kirkendall
15
1
Atmospheric Chemistry and Dynamics Laboratory, NASA Goddard Space Flight Center, Greenbelt, MD 20771, USA
2
Jet Propulsion Laboratory, California Institute of Technology, Pasadena, CA 91109, USA
3
Earth System Science Interdisciplinary Center, University of Maryland, College Park, MD 20742, USA
4
Ozone Science Investigator Processing Facility, Science Systems and Applications, Inc., Lanham, MD 20706, USA
5
Direct Readout Laboratory, NASA Goddard Space Flight Center, Greenbelt, MD 20771, USA
6
Geophysical Institute, University of Alaska Fairbanks, Fairbanks, AK 99775, USA
7
Geographic Information Network of Alaska, University of Alaska Fairbanks, Fairbanks, AK 99775, USA
8
Alaska Volcano Observatory, U.S. Geological Survey, Anchorage, AK 99775, USA
9
Finnish Meteorological Institute, 00100 Helsinki, Finland
10
Sodankylä Satellite Data Centre, FMI, 00100 Helsinki, Finland
11
NASA Langley Research Center, Hampton, VA 23666, USA
12
Geological and Mining Engineering and Sciences, Michigan Technological University, Houghton, MI 49931, USA
13
Anchorage VAAC/AAWU, Anchorage, AK 99501, USA
14
NASA Earth Applied Sciences Disasters Program, Headquarters, Washington, DC 20001, USA
15
Environmental Systems Research Institute, Louisville, CO 40018, USA
*
Author to whom correspondence should be addressed.
Remote Sens. 2021, 13(19), 4003; https://0-doi-org.brum.beds.ac.uk/10.3390/rs13194003
Submission received: 25 August 2021 / Revised: 21 September 2021 / Accepted: 25 September 2021 / Published: 6 October 2021
(This article belongs to the Special Issue Remote Sensing for Near-Real-Time Disaster Monitoring)

Abstract

:
We describe NASA’s Applied Sciences Disasters Program, which is a collaborative project between the Direct Readout Laboratory (DRL), ozone processing team, Jet Propulsion Laboratory, Geographic Information Network of Alaska (GINA), and Finnish Meteorological Institute (FMI), to expedite the processing and delivery of direct readout (DR) volcanic ash and sulfur dioxide (SO2) satellite data. We developed low-latency quantitative retrievals of SO2 column density from the solar backscattered ultraviolet (UV) measurements using the Ozone Mapping and Profiler Suite (OMPS) spectrometers as well as the thermal infrared (TIR) SO2 and ash indices using Visible Infrared Imaging Radiometer Suite (VIIRS) instruments, all flying aboard US polar-orbiting meteorological satellites. The VIIRS TIR indices were developed to address the critical need for nighttime coverage over northern polar regions. Our UV and TIR SO2 and ash software packages were designed for the DRL’s International Planetary Observation Processing Package (IPOPP); IPOPP runs operationally at GINA and FMI stations in Fairbanks, Alaska, and Sodankylä, Finland. The data are produced within 30 min of satellite overpasses and are distributed to the Alaska Volcano Observatory and Anchorage Volcanic Ash Advisory Center. FMI receives DR data from GINA and posts composite Arctic maps for ozone, volcanic SO2, and UV aerosol index (UVAI, proxy for ash or smoke) on its public website and provides DR data to EUMETCast users. The IPOPP-based software packages are available through DRL to a broad DR user community worldwide.

Graphical Abstract

1. Introduction

Volcanic eruptions inject significant amounts of sulfur dioxide (SO2) and volcanic ash (VA) into the atmosphere at the cruising altitudes of commercial aircrafts [1]. This poses a substantial risk to aviation safety, since many of these eruptions can occur sporadically and with very little warning [2,3,4,5,6,7]. In the worst-case scenario, jets flying into undetected VA clouds may experience engine shutdown (flameout) [8,9], where there is a greater risk at night and at high northern latitudes where operational geostationary sensors [10] have limited or no coverage. The limitations in satellite tracking of VA clouds have led to prolonged flight cancellations with ripple effects throughout the airline industry’s economy and personal travel, notably after the 2010 Eyjafjallajökull eruption in Iceland [11,12]. This exposed a major deficiency in the existing VA monitoring system that needs urgent attention given the ever-increasing number of flights that operate at night or fly over the Arctic polar region.
To improve the monitoring and forecasting of volcanic aviation hazards over the northern polar region, one can take advantage of the direct readout (DR) VA and SO2 products from polar-orbiting satellites. Because volcanic SO2 greatly exceeds background levels and has a relatively long lifetime in the upper atmosphere, it has been quantitatively measured by satellites for a long time using both solar ultraviolet (UV) backscatter radiance and thermal infrared (TIR) transmission techniques [13,14,15,16,17,18,19,20,21,22]. In addition to its use as a proxy for VA [15], SO2 is a regulated criterion for air pollution, which could lead to the degradation of cabin air quality and premature aircraft frame corrosion and turbine blade sulfidation.
While geostationary satellites have almost no coverage over polar regions, low-earth polar-orbiting satellites provide frequent measurements over the region, with data typically available within 3 h from acquisition. The direct broadcast (DB) capabilities of NASA’s Earth Observing System (EOS) polar-orbiting satellites (Terra, Aqua, and Aura) have enabled real-time processing of moderate-resolution imaging spectrometer (MODIS), atmospheric infrared sounder (AIRS), and ozone monitoring Instrument (OMI) data since the early 2000s. The Finnish Meteorological Institute’s (FMI) very fast delivery (VFD) service pioneered DR processing of OMI DB data at the Sodankylä ground station in 2006 [23,24], and it has been continuing this processing and data dissemination without major interruptions. The initial VFD products included ozone, surface UV radiation, and cloud Lambertian equivalent reflectivity (LER) data, and volcanic SO2 and UV aerosol index (UVAI) products were added after the 2010 Eyjafjallajökull eruption. The volcanic DR products, available within 30 min of the satellite’s overpass, were immediately found to be useful when Iceland’s Grimsvötn volcano erupted in 2011. The service was further enhanced in 2014 with the implementation of DR processing for the NASA–NOAA Suomi National Polar Partnership (SNPP) Ozone Mapping and Profiler Suite/nadir mapper UV spectrometer (OMPS). The UVAI product has also proven to be a useful proxy for smoke plumes from forest fires [25] in addition to VA clouds [26,27,28].
Currently, NASA’s Applied Sciences Disasters Program (ASP) and Direct Readout Laboratory (DRL) are supporting transitions of NASA’s DB/DR Earth observation capabilities to operational agencies for applications where latency time is critical. Here, we describe an on-going collaborative ASP project to transition our OMPS-based retrievals of volcanic SO2 column amounts and UVAI as well as day/night SO2 and ash indices derived from thermal infrared (TIR) radiance spectra measured with Visible Infrared Imaging Radiometer Suite (VIIRS) instruments. A main goal of this project is to automatically generate VA and SO2 DR satellite products for aviation avoidance over northern polar latitudes. OMPS and VIIRS fly in tandem aboard the NASA/NOAA polar-orbiting operational meteorological satellites, enabling simultaneous daytime observations of volcanic plumes and clouds in the UV and TIR (Section 2). We next describe our integration of the OMPS and VIIRS DR science processing algorithms (SPAs) into the DRL’s International Planetary Observation Processing Package (IPOPP), integrating of DR products into the NASA Disasters Mapping Portal (https://maps.disasters.nasa.gov/ accessed on 5 October 2021), and processing of volcanic DB/DR data at ground stations in Alaska and Finland (Section 3). Finally, we discuss the transition plan to sustain operations (Section 4).

2. Materials and Methods

2.1. UV-Based Volcanic SO2 and UVAI DR Data

The OMPS series of satellite sensors are the latest backscattered ultraviolet (BUV) spectrometers developed for NOAA’s new generation polar-orbiting weather satellite system (the Joint Polar-Orbiting Operational Satellite System, or JPSS) to continue monitoring the health of the Earth’s ozone layer. The nadir push-broom components of these satellite suites consist of charge-coupled device (CCD) detectors that make hyperspectral observations of the atmosphere in 2800 km pole-to-pole orbital swaths that provide global daily coverage. The hyperspectral capability allows for atmospheric trace gas retrievals beyond ozone (O3), including sulfur dioxide (SO2), formaldehyde (HCHO), as well as the UV-absorbing aerosol index (UVAI), which is a useful proxy for smoke, dust, and volcanic ash (VA). In addition to its role in support of NOAA, NASA also processes OMPS data to extend long-term ozone climate data records through its ozone Science Investigator Processing facility (SIPS) at the Goddard Space Flight Center. Along with the generation of the ozone climate data record, the SIPS also supports the production and dissemination of global near real-time (NRT) products through NASA’s LANCE (Land, Atmosphere Near real-time Capability for EOS), providing UVAI as well as the quantitative column density of volcanic SO2 for long-term tracking of volcanic clouds [19]. Global NRT OMPS imagery, along with a multitude of different satellite products, is available via NASA’s World View website (https://worldview.earthdata.nasa.gov/ accessed 5 October 2021) within 3 h.
NASA’s ASP supports the development of the OMPSnadir Science Processing Algorithm (SPA) package, which processes DR OMPS data received at ground stations in Alaska and Finland and produces quantitative O3 and SO2 column density and qualitative UVAI DR data. The OMPSnadir SPA runs under NASA DRL’s International Planetary Observation Processing Package (IPOPP), which is available to all ground station operators. The SPA is based on our science quality principal component analysis (PCA) algorithm, which has been used to produce OMI and OMPS SO2 data since 2017 [19]. This highly efficient algorithm takes only a few minutes to process an entire OMPS orbit. For the SPA, the SO2 algorithm was modified to optimize its performance in DR processing (Figure 1).
The PCA algorithm employs a PCA technique to separate the SO2 signal from confounding signals resulting from ozone absorption and rotational Raman scattering (among other factors). In the presence of large volcanic plumes, the derived principal components (PCs) may contain SO2 signatures and can cause collinearity in the fitting. It is thus important to first screen for pixels containing large amounts of SO2 in the retrieval process. In the previous SPA, this screening was based on the ozone (O3) residuals at two pairs of wavelengths (313/314 nm and 314/315 nm, see [19] for details). The O3 residuals were defined as the differences between the measured radiances and those calculated with the retrieved O3 amount (from the total ozone algorithm) and reflectivity but assuming zero SO2 in the atmosphere. When SO2 is present in significant quantities, the residuals at 313 and 315 nm are much greater than at 314 nm. In the DR environment, we implemented a new volcanic SO2 screening scheme using a fixed set of reference PCs derived from an SO2-free OMPS swath (orbit number 40,599) in spectral fitting to generate initial estimates of SO2 column amounts. While there are orbit-to-orbit changes in measurements, such as uncorrected detector dark current, the performance of the OMPS instrument is relatively stable over time, allowing for reasonable initial SO2 retrievals when using PCs derived from a different orbit. This new scheme is more sensitive to SO2 compared with the residual-based approach and helps to eliminate artifacts, leading to improved volcanic SO2 column density data as shown in Figure 1.
In addition to column SO2, the SPA also produces column ozone, cloud/surface LER, and UVAI data. The UVAI is calculated from the spectral contrast between different UV wavelengths [25]. VA particles strongly absorb light in the UV, leading to lower LERs at shorter UV wavelengths [17,26,27]. With assumptions about the ash refractive index, particle size distribution and height and ash column mass can be estimated [28].
We are also implementing the OMPSnadir SO2/UVAI SPA with the follow-on JPSS-1/NOAA-20/OMPS instrument. With a spatial resolution almost an order of magnitude finer than SNPP/OMPS (13 × 17 km2 vs. 50 × 50 km2 at nadir), NOAA-20/OMPS provides far greater detail of volcanic plumes. Such high-resolution data will be particularly valuable for detecting relatively small, localized eruptions that have signals which may become diluted and undetectable in the coarse SNPP/OMPS pixels but may still pose a threat to airliners flying nearby. As an example, Figure 2 shows the volcanic SO2 plume from the 2018 Fuego (Guatemala) eruption retrieved by NOAA-20 and SNPP OMPS instruments. The high-resolution NOAA-20 OMPS retrievals revealed relatively small pockets of enhanced SO2 near the west edge of the domain, whereas SNPP/OMPS showed no significant amount of SO2 over the same area.

2.2. Infrared-Based Volcanic SO2 and Ash Index DR Data

To provide nighttime coverage for polar flight routes, we developed DR volcanic ash and SO2 indices based on thermal infrared (TIR) data, acquired by several polar-orbiting operational satellite instruments. The current version of IPOPP used to process VIIRS-SO2 SPA (v1.3) is based on NASA’s Earth Observing System (EOS) Terra and Aqua MODIS TIR volcanic ash and SO2 algorithms [29]. The VIIRS-SO2 products are based on TIR channels M14, M15, and M16. As shown in Figure 3, these channels cover distinctive features in the TIR spectra of SO2, volcanic (silicate) ash, and ice crystals, allowing us to discriminate volcanic SO2 and ash from ice-rich meteorological clouds.
Figure 3 compares a color composite of data from the VIIRS TIR channels (Figure 3d) with the transmission spectra of SO2 (Figure 3a), ash (Figure 3b), and ice crystals (Figure 3c). To construct the color composite, we displayed the data from M14 (centered near 8.5 µm) in blue, M15 (11 µm) in green, and M16 (12 µm) in red. SO2, which absorbs radiance in M14 and is transparent in M15 and M16, appears yellow in the color composite. Ash, which transmits more radiance in M14 and M16 than in M15, appears red to purple in the color composite. Combinations of SO2 and ash appear orange. Ice clouds, which transmit more radiance in M14 and M15 than in M16, appear cyan to blue in the color composite. Optically thick ice clouds are opaque in the TIR and appear dark (i.e., cold) in the color composite.
The VIIRS-SO2 SPA produces SO2 and Ash Index maps, based on differences in brightness temperature (BT), that isolate the distinctive spectra features of SO2 and ash. The VIIRS SO2 index is a scaled version of the difference (BTD) between the BT in M14 and maximum BT across M14, M15, and M16. The SO2 BTD is scaled between −2 and −15 K to minimize the effects of water vapor (H2O) absorption at the low end of the scale and accommodate the strong SO2 absorption of high-altitude plumes at the high end of the scale. The VIIRS Ash Index is a scaled version of the difference between the BT in M15 and the maximum BT. The BTD is scaled between 0 and −15 K to accommodate strong ash absorption from high-altitude plumes.
To verify that the VIIRS SO2 index will be effective at detecting plumes over a wide range of plume heights and atmospheric conditions (Figure 4), we analyzed VIIRS observations of plumes from the Raikoke (Kurile Islands, Figure 4a), Bardarbunga (Iceland, Figure 4b), Lewotolo (Indonesia, Figure 4c), and Kilauea (Hawaii, Figure 4d) volcanoes. This set of test cases features plumes in Arctic and tropical climate zones at heights ranging from 2 to 13 km and H2O content (expressed as total precipitable water) between 12 and 43 mm of H2O. The SO2 plumes were detected successfully in each test case.
To generate final versions of the VIIRS SO2 (Figure 5a) and Ash Index maps (Figure 5b), we screened the scaled BTD values for ice-rich meteorological clouds based on the unique spectrum of ice crystals (Figure 3c). H2O absorption is strongest at the margins of the scene, where the satellite, or view, zenith angles (VZAs) exceed 50°. The H2O absorption reduces the BT in M14 and M16, and we minimized the impacts of this absorption on SO2 and ash detections by applying a gradient, or fade, function to VZA >50°. We adopted a range between 0 and 100 for the color index table assigned to the VIIRS SO2 and Ash Index (Figure 5). This range was a compromise between the strongest and weakest absorptions anticipated for various combinations of SO2 and ash concentrations, plume height, and atmospheric conditions.
The implementation of the VIIRS-SO2 SPA results in significant increases in the temporal frequency and spatial resolution of the volcanic SO2 and VA monitoring program. In addition to adding nighttime TIR coverage, the convergence of SNPP orbital tracks over the northern polar latitudes provides opportunities for multiple day- and nighttime observations in a single 24 h period.

3. Results

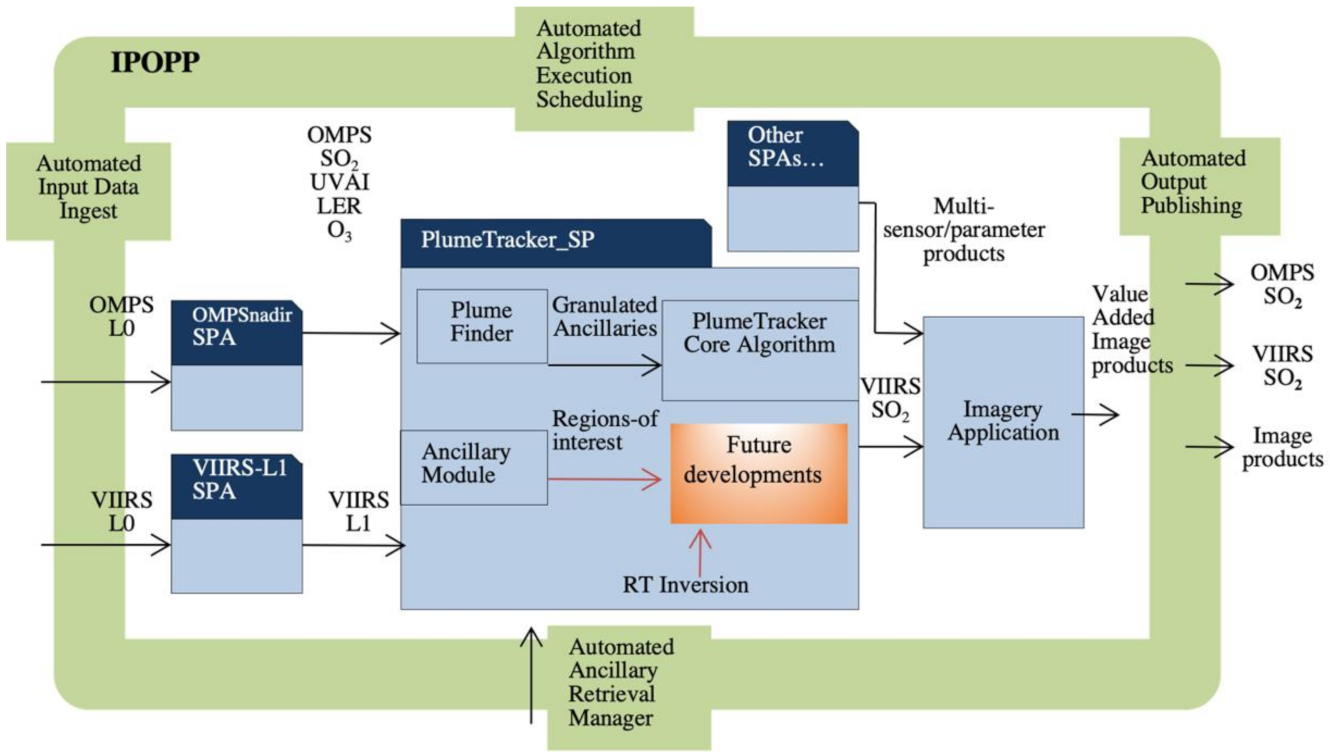
3.1. Integrating Volcanic SO2 and Ash Science Algorithms into IPOPP

Our UV and TIR SO2 and ash SPAs were designed for NASA’s DRL International Planetary Observation Processing Package (IPOPP), which is freely available from the DRL website: https://directreadout.sci.gsfc.nasa.gov/?id=dspContent&cid=68 accessed on 5 October 2021). Both the OMPSnadir and VIIRS-SO2 SPA packages adhered to an IPOPP modular architecture, which allowed for efficient evolution of the SPAs (Figure 6). Inputs of OMPS and VIIRS raw data (Level 0, L0) were first processed through the L0 to Level 1 (L1) processors, which geolocate and calibrate the raw data. The L1 data were the inputs for the Level 2 SPAs, which produce geophysical quantities (column ozone, SO2) and indices (UVAI, VIIRS SO2, and ash). VIIRS L1 geolocation data were used by the ancillary module to granulate the ancillary inputs into the VIIRS swath geometry. The core algorithm then used the VIIRS L1 and the granulated ancillary data to process the VIIRS pixels. Eventually, the VIIRS and OMPS L2 outputs were combined with the ancillary products within the imagery application module to produce value-added image information products and GeoTIFF image files. The DRL provides pre-release versions of the SPAs for evaluation by our partners at the FMI, GINA, the Alaska Volcano Observatory (AVO), and the National Weather Service (NWS). The algorithm’s developers and DRL team communicate continuously with these partners to solicit feedback regarding these SPAs. Based on this feedback, the DRL evolves these SPAs and provides technical support to meet operational user needs.

3.2. Integrating Volcanic SPAs into NASA’s Disasters Mapping Portal

The NASA Disasters Mapping Portal (The Portal: https://maps.disasters.nasa.gov/ accessed on 5 October 2021) is an internet based Esri Enterprise geospatial information system (GIS) portal that is used by the NASA Applied Sciences Disasters Program to distribute its scientific data products to a broader, non-scientific audience. Many of the stakeholders of the Disasters Program are in the emergency management and disaster response community and do not have experience processing remotely sensed data in scientific formats (HDF, NetCDF). To facilitate interactions with its stakeholders before, during, and after a disaster, the Disasters Program utilizes GIS web services and GIS-friendly data formats, most commonly GeoTIFF and shapefile, to disseminate its data products through the portal.
When the Disasters Program responds to volcanic eruptions, the DB/DR VIIRS and OMPS SO2 and UVAI, distributed through the DRL, are among the most used data products for addressing concerns over air travel and air quality. Because the data are being produced by the DRL as GeoTIFFs, they can be quickly loaded into the portal to be published as GIS web services where the data can be visualized in a way that can help users easily see volcanic cloud movements and impacts on the air space. Due to the daily revisit frequency of Suomi-NPP (more frequent in the Arctic), these data products are often visualized in a time-enabled mosaic data set that shows the progression of the volcanic plume as it moves throughout the atmosphere. By utilizing the portal for sharing and visualizing data, stakeholders can seamlessly stream the data into their own GIS systems and combine their own organization’s data to create a more holistic view of the eruption. Figure 7 shows composite sequence of OMPS SO2 clouds for the June 2020 Nishinoshima eruption in the Disasters Mapping portal.

3.3. DR Data Processing in Alaska

The NOAA National Weather Service (NWS) Alaska Aviation Weather Unit’s (AAWU) Anchorage Volcanic Ash Advisory Center (A-VAAC) has the primary responsibility to issue volcanic ash advisories (VAAs) for the busy north Pacific/Alaska flight routes between Asia and North America. In Alaska alone, there are 54 historically active volcanoes and approximately 60 additional historically active volcanoes in the Russian Far East (Kamchatka and the Kuril Islands) on the western boarder of the A-VAAC’s area of responsibility. The A-VAAC works in close collaboration with the United States Geological Survey (USGS) Alaska Volcanic Observatory (AVO) during eruptions to evaluate eruptive activity (magnitude, altitude of eruption cloud) to forecast the dispersion and transport of VA clouds and to assess the potential hazards to aviation. The work of the A-VAAC and the AVO supports the Anchorage Center Weather Service Unit (CWSU), which is co-located at the Federal Aviation Administration (FAA) Anchorage Air Route Traffic Control Center (ARTCC). The CWSU serves as the in-house expert on meteorological conditions and hazards and solicits pilot reports of volcanic activity and volcanic cloud dispersion through FAA air traffic controllers. VAAC has access to many of the VIIRS and legacy MODIS and AVHRR visible and TIR bands, such that it can make multispectral products in the operational system. This includes traditional split window BTDs of M16 and M15 for VIIRS and the EUMETSAT or Japan Meteorological Agency (JMA) false-color RGB recipes for ash and SO2. However, interpreting these images is not always straightforward, and incorporating DR data from VIIRS and OMPS into the NWS Advanced Weather Interactive Processing System (AWIPS) could be the first step in augmenting the A-VAAC “tool-box” (Figure 8).
Volcanic SO2 factors into A-VAAC and CWSU operations in the aftermath of large eruptions (e.g., 2008 Kasatochi or 2019 Raikoke), which produced long-lived and widely dispersed volcanic clouds. For such clouds, there is the need to explicitly determine that they do not pose a VA threat for aircraft flying through them. Both the A-VAAC and CWSU need all available satellite volcanic products (including SO2) to provide situational awareness of VA, SO2, and volcanic aerosols, such as fine sulfuric acid droplets, that are produced from SO2. Volcanic sulfate aerosols can persist for weeks following a large eruption. Tracking SO2 clouds is needed to interpret whether pilot reports are due to the ash or sulfuric acid aerosols (which are co-located with SO2).
Currently, satellite SO2 products can be accessed via public websites, such as NASA SO2 (https://so2.gsfc.nasa.gov/ accessed on 5 October 2021) and Worldview (https://worldview.earthdata.nasa.gov/ accessed on 5 October 2021), NOAA NESDIS (https://www.ospo.noaa.gov/Products/atmosphere/ompsso2/ accessed on 5 October 2021), or European Support to Aviation Control Service (SACS: https://sacs.aeronomie.be/ accessed on 5 October 2021), but these are not available in real time. This time latency could ultimately be reduced by using DB/DR data processed by the Geographic Information Network of Alaska (GINA) at the University of Alaska Fairbanks (UAF). GINA provides real-time satellite data and imagery services over the north Pacific and Alaska in support of the NWS, NASA/NOAA’s JPSS program, and numerous other Alaskan stakeholders. Since 2001, GINA has operated a SeaSpace 3.6-m X-band antenna on the UAF campus. In 2014, a 3.0 m S-, L-, and X-band Orbital Systems antenna was installed at the NOAA Fairbanks Command and Data Acquisition Site (FCDAS) just outside of Fairbanks. Additionally, GINA has access to data from a third ground station on the northern coast of Alaska at Utqiagvik. Over 110 passes are received each day from 10 low Earth orbiting satellites, including from those used in this project (S-NPP, NOAA-20, Terra, and Aqua). After DR data are captured by these antennas, products are generated in multiple formats and in near real time at GINA and immediately staged to public-facing data distribution servers. GINA also pushes data to the NWS Alaska Region Headquarters in Anchorage via Unidata’s Local Data Manager (LDM); from there, data are distributed to the NWS weather forecast offices and A-VAAC. One format pushed to NWS is sectorized CMI (SCMI), a form of netCDF, and it is the same format A-VAAC’s operational systems use for geostationary imagery from GOES-17 and Himawari-8. The data are routed, ingested, and properly displayed in NWS operations system (AWIPS) and, thus, are readily available to forecasters (Figure 8).

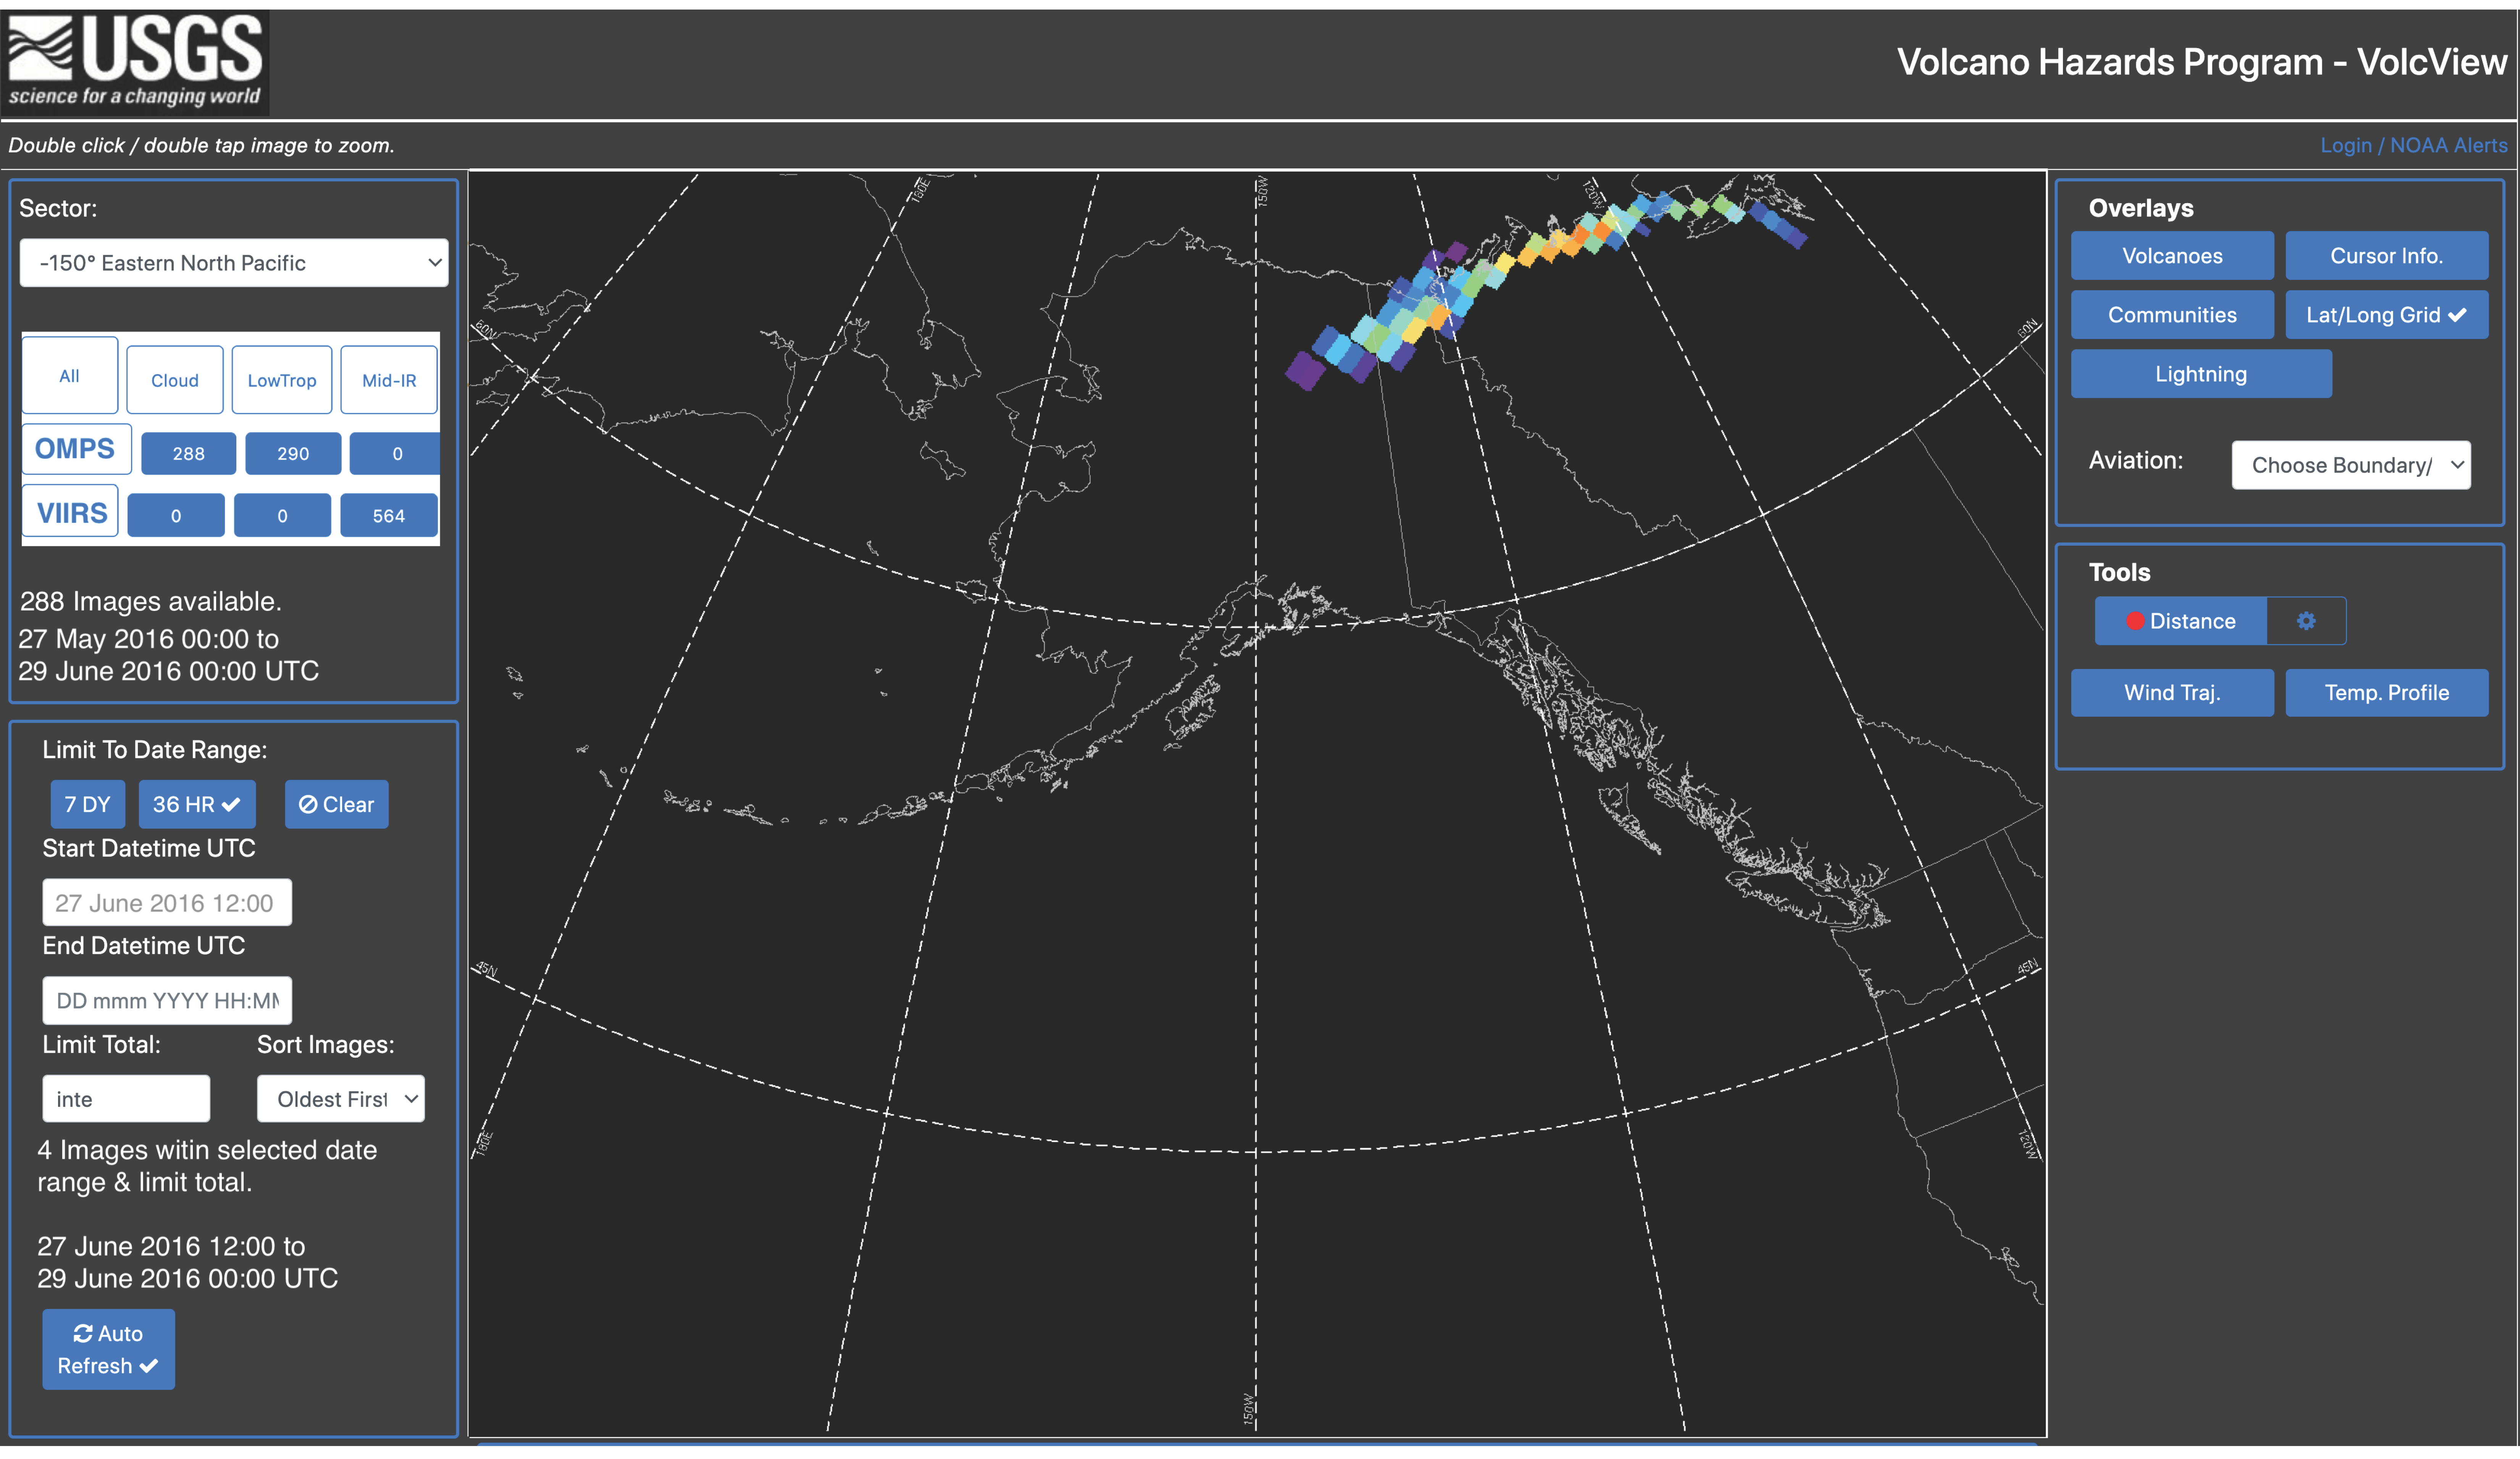
3.4. Using DR Data at the Alaska Volcano Observatory

The Alaska Volcano Observatory (AVO), a cooperative project of the US Geological Survey (USGS), the University of Alaska Fairbanks, and State of Alaska Divisions of Geological and Geophysical Surveys, makes extensive use of satellite remote sensing data to monitor volcanic activity along the 2300 km long Aleutian Arc in the northern Pacific. The monitoring efforts have focused on detection of thermal anomalies (“hot spots”) and ash clouds with TIR data acquired by legacy AVHR, EOS MODIS, and VIIRS instruments, flying on NASA/NOAA polar-orbiting satellites, and the GOES-West and Himawari-8 (operated by the Japan Meteorological Agency) series of geostationary satellites. Satellite-based detection of volcanic SO2 by the AVO has only recently been expanded as new sources of data have been made available. Through the GINA station, AVO and A-VAAC have access to OMPS, MODIS, AIRS, and VIIRS data. These data and resulting products are served by the USGS-AVO via AVO’s VolcView server (Figure 9), where they are available to AVO, A-VAAC, and CWSU analysts.
AVO’s mission is to provide advance notice that a volcano is demonstrating signs of unrest prior to an eruption, reducing the latency between eruption onset and public notification. AVO issues Volcano Observatory Notifications for Aviation (VONAs), as recommended by ICAO, to warn of impending eruptions (through the increase in the Aviation Color Code) and offer guidance during eruptions. An evaluation of the performance of the USGS-AVO shows improvement in pre-eruptive guidance and eruption notification time when volcanic activity is observed in multiple data sets (i.e., seismic, infrasound, satellite, lightning, and pilot reports). An analysis of the 2016–2017 eruption of Bogoslof shows that the availability of satellite data (primarily from geostationary satellites) resulted in the largest reduction in eruption reporting latency [30]. The OMPS SO2 DR data were also useful for showing the eastward long-range transport of the volcanic cloud from the 2016 Mount Pavlof eruption (Figure 9). The AVO has begun the process of producing VIIRS TIR-based SO2 and ash data products to add day/night and seasonal capabilities to the existing UV-based products. These products will be served to A-VAAC analysts via the VolcView web platform (https://volcview.wr.usgs.gov/vv-gui/ accessed on 5 October 2021).

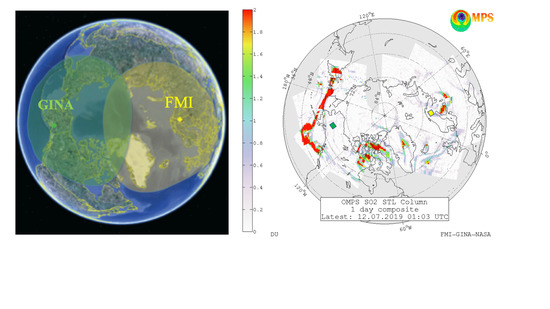
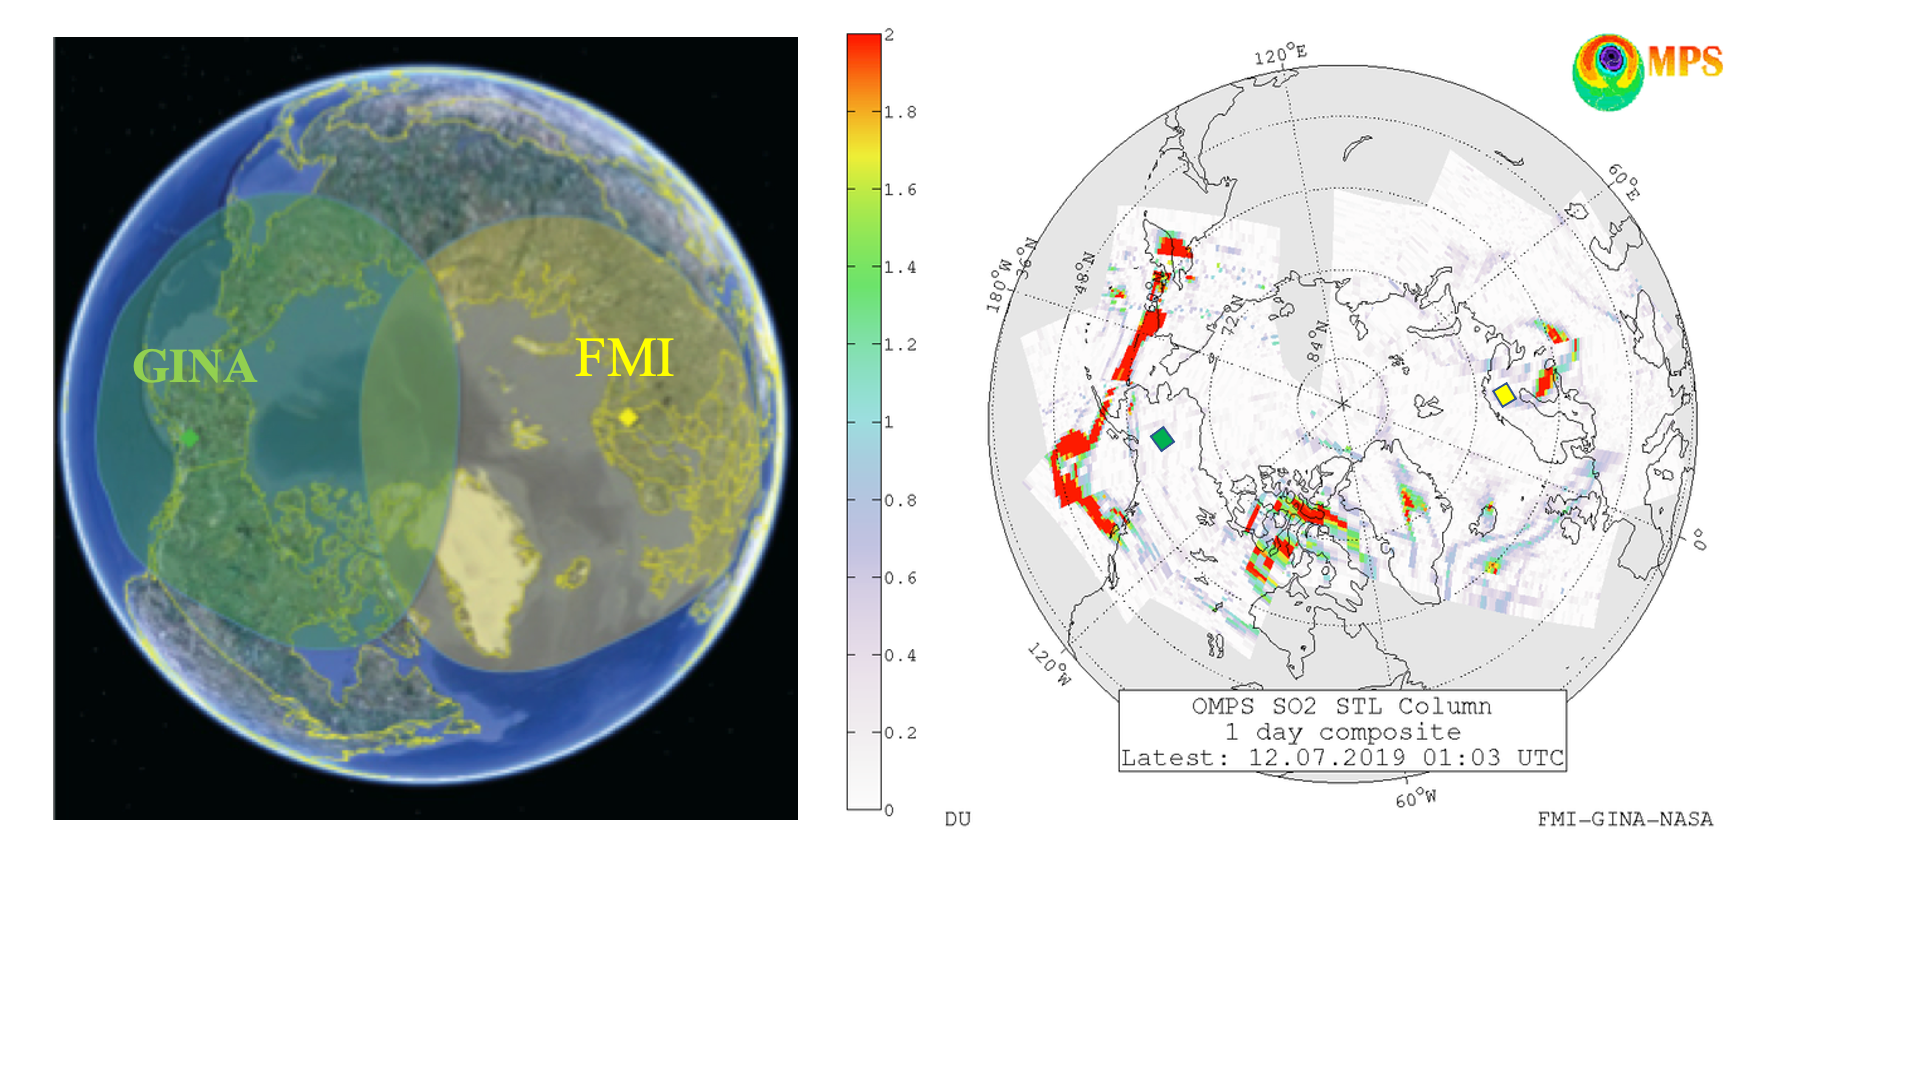
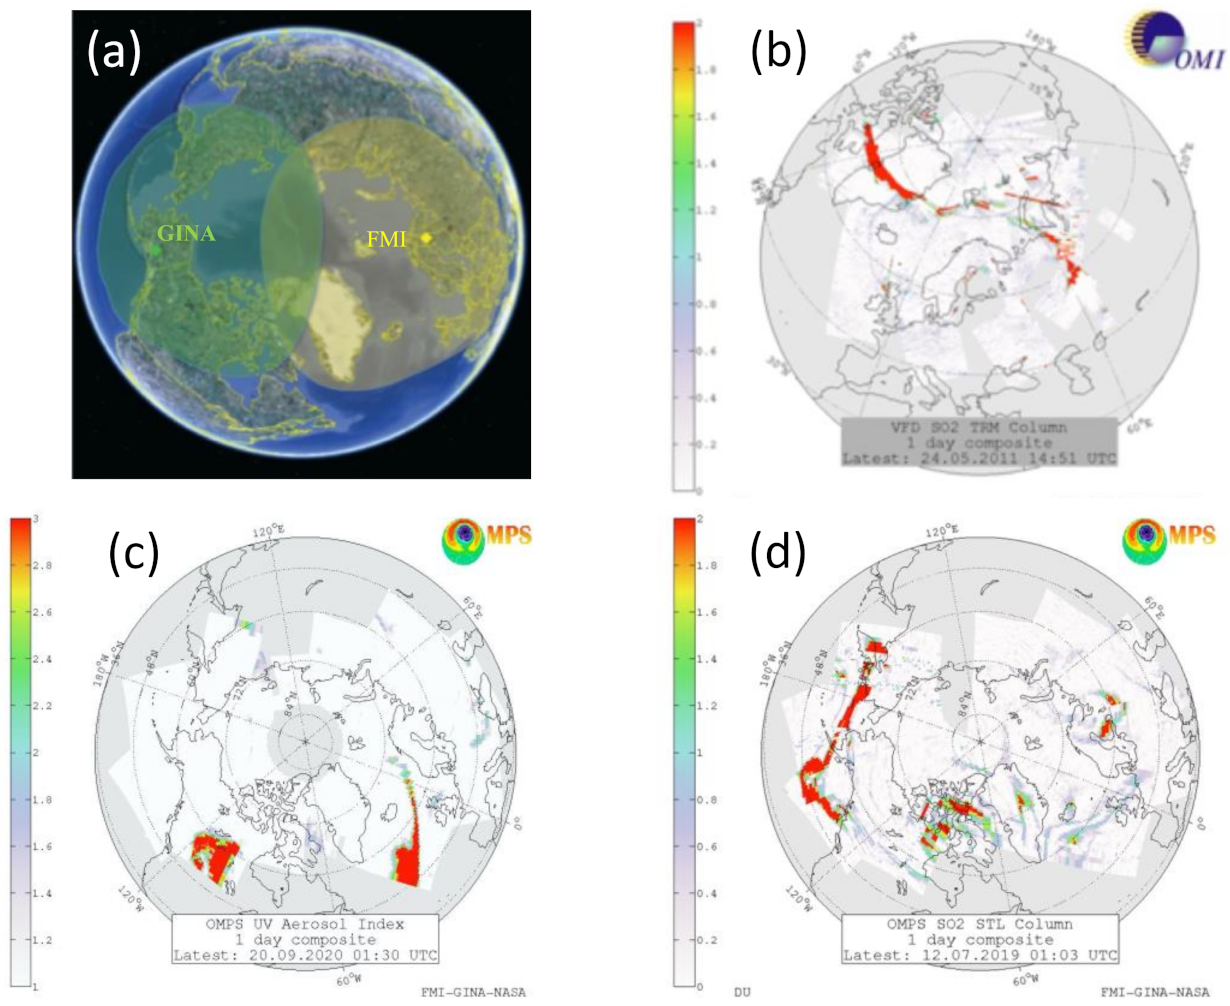
3.5. Bringing Together DR Data from Alaska and Finland for Complete Arctic Coverage

At the Finnish Meteorological Institute’s (FMI) Sodankylä Ground Station, the first 2.4 m X-band antenna (later named SOD01) was installed in 2003 for DR processing of data from Aura/OMI [31,32] in addition to data from EOS-Terra and EOS-Aqua satellites. The site now hosts two newer antennas, SOD02 since 2011 and SOD03 since 2017, both capable of receiving large data dumps with their 7.3 m dishes. In 2020, approximately 15 satellites were actively tracked resulting in total ~22,000 acquired overpasses. Currently, FMI’s DR satellite center in Sodankylä processes both OMI and SNPP/OMPS data and also fetches GINA DR SNPP/OMPS data from Alaska. Together, the Sodankylä and GINA ground stations provide near complete coverage of the Arctic (Figure 10a). The Sodankylä data products are available via FTP, and both Sodankylä and GINA received data are re-distributed for users via EUMETSAT’s EUMETCast multicast service. The SO2 and UVAI maps for the Arctic are also publicly available for visual examination on the recently redesigned SAMPO website (https://sampo.fmi.fi/products accessed on 5 October 2021). VIIRS SO2 processing is currently under implementation and testing with data expected to be available in 2022. Furthermore, the NOAA-20 OMPS and VIIRS processing will be implemented when the relevant SPAs become available to enhance SAMPO’s service in the future.

4. Discussion

Currently, GINA relies on NASA’s Applied Sciences Disasters program and NOAA’s JPSS support to process SNPP/OMPS SO2 and UVAI data and distribute to AVO, A-VAAC, and FMI. AVO loads SO2 data into VolcView, and the NWS Arctic Testbed and Proving Ground (ATPG) will work to incorporate our SO2 and ash products into their operational data processing and delivery mechanisms such as the AWIPS data systems. The NWS will deliver the data internally to the A-VAAC and other field offices such as the NWS Center Weather Service Unit at the FAA Traffic Control Facility. Furthermore, there is a need for the NWS to develop training materials for A-VAAC forecasters. The large increase in available data and products from various meteorological satellite systems can be overwhelming and, thus, training and refined, well-researched satellite data products are needed to gain the largest benefit from the available data.
The USGS-AVO will continue to collect data provided by GINA to produce products for use by observatory scientists in its VolcView web browser and will coordinate with the NWS regarding training A-VAAC forecasters. Future eruptions in the North Pacific will likely provide additional opportunities to evaluate NASA DR volcanic SO2 and ash products through operational response with the A-VAAC.
The FMI will continue DR SO2 and AI data processing from OMPS and VIIRS at the Sodankylä ground station in northern Finland for both SNPP and NOAA20 satellites and distribute these data to operational users in Europe via the operational EUMETSAT EUMETCast system as requested by EUMETSAT member states (National Weather Prediction centers in Norway, Sweden, and Denmark). Real-time VIIRS and OMPS SO2 maps are available from the FMI’s public operational SAMPO website.
The OMPSnadir and VIIRS DR-SO2 SPAs will be maintained by Ozone SIPS and JPL teams and updated, when necessary, as defined by user needs. NASA’s DRL will maintain and further develop IPOPP and make it freely available to a broader DR user community to extend the applications of the SPAs developed under this project. Agencies currently using IPOPP software for real-time decision making include the UK Met Office, Meteo-France, FMI, USDA Forest Service, Council for Scientific and Industrial Research (CSIR), Indian Space Research Organization (ISRO), National Institute for Space Research (INPE), Australian Government Bureau of Meteorology (BOM), National Commission for Biodiversity of Mexico (CONABIO), Kongsberg Satellite Services AS (KSAT), National Space Activities Commission of Argentina (CONAE), the US NOAA National Weather Service, and the US Air Force, Army, and Navy. With downlinks of OMPS and VIIRS DB data and relevant SPAs, any of these facilities can generate OMPS and VIIRS volcanic data products.
This project also presents ample opportunities for high-quality information-rich visualizations in line with NASA’s long-term vision. The DRL will continue development of value-added image information products that can be produced downstream of the OMPSnadir and VIIRS DR-SO2 products. These products will have overlays of VIIRS SO2 and other cross-sensor raster and vector data on coincident or composite true color/false color/nighttime backgrounds from high spatial resolution sensors such as VIIRS, MODIS, Landsat-OLI/TIRS, GOES, and Sentinel-2 MSI. A main objective in this regard will be creating image information products that are useful during disaster application response and recovery team mobilizations and which can be directly loaded into NASA’s Disaster Mapping web portal.

5. Conclusions

The current satellite products used by VAACs and volcano observatories include polar and geostationary TIR imagery of volcanic ash (VA) and estimates of VA column mass, particle size, and height retrievals [10]. These are quite useful in detecting moderate to high concentrations of ash but do not guarantee 100% detection because of the interference of clouds, water vapor, and insufficient temperature contrast, especially for fresh opaque VA clouds, which are the most dangerous to jet aircrafts. The GOES coverage is also limited for polar areas. The availability of direct readout SO2 and volcanic ash products from GINA and FMI provides timely, complementary coverage at higher northern latitudes as well as quantitative volcanic SO2 column density/mass information [19] not previously available in real time.
The most recent improvements in the decision-support capabilities have been achieved through the installation of the DR VIIRS-SO2 science processing algorithm at GINA and FMI, which enables comprehensive day–night monitoring of volcanic SO2 clouds. This monitoring will augment and, in some cases, substitute the monitoring of ash clouds, and track the dispersion and transport of long-lived SO2/sulfate aerosol clouds when ash is not directly detectable. VIIRS-SO2 increases the frequency of satellite observations by increasing the use of nighttime data and data from the overlap of ground swaths at high latitudes. In addition, the DRL’s IPOPP environment also supports the processing of JPSS-1/NOAA-20 DR data, which will provide additional VIIRS as well as higher spatial resolution OMPS observations. With all these advantages we expect that:
  • This increased capacity will allow rapid confirmation of the presence of volcanic SO2 and ash clouds as well as improved monitoring of rapidly evolving events such as smoke plumes from forest fires. The coverage over polar areas will be available both day and night, and the temporal gap between measurements for a given typical area will be reduced to only several hours.
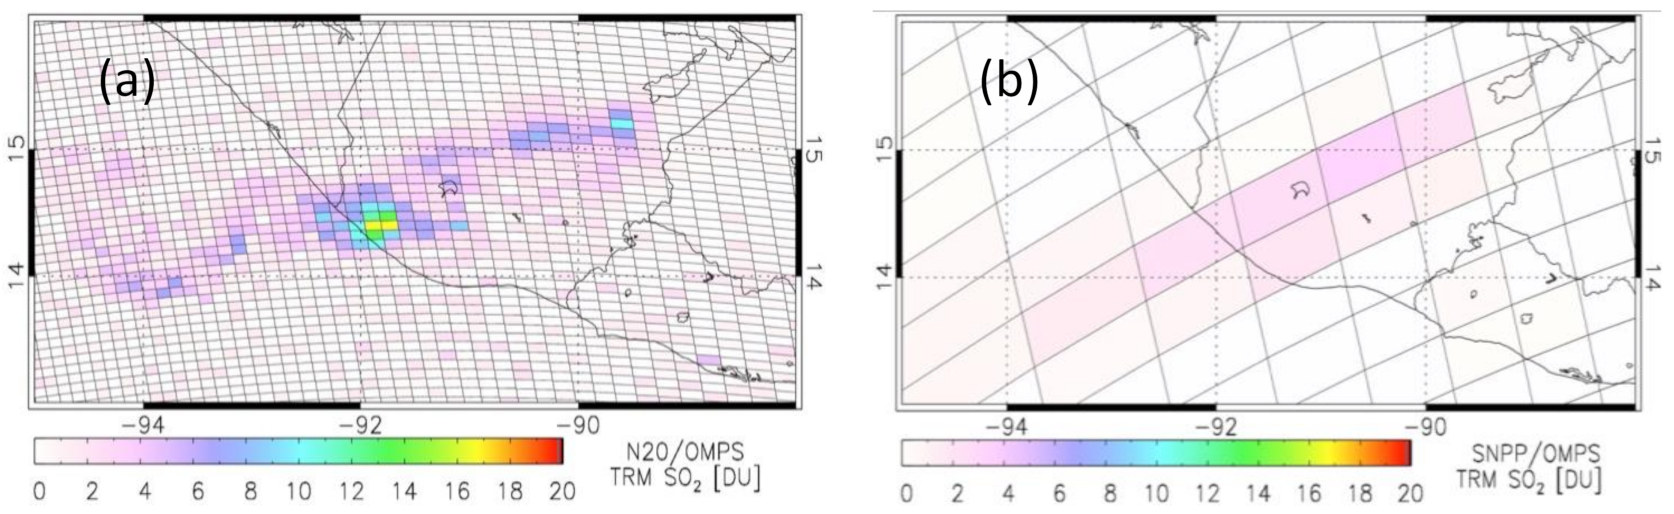
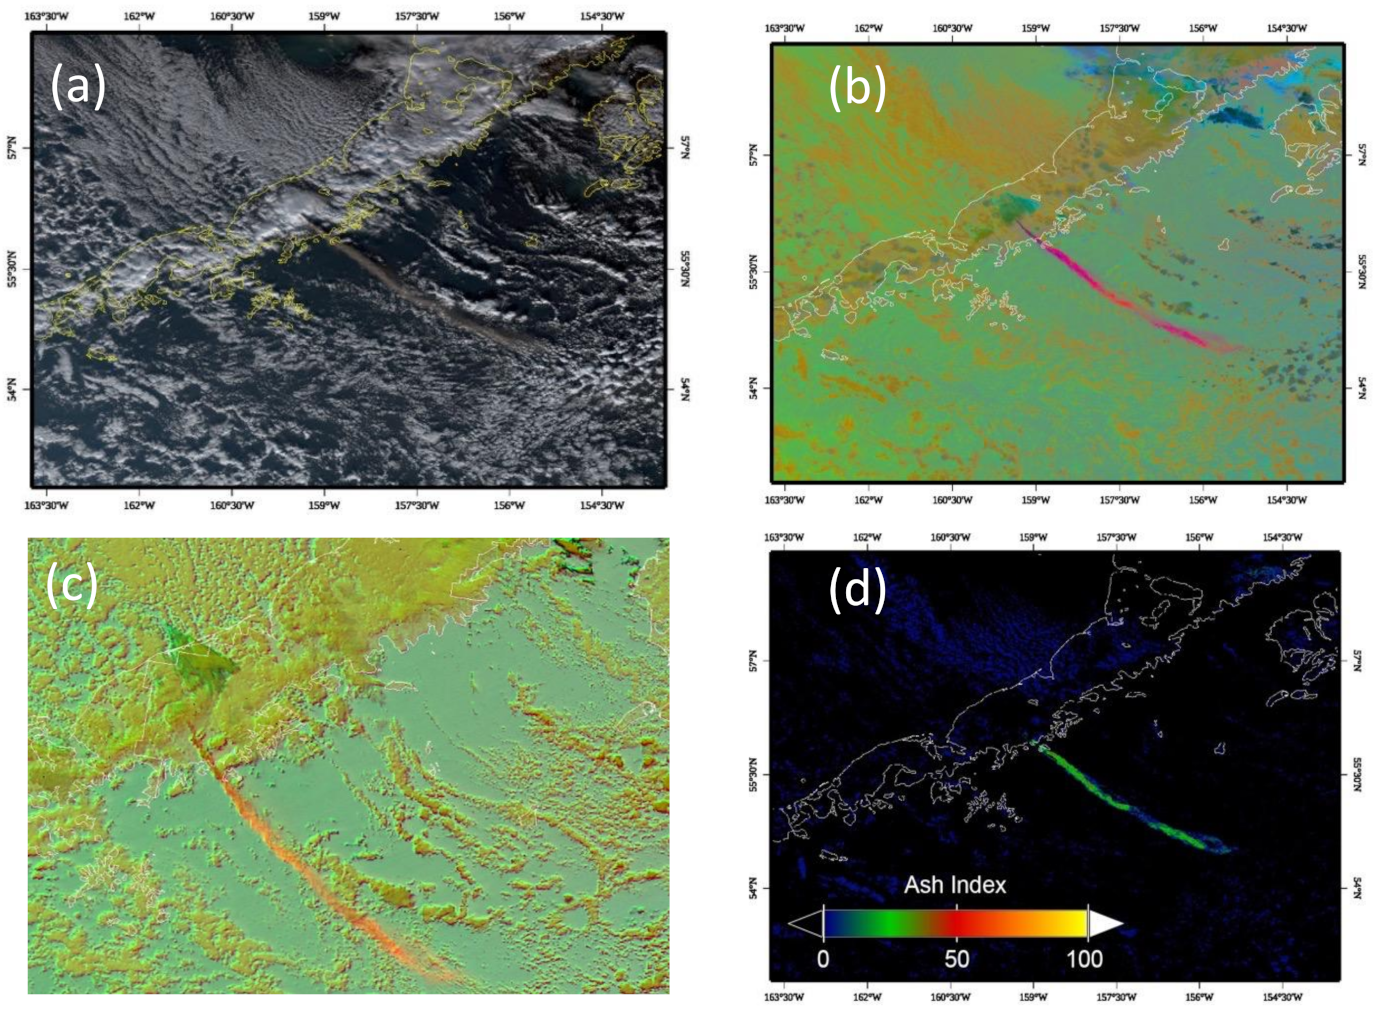
  • The high spatial resolution of VIIRS (sufficient to resolve the source points of the SO2 plumes as shown in Figure 4), combined with the four times daily coverage afforded by SNPP and NOAA-20, will enable users to estimate the daily rates of SO2 emissions, or flux, via satellite observations. Changes in gas emission rates may be precursors to impending eruptions, and our OMPS-based and VIIRS-based SO2 estimates of emission rates will find immediate application in Alaska where the USGS Volcanic Emissions Project conducts annual airborne gas surveys. The majority of Alaska’s volcanoes are not monitored for gas emissions, and systematic, repetitive surveys are required before anomalous degassing behavior can be identified.
  • This synergy of UV and TIR sensors on the SNPP and JPSS satellite platforms will produce the lowest possible latency and the best coverage to quantify both peak SO2 column density amounts as well as the total emitted mass and lifetime.

Author Contributions

Conceptualization, N.K., V.R. and K.B.; methodology, C.L. and V.R.; software, C.S., C.L., J.L., K.B., S.H. and T.R.; validation, M.S., D.S., J.C., C.D., J.D., S.H., T.R., S.C., J.O. and N.E.; investigation, N.K., V.R., C.L. and K.B.; resources, J.M. and J.T.; data curation, S.C.; writing—original draft preparation, N.K., V.R., C.L., D.S. and S.H.; writing—review and editing, N.K., V.R., C.L., C.S., S.H., D.S., C.D. and S.C.; visualization, V.R., C.L., K.B., S.H., J.K. and G.L.; supervision, M.S., J.D., N.K., J.T., D.S. and V.R.; project administration, J.M.; funding acquisition, N.K., V.R., J.M. and J.T. All authors have read and agreed to the published version of the manuscript.

Funding

This research was funded by NASA’s Applied Sciences Disasters Program, solicitation ROSES 2018 NNH18ZDA001N-DISASTERS (A.37), project 0028: “Day–Night Monitoring of Volcanic SO2 and Ash for Aviation Avoidance at Northern Polar Latitudes: Enhancing Direct Readout Capabilities from EOS, SNPP and NOAA20” and NASA grant 80NSSC19K1236 to University of Alaska Fairbanks. S.H., J.T. and T.R. acknowledge funding from academy of Finland grants (312125, 337552 and 338559). D.S. acknowledges funding from NASA-USGS Interagency agreement 80HQTR19T0108.

Data Availability Statement

The latest DRL IPOPP software, including OMPSnadir and VIIRS-SO2 science processing algorithms, are available from the DRL website (https://directreadout.sci.gsfc.nasa.gov/?id=home (accessed on 24 August 2021)). Information on GINA products and a list of our public-facing data portals is available on GINA’s website (https://gina.alaska.edu/ accessed on 5 October 2021).

Conflicts of Interest

The authors declare no conflict of interest.

Abbreviations

The following abbreviations are used in this manuscript:
AbbreviationExplanation
AAWU Alaska Aviation Weather Unit at Anchorage FAA facility
AIRSAtmospheric Infrared Sounder on NASA’s EOS Aqua satellite
ARTCCAnchorage Air Route Traffic Control Center
ASPNASA Applied Sciences Disasters Program
ATPG Arctic Test Bed and Proving Ground
A-VAAC Anchorage Volcanic Ash Advisory Center
AVO Alaska Volcanic Observatory
AWIPSAdvanced Weather Interactive Processing System
BTDBrightness Temperature Difference
CrISCross-Track Infrared Sounder
CWSUCenter Weather Service Unit
DBDirect Broadcast of Satellite Data
DRDirect Readout of DB Data at Ground Receiving Station
DRLNASA Direct Readout Laboratory
DSTDecision Support Tool
DUDobson Unit, 1 DU = 2.69 × 10¹⁶ molecules/cm2
EOSNASA Earth Observing System
EUMETCastMulti-Service Dissemination System Offered by EUMETSAT
EUMETSATEuropean Organization for the Exploitation of Meteorological Satellites
FAAFederal Aviation Administration
FMIFinnish Meteorological Institute
GIGeophysical Institute at UAF, home of GINA
GINAGeographic Information Network of Alaska
GOESGeosynchronous Operational Environmental Satellite
GSFCNASA Goddard Space Flight Center
GUIGraphical User Interface
ICAOInternational Civil Aviation Organization
IFOVIndividual Field of View
IPOPPInternational Planetary Observation Processing Package, DRL
JMAJapan Meteorological Agency
JPLJet Propulsion Laboratory
JPSSNASA/NOAA Joint Polar Satellite System
L0Level 0 Reconstructed, Unprocessed instrument and Payload Data
L1BLevel-1B Satellite Radiance Data Product
L2Level-2 Pixel-Level Satellite Products
LANCELand Atmosphere Near Real-Time Capability for EOS
LUTLook-Up Table
MODISModerate Resolution Imaging Spectroradiometer
NASANational Aeronautics and Space Administration
NMNadir Mapper of OMPS instrument
NOAANational Oceanic and Atmospheric Administration
NRT Near Real-Time
NWS US National Weather Service
O3Ozone
OLILandsat 8 Operational Land Imager
OMIOzone Monitoring Instrument on NASA EOS Aura Satellite
OMPSOzone Mapping Profiler Suite aboard SNPP and NOAA-20 Satellites
PCPrincipal Component
PCAPrincipal Component Analysis
RTRadiative Transfer
SACSSupport to Aviation Control Service
SIPSNASA Science Investigator-Led Processing System
SNPPSuomi National Polar Orbiting Partnership, NASA–NOAA satellite
SO2Sulfur Dioxide
SPAScience Processing Algorithm
TIRThermal Infrared Part of the Electromagnetic Spectrum (~5–15 micron)
TIRSLandsat 8 Thermal Infrared Sensor
UAFUniversity of Alaska Fairbanks
USGSUnited States Geological Survey
UVUltraviolet Part of the Spectrum of Light (wavelengths from ~200–400 nm)
VAVolcanic Ash
VAA Volcanic Ash Advisories Issued by VAACs
VAACVolcanic Ash Advisory Center, Part of the National Met Service (e.g., NWS)
VONAVolcano Observatory Notification for Aviation
VIIRSVisible Infrared Imaging Radiometer Suite

References

  1. Robock, A. Volcanic eruptions and climate. Rev. Geophys. 2000, 38, 191–219. [Google Scholar] [CrossRef]
  2. Carn, S.A.; Krueger, A.J.; Krotkov, N.A.; Yang, K.; Evans, K. Tracking volcanic sulfur dioxide clouds for aviation hazard mitigation. Nat. Hazards 2009, 51, 325–343. [Google Scholar] [CrossRef]
  3. Brenot, H.; Theys, N.; Clarisse, L.; van Geffen, J.; van Gent, J.; Van Roozendael, M.; van der A, R.; Hurtmans, D.; Coheur, P.-F.; Clerbaux, C.; et al. Support to Aviation Control Service (SACS): An online service for near-real-time satellite monitoring of volcanic plumes. Nat. Hazards Earth Syst. Sci. 2014, 14, 1099–1123. [Google Scholar] [CrossRef] [Green Version]
  4. Brenot, H.; Theys, N.; Clarisse, L.; van Gent, J.; Hurtmans, D.R.; Vandenbussche, S.; Papagiannopoulos, N.; Mona, L.; Virtanen, T.; Uppstu, A.; et al. EUNADICS early warning system dedicated to support aviation in case of crisis from natural airborne hazard and radionuclide cloud. Nat. Hazards Earth Syst. Sci. Discuss. 2021. [Google Scholar] [CrossRef]
  5. Krotkov, N.A.; Habib, S.; da Silva, A.; Hughes, E.; Yang, K.; Brentzel, K.; Seftor, C.; Schneider, D.; Guffanti, M.; Hoffman, R.L.; et al. Real Time Volcanic Cloud Products and Predictions for Aviation Alerts. In Proceedings of the 6th AIAA Atmospheric and Space Environments Conference, Atlanta, GA, USA, 17–20 June 2014. [Google Scholar]
  6. Prata, F.; Rose, B. Volcanic Ash Hazards to Aviation. In The Encyclopedia of Volcanoes, 2nd ed.; Sigurdsson, H., Ed.; Academic Press: Amsterdam, The Nerthlands, 2015; pp. 911–934. [Google Scholar] [CrossRef]
  7. Lechner, P.; Tupper, A.; Guffanti, M.; Loughlin, S.; Casadevall, T. Volcanic Ash and Aviation—The Challenges of Real-Time, Global Communication of a Natural Hazard. Adv. Volcanol. 2018, 69, 51–64. [Google Scholar] [CrossRef] [Green Version]
  8. ICAO (International Civil Aviation Organization). Manual on Volcanic ash, Radioactive Material and Toxic Chemical Clouds Doc. 9691. 2007. Available online: https://skybrary.aero/bookshelf/books/2997.pdf (accessed on 24 August 2021).
  9. Guffanti, M.; Casadevall, T.J.; Budding, K. Encounters of Aircraft with Volcanic Ash Clouds. A Compilation of Known Incidents, 1953–2009. U.S. Geological Survey Data Series 545, ver. 1.0, 12 p., plus 4 Appendixes Including the Compilation Database. Available online: https://pubs.usgs.gov/ds/545/ (accessed on 24 August 2021).
  10. Pavolonis, M.; Sieglaff, J.; Cintineo, J. Spectrally Enhanced Cloud Objects—A generalized framework for automated detection of volcanic ash and dust clouds using passive satellite measurements: 1. Multispectral analysis. J. Geophys. Res.-Atmos. 2015, 120, 7813–7841. [Google Scholar] [CrossRef]
  11. Alexander, D. Volcanic ash in the atmosphere and risks for civil aviation: A study in European crisis management. Int. J. Disast. Risk Sci. 2013, 4, 9–19. [Google Scholar] [CrossRef] [Green Version]
  12. Hirtl, M.; Arnold, D.; Baro, R.; Brenot, H.; Coltelli, M.; Eschbacher, K.; Hard-Stremayer, H.; Lipok, F.; Maurer, C.; Meinhard, D.; et al. A volcanic-hazard demonstration exercise to assess and mitigate the impacts of volcanic ash clouds on civil and military aviation. Nat. Hazards Earth Syst. Sci. 2020, 20, 1719–1739. [Google Scholar] [CrossRef]
  13. Hyman, D.M.; Pavolonis, M.J. Probabilistic retrieval of volcanic SO2 layer height and partial column density using the Cross-track Infrared Sounder (CrIS). Atmos. Meas. Tech. 2020, 13, 5891–5921. [Google Scholar] [CrossRef]
  14. Gorkavyi, N.; Krotkov, N.; Li, C.; Lait, L.; Colarco, P.; Carn, S.; DeLand, M.; Newman, P.; Schoeberl, M.; Taha, G.; et al. Tracking aerosols and SO2 clouds from the Raikoke eruption: 3D view from satellite observations. Atmos. Meas. Tech. Discuss. 2021. in review. [Google Scholar] [CrossRef]
  15. Thomas, H.E.; Prata, A.J. Sulphur dioxide as a volcanic ash proxy during the April–May 2010 eruption of Eyjafjallajökull Volcano, Iceland. Atmos. Chem. Phys. 2011, 11, 6871–6880. [Google Scholar] [CrossRef] [Green Version]
  16. Krueger, A.J. Sighting of El Chichón sulfur dioxide clouds with the Nimbus 7 Total Ozone Mapping Spectrometer. Science 1983, 220, 1377–1378. [Google Scholar] [CrossRef] [Green Version]
  17. Krotkov, N.A.; Krueger, A.J.; Bhartia, P.K. Ultraviolet optical model of volcanic clouds for remote sensing of ash and sulfur dioxide. J. Geophys. Res. 1997, 102, 21891–21904. [Google Scholar] [CrossRef]
  18. Yang, K.; Krotkov, N.; Krueger, A.J.; Carn, S.A.; Bhartia, P.; Levelt, P.F. Retrieval of large volcanic SO2 columns from the Aura Ozone Monitoring Instrument: Comparison and limitations. J. Geophys. Res. 2007, 112, D24S43. [Google Scholar] [CrossRef] [Green Version]
  19. Li, C.; Krotkov, N.A.; Carn, S.; Zhang, Y.; Spurr, R.J.D.; Joiner, J. New-generation NASA Aura Ozone Monitoring Instrument (OMI) volcanic SO2 dataset: Algorithm description, initial results, and continuation with the Suomi-NPP Ozone Mapping and Profiler Suite (OMPS). Atmos. Meas. Tech. 2017, 10, 445–458. [Google Scholar] [CrossRef] [Green Version]
  20. Theys, N.; De Smedt, I.; Yu, H.; Danckaert, T.; van Gent, J.; Hörmann, C.; Wagner, T.; Hedelt, P.; Bauer, H.; Romahn, F.; et al. Sulfur dioxide retrievals from TROPOMI onboard Sentinel-5 Precursor: Algorithm theoretical basis. Atmos. Meas. Tech. 2017, 10, 119–153. [Google Scholar] [CrossRef] [Green Version]
  21. Prata, A.J. Observations of volcanic ash clouds in the 10–12-micron window using AVHRR/2 data. Int. J. Remote Sens. 1989, 10, 751–761. [Google Scholar] [CrossRef]
  22. Realmuto, V.J. The potential use of Earth Observing System data to monitor the passive emission of sulfur dioxide from volcanoes. Geophys. Monogr. 2000, 116, 101–115. [Google Scholar]
  23. Leppelmeier, G.; Aulamo, O.; Hassinen, S.; Malkki, A.; Riihisaari, T.; Tajakka, R.; Tamminen, J.; Tanskanen, A. OMI Very Fast Delivery and the Sodankyla Satellite Data Centre. IEEE Trans. Geosci. Remote Sens. 2006, 44, 1283–1287. [Google Scholar] [CrossRef]
  24. Hassinen, S. Description and validation of the OMI very fast delivery products. J. Geophys. Res. 2008, 113, D16S35. [Google Scholar] [CrossRef] [Green Version]
  25. Torres, O. Aerosols and surface UV products from OMI observations: An overview. J. Geophys. Res. 2007, 112, D24S47. [Google Scholar] [CrossRef] [Green Version]
  26. Krotkov, N.A.; Flittner, D.; Krueger, A.; Kostinski, A.; Riley, C.; Rose, W.; Torres, O. Effect of particle non-sphericity on satellite monitoring of drifting volcanic ash clouds. JQSRT 1999, 63, 613–630. [Google Scholar] [CrossRef] [Green Version]
  27. Carn, S.A.; Krotkov, N.A. UV Satellite Measurements of Volcanic Ash. In Volcanic Ash: Hazard Observation; Mackie, S., Cashman, K., Rust, A., Ricketts, H., Watson, L.M., Eds.; Elsevier: Amsterdam, The Netherlands, 2016; pp. 217–231. [Google Scholar] [CrossRef] [Green Version]
  28. Krotkov, N.; Torres, O.; Seftor, C.; Krueger, A.J.; Kostinski, A.; Bluth, G.; Schaefer, S.J.; Rose, W.I.; Schneider, D. Comparison of TOMS and AVHRR volcanic ash retrievals from the August 1992 eruption of Mt. Spurr. Geophys. Res. Lett. 1999, 26, 455–458. [Google Scholar] [CrossRef] [Green Version]
  29. Realmuto, V.J.; Berk, A. Plume Tracker: Interactive mapping of volcanic sulfur dioxide emissions with high-performance radiative transfer modeling. J. Volcanol. Geotherm. Res. 2016, 327, 55–69. [Google Scholar] [CrossRef]
  30. Coombs, M.L.; Wech, A.G.; Haney, M.M.; Lyons, J.J.; Schneider, D.J.; Schwaiger, H.F.; Wallace, K.L.; Fee, D.; Freymueller, J.T.; Schaefer, J.R.; et al. Short-Term Forecasting and Detection of Explosions During the 2016–2017 Eruption of Bogoslof Volcano, Alaska. Front. Earth Sci. 2018, 6, 122. [Google Scholar] [CrossRef] [Green Version]
  31. Levelt, P.F.; Hilsenrath, E.; Leppelmeier, G.; Oord, G.V.D.; Bhartia, P.; Tamminen, J.; De Haan, J.; Veefkind, J. Science Objectives Of The Ozone Monitoring Instrument. IEEE Trans. Geosci. Rem. Sens. 2006, 44, 1199–1208. [Google Scholar] [CrossRef]
  32. Levelt, P.F.; Joiner, J.; Tamminen, J.; Veefkind, J.P.; Bhartia, P.K.; Zweers, D.C.S.; Duncan, B.N.; Streets, D.G.; Eskes, H.; Van Der A, R.; et al. The Ozone Monitoring Instrument: Overview of 14 years in space. Atmos. Chem. Phys. 2018, 18, 5699–5745. [Google Scholar] [CrossRef] [Green Version]
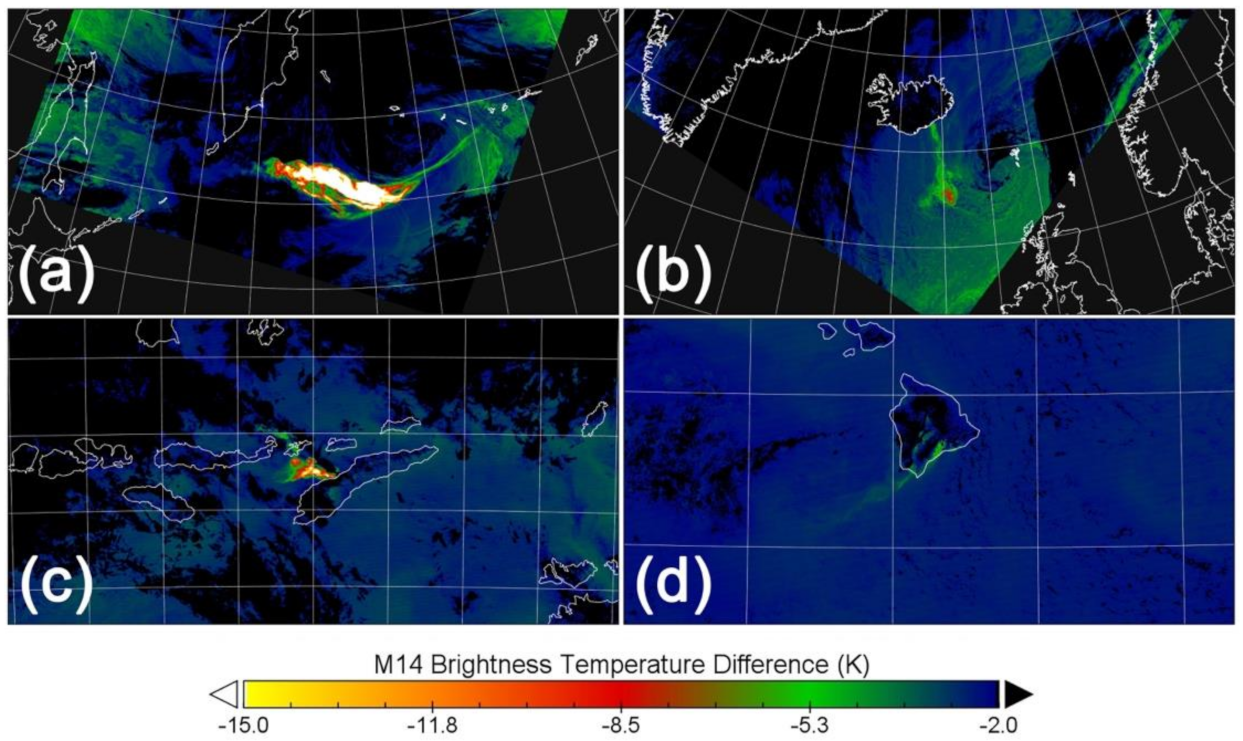
Figure 1. (a) The previous version of the science processing algorithm (SPA) for UV-based OMPS SO2 retrievals had false positive artifacts and missed SO2 (white pixels) for large eruptions such as the 2019 Raikoke eruption. (b) The updated SPA designed for DR retrievals mitigates these issues, leading to overall better data quality. Quantitative SO2 column density data are expressed in Dobson units (1 DU = 2.69 × 10¹⁶ molecules of SO2 per cm2).
Remotesensing 13 04003 g001
Figure 2. The high-resolution NOAA-20/OMPS instrument (a) offered greater detail of the SO2 plume than the low-resolution SNPP/OMPS instrument (b) after the eruption of the Fuego volcano (Guatemala) on 1 February 2018. Footprints (IFOVs) of the instruments are overlaid on the maps, showing a much higher resolution offered by NOAA-20/OMPS. Such high-resolution measurements reveal greater details and cover a larger portion of the volcanic plume.
Remotesensing 13 04003 g002
Figure 3. Distinctive features in the TIR spectra of (a) SO2, (b) silicate ash, and (c) ice crystals allow us to discriminate volcanic SO2 and ash (d) from icy meteorological clouds. The color composite of data from the VIIRS TIR channels (d) shows the distributions of SO2, ash, and ice crystals in the Raikoke eruption clouds at 14:30 UTC on 22 June 2019.
Remotesensing 13 04003 g003
Figure 4. We evaluated the scaling of BTD14—(BT14 MAX(BT14, BT15, BT16)) through analysis of VIIRS observations of SO2 plumes representing a range of plume heights and atmospheric conditions (Table 1). The SO2 plumes were detected successfully in each test case: (a) Raikoke, (b) Bardarbunga, (c) Lewotolo, and (d) Kilauea.
Remotesensing 13 04003 g004
Figure 5. The VIIRS (a) SO2 and (b) Ash Index maps for the 2019 Raikoke (Kurile Islands) eruption clouds on 24 June 2019. As demonstrated by these Raikoke maps, our scaling and visualization strategies capture all but the strongest absorption without saturating while also delineating subtle plumes with weaker absorption.
Remotesensing 13 04003 g005
Figure 6. The VIIRS-SO2 and OMPSnadir science processing algorithms’ (SPAs) architecture within the DRL’s IPOPP framework.
Remotesensing 13 04003 g006
Figure 7. Time-enabled web application hosted in the Disasters Mapping Portal (https://go.nasa.gov/3v4MSft accessed on 5 October 2021) showing OMPS SO2 column density overlayed on VIIRS True Color Imagery on 25 June 2020, for the Nishinoshima volcano (triangle) eruption.
Remotesensing 13 04003 g007
Figure 8. Ash plume from the 2018 Veniaminof eruption as seen by SNPP VIIRS at 22:30 UTC: (a) true color RGB composite, (b) false color composite of TIR, (c) operational (AWIPS) TIR false color RBG generated at A-VAAC, and (d) the VIIRS Ash Index from GINA/DRL VIIRS-SO2 SPA (v1.3) similar to Figure 5b.
Remotesensing 13 04003 g008
Figure 9. Direct readout SNPP/OMPS SO2 data for the March 2016 Mount Pavlof eruption integrated into the AVO VolcView Decision Support Tool (DST) (https://volcview.wr.usgs.gov/vv-gui/ accessed on 5 October 2021). VIIRS TIR SO2 data are ingested into this DST at AVO and A-VAAC for nighttime coverage.
Remotesensing 13 04003 g009
Figure 10. (a) Direct readout coverage of the NASA EOS Aura Ozone Monitoring Instrument (OMI), SNPP, and NOAA20 direct broadcast received via the FMI satellite downlink station in Sodankylä in northern Finland (yellow) and GINA ground station in Fairbanks, Alaska (green). (b) Several OMI orbits composite SO2 map showing long-range SO2 transport (red) from the May 2011 Grimsvotn eruption in Iceland. (c) OMPS composite UV Aerosol Index (UVAI) map showing the long-range transport of September 2010 forest fire smoke clouds from the US West Coast. (d) OMPS composite SO2 map showing the dispersion of SO2 clouds from the 2019 Raikoke eruption. Currently, both OMI and OMPS volcanic SO2 and UVAI maps are processed and made available at the FMI SAMPO website (https://sampo.fmi.fi/products accessed on 5 October 2021) within ~30 min of satellite acquisition.
Remotesensing 13 04003 g010
Table 1. Summary of the test cases.
VolcanoDateLatitudeClimate ZonePlume Height (km)Total
Precipitable H2O (mm)
Raikoke22 June 201950°NSubarctic10–1322.4
Bardarbunga05 September 201462°NArctic5–612.6
Lewotolo29 November 20209°STropical5–642.9
Kilauea22 December 202019°NSubtropical~230.3
Publisher’s Note: MDPI stays neutral with regard to jurisdictional claims in published maps and institutional affiliations.

