Attribution of Long-Term Evapotranspiration Trends in the Mekong River Basin with a Remote Sensing-Based Process Model

1
Key Laboratory of Water Cycle & Related Land Surface Processes, Institute of Geographic Sciences and Natural Resources Research, Chinese Academy of Sciences, Beijing 100101, China
2
College of Resources and Environment/SDC College, University of Chinese Academy of Sciences, Beijing 101407, China
*
Author to whom correspondence should be addressed.
Remote Sens. 2021, 13(2), 303; https://0-doi-org.brum.beds.ac.uk/10.3390/rs13020303
Submission received: 1 December 2020
/
Revised: 8 January 2021
/
Accepted: 9 January 2021
/
Published: 16 January 2021
(This article belongs to the Special Issue Remote Sensing in Hydrology and Water Resources Management)
Abstract
:Using the Global Land Surface Satellite (GLASS) leaf area index (LAI), the actual evapotranspiration (ETa) and available water resources in the Mekong River Basin were estimated with the Remote Sensing-Based Vegetation Interface Processes Model (VIP-RS). The relative contributions of climate variables and vegetation greening to ETa were estimated with numerical experiments. The results show that the average ETa in the entire basin increased at a rate of 1.16 mm year−2 from 1980 to 2012 (36.7% of the area met the 95% significance level). Vegetation greening contributed 54.1% of the annual ETa trend, slightly higher than that of climate change. The contributions of air temperature, precipitation and the LAI were positive, whereas contributions of solar radiation and vapor pressure were negative. The effects of water supply and energy availability were equivalent on the variation of ETa throughout most of the basin, except the upper reach and downstream Mekong Delta. In the upper reach, climate warming played a critical role in the ETa variability, while the warming effect was offset by reduced solar radiation in the Mekong Delta (an energy-limited region). For the entire basin, the available water resources showed an increasing trend due to intensified precipitation; however, in downstream areas, additional pressure on available water resources is exerted due to cropland expansion with enhanced agricultural water consumption. The results provide scientific basis for practices of integrated catchment management and water resources allocation.
1. Introduction
As a result of the impacts of global warming and human activities, the global water cycle has been intensified, leading to changes in global precipitation [1], evapotranspiration (ET) [2,3] and runoff [4]. More than half of the global absorbed solar radiation is used for ET, which reintroduces approximately 60% of land surface precipitation back into the atmosphere [5]. However, the mechanisms responsible for the variations in ET are spatially heterogeneous; thus, investigating ET variations and their underlying mechanisms can improve our ability to simulate land surface processes and predict future water cycle alterations.
Terrestrial ET variations are impacted by changes in the atmospheric evaporative demand (AED), water supply and physiological properties of vegetation. Observational and experimental evidence has shown that climate factors, including precipitation, solar radiation, temperature and wind speed, control both the AED and the water supply for terrestrial ET. Research has found that in humid areas, long-term ET variations are driven primarily by changes in incident solar radiation, whereas ET variations in arid areas are controlled predominantly by the soil water supply, which is linked to precipitation [6]. In addition to climate factors, elevated atmospheric CO2 concentrations can also induce changes in ET by stimulating the photosynthetic rate, thereby increasing plant growth and leaf areas, which accelerates the rate of ET [7]. Due to increasing CO2 fertilization, nitrogen deposition, climate change and land-use change, the global leaf area index (LAI) increased significantly by 8% during 1982–2011 [8], which had a significant impact on the intensification of terrestrial ET. Numerical modeling has played an important role in simulating terrestrial ET [9,10], and provides a possible solution for quantifying the contributions of different environmental factors on ET [9]. For example, with a land surface model, Shi et al. [10] and Mao et al. [11] pointed out that spatio-temporal variations in ET were determined mainly by climate variables. However, when a remote-sensing ET model with observation-based environmental drivers was applied, it was found that more than half of the accelerated global terrestrial ET was caused by vegetation greening [9], which suggests that the attribution of regional terrestrial ET trends without considering vegetation dynamics is improper. Considering the climate changes and vegetation greening on regional ET and available water supply are still unclear, based on the remote sensed LAI data, the contributions of climate control and vegetation greening to ETa can be quantified with an ecological model.
The Mekong River Basin (MRB), which is rich in natural resources, spans large parts of continental Southeast Asia. However, under the impacts of climate change and rapid socioeconomic development over recent decades, the natural resources within the MRB have faced increasing pressure. Since the 1950s, the MRB has been characterized by significant increases in the temperature and spatial-temporal variation of precipitation [12,13]. The hydrological cycle has therefore intensified, resulting in changes in the rates and patterns of ET and river flows [14,15]. Differences in flow variability were found between the upper and lower MRB because floods mostly originate from rainfall and snowmelt in the upper MRB [16], while the hydrology of the lower Mekong is controlled by the western North Pacific monsoon [17]. Moreover, a significant positive correlation was found between discharge, precipitation and snow cover in the upper MRB, especially during the dry season [18]. In contrast, in the lower MRB, changes in discharge are driven primarily by the variation in the Asian summer monsoon [17]. In addition, rapid economic development, population growth and widespread agricultural deforestation have created pressures leading to competition for water [19]. Land-use changes, which manifest mainly as transformation into cropland, have increased the consumption of water through irrigation [20,21] and affected the land surface roughness and albedo, thereby altering both the hydrologic processes [22] and the energy balance at the surface [23,24]. Therefore, although the average variations in ET and runoff at the basin scale are relatively small, the changes in these parameters in the highly irrigated areas of the lower MRB are significant due to the expansion of cropland and additional irrigation [20,25].
According to the results of climate modeling, the monsoon patterns in the MRB will change, resulting in significant increases in the average precipitation and temperature over the basin [26]. However, it remains unclear how these climate changes and the overlapping effects of land-use change will alter the regional ET and available water supply. In this study, the long-term actual ET (ETa) in the MRB was simulated by Remote Sensing-Based Vegetation Interface Processes Model, and we aim to (1) explore the trends and variability of ETa and the availability of water resources in recent decades and (2) quantify the contributions of climate control and vegetation greening to ETa. This paper is organized as follows, Section 2 describes the datasets and attribution methods using VIP-RS model, while Section 3 highlights the results for the ETa variation and identifies relative contributions of climate variables and vegetation greening to ETa. Finally, Section 4 and Section 5 delve into the discussions and conclusions of this work.
2. Materials and Methods
2.1. Study Region
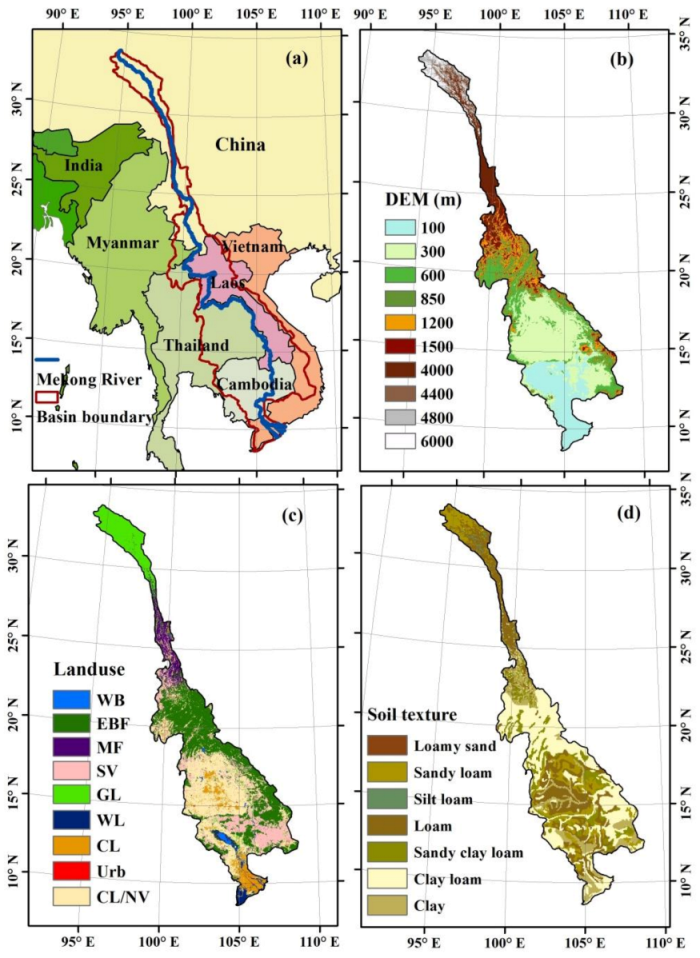
As the longest river in Southeast Asia, the Mekong River (4800 km) passes through six countries and boasts a drainage area of 805,604 km2. As a result of the Asian monsoon, the mean annual precipitation in the MRB shows significant spatiotemporal heterogeneity. More than 90% of annual precipitation falls during the rainy season, which spans from mid-May to early October. The highest annual rainfall occurs in the mountainous regions of Laos, which receives mean annual precipitation of 3200 mm, whereas the lowest annual rainfall reaches approximately 1000 mm in northeastern Thailand [27]. The land cover types in the upper catchment are primarily tundra and grassland, whereas farther downstream, the natural vegetation is dominated by evergreen broadleaved forest; in the lower catchment and Mekong Delta, cropland is the major land-use type (Figure 1).
2.2. Data
2.2.1. Meteorological Data
Meteorological data, including temperature, surface air pressure, longwave radiation, shortwave radiation, precipitation, relative humidity and wind speed, were collected on a daily scale from 1980 to 2012. The meteorological data were provided by the Inter-Sectoral Impact Model Intercomparison Project (ISIMIP) [28,29], with a spatial resolution of 0.5 × 0.5°. The meteorological data used in this study were resampled to 5 × 5 km with the bilinear resampling method. The air temperature, precipitation and wind speed data were resampled at sea level, and then were corrected to the real elevation based on a digital elevation model (DEM) with a 5 km resolution after bilinear resampling (Appendix A).
2.2.2. Land Surface Characterization Data
The land surface characterization data included topographic maps, land-use maps and soil texture maps. DEM data were obtained from the GTOPO30 global DEM (https://lta.cr.usgs.gov/GTOPO30) and resampled to a 5 km resolution with cubic Lagrange interpolation. Land cover data (MOD12Q1) were downloaded from the Moderate Resolution Imaging Spectroradiometer (MODIS) website (http://modis.gsfc.nasa.gov/data/) with a spatial resolution of 500 m and a temporal resolution of one year. Land cover data from 2000 to 2012 were used in this study and were resampled to 5 × 5 km with the majority resampling method [30]. The soil texture map was obtained from the Harmonized World Soil Database v 1.2 provided by the Food and Agriculture Organization of the United Nations.
2.2.3. Remote Sensing Data
The remote sensing data included the Global Land Surface Satellite (GLASS) LAI product, Global Land Evaporation Amsterdam Model (GLEAM) ET data and Gravity Recovery and Climate Experiment (GRACE) data. Based on general regression neural networks, the GLASS LAI product (http://glass-product.bnu.edu.cn/), which has a spatial resolution of 0.05° and a temporal resolution of 8 days, was retrieved from MODIS and Advanced Very-High-Resolution Radiometer (AVHRR) land surface data. Compared with MODIS LAI and CYCLOPES LAI data, the GLASS LAI product is spatially more complete and temporally more continuous [31]. Monthly actual ET data from GLEAM v3.2 (https://www.gleam.eu/), which have a spatial resolution of 0.25 × 0.25°, were used to validate the ETa results. Based on the function between the soil moisture stress and potential evaporation calculated with the Priestley–Taylor equation, four evaporation components can be obtained from GLEAM, namely, interception loss, bare soil evaporation, plant transpiration and evaporation from water bodies and regions covered by ice and/or snow. With the bilinear resampling method, the GLASS LAI data and actual ET data from GLEAM from 2000 to 2012 were resampled to 5 × 5 km. In addition to the GLEAM ETa, monthly ETa data calculated from the water balance equation were also used to validate the ETa results at the basin scale:
where P and R are the precipitation and the runoff respectively, and ds/dt is the derivative of the terrestrial water storage anomaly (TWSA) with respect to time.
The TWSA can be reflected by GRACE RL05 data, which can be retrieved from the website of the Jet Propulsion Laboratory, California Institute of Technology (https://grace.jpl.nasa.gov/data/get-data/monthly-mass-grids-land/). After removing the effects of the atmosphere, oceans and tides, monthly level-2 GRACE RL05 data from 2003 to 2012 were used in this study. To restore signal losses arising from the sampling and post processing of GRACE data, the data were recorrected with a scaling factor approach [32], and the data gaps were filled using cubic Lagrange interpolation.
The runoff data were provided by the Global Runoff Data Centre (https://www.bafg.de/GRDC/EN/02_srvcs/21_tmsrs/riverdischarge_node.html).
2.3. Method
2.3.1. Model Introduction
ETa was simulated by the Remote Sensing-Based Vegetation Interface Processes (VIP-RS) model [33,34]. The total ETa is composed of evaporation due to canopy interception (Ei), transpiration from vegetation (Ec) and soil evaporation (Es). Transpiration (Ec) is estimated based on potential transpiration (Ecp) and is limited by water conditions (fw) and temperature (ft), as follows:
where fw is the stress function of the atmospheric water vapor pressure deficit calculated using the algorithms proposed by Mu et al. [35] and ft is the stress function of the air temperature calculated using the algorithms proposed by Zhang et al. [36]. Ecp is calculated using the Penman-Monteith (PM) equation as follows:
where Rnc is the net radiation absorbed by the canopy, Δ represents the slope of the saturated vapor pressure curve versus air temperature,γ, ρ, cp and D represent the psychrometric constant (hPa °C−1), air density (kg m−3), specific heat capacity of air (J kg−1 °C−1) and vapor pressure deficit (hPa), respectively. Additionally, η is the ratio of the minimum stomatal resistance of a natural functional plant type to that of a reference crop, λ is the latent heat of the vaporization of water (J kg−1) and ra is the aerodynamic resistance between the canopy and the reference height (s m−1). fc is the fractional vegetation cover, and is the stress function of atmospheric CO2 [37]. These two factors are calculated as follows:
where CO2 is the atmospheric CO2 concentration (ppm), β is an empirical constant, being 0.6 to 1.2, taken here as 0.7 [38], and VImax and VImin represent the vegetation index values under full vegetation cover and bare soil conditions, respectively (set to 0.95 and 0.01). Additionally, and are the maximum and minimum fPAR corresponding to VImax and VImin respectively, and are set to 0.95 and 0.001. LAImax is the maximum LAI during the growing period (assumed to be 6.0) [39]; the LAI, which influences the partitioning of energy between the soil and canopy, is retrieved from remote sensing data.
The evaporation due to canopy interception (Ei) equals the potential evaporation from the wetted surface. Soil evaporation (Es) is the minimum value of surface potential evaporation (Esp) and soil moisture exfiltration (Eex) [40]:
where Rns is the net radiation absorbed by the soil surface, G is the soil heat flux (MJ d−1) [41], ras is the aerodynamic resistance between the reference height and the soil surface (s m−1), (set as 0.05) [42] and (set as 0.315) [43] are the ratios of G to Rnc for full vegetation canopy and bare soil, respectively.
2.3.2. Model Implementation and Verification
Driven by the daily meteorological data (average, maximum and minimum air temperatures, atmospheric pressure, humidity, wind speed, precipitation, longwave downwelling radiation and shortwave downwelling radiation), the daily ETa from 1980 to 2012 was simulated by the VIP-RS model at a spatial resolution of 5 km. As the initial condition of soil moisture was not available, the spatial pattern of soil moisture after one-year run was used as the initial state [44], and daily ETa from 1981 to 2012 were used for the subsequent analysis. The tendency of annual ETa and its significances were explored based on the Theil-Sen estimator and Mann–Kendall (M-K) test.
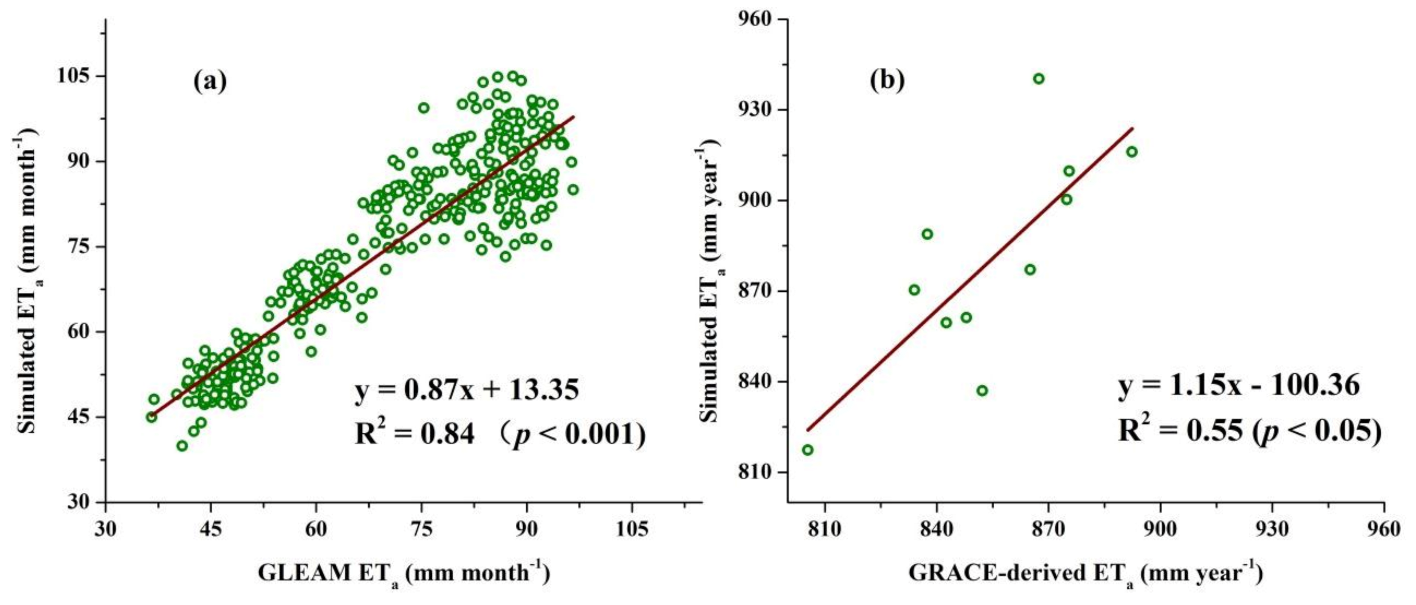
The simulated monthly ETa was consistent with the actual ET from GLEAM (Figure 2a) and yielded an R2 value of 0.84. The mean bias and root mean square error (RMSE) between the simulated and GLEAM ETa were 4.5 mm month−1 and 8.17 mm month−1, respectively. At annual scale, the GRACE-derived ETa and simulated ETa showed acceptable consistency with an R2 of 0.55. However, the GRACE-derived ETa was 25.72 mm year−1 lower than the simulated ETa, indicating that the VIP-RS model slightly overestimated the yearly ETa in the MRB.
2.3.3. Attribution of ETa to Climate Change
The factor separation methodology [45] is a popular technique for evaluating the contribution of each input factor to a chosen response variable. To quantitatively distinguish the effects of climate change, carbon dioxide enhancement, vegetation greening and their interactions on the ETa trend, thirty simulation experiments were designed based on the factor separation method. In each simulation experiment, one or more variables were varied according to the observation records, while the other variables were varied according to the control conditions [46]. The control simulation (f(con)) is driven by the mean climatology, average atmospheric CO2 concentration and vegetation dynamics from 1982 to 1990. The ETa result from the control simulation is the expected value under the average climate and vegetation conditions of the 1980s. In the control simulation, the CO2 concentration is the average CO2 value from 1982 to 1990. Except for precipitation, the climate drivers and LAI in the control simulation are the multiyear means for individual days (expressed as Julian days) from 1982 to 1990. To eliminate the impact of variation in rainfall patterns on the resulting ETa, the precipitation in each year (1982–1990) is used in the control simulation, and the final ETa result from the control simulation is the average value of each year. The thirty performed simulation experiments included one control simulation, seven simulations (f(var1)), in which only one of the seven factors was varied each time, and twenty-one simulations (f(var1_var2)), in which two of the seven factors were varied for each model run (Appendix B, Table A1). Simulation experiment f(var1) denotes the simulation driven by the variable var1, which was varied according to the ISIMIP records, and the other variables were set to the control conditions. Similarly, simulation experiment f(var1_var2) is the simulation driven by the variables var1 and var2, which were varied according to the ISIMIP records, while the other variables were set to the control conditions. The seven factors used in the simulation experiments are temperature, precipitation, net radiation, vapor pressure, wind speed, LAI and atmospheric CO2 concentration.
The main effect of each factor on the ETa trend is the difference between the ETa result from the simulation with only one variable factor and the result from the control simulation. For example, the main effects of variable one (var1) and variable two (var2) on the ETa trend are as follows:
The two-factor interactive effect of variables one (var1) and two (var2) is calculated by subtracting the main effects of var1 and var2 from the combined effect of var1 plus var2. For example, the two-factor interactive effect of var1 and var2 (E(var1_var2)) is expressed as:
where E(var1) and E(var2) are the effects of var1 and var2 on the ETa trend, respectively.
The land-use transfer matrix, which is used to analyze spatial-temporal changes in land use, is built with land-use data (with a spatial resolution of 500 m) from 2000 and 2012. To assess the contributions of land-use changes to ETa, the control simulation (f(land_con)) was driven by the land-use data from 2000. For certain land-use types, simulation f(land_type1) was driven by one land-use type that was varied according to the records from 2010, while the other land-use types remained unchanged according to the year 2000. The effect of a change in a particular land-use type (land_type1) on the ETa trend is the difference between f(land_type1) and f(land_con). Considering that ETa was simulated at a 5 km resolution and that the land-use data have a spatial resolution of 500 m, to assess the contributions of land-use changes to ETa, the ETa value in each sub-grid and the contributions of different sub-grid-scale land-use types to the grid box average were calculated (Equation (14)) to reduce the error in the ETa simulation:
where ETai is the ETa value in each sub-grid (5 km resolution) with land-use type i (Figure 1) and Vi is the proportion of land-use type i in each sub-grid with a 5 km resolution. Vi is obtained from land-use data with a spatial resolution of 500 m.
3. Results
3.1. Spatial-Temporal Variation of Actual ET
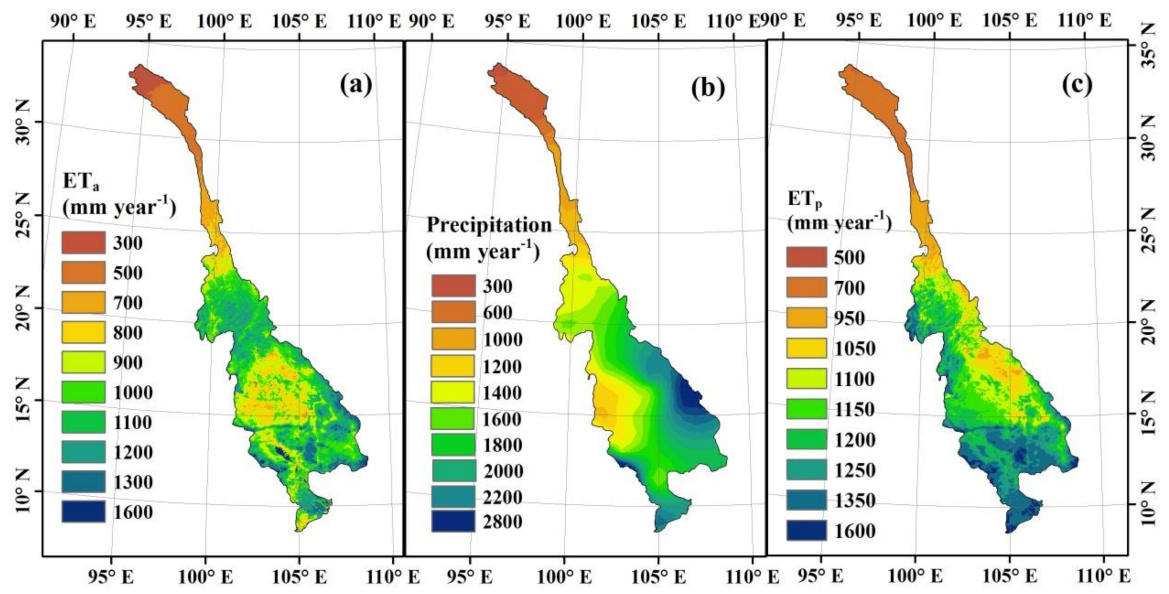
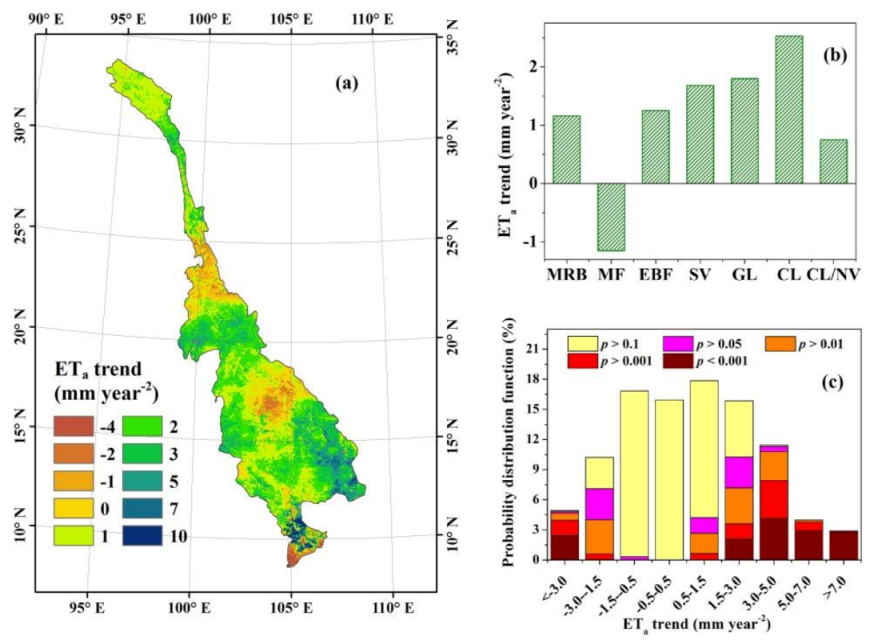
ETa is principally controlled by the AED (represented by ETp) and precipitation. The annual ETa in the MRB showed remarkable spatial heterogeneity with an average value of 896 ± 34 mm year−1 and increased gradually from north to south with a range of 300 to 2000 mm year−1. From 1982 to 2012, 70% of the study area showed an increasing ETa trend with an average increase rate of 1.16 mm year−2.
In the upper basin, where the precipitation is less than 800 mm year−1 and the AED is weak, the annual ETa is less than 400 mm year−1 (Figure 3). Due to rising temperatures, glacial melting in the upper basin has accelerated, which has been accompanied by increased precipitation, and the annual ETa has shown a significant increasing trend over more than 13.7% of the study area (p < 0.01, Figure 4c).
In the central and lower reaches of the basin, the situation is relatively complex. In evergreen broadleaf forest, which have abundant rainfall (annual precipitation > 1700 mm year−1), the spatial pattern of the average annual ETa is highly consistent with the average annual ETp (Figure 3), whereas in cropland/natural vegetation mosaic areas, which have an average annual precipitation of less than 1200 mm year−1, approximately 75% of the rainfall returns to the atmosphere through evaporation; as a result, the spatial pattern of ETa is similar to that of precipitation. A significant positive temporal trend of ETa was found in the Mekong Delta and the southeastern basin (Figure 4a), where precipitation and LAI display increasing trends. Significant positive trends of ETa were found in 36.7% of the MRB (p < 0.05), most of which corresponded to savanna and cropland with high increasing rate of annual ETa (Figure 4c). The highest increasing rate was found in cropland (2.53 mm year−2), followed by grassland (1.8 mm year−2), savanna (1.68 mm year−2) and evergreen broadleaf forest (1.25 mm year−2) (Figure 4b). Approximately 16.7% of the area of the MRB had significant negative ETa trends, and most of this area corresponded to mixed forest (with an average decreasing rate of 1.15 mm year−2) and cropland/natural vegetation mosaic, because solar radiation and precipitation both showed decreasing trends in these regions (Appendix B, Figure A1).
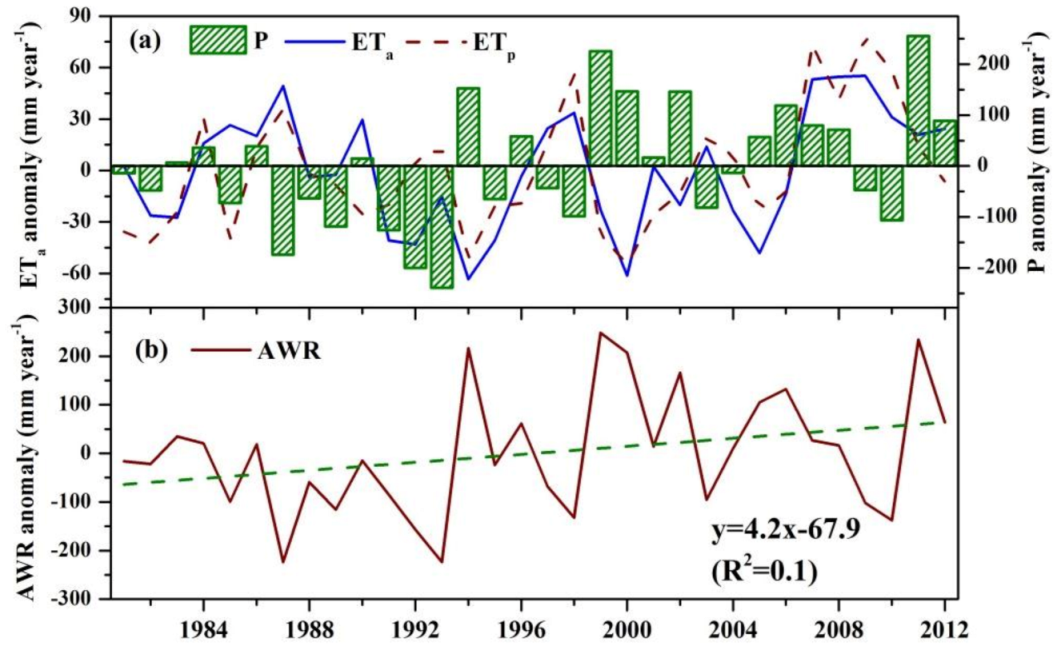
The spatial pattern of annual available water resources (AWR, the difference between precipitation and ETa) variation is highly consistent with that of precipitation, as shown in Figure 5 and Appendix B, Figure A1. From 1981 to 2012, the annual AWR in approximately 23.6% of the grids throughout the MRB showed significant positive trends, whereas 6.4% of the grids showed significantly negative trends. The grids with positive trends were distributed mainly in the evergreen broadleaf forest of the central reach of the basin and the savanna of the southeastern basin (Figure 5). For the entire basin, the average increasing rate of AWR was about 0.32% year−1. The largest increasing rate was found in evergreen broadleaf forest (approximately 0.88% year−1), followed by that in savanna (0.56% year−1), cropland and natural vegetation mosaic (0.41% year−1) and grassland (0.23% year−1). The grids with negative trends were distributed primarily in the mixed forest of the upper basin and the cropland of the Mekong Delta. The precipitation decreased significantly in the mixed forest, which resulted in a decrease in the AWR (Figure 5). Although the precipitation showed a minor increasing trend in the paddy fields of the Mekong Delta (Appendix B, Figure A1), the ETa increased sharply (Figure 4), resulting in a significant decrease in the AWR. This finding implies that additional water is needed for agricultural development in the Mekong Delta. For the entire basin, the correlation coefficient between the AWR anomaly and precipitation anomaly was 0.96, which is much higher than that between the AWR anomaly and ETa anomaly (0.14) (Figure 6), demonstrating that water consumption has a minor effect on the regional variation of AWR. Thus, the inter-annual variation of AWR is affected mainly by the water supply (precipitation).
3.2. Attribution of Actual ET
3.2.1. Attribution of Actual ET Change to Climate Change and Vegetation Greening
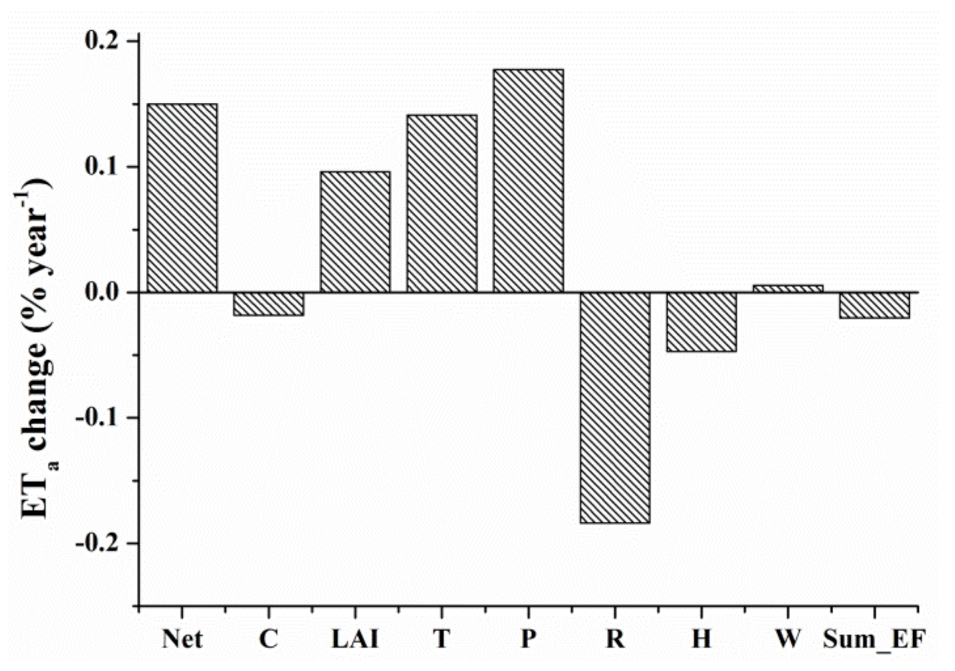
The inter-annual variation of ETa was mainly influenced by changes in precipitation, solar radiation, temperature, vapor pressure, atmospheric CO2 and the LAI (Figure 7). Although increasing atmospheric CO2 concentrations reduced stomatal conductance, which could have been responsible for the decreased ETa, the effect of CO2 fertilization on ETa was very weak (0.0018% year−1), indicating that climate change and vegetation greening were the dominant factors driving the terrestrial ETa variation.
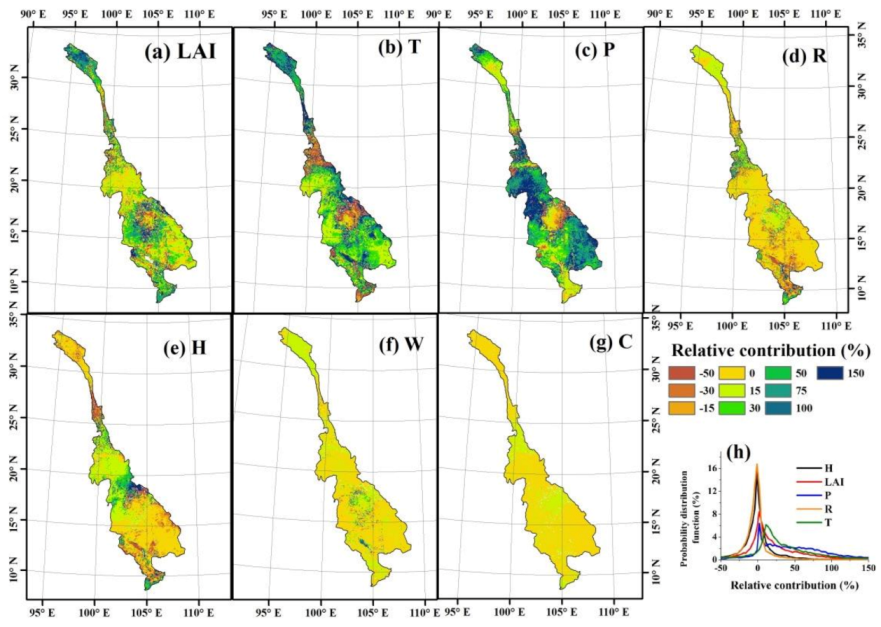
From 1981 to 2012, except for net radiation, all the climate factors showed increasing trends in the MRB. The air temperature showed a significant increasing trend in all land-use types with an average increasing rate of 0.23 °C per decade. Accompanied by precipitation increasing (Appendix B, Figure A1), a warming–wetting trend was found throughout the MRB, which is beneficial to vegetation growth in most parts of the MRB. Consequently, the LAI showed an increasing trend in all land-use types except mixed forest (−0.17% year−1). The highest LAI increasing rate was found in farmland (1.42% year−1), followed by grassland (0.96% year−1), savanna (0.68% year−1) and evergreen broadleaf forest (0.49% year−1). Increases in precipitation, temperature and the LAI had positive effects on the ETa trend that counteracted the negative effects caused by decreases in solar radiation and increases in vapor pressure. For the entire basin, the relative contributions of temperature, precipitation, solar radiation, vapor pressure and LAI to the ETa trend were 43.7%, 21.8%, −16.8%, −2.8% and 54.1%, respectively (Figure 7). Precipitation was the dominant driving factor affecting ETa in approximately 42% of the grids in the MRB, and most of these grids were located in grassland, evergreen broadleaf forest and savanna areas. The LAI had a significant positive effect on the ETa trend in the grassland of the upper basin, the savanna of the central basin and the cropland of the Mekong Delta. Solar radiation and temperature were the dominant factors driving the ETa variation in approximately 35% of the grids throughout the MRB, and most of these grids were located in cropland, grassland and savanna (Figure 8).
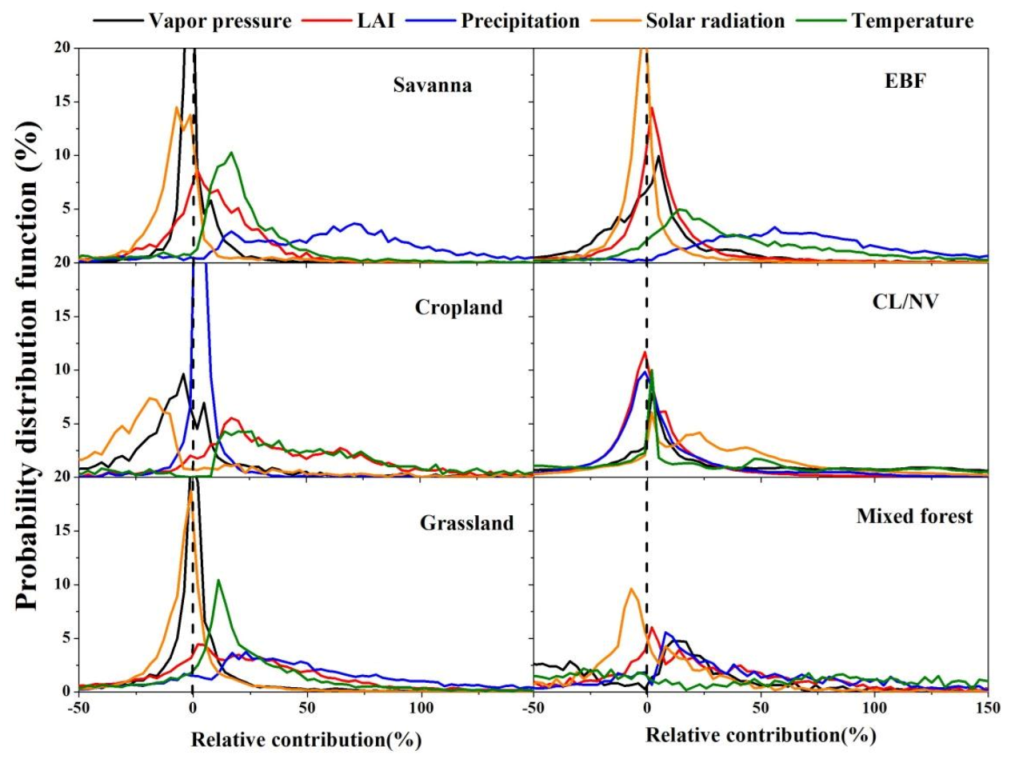
Variations in actual ET are principally controlled by variations in the water supply and AED. McVicar [47] divided the environment into three types: energy-limited areas (ETp/p < 0.76), “equitant” areas (0.76 < ETp/p < 1.35), and water-limited areas (ETp/p > 1.35). In the grassland of the upper basin (ETp/p = 1.37), precipitation is the dominant factor affecting the observed ETa variation, but increasing temperatures also play an important role (Figure 9). Glacial meltwater is an important water source in the upper basin. Temperature increasing not only improved the thermal conditions for vegetation growth but also accelerated glacial melting, which may provide more water for vegetation growth. The negative effect of ETa on runoff was offset by the positive effect of glacial meltwater in the Lancang River [48]. Therefore, although the grassland in the upper basin is a water-limited region (precipitation and the LAI are the principal driving factors in approximately 68% of grassland areas), the relative contribution of temperature varied from 5% to about 25% in more than 65% of the grassland grids (Figure 9).
In the central and lower reaches of the basin, the positive effect of increasing temperature on ETa was offset by the negative effect of reduced solar radiation, especially in evergreen broadleaf forest (ETp/p = 0.68), mixed forest (ETp/p = 0.83) and savanna (ETp/p = 0.76) (Figure 9). In more than 75% of grids of the abovementioned vegetation types, the relative contributions of precipitation varied from 25% to about 70%, while the relative contribution of temperature and solar radiation varied from 5% to about 65% and from −25% to about 5%, demonstrating that the water supply (precipitation) and energy (temperature and solar radiation) have equivalent impacts on the ETa variation. Because irrigation is a major source of water in cropland (ETp/p = 0.73) and cropland/natural vegetation mosaic (ETp/p = 0.69), the relative contribution of precipitation to ETa variation is weak (within a range of ±15% in more than 85% of the grids). Thus, temperature and solar radiation are the principal driving factors in more than 80% of the grids, indicating that cropland and cropland/natural vegetation mosaics are energy-limited regions.
3.2.2. Contribution of Land-Use Changes to ETa
Since 2000, the MRB has been characterized by the expansion of cropland and cropland/natural vegetation mosaic. In the central basin, the increase in cropland was mainly attributed to the conversion of cropland/natural vegetation mosaic, and the loss of cropland/natural vegetation mosaic was compensated by the conversion of savanna, which resulted in a decrease in savanna (Table 1). In the Mekong Delta, the increase in cropland benefited from the conversion of wetlands and water bodies. Another noticeable change is that approximately 18.55% and 16.38% of mixed forest were converted into evergreen broadleaf forest and savanna respectively, which resulted in a decrease in mixed forest.
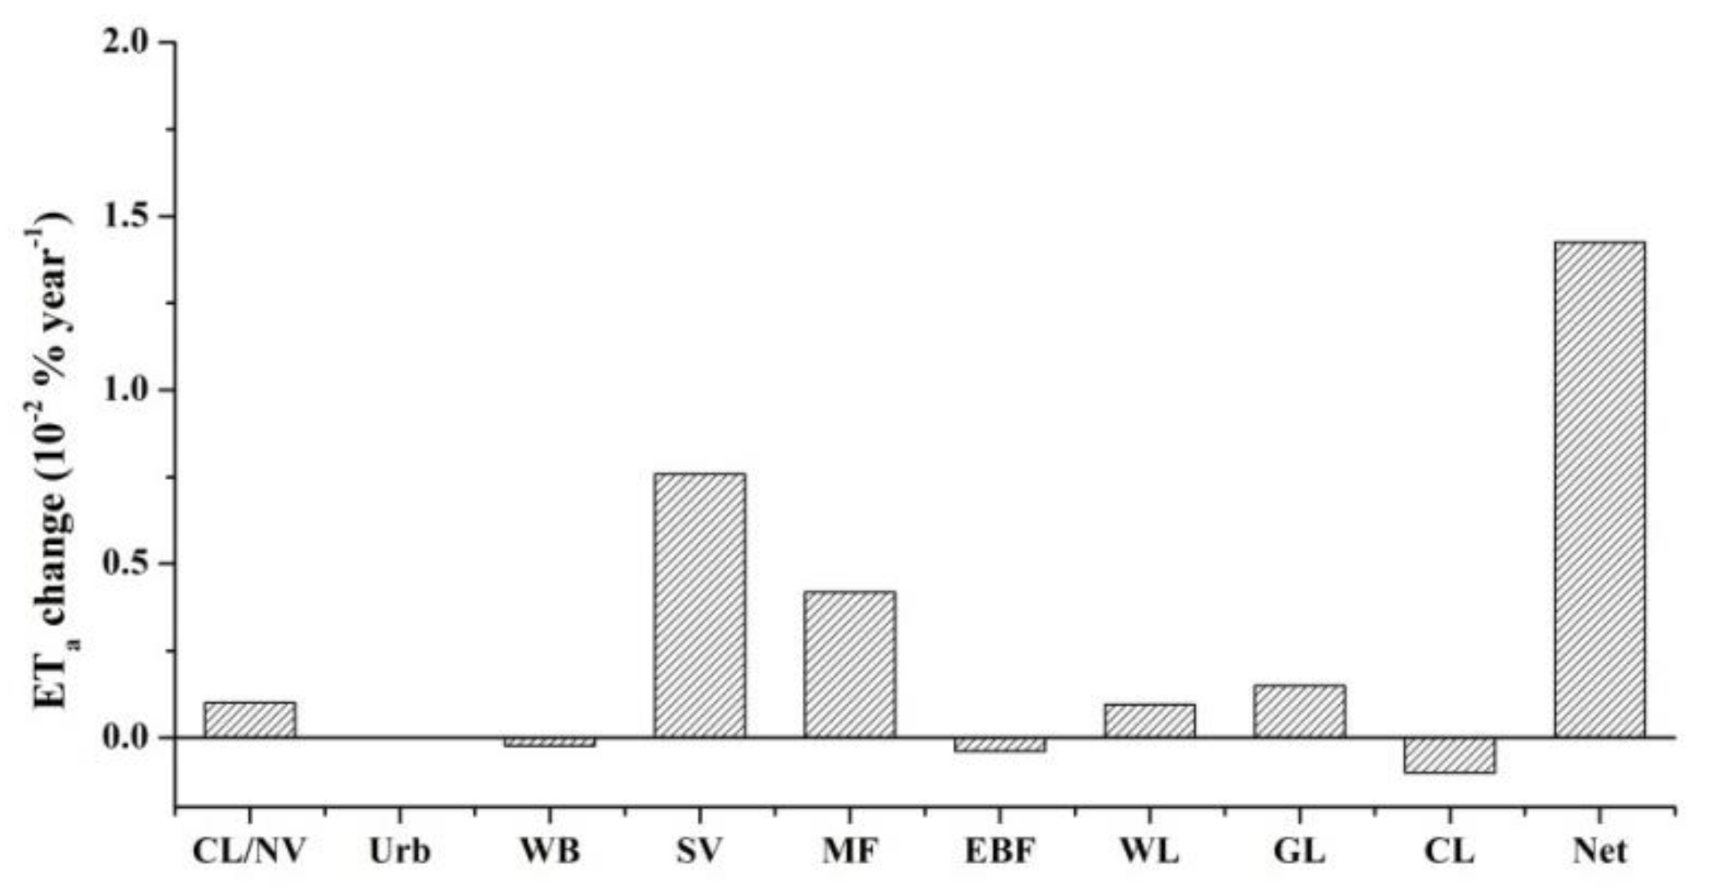
For the entire basin, land-use change enhanced the increase of ETa by 0.014% year−1, 53.24% and 29.34% of which were attributed to the conversion of mixed forest and savanna respectively, into other land-use types (Figure 10). Compared with the effects of climate change and vegetation greening on ETa variation (0.15% year−1), the relative contribution of land-use change on ETa variation was only 9.3%, indicating that climate change and vegetation greening are the principal factors affecting the regional ETa variation. However, the expansion of cropland in the Mekong Delta enhanced the ETa increase by 15%, demonstrating that land-use change notably affects the water balance in this region.
4. Discussion
4.1. Impact of Climate Change and Vegetation Greening on ETa
In the upper MRB, ETa is limited by the soil moisture supply. Although the increased rate of precipitation in the upper basin is lower than that in the lower basin (Figure A1), ETa is sensitive to small changes in precipitation in water-limited regions. In equitant regions, such as evergreen broadleaf forest, the annual precipitation is larger than that in water-limited regions. ETa is not totally limited by the soil moisture supply; thus, the sensitivity and relative contribution of precipitation decline. Similarly, because soil moisture in the cropland of the Mekong Delta is supplied by both precipitation and irrigation (Figure 9), ETa is insensitive to variations in precipitation, while variations in air temperature and solar radiation constitute the predominant driving forces for potential ET, and hence ETa. Therefore, precipitation is responsible for the observed variation in ETa over arid and semiarid regions, whereas air temperature and incident solar radiation are more important over humid regions [6,49,50].
For the entire basin, vegetation greening provides a greater contribution (54.1%) to the variation in ETa than climate change does. Under enhanced CO2 concentrations, leaf stomatal conductance will decrease, and increasing atmospheric CO2 concentrations could be responsible for decreases in ETa. Although the direct effect of CO2 fertilization on ETa is weak (0.02 mm year−1 in MRB and 0.05 mm year−1 at the global scale) [4], it must be noted that CO2 fertilization explains 70% of the global observed greening trend [51], and its negative effect may be entirely compensated by increases in leaf area. From 1981 to 2011, approximately 55% ± 25% of the observed global terrestrial ETa increase was caused by vegetation greening [52]. The same phenomenon was also found in MRB, increases in the LAI are associated with the intensification of terrestrial ETa (Figure 7). Considering that the greening of the Earth is projected to continue worldwide during the 21st century in most Coupled Model Intercomparison Project Phase 5 (CMIP5) Earth system models involved in the Intergovernmental Panel on Climate Change (IPCC) Fifth Assessment Report (AR5) [53], the water cycle will continue to be accelerated by greening-induced variations in ETa.
4.2. Variation in Available Water Resources
As the Mekong River crosses several international boundaries, the water resources of the downstream countries are strongly connected with those of the upstream countries. The upper basin flows are affected mainly by snowmelt and precipitation [17], the negative effect of ETa on runoff was offset by the positive effect of glacial meltwater in the upper basin (Lancang River in China) [54]. Because the AWR are calculated herein as the difference between precipitation and ETa, which ignores the contribution from snowmelt, the AWR in the upper basin were found to exhibit a minor increasing trend (Figure 5). Although the AWR increased in the upper basin, the maximum flows at the Chiang Saen gauging station, which is located in the upper MRB, showed a decreasing trend, and the decreasing rate of flow was accelerated due to the completion of dams in the upstream region [55]. Other studies have further argued that climate change is not the main mechanism responsible for the variation in AWR in the Mekong River; instead, the development of dams on the Lancang River may be the major influencing factor, especially in the dry season and upstream region [55,56]. Therefore, although the AWR increased in the upper basin, the conditions of the actual water resources both upstream and downstream remain somewhat unclear.
In the central basin and Mekong Delta, cropland expansion has placed great pressure on the AWR; for example, a dramatic increase in ETa and a significant decrease in AWR were found in the Mekong Delta and southeastern Thailand (Figure 4 and Figure 5). In the Mekong Delta, the regional population grew by nearly 45% from 1980 to 2000 [57]. Additionally, rice cropping systems have undergone remarkable changes from single-cropping to double- or triple-cropping systems [58]. Rapid population growth and agricultural development have placed additional pressures on cropland and water for food production. In Lao, Thailand, Cambodia and the central highlands of Vietnam, rain-fed rice is the primary crop [25], and irrigation is intended mainly for rice during the rainy season due to its low water requirements [59]. Due to changes in the climate and dam construction, changes in seasonal flow patterns have strongly influenced land-use patterns [1]. Fortunately, a significant increase in dry-season flows and a decrease in wet-season flows occurred when the Xiaowan dam (constructed in 2010) and Nuozhadu dam (constructed in 2014) were erected in the upper reaches of the Mekong River (Lancang River) [54]. Increased dry-season flows may benefit agricultural irrigation downstream, and decreased wet-season flows may benefit downstream flood and drought management.
5. Conclusions
The spatial-temporal patterns of ETa and AWR in the MRB were estimated from 1981 to 2012 using the VIP-RS model. The contributions of climate change and vegetation greening to the ETa trends were quantitatively determined with 30 model experiments. Due to vegetation greening and increasing temperature and precipitation, ETa showed an increasing trend at a rate of 1.16 mm year−2 from 1981 to 2012. In most of the basin, the water and energy had equivalent impacts on the ETa trends. Although the AED increased, the AWR showed an increasing trend due to increasing precipitation. In the paddy fields of the Mekong Delta region, the ETa increased significantly, resulting in additional pressure on agricultural development. In the central basin where rain-fed rice is planted, the AWR is decreasing following the reduced precipitation. Therefore, the MRB may face water shortages in the dry season.
Author Contributions
Conceptualization, X.M. and S.H.; methodology, X.M.; writing—original draft preparation, S.H.; writing—review and editing, X.M. and S.H.; project administration, X.M.; funding acquisition, X.M. All authors have read and agreed to the published version of the manuscript.
Funding
This research was funded by National Key R&D Program of China, grant number 2017YFA0603702, and National Natural Science Foundation of China, grant number 41971232.
Data Availability Statement
No new data were created or analyzed in this study. Data sharing is not applicable to this article.
Conflicts of Interest
The authors declare no conflict of interest.
Appendix A
The air temperature was corrected to sea level as follows:
where Tsl (°C) is the air temperature at sea level, and T (°C) is the air temperature at real elevation. If the precipitation is higher than 3 mm day−1, it was corrected to sea level as follows. If the precipitation is lower than 3 mm day−1, it was directly resampled to 5 × 5 km with the bilinear resampling method.
where Psl (mm day−1) is the precipitation at sea level, and P (mm/day) is the precipitation at real elevation. The wind speed was corrected to the value at the 2 m level as follows:
where Wsl (m s−1) is the wind speed at 2 m, and W (m s−1) is the wind speed at real elevation.
Appendix B

Table A1.
Summary of simulation experiments.
| Treatment | Description |
|---|---|
| f(con) | Simulation with the 1982–1990 mean climatology, atmospheric CO2 concentration and vegetation dynamics |
| f(T) | Temperature varies according to the ISIMIP records; other variables vary according to control conditions |
| f(P) | Precipitation varies according to the ISIMIP records; other variables vary according to control conditions |
| f(H) | Relative humidity varies according to the ISIMIP records; other variables vary according to control conditions |
| f(R) | Longwave downwelling radiation and shortwave downwelling radiation vary according to the ISIMIP records; other variables vary according to control conditions |
| f(W) | Wind speed varies according to the ISIMIP records; other variables vary according to control conditions |
| f(LAI) | The LAI varies according to the GLASS records; other variables vary according to control conditions |
| f(C) | Atmospheric CO2 concentration varies according to the NOAA ESRL records; other variables vary according to control conditions |
| f(C_T) | CO2 concentration and temperatures vary; other variables vary according to control conditions |
| f(C_P) | CO2 concentration and precipitation vary; other variables vary according to control conditions |
| f(C_H) | CO2 concentration and relative humidity vary; other variables vary according to control conditions |
| f(C_R) | CO2 concentration and radiation vary; other variables vary according to control conditions |
| f(C_W) | CO2 concentration and wind speed vary; other variables vary according to control conditions |
| f(C_V) | CO2 concentration and the LAI vary; other variables vary according to control conditions |
| f(LAI_T) | LAI and temperatures vary; other variables vary according to control conditions |
| f(LAI_P) | LAI and precipitation vary; other variables vary according to control conditions |
| f(LAI_H) | LAI and temperatures vary; other variables vary according to control conditions |
| f(LAI_R) | LAI and radiation vary; other variables vary according to control conditions |
| f(LAI_W) | LAI and wind speed vary; other variables vary according to control conditions |
| f(T_P) | Temperature and precipitation vary; other variables vary according to control conditions |
| f(T_H) | Temperature and relative humidity vary; other variables vary according to control conditions |
| f(T_R) | Temperature and radiation vary; other variables vary according to control conditions |
| f(T_W) | Temperature and wind speed vary; other variables vary according to control conditions |
| f(P_H) | Precipitation and relative humidity vary; other variables vary according to control conditions |
| f(P_R) | Precipitation and radiation vary; other variables vary according to control conditions |
| f(P_W) | Precipitation and wind speed vary; other variables vary according to control conditions |
| f(H_R) | Relative humidity and radiation vary; other variables vary according to control conditions |
| f(H_W) | Relative humidity and wind speed vary; other variables vary according to control conditions |
| f(R_W) | Radiation and wind speed vary; other variables vary according to control conditions |
| f(all) | All variables vary |
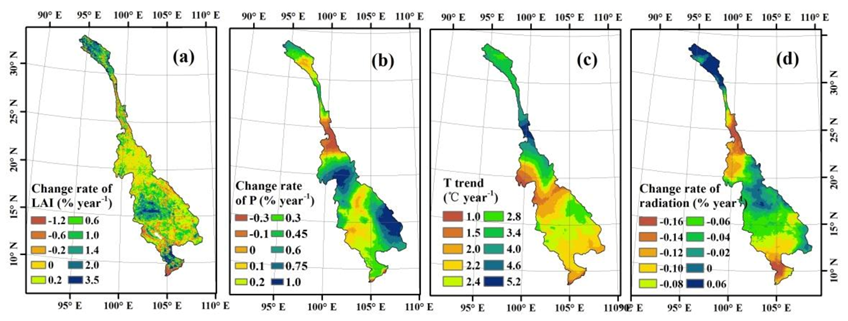
Figure A1.
Spatial patterns of the temporal variations of the annual (a) leaf area index (LAI), (b) precipitation, (c) temperature and (d) radiation from 1981 to 1012.
Figure A1.
Spatial patterns of the temporal variations of the annual (a) leaf area index (LAI), (b) precipitation, (c) temperature and (d) radiation from 1981 to 1012.

References
- Arias, M.E.; Cochrane, T.A.; Norton, D.; Killeen, T.J.; Khon, P. The Flood Pulse as the Underlying Driver of Vegetation in the Largest Wetland and Fishery of the Mekong Basin. Ambio 2013, 42, 864–876. [Google Scholar] [CrossRef] [PubMed] [Green Version]
- Zeng, Z.; Piao, S.; Lin, X.; Yin, G.; Peng, S.; Ciais, P.; Myneni, R.B. Global evapotranspiration over the past three decades: Estimation based on the water balance equation combined with empirical models. Environ. Res. Lett. 2012, 7, 14026. [Google Scholar] [CrossRef]
- Zeng, Z.; Wang, T.; Zhou, F.; Ciais, P.; Mao, J.; Shi, X.; Piao, S. A worldwide analysis of spatiotemporal changes in water balance-based evapotranspiration from 1982 to 2009. J. Geophys. Res. Atmos. 2014, 119, 1186–1202. [Google Scholar] [CrossRef]
- Piao, S.; Friedlingstein, P.; Ciais, P.; De Noblet-Ducoudre, N.; Labat, D.; Zaehle, S. Changes in climate and land use have a larger direct impact than rising CO2 on global river runoff trends. Proc. Natl. Acad. Sci. USA 2007, 104, 15242–15247. [Google Scholar] [CrossRef] [Green Version]
- Trenberth, K.E.; Fasullo, J.T.; Kiehl, J. Earth’s global energy budget. Bull. Am. Meteorol. Soc. 2009, 90, 311–323. [Google Scholar] [CrossRef]
- Wang, K.; Dickinson, R.E.; Wild, M.; Liang, S. Evidence for decadal variation in global terrestrial evapotranspiration between 1982 and 2002: 2. Results. J. Geophys. Res. 2010, 115, D20113. [Google Scholar] [CrossRef] [Green Version]
- Felzer, B.; Cronin, T.; Melillo, J.; Kicklighter, D.; Schlosser, C. Importance of carbon–nitrogen interactions and ozone on eco-system hydrology during the 21st century. J. Geophys. Res. 2009, 114, G01020. [Google Scholar]
- Zhu, Z.; Bi, J.; Pan, Y.; Ganguly, S.; Anav, A.; Xu, L.; Samanta, A.; Piao, S.; Nemani, R.R.; Myneni, R.B. Global data sets of vegetation leaf area index (LAI) 3g and Fraction of Photosynthetically Active Radiation (FPAR) 3g derived from Global In-ventory Modeling and Mapping Studies (GIMMS) Normalized Difference Vegetation Index (NDVI3g) for the period 1981 to 2011. Remote Sens. 2013, 5, 927–948. [Google Scholar]
- Zeng, Z.; Peng, L.; Piao, S. Response of terrestrial evapotranspiration to Earth’s greening. Curr. Opin. Environ. Sustain. 2018, 33, 9–25. [Google Scholar] [CrossRef]
- Shi, X.; Mao, J.; Thornton, P.E.; Huang, M. Spatiotemporal patterns of evapotranspiration in response to multiple environmental factors simulated by the Community Land Model. Environ. Res. Lett. 2013, 8, 024012. [Google Scholar] [CrossRef]
- Mao, J.; Fu, W.; Shi, X.; Ricciuto, D.M.; Fisher, J.B.; Dickinson, R.E.; Wei, Y.; Shem, W.; Piao, S.; Wang, K.; et al. Disentangling climatic and anthropogenic controls on global terrestrial evapotranspiration trends. Environ. Res. Lett. 2015, 10, 094008. [Google Scholar] [CrossRef]
- Fan, H.; He, D. Temperature and Precipitation Variability and Its Effects on Streamflow in the Upstream Regions of the Lancang–Mekong and Nu–Salween Rivers. J. Hydrometeorol. 2015, 16, 2248–2263. [Google Scholar] [CrossRef]
- Hapuarachchi, H.A.P.; Takeuchi, K.; Zhou, M.; Kiem, A.S.; Georgievski, M.; Magome, J.; Ishidaira, H. Investigation of the Mekong River basin hydrology for 1980–2000 using the YHyM. Hydrol. Process. 2008, 22, 1246–1256. [Google Scholar] [CrossRef]
- Milly, P.C.; Dunne, K.A.; Vecchia, A.V. Global pattern of trends in streamflow and water availability in a changing climate. Nat. Cell Biol. 2005, 438, 347–350. [Google Scholar] [CrossRef] [PubMed]
- Oki, T.; Kanae, S. Global hydrological cycles and world water resources. Science 2006, 313, 1068–1072. [Google Scholar] [CrossRef] [PubMed] [Green Version]
- Luo, P.; Mu, D.; Xue, H.; Ngo-Duc, T.; Dang-Dinh, K.; Takara, K.; Nover, D.; Schladow, G. Flood inundation assessment for the Hanoi Central Area, Vietnam under historical and extreme rainfall conditions. Sci. Rep. 2018, 8, 1–11. [Google Scholar] [CrossRef]
- Delgado, J.; Merz, B.; Apel, H. Flood trends and variability in the Mekong River. Hydrol. Earth Syst. Sci. 2010, 11, 407–418. [Google Scholar] [CrossRef] [Green Version]
- Cook, B.I.; Bell, A.R.; Anchukaitis, K.J.; Buckley, B.M. Snow cover and precipitation impacts on dry season streamflow in the Lower Mekong Basin. J. Geophys. Res. Space Phys. 2012, 117, 16116. [Google Scholar] [CrossRef]
- Lacombe, G.; Pierret, A.; Hoanh, C.T.; Sengtaheuanghoung, O.; Noble, A.D. Conflict, migration and land-cover changes in Indochina: A hydrological assessment. Ecohydrology 2010, 3, 382–391. [Google Scholar] [CrossRef]
- Haddeland, I.; Lettenmaier, D.P.; Skaugen, T. Effects of irrigation on the water and energy balances of the Colorado and Mekong river basins. J. Hydrol. 2006, 324, 210–223. [Google Scholar] [CrossRef]
- Tatsumi, K.; Yamashiki, Y. Effect of irrigation water withdrawals on water and energy balance in the Mekong River Basin using an improved VIC land surface model with fewer calibration parameters. Agric. Water Manag. 2015, 159, 92–106. [Google Scholar] [CrossRef]
- Huo, A.; Yang, L.; Luo, P.; Cheng, Y.; Peng, J.; Nover, D. Influence of landfill and land use scenario on runoff, evapotranspiration, and sediment yield over the Chinese Loess Plateau. Ecol. Indic. 2021, 121, 107208. [Google Scholar] [CrossRef]
- Şen, Ö.L.; Bozkurt, D.; Vogler, J.B.; Fox, J.; Giambelluca, T.W.; Ziegler, A.D. Hydro-climatic effects of future land-cover/land-use change in montane mainland southeast Asia. Clim. Chang. 2012, 118, 213–226. [Google Scholar] [CrossRef]
- Liu, Z.; Yao, Z.; Huang, H.; Wu, S.; Liu, G. Land use and climate changes and their impacts on runoff in the yarlung zangbo river basin, China. Land Degrad. Dev. 2012, 25, 203–215. [Google Scholar] [CrossRef]
- Pokhrel, Y.; Hanasaki, N.; Koirala, S.; Cho, J.; Yeh, P.J.F.; Kim, H.; Kanae, S.; Oki, T. Incorporating anthropogenic water reg-ulation modules into a land surface model. J. Hydrometeorol. 2012, 13, 255–269. [Google Scholar] [CrossRef] [Green Version]
- Richard, M.; Babiker, M.; Brinkman, S.; Calvo, E.; Carter, T.; Edmonds, J.; Elgizouli, I.; Emori, S.; Erda, L.; Hibbard, K.; et al. Towards New Scenarios for Analysis of Emissions, Climate Change, Impacts and Response Strategies; IPCC ExperT Meeting Report; Intergovernmental Panel on Climate Change Secretariat (IPCC): Noordwijkerhout, The Netherlands, 2007. [Google Scholar]
- Kite, G.W. Modelling the Mekong: Hydrological simulation for environmental impact studies. J. Hydrol. 2001, 253, 1–13. [Google Scholar] [CrossRef]
- Weedon, G.P.; Gomes, S.S.; Viterbo, P.P.; Shuttleworth, W.J.; Blyth, E.E.; Österle, H.H.; Adam, J.C.; Bellouin, N.N.; Boucher, O.O.; Best, M.M. Creation of the WATCH Forcing Data and Its Use to Assess Global and Regional Reference Crop Evapora-tion over Land during the Twentieth Century. J. Hydrometeor. 2011, 12, 823–848. [Google Scholar] [CrossRef] [Green Version]
- Weedon, G.P.; Balsamo, G.; Bellouin, N.; Gomes, S.A.S.S.; Best, M.J.; Viterbo, P. The WFDEI meteorological forcing data set: WATCH Forcing Data methodology applied to ERA-Interim reanalysis data. Water Resour. Res. 2014, 50, 7505–7514. [Google Scholar] [CrossRef] [Green Version]
- Parker, J.A.; Kenyon, R.V.; Troxel, D.E. Comparison of Interpolating Methods for Image Resampling. IEEE Trans. Med. Imaging 1983, 2, 31–39. [Google Scholar] [CrossRef]
- Xiao, Z.; Liang, S.; Wang, J.; Chen, P.; Yin, X.; Zhang, L.; Song, J. Use of General Regression Neural Networks for Generating the GLASS Leaf Area Index Product From Time-Series MODIS Surface Reflectance. IEEE Trans. Geosci. Remote. Sens. 2014, 52, 209–223. [Google Scholar] [CrossRef]
- Landerer, F.W.; Swenson, S.C. Accuracy of scaled GRACE terrestrial water storage estimates. Water Resour. Res. 2012, 48, 04531. [Google Scholar] [CrossRef]
- Mo, X.; Liu, S.; Lin, Z. Evaluation of an ecosystem model for a wheat–maize double cropping system over the North China Plain. Environ. Model. Softw. 2012, 32, 61–73. [Google Scholar] [CrossRef]
- Mo, X.; Chen, X.; Hu, S.; Liu, S.; Xia, J. Attributing regional trends of evapotranspiration and gross primary productivity with remote sensing: A case study in the North China Plain. Hydrol. Earth Syst. Sci. 2017, 21, 295–310. [Google Scholar] [CrossRef] [Green Version]
- Mueller, B. Benchmark products for land evapotranspiration: LandFlux-EVAL multi-data set synthesis. Hydrol. Earth Syst. Sci. 2013, 17, 3707–3720. [Google Scholar] [CrossRef] [Green Version]
- Zhang, K.; Kimball, J.S.; Nemani, R.R.; Running, S.W. A continuous satellite-derived global record of land surface evapo-transpiration from 1983 to 2006. Water Resour. Res. 2010, 46, W09522. [Google Scholar] [CrossRef] [Green Version]
- Pan, S.; Tian, H.; Shree, R.S.D.; Yang, Q.; Yang, J.; Lu, C.; Tao, B.; Ren, W.; Ouyang, Z. Responses of global terrestrial evapo-transpiration to climate change and increasing atmospheric CO2 in the 21st century. Earth’s Future 2015, 3, 15–35. [Google Scholar] [CrossRef]
- Li, F.; Kustas, W.P.; Prueger, J.H.; Neale, C.M.; Jackson, T.J. Utility of remote sensing-based two-source energy balance model under low- and high-vegetation cover conditions. J. Hydrometeorol. Spec. Sect. 2005, 6, 878–891. [Google Scholar] [CrossRef]
- Sellers, P.J.; Los, S.O.; Tucker, C.J.; Justice, C.O.; Dazlich, D.A.; Collatz, G.J.; Randall, D.A. A revised land surface parame-terization (SiB2) for atmospheric GCMs. Part II. The generation of global fields of terrestrial biophysical parameters from sat-ellite data. J. Clim. 1996, 9, 706–737. [Google Scholar] [CrossRef] [Green Version]
- Eagleson, P.S. Climate, soil, and vegetation: 3. A simplified model of soil moisture movement in the liquid phase. Water Resour. Res. 1978, 14, 722–730. [Google Scholar] [CrossRef] [Green Version]
- Su, Z.; Schmugge, T.; Kustas, W.P.; Massman, W.J. An evaluation of two models for estimation of the roughness height for heat transfer between the land surface and the atmosphere. J. Appl. Meteorol. 2001, 40, 1933–1951. [Google Scholar] [CrossRef] [Green Version]
- Monteith, J.L.; Reifsnyder, W.E. Principles of Environmental Physics. Phys. Today 1974, 27, 51–52. [Google Scholar] [CrossRef]
- Kustas, W.P.; Daughtry, C.S. Estimation of the soil heat flux/net radiation ratio from spectral data. Agric. For. Meteorol. 1990, 49, 205–223. [Google Scholar] [CrossRef]
- Mo, X.; Liu, S.; Lin, Z.; Zhao, W. Simulating temporal and spatial variation of evapotranspiration over the Lushi basin. J. Hydrol. 2004, 285, 125–142. [Google Scholar] [CrossRef]
- Stein, U.; Alpert, P. Factor Separation in Numerical Simulations. J. Atmospheric Sci. 1993, 50, 2107–2115. [Google Scholar] [CrossRef] [Green Version]
- Zhang, K.; Kimball, J.S.; Nemani, R.R.; Running, S.W.; Hong, Y.; Gourley, J.J.; Yu, Z. Vegetation Greening and Climate Change Promote Multidecadal Rises of Global Land Evapotranspiration. Sci. Rep. 2015, 5, 15956. [Google Scholar] [CrossRef] [PubMed]
- McVicar, T.R.; Roderick, M.L.; Donohue, R.J.; Van Niel, T.G. Ecohydrology bearings–Invited commentary less bluster ahead? Ecohydrological implications of global trends of terrestrial near-surface wind speed. Ecohydrology 2012, 5, 381–388. [Google Scholar] [CrossRef]
- Liu, Z.F.; Wang, R.; Yao, Z. Climate change and its impact on water availability of large international rivers over the main-land Southeast Asia. Hydrol. Process. 2018, 32, 3966–3977. [Google Scholar] [CrossRef]
- Wang, A.; Zeng, X. Sensitivities of terrestrial water cycle simulations to the variations of precipitation and air temperature in China. J. Geophys. Res. Space Phys. 2011, 116, 02107. [Google Scholar] [CrossRef] [Green Version]
- Yang, L.; Feng, Q.; Li, C.; Si, J.; Wen, X.; Yin, Z. Detecting climate variability impacts on reference and actual evapotranspira-tion in the Taohe River Basin, NW China. Hydrol. Res. 2017, 48, 596–612. [Google Scholar] [CrossRef]
- Zhu, Z.; Piao, S.; Myneni, R.B.; Huang, M.; Zeng, Z.; Canadell, J.G.; Ciais, P.; Sitch, S.; Friedlingstein, P.; Arneth, A.; et al. Greening of the Earth and its drivers. Nat. Clim. Chang. 2016, 6, 791–795. [Google Scholar] [CrossRef]
- Zeng, R.; Cai, X. Assessing the temporal variance of evapotranspiration considering climate and catchment storage factors. Adv. Water Resour. 2015, 79, 51–60. [Google Scholar] [CrossRef]
- Mahowald, N.; Lo, F.; Zheng, Y.; Harrison, L.; Funk, C.; Lombardozzi, D. Leaf Area Index in Earth System Models: Evaluation and projections. Earth Syst. Dyn. Discuss. 2015, 6, 761–818. [Google Scholar] [CrossRef] [Green Version]
- Li, D.; Long, D.; Zhao, J.; Lu, H.; Hong, Y. Observed changes in flow regimes in the Mekong River basin. J. Hydrol. 2017, 551, 217–232. [Google Scholar] [CrossRef]
- Lu, X.X.; Siew, R.Y. Water discharge and sediment flux changes over the past decades in the Lower Mekong River: Possible impacts of the Chinese dams. Hydrol. Earth Syst. Sci. 2006, 10, 181–195. [Google Scholar] [CrossRef] [Green Version]
- Cochrane, T.A.; Arias, M.E.; Piman, T. Historical impact of water infrastructure on water levels of the Mekong River and the Tonle Sap system. Hydrol. Earth Syst. Sci. 2014, 18, 4529–4541. [Google Scholar] [CrossRef] [Green Version]
- Nesbitt, H.; Johnston, R.; Solieng, M. Mekong river water: Will river flows meet future agriculture needs in the lower Mekong basin? Water Agric. 2004, 116, 86–104. [Google Scholar]
- Ngan, L.T.; Bregt, A.K.; van Halsema, G.E.; Hellegers, P.J.G.J.; Nguyen, L. Interplay between land-use dynamics and changes in hydrological regime in the Vietnamese Mekong Delta. Land Use Policy 2018, 73, 269–280. [Google Scholar]
- Mekong River Commission (MRC). Regional Irrigation Sector Review for Joint Basin Planning Process; MRC: Vientiane, Laos, 2009; p. 59. [Google Scholar]
Figure 1.
(a) Location, (b) elevation, (c) land-use/cover type and (d) soil texture in the Mekong River Basin (MRB) (WB: Water body, EBF: Evergreen broadleaf forest, MF: Mixed forest, SV: Savanna, GL: Grassland, WL: Wetland, CL: Cropland, Urb: Urban and built-up, CL/NV: Cropland and natural vegetation mosaic).

Figure 2.
Comparisons of the simulated ETa (actual evapotranspiration) with (a) the GLEAM ETa and (b) water balance-derived ETa.
Figure 2.
Comparisons of the simulated ETa (actual evapotranspiration) with (a) the GLEAM ETa and (b) water balance-derived ETa.

Figure 3.
Spatial patterns of annual average (a) actual evapotranspiration, (b) precipitation and (c) potential evapotranspiration over Mekong River Basin for the period of 1981 to 2012.
Figure 3.
Spatial patterns of annual average (a) actual evapotranspiration, (b) precipitation and (c) potential evapotranspiration over Mekong River Basin for the period of 1981 to 2012.

Figure 4.
(a) Spatial patterns of the temporal variations of average actual evapotranspiration, (b) average change rate of actual evapotranspiration in different vegetation types, and (c) probability distribution function of significant levels in the actual evapotranspiration trend.
Figure 4.
(a) Spatial patterns of the temporal variations of average actual evapotranspiration, (b) average change rate of actual evapotranspiration in different vegetation types, and (c) probability distribution function of significant levels in the actual evapotranspiration trend.

Figure 5.
Spatial patterns of the temporal variation of annual average available water resources (AWR) for the period of 1981 to 2012.
Figure 5.
Spatial patterns of the temporal variation of annual average available water resources (AWR) for the period of 1981 to 2012.

Figure 6.
Inter-annual variations of anomalies of (a) the actual ET (ETa) anomaly, potential ET (ETp) anomaly and precipitation (P) anomaly, and (b) available water resources (AWR) anomaly from 1981 to 2012.
Figure 6.
Inter-annual variations of anomalies of (a) the actual ET (ETa) anomaly, potential ET (ETp) anomaly and precipitation (P) anomaly, and (b) available water resources (AWR) anomaly from 1981 to 2012.

Figure 7.
Contributions of changes in climate variables, the atmospheric CO2 concentration and the leaf area index (LAI) to the ETa variation and their two-factor interactive effects (Net: total effect of all the variables, C: atmospheric CO2 concentration, T: temperature, P: precipitation, R: radiation, H: vapor pressure, W: wind speed, Sum_EF: sum of all the two-factor interactive effects of variables).

Figure 8.
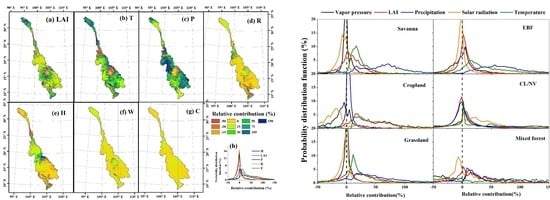
Spatial patterns of the relative contributions of the variation of (a) LAI, (b) temperature, (c) precipitation, (d) radiation, (e) vapor pressure, (f) wind speed, (g) atmospheric CO2 concentration variation to ETa and (h) probability distribution function of relative contributions of the main climatic variables and LAI changes to ETa trends in Mekong River Basin.
Figure 8.
Spatial patterns of the relative contributions of the variation of (a) LAI, (b) temperature, (c) precipitation, (d) radiation, (e) vapor pressure, (f) wind speed, (g) atmospheric CO2 concentration variation to ETa and (h) probability distribution function of relative contributions of the main climatic variables and LAI changes to ETa trends in Mekong River Basin.

Figure 9.
Probability distribution function of relative contributions of climatic variables and LAI changes to ETa trends in different vegetation types.
Figure 9.
Probability distribution function of relative contributions of climatic variables and LAI changes to ETa trends in different vegetation types.

Figure 10.
Effects of land-use changes on the ETa trend (Net: total effect of all the land-use changes).
Figure 10.
Effects of land-use changes on the ETa trend (Net: total effect of all the land-use changes).

Table 1.
Land-use transformation matrix (%).
| WB | EBF | MF | SV | GL | WL | CL | Urb | CL/NV | |
|---|---|---|---|---|---|---|---|---|---|
| WB | 75.24 | 2.25 | 3.67 | 0.97 | 0.48 | 5.80 | 9.50 | 0.01 | 2.08 |
| EBF | 0.04 | 86.81 | 0.68 | 7.73 | 0.13 | 0.34 | 0.30 | 0.00 | 3.95 |
| MF | 0.27 | 18.55 | 55.67 | 16.38 | 3.30 | 0.81 | 1.27 | 0.00 | 3.76 |
| SV | 0.12 | 8.37 | 6.46 | 53.99 | 2.23 | 0.68 | 2.29 | 0.00 | 25.85 |
| GL | 0.19 | 0.16 | 1.53 | 2.30 | 88.25 | 1.28 | 2.14 | 0.00 | 4.14 |
| WL | 1.70 | 11.14 | 4.97 | 4.78 | 0.62 | 60.26 | 11.82 | 0.11 | 4.60 |
| CL | 0.10 | 1.18 | 1.30 | 2.75 | 3.45 | 3.84 | 54.67 | 0.00 | 32.71 |
| Urb | 0.06 | 0.00 | 0.00 | 0.00 | 0.00 | 0.66 | 0.00 | 99.28 | 0.00 |
| CL/NV | 0.08 | 5.42 | 0.94 | 6.85 | 1.52 | 0.70 | 13.41 | 0.00 | 71.07 |
WB: Water body, EBF: Evergreen broadleaf forest, MF: Mixed forest, SV: Savanna, WL: Wetland, GL: Grassland, CL: Cropland, Urb: Urban and built-up, CL/NV: Cropland and natural vegetation mosaic.
Publisher’s Note: MDPI stays neutral with regard to jurisdictional claims in published maps and institutional affiliations. |
© 2021 by the authors. Licensee MDPI, Basel, Switzerland. This article is an open access article distributed under the terms and conditions of the Creative Commons Attribution (CC BY) license (http://creativecommons.org/licenses/by/4.0/).
Share and Cite
MDPI and ACS Style
Hu, S.; Mo, X. Attribution of Long-Term Evapotranspiration Trends in the Mekong River Basin with a Remote Sensing-Based Process Model. Remote Sens. 2021, 13, 303. https://0-doi-org.brum.beds.ac.uk/10.3390/rs13020303
AMA Style
Hu S, Mo X. Attribution of Long-Term Evapotranspiration Trends in the Mekong River Basin with a Remote Sensing-Based Process Model. Remote Sensing. 2021; 13(2):303. https://0-doi-org.brum.beds.ac.uk/10.3390/rs13020303
Chicago/Turabian StyleHu, Shi, and Xingguo Mo. 2021. "Attribution of Long-Term Evapotranspiration Trends in the Mekong River Basin with a Remote Sensing-Based Process Model" Remote Sensing 13, no. 2: 303. https://0-doi-org.brum.beds.ac.uk/10.3390/rs13020303
Note that from the first issue of 2016, this journal uses article numbers instead of page numbers. See further details here.