Spatiotemporal Variation of the Burned Area and Its Relationship with Climatic Factors in Central Kazakhstan


1
International Center for Climate and Environment Sciences, Institute of Atmospheric Physics, Chinese Academy of Sciences, Beijing 100029, China
2
College of Earth and Planetary Sciences, University of Chinese Academy of Sciences, Beijing 100049, China
3
China-Pakistan Joint Research Center on Earth Sciences, CAS-HEC, Islamabad 45320, Pakistan
*
Author to whom correspondence should be addressed.
Remote Sens. 2021, 13(2), 313; https://0-doi-org.brum.beds.ac.uk/10.3390/rs13020313
Submission received: 24 December 2020
/
Revised: 11 January 2021
/
Accepted: 12 January 2021
/
Published: 18 January 2021
Abstract
:Central Asia is prone to wildfires, but the relationship between wildfires and climatic factors in this area is still not clear. In this study, the spatiotemporal variation in wildfire activities across Central Asia during 1997–2016 in terms of the burned area (BA) was investigated with Global Fire Emission Database version 4s (GFED4s). The relationship between BA and climatic factors in the region was also analyzed. The results reveal that more than 90% of the BA across Central Asia is located in Kazakhstan. The peak BA occurs from June to September, and remarkable interannual variation in wildfire activities occurs in western central Kazakhstan (WCKZ). At the interannual scale, the BA is negatively correlated with precipitation (correlation coefficient r = −0.66), soil moisture (r = −0.68), and relative humidity (r = −0.65), while it is positively correlated with the frequency of hot days (r = 0.37) during the burning season (from June to September). Composite analysis suggests that the years in which the BA is higher are generally associated with positive geopotential height anomalies at 500 hPa over the WCKZ region, which lead to the strengthening of the downdraft at 500 hPa and the weakening of westerlies at 850 hPa over the region. The weakened westerlies suppress the transport of water vapor from the Atlantic Ocean to the WCKZ region, resulting in decreased precipitation, soil moisture, and relative humidity in the lower atmosphere over the WCKZ region; these conditions promote an increase in BA throughout the region. Moreover, the westerly circulation index is positively correlated (r = 0.53) with precipitation anomalies and negatively correlated (r = −0.37) with BA anomalies in the WCKZ region during the burning season, which further underscores that wildfires associated with atmospheric circulation systems are becoming an increasingly important component of the relationship between climate and wildfire.
1. Introduction
Wildfires are natural disasters around the world and have directly caused enormous losses in terms of human lives, social disturbances, and environmental damage in recent years [1]. It is estimated that the global annual burned area exceeds 3.5 million square kilometers induced by natural and anthropogenic origins, and it is mainly distributed in central and northern Africa, northern Australia, the Amazon region of South America, Southeast Asia, and the midlatitude Eurasian region including Central Asia [2]. Wildfire not only plays an important role in shaping the composition and function of terrestrial ecosystems [3] but also serves as a major carbon source in the global carbon cycle by emitting large amounts of black carbon aerosols and greenhouse gases, including CO2, CO, and CH4, etc., which in turn affect the radiation balance of the entire land-air system [4,5].
Regional-level studies of wildfire characteristics have attracted much attention because they have implications for hazard management, climate studies, and ecosystem research [6]. Recently, many studies have demonstrated that a large number of wildfires are driven by natural factors such as fuel availability, high temperature, wind, drought, and lightning strikes at different temporal and spatial scales as well as by anthropogenic factors [7,8,9]. For example, Prasad et al. [10] indicated that the temperature and precipitation corresponding to the warmest season of the year are the major climatic factors for the occurrence of the wildfire in southern India. Chen et al. [11] found that the burned area in the Amazon region of South America during the burning season (August–October) is closely correlated with sea surface temperature (SST), precipitation, evapotranspiration, and total water storage (TWS) during the preburning period, and with surface air moisture and fuel moisture during the burning season. Many studies also supported that rising global temperatures and more frequent heatwaves increased the frequency and severity of fire weather by promoting hot and dry conditions, increasing the risks of wildfires. The impact of climate change on the wildfire occurrence is also of great concern. Natural variability is superimposed on the increasingly warm and dry background conditions resulting from climate change, leading to more extreme fire and more extreme fire seasons [12]. Stocks et al. [13] found that there was a significant increase in extreme fire danger levels during June and July for the 1980–1989 period across much of west-central Canada and Siberia projected under a warmer climate using four current General Circulation Models (GCMs). Flannigan et al. [14] also demonstrated that the burned area will increase and the burning season will become longer due to global warming. Luo et al. [15] found that future atmospheric environments will be more conducive to wildfires in mountainous regions of the western United States. In short, as Falk et al. [16] suggested, at regional scales, the climate has been shown to be a primary driver of the variability of fire characteristics.
Central Asia is one of the largest semiarid-to-arid regions, and the dominant land cover types are steppe, semideserts, and deserts [17]. It is also a region that is sensitive to global warming and has shown a greater rate of temperature increase (0.18 °C per decade) than the global average during the last 100 years [18]. In addition, most parts of Central Asia have also become drier in the last 50 years [19]. Kim et al. [20] found that Central Asia is one of the major regions in the northern circumpolar region based on the GFED4s datasets and has an extensive burned area. Approximately 15 million hectares of the arid region of Central Asia burn each year, and 89% of these forest fires occur in Kazakhstan [21]. Meanwhile, van der Werf et al. [4] found that emissions from forest fires and from agricultural fires in southern Siberia, Kazakhstan, and Ukraine in spring and summer are large sources of black carbon. McConnell et al. [22] demonstrated that the black carbon from biomass combustion in the northern Eurasia could be transported to the Arctic region, leading to significant climate forcing because light-absorbing black carbon deposited on snow surfaces accelerates snowmelt. Therefore, Central Asia has become a hot spot for global wildfire research [23,24]. Sinkunas [25] illustrated that the removal of vegetation by burning can lead to soil degradation, as these open ecosystems frequently experience strong winds. Shen et al. [26] uncovered a close connection between the spring precipitation and summer fire occurrence in the Kazakhstan region.
However, there is still a lack of studies on the spatial-temporal patterns of wildfires throughout Central Asia, including the role of climatic factors in wildfire occurrence in this region. To understand the impacts of wildfires in Central Asia on the carbon cycle and on ecosystems, quantitative information about the interannual variability of wildfires is needed. Remote sensing provides a unique opportunity for the investigation of wildfire variations and their relationship to climate factors [27]. Active fire count products and burned area products are two important and complementary sources of information regarding wildfires, and both should be included in fire analyses and characterization [28]. The active fire count product is derived by measuring the outgoing radiance within midinfrared channels; satellite radiometers are able to detect active fire locations and quantify fire radiative power with relatively high spatial and temporal resolution [29,30]. Satellite remote sensing observations have also been used to derive global-scale burned area products by detecting changes in surface reflectance following fire damage [31,32,33]. Previous work has shown that the relationship between burned area and active fire counts is much stronger in grasslands and savannas than in other ecosystems [34], and the land cover throughout Central Asia is mainly grasslands (Figure 1b). In this study, we selected the burned area as a variable of wildfire to investigate the characteristics of wildfire as it is the most important indicator of wildfire regime [35]. We used the monthly burned area fraction from GFED4s [36] to describe their distributions spatially and temporally, along with the relationship between the burned area and climatic factors.
In this paper, we will first illustrate the characteristics of the spatiotemporal variation in wildfires in Central Asia based on the GFED4s burned area dataset during 1997–2016 and then investigate the relationship between burned areas and climate factors. Moreover, the associated atmospheric circulation will be further analyzed to explain the processes by which climate factors can affect the interannual variation of the burned area throughout the region. This paper is organized as follows. In Section 2, we briefly introduce the study area, data, and methods used for analysis. Section 3 presents our main findings about the characteristics of the spatiotemporal variation of the burned area across Central Asia and its relationship to meteorological variables across the region as well as to the associated atmospheric circulations. The discussion and conclusion are provided in Section 4 and Section 5, respectively.
2. Study Area, Data, and Methods
2.1. Study Area
Central Asia, which includes Kazakhstan, Turkmenistan, Uzbekistan, Tajikistan, and Kyrgyzstan, is located in the center of the Eurasian continent and covers a total area of approximately 4 million square kilometers [37]. The terrain of Central Asia is generally lowest in the northwest and highest in the southeast, where the Pamir and Tianshan Mountains are located (Figure 1a). The land cover in Central Asia is mainly grasslands, croplands, and barren lands (Figure 1b). Grasslands are distributed across the majority of Kazakhstan except in its northern region (50–54° N), where croplands are the primary land cover. Grasslands are also distributed in Kyrgyzstan, eastern Uzbekistan, southeastern Turkmenistan, and western Tajikistan. Most parts of the land surface in Turkmenistan and western Uzbekistan are covered by barren soils.
Central Asia is one of the largest semiarid-to-arid regions in the world (35–56° N, 46–88° E). The regional average annual precipitation is approximately 300 mm, with most precipitation occurring in winter and spring [37]. The Iranian Plateau and the Qinghai-Tibet Plateau, located just to the south of Central Asia, prevent warm and humid air masses from the Indian Ocean and the Pacific Ocean from bringing water vapor to the region. Therefore, the precipitation in Central Asia is mainly affected by the westerly circulation, which brings water vapor from the Atlantic Ocean, and the precipitation is concentrated on the western slopes of the mountains [38,39]. To further investigate the spatial characteristics of the precipitation over Central Asia, the monthly precipitation data provided by the Climatic Research Unit (CRU) are used in this study [40]. As shown in Figure 1c, there is great spatial variability in the precipitation in Central Asia; the annual precipitation ranges from less than 110 mm in the desert area of southwestern Central Asia to more than 500 mm in the Kazakhstan region and up to 900 mm in the mountainous regions of Tajikistan and Kyrgyzstan.
2.2. Data
2.2.1. GFED4s Burned Area
To quantify the interannual variability in Central Asian wildfires, we used the fourth version of the GFED (Global Fire Emissions Database) burned area product [41], updated to account for small fires (GFED4s) [2,42] available at: http://www.globalfiredata.org/. The GFED4s product is generated by combining 500 m MODIS burned area products (MCD64A1) with active fire datasets detected by multiple satellites, including the Tropical Rainfall Measuring Mission (TRMM) Visible and Infrared Scanner (VIRS) and the Along-Track Scanning Radiometer (ATSR) family of sensors [33]. To help the interpretation, the burned area (unit: km2) was represented by the burned area fraction (unit: %), which means the ratio of monthly grid cell burned area to the monthly total grid cell area. The spatial resolution of these data is 0.25° × 0.25°. This dataset is widely used for the detection of wildfire activities worldwide, including in South America, North America, Australia, Europe, Africa, Central Asia, and Southeast Asia [43,44,45,46,47]. In this study, the monthly burned area data from 1997–2016 were used to investigate the temporal and spatial variations in wildfire activities in Central Asia (Table 1).
2.2.2. CRU Monthly Precipitation and Maximum Temperature
Compared to the traditional gauge observations, the gridded datasets have a better spatial representativeness and continuous availability and have been widely used for characterizing droughts. Recent studies [48,49,50] also suggested that the CRU dataset is applicable and satisfactory for climatological studies in Central Asia. The CRU dataset was developed by the Climate Research Unit (University of East Anglia) and is available online http://www.cru.uea.ac.uk/data/. In this study, the monthly precipitation and maximum temperature data from the latest version of Climate Research Unit Version 4.04 (CRU TS4.04) [40] are used for the period from 1997–2016. This station-based gridded dataset is produced by angular-distance weighting interpolation of station observations onto a 0.5° × 0.5° grid.
2.2.3. NOAA/CPC Daily Maximum Temperature
The CPC dataset was developed by the American National Oceanic and Atmospheric Administration (NOAA). A gauge-based analysis of NOAA/CPC daily temperature has been constructed over the global land areas. Gauge reports from over 30,000 stations are collected from multiple sources including GTS, COOP, and other national and international agencies [51]. The NOAA/CPC global daily surface 2-m air temperature (CPC-T2m) is a gridded global daily maximum (Tmax) and minimum (Tmin) temperature analysis from 1979 to the present, available at two spatial of 10 min × 10 min and 0.5° × 0.5° (latitude × longitude). This product provides an observational T2m estimate for climate monitoring, model evaluation, and forecast verification [52]. In this study, the daily Tmax variable is used for the period from 1997–2016, and its spatial resolution is 0.5° × 0.5°.
2.2.4. ERA5 Reanalysis Data
To further investigate the relationship of the burned area with soil moisture, relative humidity, and the influence of large-scale atmospheric circulations on the spatiotemporal characteristics of burned area in the study area, we downloaded the fifth-generation reanalysis dataset of the European Centre for Medium-Range Weather Forecasts (ECMWF), including the monthly mean soil moisture at the topsoil level (0–7 cm), relative humidity at 1000 hPa, specific humidity and horizontal wind at 850 hPa, the geopotential height at 500 hPa, the vertically integrated divergence of moisture flux (VIDMF), and the vertically integrated moisture flux (VIMF) for Central Asia between 1997 and 2016. The ERA5 reanalysis data are produced by combining a numerical weather prediction model estimates with observational data from satellites and ground observations via data assimilation [53]. The spatial resolution of the ERA5 dataset is 0.25° × 0.25°.
Note that the GFED4s and ERA5 data were interpolated to be a spatial resolution of 0.5° × 0.5°.
2.3. Methods
Figure 2 is the flowchart of the methodology used in this study. Based on the climatological distribution of burned areas and its variability across Central Asia, the key region with higher burned areas and larger interannual variability of the burned area is obtained. Secondly, we conducted the Pearson correlation method to explore the correlation between the burned areas and the meteorological factors including precipitation, temperature, soil moisture, and relative humidity in the key region. Meanwhile, the dominant meteorological factor affecting the interannual variation of the burned areas in the key region was determined. Furthermore, through the Composite analysis method, the anomalies of geopotential height at 500 hPa, wind, and specific humidity at 850 hPa, as well as the vertically integrated divergence of moisture flux (VIDMF) and vertically integrated moisture flux (VIMF) in the anomaly high and low burned area years are studied, respectively. Finally, based on the influence of the atmospheric circulation on the dominant meteorological factor, the specific process of the interannual variation of the burned area in key region is revealed. Note that the NCAR Command Language (Version 6.5.0) http://0-dx-doi-org.brum.beds.ac.uk/10.5065/D6WD3XH5 was used in this study.
2.3.1. Correlation Analysis
We investigated the linkage between the burned area variability and meteorological factors through correlation analysis, assessing the strength of relationships using Pearson’s correlation [54] coefficient (r), and evaluating significance (p) using a two-tailed Student’s t-test. The specific method is as follows:
Suppose that there are two variables with a sample size of n, , then the correlation coefficient calculation formula of these two variables is:
The result of the correlation coefficient r is between −1.0 and 1.0. If r > 0, it means that there is a positive correlation between the two variable fields. The larger the value, the stronger the positive correlation; if r < 0, there is a negative correlation, and the smaller the value is, the stronger the negative correlation.
After the calculation of the correlation coefficient, the two-tailed Student’s t-test is conducted. Note that, before this operation, all the variables were carried out by using the detrended method. Removing a trend from the meteorological variables can allow us to isolate the interannual fluctuations and identify any number of important factors. Usually, we used the least squares method to estimate and remove the least squares linear trend. If the data show a linear relationship between the X and Y variables, we can find the line that best fits that relationship. That line is called a regression line and has the equation ŷ = a + b x. The least squares regression line is the line that makes the vertical distance from the data points to the regression line as small as possible. Finally, we removed the differences from the regression line and obtained the detrended meteorological variables.
2.3.2. Composite Analysis
Composite analysis is frequently used in the climate change research to explore the salient characteristics of certain special years. In this study, we first selected the special years in accordance with the rules of greater than 0.5 times the standard deviation or less than −0.5 times the standard deviation based on the standardized time series of burned area. The special years selected are named as high burned area years and low burned area years, respectively. Second, we compared the average of meteorological elements in these special years with the average values of all years to investigate the meteorological differences during high burned area years and low burned area years.
2.3.3. The Frequency of Hot Days
The quantification of heatwaves in this study is conducted to investigate the relationship between burned area and extreme heat conditions. The daily threshold for extremely hot days was defined for each calendar day as the 95th percentile of Tmax based on all the daily maximum temperature during the reference period 1997–2016 within an n-day window centered on the given calendar day. n = 30 (for June and September) and n = 31 (for July and August) were used to analyze the heatwaves, as suggested by Russo et al. [55]. A hot day was defined as when Tmax was above the daily threshold as applied in IPCC (2007a) and many previous studies [56,57,58]. Note that the monthly (seasonally) frequency of hot days is the ratio of the sum of hot days to the total number of days in a certain month (season).
3. Results
3.1. Climatological Distribution of Burned Areas and Its Variability across Central Asia
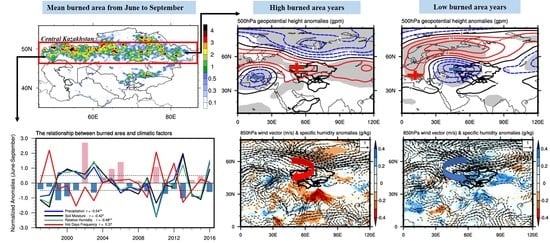
Figure 3 shows the spatial distribution of the monthly burned area fraction averaged from 1997–2016 across Central Asia. The figure shows that the burned area fraction was quite low from November to March (Figure 3a–c,k,l). However, the value of the burned area fraction in the other seven months was relatively large. During April and May, the area with a larger burned area fraction was located north of 52° N in Kazakhstan, and the largest burned area fraction value, 5%, was observed north of Astana city in April (Figure 3d). However, in May, the value of the burned area fraction was approximately 1%, and the highest burned area fraction value was 2.5% (Figure 3e). From June to October, central Kazakhstan between 47° N and 52° N had a large burned area fraction, between 2.5% and 10%, with a maximum of 12.5%. More specifically, in June and July, western central Kazakhstan (47–52° N, 47–70° E) had a large burned area fraction, with maximum values of approximately 7.5%. However, for August and September, the area with a large burned area fraction extended to central Kazakhstan (47–52° N, 47–86° E), with maximum burned area fraction values of 12.5% in western central Kazakhstan in August and of 10.3% in eastern central Kazakhstan in September. The value of the burned area fraction in October was just above 1.5%. Furthermore, in southern and southeastern Kazakhstan, close to the Kyrgyzstan region, very low burned area fraction values were observed, most of which were below 0.5%.
The analysis above reveals that the burned area fraction was high from April to September. To investigate the spatiotemporal characteristics of the interannual variability in the burned area fraction across Central Asia during these six months, we further analyzed the spatial distribution of the interannual variability of the burned area fraction, as shown in Figure 4, which is represented by the standard deviation of the burned area fraction, from 1997–2016 across Central Asia. Notably, the standard deviation is not normalized by monthly mean burned area fraction, and the unit of standard deviation is percentage, which is the same as the unit of burned area fraction. The standard deviation of the burned area fraction was mostly above 0.5%, with the largest value reaching 7.5% from April to May north of 52° N in Kazakhstan (Figure 4a,b). In contrast, the standard deviation in April was slightly higher than that in May, especially in northern Astana city. From June to September, the standard deviation of the burned area fraction was mostly above 5%, with the largest value reaching 20% (Figure 4c–f) in western central Kazakhstan, indicating the large interannual variability in the burned area in western central Kazakhstan (47–52° N, 47–70° E). Comparably, in eastern central Kazakhstan (47–52° N, 70–86° E), there were larger standard deviations in August and September than in June and July.
Overall, the main areas with high burned area fraction values and large interannual variability of burned area fraction were the central and northern regions of Kazakhstan. The interannual variability of burned area in central Kazakhstan during summer and early autumn was almost twice as large as that in northern Kazakhstan during April and May, which indicated that the burned area in central Kazakhstan could be affected by climate conditions comparing to northern Kazakhstan where the impact of human activities, i.e., the combustion of agricultural waste on the wildfire occurrences accounts for a large proportion [28].
Figure 5a shows the annual cycle of the total burned area averaged over 1997–2016 in the five Central Asian countries, i.e., Kazakhstan, Kyrgyzstan, Turkmenistan, Tajikistan, and Uzbekistan, respectively. The annual mean burned area in the Central Asia was approximately 107 ha, and Kazakhstan was the country with the largest burned area (9.6 × 10⁶ ha, which accounted for 96% of the total burned area in Central Asia). The burned areas in the other four countries were much smaller, especially those in Tajikistan and Kyrgyzstan, which accounted for less than 1% of the total burned area in Central Asia. Large seasonal variations in burned area were observed in Central Asia, and we can see that the burned area mainly occurred from June to September with the largest burned area in August.
As Figure 3, Figure 4, and Figure 5a show, the highest burned area fraction and interannual variability throughout Central Asia occurred in northern and central Kazakhstan, so we focused further on the annual cycle of the total burned area across two regions: northern Kazakhstan (NKZ: 52–55° N, 60–70° E) and central Kazakhstan (CKZ: 47–52° N, 46–87° E). As shown in Figure 5b, the seasonal variation in the burned area in CKZ exhibited a single-peak distribution, and the peak of the monthly mean burned area reached 1.8 × 10⁶ ha in August. In addition, the burned areas from June to September were all above 106 ha and were larger than those in other months. In NKZ, the monthly mean burned area showed a bimodal distribution, with one peak in April (3 × 10⁵ ha) and the other in September (1.2 × 10⁵ ha). Note that the maximum monthly burned area in CKZ (1.8 × 10⁶ ha) was approximately six times that in NKZ (3 × 10⁵ ha), which indicated that CKZ was the major combustion area in Central Asia.
Overall, the annual mean burned area in the CKZ region accounts for more than 80% and the burned area in this region has the same seasonal variation characteristics as that in Central Asia. Furthermore, the burned area and the interannual variability of burned area in central Kazakhstan are largest from June to September, so this region could have a closer relationship with climate conditions than northern Kazakhstan where the impact of human activities on the wildfire occurrences accounts for a larger proportion. Therefore, in the following sections, we considered the CKZ region as a key region in Central Asia to further investigate the relationship between the burned area and climatic factors as well as the associated atmospheric circulation responsible for the variations in the burned area.
3.2. The Relationship between Meteorological Factors and the Burned Area
3.2.1. Seasonal Variations
Figure 6 shows the seasonal variations in precipitation, soil moisture, relative humidity, and maximum temperature in the CKZ for the 1997–2016 period. The monthly total burned area is also plotted for reference. In general, as shown in Figure 6a, the relatively wet season is almost in summer from May to July for CKZ, with a regional mean precipitation of approximately 33 mm/month in June, and the maximum precipitation is approximately 36 mm/month in July. The precipitation rapidly decreased to approximately 21 mm/month in August and 19 mm/month in September. Corresponding to the dry season for August and September, a larger burned area can be found in these two months. Although the monthly precipitation amount is relatively higher in June and July, we can still find that the burned area is relatively higher than that in other months except August and September. However, it is noted that even though July is the peak precipitation month, the monthly total precipitation amount is still quite small, and it is only 17 mm more than that in September.
The soil dryness was relatively wet in spring, followed by winter and autumn, and the soil was the driest during summer season from June to September (Figure 6b). The top layer soil moisture was larger than 0.27 m3/m3 from January to April, but it decreased less than 0.18 m3/m3 from June to September, which corresponded to the higher burning area in the same period. The seasonal cycle of near-surface relative humidity was similar to that of the top layer soil moisture, with the lowest surface air humidity found from May to September, and the magnitude of relative humidity was approximately less than 30% during this season (Figure 6c). For other seasons, the atmospheric relative humidity was much larger, with a maximum value of 65% (in January). The seasonal cycle of maximum temperature (Tmax) was also presented in Figure 6d, and we found that, in general, the relatively warm season was in summer for CKZ, with a regional mean Tmax of approximately 35 °C. The Tmax decreased to approximately 32 °C in September.
3.2.2. Interannual Variation
Figure 7a shows the time series of the regional mean burned area in the CKZ for the burning season from 1997–2016. The burning season was defined as the months with the largest burned area (June to September; Figure 5b) before and after removing the linear trend. The burned area showed a slightly decreasing trend of 5 × 10² ha/year, which was not statistically significant at p < 0.1. In general, the annual total burned area was less than 2 × 10⁶ ha for most of years except 2002, 2004, 2005, 2010, 2014, and 2015, with a maximum burned area of 4.6 × 10⁶ ha in 2002. The years with less burned area were 1999 and 2013, with a minimum burned area value of 105 ha in 2013, which is only one-fiftieth of that in 2002.
The burned area in the CKZ showed large interannual variations, as shown in Figure 7b. The years with anomalously large or small burned areas were defined. If a year has a burned area anomaly of 0.5 σ higher (lower) than the multiyear mean, this year is regarded as a high (low) burned area year. The high burned area years were 2002, 2005, 2006, and 2010, and the low burned area years were 1999, 2000, 2003, 2009, 2011, 2013, and 2016.
In addition, Figure 7b also shows that the burned area was negatively correlated with precipitation, with a correlation coefficient of −0.54, which was statistically significant at the p < 0.05 level. For instance, we observed below-average precipitation in 2006 (−4.85 mm) and 2010 (−12.5 mm) where more burned area was recorded over the CKZ region. In contrast, the precipitation was above-average in 2000 (+4.16 mm), 2013 (+12.33 mm), and 2016 (+9.09 mm), leading to less burned area over the region. In general, the monthly mean precipitation was approximately 6 mm less than the climatology during the burning season in the years with high burned areas, while, for the years with low burned areas, the anomaly of precipitation was approximately 4 mm more than the climatology.
Similarly, we found that the interannual variation of soil moisture and near-surface relative humidity was close to that of precipitation during the burning season. The correlation between burned area and soil moisture as well as near-surface relative humidity was almost the same as that of precipitation, with the correlation coefficients of −0.42 and −0.48 respectively, which were statistically significant at the p < 0.1 and p < 0.05. In general, soil moisture and near-surface relative humidity were below-average at approximately 0.05 m3/m3 and 7% on average in the years with high burned areas. In contrast, they were below-average approximately 0.03 m3/m3 and 5% on average in the years with low burned areas.
In addition, we explored the relationship between burned area and the extreme heat conditions based on the frequency of hot days instead of maximum temperature. We found that the frequency of hot days had a positive correlation between burned area and frequency of hot days (r = 0.37, at p < 0.1) as presented in Figure 7b. This suggested that the extreme heat conditions could be one of the important climatic factors for the interannual variation of burned area in a certain area of the CKZ region or a certain month from June to September. For instance, we observed above-average hot days in 2010 (+6 days) where high burned area was recorded over the CKZ region. In contrast, the hot days were below average in 2009 (−3 days) and 2013 (−4 days) where low burned areas were recorded.
Notably, the relationship between the regional mean burned area and the meteorological conditions in each month of the burning season showed certain differences across the whole CKZ region, as shown in Figure 8 and Table 2. The burned area in the CKZ region had a statistically significant negative correlation with precipitation (r = −0.53) and soil moisture (r = −0.53) at p < 0.05 in June. Meanwhile, the burned area in July, August, and September also depicted a statistically significant negative correlation with precipitation and soil moisture at p < 0.1. Furthermore, we found a negative correlation between the relative humidity and the burned area that was statistically significant (at p < 0.05) in June (r = −0.52) and September (r = −0.55). In contrast, the hot-day frequency showed a statistically significant positive correlation with the burned area in June (r = 0.58) and September (r = 0.63) at p < 0.05 and at p < 0.01, respectively. These results indicated that the relative contribution of different meteorological factors to the interannual variation of burned area varies from month to month over the CKZ region. Specifically, precipitation and soil moisture could be the dominant factors from June to September especially in June, while relative humidity and hot-day frequency could be the dominant factors for June and September. In other words, the dry conditions including soil and air and the extreme temperature conditions play an important role in the interannual variation of burned area for June and September, while only dry conditions occur for July and August in the CKZ region.
To provide further evidence, we attempted to demonstrate the spatial distribution of the correlation coefficients across the grid points in the CKZ (Figure 9). During the burning season, precipitation, soil moisture, and near-surface relative humidity all showed consistently negative correlations with the burned area over the CKZ region, and the region with a strong correlation (r < −0.3) was mainly distributed in the western CKZ (WCKZ, west of 70° E). Similarly, to explore the spatial distribution characteristics of the relationship between the burned area at each grid point and the meteorological conditions in each month of the burning season, we further analyzed the correlation coefficient in each month as shown in Figures S1–S4. In June and July, the burned area had significant correlations with meteorological conditions in the WCKZ region, and the correlations were the same as those for the burning season (Figures S1 and S2). However, in August, the burned area had a significant correlation with meteorological conditions in the eastern CKZ (ECKZ, east of 70° E), mainly between 70° E and 80° E (Figure S3). In September, the burned area had a weaker correlation with hot-day frequency over the whole CKZ region compared to the other three months, but there were some significant regions in the CKZ region where the correlation coefficients between burned area and precipitation, soil moisture, or relative humidity were high (Figure S4).
Based on the above analysis, Table 3 shows the correlation coefficients between the burned area and each of these four variables (precipitation, soil moisture, near-surface relative humidity and hot-day frequency) in different CKZ regions during the burning season and each month. In the WCKZ region, the correlation coefficients between the burned area and three variables (precipitation, soil moisture, and near-surface relative humidity) ranged from −0.65 to −0.68 and were all statistically significant at p < 0.01. In the eastern CKZ (ECKZ, east of 70° E), the correlations between the burned area and meteorological factors (precipitation, soil moisture and near-surface relative humidity) were relatively weaker (the absolute values of the correlation coefficients were generally less than 0.3) than in WCKZ. However, there were also significant negative correlations between the burned area and three factors (precipitation, soil moisture, and near-surface relative humidity) in the region between 70° E and 87° E in August and September.
Unlike precipitation, soil moisture, and near-surface relative humidity, the frequency of hot days showed a consistently positive correlation (r > 0.3) with the burned area in most parts of the CKZ, including ECKZ and WCKZ (Figure 8d). The highest correlation coefficient between the burned area and the hot-day frequency was approximately 0.9. However, the correlation coefficient between the burned area and the hot-day frequency for the whole CKZ region was only 0.37 (Figure 6b), indicating that the regional mean moderates the strong local correlation. In certain months, the burned area had a close relationship to the hot-day frequency. For example, in August, the correlation coefficient between the burned area and the hot-day frequency was approximately 0.9 in the region between 70 and 87° E. These results further demonstrate the strong correlation between the burned area and key meteorological factors, especially at the local scale.
Note that, although the burned area had a weak correlation with the maximum temperature (data not shown), the burned area was strongly positively correlated with the hot-day frequency. This indicates that extreme heat conditions are very favorable for the occurrence and spread of wildfires, and thus the extreme heat conditions are also one of the important factors that affect the interannual variation in burned areas.
3.3. Large-Scale Circulation for the Interannual Variation of the Burned Area
In Section 3.2.2, we showed that the correlations between the burned area and meteorological factors were strong in the WCKZ. Here, we used composite analysis to further demonstrate whether large-scale circulation favors higher and lower burned areas in this region.
Figure 10a shows the temporal evolution of the seasonal mean (June to September) burned area for the period of 1997–2016 in the western Kazakhstan (WCKZ) region. For the composite analysis, the high burned area (>+0.5 σ) and low burned area (<–0.5 σ) years were first determined: 2002, 2004, 2005, 2006, and 2010 were high burned area years, and 1997, 1999, 2000, 2003, 2011, 2013, and 2016 were low burned area years. Figure 10b–d shows the spatial distribution of burned area for climatological context and the difference in composite years with high and low burned areas, respectively. In most parts of the WCKZ region, the burned area fraction is more than 1.5% during the burned season for the period of 1997–2016, with an area-averaged of burned area fraction around 3.5%. During the positive anomaly years (Figure 10c), the burned area fraction is significantly high anomaly around 3% in most part of WCKZ region. In contrast, during the negative anomaly years (Figure 10d), the burned area fraction has a significantly low anomaly around 2% in most parts of the WCKZ region.
Figure 11 shows the spatial patterns of precipitation, soil moisture, relative humidity and the frequency of hot days in the WCKZ region to provide the climatological context as well as the high burned area years and low burned area years during the burning season (June to September). During the positive anomaly years, precipitation, soil moisture, and relative humidity were consistently low and the frequency of hot days was high at approximately 4% in the WCKZ. This is consistent with the correlation coefficients analyzed in Section 3.2.2. In contrast, precipitation, soil moisture, and relative humidity were statistically significant positive anomalies during the low burned area years in the WCKZ region, and the frequency of hot days was also a statistically significant negative anomaly especially in the WCKZ region west of 60° E.
To further understand the weather conditions that are favorable to the occurrence and spread of wildfires in the context of atmospheric circulation, we first conducted a composite analysis of the 500 hPa geopotential height (Figure 12). A trough forms in the Black Sea-Mediterranean region upstream of the WCKZ, and a weak ridge forms in the WCKZ, as shown in Figure 12a. During the positive anomaly years (Figure 12b), the trough of the Black Sea-Mediterranean area presented a negative geopotential height anomaly distribution, and the trough center was a low anomaly, by 8 gpm. The ridge over the WCKZ area was a positive geopotential height anomaly with an anomaly of more than 12 gpm in the ridge center. Such conditions lead to a relatively stable circulation system and subsidence airflow over the WCKZ, which suppresses the convection and is not conducive to the development of precipitation. During the negative anomaly years (Figure 12c), the trough in the Black Sea-Mediterranean region presented a positive geopotential height anomaly distribution, and the trough center was anomalously high, by 12 gpm. There was also a ridge over the WCKZ area, and the ridge center was anomalously low, by 8 gpm. Because of the formation of the unstable circulation system, the trough of the Black Sea-Mediterranean region moves eastward to the WCKZ area, which is conducive to the development of convection in this area and produces precipitation.
Figure 13 shows the specific humidity and winds at 850 hPa during the burning season in 1997–2016 as well as their anomalies during high and low burned area years. In the WCKZ, westerlies prevail, and the water vapor mainly comes from the upstream North Atlantic Ocean across the Mediterranean Sea, Black Sea, and Caspian Sea [59]. In positive anomaly years (Figure 13b), the weak easterly anomaly over the WCKZ suppressed the water vapor transported from the North Atlantic Ocean, leading to more arid weather conditions; in contrast, in negative anomaly years (Figure 13c), a weak westerly anomaly in the WCKZ brings more water vapor transport from the North Atlantic, which promotes more humid weather conditions.
Notably, the large-scale convergence controls the precipitation patterns [60,61]. Therefore, the analysis of the moisture transport and its divergence/convergence provides an understanding of the major modes of precipitation variability over the CKZ region and their moisture sources. We further investigated the climatological vertically integrated divergence of moisture flux (VIDMF) and vertically integrated moisture flux (VIMF) for the burning season from 1997–2016 as well as their anomalies during high and low burned area years. As shown in Figure 14a, the VIMF vector from the Mediterranean Sea and Caspian Sea supplies moisture to the WCKZ region and causes precipitation; meanwhile, the VIDMF shows an almost positive pattern in the WCKZ, indicating water vapor divergence in the WCKZ. During high burned area years (Figure 14b), compared to the mean state, there was an anomalous divergence of water vapor in the western WCKZ, and a convergence of water vapor in the eastern WCKZ. In addition, the VIMF vectors over the WCKZ region showed an anticyclonic circulation that suppressed moisture transport to the WCKZ region. In contrast, during low burned area years (Figure 14c), there was an anomalous convergence of water vapor in the western WCKZ and anomalous divergence of water vapor in the eastern WCKZ. Meanwhile, the VIMF vectors over the CKZ showed a cyclonic circulation that was conducive to moisture transport to the CKZ region.
According to the definition of Rossby [62], the westerly circulation index (WI) is quantitatively defined as the 500 hPa geopotential height difference between the 55–75° E region at latitudes of 35° N and 55° N. As shown in Figure 15, during the burning season in the WCKZ region, the precipitation correlated well with WI, and the correlation coefficient between them was 0.53, which was statistically significant at p < 0.05. Meanwhile, the burned area had a negative correlation coefficient (r = −0.37) with WI that was statistically significant at p < 0.1. This result illustrates that the westerly circulation affects the variation in precipitation over the WCKZ and thus affects the variation in burned area. Therefore, the relationships among precipitation, WI, and burned area indicate that when the westerly circulation is weak (strong), it brings less (more) water vapor from the Atlantic Ocean to Central Asia, thereby generating less (more) precipitation, leading to a high (low) burned area during the burning season.
4. Discussion
In general, wildfire is an important disturbance agent in Central Asia, and it affects approximately ten million hectares of land area annually, with a particularly large proportion of area burned in grasslands [63]. There is a large variability in the relative contributions of individual countries within Central Asia to the overall amount of burned area and the overwhelming majority of burning occurs in Kazakhstan [21]. In Kazakhstan, large spatial and temporal variability of burned area are found in the northern and central part of Kazakhstan, where the total burned area is also large. In the northern part of Kazakhstan covered by croplands, a large amount of burning occurs in April and May, which are almost tenfold larger than those in other months. In contrast, in the central Kazakhstan, which is covered by grasslands, there is a large burned area in summer and early autumn with the peak month in August. In addition, there is large interannual variability of burned area in northern and central Kazakhstan during the peak season (April–May and June–September, respectively) and the burning peak is likely to be a combination effect of human activity and meteorological-related conditions [21]. Notably, the interannual variability of burned area in central Kazakhstan during summer and early autumn is almost twice as large as that in northern Kazakhstan during April and May, which indicates that the interannual variation of burned area in central Kazakhstan could be affected by meteorological factors compared to northern Kazakhstan where the impact of human activities on the wildfire occurrences accounts for a large proportion [64]. Consequently, we chose the central Kazakhstan region as a study area to further explore the effect of climate conditions on the interannual variation of burned area.
In central Kazakhstan, the burned area over the CKZ region had large interannual variability during the burning season from 1997–2016. This study found that the dominant factors affecting the interannual variation of burned area are precipitation, soil moisture, and near-surface relative humidity over the central Kazakhstan and precipitation is the major factor followed by near-surface relative humidity and soil moisture in terms of the correlation coefficient during the burning season (June–September). However, we found that there is no significant correlation coefficient between the burned area and hot-day frequency during the burning season, with a correlation coefficient of only 0.2, which is different from the result that extreme heat conditions can cause more wildfires in the northern Eurasia [65]. We further investigated the relationship between burned area and meteorological factors for individual months from June to September (Table 3). We found that, during the relative wet season (June–July), in the western part of central Kazakhstan, precipitation is the dominant factor followed by near-surface relative humidity and soil moisture, which is the same as the whole burning season. Especially, in July, the correlation coefficient between burned area and precipitation is up to around 0.8, totally larger than the other three meteorological factors. Similarly, Chen et al. [11] also found that, in South America during the wet season, the precipitation is also the major meteorological factor affecting the interannual variations of burned area. Interestingly, during the dry season (August–September), we found that the frequency of hot days was the most important meteorological factor affecting the interannual variation of burned area in the eastern central Kazakhstan, instead of precipitation. In particular, in August, we can find that the correlation coefficient between burned area and the frequency of hot days is up to 0.9. Meanwhile, the correlations between burned area and soil moisture as well as relative humidity are also larger than those with precipitation. Consequently, based on the above analysis, it is suggested that, during the wet season, the amount of burned area is more sensitive to the changes of precipitation. However, during the dry season with the lowest level of precipitation, the extreme heat conditions play a more important role in the change of burned area at the interannual scale. The extremely high temperature makes the water vapor lost by evaporation greater than that obtained by precipitation, ultimately leading to the drier climate conditions, increased fuel dryness, and directly support the occurrence and spread of wildfire over the region [35,66]. Indeed, except for the above four variables, the other climatic variables, such as the number of wet days (WET) which provides a measure of the average length of dry periods, monthly diurnal temperature range (DTR), and land surface temperature (LST), which are the measures of energetic constraints on fuel drying, also affect the interannual variations of burned area [67,68].
Previous studies have demonstrated that drought conditions associated with atmospheric circulation are the key regulators of extreme fire events [27]. Although there are different dominant factors at intraseasonal and seasonal scales, we are trying to focus on the specific processes of how the precipitation affects the interannual variation of burned area over the central Kazakhstan region during the burning season. We conducted a composite analysis of atmospheric circulation differences in years with high and low burned area. Cherednichenko et al. [69] suggested that the convective clouds supply most of the precipitation in the summer season for the central Kazakhstan during the summer season. We found that the large moisture flux from the Atlantic Ocean to the Central Kazakhstan and a weakened ridge over the WCKZ region can ascribe more precipitation [70] and is conducive to the development of convective precipitation ultimately causing lower burned areas in the region. In contrast, less moisture flux and an enhanced ridge over the WCKZ region suppress the convective precipitation leading to initiate the wildfires. On the other hand, our results revealed a negative relationship between the burned area in the Central Kazakhstan and westerlies, suggesting that the middle-latitude to high-latitude circulation modulates the precipitation in Central Asia [18], ultimately affecting wildfires over the region.
Overall, this study shows a close relation between wildfire activities and meteorological factors over the central Kazakhstan region. It also reveals the effect of large-scale circulation on the interannual variation of burned area. The importance of meteorological conditions in determining wildfire is well regarded in other regions of the world and various fire indexes have been established [71,72,73]. Therefore, it is desirable to further investigate the applicability of these indexes in Central Asia in the future. Furthermore, this study suggests that positive temperature, negative precipitation, soil moisture, and relative humidity anomalies in the central Kazakhstan correlate with large wildfires, so they are also the good indicators to predict the occurrence and spread of wildfires at seasonal and intraseasonal scales based on the lagged relations for antecedent meteorological factors, and to project the future fire weather and climate conditions. It is projected that the temperature during the burning season will increase in the 2080s under future climate scenarios, and the burned area is projected to increase by 3–13% by 2071–2100, depending on future emissions scenarios [35]. The daily maximum temperature and fire danger rate would increase and the annual precipitation would decrease in the 2071–2100 [74]. In general, future climate and its manifestation in regional weather and climate patterns will provide more favorable atmospheric conditions for wildfires to become erratic and spread rapidly in the region [15].
5. Conclusions
The clear understanding of the spatial-temporal characteristics of wildfire activities, and the role of climatic factors in the wildfire activities is crucial for fire management and mitigate the wildfire disasters over Central Asia. According to the results, we found that more than 90% of the annual mean burned area over Central Asia is concentrated in Kazakhstan. This study suggests that the wildfire activities over the region has seasonal dependency. For instance, in the northern Kazakhstan, peak of burned area is detected from April to May, while central Kazakhstan recorded the maximum burned area during June to September. The higher burned area and larger interannual variability of burned area were distributed in central Kazakhstan during June to September, where the precipitation is a key meteorological factor for the variations of wildfire activities. Meanwhile, soil moisture, relative humidity, and the frequency of hot days also have a close relationship with wildfire activities in the central Kazakhstan. In addition, the relative contribution of different meteorological factors to the interannual variation of burned area varies from month to month over the central Kazakhstan. Specifically, precipitation, soil moisture, and relative humidity are the dominant factors for the entire burning season, especially in summer (June–August) over the western central Kazakhstan. Hot days frequency has large impact on the interannual variation of burned area in the western central Kazakhstan for June and July and in the eastern central Kazakhstan for August and September. This study also suggests that the weakened westerlies suppressed the transport of water vapor from the Atlantic Ocean to the central Kazakhstan, resulting in the decreasing precipitation, which was favorable for higher burned areas over the region. Therefore, a better understanding of the possible atmospheric teleconnections and external forcing related to the interannual variation of burned area in central Kazakhstan is needed to improve the prediction skills about fire danger. The results will contribute and enhance the understanding related to the occurrence of wildfires in Central Asia and provide scientific evidence to adopt effective solutions for fire management departments.
Supplementary Materials
The following are available online at https://0-www-mdpi-com.brum.beds.ac.uk/2072-4292/13/2/313/s1, Figures S1–S4. The spatial distribution of the correlation coefficient between burned area (a) precipitation (b) soil moisture (c) relative humidity and (d) hot days frequency from June to September over the Central Kazakhstan (CKZ) region, respectively. The linear trend of all variables is removed first before being used for the calculation of correlation coefficient. The dots denote the regions where the correlation is statistically significant at the 90% confidence level.
Author Contributions
Conceptualization, Z.L. and Y.X.; methodology, Y.X.; formal analysis, Y.X. and Z.L.; resource, Z.L.; data curation, Y.X.; writing―original draft preparation, Y.X.; writing―review and editing, Z.L. and C.W.; funding acquisition, Z.L. All authors have read and agreed to the published version of the manuscript.
Funding
This research was jointly supported by the Strategic Priority Research Program of the Chinese Academy of Sciences (Grant No. XDA19030403), National Natural Science Foundation of China (Grant No. 42075166), and the project “Climate monitoring and prediction applications in the high and cold regions of North Hemisphere using FY-3 satellite products” (Grant No. ZQC-R18012) from National Satellite Meteorological Center, China Meteorological Administration.
Informed Consent Statement
Informed consent was obtained from all subjects involved in the study.
Data Availability Statement
No new data were created or analyzed in this study. Data sharing is not applicable to this article.
Acknowledgments
We acknowledge the CPC Global Temperature data provided by the NOAA/OAR/ESRL PSL, Boulder, CO, USA. A special acknowledgement should be expressed to China-Pakistan Joint Research Center on Earth Sciences that supported the implementation of this study. We also thank the anonymous reviewers for their constructive criticism and helpful comments.
Conflicts of Interest
The authors declare no conflict of interest.
References
- Marlon, J.R.; Bartlein, P.J.; Carcaillet, C.; Gavin, D.G.; Harrison, S.P.; Higuera, P.E.; Joos, F.; Power, M.J.; Prentice, I.C. Climate and human influences on global biomass burning over the past two millennia. Nat. Geosci. 2008, 1, 697–702. [Google Scholar] [CrossRef]
- van der Werf, G.R.; Randerson, J.T.; Giglio, L.; van Leeuwen, T.T.; Chen, Y.; Rogers, B.M.; Mu, M.; van Marle, M.J.E.; Morton, D.C.; Collatz, G.J.; et al. Global fire emissions estimates during 1997–2016. Earth Syst. Sci. Data 2017, 9, 697–720. [Google Scholar] [CrossRef] [Green Version]
- Scott, A.C.; Glasspool, I.J. The diversification of Paleozoic fire systems and fluctuations in atmospheric oxygen concentration. Proc. Natl. Acad. Sci. Usa 2006, 103, 10861. [Google Scholar] [CrossRef] [PubMed] [Green Version]
- Van der Werf, G.R.; Randerson, J.T.; Giglio, L.; Collatz, G.J.; Kasibhatla, P.S.; Arellano, A.F., Jr. Interannual variability in global biomass burning emissions from 1997 to 2004. Atmos. Chem. Phys. 2006, 6, 3423–3441. [Google Scholar] [CrossRef] [Green Version]
- Harrison, S.P.; Marlon, J.R.; Bartlein, P.J. Fire in the Earth System. In Changing Climates, Earth Systems and Society; Dodson, J., Ed.; Springer: Dordrecht, The Netherlands, 2010; pp. 21–48. [Google Scholar] [CrossRef]
- Moritz, M.A.; Stephens, S.L. Fire and sustainability: Considerations for California’s altered future climate. Clim. Chang. 2008, 87, 265–271. [Google Scholar] [CrossRef] [Green Version]
- Swetnam, T.W. Fire history and climate change in giant sequoia groves. Science 1993, 262, 885–889. [Google Scholar] [CrossRef]
- Westerling, A.L.; Gershunov, A.; Brown, T.J.; Cayan, D.R.; Dettinger, M.D. Climate and Wildfire in the Western United States. B Am. Meteorol. Soc. 2003, 84, 595–604. [Google Scholar] [CrossRef] [Green Version]
- Flannigan, M.D.; Logan, K.A.; Amiro, B.D.; Skinner, W.R.; Stocks, B.J. Future Area Burned in Canada. Clim. Chang. 2005, 72, 1–16. [Google Scholar] [CrossRef]
- Prasad, V.K.; Badarinath, K.V.S.; Eaturu, A. Biophysical and anthropogenic controls of forest fires in the Deccan Plateau, India. J. Env. Manag. 2008, 86, 1–13. [Google Scholar] [CrossRef]
- Chen, Y.; Velicogna, I.; Famiglietti, J.S.; Randerson, J.T. Satellite observations of terrestrial water storage provide early warning information about drought and fire season severity in the Amazon. J. Geophys. Res. Biogeoences. 2013, 118, 495–504. [Google Scholar] [CrossRef] [Green Version]
- Abatzoglou, J.T.; Williams, A.P.; Barbero, R. Global emergence of anthropogenic climate change in fire weather indices. Geophys. Res. Lett. 2019, 46, 326–336. [Google Scholar] [CrossRef] [Green Version]
- Stocks, B.J.; Fosberg, M.A.; Lynham, T.J.; Mearns, L.; Wotton, B.M.; Yang, Q.; Jin, J.Z.; Lawrence, K.; Hartley, G.R.; Mason, J.A.; et al. Climate Change and Forest Fire Potential in Russian and Canadian Boreal Forests. Clim. Chang. 1998, 38, 1–13. [Google Scholar] [CrossRef]
- Flannigan, M.D.; Krawchuk, M.A.; Groot, W.J.D.; Wotton, B.M.; Gowman, L.M. Implications of changing climate for global wildland fire. Int. J. Wildland Fire 2009, 18, 483–507. [Google Scholar] [CrossRef]
- Luo, L.; Tang, Y.; Zhong, S.; Bian, X.; Heilman, W.E. Will Future Climate Favor More Erratic Wildfires in the Western United States? J. Appl. Meteorol. Clim. 2013, 52, 2410–2417. [Google Scholar] [CrossRef] [Green Version]
- Falk, D.A.; Heyerdahl, E.K.; Brown, P.M.; Farris, C.; Fulé, P.Z.; McKenzie, D.; Swetnam, T.W.; Taylor, A.H.; Van Horne, M.L. Multi-scale controls of historical forest-fire regimes: New insights from fire-scar networks. Front. Ecol. Env. 2011, 9, 446–454. [Google Scholar] [CrossRef] [Green Version]
- Lioubimtseva, E.; Cole, R. Uncertainties of Climate Change in Arid Environments of Central Asia. Rev. Fish. Sci. 2006, 14, 29–49. [Google Scholar] [CrossRef]
- Chen, F.; Wang, J.; Jin, L.; Zhang, Q.; Jing, L.I.; Chen, J. Rapid warming in mid-latitude central Asia for the past 100 years. Front. Earth Sci. China 2009, 3, 42–50. [Google Scholar] [CrossRef]
- Huang, A.; Zhou, Y.; Zhang, Y.; Huang, D.; Zhao, Y.; Wu, H. Changes of the Annual Precipitation over Central Asia in the Twenty-First Century Projected by Multimodels of CMIP5. J.Clim. 2014, 27, 6627–6646. [Google Scholar] [CrossRef]
- Kim, J.-S.; Kug, J.-S.; Jeong, S.-J.; Park, H.; Schaepman-Strub, G. Extensive fires in southeastern Siberian permafrost linked to preceding Arctic Oscillation. Sci. Adv. 2020, 6, eaax3308. [Google Scholar] [CrossRef] [Green Version]
- Loboda, T.V.; Giglio, L.; Boschetti, L.; Justice, C.O. Regional fire monitoring and characterization using global NASA MODIS fire products in dry lands of Central Asia. Front. Earth Sci. 2012, 6, 196–205. [Google Scholar] [CrossRef]
- McConnell, J.R.; Edwards, R.; Kok, G.L.; Flanner, M.G.; Zender, C.S.; Saltzman, E.S.; Banta, J.R.; Pasteris, D.R.; Carter, M.M.; Kahl, J.D.W. 20th-Century Industrial Black Carbon Emissions Altered Arctic Climate Forcing. Science 2007, 317, 1381–1384. [Google Scholar] [CrossRef] [PubMed] [Green Version]
- Leptoukh, G.; Csiszar, I.; Romanov, P.; Shen, S.; Loboda, T.; Gerasimov, I. NASA NEESPI Data and Services Center for Satellite Remote Sensing Information. Env. Res. Lett. 2007, 2, 045009. [Google Scholar] [CrossRef]
- Yan, G.; Mas, J.F.; Maathuis, B.H.P.; Xiangmin, Z.; Van Dijk, P.M. Comparison of pixel-based and object-oriented image classification approaches—A case study in a coal fire area, Wuda, Inner Mongolia, China. Int. J. Remote Sens. 2006, 27, 4039–4055. [Google Scholar] [CrossRef]
- Sinkunas, P. The Physical Geography of Northern Eurasia; Shahgedanova, M., Ed.; Oxford University Press: Oxford, UK, 2003; p. 571. [Google Scholar]
- Shen, S.; Leptoukh, G.; Loboda, T.; Csiszar, I.; Gerasimov, I. The NASA NEESPI Data Portal to Support. Studies of Climate and Environmental Changes in Non-boreal Europe; Springer: Dordrecht, The Netherlands, 2009. [Google Scholar]
- Asner, G.P.; Alencar, A. Drought impacts on the Amazon forest: The remote sensing perspective. New Phytol. 2010, 187, 569–578. [Google Scholar] [CrossRef]
- Humber, M.L.; Boschetti, L.; Giglio, L.; Justice, C.O. Spatial and temporal intercomparison of four global burned area products. Int. J. Digit. Earth 2019, 12, 460–484. [Google Scholar] [CrossRef]
- Giglio, L.; Kendall, J.D.; Mack, R. A multi-year active fire dataset for the tropics derived from the TRMM VIRS. Int. J. Remote Sens. 2003, 24, 4505–4525. [Google Scholar] [CrossRef]
- Giglio, L.; Csiszar, I.; Restás, Á.; Morisette, J.T.; Schroeder, W.; Morton, D.; Justice, C.O. Active fire detection and characterization with the advanced spaceborne thermal emission and reflection radiometer (ASTER). Remote Sens. Env. 2008, 112, 3055–3063. [Google Scholar] [CrossRef]
- Roy, D.P.; Boschetti, L.; Justice, C.O.; Ju, J. The collection 5 MODIS burned area product—Global evaluation by comparison with the MODIS active fire product. Remote Sens Env. 2008, 112, 3690–3707. [Google Scholar] [CrossRef]
- Tansey, K.; Grégoire, J.-M.; Defourny, P.; Leigh, R.; Pekel, J.F.O.; Van Bogaert, E.; Bartholomé, E. A new, global, multi-annual (2000-2007) burnt area product at 1 km resolution. Geophys. Res. Lett. 2008, 35, L01401. [Google Scholar] [CrossRef]
- Giglio, L.; Randerson, J.T.; Van der Werf, G.R.; Kasibhatla, P.S.; Collatz, G.J.; Morton, D.C.; DeFries, R.S. Assessing variability and long-term trends in burned area by merging multiple satellite fire products. Biogeoences 2010, 7, 1171–1186. [Google Scholar] [CrossRef] [Green Version]
- Chen, Y.; Randerson, J.T.; Morton, D.C.; Defries, R.S.; Collatz, G.J.; Kasibhatla, P.S.; Giglio, L.; Jin, Y.; Marlier, M.E. Forecasting Fire Season Severity in South America Using Sea Surface Temperature Anomalies. Science 2011, 334, 787–791. [Google Scholar] [CrossRef] [PubMed] [Green Version]
- Zong, X.; Tian, X.; Yin, Y. Impacts of Climate Change on Wildfires in Central Asia. Forests 2020, 11, 802. [Google Scholar] [CrossRef]
- van der Werf, G.R.; Randerson, J.T.; Giglio, L.; Collatz, G.J.; Mu, M.; Kasibhatla, P.S.; Morton, D.C.; DeFries, R.S.; Jin, Y.; van Leeuwen, T.T. Global fire emissions and the contribution of deforestation, savanna, forest, agricultural, and peat fires (1997–2009). Atmos. Chem. Phys. 2010, 10, 11707–11735. [Google Scholar] [CrossRef] [Green Version]
- Lioubimtseva, E.; Henebry, C.M. Climate and environmental change in arid Central Asia: Impacts, vulnerability, and adaptations. J. Arid Env. 2009, 73, 963–977. [Google Scholar] [CrossRef]
- Aizen, E.M.; Aizen, V.B.; Melack, J.M.; Nakamura, T.; Ohta, T. Precipitation and atmospheric circulation patterns at mid-latitudes of Asia. Int. J. Clim. 2001, 21, 535–556. [Google Scholar] [CrossRef]
- Rogers, J.C.; Van Loon, H. The seesaw in winter temperatures between Greenland and northern Europe. Part II: Some oceanic and atmospheric effects in middle and high latitudes. Mon. Weather Rev. 1979, 107, 509–519. [Google Scholar] [CrossRef]
- Harris, I.; Osborn, T.J.; Jones, P.; Lister, D. Version 4 of the CRU TS monthly high-resolution gridded multivariate climate dataset. Sci. Data 2020, 7, 109. [Google Scholar] [CrossRef] [Green Version]
- Giglio, L.; Randerson, J.T.; Werf, G.R.V.D. Analysis of daily, monthly, and annual burned area using the fourth-generation global fire emissions database (GFED4). J. Geophys. Res. Biogeosci. 2013, 118, 317–328. [Google Scholar] [CrossRef] [Green Version]
- Randerson, J.T.; Chen, Y.; van der Werf, G.R.; Rogers, B.M.; Morton, D.C. Global burned area and biomass burning emissions from small fires. J. Geophys. Res. Biogeosci. 2012, 117. [Google Scholar] [CrossRef]
- Champion, W.M.; Warren, S.H.; Kooter, I.M.; Preston, W.; Krantz, Q.T.; DeMarini, D.M.; Jetter, J.J. Mutagenicity- and pollutant-emission factors of pellet-fueled gasifier cookstoves: Comparison with other combustion sources. Sci. Total Env. 2020, 739, 139488. [Google Scholar] [CrossRef]
- Chen, Y.; Morton, D.C.; Andela, N.; Giglio, L.; Randerson, J.T. How much global burned area can be forecast on seasonal time scales using sea surface temperatures? Env. Res. Lett. 2016, 11, 045001. [Google Scholar] [CrossRef]
- Pan, X.; Ichoku, C.; Chin, M.; Bian, H.; Darmenov, A.; Colarco, P.; Ellison, L.; Kucsera, T.; da Silva, A.; Wang, J.; et al. Six global biomass burning emission datasets: Intercomparison and application in one global aerosol model. Atmos. Chem. Phys. 2020, 20, 969–994. [Google Scholar] [CrossRef] [Green Version]
- Jiang, Y.; Lu, Z.; Liu, X.; Qian, Y.; Zhang, K.; Wang, Y.; Yang, X.Q. Impacts of global open-fire aerosols on direct radiative, cloud and surface-albedo effects simulated with CAM5. Atmos. Chem. Phys. 2016, 16, 14805–14824. [Google Scholar] [CrossRef] [Green Version]
- Li, F.; Lawrence, D.M.; Bond-Lamberty, B. Impact of fire on global land surface air temperature and energy budget for the 20th century due to changes within ecosystems. Env. Res. Lett. 2017, 12, 044014. [Google Scholar] [CrossRef]
- Deng, H.; Chen, Y. Influences of recent climate change and human activities on water storage variations in Central Asia. J. Hydrol. 2017, 544, 46–57. [Google Scholar] [CrossRef]
- Li, Z.; Chen, Y.; Fang, G.; Li, Y. Multivariate assessment and attribution of droughts in Central Asia. Sci Rep. Uk 2017, 7, 1316. [Google Scholar] [CrossRef]
- Li, Z.; Chen, Y.; Wang, Y.; Fang, G. Dynamic changes in terrestrial net primary production and their effects on evapotranspiration. Hydrol. Earth Syst. Sci. 2016, 20, 2169–2178. [Google Scholar] [CrossRef] [Green Version]
- Fan, Y.; Van den Dool, H. A global monthly land surface air temperature analysis for 1948–present. J. Geophys. Res. Atmos. 2008, 113, D01103. [Google Scholar] [CrossRef]
- Pan, Y.; Wang, W.; Shi, W. Assessment of CPC Global Daily Surface Air Temperature (CPC-T2m) Analysis. Assessment 2019, 22, 24. [Google Scholar]
- Hersbach, H.; Bell, B.; Berrisford, P.; Hirahara, S.; Horányi, A.; Muñoz-Sabater, J.; Nicolas, J.; Peubey, C.; Radu, R.; Schepers, D.; et al. The ERA5 global reanalysis. Q. J. R. Meteorol. Soc. 2020, 146, 1999–2049. [Google Scholar] [CrossRef]
- Wilks, D.S. Statistical Methods in the Atmospheric Sciences; Academic Press: Cambridge, MA, USA, 2011; Volume 100. [Google Scholar]
- Russo, S.; Dosio, A.; Graversen, R.G.; Sillmann, J.; Carrao, H.; Dunbar, M.B.; Singleton, A.; Montagna, P.; Barbola, P.; Vogt, J.V. Magnitude of extreme heat waves in present climate and their projection in a warming world. J. Geophys. Res. Atmos. 2014, 119, 12,500–12,512. [Google Scholar] [CrossRef] [Green Version]
- Jones, P.D.; Horton, E.B.; Folland, C.K.; Hulme, M.; Parker, D.E.; Basnett, T.A. The Use of Indices to Identify Changes in Climatic Extremes. Clim. Chang. 1999, 42, 131–149. [Google Scholar] [CrossRef]
- Hua, L.; Ma, Z.; Zeng, Z. The comparative analysis of the changes of extreme temperature and extreme diurnal temperature range of large cities and small towns in eastern China. Chin. J. Atmos. Sci. Chin. Ed. 2006, 30, 80. [Google Scholar]
- Yan, Z.; Yang, C. Geographic patterns of extreme climate changes in China during 1951-1997. Clim. Env. Res. 2000, 5, 267–272. [Google Scholar]
- Syed, F.S.; Giorgi, F.; Pal, J.S.; King, M.P. Effect of remote forcings on the winter precipitation of central southwest Asia part 1: Observations. . Appl. Clim. 2006, 86, 147–160. [Google Scholar] [CrossRef]
- Allan, R.P.; Soden, B.J. Large discrepancy between observed and simulated precipitation trends in the ascending and descending branches of the tropical circulation. Geophys. Res. Lett. 2007, 34. [Google Scholar] [CrossRef] [Green Version]
- Trenberth, K.E.; Dai, A.; Rasmussen, R.M.; Parsons, D.B. The Changing Character of Precipitation. B Am. Meteorol. Soc. 2003, 84, 1205–1218. [Google Scholar] [CrossRef]
- Rossby, C.G. Relation between Variations in the Intensity of the Zonal Circulation of the Atmosphere and the Displacements of the Semi-permanent Centers of Action. J. Mar. Res. 1939, 2, 38–55. [Google Scholar] [CrossRef]
- Cao, X.; Meng, Y.; Chen, J. Mapping Grassland Wildfire Risk of the World. In World Atlas of Natural Disaster Risk; Shi, P., Kasperson, R., Eds.; Springer: Berlin/Heidelberg, Germany, 2015; pp. 277–283. [Google Scholar] [CrossRef]
- Syphard, A.D.; Keeley, J.E.; Pfaff, A.H.; Ferschweiler, K. Human presence diminishes the importance of climate in driving fire activity across the United States. Proc. Natl. Acad. Sci. Usa 2017, 114, 13750–13755. [Google Scholar] [CrossRef] [Green Version]
- Lappalainen, H.K.; Kerminen, V.-M.; Petäjä, T.; Kurten, T.; Baklanov, A.; Shvidenko, A.; Bäck, J.; Vihma, T.; Alekseychik, P.; Arnold, S. Pan-Eurasian Experiment (PEEX): Towards holistic understanding of the feedbacks and interactions in the land-atmosphere-ocean-society continuum in the Northern Eurasian region. Atmos. Chem. Phys. Discuss. 2016, 16, 14421–14461. [Google Scholar] [CrossRef] [Green Version]
- Jolly, W.M.; Cochrane, M.A.; Freeborn, P.H.; Holden, Z.A.; Brown, T.J.; Williamson, G.J.; Bowman, D.M. Climate-induced variations in global wildfire danger from 1979 to 2013. Nat. Commun. 2015, 6, 7537. [Google Scholar] [CrossRef] [PubMed]
- Forkel, M.; Dorigo, W.; Lasslop, G.; Teubner, I.; Chuvieco, E.; Thonicke, K. A data-driven approach to identify controls on global fire activity from satellite and climate observations (SOFIA V1). Geosci. Model. Dev. 2017, 10, 4443–4476. [Google Scholar] [CrossRef] [Green Version]
- Maffei, C.; Alfieri, S.; Menenti, M. Relating Spatiotemporal Patterns of Forest Fires Burned Area and Duration to Diurnal Land Surface Temperature Anomalies. Remote Sens. 2018, 10, 1777. [Google Scholar] [CrossRef] [Green Version]
- Cherednichenko, A. Estimating agricultural adaptation to climate change through cloud activation for northern Kazakhstan. In Environmental Problems of Central Asia and their Economic, Social and Security Impacts; Springer: Berlin/Heidelberg, Germany, 2008; pp. 183–190. [Google Scholar]
- Huang, W.; Chen, F.; Feng, S.; Chen, J.; Zhang, X. Interannual precipitation variations in the mid-latitude Asia and their association with large-scale atmospheric circulation. Chin. Sci. Bull. 2013, 58, 3962–3968. [Google Scholar] [CrossRef] [Green Version]
- Cohen, J.D. The National Fire-Danger Rating System: Basic Equations; US Department of Agriculture, Forest Service, Pacific Southwest Forest and Range Experiment Station: Berkeley, CA, USA, 1985; Volume 82.
- Burgan, R.E.; Klaver, R.W.; Klaver, J.M. Fuel Models and Fire Potential From Satellite and Surface Observations. Int. J. Wildland Fire 1998, 8, 159–170. [Google Scholar] [CrossRef]
- Potter, B. The Haines Index—It’s time to revise it or replace it. Int. J. Wildland Fire 2018, 27, 437–440. [Google Scholar] [CrossRef]
- Liu, Y.; Stanturf, J.; Goodrick, S. Trends in global wildfire potential in a changing climate. Ecol. Manag. 2010, 259, 685–697. [Google Scholar] [CrossRef]
Figure 1.
The spatial distribution of (a) topography and (b) land cover in Central Asia. The thick black line demarcates the boundary of Central Asia, and the capital cities shown in (a) are represented by red dots. Seas and inland lakes are shown in blue in (a,b); (c) shows the spatial pattern of annual precipitation (unit: mm/year) over Central Asia.

Figure 2.
The flowchart of the methodology used in this study.

Figure 3.
The spatial distribution of the monthly burned area fraction (%) averaged from 1997–2016 across Central Asia. (a–l) represent the results from January to December, respectively.
Figure 3.
The spatial distribution of the monthly burned area fraction (%) averaged from 1997–2016 across Central Asia. (a–l) represent the results from January to December, respectively.

Figure 4.
Spatial distribution of interannual variability of the burned area fraction in (a) April, (b) May, (c) June, (d) July, (e) August and (f) September in terms of standard deviation (unit: %) from 1997–2016 across Central Asia. The blue and red rectangles represent the NKZ and CKZ regions, respectively, in (c).

Figure 5.
The annual cycle of the total burned area (unit: ×104 hectares) averaged from 1997–2016 for (a) five countries in Central Asia, i.e., Kazakhstan (green), Uzbekistan (blue), Kyrgyzstan (yellow), Turkmenistan (red), and Tajikistan (purple), respectively, and for (b) central Kazakhstan (CKZ, blue) and northern Kazakhstan (NKZ, gray). The x-axis represents the month of the year, starting in January.


Figure 6.
The annual cycle of (a) precipitation (blue bar, unit: mm/month) and burned area (gray bar; unit: × 104 ha) in the CKZ during from 1997–2016. (b–d) are same as (a), but for the soil moisture (blue bar, unit: m3/m3), relative humidity (blue bar, unit: %), and (d) maximum temperature (red bar, unit: °C). The upper whispers represent the positive standard deviation of climatic factors and burned area.

Figure 7.
Temporal evolution of seasonal mean (June to September) (a) burned area (solid line; unit: × 104 ha) and detrended burned area (dashed line; unit: × 104 ha) and (b) precipitation (PRE), soil moisture (SM), relative humidity (RH) and hot-day frequency (HDF) for the period of 1997–2016 over the central Kazakhstan (CKZ) region. The area-averaged burned area (bar graph) is plotted for reference in (b). All the meteorological variables were detrended in order to plot normalized anomalies in Figure 6b. The dashed line in Figure 6b denotes the +0.5 σ (σ is the standard deviation of the normalized burned area) and −0.5 σ lines. Additionally, Figure 6b shows the correlation coefficients (r) between precipitation and burned area, soil moisture, and burned area, between relative humidity and burned area, and hot-day frequency and burned area. The significance of each correlation is indicated by one asterisk (*; at p < 0.1) or two asterisks (**; at p < 0.05) after the correlation coefficient.

Figure 8.
Temporal evolution of (a) June, (b) July, (c) August, and (d) September burned area (bar graph), precipitation (PRE), soil moisture (SM), relative humidity (RH) and hot days frequency (HDF) for the period of 1997–2016 over the central Kazakhstan (CKZ) region. The area-averaged burned area (bar graph) is plotted for reference. All the meteorological variables are detrended for plotting normalized anomalies. The dashed line denotes the ±0.5 standard deviation lines.

Figure 9.
The spatial distribution of the correlation coefficients between burned area and (a) precipitation (PRE), (b) soil moisture (SM), (c) relative humidity (RH) and (d) hot days frequency (HDF) during the burning season (June to September) in the CKZ region. The linear trends of all variables were removed before being used for the calculation of the correlation coefficients. The dots denote the regions where the correlation is statistically significant at p < 0.1.

Figure 10.
The temporal evolution (a) and spatial pattern (b–d) of seasonal burned area (June to September) for the period of 1997–2016 in the western central Kazakhstan (WCKZ) region. The burned area was detrended in order to plot normalized anomalies and the dashed line denotes the ±0.5 standard deviation in figure (a); (b–d) represents the burned area for the climatological context and the difference in composite years with high and low burned areas respectively. The dotted areas indicate where the differences are statistically significant at p < 0.1 (Student’s t-test).

Figure 11.
The spatial distribution of precipitation (mm month−1), soil moisture (m3 m−3), relative humidity (%), and hot-day frequency (%) for climatological context and the difference in composite years with high and low burned areas. The left panels (a,d,g,j) show the climatological data, and the middle panels (b,e,h,k) represent the differences in composite years with high burned areas. The right panels (c,f,i,l) are the same as the middle panels but for composite years with low burned areas. The dotted areas indicate where the differences are statistically significant at p < 0.1 (Student’s t-test).

Figure 12.
The geopotential height at 500 hPa (GPH; contour; unit: gpm) for the burning season (a) climatology averaged over 1997–2016, as well as their anomalies in (b) high burned area years and (c) low burned area years. If the burned area for a year was >+0.5 σ (<−0.5 σ), the year was considered a high (low) burned area year. The thick black lines indicate Central Asia, and the black rectangle denotes the western central Kazakhstan region. The shaded area represents the anomalies that are statistically significant at p < 0.1.

Figure 13.
The specific humidity (Q; shaded; unit: g kg−1) and the wind vector (UV; arrows; unit: m s−1) at 850 hPa for the burning season (a) climatology averaged over 1997–2016, as well as their anomalies for (b) high and (c) low burned area years. If the burned area for a year was >+0.5 σ (<−0.5 σ), the year was considered a high (low) burned area year. The thick black lines indicate Central Asia, and the black rectangle denotes the western central Kazakhstan region.

Figure 14.
The vertically integrated moisture flux divergence (VIDMF; shaded; unit: 10–5 kg m−2 s−1) superimposed with the vertically integrated moisture flux (VIMF; vector, unit: kg m−1 s−1) for the burning season (a) climatology averaged over 1997–2016 as well as anomalies for (b) high and (c) low burned area years. If the burned area for a year was >+0.5 σ (<−0.5 σ), the year was considered a high (low) burned area year. The thick black lines indicate Central Asia, and the black rectangle denotes the western central Kazakhstan (WCKZ) region.

Figure 15.
Temporal evolution of detrended seasonal anomalies of burned area (BA; black solid line) precipitation (PRE; blue solid line) over the western central Kazakhstan (WCKZ) region, and westerly circulation index (WI; red solid line) during the burning season. WI is defined as the 500 hPa geopotential height difference over the 55–75° E region between 35° N and 55° N.


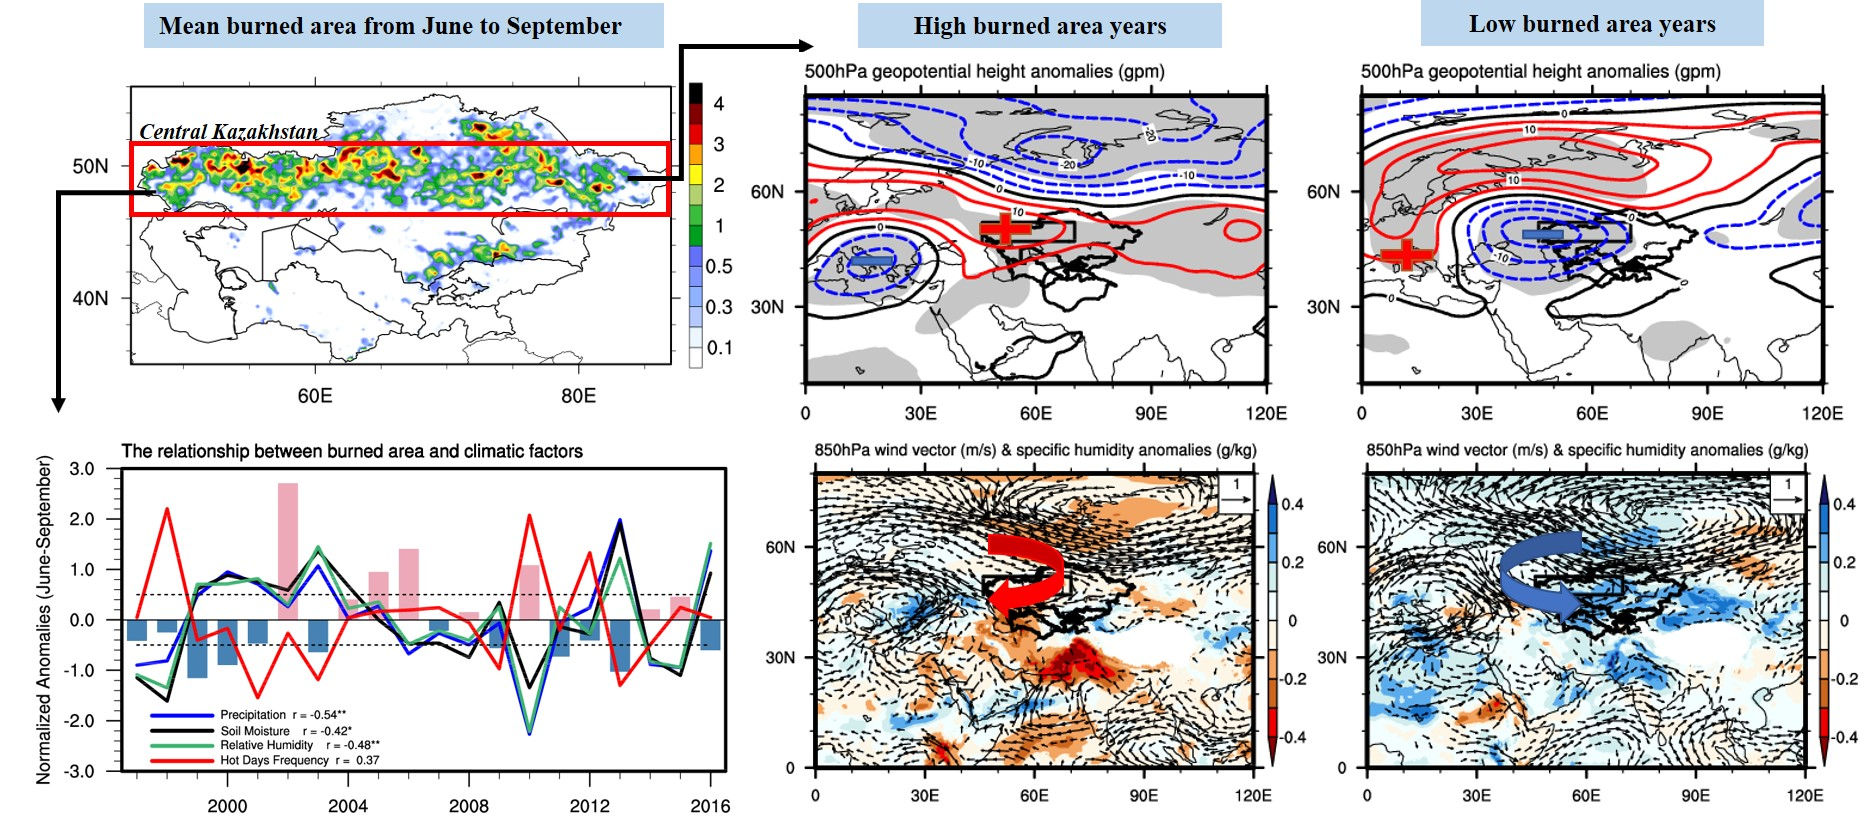
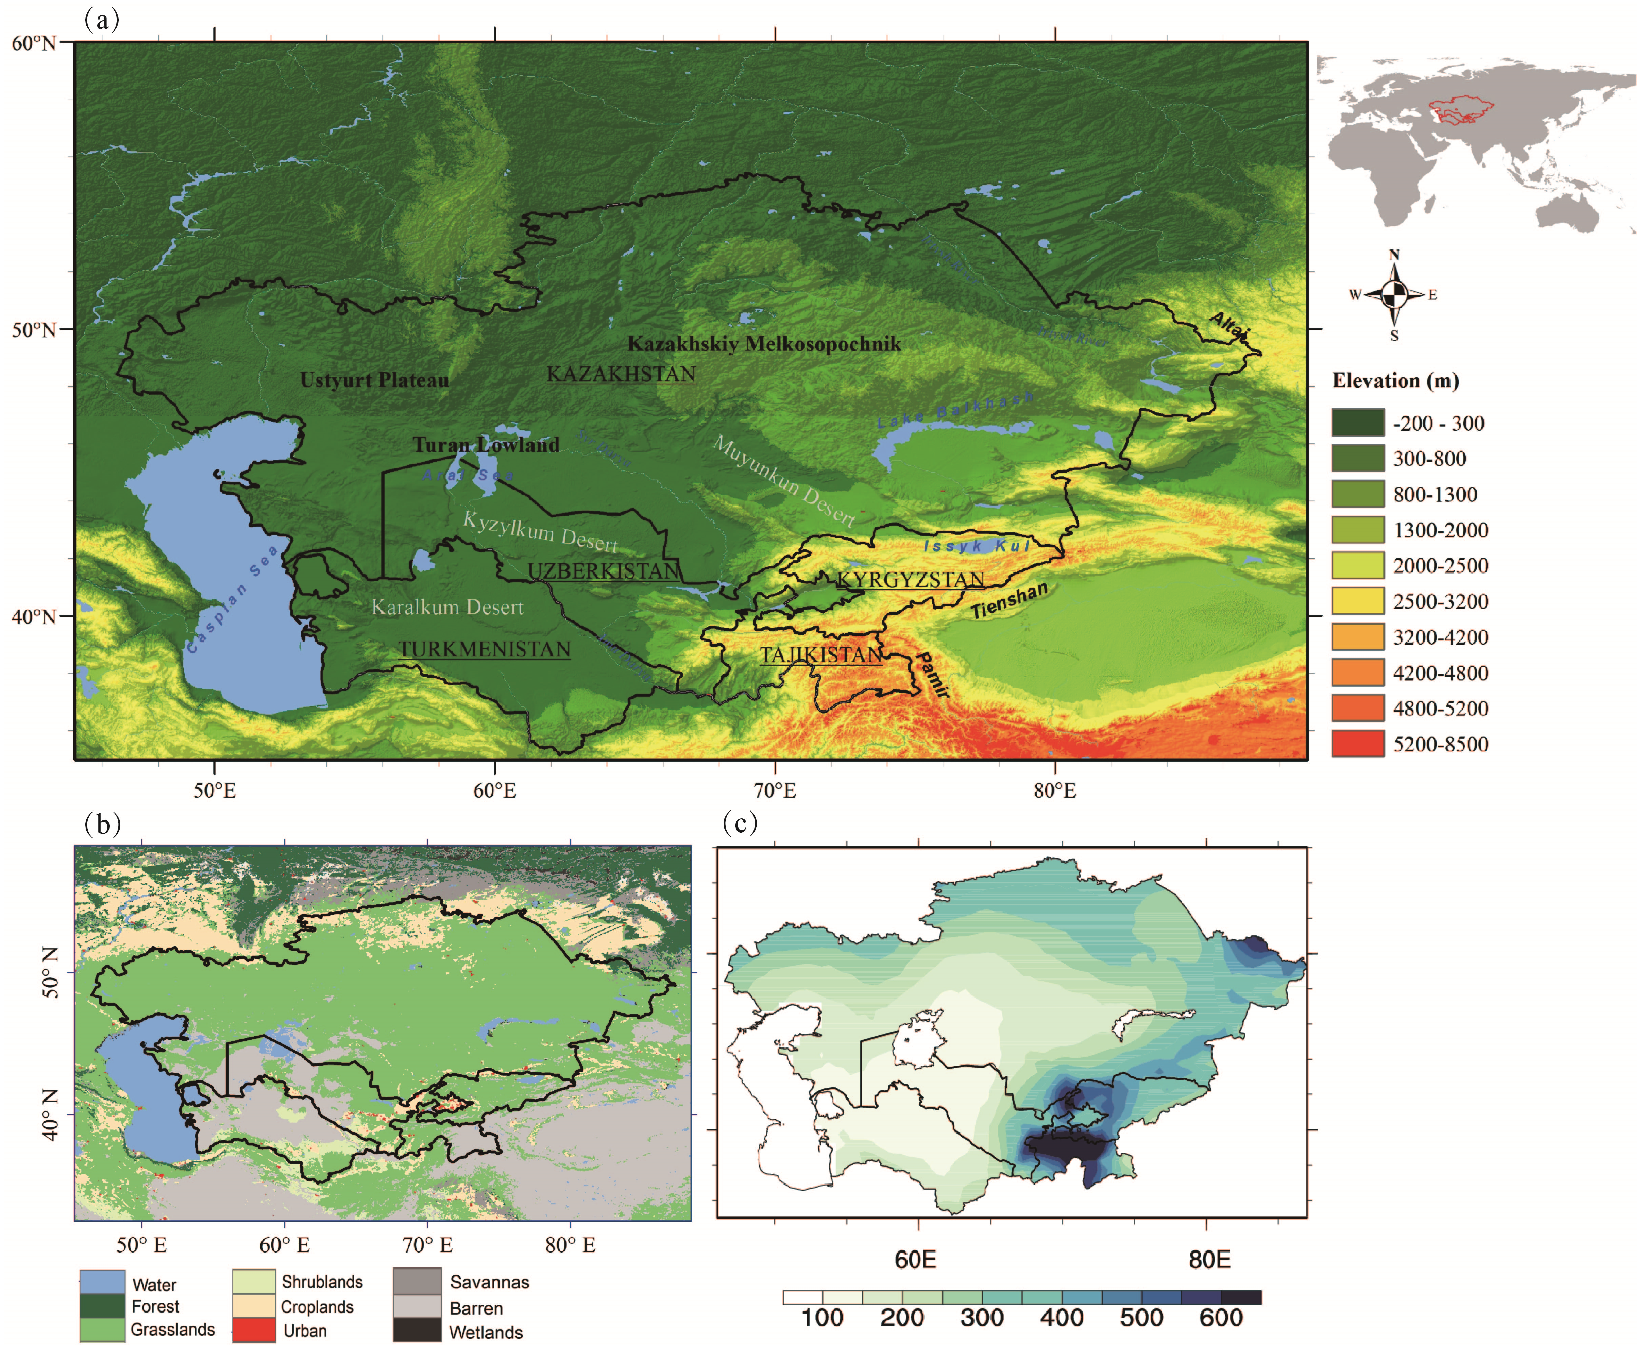
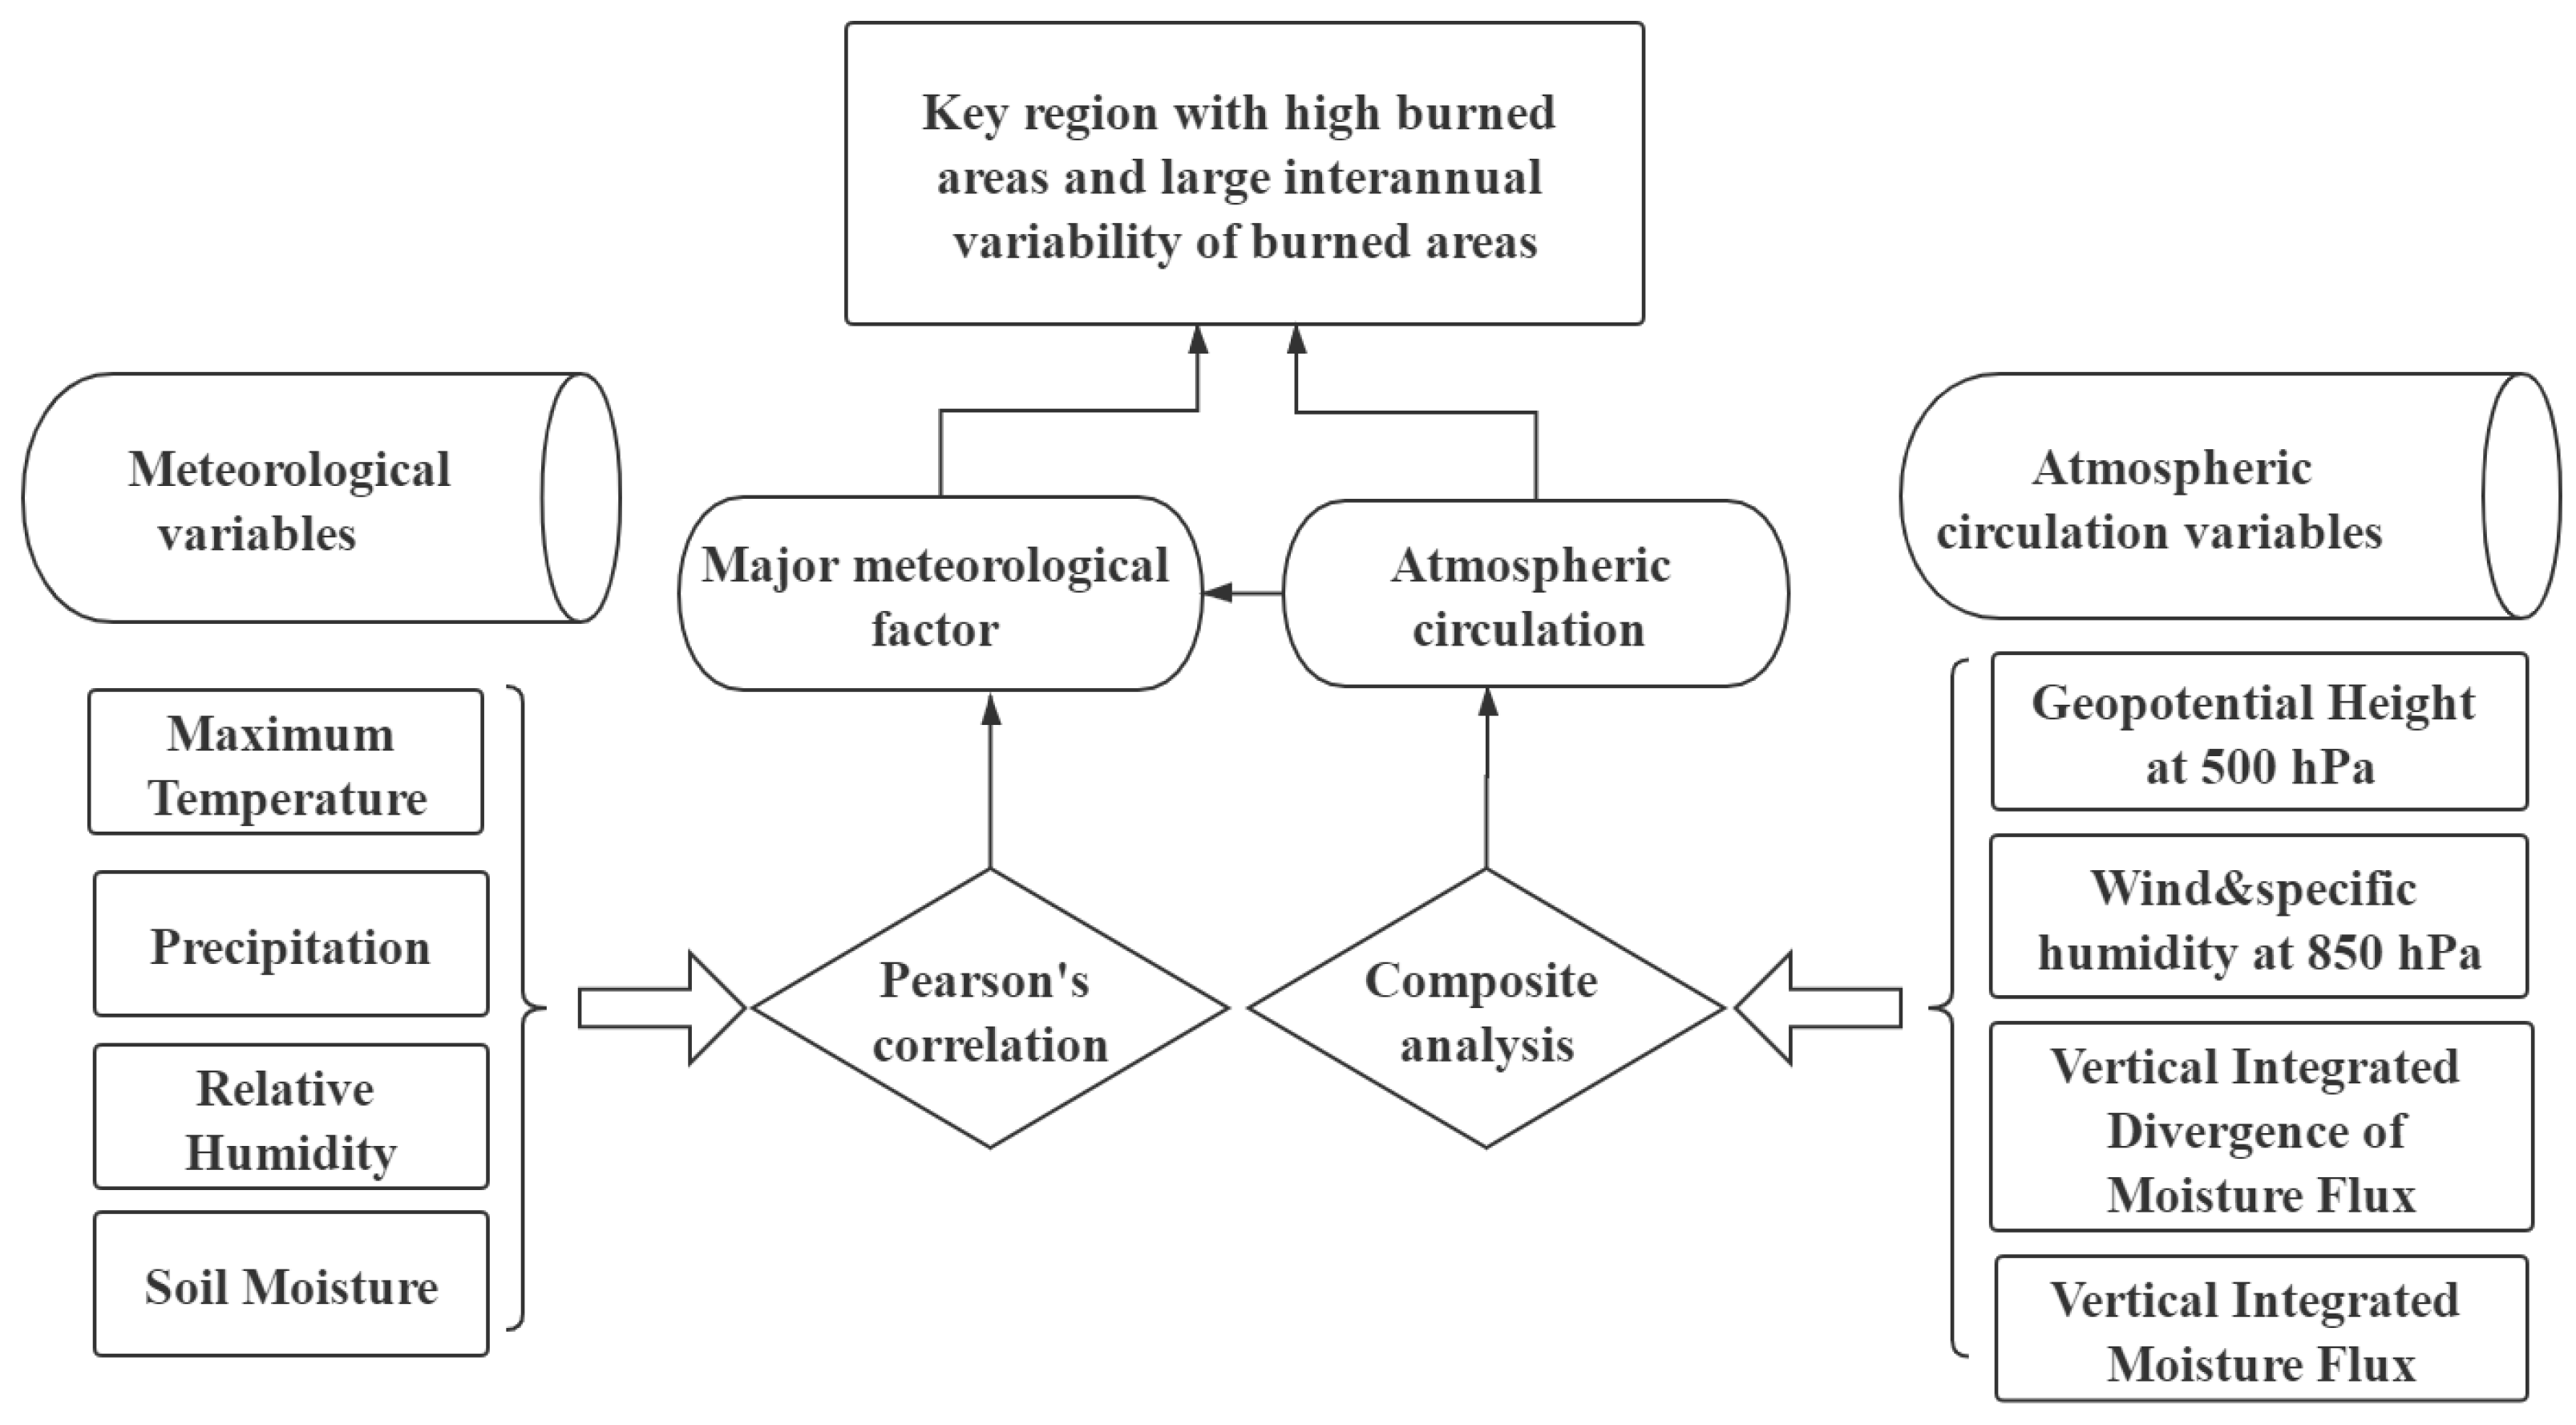
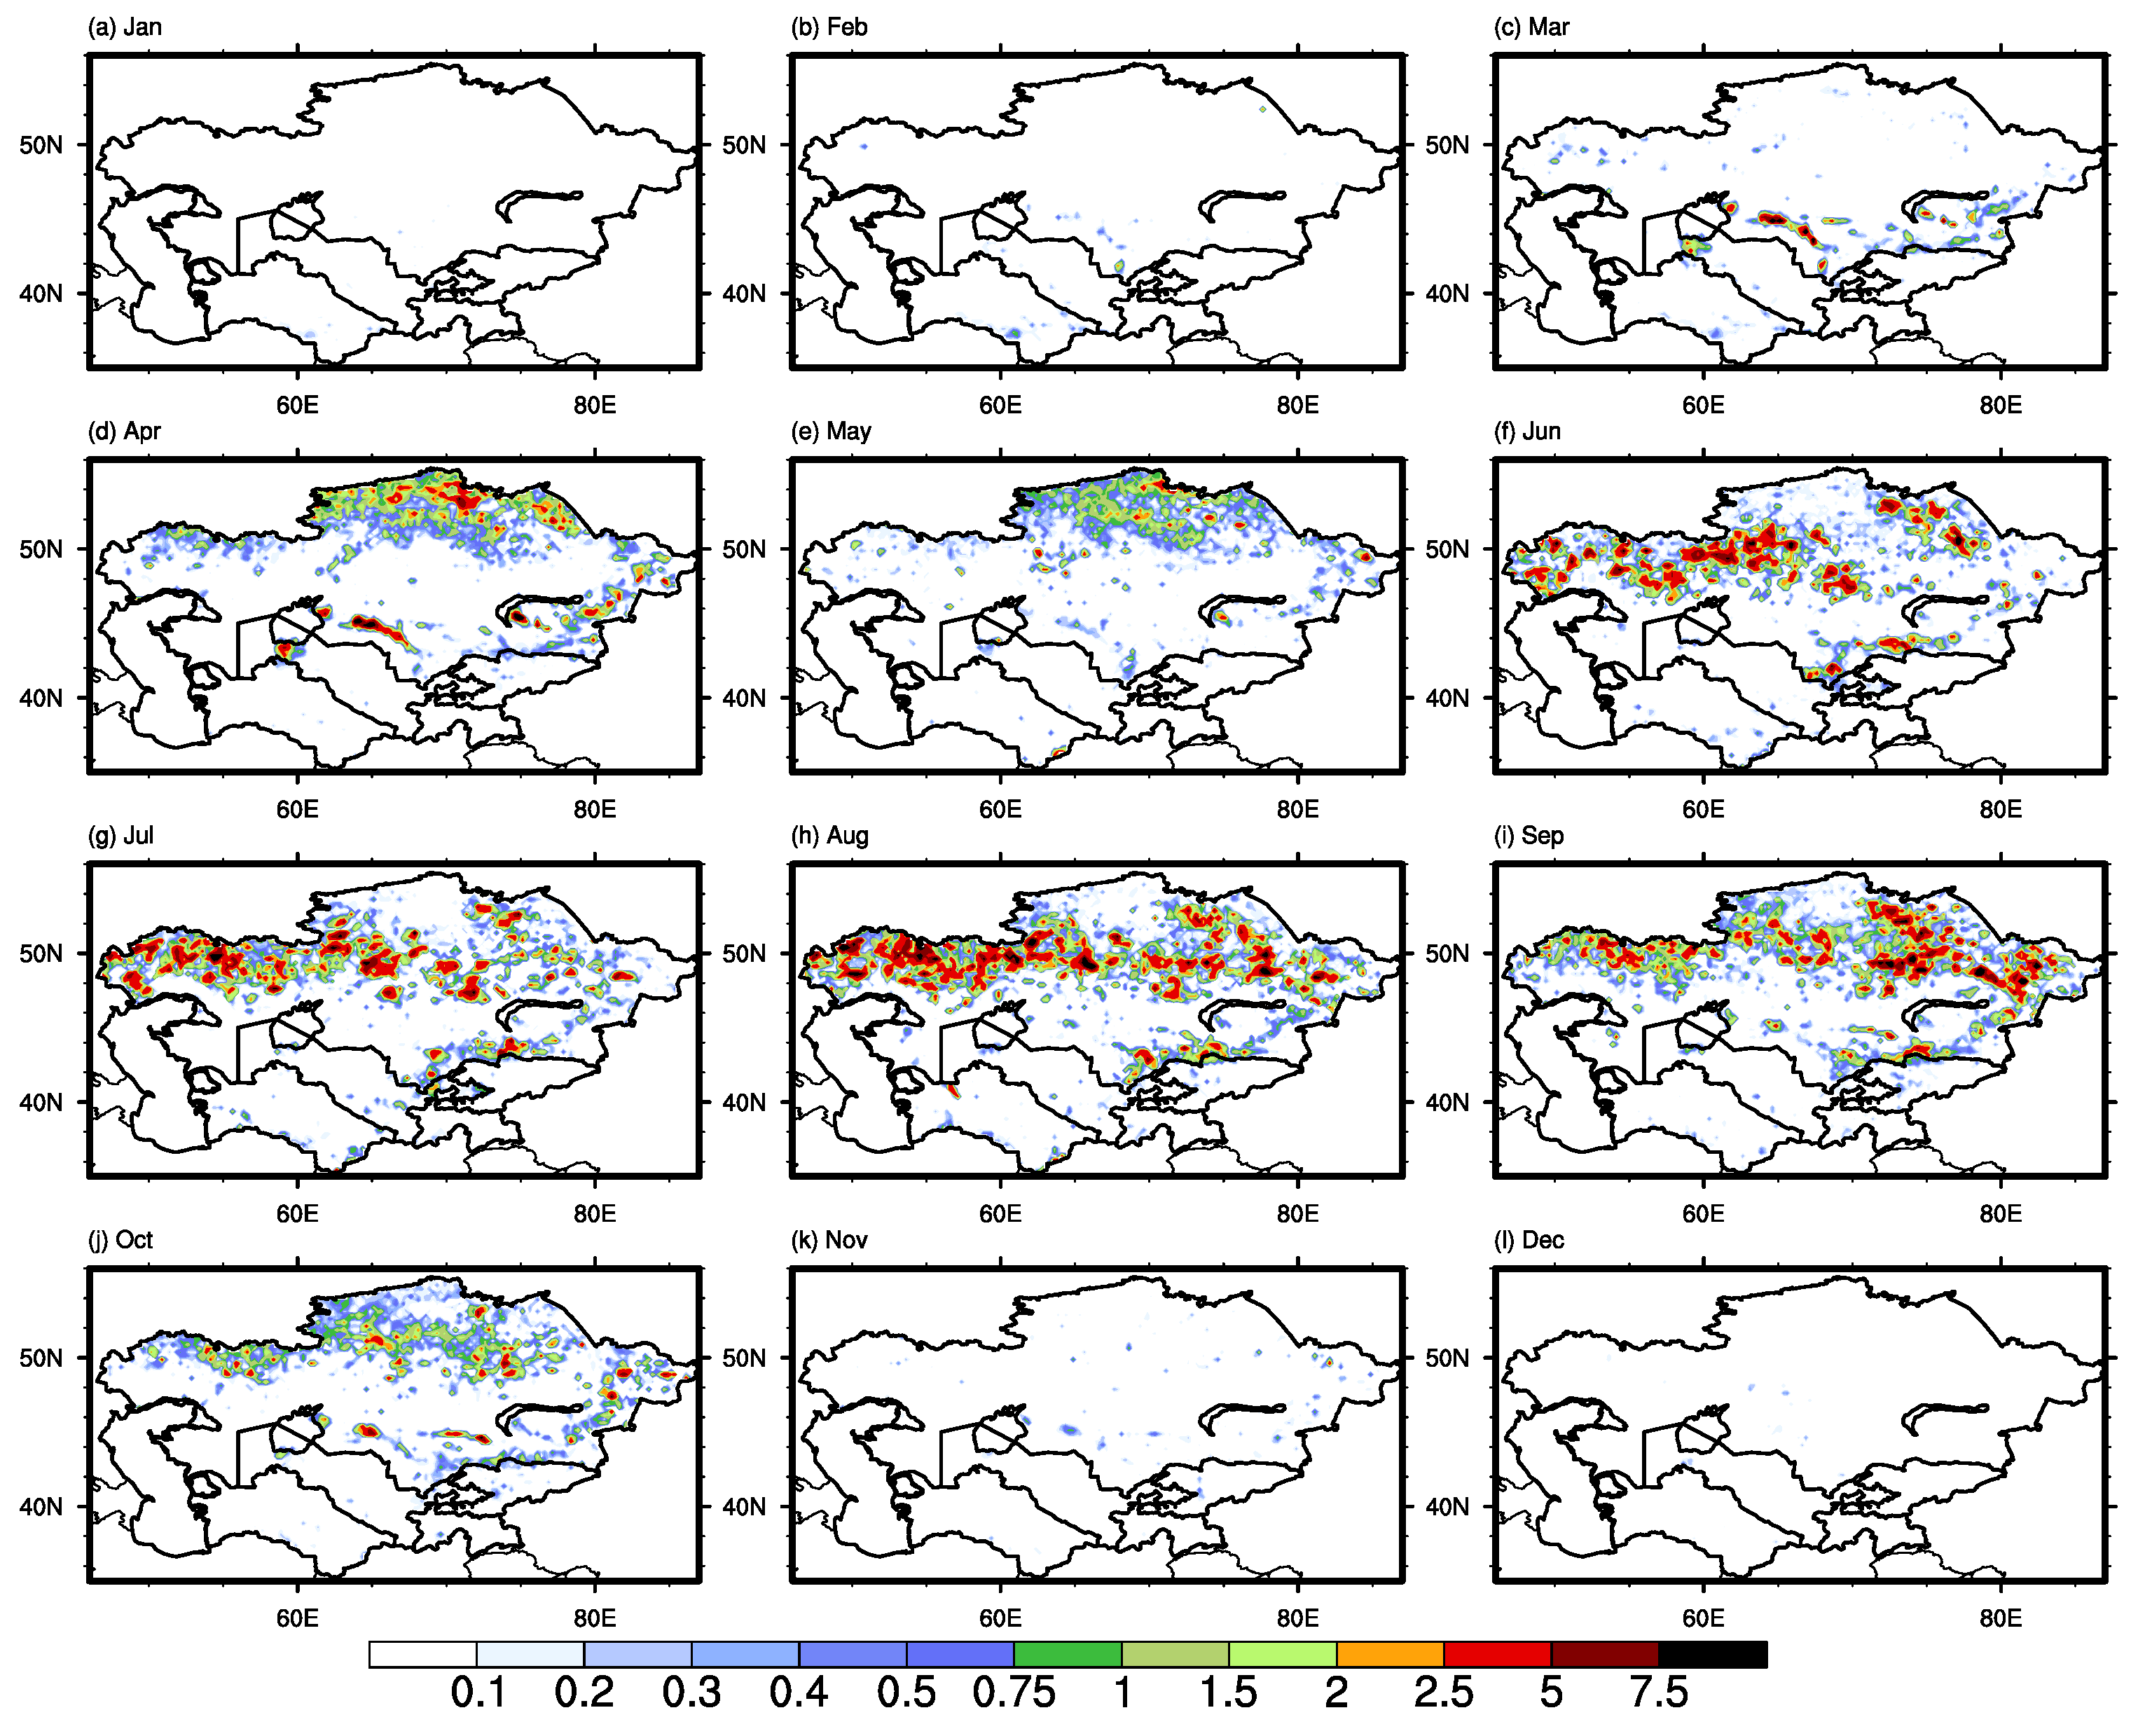
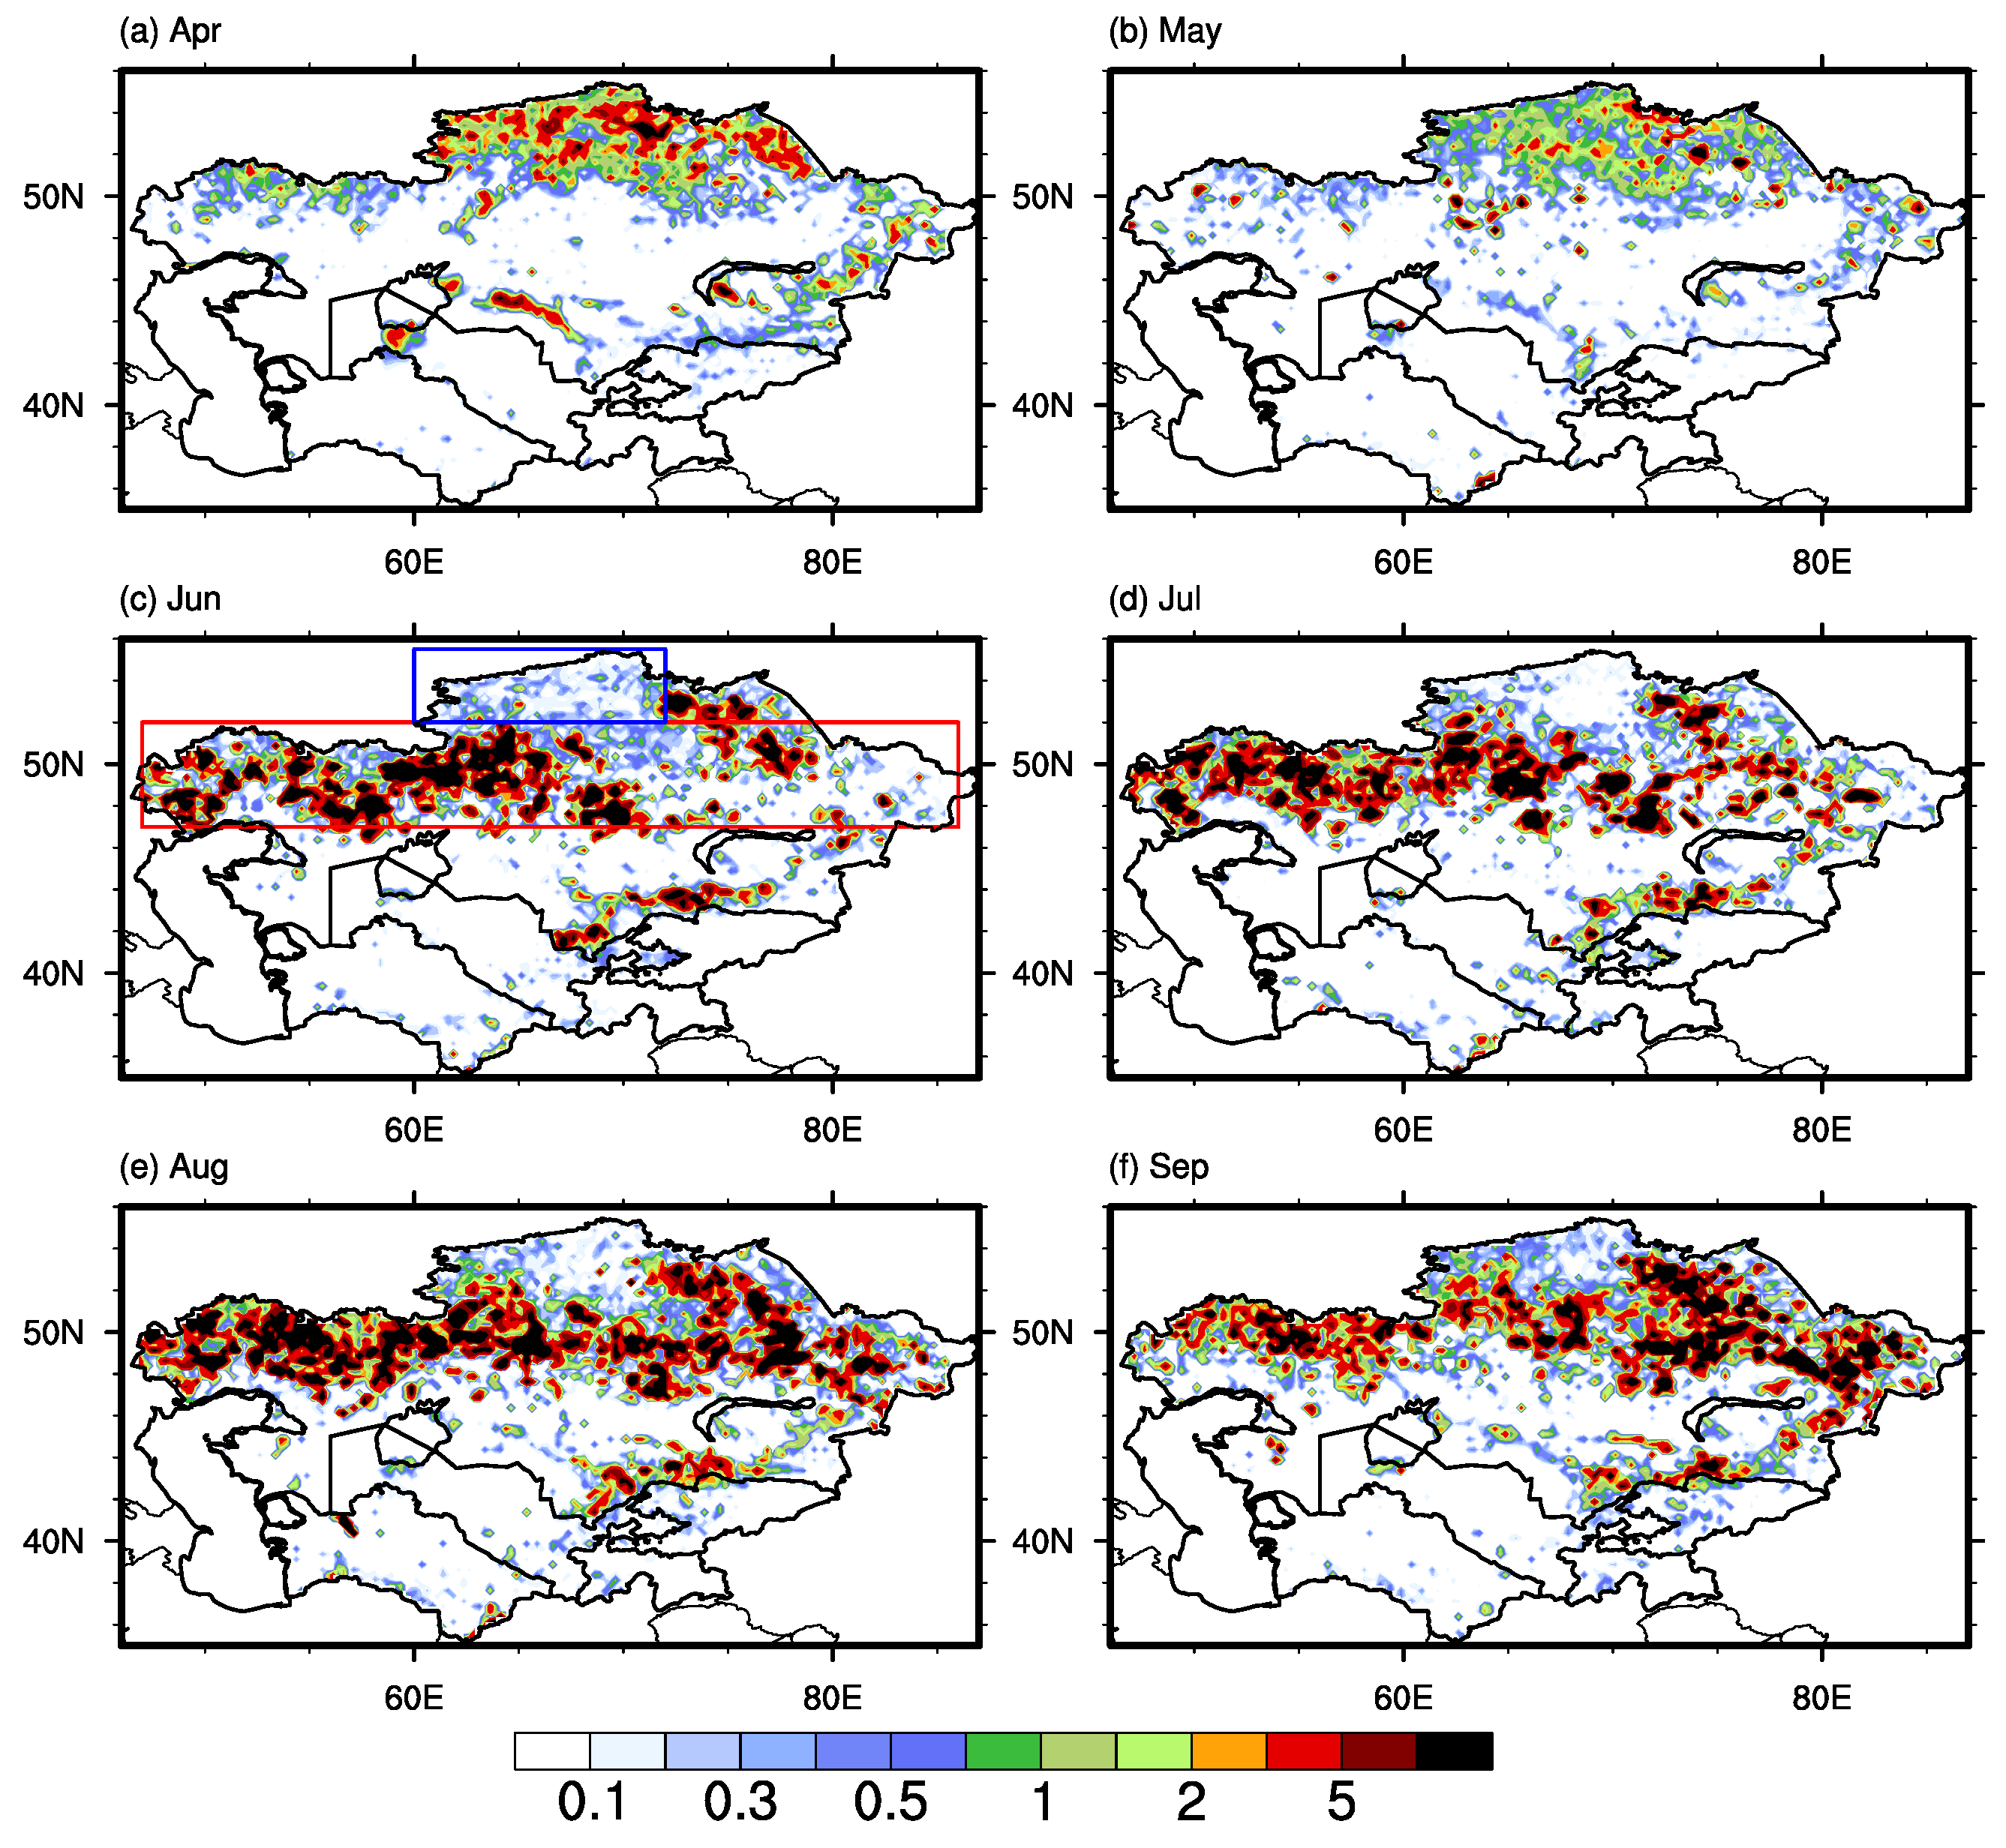
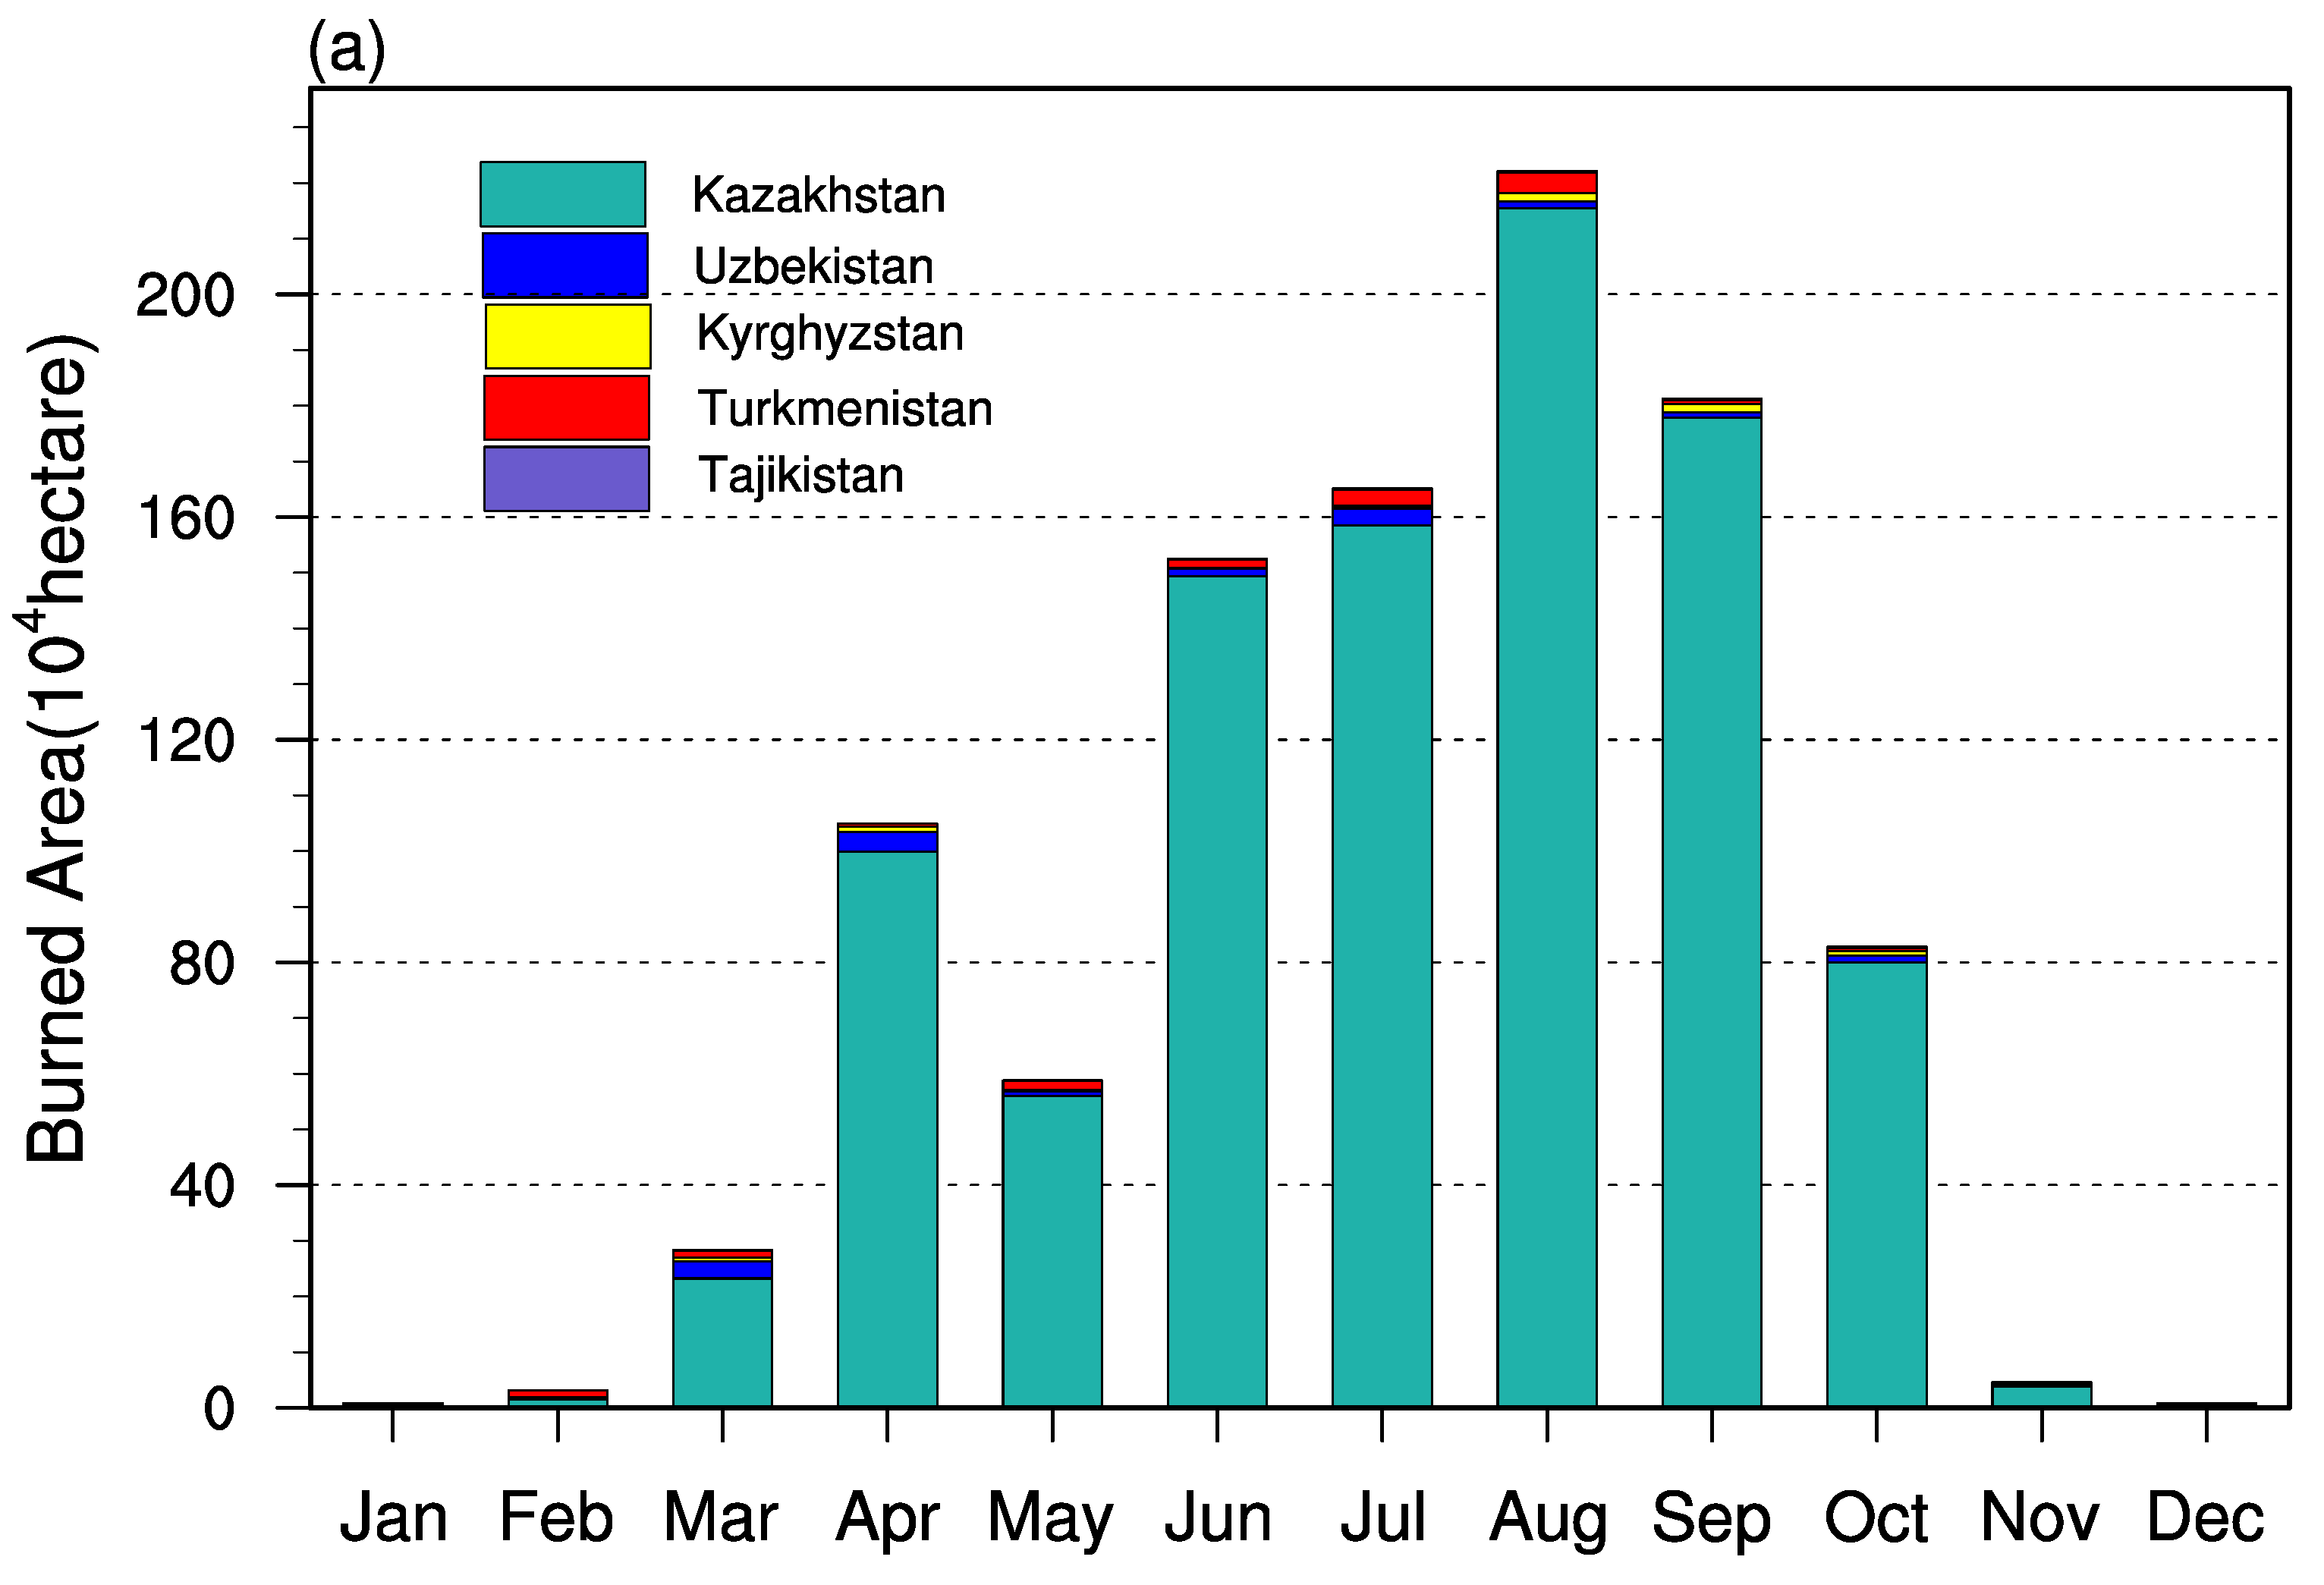
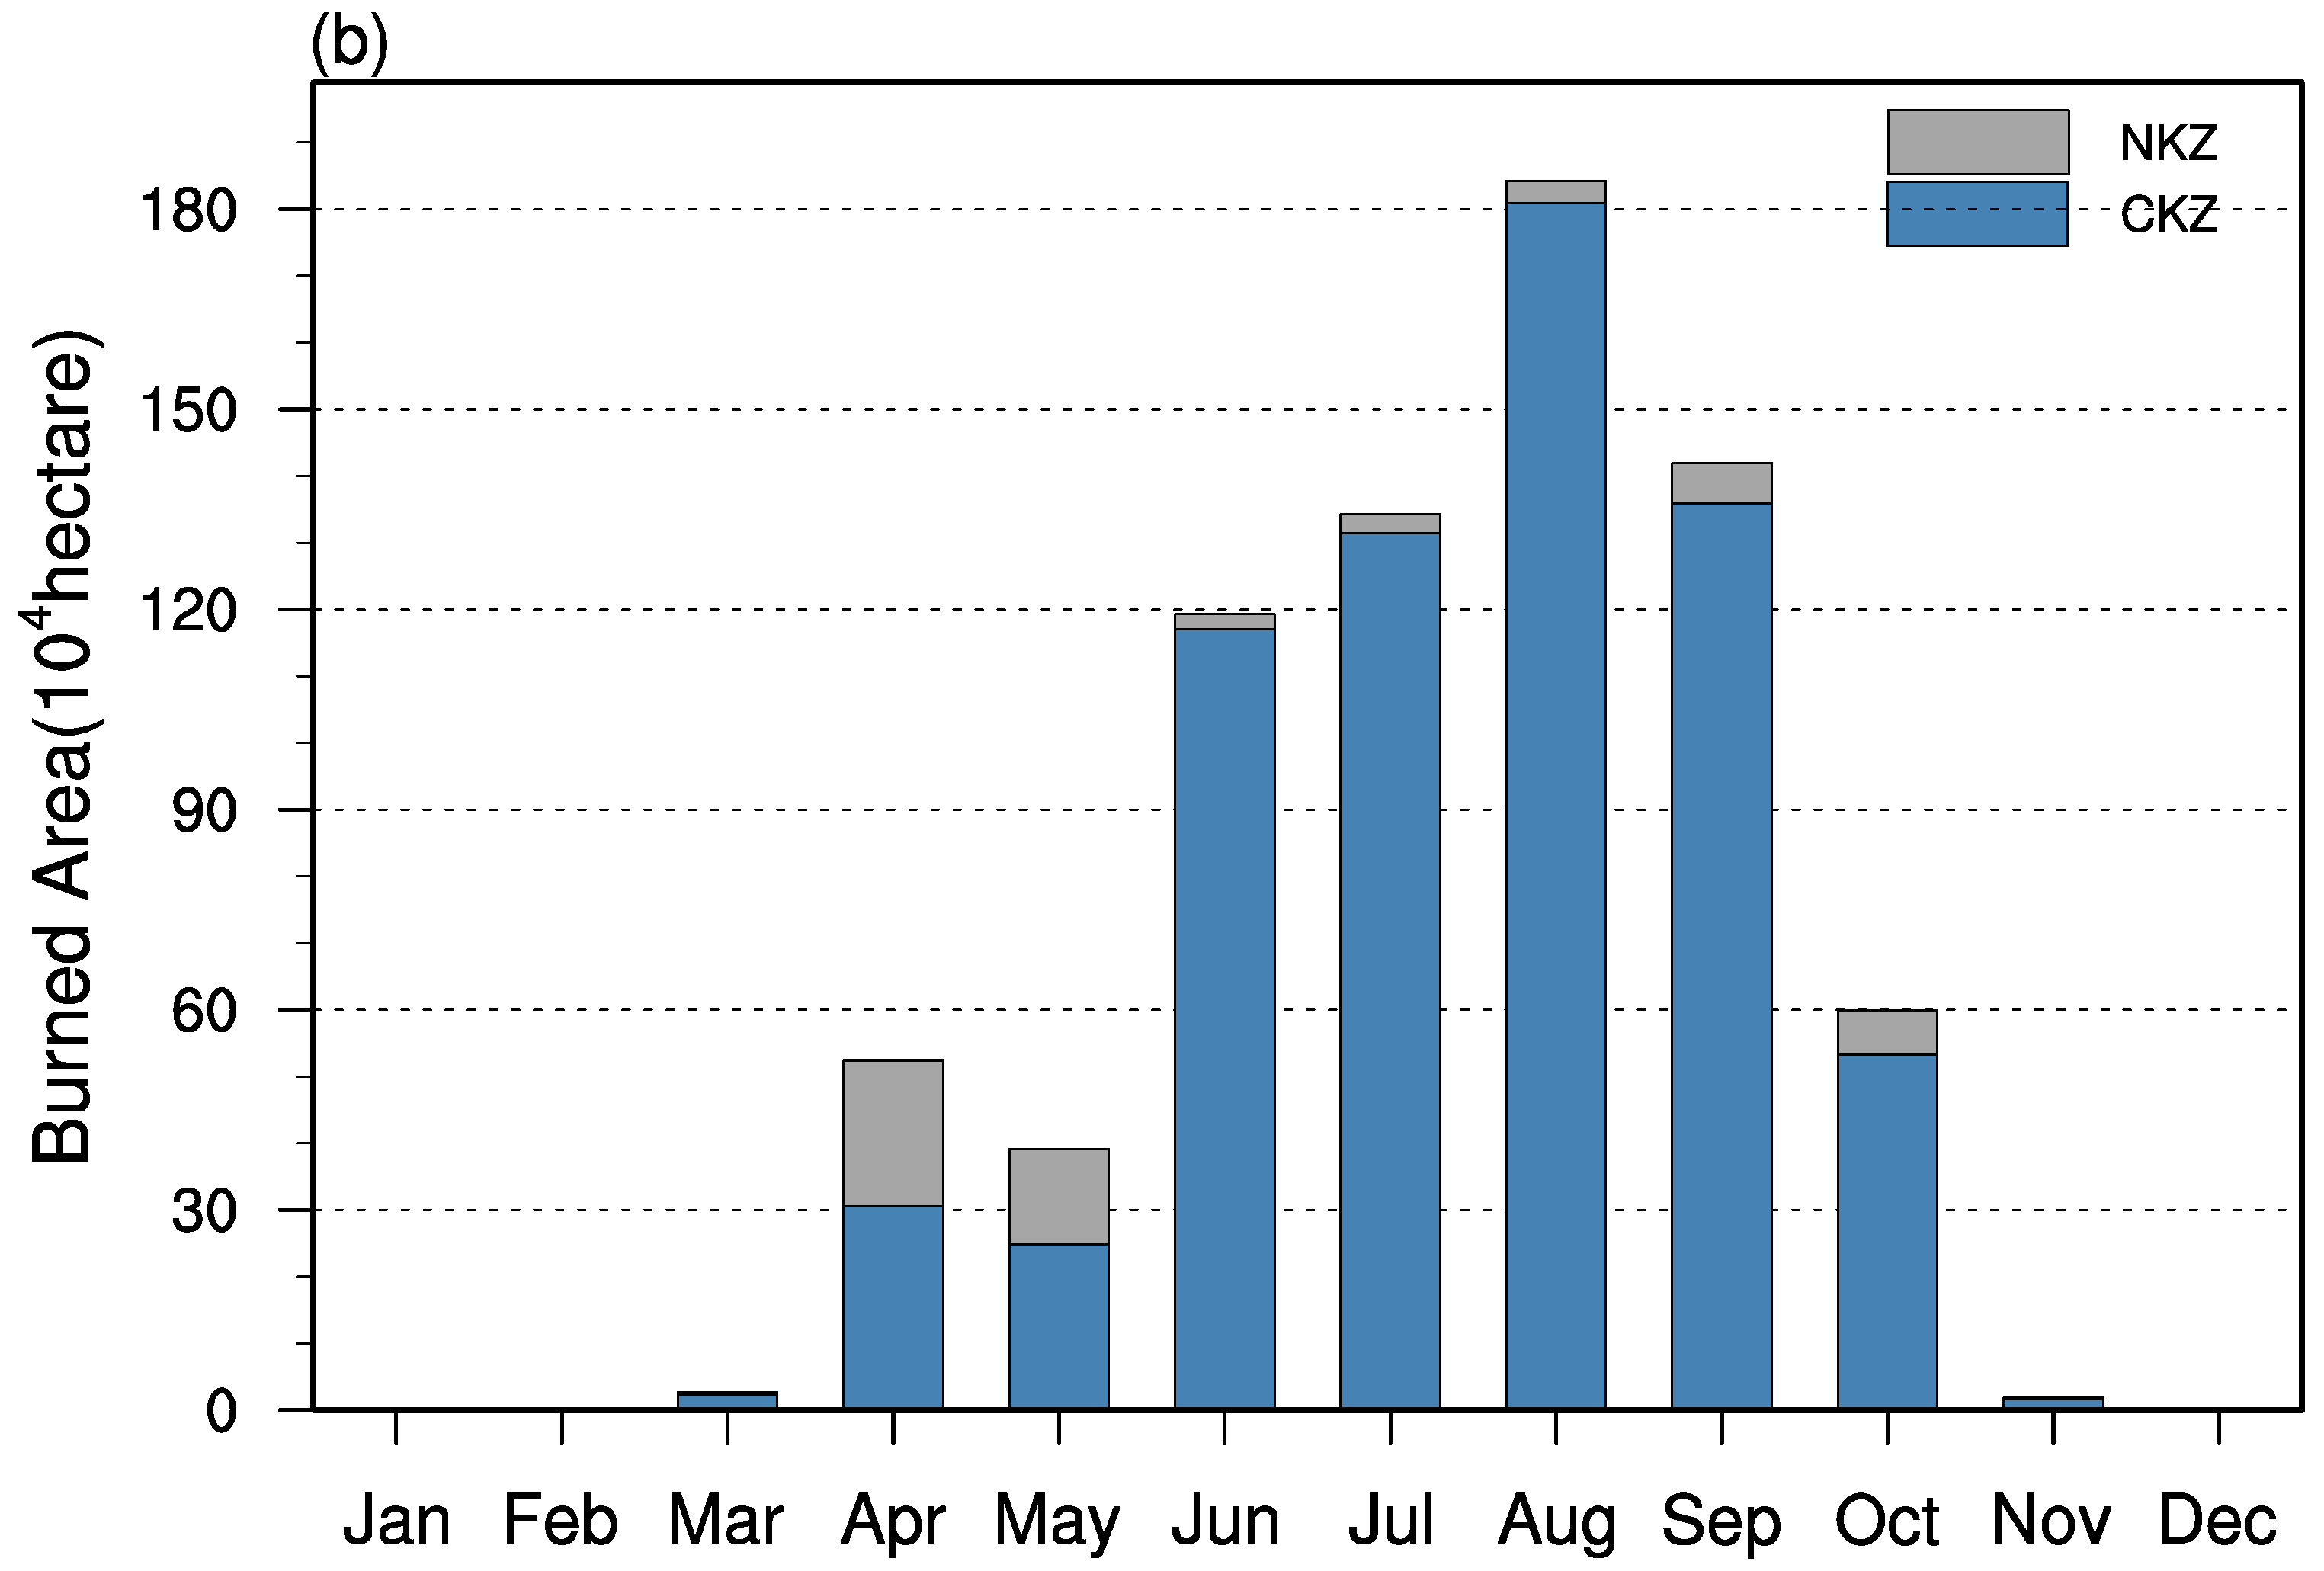
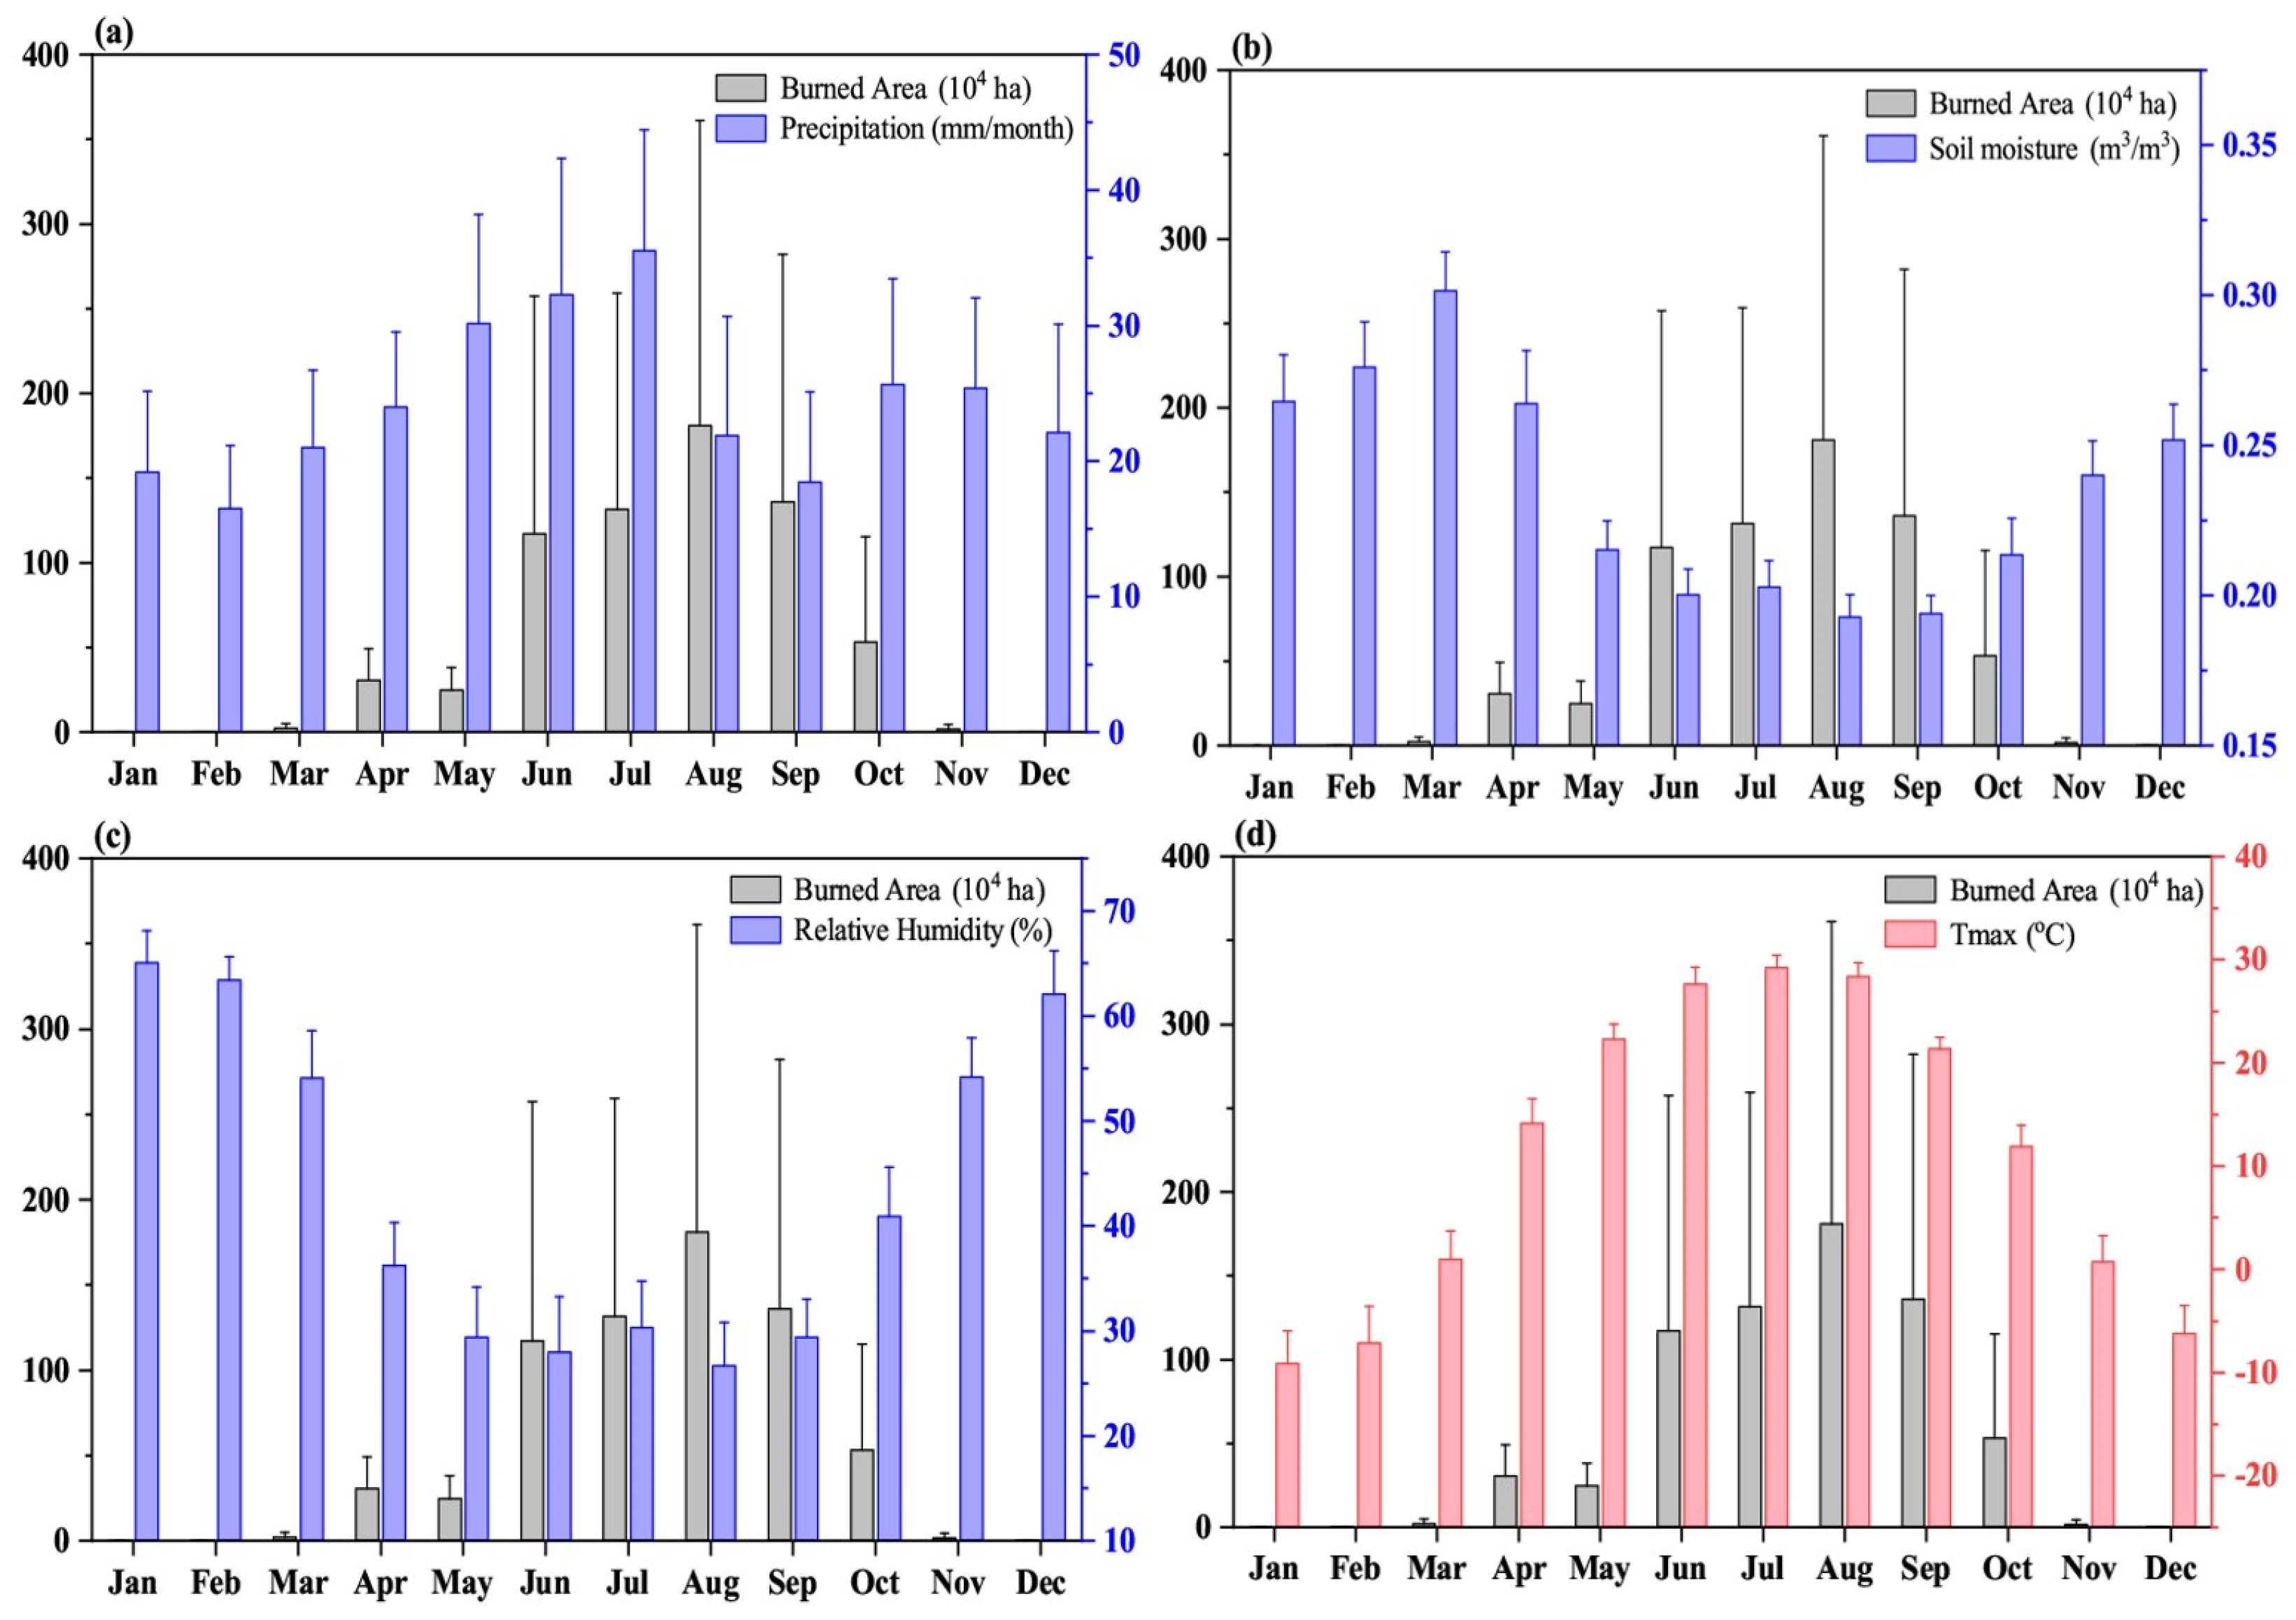
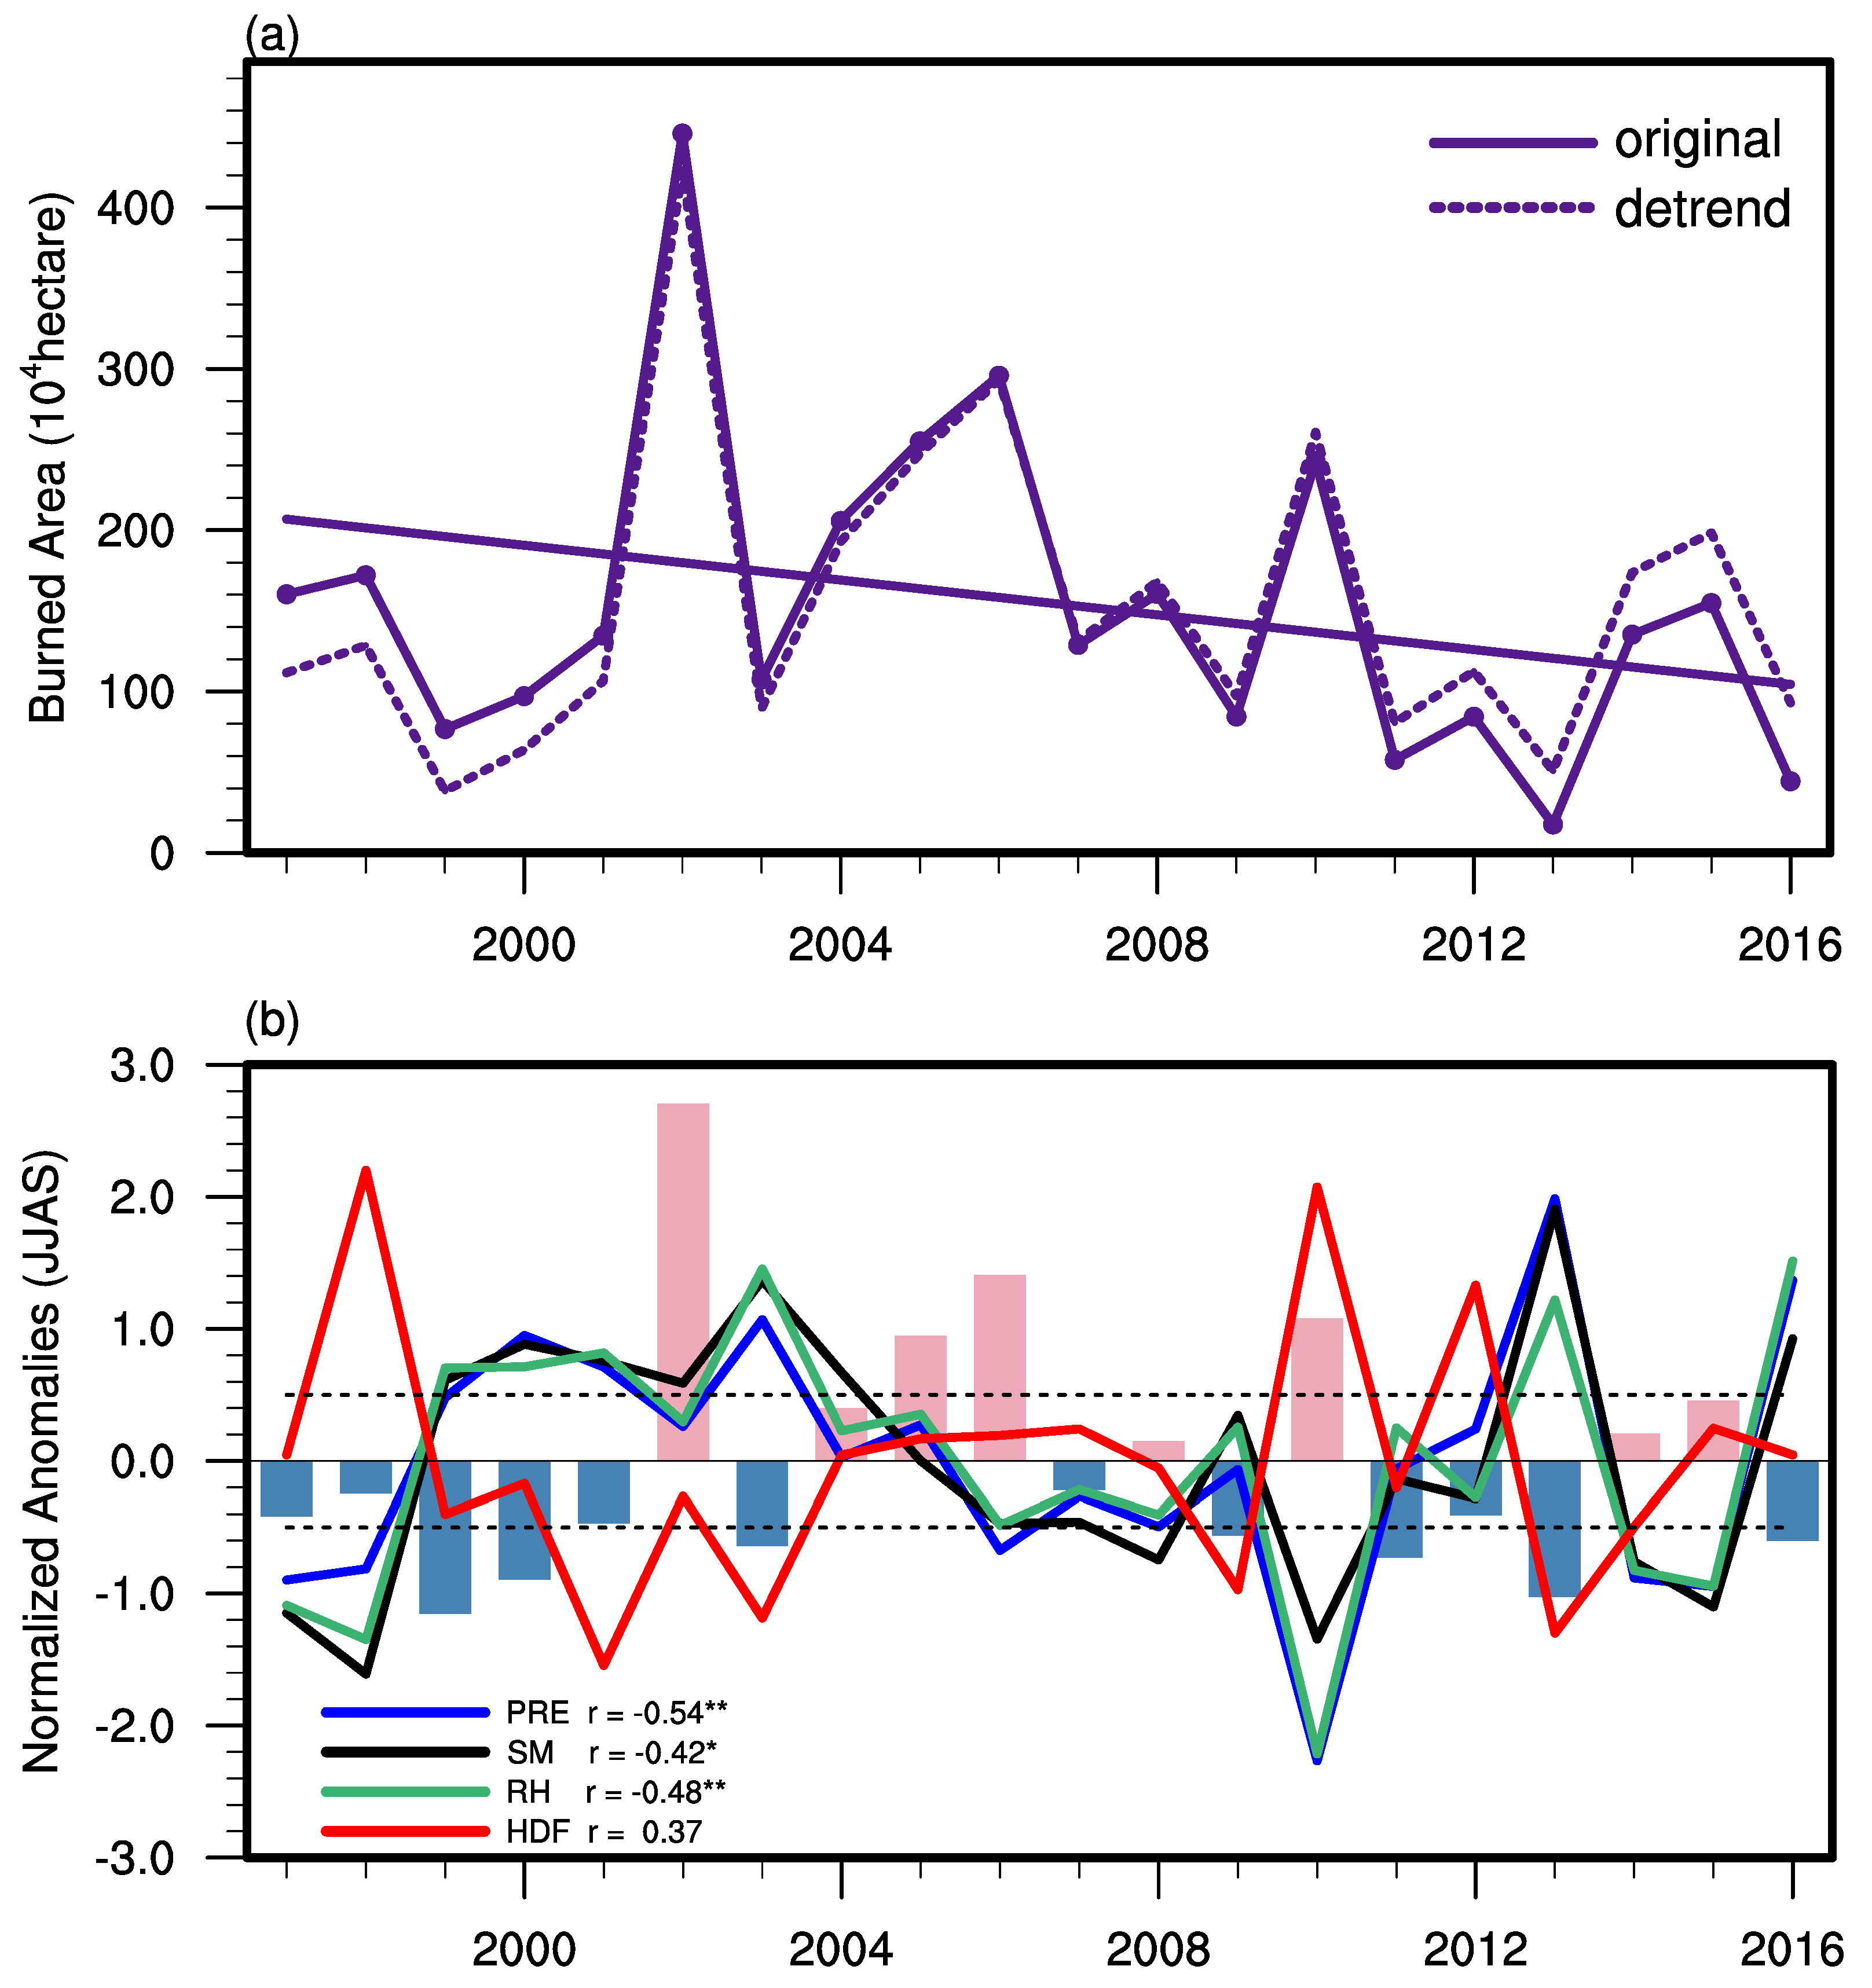
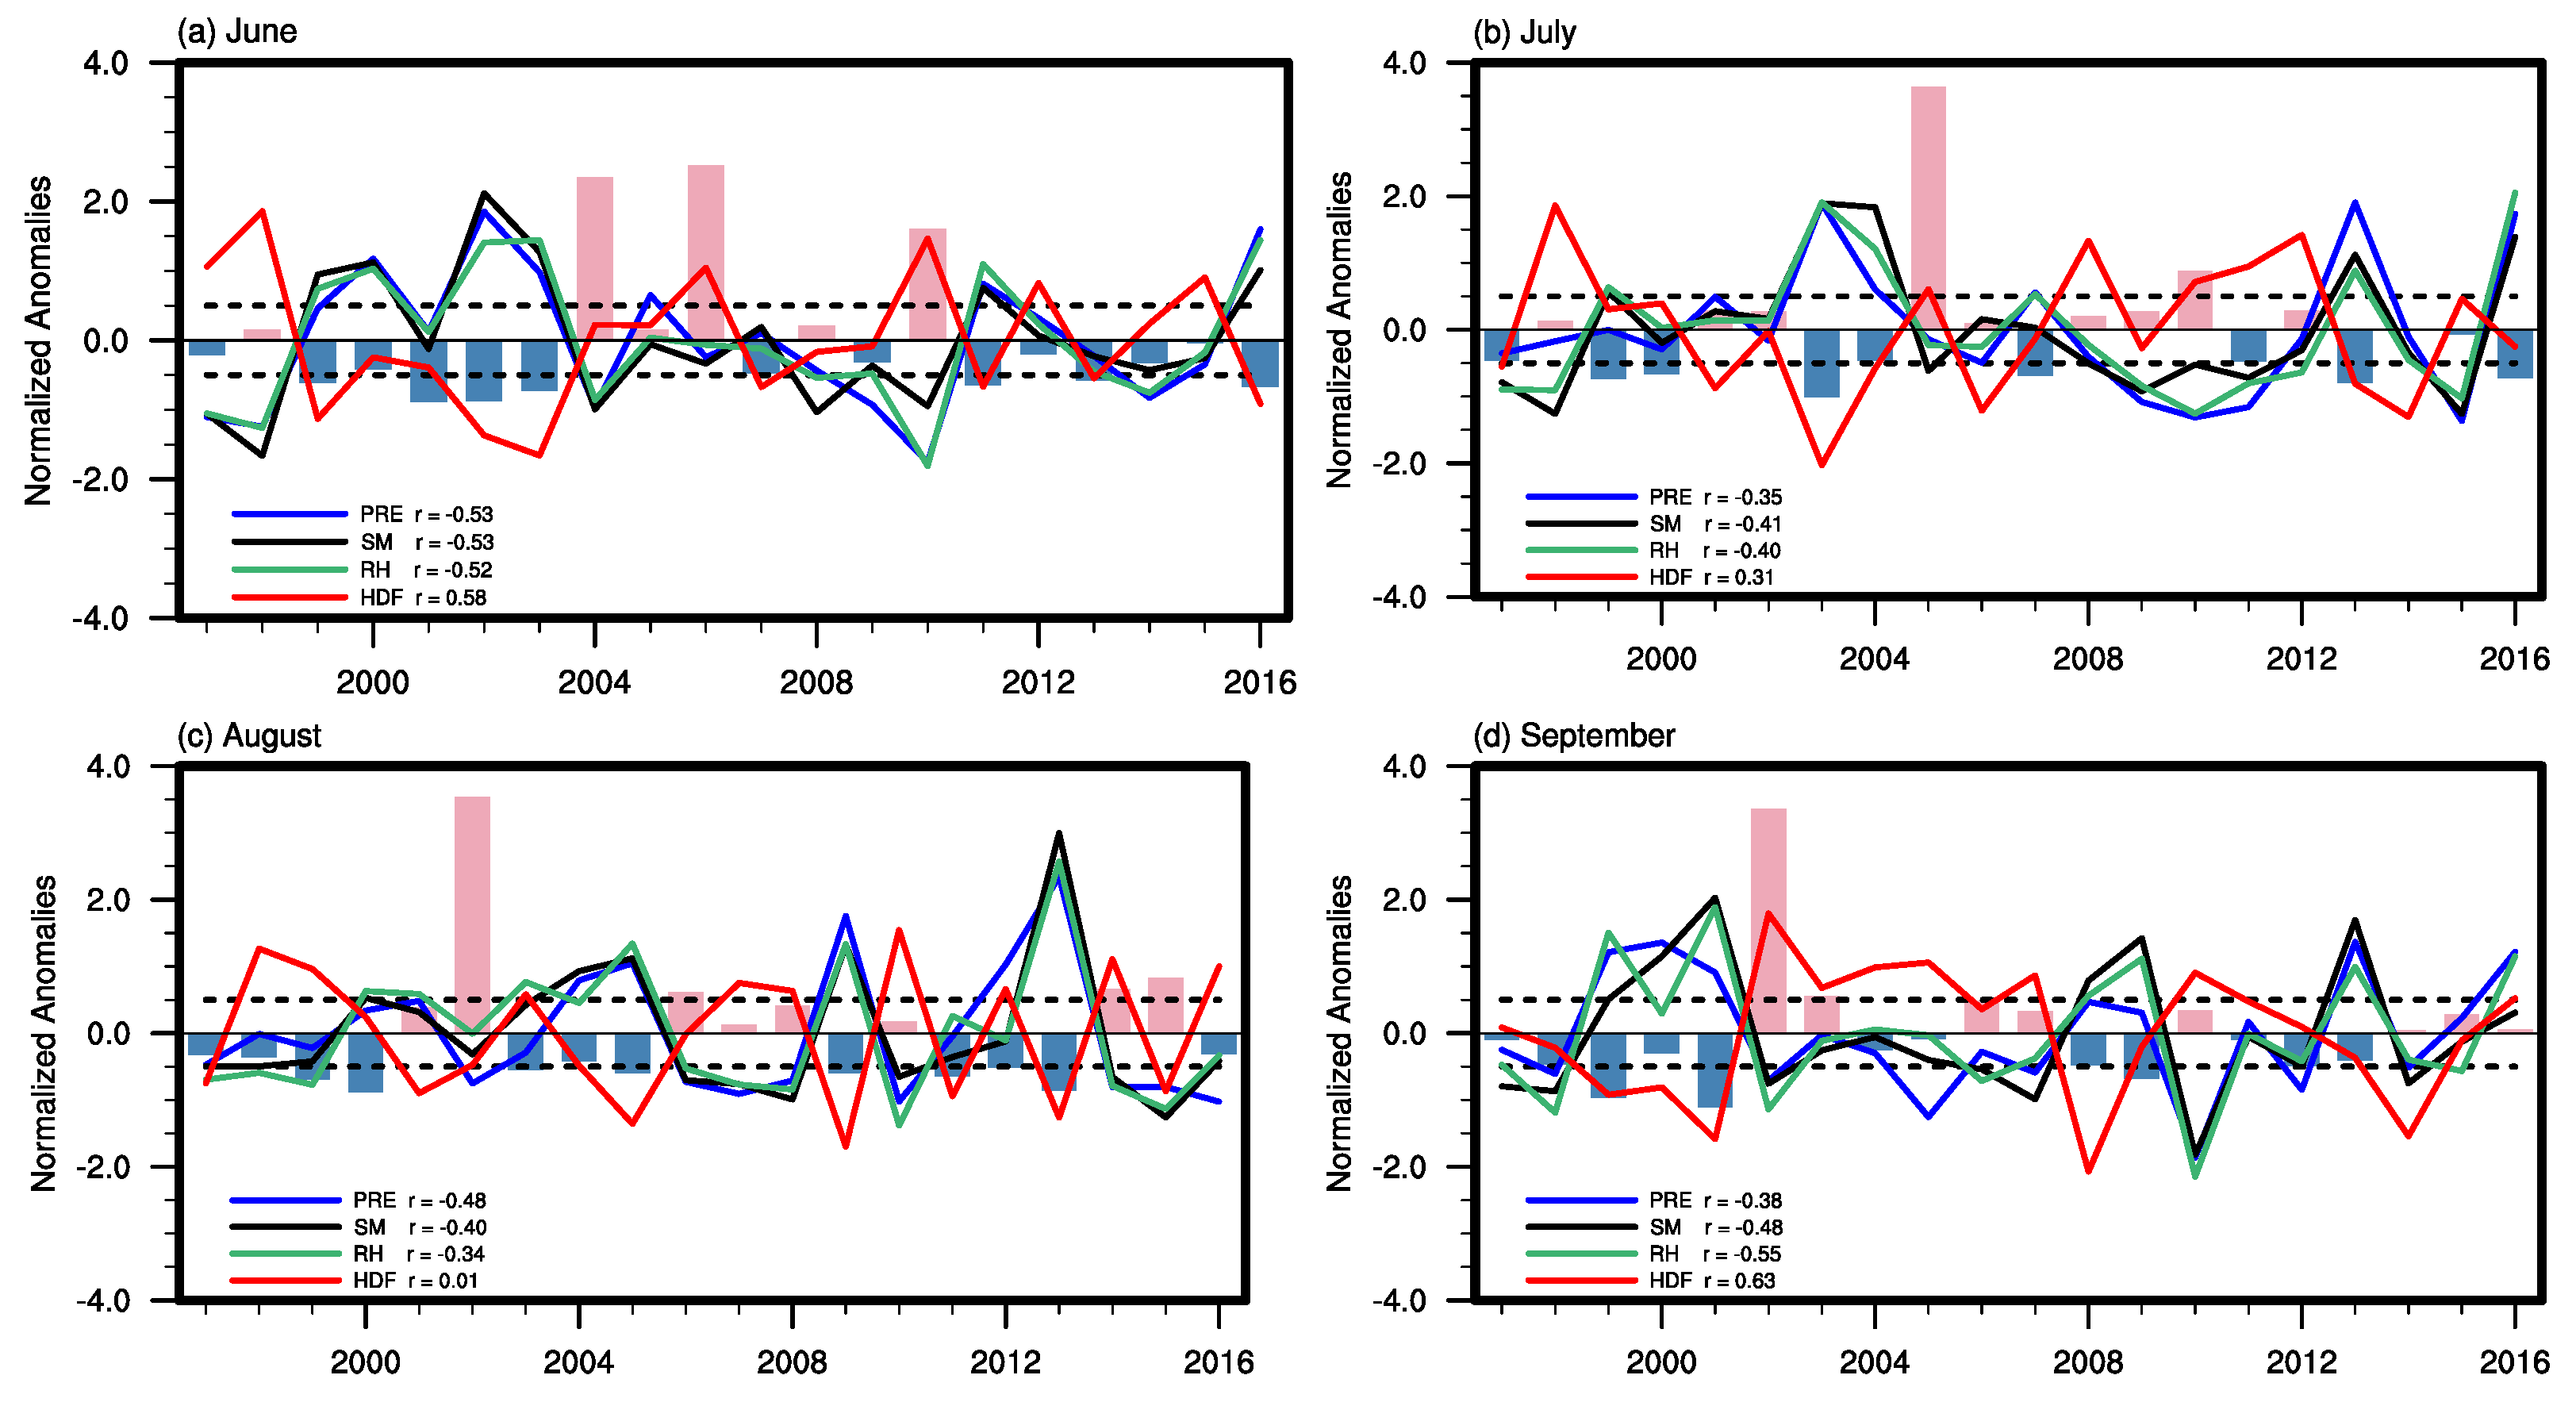
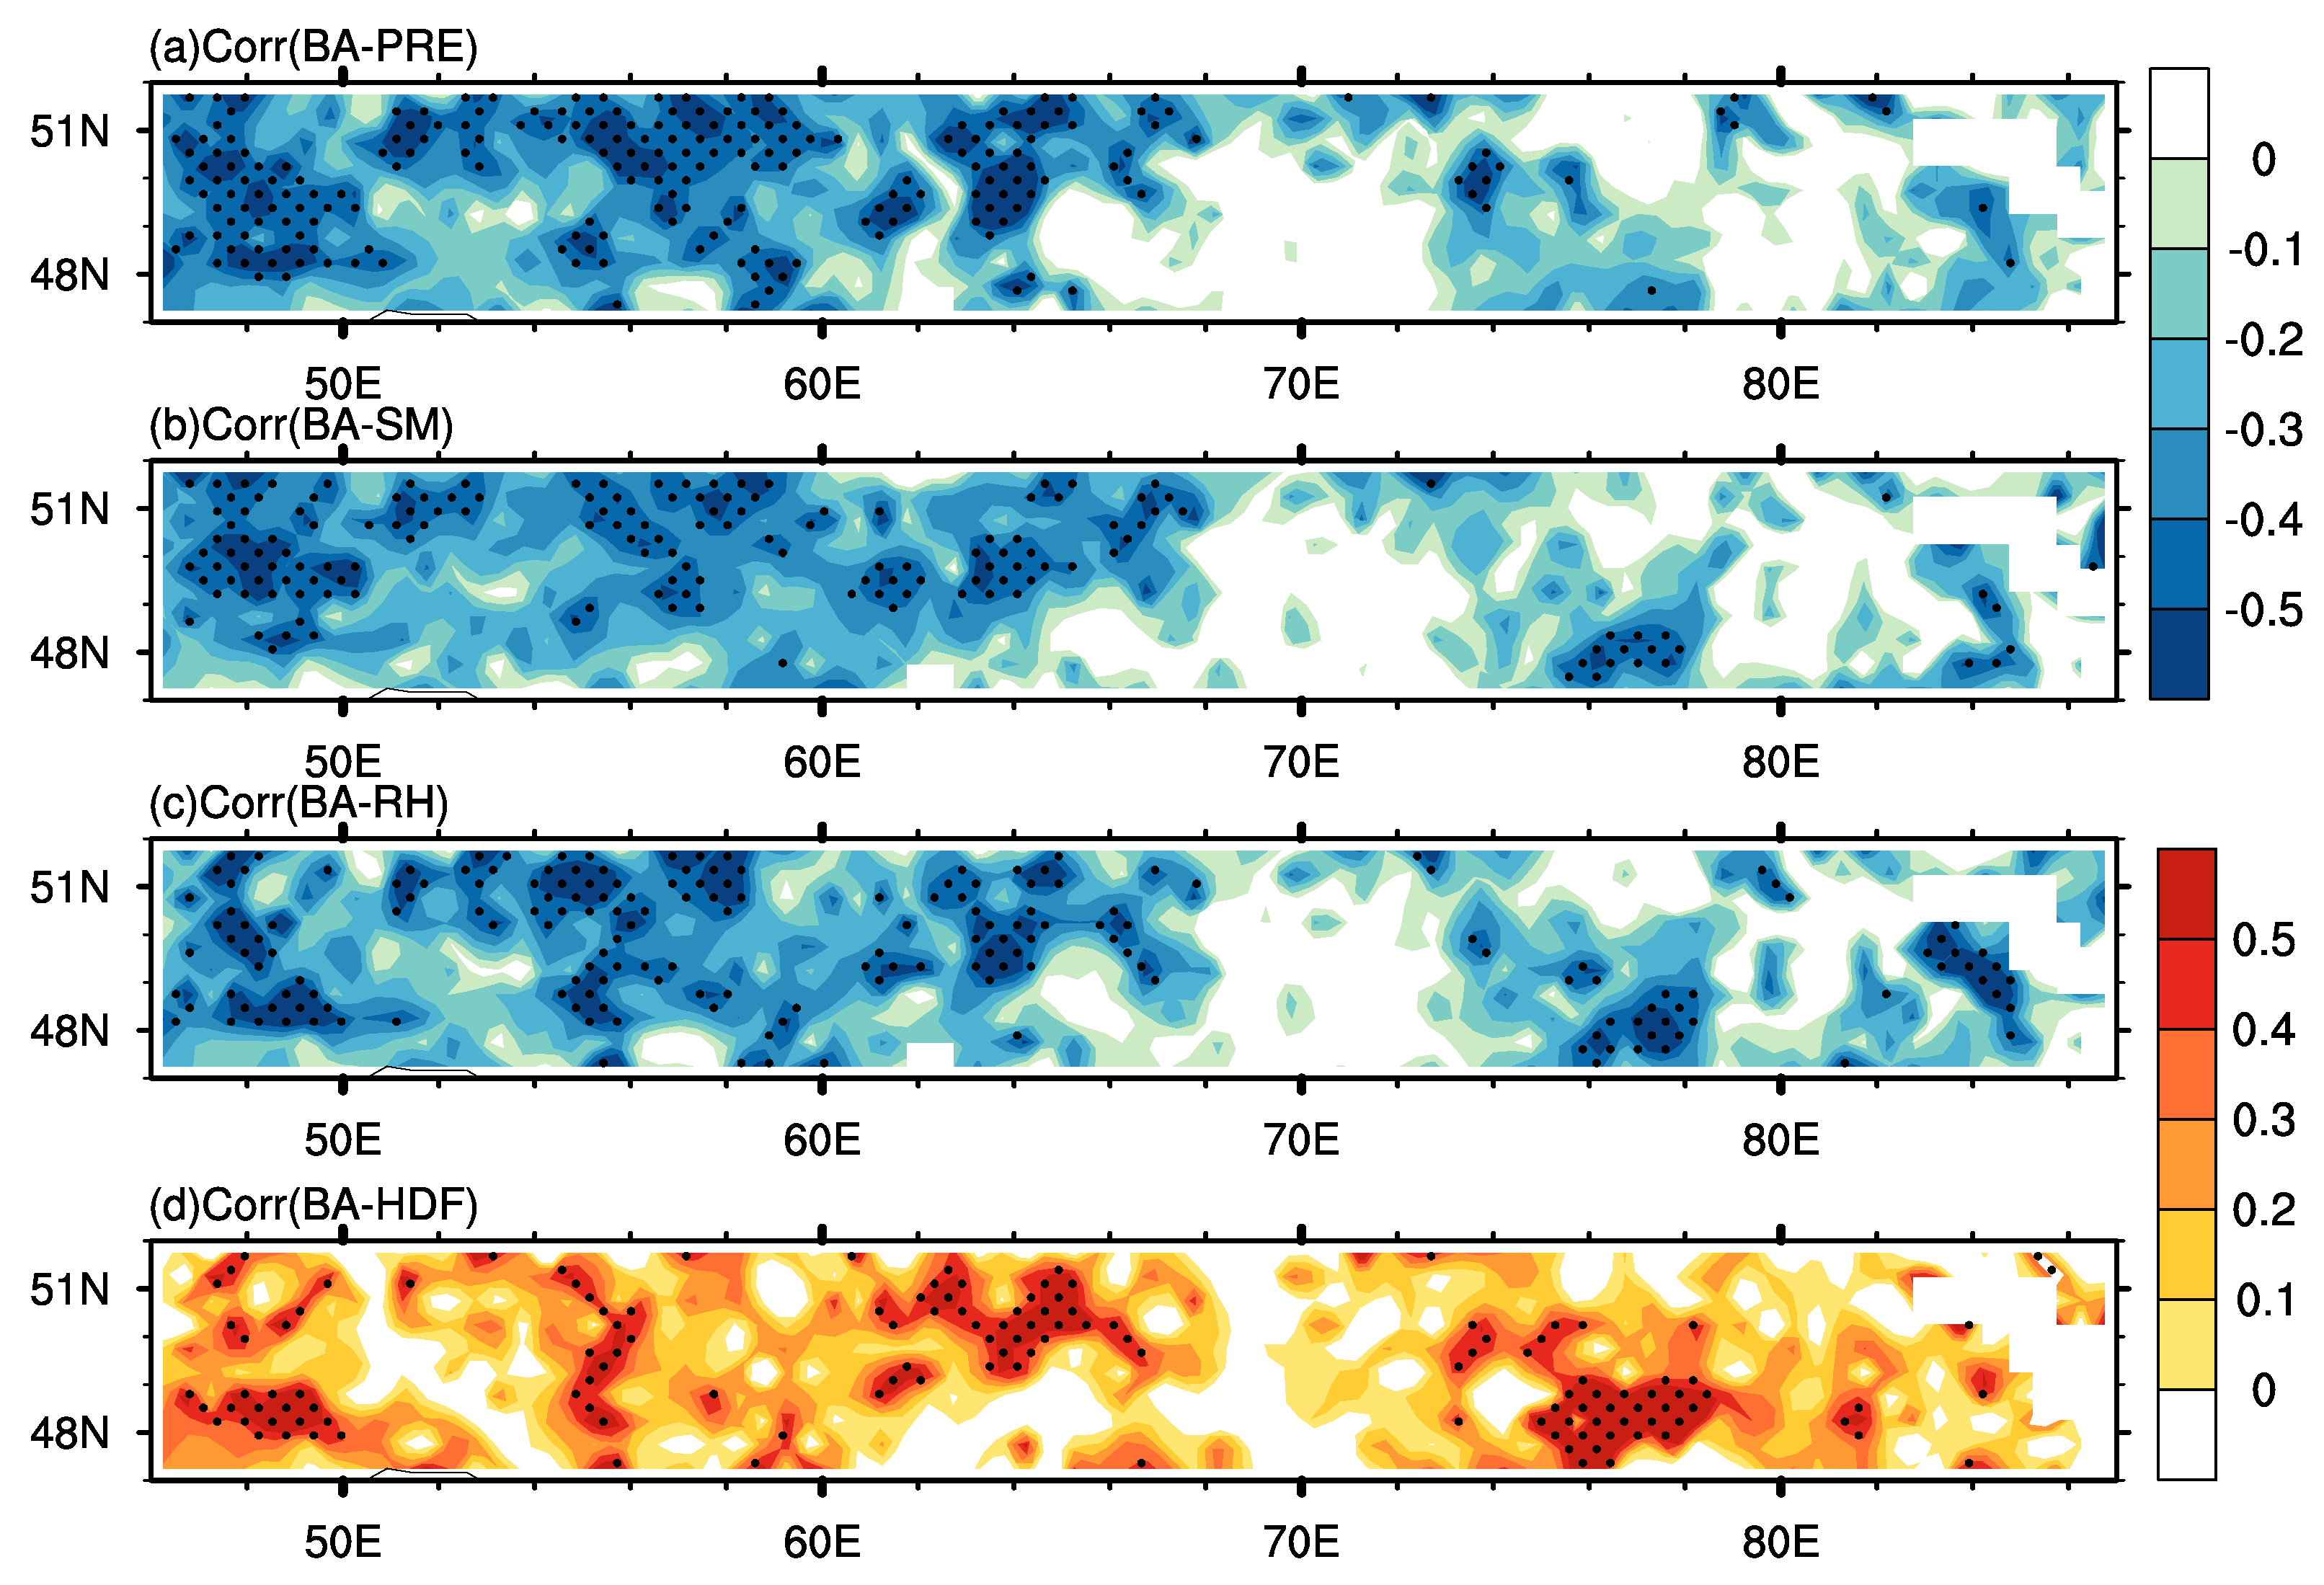
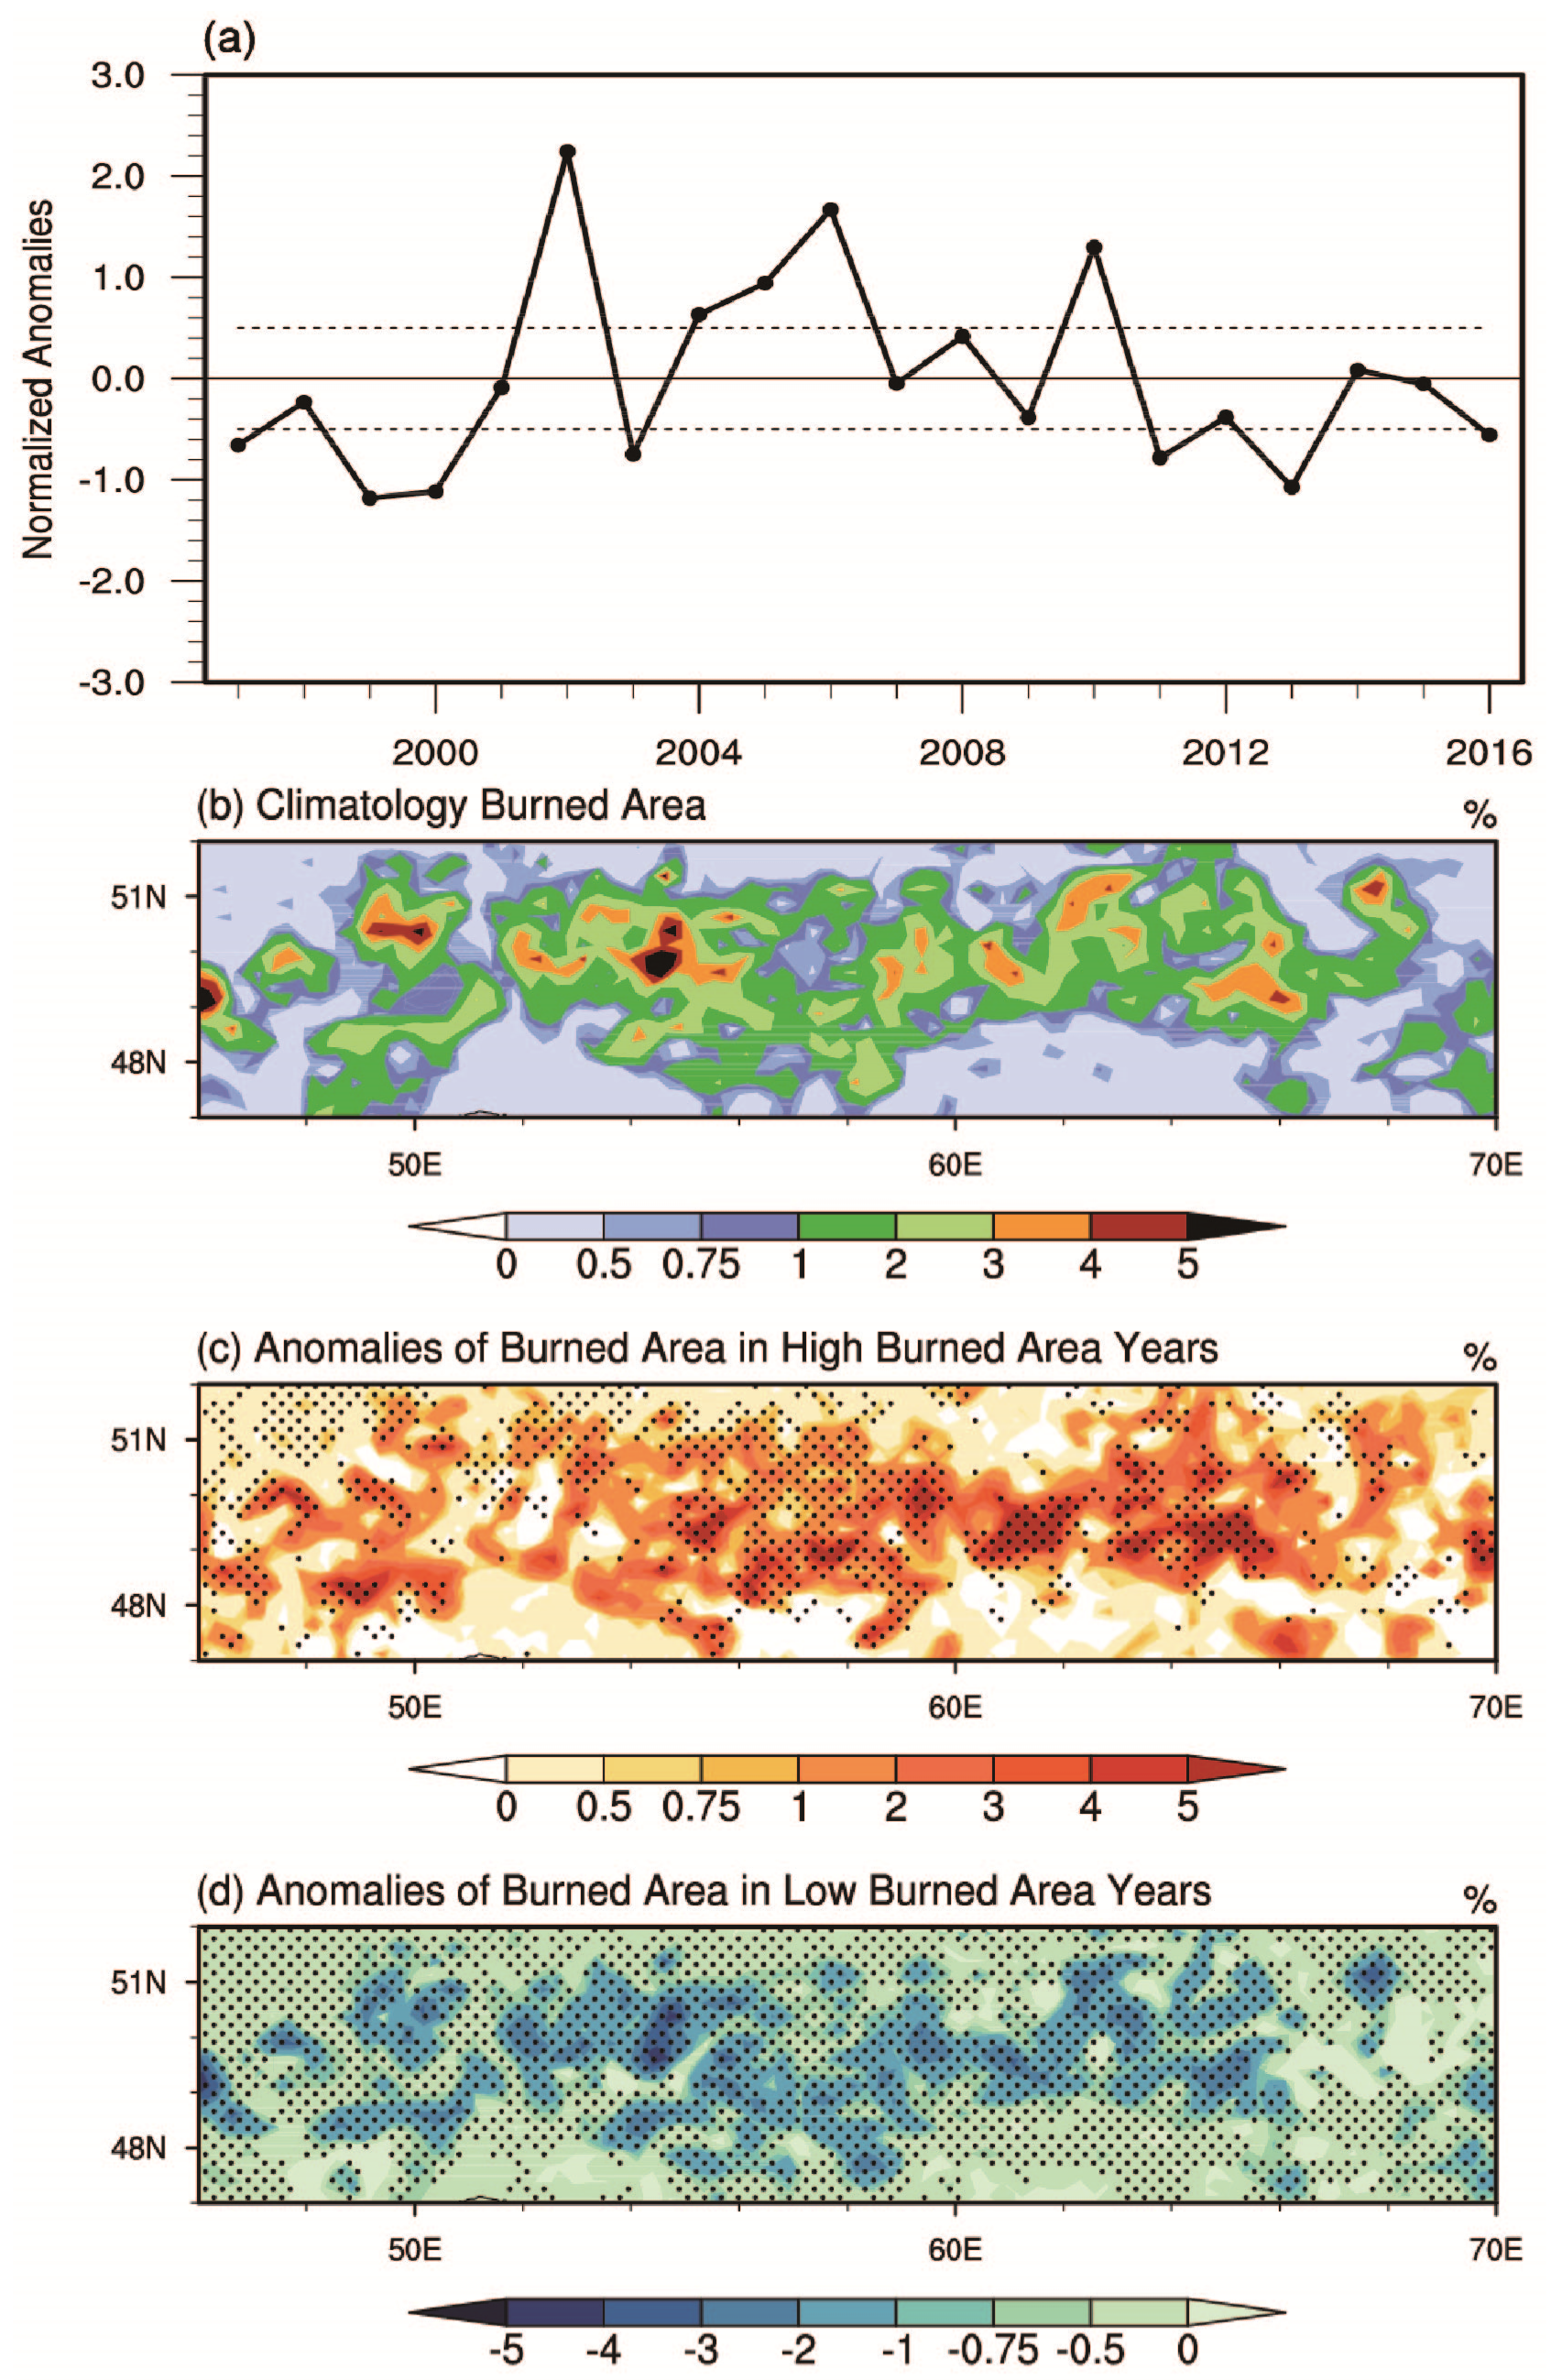
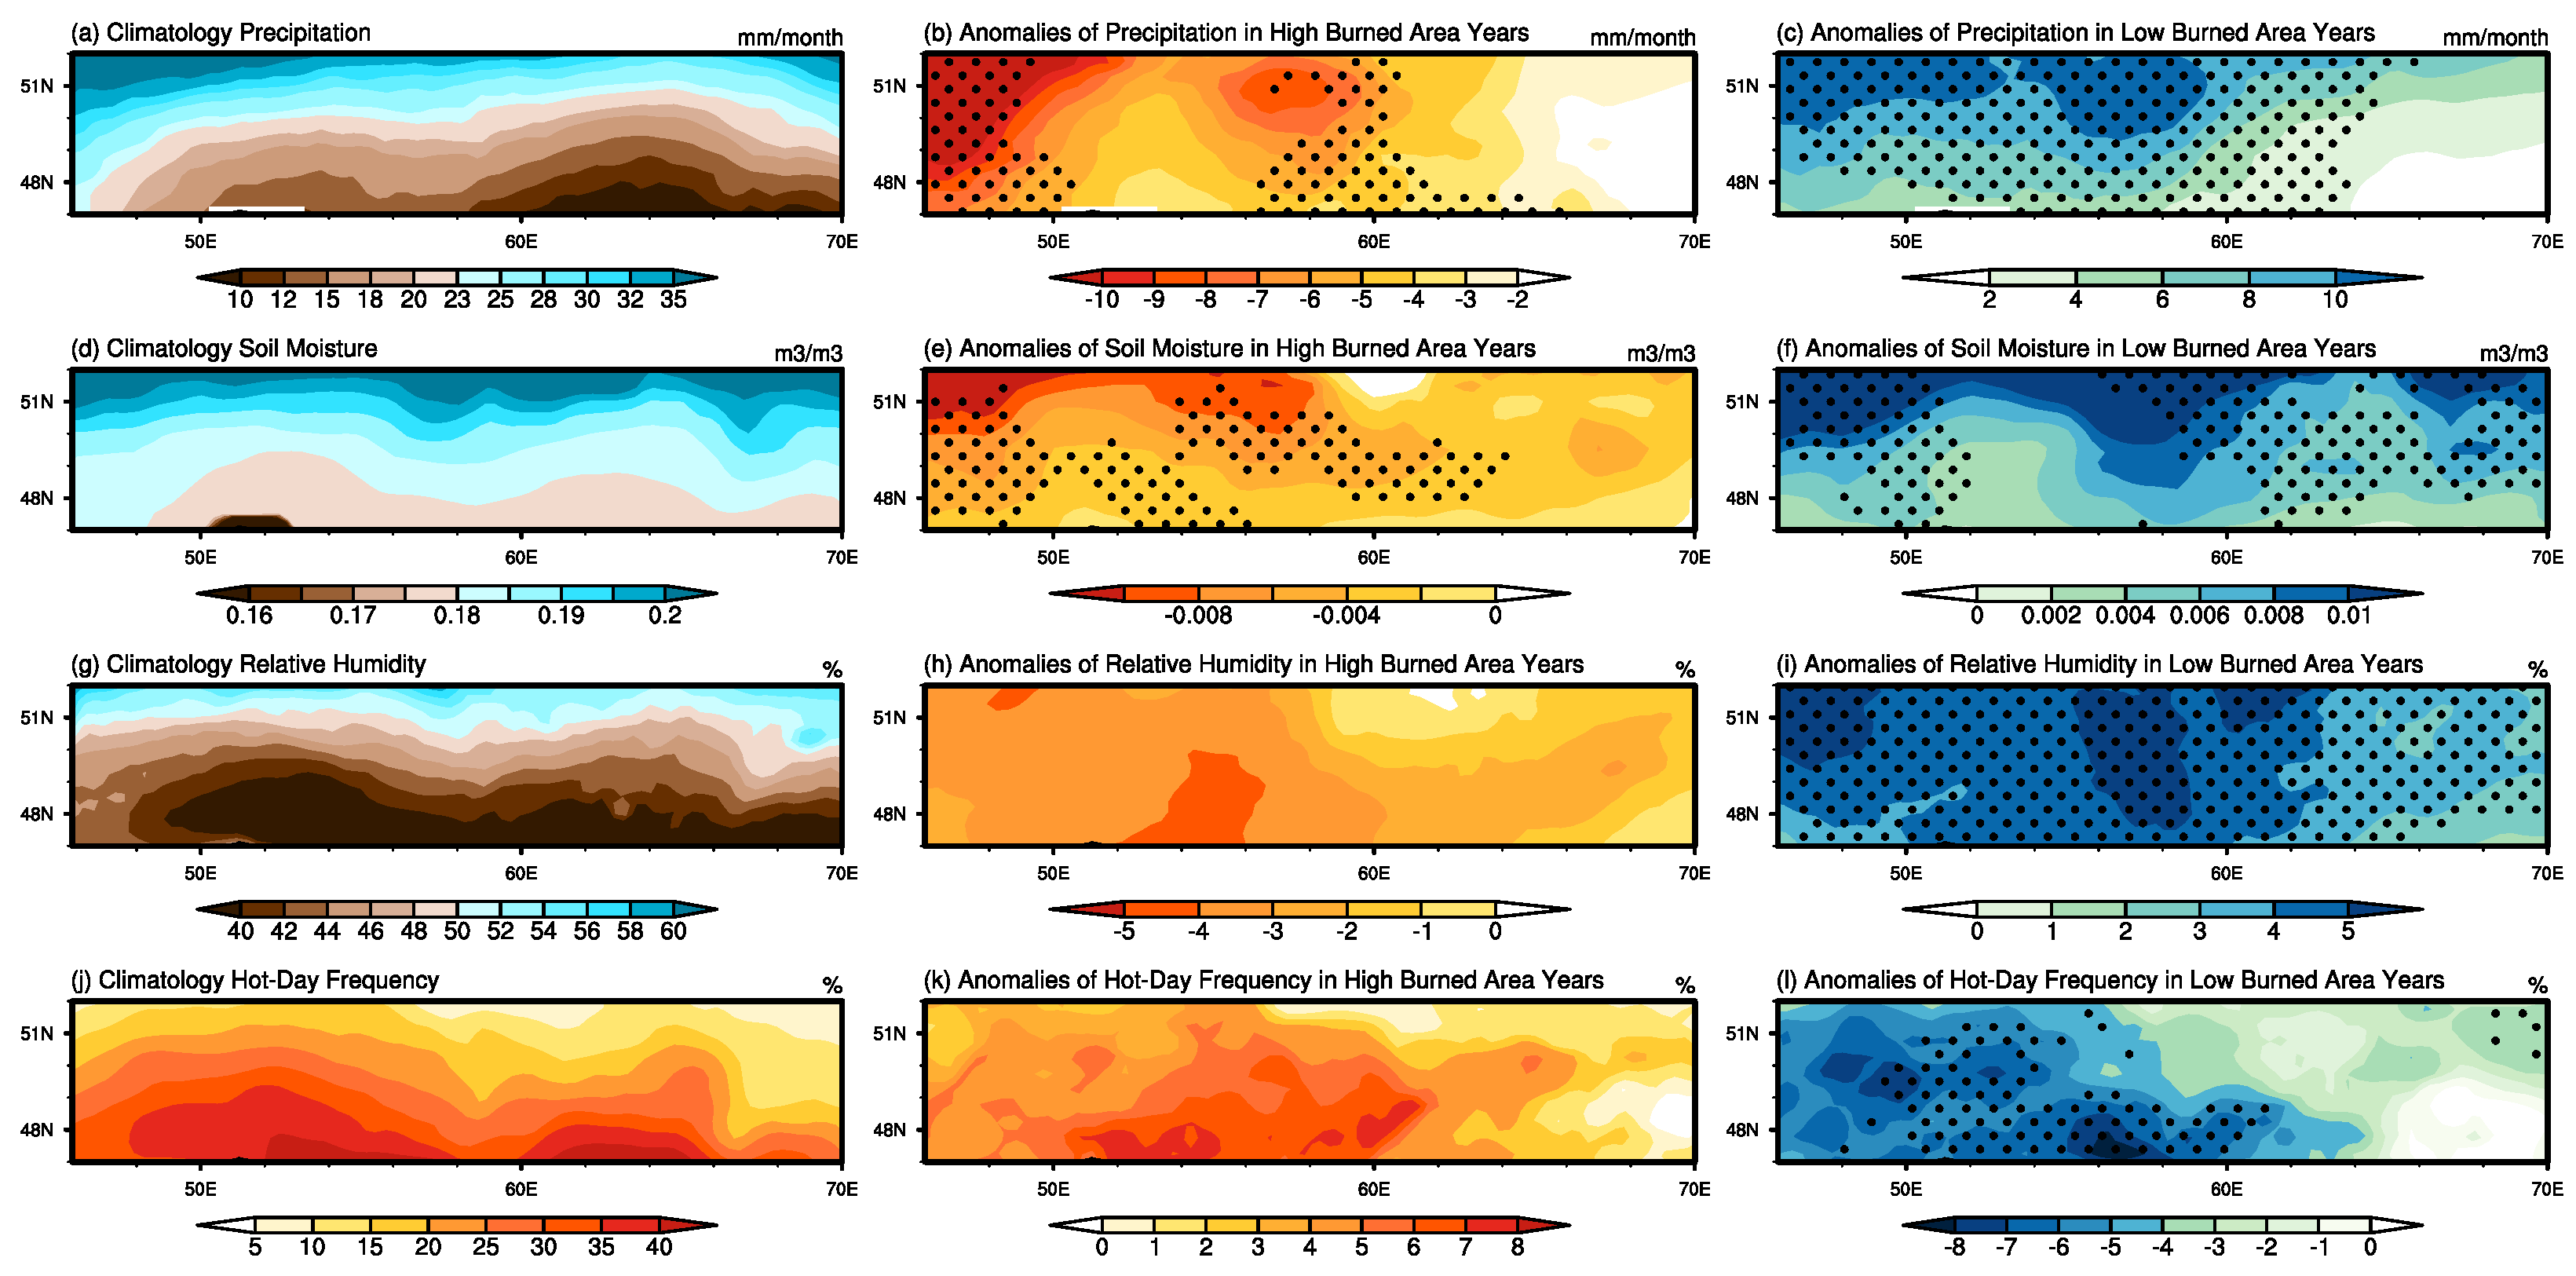
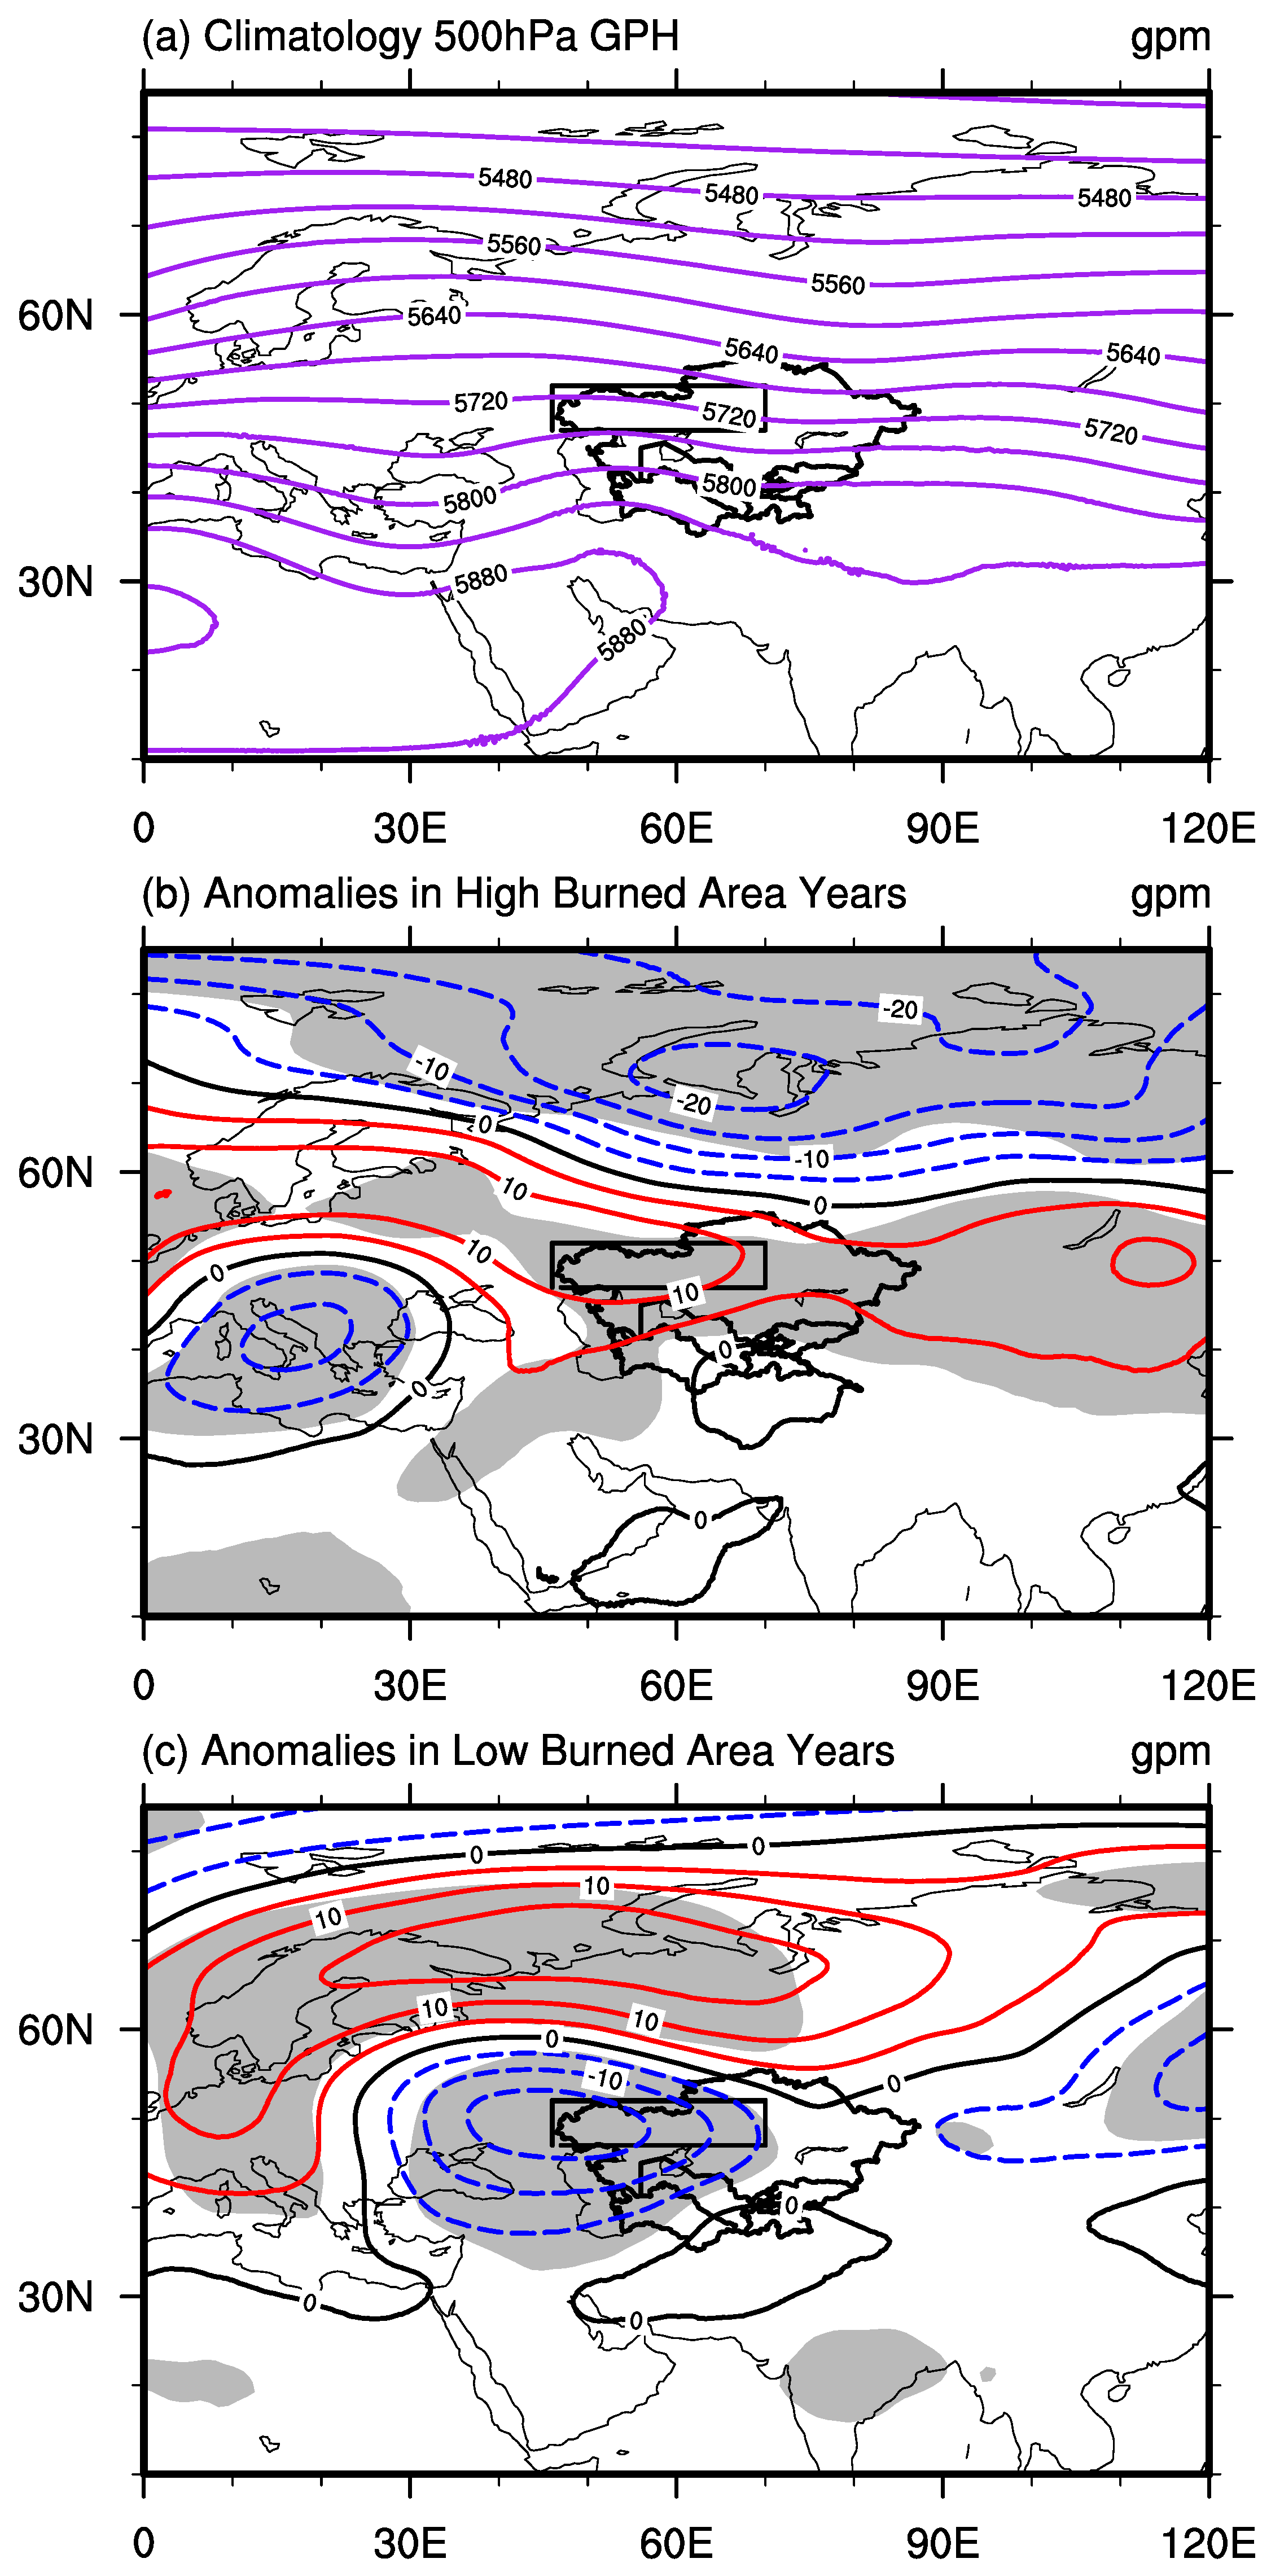
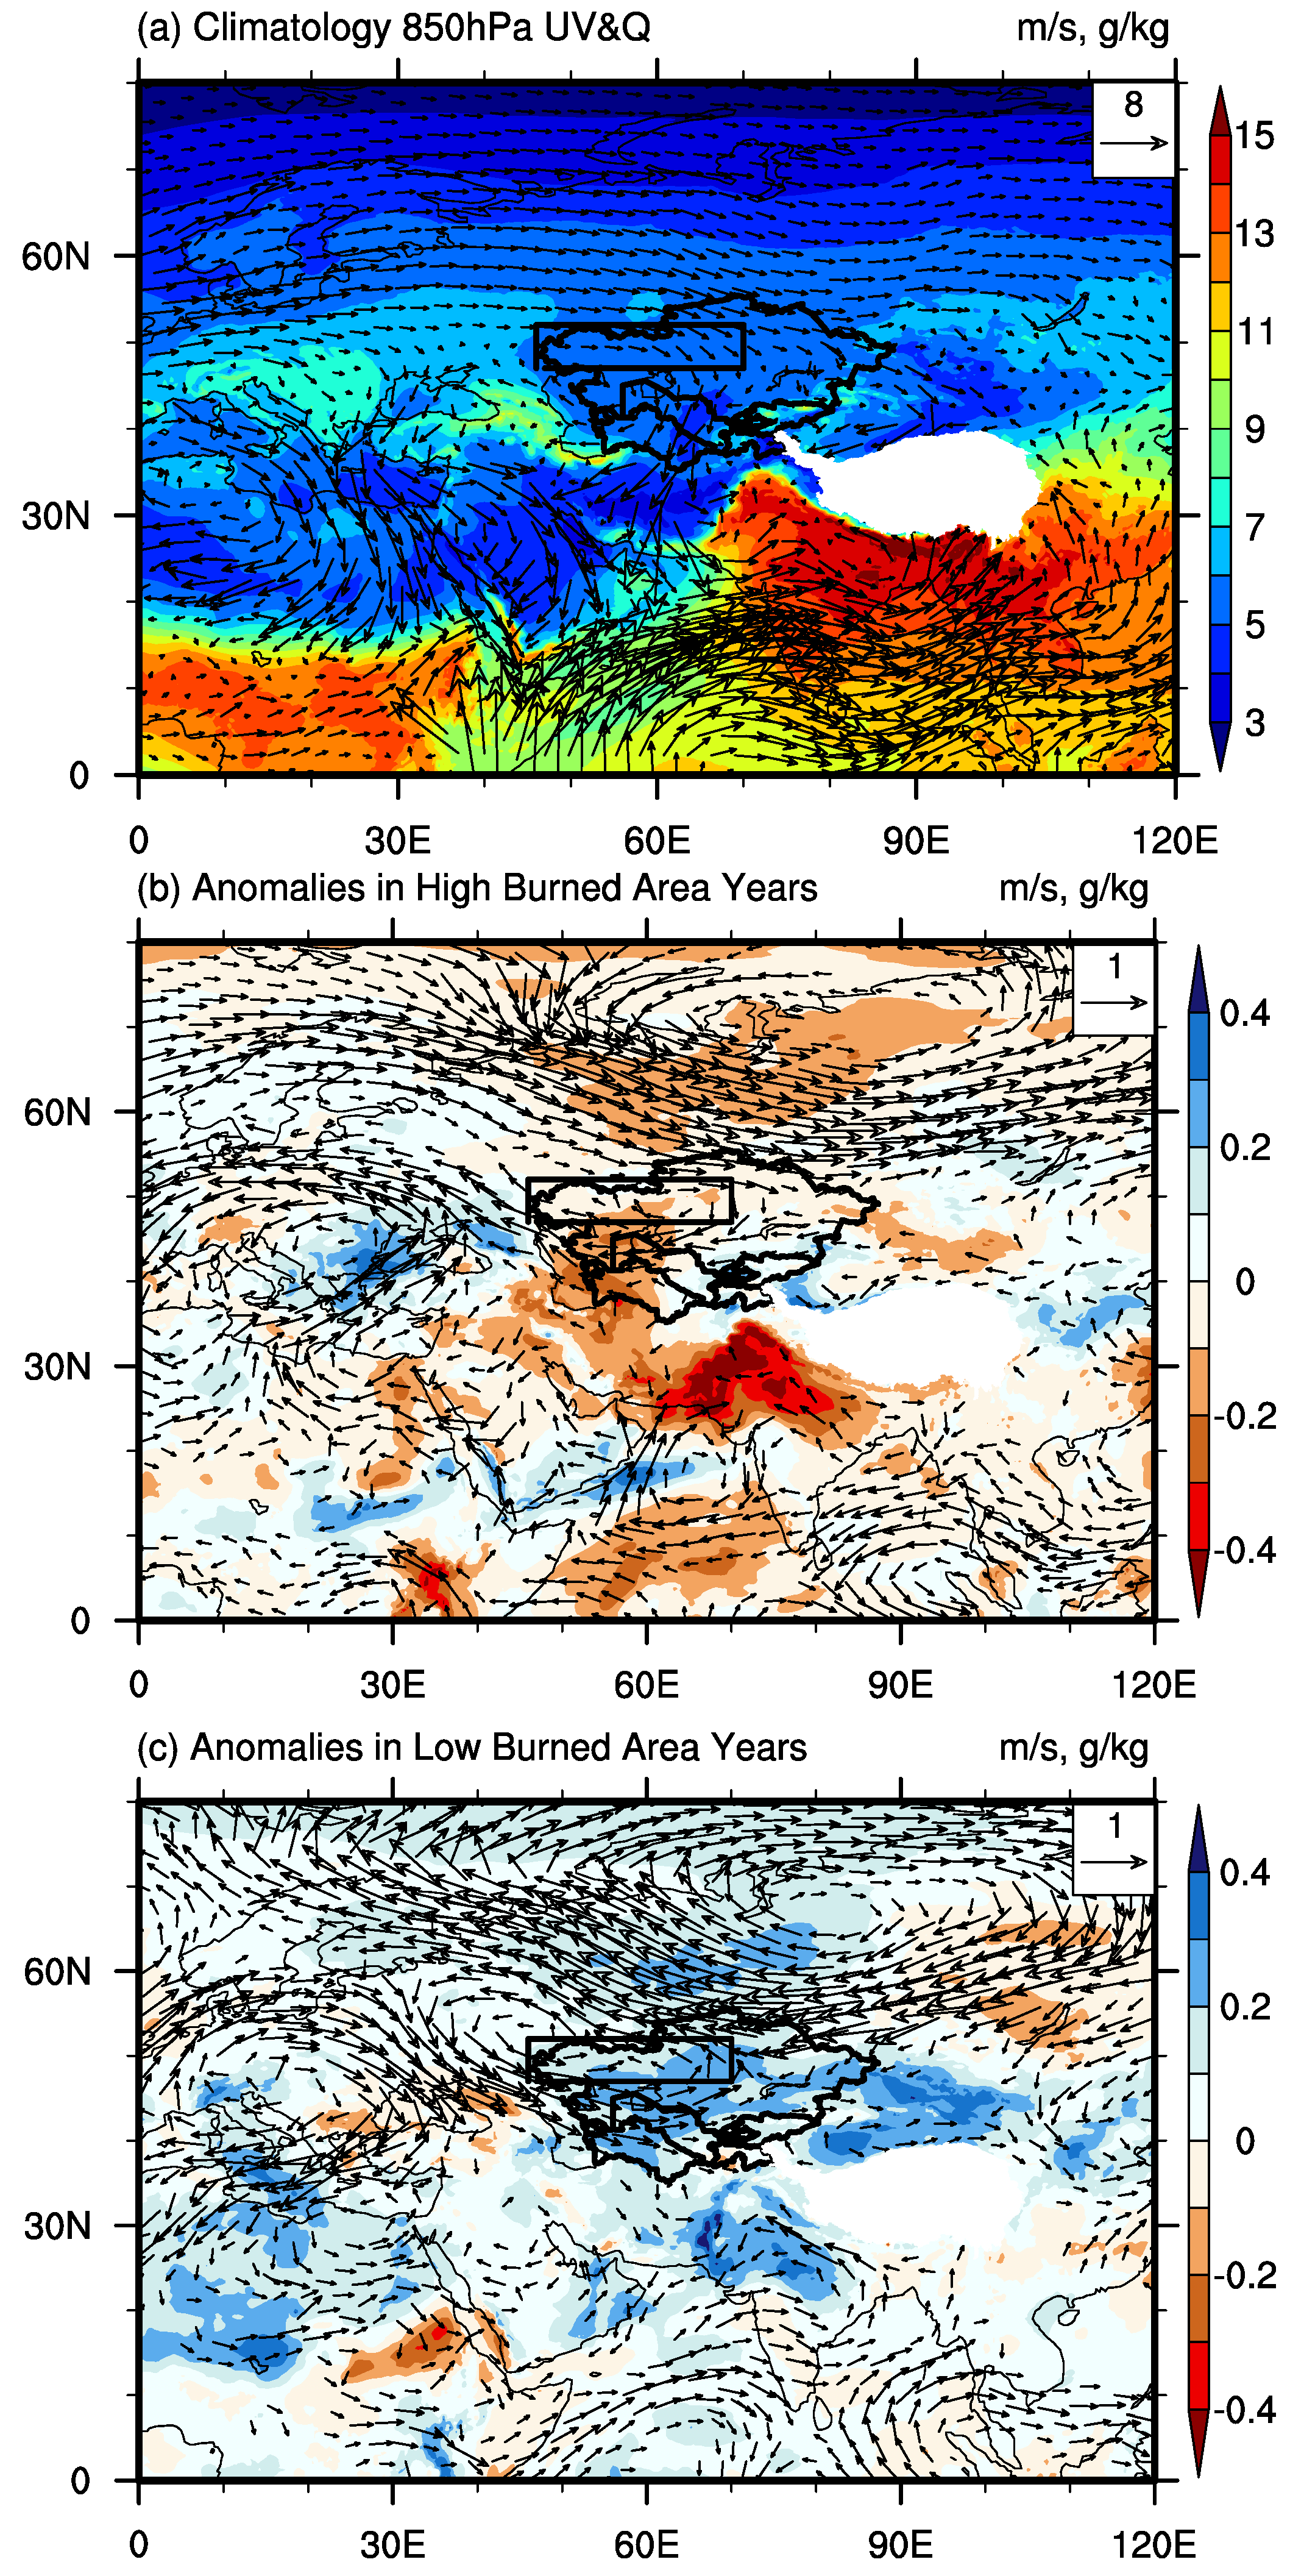
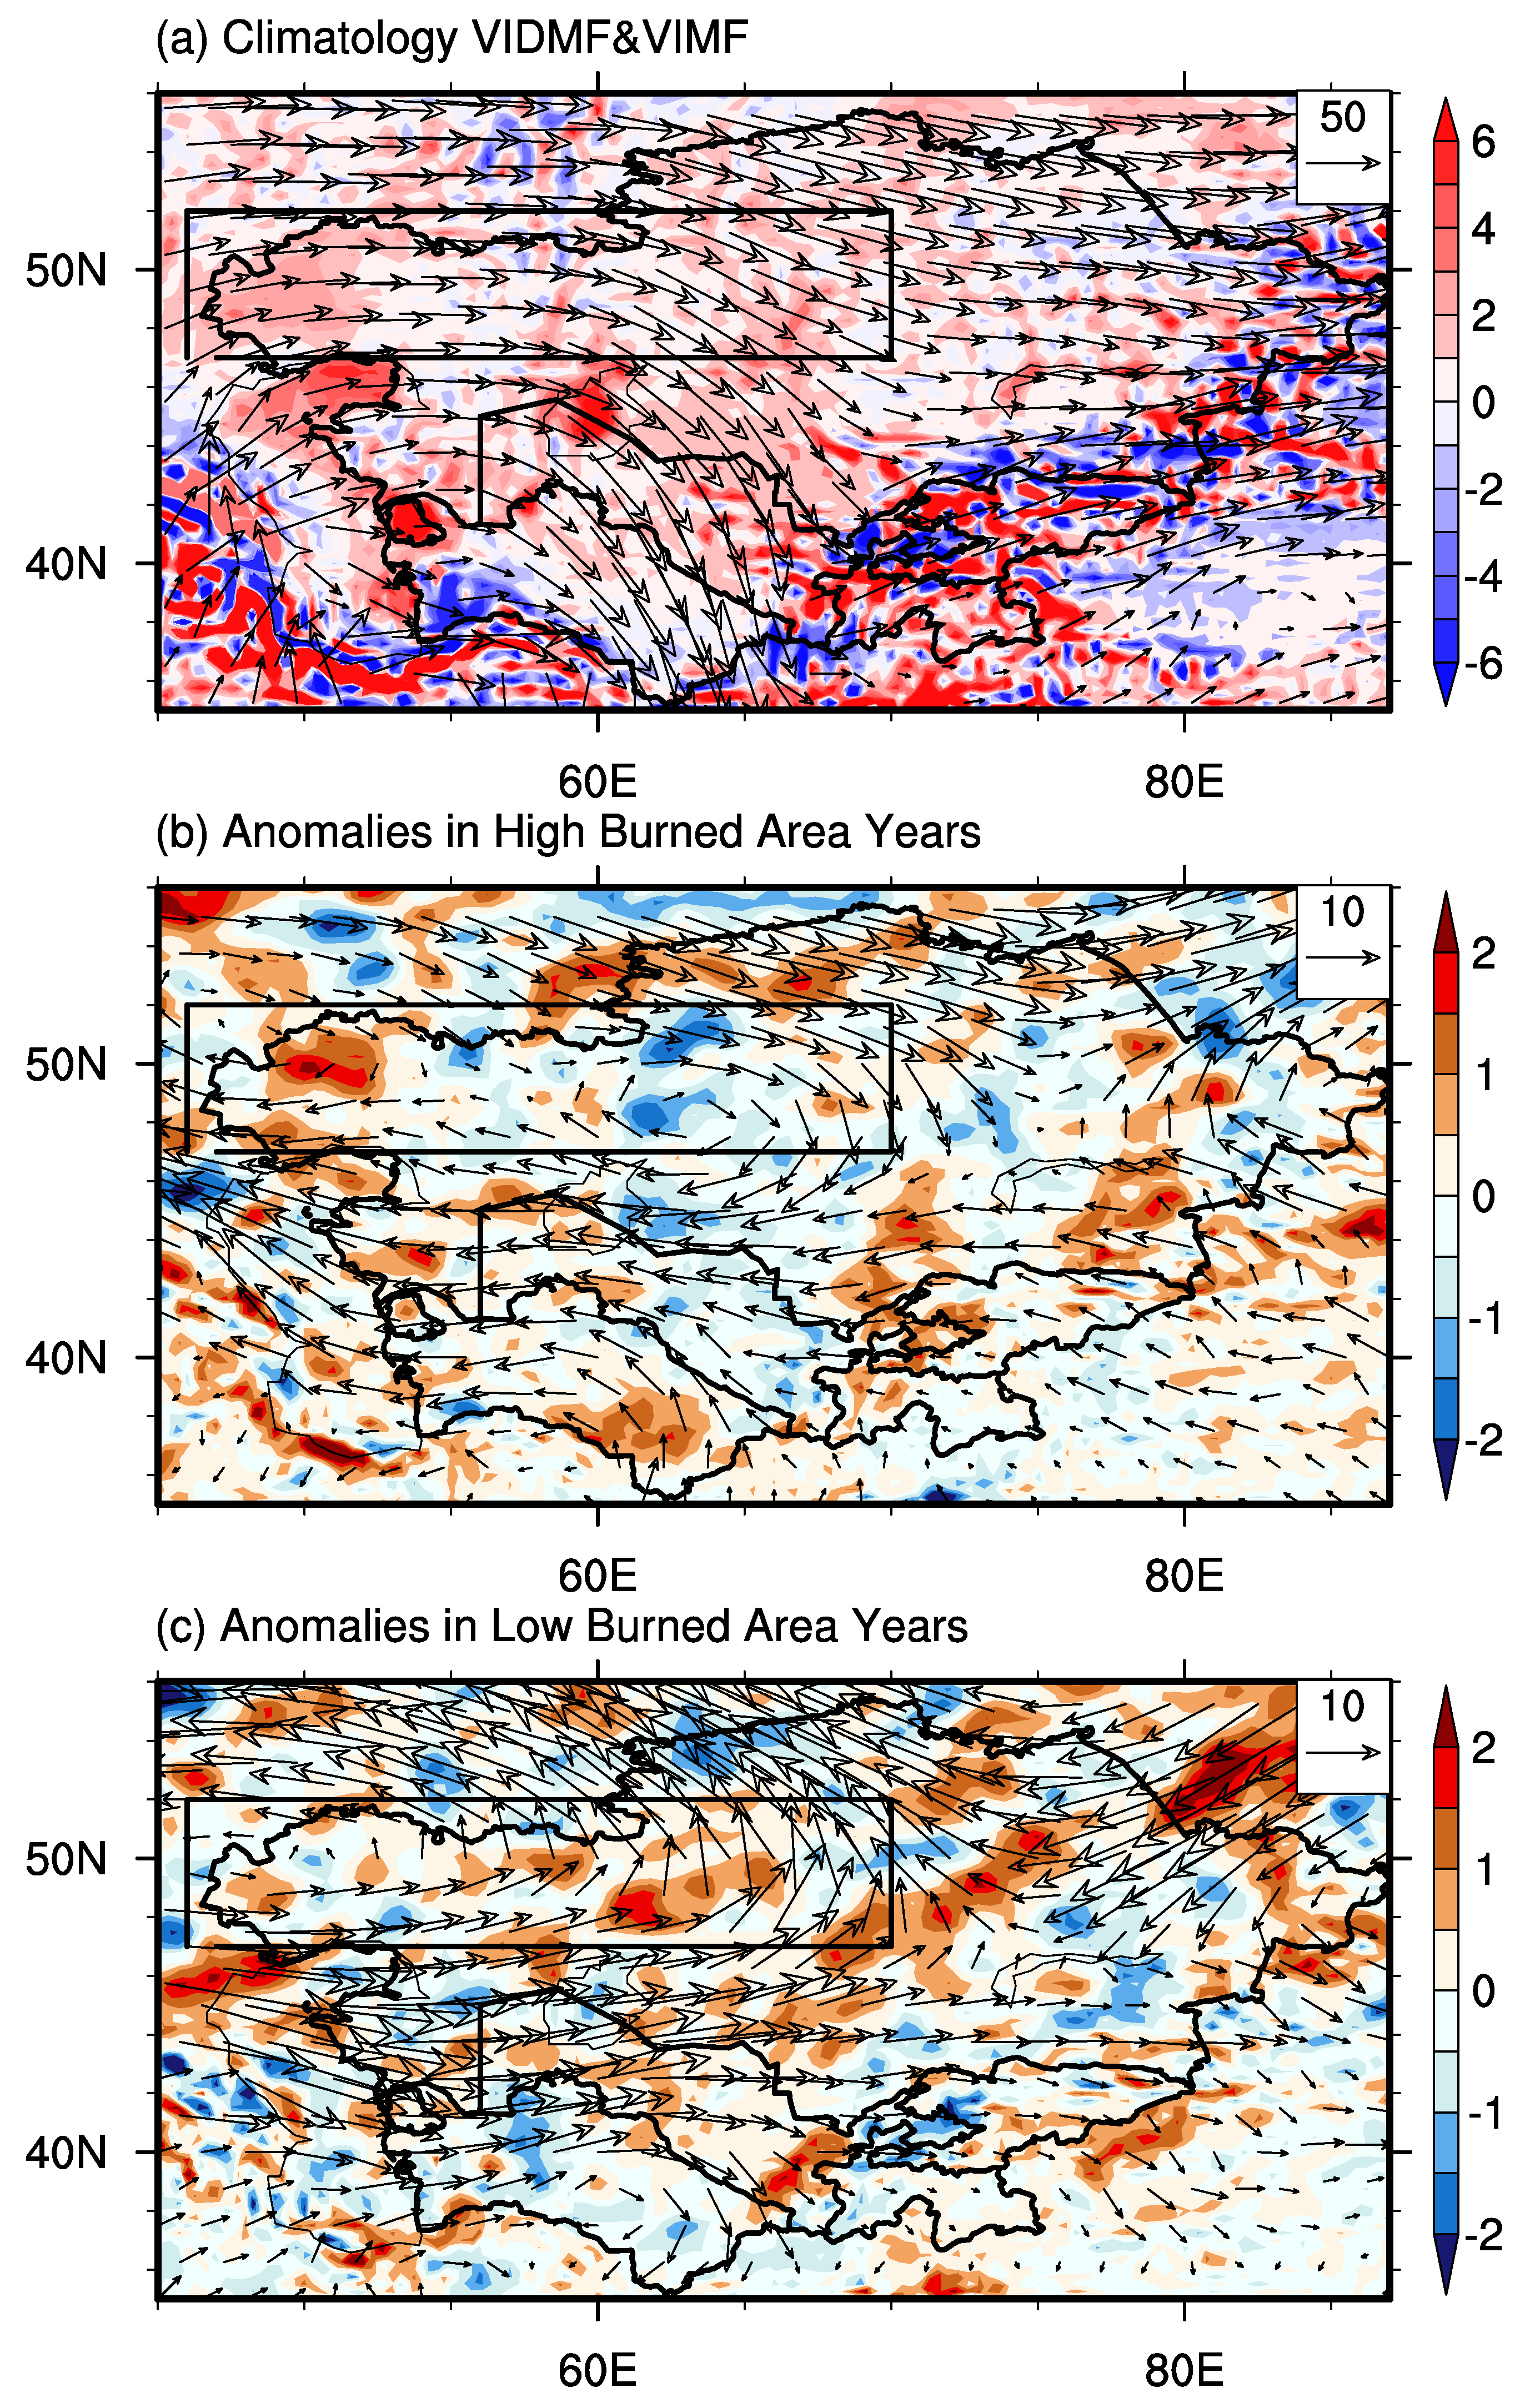
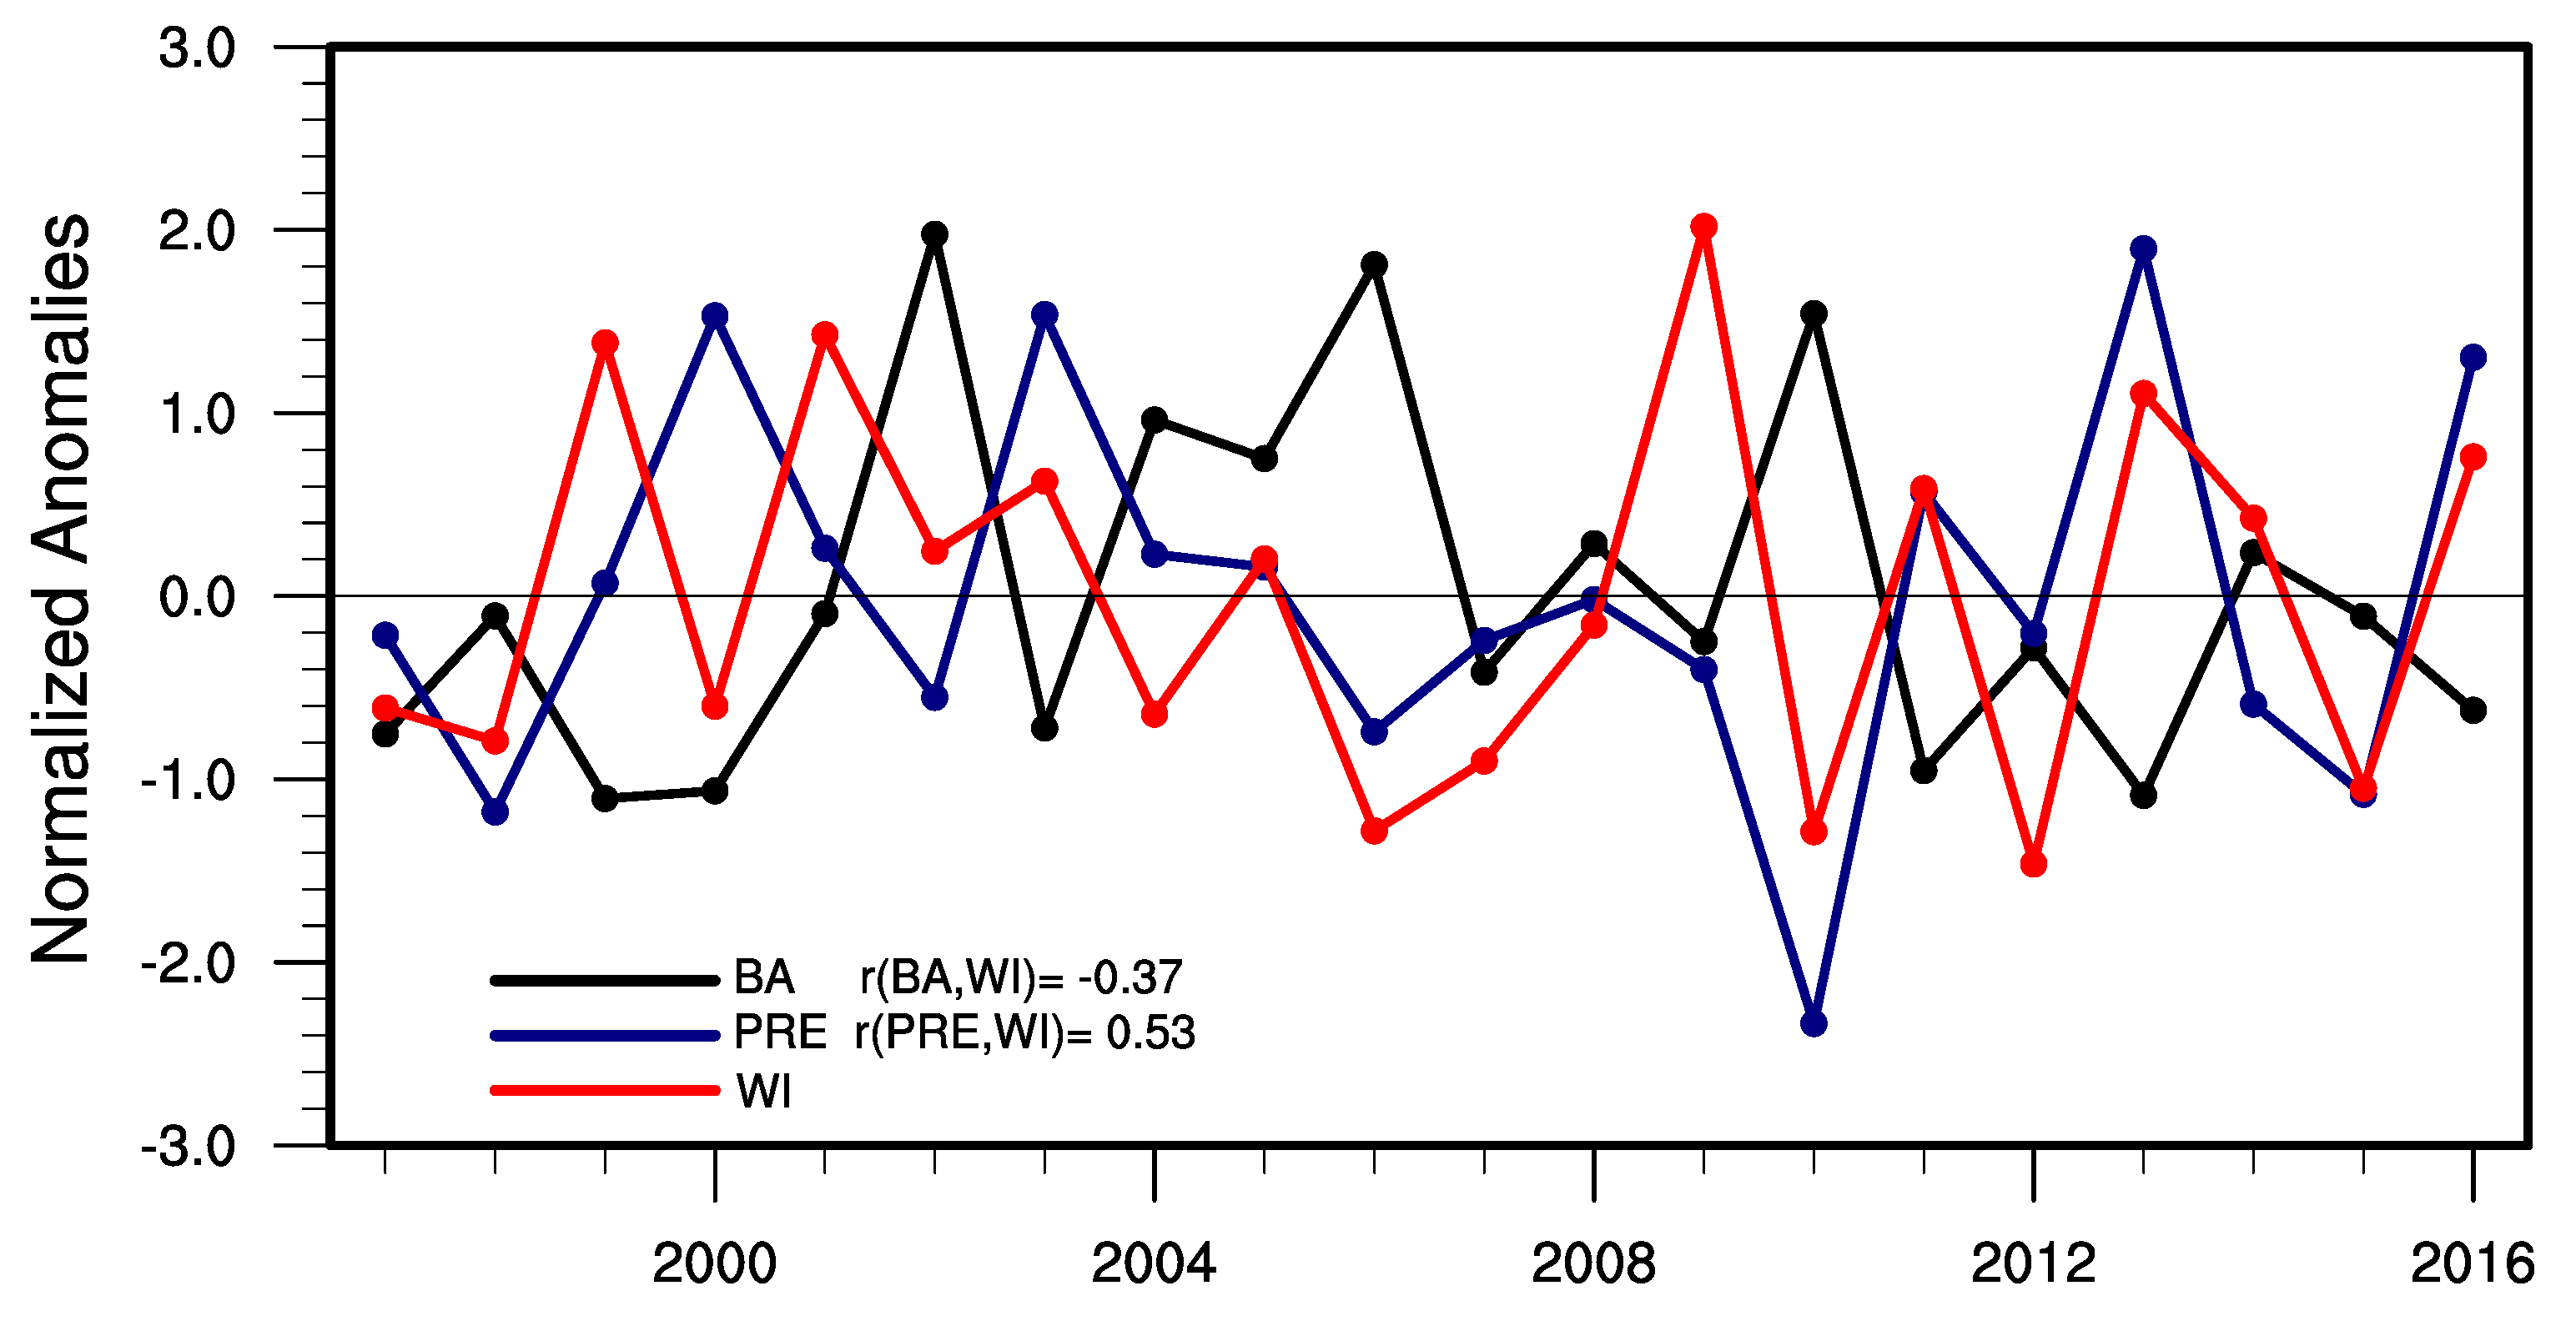
Table 1.
Summary of the gridded datasets used in investigating the relationship between the wildfires and the climatic factors.
Table 1.
Summary of the gridded datasets used in investigating the relationship between the wildfires and the climatic factors.
| Variables | Resolutions | Sources |
|---|---|---|
| Burned Fraction | 0.25° × 0.25°, Monthly | GFED4s [41] |
| Precipitation, Maximum Temperature | 0.5° × 0.5°, Monthly | CRU [40] |
| Maximum Temperature | 0.5° × 0.5°, Daily | NOAA/CPC https://psl.noaa.gov/data/gridded/data.cpc.globaltemp.html |
| Soil Moisture Topsoil Level (0–7cm) | 0.25° × 0.25°, Monthly | ERA5 [53] |
| Relative Humidity | ||
| Vertically Integrated Divergence of Moisture Flux (VIDMF) | ||
| Vertically Integrated Moisture Flux (VIMF) | ||
| 850 hPa Wind | ||
| Specific Humidity (850 hPa) | ||
| 500 hPa Geopotential Height |
Table 2.
Temporal correlation coefficient of burned area and meteorological variables during each month of burning season in the CKZ region. The letters a, b, and c indicate p < 0.1, p < 0.05, and p < 0.01, respectively.
Table 2.
Temporal correlation coefficient of burned area and meteorological variables during each month of burning season in the CKZ region. The letters a, b, and c indicate p < 0.1, p < 0.05, and p < 0.01, respectively.
| Variable | June | July | August | September |
|---|---|---|---|---|
| Precipitation | −0.53 b | −0.37 a | −0.48 b | −0.38 a |
| Soil Moisture | −0.53 b | −0.41 a | −0.40 a | −0.48 b |
| Relative Humidity | −0.52 b | −0.41 a | −0.34 | −0.55 b |
| Hot Days Frequency | 0.58 b | 0.31 | 0.01 | 0.63 c |
Table 3.
Temporal correlation coefficient of the burned area and meteorological variables during the whole burning season (June to September) and for each month of the burning season in different parts of the CKZ region. The letters a, b, and c indicate the significance at p < 0.1, p < 0.05, and p < 0.01, respectively.
| Variable | June 46–70° E | July 46–70° E | August 70–87° E | September 70–87° E | JJAS 46–70° E |
|---|---|---|---|---|---|
| Precipitation | −0.53 b | −0.79 c | −0.53 b | −0.45 a | −0.66 c |
| Soil Moisture | −0.50 b | −0.41 a | −0.66 c | −0.55 b | −0.68 c |
| Relative Humidity | −0.45 b | −0.48 b | −0.63 c | −0.59 b | −0.65 c |
| Hot Days Frequency | 0.50 b | 0.44 a | 0.90 c | 0.78 c | 0.20 |
Publisher’s Note: MDPI stays neutral with regard to jurisdictional claims in published maps and institutional affiliations. |
© 2021 by the authors. Licensee MDPI, Basel, Switzerland. This article is an open access article distributed under the terms and conditions of the Creative Commons Attribution (CC BY) license (http://creativecommons.org/licenses/by/4.0/).
Share and Cite
MDPI and ACS Style
Xu, Y.; Lin, Z.; Wu, C. Spatiotemporal Variation of the Burned Area and Its Relationship with Climatic Factors in Central Kazakhstan. Remote Sens. 2021, 13, 313. https://0-doi-org.brum.beds.ac.uk/10.3390/rs13020313
AMA Style
Xu Y, Lin Z, Wu C. Spatiotemporal Variation of the Burned Area and Its Relationship with Climatic Factors in Central Kazakhstan. Remote Sensing. 2021; 13(2):313. https://0-doi-org.brum.beds.ac.uk/10.3390/rs13020313
Chicago/Turabian StyleXu, Yongfang, Zhaohui Lin, and Chenglai Wu. 2021. "Spatiotemporal Variation of the Burned Area and Its Relationship with Climatic Factors in Central Kazakhstan" Remote Sensing 13, no. 2: 313. https://0-doi-org.brum.beds.ac.uk/10.3390/rs13020313
Note that from the first issue of 2016, this journal uses article numbers instead of page numbers. See further details here.