Article

Spatiotemporal Monitoring of a Grassland Ecosystem and Its Net Primary Production Using Google Earth Engine: A Case Study of Inner Mongolia from 2000 to 2020

1
Key Laboratory of Geographic Information Science (Ministry of Education), East China Normal University, Shanghai 200241, China
2
Key Laboratory of Spatial-Temporal Big Data Analysis and Application of Natural Resources in Megacities (Ministry of Natural Resources), East China Normal University, Shanghai 200241, China
3
School of Geographic Sciences, East China Normal University, Shanghai 200241, China
4
Shanghai Municipal Institute of Surveying and Mapping, Shanghai 200063, China
*
Author to whom correspondence should be addressed.
Remote Sens. 2021, 13(21), 4480; https://0-doi-org.brum.beds.ac.uk/10.3390/rs13214480
Submission received: 2 September 2021 / Revised: 3 November 2021 / Accepted: 4 November 2021 / Published: 8 November 2021
(This article belongs to the Section Ecological Remote Sensing)

Abstract

:
Grassland ecosystems are a significant part of the global ecosystem and support the livelihoods of millions of people. The Inner Mongolia grassland is the largest temperate grassland in the world, and an important ecological barrier for China, but due to human activities and climate change it has been faced with an ecological crisis in recent years. In this study, a modified Carnegie-Ames-Stanford approach (CASA) model based on the Google Earth Engine platform was used to determine the net primary production (NPP) in the Inner Mongolia grassland from 2000 to 2020. The results show that the average annual NPP of the Inner Mongolia grassland is 278.63 g C/m2, and 83.22% of the total area has shown an increasing trend during the study period. We also analyzed the impact of land-use/cover change (LUCC) and climatic factors on NPP. We found that: (1) the total area of grassland increased from 2000 to 2010 and then decreased from 2010 to 2020. During the whole study period, although the grassland area increased slightly by 4728.69 km2 because of LUCC, the overall effect of LUCC on grassland NPP was negative, with a loss of 17.63 Tg C compared to an increase of 16.38 Tg C. (2) The main meteorological factor affecting the NPP of the Inner Mongolia grassland is precipitation, followed by sunshine duration and temperature. About 97.06% of the grassland shows a positive correlation between NPP and precipitation. (3) The results for NPP and its changing trends are not completely consistent in the long- and short-term study periods. Considering the instability of grassland growth, it is necessary to take the periodic variation of precipitation into account when studying NPP. These results could provide basic information for policy formulation and scientific research into the ecological environment management of grassland areas in the future.

Graphical Abstract

1. Introduction

Grassland ecosystems are one of the most important parts of the global land ecosystem, covering nearly 25% of the land surface of the Earth, but they are sensitive to global change [1,2]. Grassland ecosystems also play an important role in global carbon cycling, holding 10% of the global carbon stocks [1,3,4]. Grasslands also provide a huge material basis for human survival and support the livelihoods of over 1 billion people [5,6]. However, due to the global population growth, many grasslands present a degradation trend [5,7].
China is a country with rich grassland resources, which account for about 40% of the total land area in China [8,9]. Inner Mongolia has the second largest area of grassland and the largest area of pasture in China, in which approximately 66% of the total area is coved by grassland [8,10,11]. The Inner Mongolia grassland is acknowledged as an important barrier for the ecological environment in northern China [12]. However, grasslands are fragile ecosystems, especially in arid and semi-arid locations [13,14,15]. The grassland degradation in Inner Mongolia is now very serious, including both area reduction and growth decline [11,16]. Two of the most important factors causing the grassland degradation are climate change and human activities [11,13,17]. The study found that Inner Mongolia had become warmer and drier during 1961–2012, with the rate of the global warming twice as fast [18]. It was reported droughts usually occurred in spring when strong winds blow away the surface soil easily [11], causing the degradation of grasslands. Moreover, many studies concluded that the impact of human activities (e.g., overgrazing, reclamation of grassland, mining, etc.) on desertification of grasslands intensified [19,20]. To slow down the trend of environmental deterioration in northern China, the Chinese government has launched several environmental restoration projects since 1999 [21], such as Grain to Green Program (1999–2015), Rangeland Law (2003), Return Grazing Land to Grassland Program (first round during 1999–2013, second round during 2014 to now), Beijing-Tianjin Sand Source Control Engineering Project (first round during 2001–2010, second round during 2013–2022), Payments for Environmental Services (2001–2020), Subsidy and Incentive System for Grassland Conservation (2011–2021), etc. [14,21,22,23].
With the repaid development of remote sensing technology and the gradual abundance of data, remote sensing has been indicated as a powerful way to study the spatiotemporal changes of earth ecosystems and their causes [24,25,26,27]. Net primary production (NPP) and land-use/cover change (LUCC), as calculated based on remote sensing technology, have been widely applied to analyze the structural and functional health of different ecosystems [28,29]. NPP refers to the net amount of new carbon absorbed by plants per unit of time and space, which can reflect the plant growth and ecosystem health status [17,30]. Several evaluation models for NPP based on remote sensing data have been developed, such as the Carnegie-Ames-Stanford approach (CASA) [31], the global production efficiency model (GLO-PEM) [32], and the vegetation photosynthesis model (VPM) [33]. The CASA model is the most popular approach, and has been widely applied [31,34]. Gao et al. [35] analyzed the trend of grassland NPP changes in Northern Tibet from 1981 to 2004 and found that the impact of regional climate change on NPP was more detrimental than positive. Zhang et al. [36] evaluated the grassland NPP in the Eurasian Steppe for 2000–2014 and found that the main cause of degradation of grassland was climate change in China, whereas human activities in Mongolia, while human activities promoted the grassland recovery in Kazakh steppe regions. Zhao et al. [37] analyzed the influencing factors for grassland NPP in Inner Mongolia, and their results showed that ecological restoration projects have had a positive impact on grassland NPP.
Furthermore, monitoring land-use/cover change has been another important task of remote sensing [38]. LUCC reflects the human activities that change the natural land environment, which can profoundly affect climate, biogeochemistry, and biological diversity [19,39]. Different anthropogenic activities, such as urban expansion and desertification control, have different impacts on vegetation types. Combined with LUCC and NPP, Yang et al. [26] found that the increase of urban and construction land has led to the decrease of vegetation NPP in Anhui province in China. Wen et al. [40] thought urban expansion significantly exacerbates the decline of the total NPP, especially in areas of rapid urban expansion. However, some scholars also point out that human environmental policies are beneficial to the ecological environment. According to the land use transfer matrix result, a large area of cultivated land and deserts turned back to grassland, with better growth, after several policies were vigorously implemented in Inner Mongolia [22,41]. Li et al. [28] pointed that the conversion to grassland or forest increased the total NPP in Northern China, which could increase the carbon sequestration capacity. Yang et al. [29] found the total NPP in the Yangtze River basin in China increased 53887.51 GgC from 2001 to 2018 because of the positive combination effect of LUCC and climate change.
With the advent of cloud computing technology, Google Earth Engine (GEE) has become one of the most popular platforms for geospatial and big data analysis. GEE provides massive computational capabilities for free, which makes it easy to analyze the temporal and spatial variations at a large scale [42,43,44]. Many studies about land-use and land-cover have been carried out through GEE [45,46,47]. Tassi et al. [46] compared the object-based and pixel-based methods for Landsat 8 image classification in Maiella National Park and found the object -based method was better. On a larger scale, Zhang et al. [47] applied a local adaptive random forest model to perform a fine classification of surface types at the global scale based on the Landsat 8 surface reflectance images on the GEE platform, achieving an overall accuracy of 82.5%. Moreover, some studies applied the GEE platform to monitor the spatial and temporal variation of NPP or gross primary production (GPP). Yin et al. [48] developed a method to analyze the spatiotemporal change of global forest NPP and its response to the El Niño–Southern Oscillation with the GEE platform. Zhang et al. [49] used the Coupled Carbon and Water model to estimate GPP in the United States from 2001 to 2016 and found LUCC had a significantly greater negative impact on GPP than climate change. In addition, remote sensing research based on the GEE platform has been widely conducted, including evapotranspiration (ET) modeling [50,51,52], shorelines extraction [53], flood monitoring [54], vegetation monitoring [55], urban remote sensing [56,57], snow fluctuations monitoring [58], etc.
Although these studies have obtained valuable results through the use of remote sensing, there is still a lack of systemic analyses of the quantity and quality change of the grassland ecosystem in Inner Mongolia. Meanwhile, there is still a lack of NPP estimation cases based on the CASA model on the GEE platform. Since the grassland ecosystem is sensitive and changeable in Inner Mongolia, it is of great significance to quantitatively analyze the grassland NPP and LUCC using long time-series data, and to assess the influence of LUCC and meteorological factors on NPP. The findings of such an analysis could provide data support for government to formulate or change the sustainable development policies. Therefore, the specific objectives of this study were:
(1)
to analyze the LUCC spatiotemporal process in Inner Mongolia every 11 years from 2000 to 2020, and especially the change of grassland.
(2)
to estimate the Inner Mongolia grassland NPP and its spatiotemporal change every year for 2000–2020.
(3)
to evaluate the influence of LUCC and meteorological factors on the spatiotemporal change of grassland NPP.
The rest of this paper is organized as follows. The background information for the study area, data sources, and research method is provided in Section 2. In Section 3, the results of the LUCC processing, the grassland NPP estimation, and the influence of LUCC and meteorological factors on NPP are provided and discussed in sequence. In Section 4, the NPP response to LUCC and meteorological factors, and the importance and uncertainties in this study will be discussed. Our conclusions are given in Section 5.

2. Materials and Methods

2.1. Study Area

Inner Mongolia, from 37°24′N to 53°23′N and 97°12′E to 126°04′E, with a total coverage of 1.183 million km2, is located in the northern part of China (Figure 1a). Most of Inner Mongolia belongs to the continental monsoon climate zone. Due to the Greater Khingan Range and the Yinshan Mountains (Figure 1b), there exists a huge difference in the altitude in Inner Mongolia, high in the west and low in the east, which significantly affects the distribution of hydrothermal resources [59]. The annual mean temperature ranges from −1 to 10 °C and shows an increasing trend from north-east to south-west. Annual total precipitation is in the range of 100–500 mm, decreasing from east to west and concentrated in summer. There is abundant sunshine in most areas, which lasts more than 2700 h every year. Due to the large range of longitude and latitude, six major vegetation types are found from east to west, which are coniferous forest, deciduous broadleaf forest, meadow steppe, typical steppe, desert steppe, and desert. Inner Mongolia represents a great resource of forest and grassland and is an important animal husbandry base for China. However, the Inner Mongolia terrestrial ecosystem is fragile, and is greatly affected by climate change and human activities [59].

2.2. Data Sources

In order to quickly pre-process the huge remote sensing images of the study area from 2000 to 2020, we selected GEE as the main research platform. The normalized difference vegetation index (NDVI) data, meteorological data, land-cover data, and NPP observation data were applied in this study, as listed in Table 1.

2.2.1. NDVI Data

The NDVI data were derived from the MOD13Q1 and MYD13Q1 products on the GEE platform from 2000 to 2020. These two products are produced from Moderate Resolution Imaging Spectroradiometer (MODIS) data by NASA’s Land Processes Distributed Active Archive Center (LP DAAC) at the USGS EROS Center [60,61]. The NDVI data have a temporal resolution of 16 days and a spatial resolution of 250 m. We first used the quality bands (SummaryQA) to remove the influence of cloud-, snow-, and ice-based pixels for each image. Secondly, since there were three or four remote sensing images for each month (since the Aqua satellite was not launch yet, before July 2002, there is only MOD13Q1 data from Terra satellite, with one or two images each month), the maximum-value composite (MVC) procedure was applied to transfer the 16-day NDVI data to monthly data. Moreover, we re-projected the NDVI data to Universal Transverse Mercator (UTM) 49 N Projection based on the WGS-84 datum and extracted the data for the research area through the use of the Inner Mongolia administrative boundary vector file.

2.2.2. Meteorological Data

The meteorological data used to estimate NPP in this study were the monthly mean temperature, total precipitation, and total sunshine duration data from 2000 to 2020. These data were obtained from 92 meteorological stations, including 39 stations in Inner Mongolia and 53 stations in surrounding provinces within 100 km. The original meteorological data were downloaded from the China Meteorological Data Service Center (http://data.cma.cn/, accessed on 28 January 2021). Missing data were filled by the average data of the same period before and after the year. Gaussian kriging interpolation was performed to interpolate the monthly meteorological data to a spatial resolution of 250 m based on the same projection as the remote sensing images on the GEE platform.

2.2.3. Land-Cover Data

The distribution of vegetation types reflects the long-term evolution of the ecological environment under the influence of climate change and human activities [62]. In the CASA model, the maximum light use efficiency (LUE) is determined by the different vegetation types. GlobeLand30 data, published by Chen et al. [63], were applied in this study, including the V2000, V2010, and V2020 images. GlobeLand30 includes 10 land cover classes in total, namely cultivated land, forest, grassland, shrubland, wetland, water bodies, tundra, artificial surface, bare land, perennial snow and ice. In this study, we only take the land-cover type of grassland as the subject of this study. The grassland land-cover type in the GlobeLand30 is defined as the lands covered by natural grass with cover density over 10%, including prairies, meadow steppes, alpine grasslands, desert steppes, and lawns. The overall accuracy of all three GlobeLand30 images has been reported to exceed 80% [64], which could meet the needs of this study.
The GlobeLand30 is published in a spatial resolution of 30 m under the UTM projection system on its official website by the China National Geomatics Center (http://www.globallandcover.com/, accessed on 24 January 2021). In order to match the spatial resolution of the NDVI data, the sliced images were first mosaiced into one complete image, and then resampled to 250 m by the majority method in ArcGIS 10.4 (ESRI, West Redlands, CA, USA). In order to analyze the long-term sequence changes of the grassland NPP in Inner Mongolia, we merged the grassland types in the GlobeLand30 for three period images.

2.2.4. NPP Observation Data

In this work, the estimated NPP by CASA model was verified through the observed NPP based on FLUXNET2015 datasets (https://fluxnet.org/data/fluxnet2015-dataset, accessed on 24 August 2021) and ChinaFLUX datasets (http://www.chinaflux.org/, accessed on 30 October 2021), hosted at the Lawrence Berkeley National Laboratory (Berkeley, CA, USA) and Institute of Geographic Sciences and Natural Resources Research (Beijing, China), respectively. FLUXNET2015 and ChinaFLUX datasets contains the gross primary production (GPP) [65,66], which could be converted into the NPP value by multiplying the ratio of NPP/GPP at 0.55 [67]. The observed GPP data from four flux sites located in Inner Mongolia during different periods were applied in this study. The details of the flux sites are given in Table 2.

2.3. Research Method

This study mainly aimed to assess the long time series of grassland NPP in Inner Mongolia based on the CASA model. The analysis of LUCC, the changing trends of NPP, and its correlation with climatic factors were combined to study the spatial and temporal variation of grasslands in Inner Mongolia. The flowchart of the main methods is shown in Figure 2.

2.3.1. Estimation of NPP Based on the CASA Model

In this study, the evaluation of NPP based on the CASA model was completed on the GEE platform. The CASA model, which is a satellite-based NPP model, is based on the theory of LUE. It uses absorbed photosynthetically active radiation (APAR) and LUE to estimate NPP at the time step of a month [31,68]. The main CASA equation is:
N P P x , t = A P A R x , t × L U E x , t
where N P P x , t , A P A R x , t , and L U E x , t are the NPP, APAR, and LUE at grid position x in month t , respectively. The units of the first two parameters are g C · m 2 · m o n t h 1 and M J · m 2 · m o n t h 1 , respectively. APAR is determined jointly by the total solar radiation and the characteristics of the vegetation itself, and can be calculated as:
A P A R x , t = 0.5 × S O L x , t × F P A R x , t
where the constant 0.5 is the proportion of solar radiation which can be absorbed by plants (i.e., 0.38–0.71 μm). S O L x , t is the total surface solar radiation, which can be estimated by the relationship between the sunshine duration and solar radiation at grid position x in month t (unit: M J · m 2 · m o n t h 1 ). For details of the calculation method for SOL, we refer the reader to Pang et al. [69] and Wu et al. [70]. F P A R x , t is the fraction of APAR absorbed by the plant canopy at grid position x in month t , which has a good linear correlation with NDVI [71,72]. The formula for FPAR is:
F P A R x , t = N D V I x , t N D V I m i n N D V I m a x N D V I m i n × F P A R m a x F P A R m i n + F P A R m i n
where N D V I x , t is the NDVI value at grid position x in month t . N D V I m a x and N D V I m i n represent the maximum and minimum NDVI values of grassland, respectively. To reduce the influence of extreme values, we used 95% and 5% in the NDVI histogram as the maximum and minimum of each vegetation type. F P A R m a x and F P A R m i n are constants, with values of 0.001 and 0.95, respectively.
In real conditions, the LUE is not only determined by the vegetation itself, but also by the influence of environmental factors, such as temperature, moisture, and other factors [68]. The formula for LUE is:
L U E x , t = T ε 1 x , t × T ε 2 x , t × W ε x , t × L U E m a x
where T ε 1 x , t and T ε 2 x , t are the temperature stress coefficients to depress the LUE, which can be derived by the optimum temperature and the temperature difference between the monthly temperature and the optimum temperature at grid position x in month t . W ε x , t is the moisture stress coefficient at grid position x in month t , which can be calculated by the precipitation and temperature data [31,68]. L U E m a x is the maximum LUE of grassland under ideal environmental conditions (unit: g C · M J 1 ). According to Zhu et al. [72], we set 0.589 as the L U E m a x of grassland under a classification accuracy of 85%.

2.3.2. Analysis of the NPP Change Volatility and Trends

The coefficient of variation (CV) of NPP can reflect the interannual volatility of the grassland growth status. The calculation of the CV was conducted on the GEE platform, of which the formula is expressed as follows:
C V = 1 n 1 × i = 1 n N P P i N P P ¯ 2 N P P ¯
where C V is the CV of NPP; n was 21 in this study because of the years from 2000 to 2020; i is the index of years; N P P i is the value of NPP in the i -th year; and N P P ¯ is the average NPP from 2000 to 2020.
The ordinary least squares (OLS) method was selected to estimate the linear trend of NPP over the long time series, which can reflect the change trend of grassland NPP [13]. The OLS method also was completed on the GEE platform. The formula for OLS is expressed as follows:
θ O L S = n × i = 1 n i × N P P i i = 1 n i × i = 1 n N P P i n × i = 1 n i 2 i = 1 n i 2
where θ O L S is the linear trend of NPP, and the other parameters are the same as above.
Theil–Sen median trend analysis, combined with the Mann–Kendall (MK) test, can be applied to analyze long time series of vegetation indicators, and reflect the change trends of each pixel in a time series [73,74,75]. Theil–Sen median trend analysis is free from the interference of outliers. The Theil–Sen median trend analysis and MK test were conducted in Python 3, using pyMannKendall open-source software [76]. The detailed formulae are expressed as follows:
θ T S = median N P P j N P P i j i ,   2000 i < j 2020
where θ T S is the Theil–Sen median result; and N P P i and N P P j represent the NPP in the years of i and j , respectively.
The MK test, which a non-parametric statistical test, is widely applied to measure the significance of Theil–Sen median trends [77,78]. It has also been used to analyze vegetation growth trends over long time series [75,79].
The MK statistic, i.e., Z , is defined as follows:
Z = f x = S 1 s S ,   S > 0 0 ,   S = 0 S + 1 s S ,   S < 0
where
S = i = 1 n 1 j = i + 1 n sgn N P P j N P P i
sgn N P P j N P P i = 1 ,   N P P j N P P i > 0 0 ,   N P P j N P P i = 0 1 ,   N P P j N P P i < 0
s S = n n 1 2 n + 5 18
where N P P i and N P P j represent the same as above, n is the length of the time series, and sgn is a sign function. The Z statistic value ranges from to + , and Z > u 1 α / 2 reflects whether the long time series shows significance at the level of α. In this study, we set α = 0.05 , so that u 1 α / 2 = u 0.975 = 1.96 . The NPP change trends were reclassified into four classes, according to the detected change trend and its significance test result, as shown in Table 3.

2.3.3. Analysis of the Main Influencing Factors

The correlation coefficient and partial correlation coefficient methods were applied in this study to analyze the influencing factors of NPP, which were calculated on the GEE platform. The partial correlation coefficient can assess the relationship between variables a and b , while eliminating the impact of other influencing factors on the complex relationship [80,81]. The partial correlation coefficient can be calculated as follows:
R a b , c d = R a b , c R a d , c × R b d , c 1 R a d , c 2 × 1 R b d , c 2
R a b , c = R a b R a c × R b c 1 R a c 2 × 1 R b c 2
R a b = i = 1 n a i a ¯ × b i b ¯ i = 1 n a i a ¯ 2 × i = 1 n b i b ¯ 2
where R a b , c d represents the second-order partial correlation coefficient of variables a and b , with c and d acting as the control variables; R a b , c represents the partial correlation coefficient of variables a and b , with c acting as the control variable; R a b represents the Pearson correlation coefficient between variables a and b ; and a ¯ and b ¯ are the mean values of the two variables.

3. Results

3.1. Characteristics and Variation of LUCC in Inner Mongolia

As the LUCC matrix (Table 4) shows, grassland is the dominant land-use type (46.88% of the total area in 2020) in Inner Mongolia, followed by bare land, cultivated land, and forest (24.99%, 13.52%, and 11.81% in 2020, respectively). These four land-use types covered 97.20% of the total area of Inner Mongolia in 2020. During the study period, the LUCC in 11.80% of the total area (136,322.38 km2) changed. From 2000 to 2020, the area of cultivated land increased the most (9,461.19 km2), followed by artificial surfaces (7,208.50 km2), grassland (4,728.69 km2), shrubland (3,965.25 km2), and forest (755.94 km2), while the areas of water (205.50 km2), wetland (1,959.31 km2), and bare land (23,954.75 km2) reduced.
However, there were certain differences in the LUCC between the first 11 years and the second 11 years. From 2000 to 2010, the area of cultivated land and water decreased (by 5,235.00 and 1013.94 km2, respectively), while they showed a pattern of growth during 2010–2020 (by 14,696.19 and 808.44 km2, respectively). The area of grassland and shrubland increased from 2000 to 2010 (by 14,287.31 and 4069.25 km2, respectively), while the area of grassland decreased during 2010–2020 (by 9558.63 and 104.00 km2, respectively). The change trends of forest, wetland, artificial area, and bare land remained the same during the two periods.
In general, the land-use change in Inner Mongolia during the study period mainly focused on the conversion between grassland and cultivated land, forest, and bare land. During 2000–2010, about 9813.00 km2 of cultivated land changed into grassland, with 5173.50 km2 of grassland changed into cultivated land. During 2010–2020, the shifts between cultivated land and grassland were more intense, and far more grassland was changed into cultivated land (26,495.25 km2) than changed from cultivated land (10,865.88 km2). Furthermore, the shift between forest and grassland remained in relative balance during the study period, ranging from 6405.00 to 8964.25 km2. In addition, the trend of change from bare land into grassland was significant in these two periods. The area of bare land changed into grassland was nearly five times (15,733.63 km2) that of grassland changed into bare land (3288.31 km2) during 2000–2010. In the second 11-year period, the ratio was again more than 2, at about 19,679.31 and 8805.19 km2, respectively.
From the spatial characteristics of the LUCC conversion process shown in Figure 3, it can be seen that the change of grassland shows spatial heterogeneity. During the first 11 years, grassland areas showed a net increase of 14,287.31 km2 (2.66%). The new grassland was mainly transformed from bare land in the city of Bayannur, cultivated land in south Xilingol League, and forest along the Great Hinggan Mountains. The losses of grassland mainly took place to the south of the city of Baotou, where it was transformed into shrubland, and in the Great Hinggan Mountains, where it was transformed into forest. There was also 5173.50 km2 of grassland changed into cultivated land, which took place scattered throughout Inner Mongolia. During the second 11 years, although the total area of grassland decreased by 9558.63 km2 (1.73%), there was still 19,679.31 km2 of bare land that was converted into grassland, which took place mostly in north Xilingol League and to the north of the city of Ulanqab. Furthermore, 10,865.88 km2 of cultivated land changed into grassland, which took place mainly in central Inner Mongolia and the city of Chifeng. However, a large amount of grassland was changed into cultivated land in eastern Inner Mongolia, especially to the east of the city of Chifeng, around the city of Tongliao, and to the west of the city of Hulun Buir. Furthermore, 7067.31 km2 of grassland changed into forest, which took place mainly in the Great Hinggan Mountains, and 8805.19 km2 of grassland degenerated into bare land, which took place mainly in western Inner Mongolia.

3.2. Spatial and Temporal Distribution of Grassland NPP in Inner Mongolia

3.2.1. Validation of the NPP Calculation

The estimated NPP by CASA model was verified through the observed NPP of four FLUXNET sites from the FLUXNET2015 datasets and ChinaFLUX datasets, located in Inner Mongolia during the growth seasons over 2004 to 2009 and 2011. As shown in Figure 4, the estimated NPP presents a high correlation with the observed NPP, with a regression coefficient of 0.64 (p < 0.001) and root mean square error (RMSE) of 24.31 g C/m2, which represents that the modified CASA model has a high precision and could meet the accuracy requirements in this study.

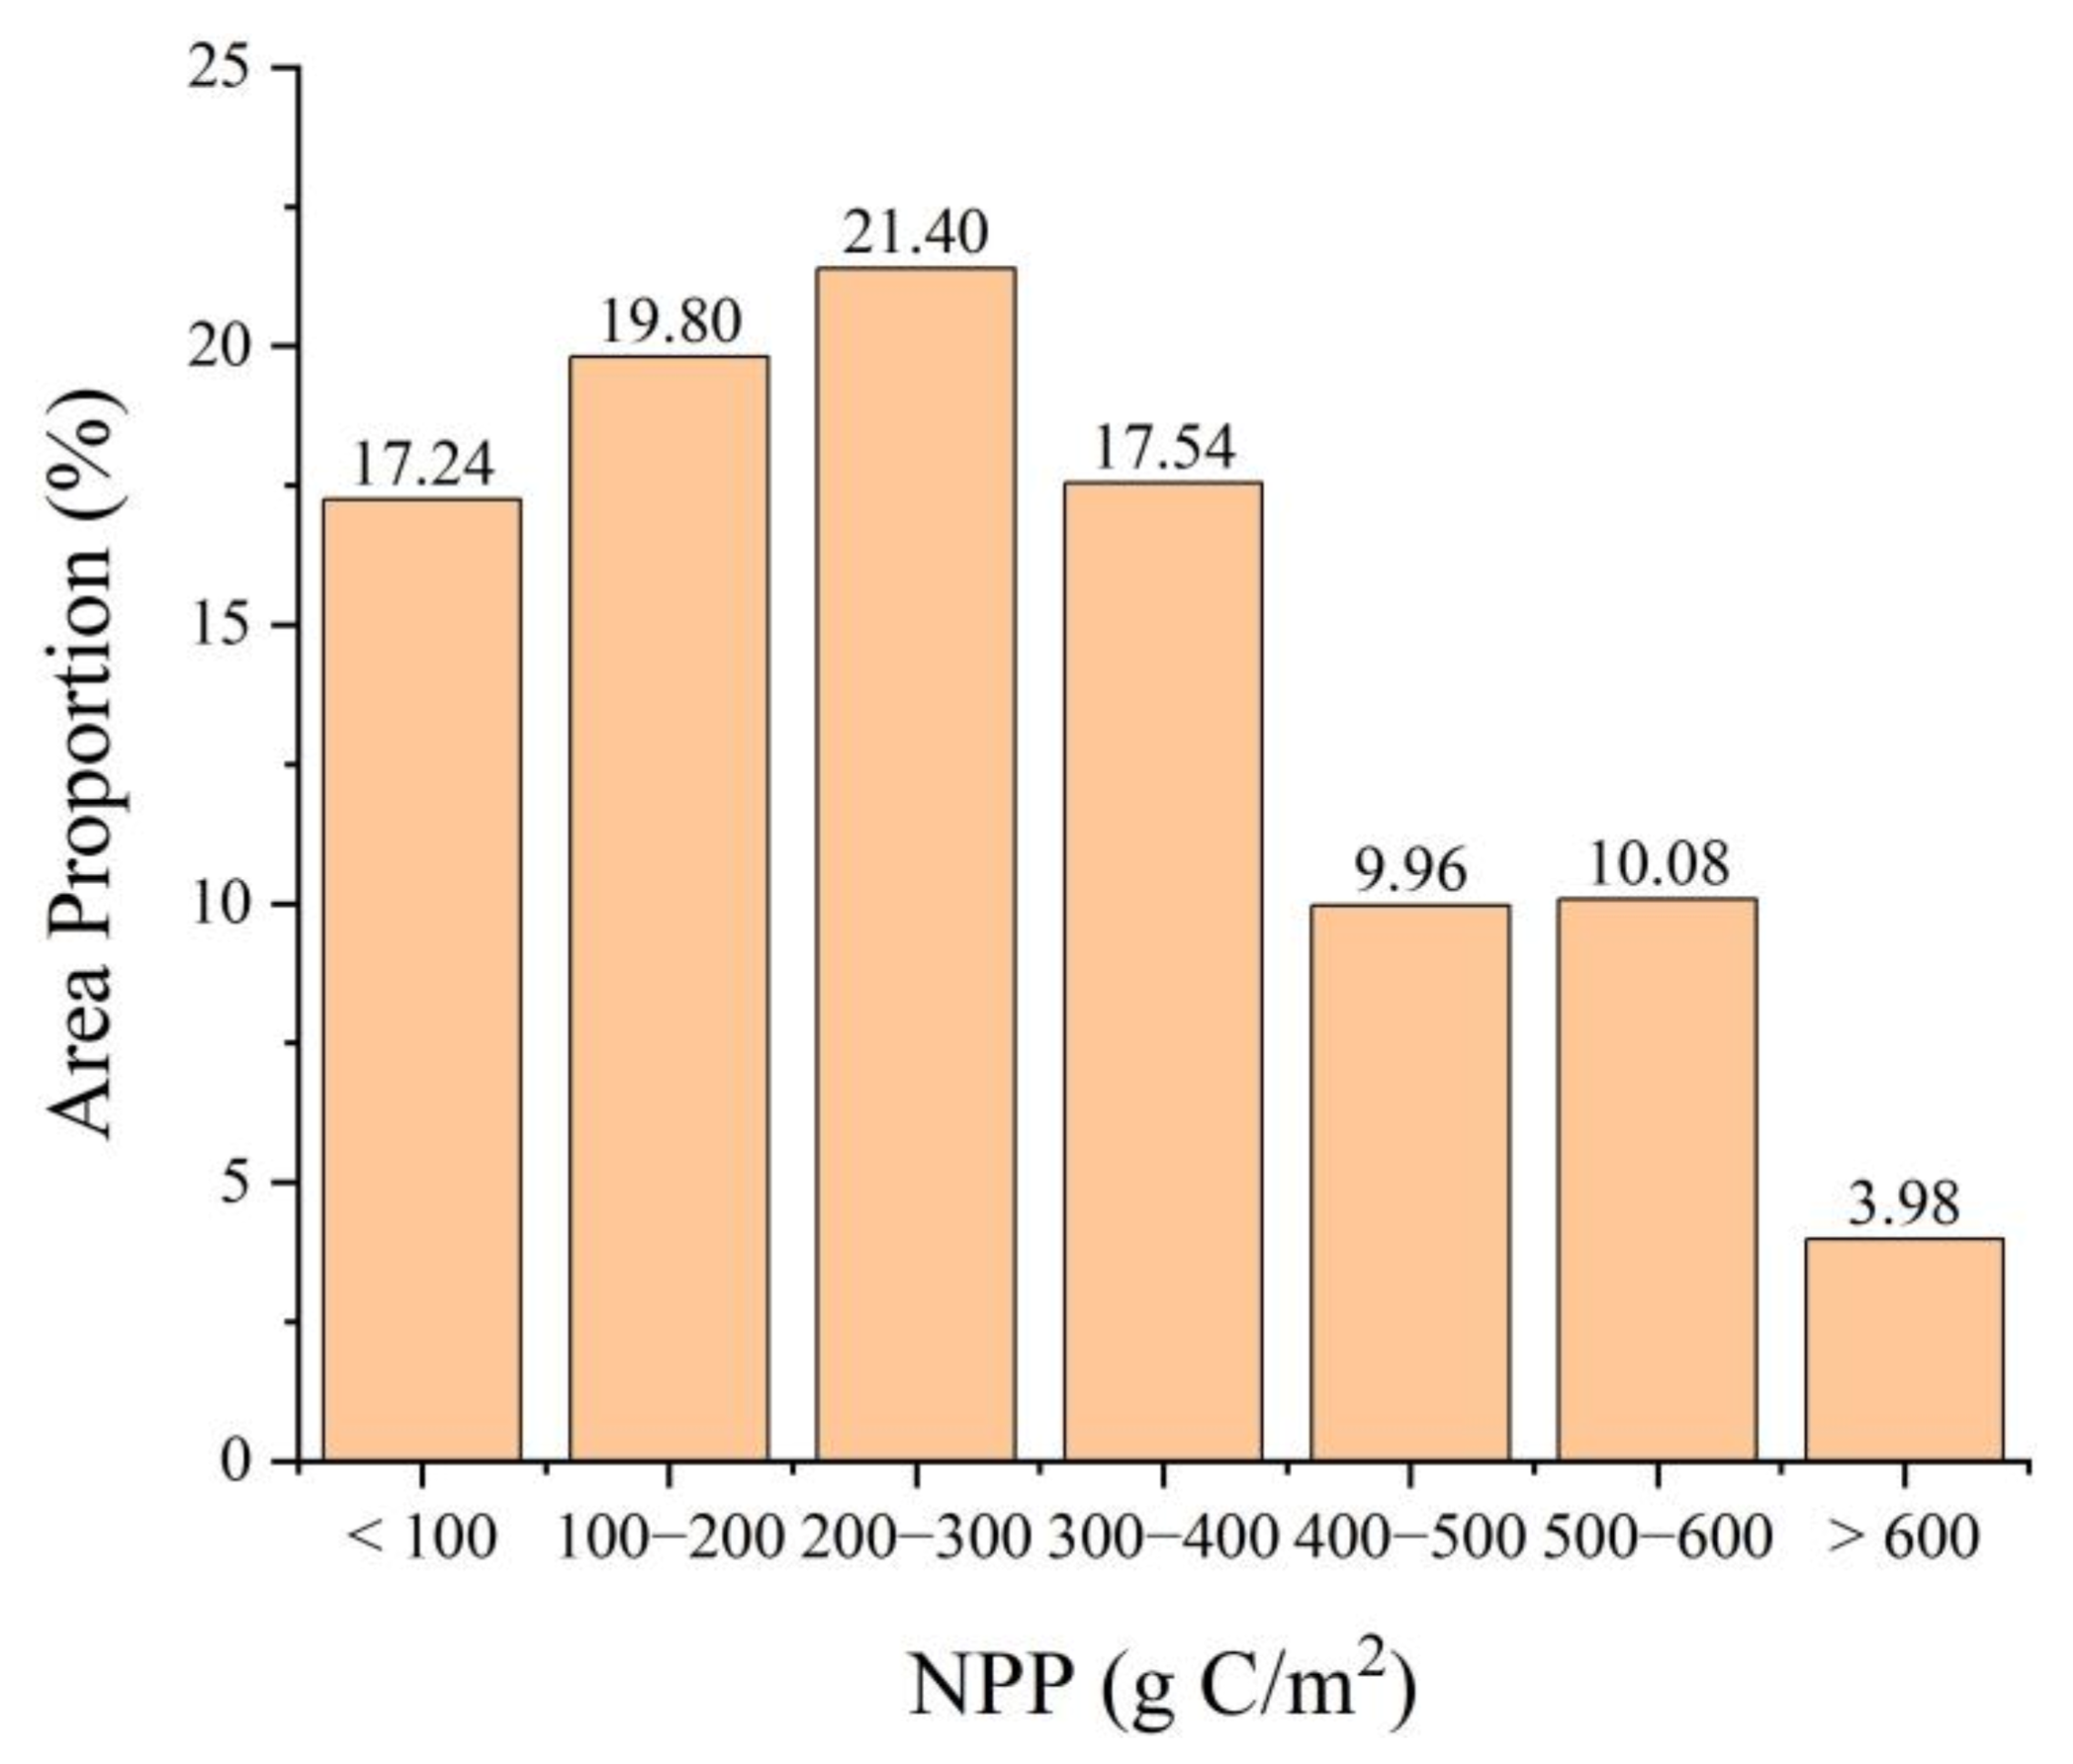
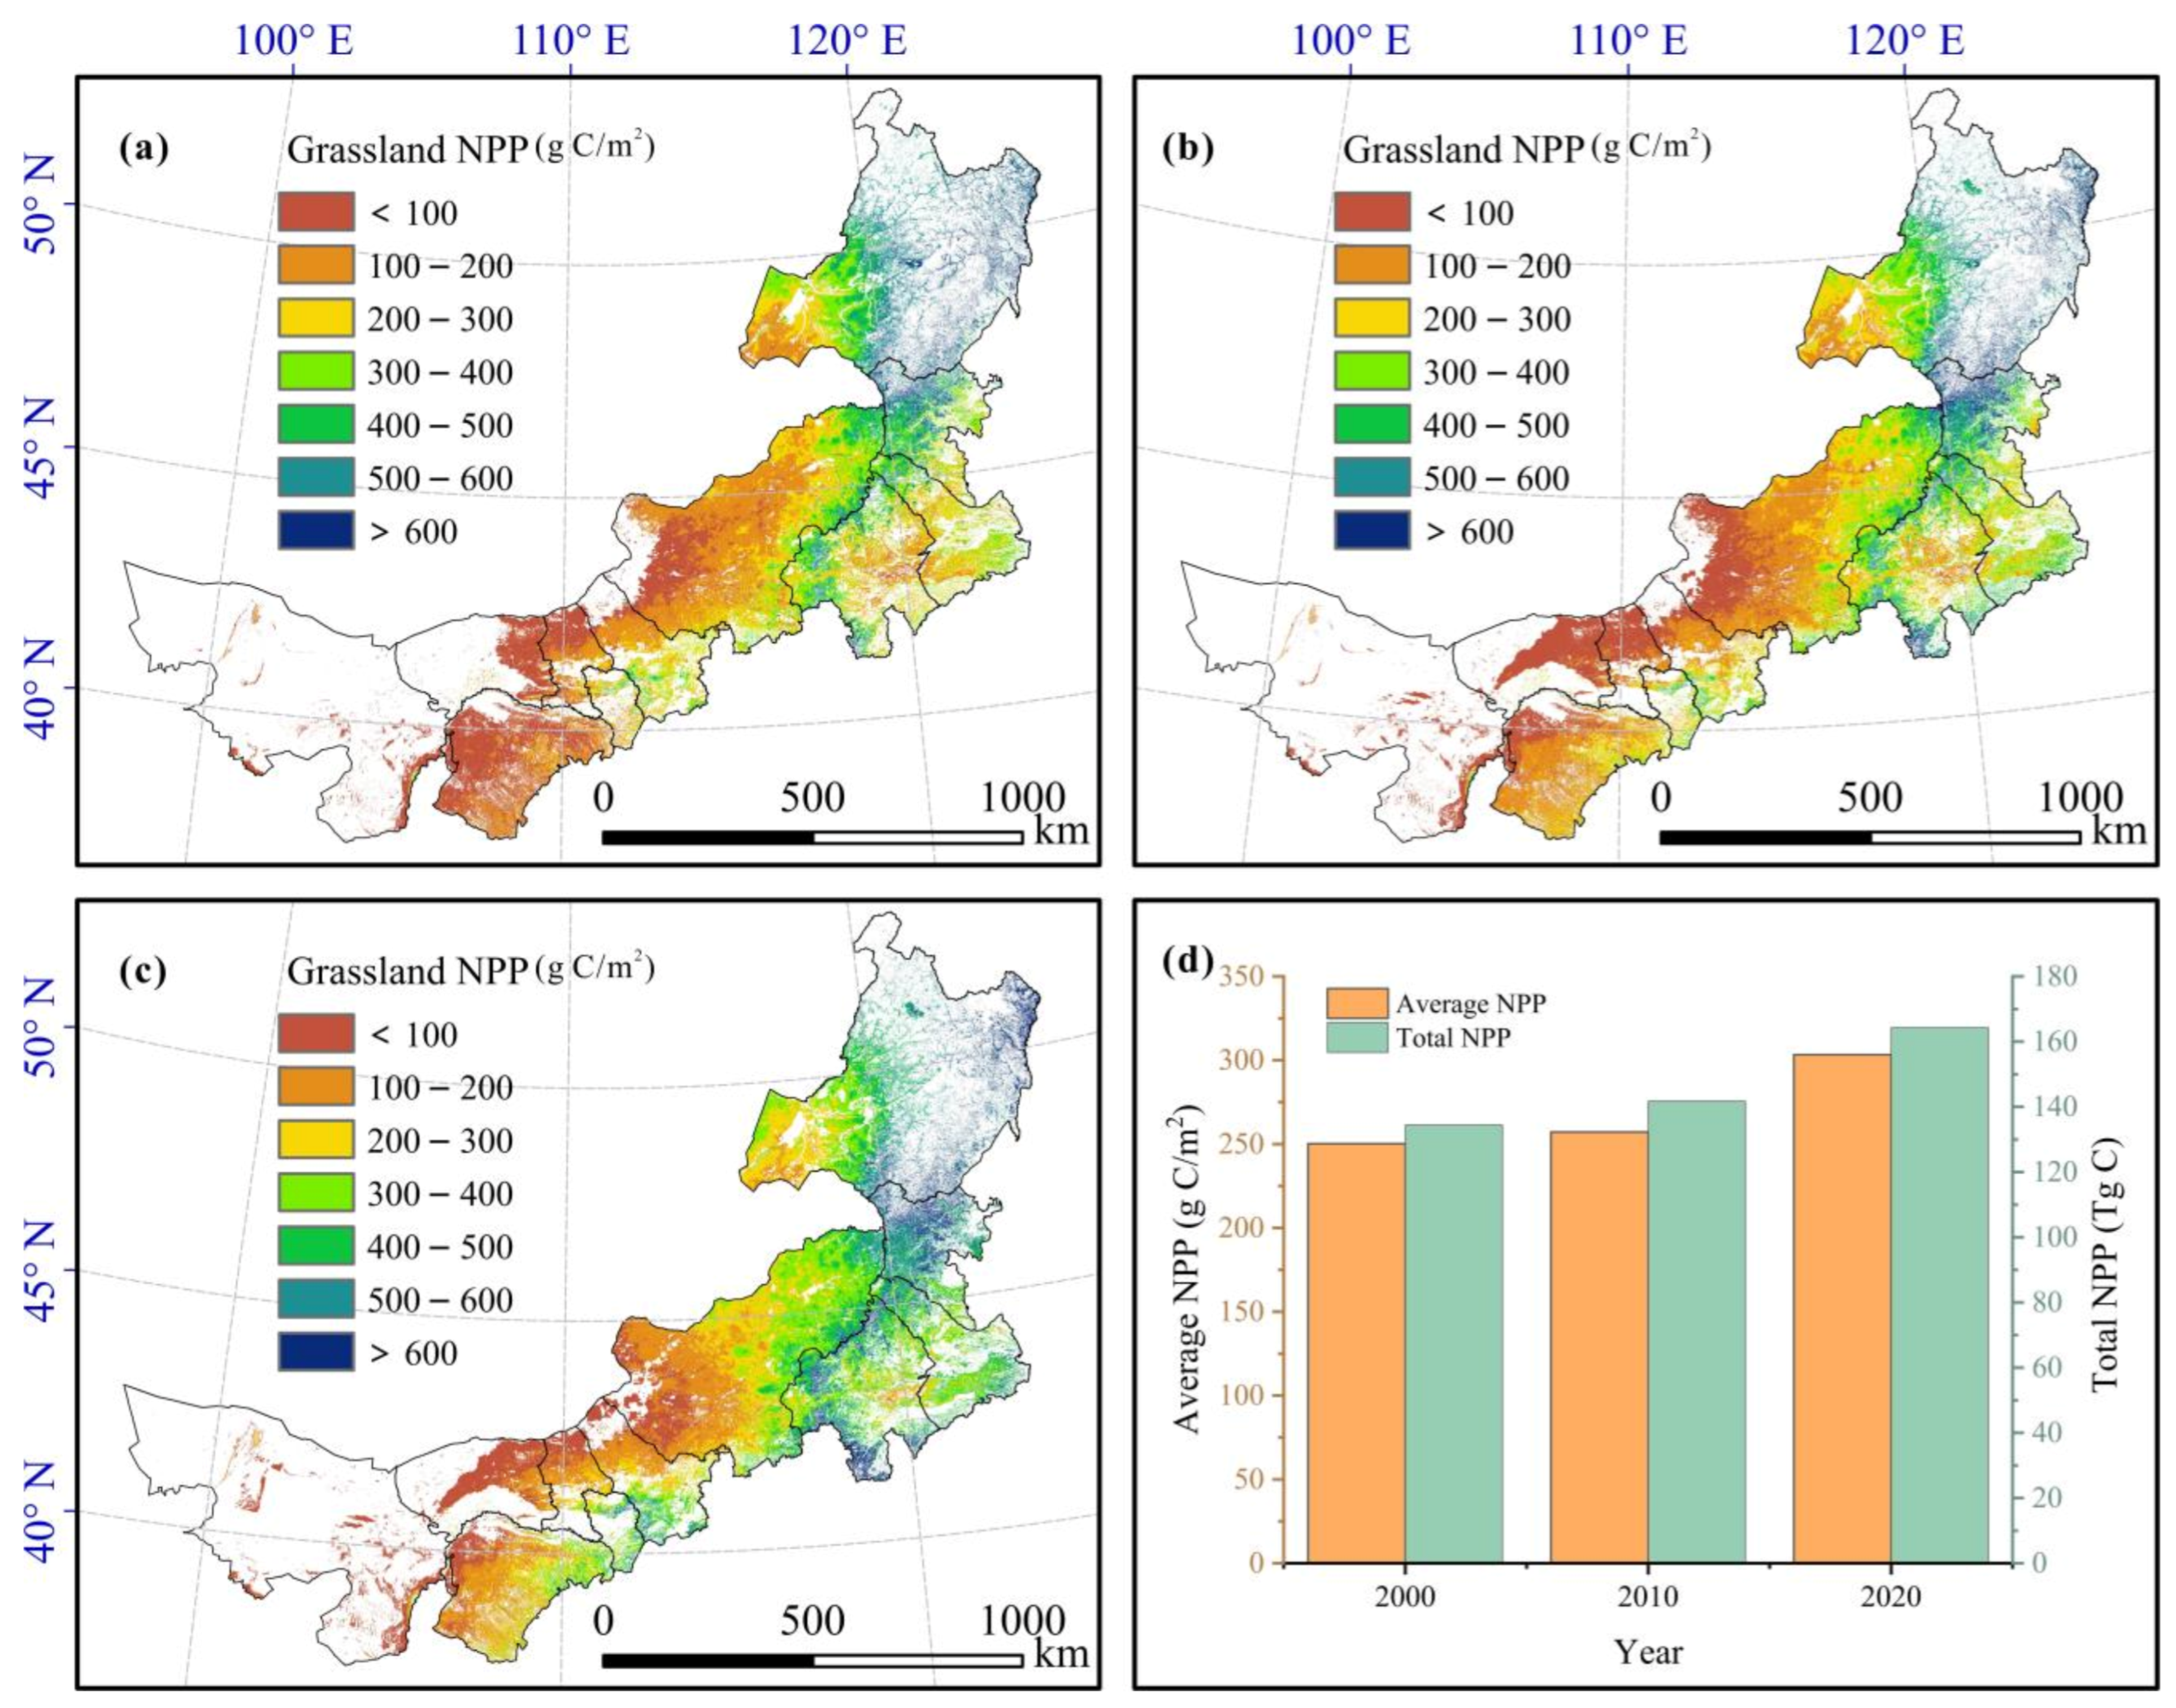
3.2.2. Characteristics of the Grassland NPP Distribution

The temporally averaged NPP in the study area over the 21 years is 278.63 g C/m2, and the NPP shows an increasing trend from south-west to north-east, as shown in Figure 5. The eastern part of Inner Mongolia has the highest NPP, followed by central Inner Mongolia, while western Inner Mongolia has the lowest productivity. As shown in Figure 6, the statistical results for the average NPP show that the NPP in most areas is between 100 and 400 g C/m2, accounting for 58.74%. There are also a few grassland areas which have an NPP of more than 600 g C/m2, accounting for 3.98%. The total NPP in Inner Mongolia grassland is 169.72 Tg C (1 Tg = 1012 g) for each year.
Figure 7 shows the spatial distribution of the CV of the NPP distribution during the study period, for which the average CV of the NPP in the study area is 0.26. There is significant spatial heterogeneity in the temporal variation of NPP over the 21 years. Areas with high CV values are mainly distributed in the north of the Greater Khingan Range/Yinshan Mountains and north-west Inner Mongolia, while the grassland NPP in eastern Inner Mongolia shows little interannual change.

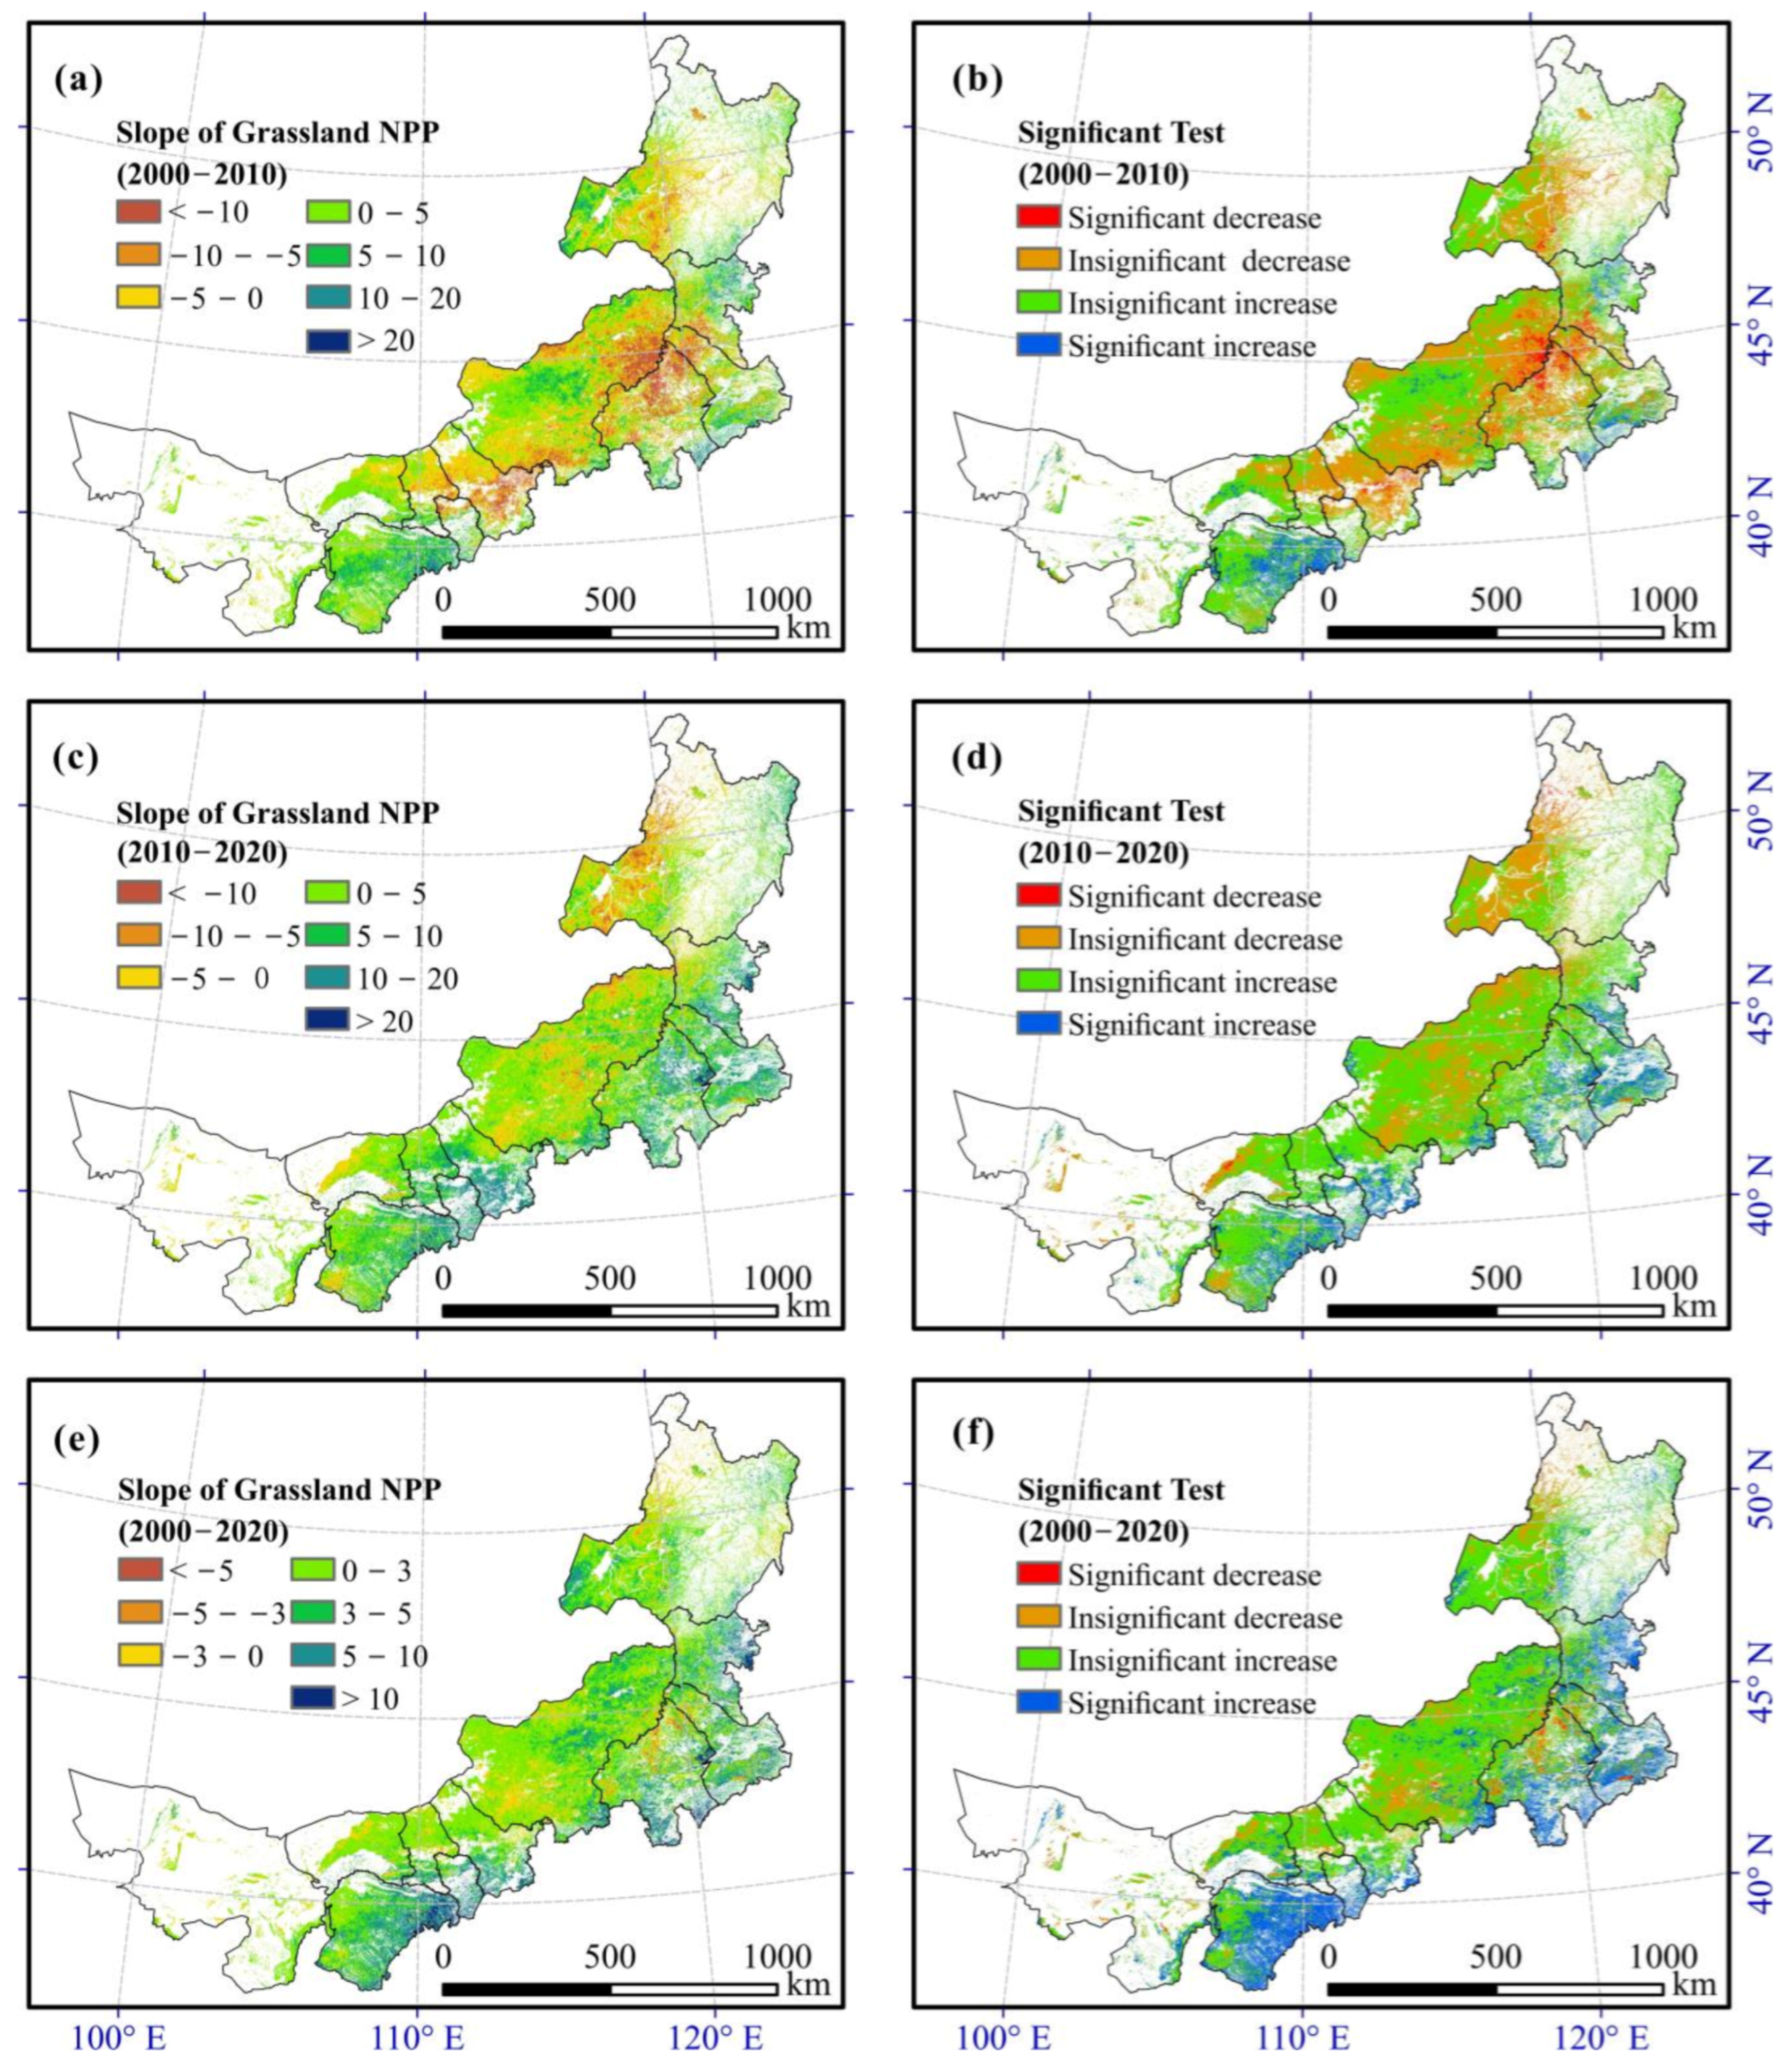
3.2.3. The Change Trend Distribution of Grassland NPP

The relationships between the interannual fluctuations of grassland NPP and meteorological factors in Inner Mongolia from 2000 to 2020 are shown in Figure 8. The NPP ranges from 246.15 g C/m2 in 2001 to 323.96 g C/m2 in 2013. The change trend obtained by the OLS method shows a slight increasing trend of 2.43 g C/(m2∙yr) (p < 0.01), and that obtained by the Theil–Sen method shows a slight increasing trend of 2.16 g C/(m2∙yr) (p < 0.05). In general, the NPP of the Inner Mongolia grassland gradually improved from 2000 to 2020.
From an overall perspective, as shown in Figure 8, the highest grassland NPP appeared in 2013, when there was adequate precipitation, suitably low temperatures, and abundant sunshine. The other periods of higher NPP were in 2012, 2018, 2019, and 2020, when the climatic conditions were better than average. The lowest grassland NPP was in 2001, when there was a lack of precipitation. The other years of lower NPP were 2000, 2007, and 2016. Extreme weather conditions occurred in these years, i.e., drought, high temperature, and lack of sunlight, respectively.
Although the growth trend of grassland NPP from 2000 to 2020 passes the significance test, the growth of NPP was not continuous and showed temporal heterogeneity (Table 5). From 2000 to 2010, the growth rate of grassland NPP was slower and more unstable, with opposite change trends obtained by the two methods, while the growth rate during 2010–2020 was faster.
In order to better clarify the spatial and temporal variation of grassland NPP in Inner Mongolia, the different time series of grassland NPP were analyzed by the use of the Theil–Sen method in this study. As shown in Figure 9e,f, there was a positive annual NPP growth tendency in most areas in the Inner Mongolia grassland from 2000 to 2020. About 83.22% of the total grassland showed an increasing trend for NPP, of which 32.28% showed significant growth at the p-value of 0.05. The grassland areas that showed significant growth are mainly distributed in east Ordos, south Chifeng, south Tongliao, and Hinggan. At the same time, about 16.78% of the total area presented a decreasing trend for NPP, which took place mainly in west Xilingol and north Chifeng, but most of this change (93.24%) was not significant.
In order to show more details of the short-term changes, the spatial and temporal variation of grassland NPP in the first 11 years and the second 11 years was also compared in this study. Figure 9a,b shows the results for 2000–2010. The changes of most of the grassland do not pass the significance test at a p-value of 0.05. About 44.85% of the grassland showed an insignificant increasing trend for NPP during this period, which took place mainly in west Ordos, middle Xilingol, and west Hulun Buir. Another 43.91% of the grassland showed an insignificant decreasing trend for NPP, which took place mainly in Baotou, Ulanqab, south-west Xilingol, and along both sides of the Greater Khingan Range. Only 8.08% of the grassland showed a significant growth trend for NPP, which took place mostly in east Ordos, while 3.16% showed a significant decrease, which took place mostly along the Greater Khingan Range. Figure 9c,d shows the results for 2010–2020. Compared with the first 11 years, the spatial distribution of the change trend of NPP changed to a certain extent, and more grassland (72.34%) showed an increasing trend for NPP. About 13.36% of the total area passed the significance test, which occurred mainly in east Ordos, south Chifeng, and south Tongliao. These three places maintained a significant growth trend from 2000 to 2010 and 2010 to 2020. Furthermore, the area of grassland NPP decline greatly reduced during this period, with less than 1% of the grassland showing a significant decreasing trend. The grassland NPP growth status greatly improved in Xilingol and along the Greater Khingan Range.

3.3. Influence of LUCC on the Change of Grassland NPP in Inner Mongolia

Human activities obviously affect LUCC, which in turn influences the growth of vegetation and its NPP. The research by Liu et al. [82] showed that the global urbanization-induced decrease in global NPP offset 30% of the climate-driven increase over the same period. In this study, we applied the LUCC of 2000, 2010, and 2020 as a mask to extract the grassland NPP in the corresponding range, to analyze the influence of LUCC on the change of grassland NPP.
As Figure 10 shows, the grassland NPP maintained an increasing trend in 2000, 2010, and 2020. The average NPP increased from 250.28 g C/m2 in 2000 to 257.13 g C/m2 in 2010, and then to 303.25 g C/m2 in 2020. The total NPP in Inner Mongolia was 134.40, 141.75, and 164.28 Tg C in 2000, 2010, and 2020, respectively. In terms of the spatial distribution, the area of medium-level NPP (200–400 g C/m2) increased from 2000 to 2020, accounting for 32.62%, 36.59%, and 37.47% in 2000, 2010, and 2020, respectively, which was obvious in north Xilingol, Chifeng, and Tongliao. This indicates that the area of grassland with medium to high quality has increased.
From the perspective of the different LUCC changes (Table 6), the different types of LUCC conversion had various effects on the grassland NPP. From 2000 to 2010, 24016.81 km2 of grassland was transferred to other land-use types, causing a loss of 8.29 Tg C in NPP, while 38,304.13 km2 changed to grassland, bringing an addition of about 9.65 Tg C in NPP. Although in terms of area, the grassland area increased, but the average NPP of the lost grassland (345.23 g C/m2) was higher than that of the added grassland (251.91 g C/m2). Taking the conversion between bare land and grassland as an example, from 2000 to 2010, grassland changing from bare land accounted for 15,733.63 km2, bringing 0.74 Tg C in NPP. Although grassland changing to bare land only accounted for 3288.31 km2, it caused a loss of 0.35 Tg C in NPP. This shows that although the lost grassland was a lesser area, the quality was good, while the added grassland was a greater area, but the quality was poor. From 2010 to 2020, the area of lost grassland increased (48,920.19 km2 and 14.96 Tg C NPP) and was more than the area of added grassland (39,361.56 km2 and 10.73 Tg C NPP). As a result of human reclamation, a large area of grassland, i.e., 26,495.25 km2 (54.16% of the total lost area), was converted into cultivated land, which led to a loss of 8.36 Tg C in NPP. During this period, the average NPP of grassland changed to bare land was 100.72 g C/m2, and the average NPP of grassland changed from bare land was 82.48 g C/m2. In general, the quality difference between the new and lost grassland still existed, but there was some improvement compared with the period of 2000–2010. However, the total area of grassland decreased during 2010–2020.
Overall, from 2000 to 2020, 59,141.81 km2 of grassland was changed into other land-use types, resulting in a loss of 17.63 Tg C in NPP. As a comparison, 63870.50 km2 of other land-use type changed into grassland, but this led to an addition of only 16.38 Tg C in NPP. In total, 26130.44 km2 grassland (44.18% of the total lost area) of high quality changed into cultivated land, for which the average NPP was 283.38 g C/m2. A further 33,086.56 km2 of bare land changed into grassland (51.80% of the total added area), with a poor average NPP of 69.97 g C/m2.

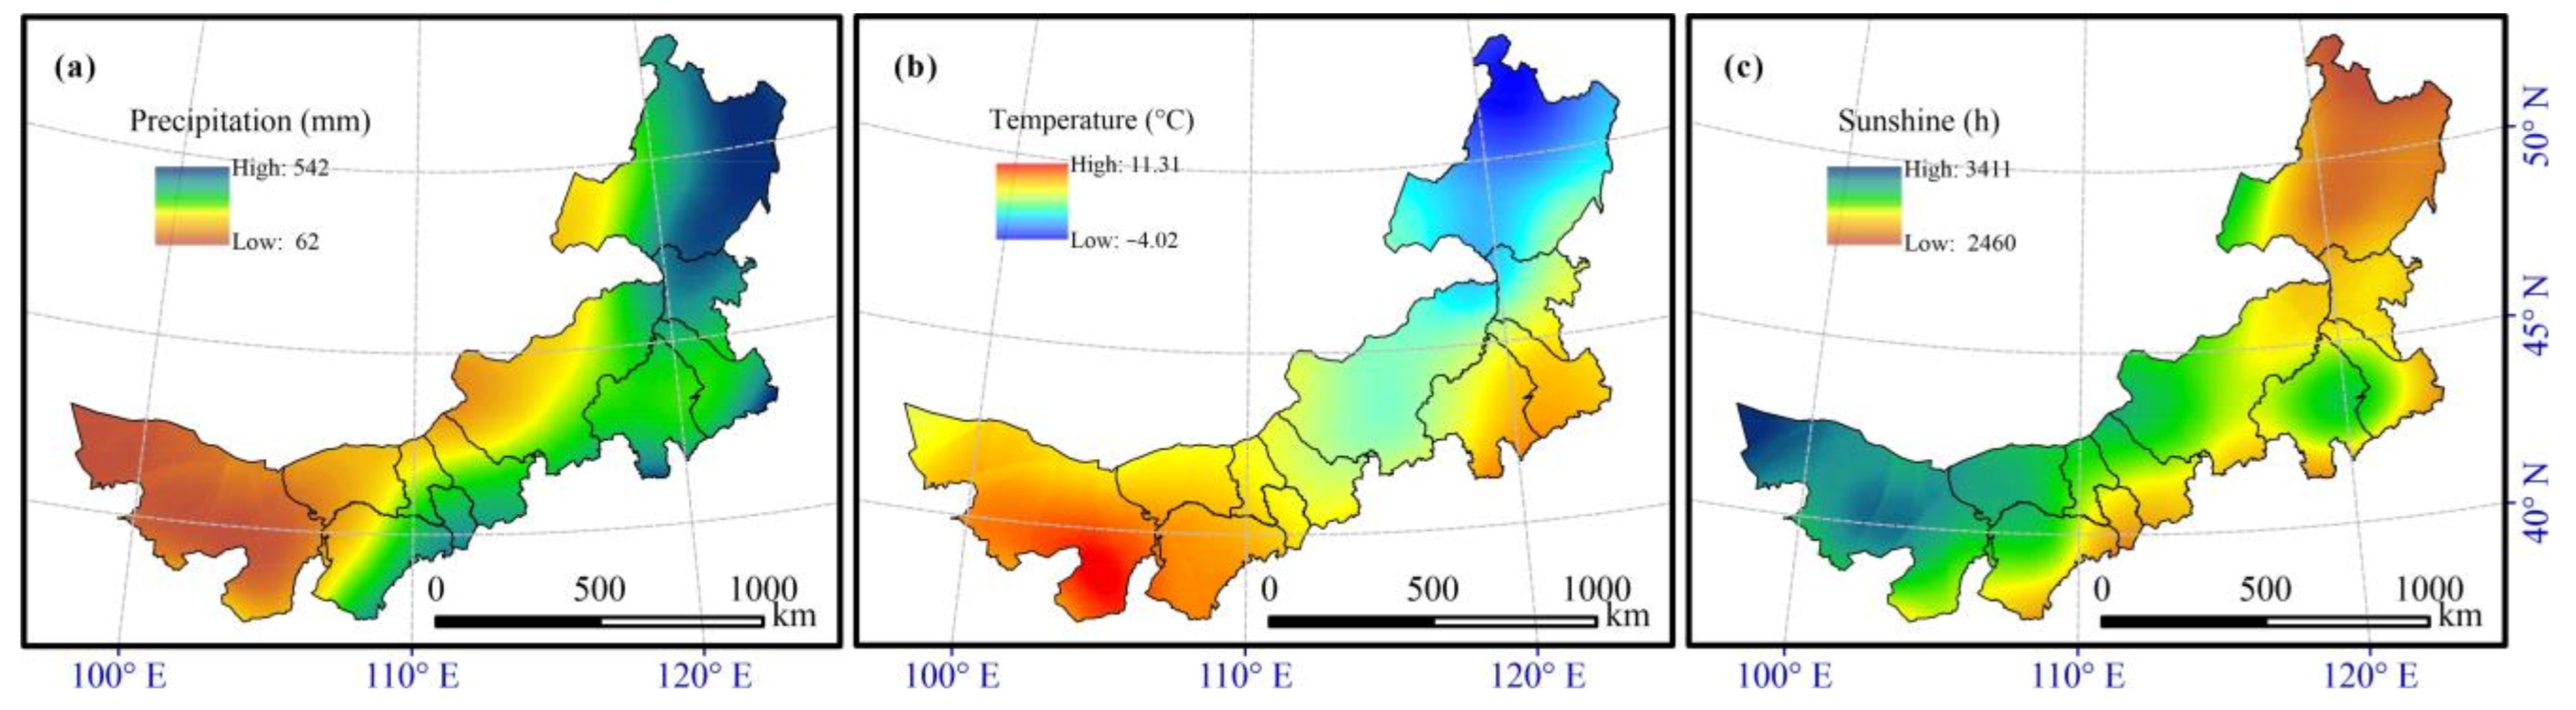
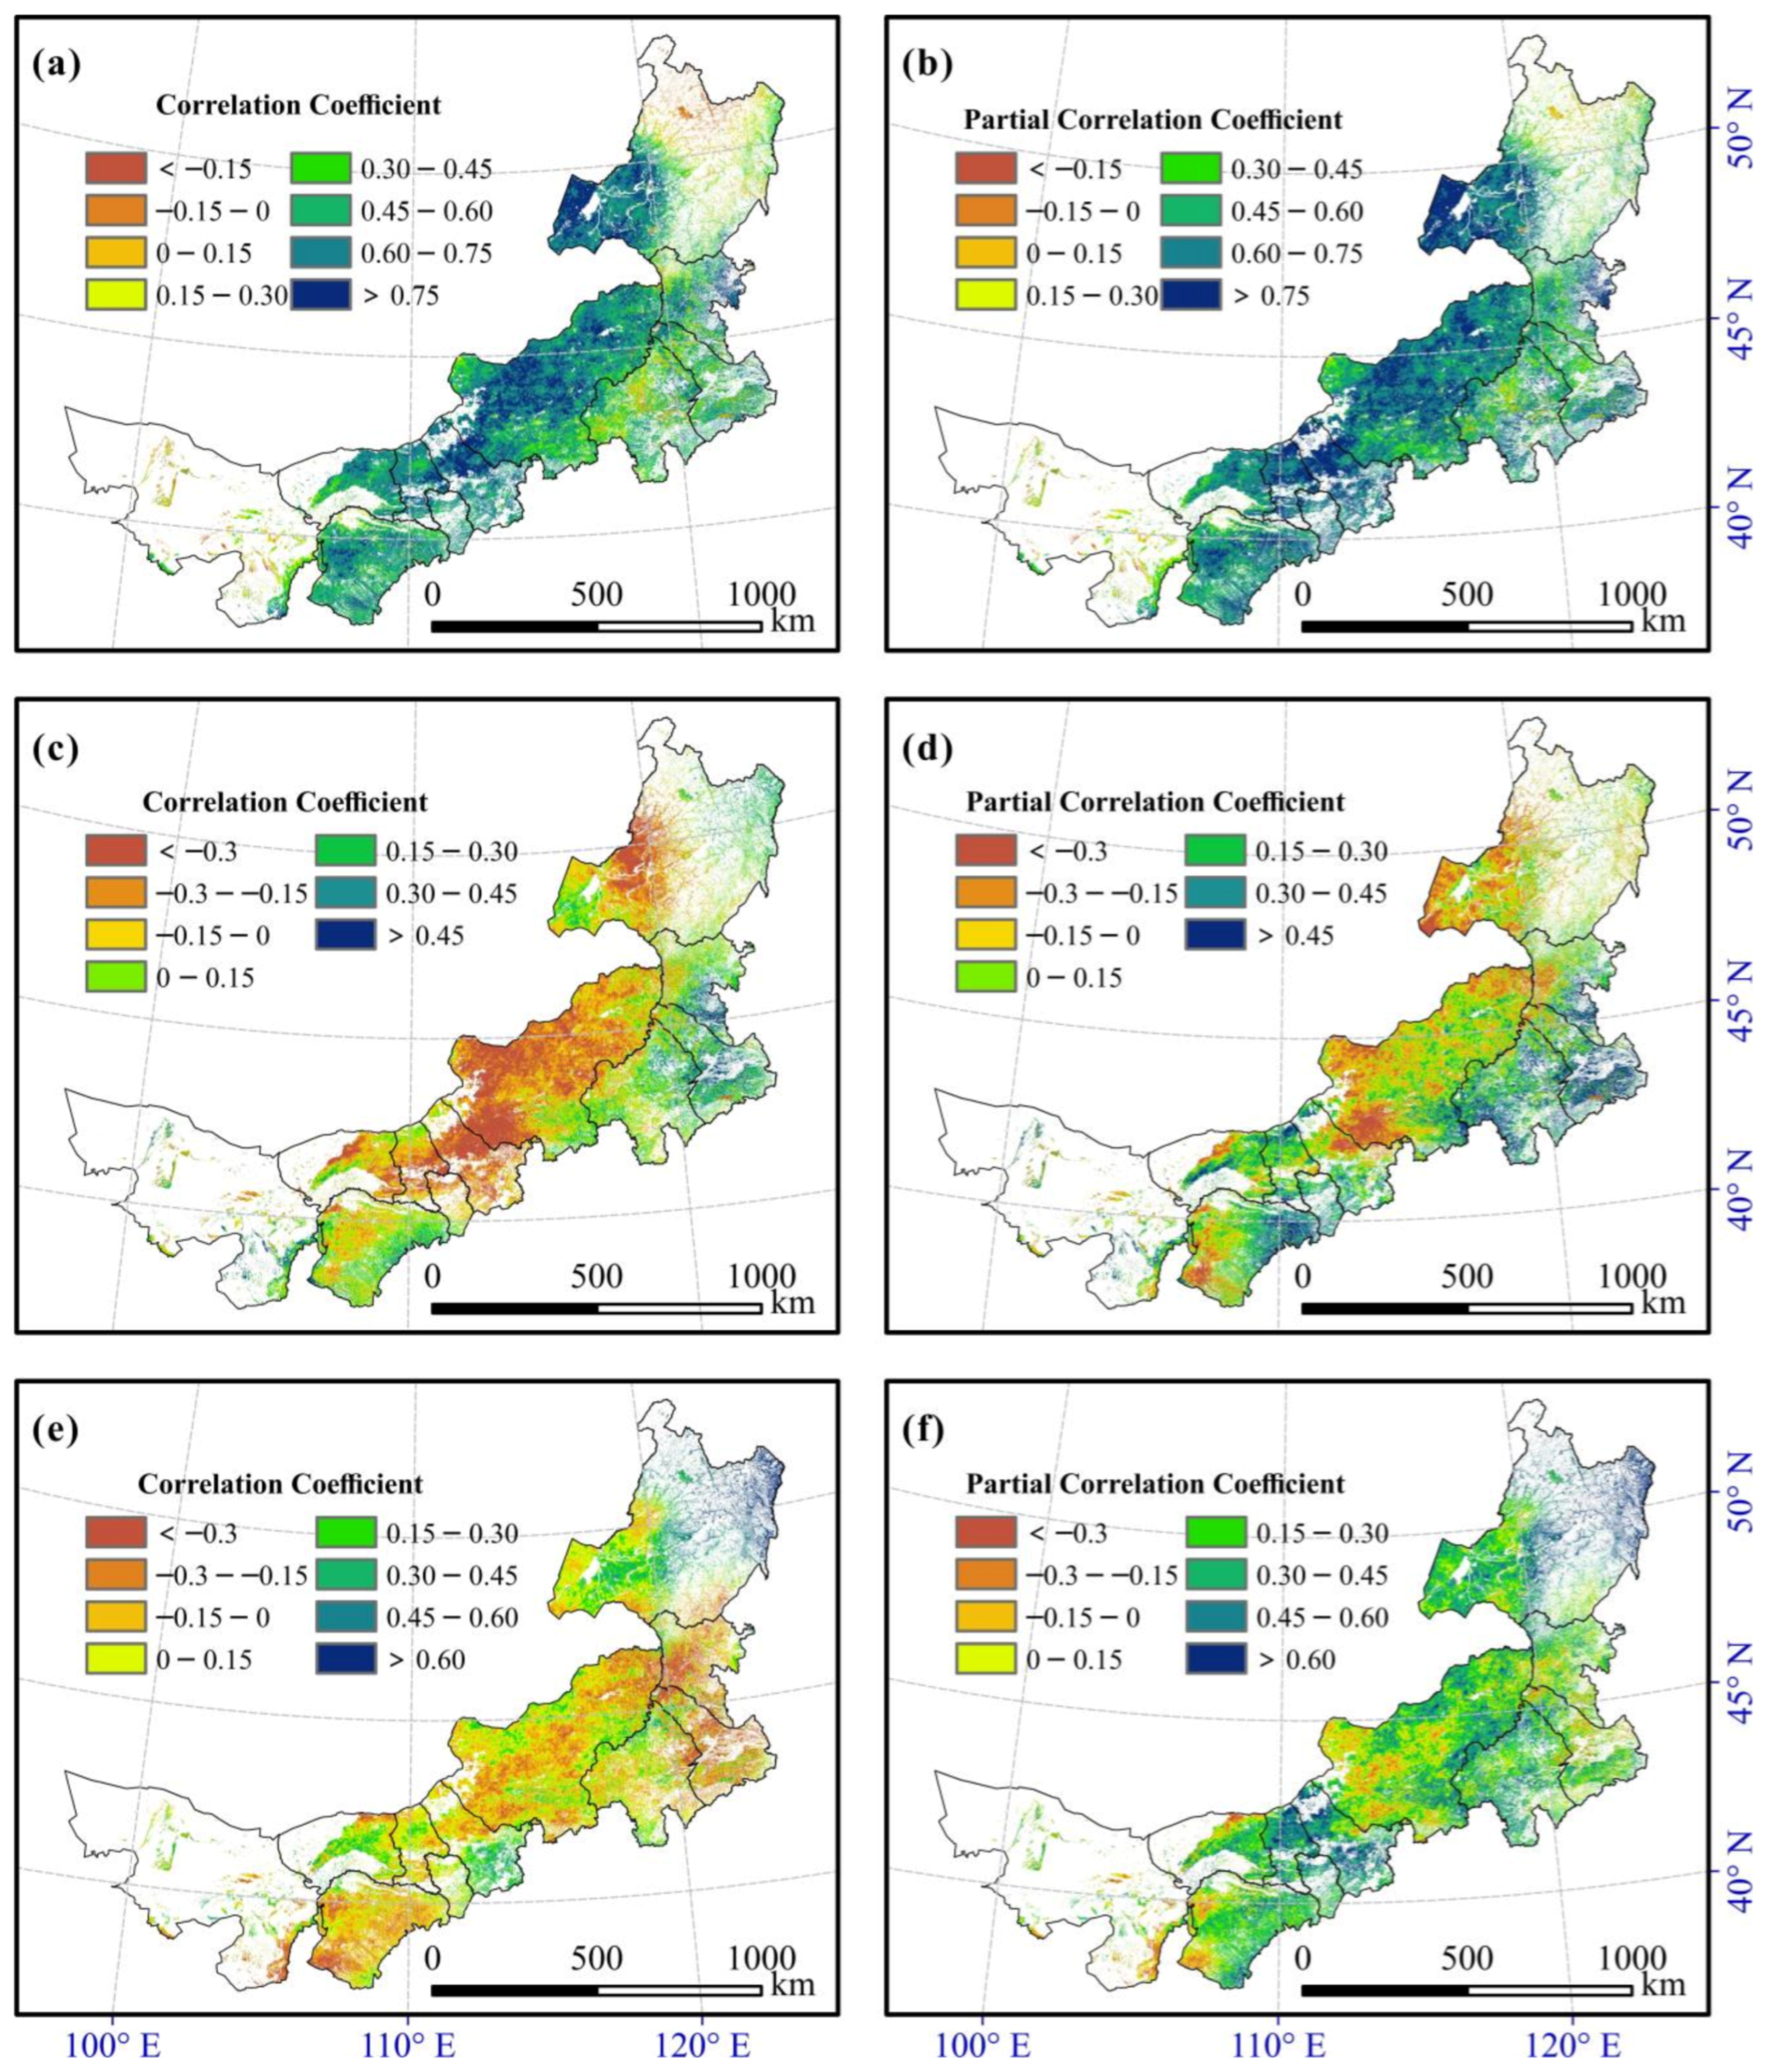
3.4. Correlation between Grassland NPP and Meteorological Factors

Meteorological factors, i.e., precipitation, temperature, and sunshine duration, are important factors affecting grassland NPP [83]. Figure 11 shows the map of the average meteorological factors in Inner Mongolia from 2000 to 2020. In order to investigate the main climatic driving factors for grassland NPP in Inner Mongolia during 2000–2020, the spatial distribution of the correlation coefficients and partial correlation coefficients was considered in this study.
As shown in Figure 12a,b, a positive correlation between grassland NPP and precipitation is seen in 97.06% of the total area. When removing the influence of the other meteorological factors, about 98.58% of the total shows a positive relationship. Thus, precipitation is the main factor affecting grassland growth in Inner Mongolia. According to the statistics, 70.59% of the grassland area has a higher partial correlation coefficient than correlation coefficient, which indicates that there is a lack of precipitation in most areas of the Inner Mongolia grassland. Thus, an increase in precipitation can greatly promote the growth of the grassland and increase the NPP. The areas with high partial correlation coefficients are distributed in east Ordos, north Xilingol, and west Hulun Buir. The correlation in the south side of the Greater Khingan Range is lower than that in the north side. However, the precipitation is generally sufficient in the south side, and when the precipitation is sufficient, the grassland NPP can be affected by the other meteorological factors, and the effect of precipitation is weakened.
For temperature, the correlation between NPP and temperature is not consistent in spatial distribution, as shown in Figure 12c,d. About 61.80% of the total grassland area shows a negative correlation with temperature, and only 7.59% of the total grassland area shows a positive correlation coefficient of greater than 0.3. The areas with negative correlation are mainly concentrated in the north side of the Greater Khingan Range. When the influence of precipitation and sunshine duration is controlled, 79.19% of the total grassland area shows a certain improvement in the positive correlation between NPP and temperature, mostly in the north side of the Greater Khingan Range. Although Inner Mongolia is located at high latitudes, a higher temperature would cause more evaporation in arid areas with little precipitation, which would then make the natural environment more disadvantageous for the growth of grassland. In contrast, in the south side of the Greater Khingan Range, due to the humid climatic conditions, the warmer environment, to a certain degree, is conducive to the increase of NPP.
The correlation between NPP and sunshine duration also shows spatial heterogeneity (Figure 12e,f) and most areas are weakly correlated. The proportion of grassland NPP showing positive correlation and negative correlation with sunshine duration is 51.18% and 48.82%, respectively. Only 6.34% of the grassland has a negative correlation of greater than 0.3, and 10.93% has a positive correlation of greater than 0.3. However, the partial correlation is positive in most grassland areas, accounting for 87.41%, with 47.66% of the total grassland having a positive correlation of greater than 0.3. A small amount of negative partial correlation is found in west Xilingol and west Inner Mongolia. Due to the arid climate in Inner Mongolia, the sunshine leads to increased soil water evaporation, which affects the growth of the grassland. In addition, the sunshine time might be less affected by the undulating terrain in Inner Mongolia than precipitation and temperature, and there is no obvious difference in the correlation and partial correlation between the two sides of the Greater Khingan Range.
In general, at the scale of a single year, precipitation has the most obvious effect on grassland NPP in Inner Mongolia. Most of the grassland shows a strong positive correlation between NPP and precipitation. The second factor is the length of sunshine duration, showing a relatively weak positive correlation. The third factor is temperature. The influence of temperature is different on the different sides of the Greater Khingan Range.

4. Discussion

4.1. Uncertainty Analysis

According to the validation result, the correlation coefficient between the estimated NPP and the observed NPP from FLUXNET2015 and ChinaFLUX was 0.64. FLUXNET provides the monthly observed data, but grasslands in arid regions tend to have low NPP by month, which resulted in NPP values generally in the low value region. In the meantime, the number of FLUXNET stations is limited. Moreover, it was reported that the spatial scale of remote sensing images has an impact on the estimation of GPP/NPP [84]. Limited to the spatial resolution, the NPP for a pixel represents an area of 250 × 250 m2, which impacts the accuracy verification result. The published estimation results for grassland NPP in Inner Mongolia were used to verify the estimated NPP in this work (Table 7). The estimation results obtained in this study are close to those of the previous studies, that is, the results reported in this paper are reliable and could be utilized for future research.
For the uncertainties, the maximum light use efficiency L U E m a x in this work refers to the work of Zhu et al. [72]. In the original CASA model, the maximum light use efficiency L U E m a x was assigned a fixed value, 0.389 g C · M J 1 [31]. Since the value of L U E m a x has a great influence on the estimated NPP, its value is controversial [31,87]. Some research tried to modify the value of L U E m a x based on field sampling data [10,88]. In future research, L U E m a x should be modified using more flux measurement sites.

4.2. LUCC and the NPP Response to LUCC

In this study, we analyzed the LUCC in Inner Mongolia and its effect on the grassland NPP in 2000, 2010, and 2020. The grassland area increased by 2.66% from 2000 to 2010, and then decreased by 1.73% from 2010 to 2020. Hu and Batu [22] found grassland of a low quality developed to a higher quality in Inner Mongolia from 1990 to 2015 based on their LUCC analysis result for dense grassland, moderate grassland, and sparse grassland. Tong et al. [89] quantitatively monitored the land use changes in Inner Mongolia and found the area of high- and moderate-coverage grassland decreased while the area of low-coverage grassland increased during 2000–2015. Li et al. [90] also found that the area change trend of high- and low-coverage grassland is opposite during 2000–2012. In this study, we found the main outflow (59,141.81 km2 in total) was grassland turned into cultivated land (26,130.44 km2), and the main inflow (63,870.50 km2 in total) was from bare land to grassland (33,086.56 km2) over the 21 years. These above studies suggest that the combined effects of climate change and human activities caused the NPP frequent changes, so that both long and short time series of monitoring are required. Notably, it has been widely reported that the ecological environment of the Mu Us Desert in Ordos has been greatly improved because of a series of ecological restoration policies in the past decades [91,92], which is consistent with our results. Therefore, the impact of human activities on grasslands quality has both positive and negative effects.
Although more land changed into grassland, the NPP of the increased grassland was lower than that of the lost grassland. In total, the NPP loss caused by LUCC was greater than the NPP growth caused by LUCC, at 17.63 and 16.38 Tg C, respectively. If the increase of grassland NPP caused by climatic factors is considered, the NPP loss caused by human activities (mainly reclaiming grassland) would be even greater. Although people have made great efforts to make the bare land green and turn it into grassland, the quality of these new grassland areas is on the low side. Thus, it is also important to protect the existing grassland from reclamation and desertification. Moreover, to explore the quality of grass, the higher time resolution and finer-grained vegetation types should be included in the future. All grassland ecosystem management projects should be evaluated by quality indices, such as NPP, and not just the area.

4.3. NPP Response to the Meteorological Factors

The correlation coefficient spatial distribution map (Figure 12) shows that precipitation was the main factor for grassland NPP in Inner Mongolia from 2000 to 2020, with which 97.06% of the total grassland showed a positive relationship. Most studies suggest that the precipitation is the most important meteorological factor which affected the change of grassland NPP in Inner Mongolia [41,83,86,93], which is consistent with the conclusion of our research. The increase of precipitation over the last 20 years has contributed to the overall increase in grassland NPP. The grassland NPP shows a negative correlation with temperature in the water-deficient area while the relationship will turn into positive when the water is enough.
Moreover, the correlation coefficients between precipitation and NPP in the north and south of the Greater Khingan Range have a certain difference of the strength. Combined with Figure 7, the changes of NPP in the different sides of the Greater Khingan Range are different significantly. For the two sides of the mountains, the differences in water and heat resources have a greater impact on grassland growth. In addition, as Wu et al. [94] summarized, human activities such as mining and reclamation had the most obvious impact on grassland NPP in west Xilingol during 2000–2018. More human activities can also weaken the response of grassland to meteorological factors, such as in the south side of the Greater Khingan Range.
Guo et al. [93] found that different grassland species had different responses to meteorological factors. Moreover, there is a time-lag in the response of vegetation to climatic factors [95], which is difficult to find on the annual scale. Thus, the changes of NPP in response to meteorological factors should be further analyzed on finer and longer time series data. In addition, the periodic law of meteorological factors should be taken into account, considering the high sensitivity of grassland to meteorological factors, especially for precipitation, which can avoid the inconsistent conclusion over a different study period.

4.4. Importance of the Segmented Long Time Series Study and GEE

As shown in Table 5, the trend of NPP was inconsistent over the two periods by Theil–Sen method. The different results and their significance between the two periods show that the change trend of grassland NPP over a short period of time might not be reliable. The change trend can be easily disturbed by one year of unusual increase or decrease and is determined by the selection of the start and end points. Furthermore, some short-term sudden changes may also be of interest, and should not be overlooked. The same situation also existed in the spatial distribution of NPP changes. For example, as shown in Figure 9, in west Hulun Buir, although there was no obvious decline in the area of grassland NPP at the scale of 21 years, different regions showed decreasing trends during the different periods (2000–2010 or 2010–2020). In other words, the grassland NPP decline in west Hulun Buir has not been stopped, but it has shifted within the region. However, it is difficult to find such a phenomenon in a long time series directly. Thus, it is of great importance to undertake trend research at an appropriate time scale, with both long and short time series, in order to find more comprehensive details of the NPP change trends. In this paper, not only was the long time series of 21 years (from 2000 to 2020) analyzed, but we also divided the long time series into two 11-year periods (from 2000 to 2010 and from 2010 to 2020) as short time series.
A large amount of remote sensing data and computational power are required for the long time series and large-scale spatiotemporal monitoring. In this study, the quantity and quality of the grassland in Inner Mongolia were evaluated by LUCC and NPP based on the GEE platform. The high-performance computing power and rich image resources of the GEE platform can be used for the long-term research of NPP in Inner Mongolia. The observed data from meteorological stations were applied in this study. However, the observation data from meteorological stations cannot be accessed conveniently for a larger scale study (e.g., a continental or global scale). Thus, for better and extensive monitoring of ecosystem growth changes, it may be easier and quicker to adopt the massive amount of remote sensing data and meteorological images available on the GEE platform [52,58].

5. Conclusions

The Inner Mongolia grassland is an important ecological barrier in northern China and the largest animal husbandry and dairy product base in China. It is of great importance to make a detailed analysis of the spatiotemporal change of the grassland in Inner Mongolia, to help formulate grassland management policies in the future. We applied the CASA model, combined with MODIS NDVI, the GlobeLand30 land-use type, and meteorological data based on the GEE platform, to evaluate the grassland NPP in Inner Mongolia during 2000–2020.
The results showed that the average grassland NPP was 278.63 g C/m2 and the growth trend was 2.43 g C/(m2∙yr) by the OLS method. Especially, the NPP of grassland in east Ordos and the south side of the Greater Khingan Range showed sustained and significant growth. Moreover, the grassland area increased during 2000–2010 and then decreased during 2010–2020. Although the total area of grassland increased during the whole study period, the NPP loss caused by LUCC was greater than the NPP growth caused by LUCC. Precipitation is the most important meteorological factor affecting the grassland NPP, followed by sunshine duration and temperature, and there is a positive relationship between NPP and precipitation in most grassland.
Our result shows the grassland ecosystem in Inner Mongolia improved, overall, during 2000–2020, but more attention should be paid to the reclamation of grassland and preventing new grassland from desertification again. Moreover, for future studies on grassland NPP, the periodic variation of precipitation could be taken into account. For other land-cover types, both long time series study and short time series change analysis should be considered for the spatio-temporal study of the NPP. The specific time series change should refer to its main impact factors. The remote sensing cloud computing platform like GEE could help with long time series monitoring of ecosystems.

Author Contributions

Conceptualization, K.T.; data curation, R.J.; formal analysis, R.J.; methodology, R.J.; software, R.J., C.P. and L.X.; supervision, K.T.; validation, C.P.; visualization, X.W. and L.X.; writing—original draft, R.J.; writing—review and editing, R.J., K.T. and X.W. All authors have read and agreed to the published version of the manuscript.

Funding

This research was supported in part by the National Natural Science Foundation of China (No. 41871337 and No. 42171335).

Institutional Review Board Statement

Not applicable.

Informed Consent Statement

Not applicable.

Data Availability Statement

The data used in this study are openly available on the websites.

Acknowledgments

We would like to sincerely thank Google for providing the free Google Earth Engine platform for scientific research. We would also like to thank NASA LP DAAC for providing the MODIS NDVI data, the China Meteorological Data Service Center for providing the monthly climate data, the China National Geomatics Center for providing the GlobeLand30 data, the Resource and Environment Science and Data Center for providing the vector map of the study area, and the FLUXNET (CN-Du2, CN-Du3, and CN-Sw2) and ChinaFLUX (NMG) flux tower sites for sharing their observed datasets.

Conflicts of Interest

The authors declare no conflict of interest.

References

  1. Yang, Y.; Fang, J.; Ma, W.; Guo, D.; Mohammat, A. Large-scale pattern of biomass partitioning across China’s grasslands. Glob. Ecol. Biogeogr. 2010, 19, 268–277. [Google Scholar] [CrossRef]
  2. Mao, D.; Wang, Z.; Li, L.; Ma, W. Spatiotemporal dynamics of grassland aboveground net primary productivity and its association with climatic pattern and changes in Northern China. Ecol. Indic. 2014, 41, 40–48. [Google Scholar] [CrossRef]
  3. Deng, L.; Shangguan, Z.; Wu, G.; Chang, X. Effects of grazing exclusion on carbon sequestration in China’s grassland. Earth-Sci. Rev. 2017, 173, 84–95. [Google Scholar] [CrossRef]
  4. Lei, T.; Feng, J.; Lv, J.; Wang, J.; Song, H.; Song, W.; Gao, X. Net Primary Productivity Loss under different drought levels in different grassland ecosystems. J. Environ. Manag. 2020, 274, 111144. [Google Scholar] [CrossRef]
  5. Kemp, D.; Han, G.; Hou, X.; Michalk, D.L.; Hou, F.; Wu, J.; Zhang, Y. Innovative grassland management systems for environmental and livelihood benefits. Proc. Natl. Acad. Sci. USA 2013, 110, 8369–8374. [Google Scholar] [CrossRef] [Green Version]
  6. Millennium Ecosystem Assessment Board. Ecosystems and Human Well-Being: Desertification Synthesis; World Resources Institute: Washington, DC, USA, 2005. [Google Scholar]
  7. Faour, G.; Mhawej, M.; Nasrallah, A. Global trends analysis of the main vegetation types throughout the past four decades. Appl. Geogr. 2018, 97, 184–195. [Google Scholar] [CrossRef]
  8. Liu, J.; Zhang, Y.; Li, Y.; Wang, D.; Han, G.; Hou, F. Overview of grassland and its development in China. In Proceedings of the 21st International Grassland Congress/8th International Rangeland Congress, Hohhot, China, 5 July 2008. [Google Scholar]
  9. Chen, Y.; Fischer, G. A New Digital Georeferenced Database of Grassland in China; Interim Report IR-98-062/September; International Institute for Applied Systems Analysis (IIASA): Laxenburg, Austria, 1998. [Google Scholar]
  10. Jin, H.; Bao, G.; Chen, J.; Chopping, M.; Jin, E.; Mandakh, U.; Jiang, K.; Huang, X.; Bao, Y.; Vandansambuu, B. Modifying the maximal light-use efficiency for enhancing predictions of vegetation net primary productivity on the Mongolian Plateau. Int. J. Remote Sens. 2020, 41, 3740–3760. [Google Scholar] [CrossRef]
  11. Wang, Z.; Deng, X.; Song, W.; Li, Z.; Chen, J. What is the main cause of grassland degradation? A case study of grassland ecosystem service in the middle-south Inner Mongolia. Catena 2017, 150, 100–107. [Google Scholar] [CrossRef]
  12. Pan, Q.; Xue, J.; Tao, J.; Xu, M.; Zhang, W. Current status of grassland degradation and measures for grassland restoration in northern China. Chin. Sci. Bull. 2018, 63, 1642–1650. [Google Scholar] [CrossRef]
  13. Gang, C.; Zhou, W.; Chen, Y.; Wang, Z.; Sun, Z.; Li, J.; Qi, J.; Odeh, I. Quantitative assessment of the contributions of climate change and human activities on global grassland degradation. Environ. Earth Sci. 2014, 72, 4273–4282. [Google Scholar] [CrossRef]
  14. Xue, Z.; Kappas, M.; Wyss, D. Spatio-temporal grassland development in Inner Mongolia after implementation of the first comprehensive nation-wide grassland conservation program. Land 2021, 10, 38. [Google Scholar] [CrossRef]
  15. Li, X.; Gao, J.; Brierley, G.; Qiao, Y.; Zhang, J.; Yang, Y. Rangeland degradation on the Qinghai-Tibet Plateau: Implications for rehabilitation. Land Degrad. Dev. 2013, 24, 72–80. [Google Scholar] [CrossRef]
  16. Chen, H.; Shao, L.; Zhao, M.; Zhang, X.; Zhang, D. Grassland conservation programs, vegetation rehabilitation and spatial dependency in Inner Mongolia, China. Land Use Policy 2017, 64, 429–439. [Google Scholar] [CrossRef]
  17. Liu, Y.; Zhang, Z.; Tong, L.; Khalifa, M.; Wang, Q.; Gang, C.; Wang, Z.; Li, J.; Sun, Z. Assessing the effects of climate variation and human activities on grassland degradation and restoration across the globe. Ecol. Indic. 2019, 106, 105504. [Google Scholar] [CrossRef]
  18. Hu, Q.; Pan, F.; Pan, X.; Zhang, D.; Li, Q.; Pan, Z.; Wei, Y. Spatial analysis of climate change in Inner Mongolia during 1961–2012, China. Appl. Geogr. 2015, 60, 254–260. [Google Scholar] [CrossRef]
  19. Zhou, W.; Li, J.; Yue, T. Research Progress of the Grassland Carbon Cycle and Grassland Degradation in China; Springer: Singapore, 2019; pp. 1–16. [Google Scholar]
  20. Yan, Y.; Liu, X.; Wen, Y.; Ou, J. Quantitative analysis of the contributions of climatic and human factors to grassland productivity in northern China. Ecol. Indic. 2019, 103, 542–553. [Google Scholar] [CrossRef]
  21. Zhou, W.; Yang, H.; Huang, L.; Chen, C.; Lin, X.; Hu, Z.; Li, J. Grassland degradation remote sensing monitoring and driving factors quantitative assessment in China from 1982 to 2010. Ecol. Indic. 2017, 83, 303–313. [Google Scholar] [CrossRef]
  22. Hu, Y.; Nacun, B. An analysis of land-use change and grassland degradation from a policy perspective in Inner Mongolia, China, 1990–2015. Sustainability 2018, 10, 4048. [Google Scholar] [CrossRef] [Green Version]
  23. Liu, M.; Dries, L.; Heijman, W.; Huang, J.; Zhu, X.; Hu, Y.; Chen, H. The impact of ecological construction programs on grassland conservation in Inner Mongolia, China. Land Degrad. Dev. 2017, 29, 326–336. [Google Scholar] [CrossRef] [Green Version]
  24. Ali, I.; Cawkwell, F.; Dwyer, E.; Barrett, B.; Green, S. Satellite remote sensing of grasslands: From observation to management. J. Plant Ecol. 2016, 9, 649–671. [Google Scholar] [CrossRef] [Green Version]
  25. Reinermann, S.; Asam, S.; Kuenzer, C. Remote sensing of grassland production and management—A review. Remote Sens. 2020, 12, 1949. [Google Scholar] [CrossRef]
  26. Yang, H.; Hu, D.; Xu, H.; Zhong, X. Assessing the spatiotemporal variation of NPP and its response to driving factors in Anhui province, China. Environ. Sci. Pollut. Res. 2020, 27, 14915–14932. [Google Scholar] [CrossRef]
  27. Wang, X.; Tan, K.; Chen, B.; Du, P. Assessing the spatiotemporal variation and impact factors of net primary productivity in China. Sci. Rep. 2017, 7, 1–10. [Google Scholar] [CrossRef] [Green Version]
  28. Li, J.; Wang, Z.; Lai, C.; Wu, X.; Zeng, Z.; Chen, X.; Lian, Y. Response of net primary production to land use and land cover change in mainland China since the late 1980s. Sci. Total Environ. 2018, 639, 237–247. [Google Scholar] [CrossRef]
  29. Yang, H.; Zhong, X.; Deng, S.; Xu, H. Assessment of the impact of LUCC on NPP and its influencing factors in the Yangtze River basin, China. Catena 2021, 206, 105542. [Google Scholar] [CrossRef]
  30. Liu, J.; Chen, J.M.; Cihlar, J.; Chen, W. Net primary productivity distribution in the BOREAS region from a process model using satellite and surface data. J. Geophys. Res. Space Phys. 1999, 104, 27735–27754. [Google Scholar] [CrossRef]
  31. Field, C.B.; Randerson, J.T.; Malmström, C.M. Global net primary production: Combining ecology and remote sensing. Remote Sens. Environ. 1995, 51, 74–88. [Google Scholar] [CrossRef] [Green Version]
  32. Prince, S.D.; Goward, S.N. Global primary production: A remote sensing approach. J. Biogeogr. 1995, 22, 815. [Google Scholar] [CrossRef]
  33. Xiao, X.; Hollinger, D.; Aber, J.; Goltz, M.; Davidson, E.; Zhang, Q.; Moore, B. Satellite-based modeling of gross primary production in an evergreen needleleaf forest. Remote Sens. Environ. 2004, 89, 519–534. [Google Scholar] [CrossRef]
  34. Hadian, F.; Jafari, R.; Bashari, H.; Tartesh, M.; Clarke, K.D. Estimation of spatial and temporal changes in net primary production based on Carnegie Ames Stanford Approach (CASA) model in semi-arid rangelands of Semirom County, Iran. J. Arid. Land 2019, 11, 477–494. [Google Scholar] [CrossRef] [Green Version]
  35. Gao, Q.; Li, Y.; Wan, Y.; Qin, X.; Jiangcun, W.; Liu, Y. Dynamics of alpine grassland NPP and its response to climate change in Northern Tibet. Clim. Chang. 2009, 97, 515–528. [Google Scholar] [CrossRef]
  36. Zhang, Y.; Wang, Q.; Wang, Z.; Li, J.; Xu, Z. Dynamics and drivers of grasslands in the Eurasian steppe during 2000. Sustainability 2021, 13, 5887. [Google Scholar] [CrossRef]
  37. Zhao, Y.; Liu, H.; Zhang, A.; Cui, X.; Zhao, A. Spatiotemporal variations and its influencing factors of grassland net primary productivity in Inner Mongolia, China during the period 2000. J. Arid. Environ. 2019, 165, 106–118. [Google Scholar] [CrossRef]
  38. Rogan, J.; Chen, D. Remote sensing technology for mapping and monitoring land-cover and land-use change. Prog. Plan. 2004, 61, 301–325. [Google Scholar] [CrossRef]
  39. Hao, H.; Ren, Z. Land use/land cover change (LUCC) and eco-environment response to LUCC in Farming-Pastoral Zone, China. Agric. Sci. China 2009, 8, 91–97. [Google Scholar] [CrossRef]
  40. Wen, Y.; Liu, X.; Bai, Y.; Sun, Y.; Yang, J.; Lin, K.; Pei, F.; Yan, Y. Determining the impacts of climate change and urban expansion on terrestrial net primary production in China. J. Environ. Manag. 2019, 240, 75–83. [Google Scholar] [CrossRef]
  41. Zhang, Y.; Wang, Q.; Wang, Z.; Yang, Y.; Li, J. Impact of human activities and climate change on the grassland dynamics under different regime policies in the Mongolian Plateau. Sci. Total Environ. 2020, 698, 134304. [Google Scholar] [CrossRef]
  42. Gorelick, N.; Hancher, M.; Dixon, M.; Ilyushchenko, S.; Thau, D.; Moore, R. Google Earth Engine: Planetary-scale geospatial analysis for everyone. Remote Sens. Environ. 2017, 202, 18–27. [Google Scholar] [CrossRef]
  43. Tamiminia, H.; Salehi, B.; Mahdianpari, M.; Quackenbush, L.; Adeli, S.; Brisco, B. Google Earth Engine for geo-big data applications: A meta-analysis and systematic review. ISPRS J. Photogramm. Remote Sens. 2020, 164, 152–170. [Google Scholar] [CrossRef]
  44. Kumar, L.; Mutanga, O. Google Earth Engine applications since inception: Usage, trends, and potential. Remote Sens. 2018, 10, 1509. [Google Scholar] [CrossRef] [Green Version]
  45. Praticò, S.; Solano, F.; Di Fazio, S.; Modica, G. Machine learning classification of Mediterranean Forest Habitats in Google Earth Engine based on Seasonal Sentinel-2 time-series and input image composition optimisation. Remote Sens. 2021, 13, 586. [Google Scholar] [CrossRef]
  46. Tassi, A.; Gigante, D.; Modica, G.; Di Martino, L.; Vizzari, M. Pixel- vs. Object-based Landsat 8 data classification in Google Earth Engine using random forest: The case study of Maiella National Park. Remote Sens. 2021, 13, 2299. [Google Scholar] [CrossRef]
  47. Zhang, X.; Liu, L.; Chen, X.; Gao, Y.; Xie, S.; Mi, J. GLC_FCS30: Global land-cover product with fine classification system at 30 m using time-series Landsat imagery. Earth Syst. Sci. Data 2021, 13, 2753–2776. [Google Scholar] [CrossRef]
  48. Yin, S.; Wu, W.; Zhao, X.; Gong, C.; Li, X.; Zhang, L. Understanding spatiotemporal patterns of global forest NPP using a data-driven method based on GEE. PLoS ONE 2020, 15, e0230098. [Google Scholar] [CrossRef]
  49. Zhang, Y.; Song, C.; Hwang, T.; Novick, K.; Coulston, J.W.; Vose, J.; Dannenberg, M.P.; Hakkenberg, C.R.; Mao, J.; Woodcock, C.E. Land cover change-induced decline in terrestrial gross primary production over the conterminous United from 2001 to 2016. For. Meteorol. 2021, 308–309, 108609. [Google Scholar] [CrossRef]
  50. Melton, F.S.; Grimm, R.; Huntington, J.L.; Herring, J.; Erickson, T.; Hall, M.; Anderson, M.; Bastiaanssen, W.; Daudert, B.; Doherty, C.; et al. OpenET: Filling the Biggest Gap in Water Data for the Western United States; AGU: Washington, DC, USA; p. H53B-07. 2018. [Google Scholar]
  51. Mhawej, M.; Faour, G. Open-source Google Earth Engine 30-m evapotranspiration rates retrieval: The SEBALIGEE system. Environ. Model. Softw. 2020, 133, 104845. [Google Scholar] [CrossRef]
  52. Fadel, A.; Mhawej, M.; Faour, G.; Slim, K. On the application of METRIC-GEE to estimate spatial and temporal evaporation rates in a mediterranean lake. Remote Sens. Appl. Soc. Environ. 2020, 20, 100431. [Google Scholar] [CrossRef]
  53. Vos, K.; Splinter, K.D.; Harley, M.; Simmons, J.A.; Turner, I.L. CoastSat: A Google Earth Engine-enabled Python toolkit to extract shorelines from publicly available satellite imagery. Environ. Model. Softw. 2019, 122, 104528. [Google Scholar] [CrossRef]
  54. DeVries, B.; Huang, C.; Armston, J.; Huang, W.; Jones, J.W.; Lang, M.W. Rapid and robust monitoring of flood events using Sentinel-1 and Landsat data on the Google Earth Engine. Remote Sens. Environ. 2020, 240, 111664. [Google Scholar] [CrossRef]
  55. Martín-Ortega, P.; García-Montero, L.G.; Sibelet, N. Temporal patterns in illumination conditions and its effect on vegetation indices using Landsat on Google Earth Engine. Remote Sens. 2020, 12, 211. [Google Scholar] [CrossRef] [Green Version]
  56. Wang, X.; Du, P.; Chen, D.; Lin, C.; Zheng, H.; Guo, S. Characterizing urbanization-induced land surface phenology change from time-series remotely sensed images at fine spatio-temporal scale: A case study in Nanjing, China (2001–2018). J. Clean. Prod. 2020, 274, 122487. [Google Scholar] [CrossRef]
  57. Abunnasr, Y.; Mhawej, M. Downscaled night air temperatures between 2030 and 2070: The case of cities with a complex- and heterogeneous-topography. Urban Clim. 2021, 40, 100998. [Google Scholar] [CrossRef]
  58. Guo, S.; Du, P.; Xia, J.; Tang, P.; Wang, X.; Meng, Y.; Wang, H. Spatiotemporal changes of glacier and seasonal snow fluctuations over the Namcha Barwa–Gyala Peri massif using object-based classification from Landsat time series. ISPRS J. Photogramm. Remote Sens. 2021, 177, 21–37. [Google Scholar] [CrossRef]
  59. Ren, H.; Shang, Y.; Zhang, S. Measuring the spatiotemporal variations of vegetation net primary productivity in Inner Mongolia using spatial autocorrelation. Ecol. Indic. 2020, 112, 106108. [Google Scholar] [CrossRef]
  60. Didan, K. MOD13Q1 MODIS/Terra Vegetation Indices 16-day L3 Global 250m SIN Grid V006; NASA EOSDIS Land Processes DAAC; NASA: Washington, DC, USA, 2015. [CrossRef]
  61. Didan, K. MYD13Q1 MODIS/Aqua Vegetation Indices 16-day L3 Global 250m SIN Grid V006; NASA EOSDIS Land Processes DAAC; NASA: Washington, DC, USA, 2015. [CrossRef]
  62. Sha, Z.; Bai, Y.; Lan, H.; Liu, X.; Li, R.; Xie, Y. Can more carbon be captured by grasslands? A case study of Inner Mongolia, China. Sci. Total Environ. 2020, 723, 138085. [Google Scholar] [CrossRef]
  63. Chen, J.; Ban, Y.; Li, S. Open access to Earth land-cover map. Nature 2014, 514, 434. [Google Scholar] [CrossRef] [Green Version]
  64. Chen, J.; Chen, J.; Liao, A.; Cao, X.; Chen, L.; Chen, X.; He, C.; Han, G.; Peng, S.; Lu, M.; et al. Global land cover mapping at 30 m resolution: A POK-based operational approach. ISPRS J. Photogramm. Remote Sens. 2015, 103, 7–27. [Google Scholar] [CrossRef] [Green Version]
  65. Pastorello, G.; Trotta, C.; Canfora, E.; Chu, H.; Christianson, D.; Cheah, Y.-W.; Poindexter, C.; Chen, J.; Elbashandy, A.; Humphrey, M.; et al. The FLUXNET2015 dataset and the ONEFlux processing pipeline for eddy covariance data. Sci. Data 2020, 7, 27. [Google Scholar] [CrossRef]
  66. Yu, G.; Wen, X.; Sun, X.; Tanner, B.D.; Lee, X.; Chen, J. Overview of ChinaFLUX and evaluation of its eddy covariance measurement. Agric. For. Meteorol. 2006, 137, 125–137. [Google Scholar] [CrossRef]
  67. Guo, D.; Song, X.; Hu, R.; Zhu, X.; Jiang, Y.; Cai, S.; Zhang, Y.; Cui, X. Large-scale analysis of the spatiotemporal changes of net ecosystem production in Hindu Kush Himalayan Region. Remote Sens. 2021, 13, 1180. [Google Scholar] [CrossRef]
  68. Potter, C.S.; Randerson, J.T.; Field, C.B.; Matson, P.A.; Vitousek, P.M.; Mooney, H.A.; Klooster, S.A. Terrestrial ecosystem production: A process model based on global satellite and surface data. Glob. Biogeochem. Cycles 1993, 7, 811–841. [Google Scholar] [CrossRef]
  69. Pang, J.; Xu, Z.; Liu, C. Weather Generator and Database in the SWAT Model. J. China Hydrol. 2007, 27, 25–30. [Google Scholar]
  70. Wu, Y.; Wu, Z.; Liu, X. Dynamic changes of net primary productivity and associated urban growth driving forces in Guangzhou city, China. Environ. Manag. 2020, 65, 758–773. [Google Scholar] [CrossRef]
  71. Ruimy, A.; Saugier, B.; Dedieu, G. Methodology for the estimation of terrestrial net primary production from remotely sensed data. J. Geophys. Res. Space Phys. 1994, 99, 5263–5283. [Google Scholar] [CrossRef]
  72. Zhu, W.; Pan, Y.; He, H.; Yu, D.; Hu, H. Simulation of maximum light use efficiency for some typical vegetation types in China. Chin. Sci. Bull. 2006, 51, 457–463. [Google Scholar] [CrossRef]
  73. Sen, P.K. Estimates of the regression coefficient based on Kendall’s Tau. J. Am. Stat. Assoc. 1968, 63, 1379–1389. [Google Scholar] [CrossRef]
  74. Theil, H. A rank-invariant method of linear and polynomial regression analysis. Indag. Math. 1950, 12, 85. [Google Scholar]
  75. Jiang, W.; Yuan, L.; Wang, W.; Cao, R.; Zhang, Y.; Shen, W. Spatio-temporal analysis of vegetation variation in the Yellow River Basin. Ecol. Indic. 2015, 51, 117–126. [Google Scholar] [CrossRef]
  76. Hussain, M.M.; Mahmud, I. pyMannKendall: A python package for non parametric Mann Kendall family of trend tests. J. Open Source Softw. 2019, 4, 1556. [Google Scholar] [CrossRef]
  77. Mann, H.B. Nonparametric Tests against Trend. Econometrica 1945, 13, 245–259. [Google Scholar] [CrossRef]
  78. Kendall, M.G. Rank Correlation Methods, 4th ed.; Griffin: London, UK, 1975. [Google Scholar]
  79. Kamali, A.; Khosravi, M.; Hamidianpour, M. Spatial–temporal analysis of net primary production (NPP) and its relationship with climatic factors in Iran. Environ. Monit. Assess. 2020, 192, 1–20. [Google Scholar] [CrossRef] [PubMed]
  80. Wang, H.; Liu, L.; Yin, L.; Shen, J.; Li, S. Exploring the complex relationships and drivers of ecosystem services across different geomorphological types in the Beijing-Tianjin-Hebei region, China (2000–2018). Ecol. Indic. 2021, 121, 107116. [Google Scholar] [CrossRef]
  81. Zhu, X.; Li, C.; Tang, L. Assessing the Spatiotemporal Dynamic of NPP in Desert Steppe and Its Response to Climate Change from 2003 to 2017: A Case Study in Siziwang Banner; SPIE: Washington, DC, USA, 2019; Volume 11149. [Google Scholar] [CrossRef]
  82. Liu, X.; Pei, F.; Wen, Y.; Li, X.; Wang, S.; Wu, C.; Cai, Y.; Wu, J.; Chen, J.; Feng, K.; et al. Global urban expansion offsets climate-driven increases in terrestrial net primary productivity. Nat. Commun. 2019, 10. [Google Scholar] [CrossRef] [PubMed] [Green Version]
  83. Wang, Z.; Zhong, J.; Lan, H.; Wang, Z.; Sha, Z. Association analysis between spatiotemporal variation of net primary productivity and its driving factors in Inner Mongolia, China during 1994. Ecol. Indic. 2019, 105, 355–364. [Google Scholar] [CrossRef]
  84. Turner, D.P.; Ritts, W.D.; Cohen, W.B.; Gower, S.T.; Zhao, M.; Running, S.W.; Wofsy, S.C.; Urbanski, S.; Dunn, A.L.; Munger, J.W. Scaling Gross Primary Production (GPP) over boreal and deciduous forest landscapes in support of MODIS GPP product validation. Remote Sens. Environ. 2003, 88, 256–270. [Google Scholar] [CrossRef] [Green Version]
  85. Zhu, W.; Pan, Y.; Long, Z.; Chen, Y.; Li, J.; Hu, H. Estimating net primary productivity of terrestrial vegetation based on GIS and RS: A case study in Inner Mongolia, China. J. Remote Sens. 2005, 9, 300–307. [Google Scholar] [CrossRef]
  86. Mu, S.; Li, J.; Yang, H.; Gang, C.; Chen, Y. Spatio-temporal variation analysis of grassland net primary productivity and its relationship with climate over the past 10 years in Inner Mongolia. Acta Pratacult. Sin. 2013, 22, 6–15. [Google Scholar] [CrossRef]
  87. Wang, Y.; Xu, X.; Huang, L.; Yang, G.; Fan, L.; Wei, P.; Chen, G. An improved CASA model for estimating winter wheat yield from remote sensing images. Remote Sens. 2019, 11, 1088. [Google Scholar] [CrossRef] [Green Version]
  88. Li, A.; Bian, J.; Lei, G.; Huang, C. Estimating the maximal light use efficiency for different vegetation through the CASA model combined with time-Series remote sensing data and ground measurements. Remote Sens. 2012, 4, 3857–3876. [Google Scholar] [CrossRef] [Green Version]
  89. Tong, S.; Dong, Z.; Zhang, J.; Bao, Y.; Guna, A.; Bao, Y. Spatiotemporal variations of land use/cover changes in Inner Mongolia (China) during 1980. Sustainability 2018, 10, 4730. [Google Scholar] [CrossRef] [Green Version]
  90. Li, Z.; Wu, W.; Liu, X.; Fath, B.D.; Sun, H.; Liu, X.; Xiao, X.; Cao, J. Land use/cover change and regional climate change in an arid grassland ecosystem of Inner Mongolia, China. Ecol. Model. 2017, 353, 86–94. [Google Scholar] [CrossRef]
  91. Liu, Q.; Zhang, Q.; Yan, Y.; Zhang, X.; Niu, J.; Svenning, J.-C. Ecological restoration is the dominant driver of the recent reversal of desertification in the Mu Us Desert (China). J. Clean. Prod. 2020, 268, 122241. [Google Scholar] [CrossRef]
  92. Shi, Y.; Jin, N.; Ma, X.L.; Wu, B.Y.; He, Q.S.; Yue, C.; Yu, Q. Attribution of climate and human activities to vegetation change in China using machine learning techniques. Agric. For. Meteorol. 2020, 294, 108146. [Google Scholar] [CrossRef]
  93. Guo, D.; Song, X.; Hu, R.; Cai, S.; Zhu, X.; Hao, Y. Grassland type-dependent spatiotemporal characteristics of productivity in Inner Mongolia and its response to climate factors. Sci. Total Environ. 2021, 775, 145644. [Google Scholar] [CrossRef]
  94. Wu, N.; Liu, G.; Liu, A.; Bai, H.; Chao, L. Monitoring and driving force analysis of net primary productivity in native grassland: A case study in Xilingol steppe, China. J. Appl. Ecol. 2020, 31, 1233–1240. [Google Scholar] [CrossRef]
  95. Wu, D.; Zhao, X.; Liang, S.; Zhou, T.; Huang, K.; Tang, B.; Zhao, W. Time-lag effects of global vegetation responses to climate change. Glob. Chang. Biol. 2015, 21, 3520–3531. [Google Scholar] [CrossRef]
Figure 1. (a) Land cover and (b) digital elevation model of Inner Mongolia in 2020.
Remotesensing 13 04480 g001
Figure 2. The flowchart of CASA model and NPP analysis methods in this study.
Remotesensing 13 04480 g002
Figure 3. Land-use change in Inner Mongolia related to grassland during: (a) 2000–2010; (b) 2010–2020; and (c) 2000–2020.
Remotesensing 13 04480 g003
Figure 4. Comparison of the monthly estimated NPP with observed NPP.
Remotesensing 13 04480 g004
Figure 5. Spatial distribution of the average NPP in the Inner Mongolia grassland during 2000–2020.
Remotesensing 13 04480 g005
Figure 6. Area proportion of the different NPP distribution intervals.
Remotesensing 13 04480 g006
Figure 7. Coefficient of variation of NPP in the Inner Mongolia grassland during 2000–2020.
Remotesensing 13 04480 g007
Figure 8. Interannual change trends of grassland NPP and meteorological factors obtained by the OLS method for the Inner Mongolia grassland.
Remotesensing 13 04480 g008
Figure 9. Spatial distribution of the slope of grassland NPP obtained by the Theil–Sen method (a,c,e) (unit: g C/(m2∙yr)) and its significance by the MK test (b,d,f) ( α = 0.05 ) in Inner Mongolia during the different periods.
Remotesensing 13 04480 g009
Figure 10. Spatial distribution map for NPP in the Inner Mongolia grassland based on LUCC in (a) 2000, (b) 2010, and (c) 2020. (d) The change of grassland NPP.
Remotesensing 13 04480 g010
Figure 11. Map of (a) the total annual precipitation, (b) average annual temperature, (c) total annual sunshine hours in Inner Mongolia from 2000 to 2020.
Remotesensing 13 04480 g011
Figure 12. Spatial distribution of the correlation coefficients and partial correlation coefficients between grassland NPP and precipitation (a,b), temperature (c,d), and sunshine duration (e,f) in Inner Mongolia during 2000–2020.
Remotesensing 13 04480 g012
Table 1. Description of data used in this study.
Date TypeDate NameTimeProvider
NDVI dataMOD13Q1Every 16 days from February 2000 to 2020Google Earth Engine by NASA LP DAAC at the USGS EROS Center
MYD13Q1Every 16 days from July 2002 to 2020
Meteorological dataTemperature,
precipitation, and
sunshine duration
Monthly from 2000
to 2020
China Meteorological Data Service Center
Land-cover dataGlobeLand302000, 2010, 2020China National
Geomatics Center
NPP observation dataFLUXNET2015Monthly from 2007
to 2009 and 2011
Lawrence Berkeley
National Laboratory (USA)
ChinaFLUXMonthly from 2004
to 2008
Institute of Geographic Sciences and Natural
Resources Research (China)
Table 2. Description of FLUXNET sites in Inner Mongolia.
Site IDSite NameTimeLand Use TypeLatitudeLongitude
CN-Du2Duolun Grassland2007–2008Grassland42.05N116.28E
CN-Du3Duolun Degraded Meadow2009Grassland42.06N116.28E
CN-Sw2Siziwang Grazed2011Grassland41.79N111.90E
NMGInner Mongolia2004–2008Grassland43.33N116.40E
Table 3. Rules for the trend classification of NPP change.
θ T S Z NPP Change Trend
> 0 > 1.96 Significantly improved
> 0 1.96 Insignificantly improved
< 0 > 1.96 Significantly degraded
< 0 1.96 Insignificantly degraded
Table 4. Transition matrices for the land-use/land-cover change in 2000–2010, 2010–2020, and 2000–2020 in Inner Mongolia (unit: km2).
2010
Cultivated LandForestGrasslandShrublandWetlandWater
Area
Artificial SurfacesBare
Land
TotalLosses
2000Cultivated land134,912.69554.449,813.00114.3192.88207.631024.8879.50146,799.3111,886.63
Forest233.81126,442.068964.2520.2514.7527.754.630.31135,707.819265.75
Grassland5173.508753.63512,974.564750.00596.31364.501090.563288.31536,991.3824,016.81
Shrubland8.69299.38515.941337.812.752.191.5096.132,264.38926.56
Wetland391.75111.751861.8152.694621.56441.0612.31238.697731.633110.06
Water area246.1366.191018.0614.38632.693835.818.88316.696138.812303.00
Artificial
surfaces
517.509.88397.446.195.948.316336.4416.257297.94961.50
Bare land80.250.6915,733.6338.0048.00237.6399.38296,475.88312,713.4416,237.56
Total141,564.31136,238.00551,278.696333.636014.885124.888578.56300,511.75
Gains6651.639795.9438,304.134995.811393.311289.062242.134035.88
Change−5235.00530.1914,287.314069.25−1716.75−1013.941280.63−12,201.69
2020
Cultivated LandForestGrasslandShrublandWetlandWater AreaArtificial SurfacesBare LandTotalLosses
2010Cultivated land126,092.94611.0610,865.8862.3196.00328.813299.88207.44141,564.3115,471.38
Forest892.38128,634.816405.00108.0619.9471.6986.3819.75136,238.007603.19
Grassland26,495.257067.31502,358.50685.561665.44719.253482.198805.19551,278.6948,920.19
Shrubland299.38109.13397.255255.8810.9411.38107.69142.006333.631077.75
Wetland229.566.251280.882.443586.38494.5066.75348.136014.882428.50
Water area229.9420.63341.631.81271.813929.9416.19312.945124.881194.94
Artificial
surfaces
1040.2513.31391.6314.881.5011.317065.9439.758578.561512.63
Bare land980.811.2519,679.3198.69120.31366.44381.44278,883.50300,511.7521,628.25
Total156,260.50136,463.75541,720.066229.635772.315933.3114,506.44288,758.69
Gains30,167.567828.9439,361.56973.752185.942003.387440.509875.19
Change14,696.19225.75−9558.63−104.00−242.56808.445927.88−11,753.06
2020
2000 to 2020Cultivated LandForestGrasslandShrublandWetlandWater AreaArtificial SurfacesBare LandTotalLosses
2000Cultivated land126,460.88738.8114,918.88118.44159.06343.943872.25187.06146,799.3120,338.44
Forest688.81123,179.8811,613.5650.4420.7564.9474.9414.50135,707.8112,527.94
Grassland26,130.4412,131.13477,849.564862.811545.69739.504181.699550.56536,991.3859,141.81
Shrubland83.63251.25706.941003.5650.6913.2511.38143.692264.381260.81
Wetland644.3191.632519.7546.633,224.25475.1982.13647.757731.634507.38
Water area309.1352.69582.4410.56654.314070.5033.69425.506138.812068.31
Artificial
surfaces
967.0617.31442.3815.062.8812.065792.6348.567297.941505.31
Bare land976.251.0633,086.56122.13114.69213.94457.75277,741.06312,713.4434,972.38
Total156,260.50136,463.75541,720.066229.635772.315,933.3114,506.44288,758.69
Gains29,799.6313,283.8863,870.505226.062,548.061862.818713.8111,017.63
Change9461.19755.944728.693965.25−1,959.31−205.507208.50−23,954.75
Table 5. Growth trend of grassland NPP in the different periods based on the two-tailed significance test method.
Study Period
(Years)
OLS MethodTheil–Sen Method
Growth Rate
(g C/(m2∙yr))
p-ValueGrowth Rate
(g C/(m2∙yr))
p-Value
2000–20100.270.85−0.471.00
2010–20203.140.222.550.28
2000–20202.43<0.012.16<0.05
Table 6. Changes of grassland NPP in Inner Mongolia based on the different land-use changes during 2000–2010, 2010–2020, and 2000–2020.
LUCC2000–20102010–20202000–2020
Area (km2)Total NPP (Tg C)Average NPP (g C/m2)Area (km2)Total NPP
(Tg C)
Average NPP
(g C/m2)
Area (km2)Total NPP
(Tg C)
Average NPP (g C/m2)
Total area of lost
grassland
24,016.818.29345.2348,920.1914.96305.7959,141.8117.63298.16
Grassland to cultivated land5173.501.77342.5126,495.258.36315.4926,130.447.41283.39
Grassland to bare land3288.310.35105.478805.190.89100.729550.560.97101.87
Grassland to forest8753.635.06578.197067.314.18590.8312,131.137.04580.32
Grassland to others6801.381.11163.416552.441.54234.7111,329.692.22195.58
Total area of new
grassland
38,304.139.65251.9139,361.5610.73272.5563,870.5016.38256.40
Cultivated land to
grassland
9813.003.24330.6510,865.884.49412.7614,918.886.02403.38
Bare land to grassland15,733.630.7446.9419,679.311.6282.4833,086.562.3269.97
Forest to grassland8964.254.96553.086405.003.89606.8611,613.566.94597.87
Others to grassland3793.250.71186.702411.380.73304.054251.501.10258.75
Table 7. Comparison with other NPP estimation results.
Research CaseAverage Yearly NPP
(g C/m2)
Growth Rate
(g C/(m2∙yr))
Time RangeNPP Model or Data Sources
Zhu et al. [85]Around 2502002CASA
Mu et al. [86]281.300.332001–2010CASA
Jin et al. [10]271.104.362001–2015CASA
Zhao et al. [37]Ranged from 81.21 to 365.534.532000–2014MODIS MOD17A3
This study278.632.432000–2020CASA
Publisher’s Note: MDPI stays neutral with regard to jurisdictional claims in published maps and institutional affiliations.

