
Identification and Severity Monitoring of Maize Dwarf Mosaic Virus Infection Based on Hyperspectral Measurements


College of Nature Resources and Environment, Northwest A&F University, Yangling 712100, China
*
Author to whom correspondence should be addressed.
Remote Sens. 2021, 13(22), 4560; https://0-doi-org.brum.beds.ac.uk/10.3390/rs13224560
Submission received: 3 October 2021
/
Revised: 6 November 2021
/
Accepted: 9 November 2021
/
Published: 13 November 2021
(This article belongs to the Special Issue Crop Disease Detection Using Remote Sensing Image Analysis)
Abstract
:Prompt monitoring of maize dwarf mosaic virus (MDMV) is critical for the prevention and control of disease and to ensure high crop yield and quality. Here, we first analyzed the spectral differences between MDMV-infected red leaves and healthy leaves and constructed a sensitive index (SI) for measurements. Next, based on the characteristic bands (Rλ) associated with leaf anthocyanins (Anth), we determined vegetation indices (VIs) commonly used in plant physiological and biochemical parameter inversion and established a vegetation index (VIc) by utilizing the combination of two arbitrary bands following the construction principles of NDVI, DVI, RVI, and SAVI. Furthermore, we developed classification models based on linear discriminant analysis (LDA) and support vector machine (SVM) in order to distinguish the red leaves from healthy leaves. Finally, we performed UR, MLR, PLSR, PCR, and SVM simulations on Anth based on Rλ, VIs, VIc, and Rλ + VIs + VIc and indirectly estimated the severity of MDMV infection based on the relationship between the reflection spectra and Anth. Distinct from those of the normal leaves, the spectra of red leaves showed strong reflectance characteristics at 640 nm, and SI increased with increasing Anth. Moreover, the accuracy of the two VIc-based classification models was 100%, which is significantly higher than that of the VIs and Rλ-based models. Among the Anth regression models, the accuracy of the MLR model based on Rλ + VIs + VIc was the highest (R2c = 0.85; R2v = 0.74). The developed models could accurately identify MDMV and estimate the severity of its infection, laying the theoretical foundation for large-scale remote sensing-based monitoring of this virus in the future.
1. Introduction
As one of the most important food crops in the world, maize covered the largest area planted in China from 2015 to 2019, with more than 40 million hectares planted each year [1]. Therefore, guaranteeing healthy growths of maize is crucial for ensuring food security and achieving sustainable agricultural development worldwide [2]. However, maize dwarf mosaic virus (MDMV) infection adversely affects the growth and development of this crop, and it has become one of the major destructive diseases in the world, including China [3,4]. In 1962, MDMV was first detected in Ohio, USA, and had spread throughout the state by 1964, damaging 5 million corn plants in a dozen counties [5]. In 1965, Janson named the pathogen “maize dwarf mosaic virus” [6]. In 1968, MDMV was reported for the first time on a large scale in Xinxiang, Huixian, and other regions in the Henan Province of China, resulting in the loss of nearly 25 million kilograms of grain. In the 1980s, the disease was effectively prevented and controlled thanks to the promotion of specific resistant varieties and agronomic cultivation measures. However, since the 1990s, due to the increased acreage of MDMV-susceptible varieties, MDMV has become prevalent once again, occurring very frequently in China and causing substantial crop losses. Therefore, prompt and accurate identification of MDMV is crucial for proper field management in order to prevent and control disease spread, and regular yield assessments are essential to devise marketing plans [7,8,9].
MDMV infection can occur throughout the maize growth period. At the early stages of disease, many elliptical chlorotic spots or markings appear near the veins at the base of the heart lobe, arranged along the veins into intermittent strips of varying lengths. With further progression of the disease, wide chlorotic stripes formed on the leaves, particularly on the young ones [2]. After contracting the disease, the chlorophyll (Chl) content of leaves reduces, turning them yellow. In some cases, the symptoms start to develop from the tip and edge of the leaves, appearing as red-purple stripes; eventually, the entire leaf becomes red and dries. However, these red-purple streaks are mainly a result of color rendering by high concentrations of anthocyanins (Anth) in the infected leaves following Chl degradation [10,11]. As an important pigment, Anth confers all colors, except green, in plants and is sensitive to environmental and biological stresses [12,13,14,15]. In addition, pathogen infection can induce anthocyanin biosynthesis in plants, and the more severe the pathogen infection, the stronger the induction ability [16]. Ludmerszki et al. observed the fourth leaf of MDMV-infected maize and found that the observed leaf gradually turned red over time and that the content of anthocyanin in MDMV-infected leaves increased while the content of chlorophyll decreased by using fluorescence technology [17]. Singh and Sharma reported in 1998 that anthocyanins and phenols increase Chkahao resistance to a variety of common rice diseases (e.g., root rot, narrow brown spot, stem rot, false smut, bacterial leaf streaks, and bacterial leaf blight) and rice pests (e.g., stem borer, rice bug, green horned caterpillar, and rice skipper) [18]. Fasahat et al. reported in 2012 that a Malaysian colored rice, Oryza Rufipogon, containing anthocyanin pigment was highly resistant to bacterial leaf blight and brown plant hopper [19]. Therefore, we used red leaf Anth as a measure to indicate the severity of MDMV infection given the close association between Anth and plant disease.
Traditional MDMV monitoring methods include field observations and laboratory measurements, which are time-consuming and expensive. In addition, chemical methods are destructive, and they cannot reflect progressive changes in the disease status in the same leaf over time [20]. In contrast, remote sensing (RS) is a non-destructive technique for rapid monitoring at different scales. Moreover, owing to its high spatial resolution, hyperspectral technology can identify invisible symptoms reflecting the physiological status of plants at the initial stages of disease and has been widely used in crop pest and disease detection in recent years [21,22,23]. For instance, Mirik et al. classified Landsat 5 Thematic Mapper (TM) images of two cities in Texas from 2006 to 2008 by using the maximum likelihood method and achieved an overall classification accuracy of 89.47–99.07% for wheat streak mosaic virus [24]. Furthermore, Camino et al. coupled a spatial spread model with an RS-driven support vector for estimating the probability of Xylella fastidiosa (XF) infection and obtained highly accurate predictions of the spatial distribution of plant disease in almond trees [25]. Martins et al. conducted field surveys and small-format aerial photography (SFAP) with different cameras to obtain visible and near-infrared images and estimated the spatial distribution of ink disease in Northern Portugal during 1995–2004 by using a geostatistical method [26]. Liu et al. collected rice reflectance spectra in the field and laboratory and estimated the severity of brown rice spot disease based on the reflectance ratio [27]. These previous studies monitored plant diseases at different scales based on satellite, unmanned aerial vehicle (UAV), and near-ground platforms, achieving satisfactory results. Simultaneously, other plant diseases, including wheat stripe rust, rice spikelet rot disease, and maize stripe rust, have also been studied by using RS technology [28,29,30]. However, only Beverly et al. compared the spectra (400–2700) of healthy, MDMV-infected, and Helminthosporium maydis-infected maize leaves, laying the foundation for RS-based research on MDMV [31], and to our best knowledge, there have been no further studies on MDMV using RS technology. Therefore, RS-based research on MDMV is of paramount importance.
Furthermore, reliable physical and empirical models of leaf reflectance and a range of physiological parameters, such as leaf water content, leaf area, and pigment content (including Anth), have been established [32,33]. Therefore, we can indirectly assess the severity of MDMV infection by establishing the relationship between the reflectance spectrum and Anth. To this end, by analyzing the spectral characteristics of infected leaves through RS, we aimed to build a suitable model for the detection and monitoring of MDMV for minimizing its adverse effects and ensuring high crop quality and yield.
2. Materials and Methods
2.1. Study Area
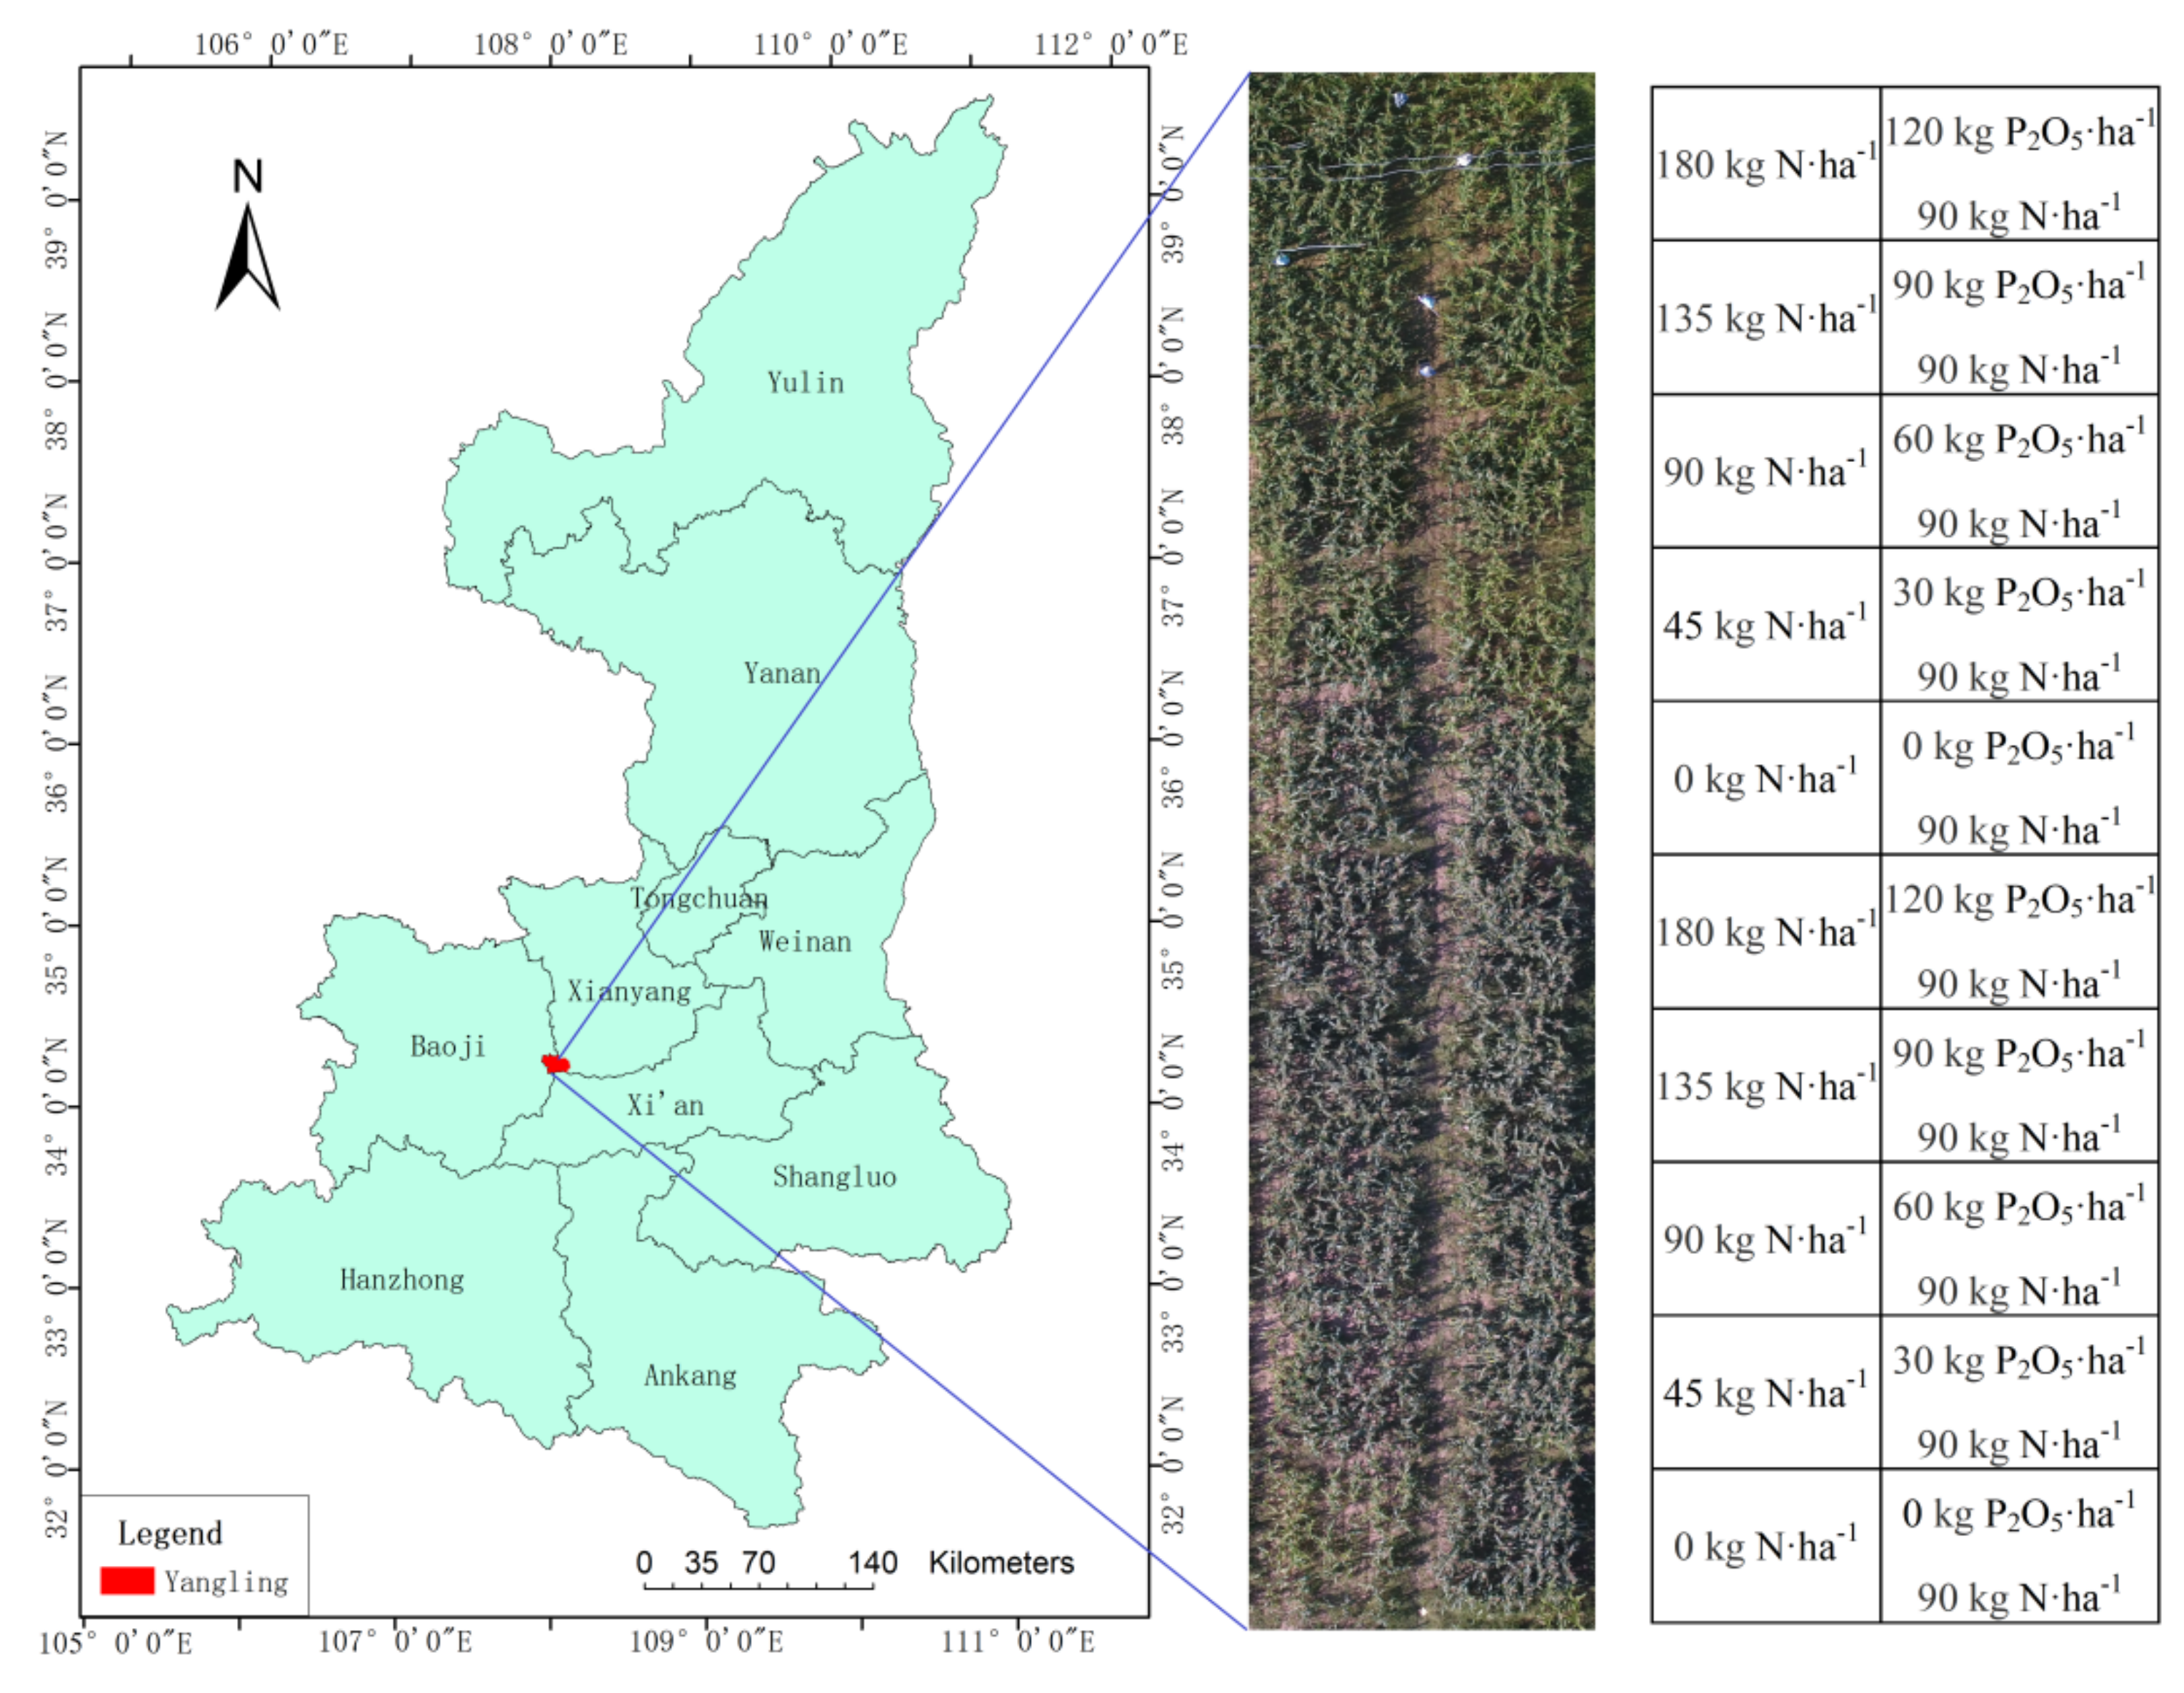
The present study was conducted in an established research facility, which is part of the Northwest A&F University, located in the Shaanxi Province of China (34°15′−34°20′ N, 107°56′−108°7′ E; 460 m a.s.l.). The region has warm, temperate, and continental monsoon climate. The study area was divided into 20 subplots, each with an area of 5.5 × 6 m2, occupying a total area of 69 × 12 m2. The maize cultivar “Dafeng 26” used in the experiment, and the cropping system was the rotation of winter wheat and summer maize. Five nitrogen (0, 45, 90, 135, and 180 kg N·ha−1) and five phosphorus (0, 30, 60, 90, and 120 kg P2O5·ha−1) application levels were set in the subplots. All fertilizers were applied at the time of sowing, and other management measures followed local practices. The location of the study area, plot setting and fertilization are shown in Figure 1.
2.2. Data Acquisition and Processing
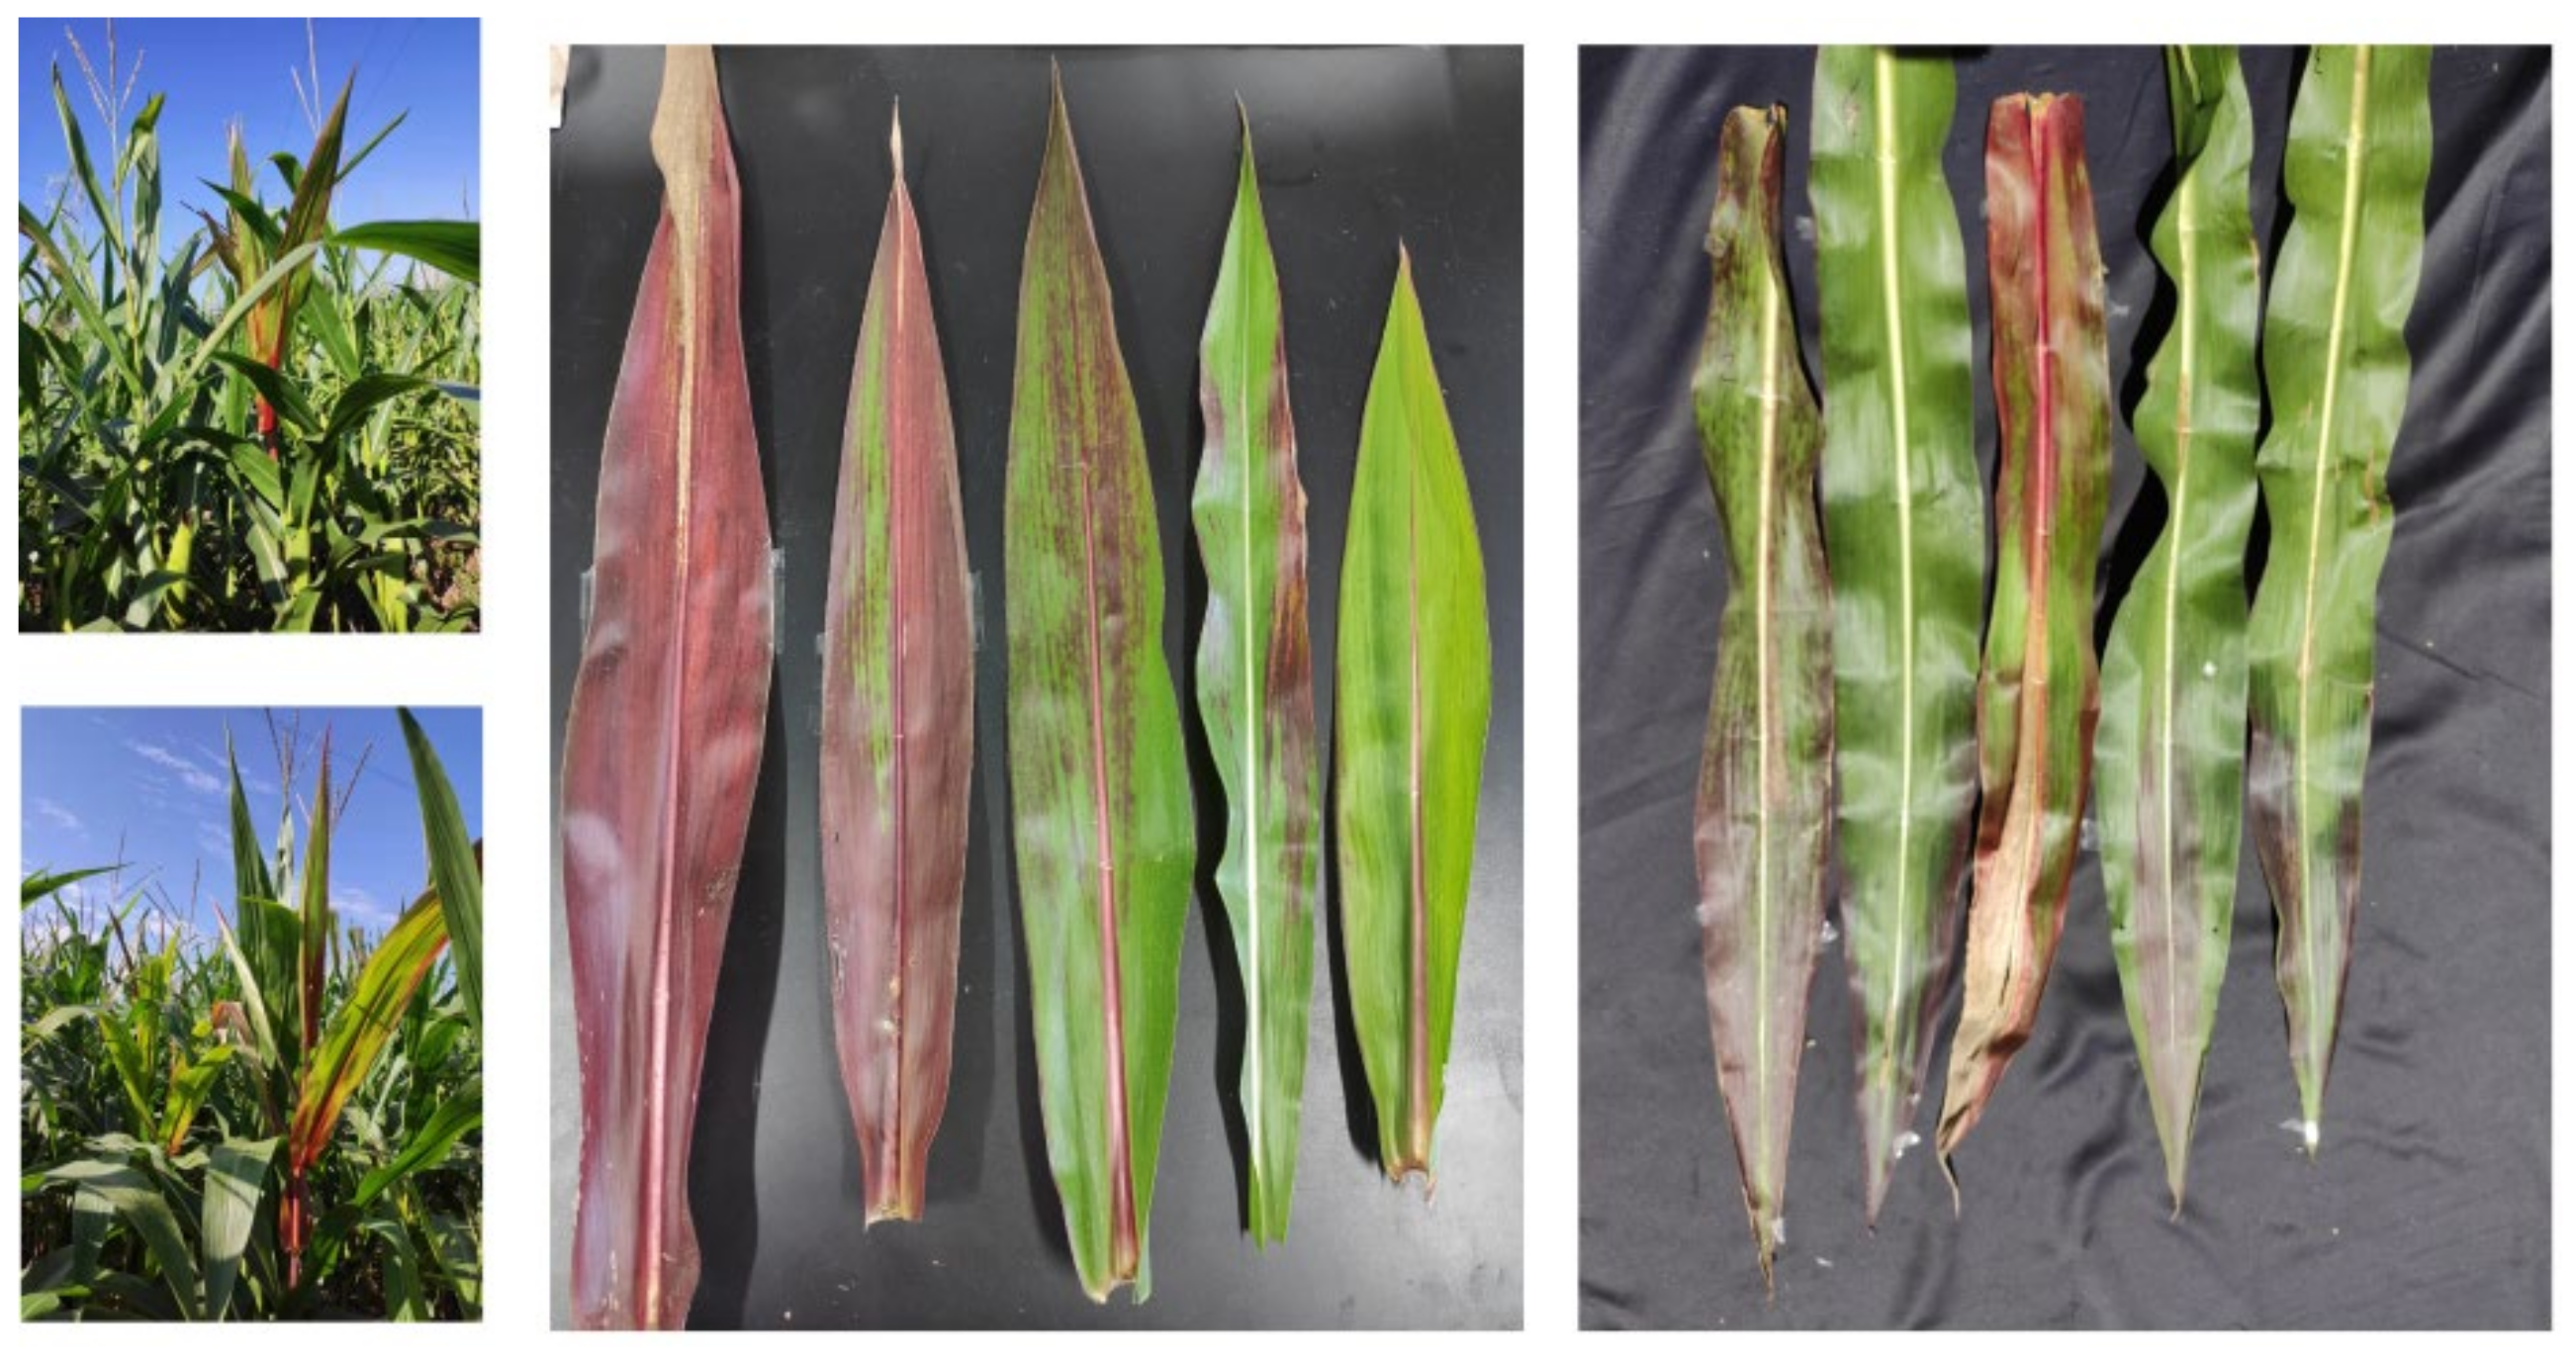
Data collection and measurements were performed at the R2 blister stage period (14 September 2017); it is not only the peak season of MDMV but also an important period for yield estimation. Two healthy corn samples were collected from each plot, and destructive samples were obtained from the upper, middle, and lower layers (three pieces from each layer). Moreover, 360 healthy leaves and 72 MDMV-infected red leaves (hereinafter referred to as red leaves) were collected throughout the study area. All blades were placed in plastic bags and transported to the laboratory in an incubator. The collected red leaf samples are presented in Figure 2.
2.2.1. Anth Quantification
Leaf Anth was quantified with Dualex 4 (France), a new multifunctional blade measurement tool that calculates the absorbance of plants in the green region to obtain Anth (μg·cm−2). This tool can also accurately measure leaf Chl, surface flavonoid, and nitrogen content and is easy to use for real-time and non-destructive measurements. Each leaf was measured 10 times to obtain the representative value of Anth. The Anth measurement of healthy leaves was not required, except in the samples from the leaf vein; in infected leaves, Anth was only measured in parts that had turned red.
2.2.2. Hyperspectral Data Acquisition
The reflectance spectra of maize leaves were determined in an indoor measurement unit using a spectroradiometer (SVC HR~1024 i) with a spectral range of 350–2500 nm and a view of 25°. First, the reflectivity of the white reference plate was measured for spectral correction. Then, the leaves were placed into the clamp to measure 10 spectra of each leaf, and the average value was calculated as the actual spectrum. Finally, the spectral resolution was resampled to 1 nm and then a continuous smooth reflection spectrum was obtained by Savitzky–Golay smoothing. Considering that the wavelengths of plant pigments are concentrated in the visible and near-infrared regions and that the constituent wavelengths of vegetation indices commonly used for estimating plant physiological and biochemical parameters are within these region [34], we only studied the spectra at 400–1000 nm.
2.3. Analytical Methods
2.3.1. Definition of Sensitivity Index (SI)
We constructed an SI based on the ratio and difference algorithm to measure the spectral difference between healthy and red leaves. The closer SI is to 0, the smaller the spectral difference between the two leaves and vice versa. The specific formula is as follows:
where Rλ is the reflectance of the red leaf spectrum at wavelength λ, and Rh is the average reflectance of the healthy spectrum at wavelength λ.
2.3.2. Construction of Vegetation Indices with Two Arbitrary Bands
Vegetation indices have been widely used in the RS-based estimation of plant growth parameters. A VI constituting several bands can effectively minimize the errors associated with sensor specifications, atmosphere, and background differences, thus enhancing the description of the observation target [35,36]. However, due to the lack of disease specificity of these indicators, the quantification or identification of specific diseases based on common vegetation indices is currently impossible. Therefore, we combined different wavelengths to construct a VI (VIc) for simplifying the spectral detection of plant diseases. Specifically, we used the normalized difference vegetation index (NDVI), ratio vegetation index (RVI), differential vegetation index (DVI), and soil-adjusted vegetation index (SAVI), defined as follows:
where Ri and Rj are the reflectance at i and j nm over the entire reflectance spectrum.
2.3.3. Linear Discriminant Analysis (LDA) Classification Model
The LDA model uses a linear combination of features as the classification standard to project data from the higher-dimensional to the lower-dimensional space, while ensuring that the intra-class variance of each class after the projection is small but the mean difference between the classes is large. It can be used for both classification and dimension reduction and is better suited for the linear classification of smaller data volumes and fewer indicators. In the present study, 48 red leaf spectra and 240 healthy leaf spectra were randomly selected from all the spectra as the calibration set, and the remaining 24 red leaf spectra and 120 healthy leaf spectra were used as the validation set. The LDA model was built using The Unscrambler X 10.4.
2.3.4. Support Vector Machine (SVM) Classification Model
In principle, SVM uses a kernel function to project the spectral information of samples in higher-dimensional space, constructs the hyperplane with the largest classification interval, and then accurately identifies different types of samples. It is better suited for linearly indivisible sample data, specifically using relaxation variables and kernel functions. In the present study, C-SVM discriminant analysis was performed on data from the calibration and validation sets using The Unscrambler X 10.4. The kernel type was a radial basis function (RBF), and the penalty coefficient (C) was 1. We adopted a 10-fold cross validation during modeling in order to improve the stability of the classification model.
2.3.5. Regression Models
In general, hyperspectral data can be used to explore specific wavelengths and/or indices that are particularly useful for the assessment of plant and ecosystem variables [37]. These wavelengths and/or indices can be used to estimate plant variables based on multivariable statistical methods, such as multiple linear regression (MLR), principal component regression (PCR), partial least squares regression (PLSR), and SVM regression (SVMR) [38,39]. When introducing new independent variables into an MLR model, a collinearity check is essential on the substituted independent variables, and until then, no new variables can be introduced or no existing ones can be removed. The equation is simple and can effectively avoid collinearity between variables. PCR combines multiple features in a high-dimensional space into a few irrelevant principal components and contains most of the variation information in the original data, effectively reducing the amount of data and simplifying operations. PLSR combines the characteristics of MLR, canonical correlation analysis (CCA), and PCR; can avoid the multicollinearity problem; and offers advantages that classic regression methods do not. SVMR uses an inner product kernel function to replace nonlinear mapping in the higher-dimensional space, but it is still better suited when the feature dimension is larger than the sample number. Moreover, SVMR, based on the principle of minimizing the structural risk, avoids overlearning problems and shows high generalizability.
2.4. Evaluation of Precision
In order to compare the predictive performance of various spectral parameters and methods, we used statistical indicators, such as the coefficient of determination (R2), root mean square error (RMSE), and relative error of prediction (REP), defined as follows:
where is the measured values, is the average of the measured values, is the predicted value, and is the number of samples. The closer the value of is to 1, the smaller and are, and the better the model accuracy. We applied 20-fold cross validation to assess the robustness of the estimation models.
2.5. Analytical Framework
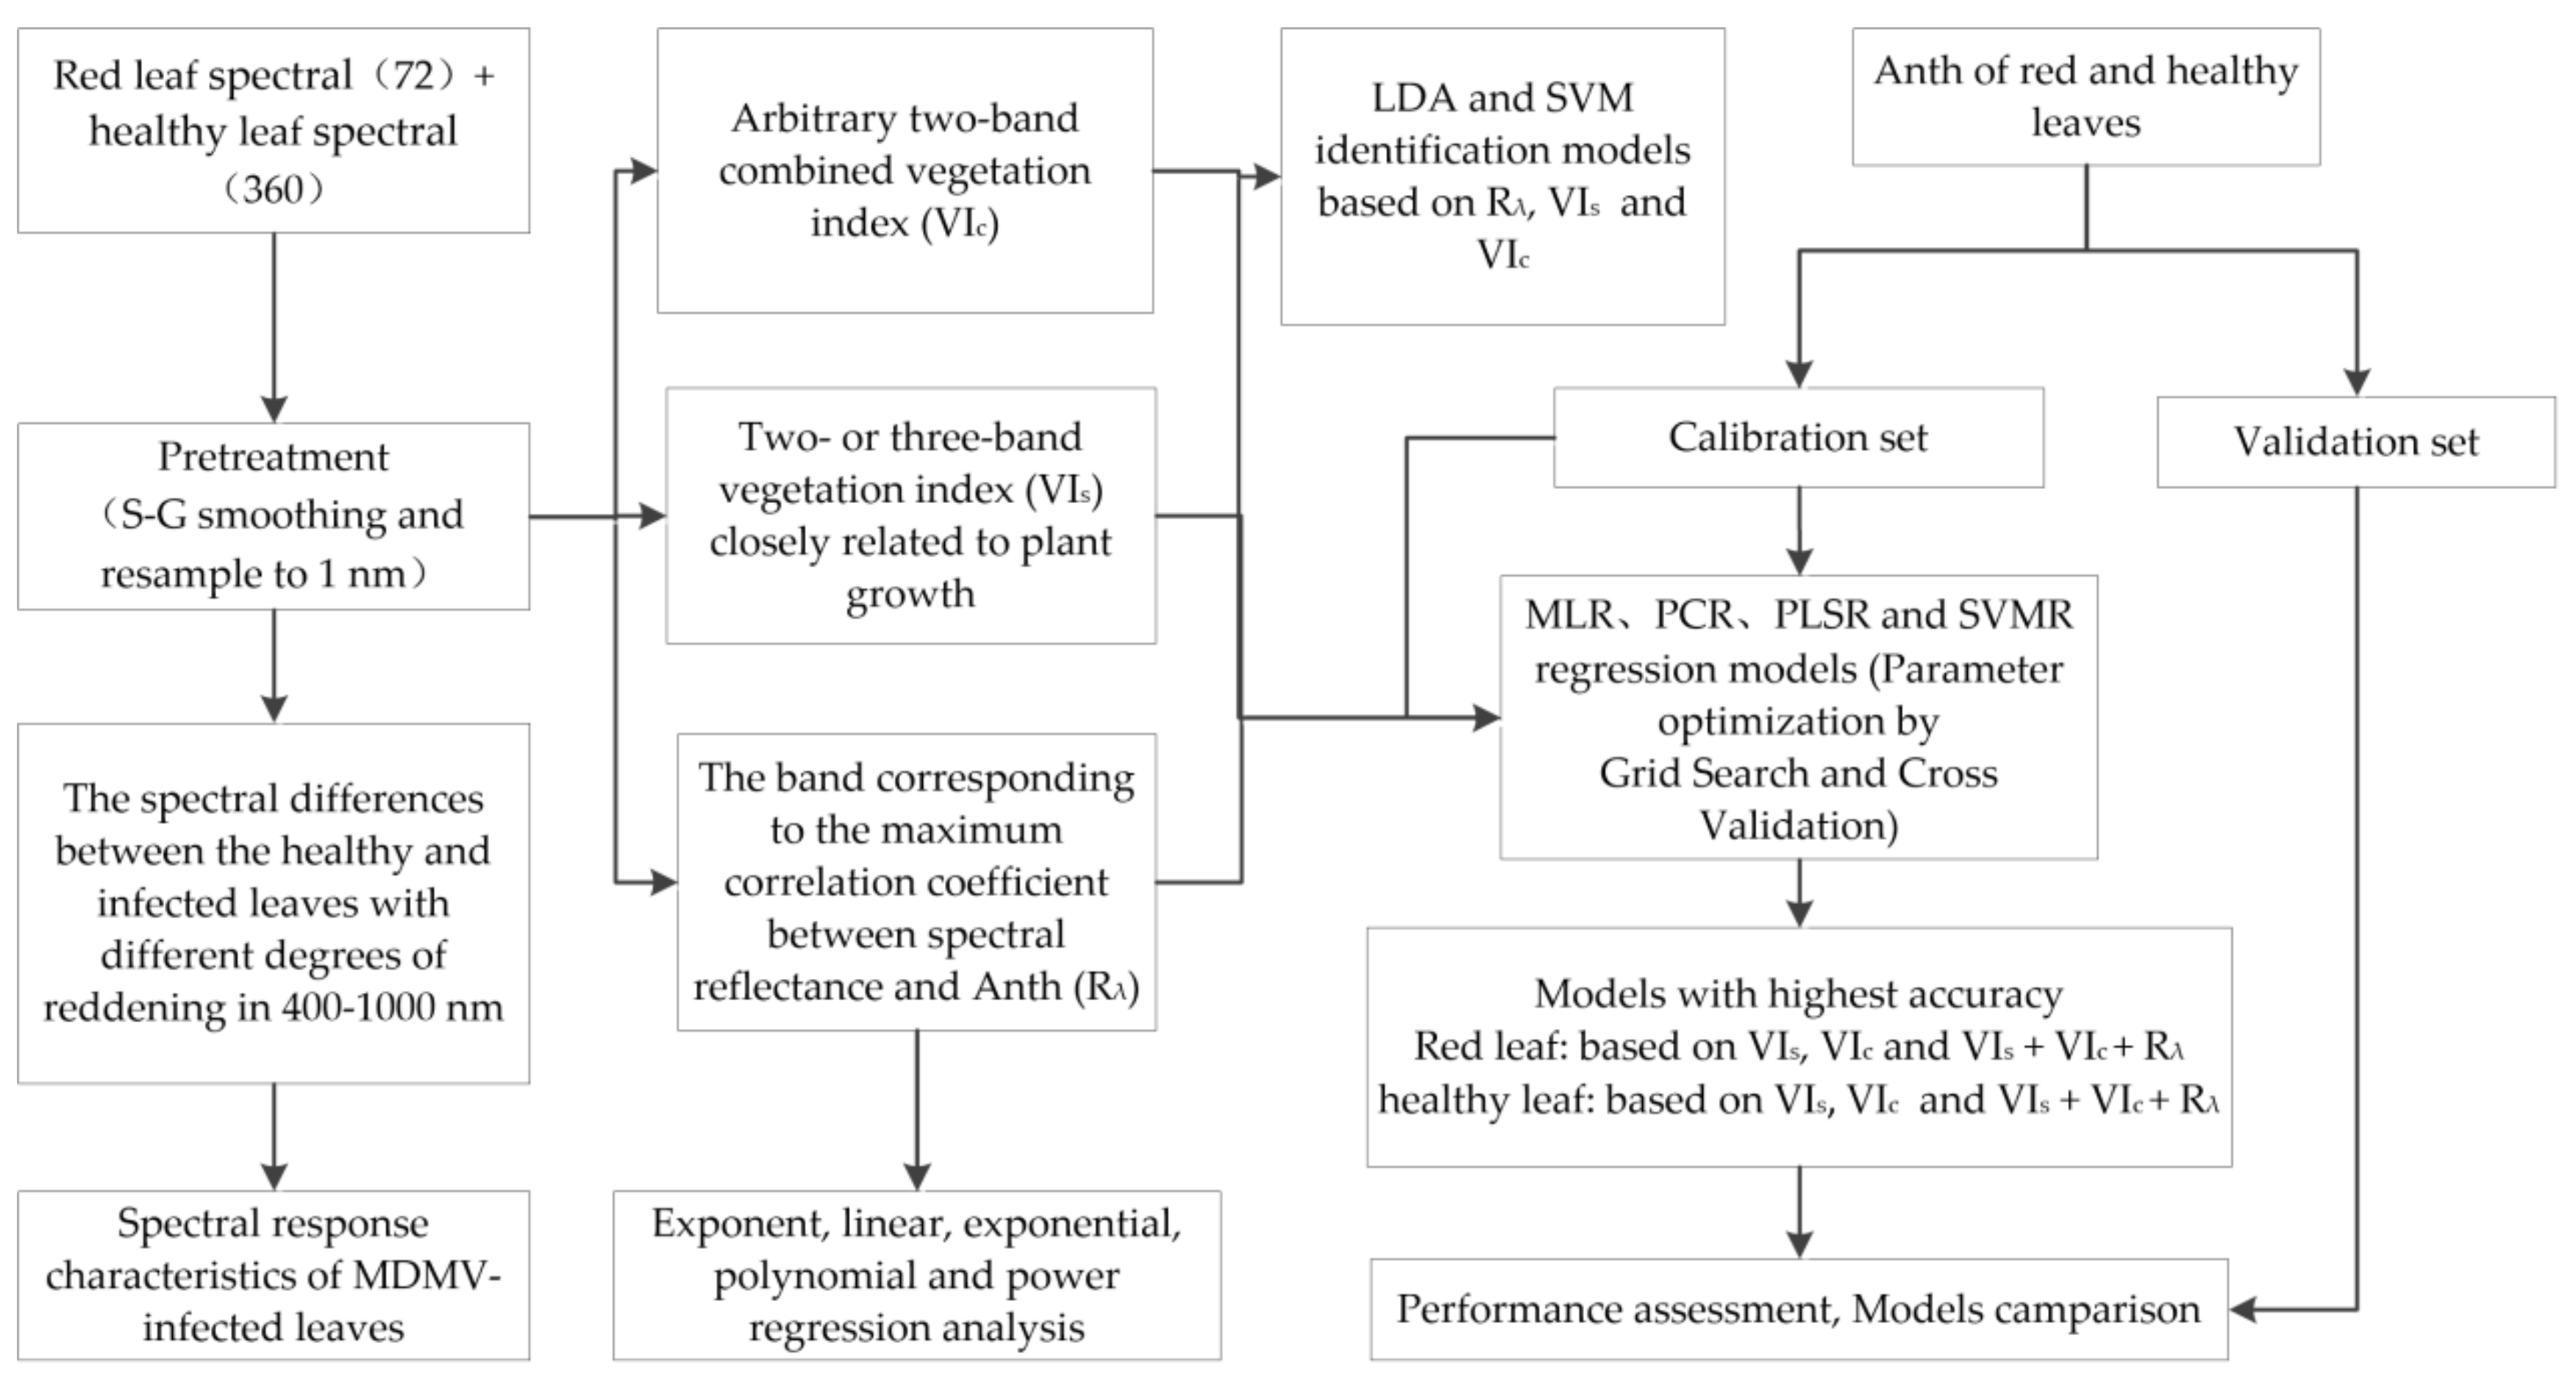
Figure 3 presents the data, methods, and processing steps for the identification of MDMV and severity monitoring of its infection. First, the spectral differences between the healthy and infected leaves with different degrees of reddening were analyzed in order to explore the spectral response characteristics of MDMV-infected leaves, which were the basis for further analyses in the present study. Then, the LDA and SVM classification models for MDMV were constructed based on single-band spectral information (Rλ), two- or three-band VIs, and full-spectrum arbitrary two-band combined vegetation index (VIc). Finally, high-precision Anth estimation models for healthy and red leaves were constructed based on three types of spectral parameters. The details are provided in Results.
3. Results
3.1. Leaf Anth Statistics
The results of the statistical analysis are reported in Table 1. The range of Anth in red leaves was 0.04–0.76 μg·cm−2, which was wider than that in healthy leaves (0.03–0.11 μg·cm−2), although the Anth of two leaves overlapped. The average Anth of red leaves (0.19 μg·cm−2) was much higher than that of healthy leaves (0.06 μg·cm−2). SD, variance, and CV of healthy leaves were small, their Anth distribution was concentrated, and the spatial variability in values was low. In contrast, SD, variance, and CV of red leaves were large, their Anth distribution was scattered, and the spatial variability in values was high.
3.2. Characteristics of Reflectance Spectra
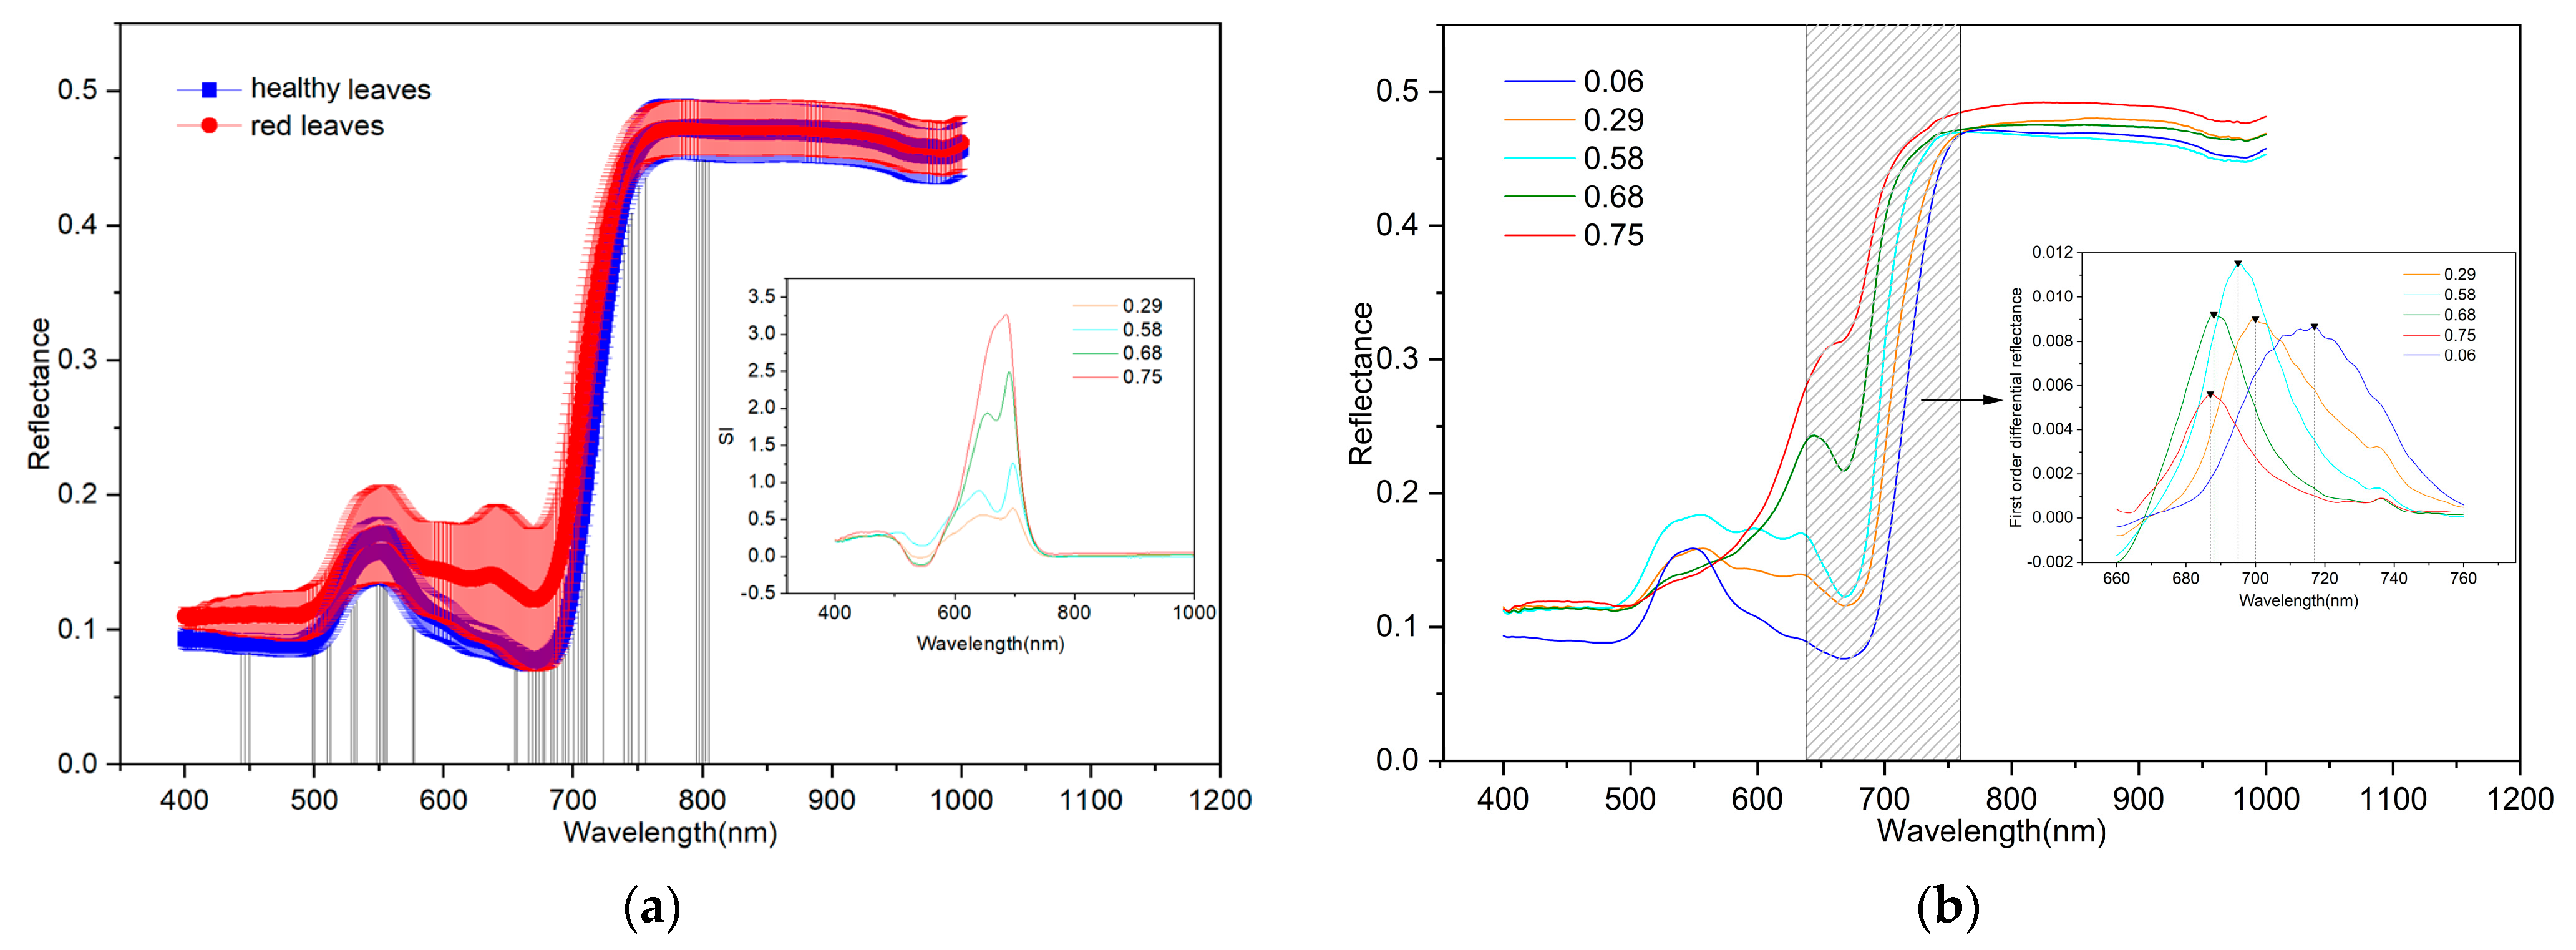
The spectral characteristics of plants are affected by their internal tissue structure, biochemical composition, and morphological features, which together constitute the biophysical and biochemical responses of plants to light. Figure 4a shows the spectra of the red and healthy leaves and SI of red leaves. Evidently, the variation in the spectral reflectance of healthy leaves is smaller than that of red leaves. In the 580–670 nm range, a new reflection peak appeared in the red leaf spectra, which was rather different from that in the healthy leaf spectra. The large SI values were mainly distributed in the 595–764 nm regions, and SI gradually increased with increases in Anth, reaching the maximum value exceeding three. At Anth values of 0.28, 0.58, and 0.68, SI showed obvious bimodal characteristics, and when the Anth value reached 0.75, the bimodal characteristic disappeared. The band corresponding to the maximum SI value appeared near 700 nm.
Selected spectral characteristics of infected leaves with different degrees of reddening (Anth = 0.29, 0.58, 0.68, and 0.75 μg·cm−2) compared with the spectral characteristics of healthy leaves (Anth = 0.06 μg·cm−2) are presented in Figure 4b. The differences were mainly concentrated in the visible and near-infrared ranges (400–750 nm). The spectral curve of healthy leaves (Anth = 0.06 μg·cm−2) showed an obvious absorption valley in the blue band at 450 nm and in the red band at 680 nm, as well as a strong reflection peak in the green band at 550 nm, which is consistent with the typical reflectance spectral characteristics of green plants. However, the spectral curve of red leaves exhibited obvious bimodal characteristics in the visible range (380–760 nm), with the left peak near 550 nm and the right peak near 640 nm. At Anth values of 0.29 and 0.58 μg·cm−2, the reflectance of the left peak was higher than that of the right peak. However, at higher Anth values of 0.68 and 0.75 μg·cm−2, the left peak disappeared, and the right peak increased sharply, forming a characteristic that is obviously different from the spectrum of healthy leaves. With the increase in Anth, the reflectance of the right peak continued to increase, whereas the absorption valley at 680 nm weakened until disappearing. The first-order differential of the original spectrum in the 640–760 nm range was calculated in Figure 4b. With an increase in Anth, the position of the red edge (wavelength corresponding to the maximum value of the first-order differential spectrum) moved in the short-wave direction; this trend is similar to that observed in cotton with different degrees of aphid damage [40]. As such, the higher the Anth is, the more severe the MDMV infection is, resulting in poor photosynthesis and low consumption of long-wave photons.
3.3. Correlation between Anth and Spectral Reflectance
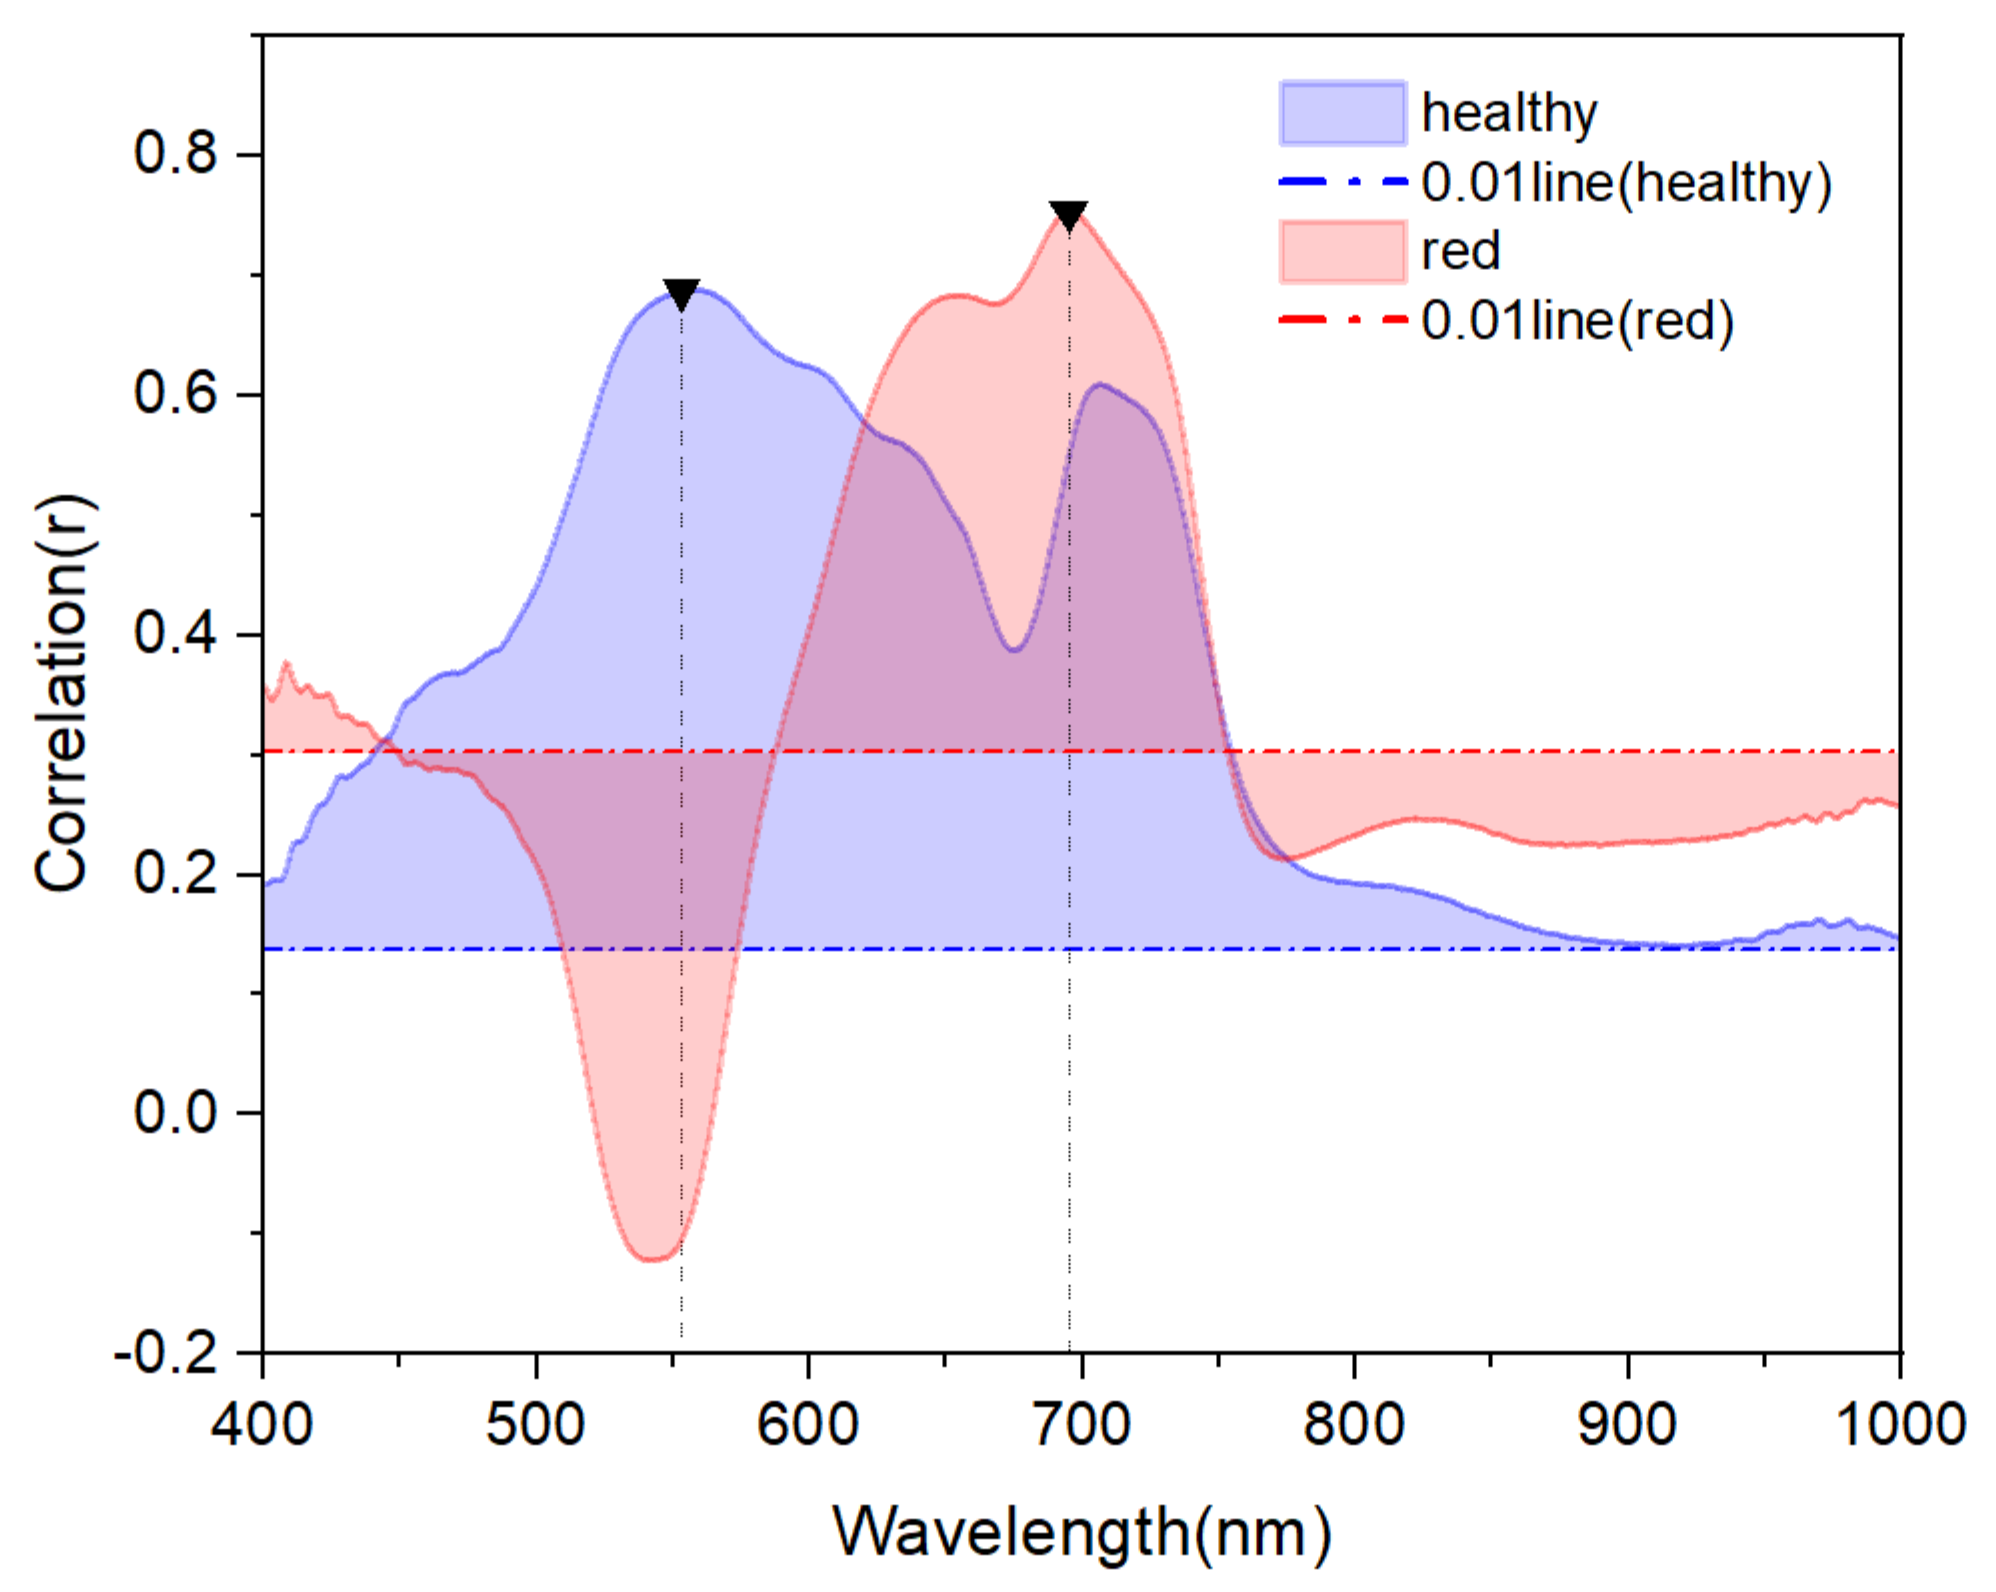
The correlation between spectral reflectance and Anth of the two types of leaves was examined, as shown in Figure 5. The spectral reflectance of red leaves was negatively correlated with Anth in the 520–563 nm region but positively correlated with Anth in the 400–519 and 564–1000 nm regions. In the 400–449 and 587–753 nm regions, there was a strong correlation (P< 0.01), with the maximum correlation coefficient of 0.76 at 695 nm. The spectral reflectance of healthy leaves was positively correlated with Anth in the 400–1000 nm, and all correlations were strong (P< 0.01), with the maximum correlation coefficient of 0.68 at 554 nm.
In the 444–620 nm region, the correlation between the reflectance and Anth was stronger in healthy leaves than in red leaves, due to the strong reflection of Chl in this region, while anthocyanins had little effect on the reflectance of the spectrum in this region. The maximum difference in the correlation coefficient was recorded near 550 nm, coinciding with the position of the reflection peak of the healthy leaf spectrum shown in Figure 4b. In the 400–443, 621–748 and 776–1000 nm regions, the correlation between reflectance and Anth was stronger in red leaves than in healthy leaves due to the strong reflection of anthocyanins in this region. The maximum difference in the correlation coefficient was recorded near 680 nm, coinciding with the position of the right reflection peak of the red leaf spectrum shown in Figure 4b.
3.4. Vegetation Indices
3.4.1. Various Vegetation Indices
The vegetation index can reduce the influence of sensors and environment on the target through normalization and derivative processing as well as by improving data utilization efficiency through the use of several selected bands [41]. Numerous vegetation indices have been constructed to estimate the biophysical and biochemical properties of plants. In the present study, 12 vegetation indices with good correlation to Anth were selected, as shown in Table 2. Seven two-band vegetation indices and five three-band vegetation indices were included. The bands used in the vegetation indices are marked in Figure 4a. Specifically, the selected bands were mainly concentrated around 500–575, 670–725, 750, and 800 nm.
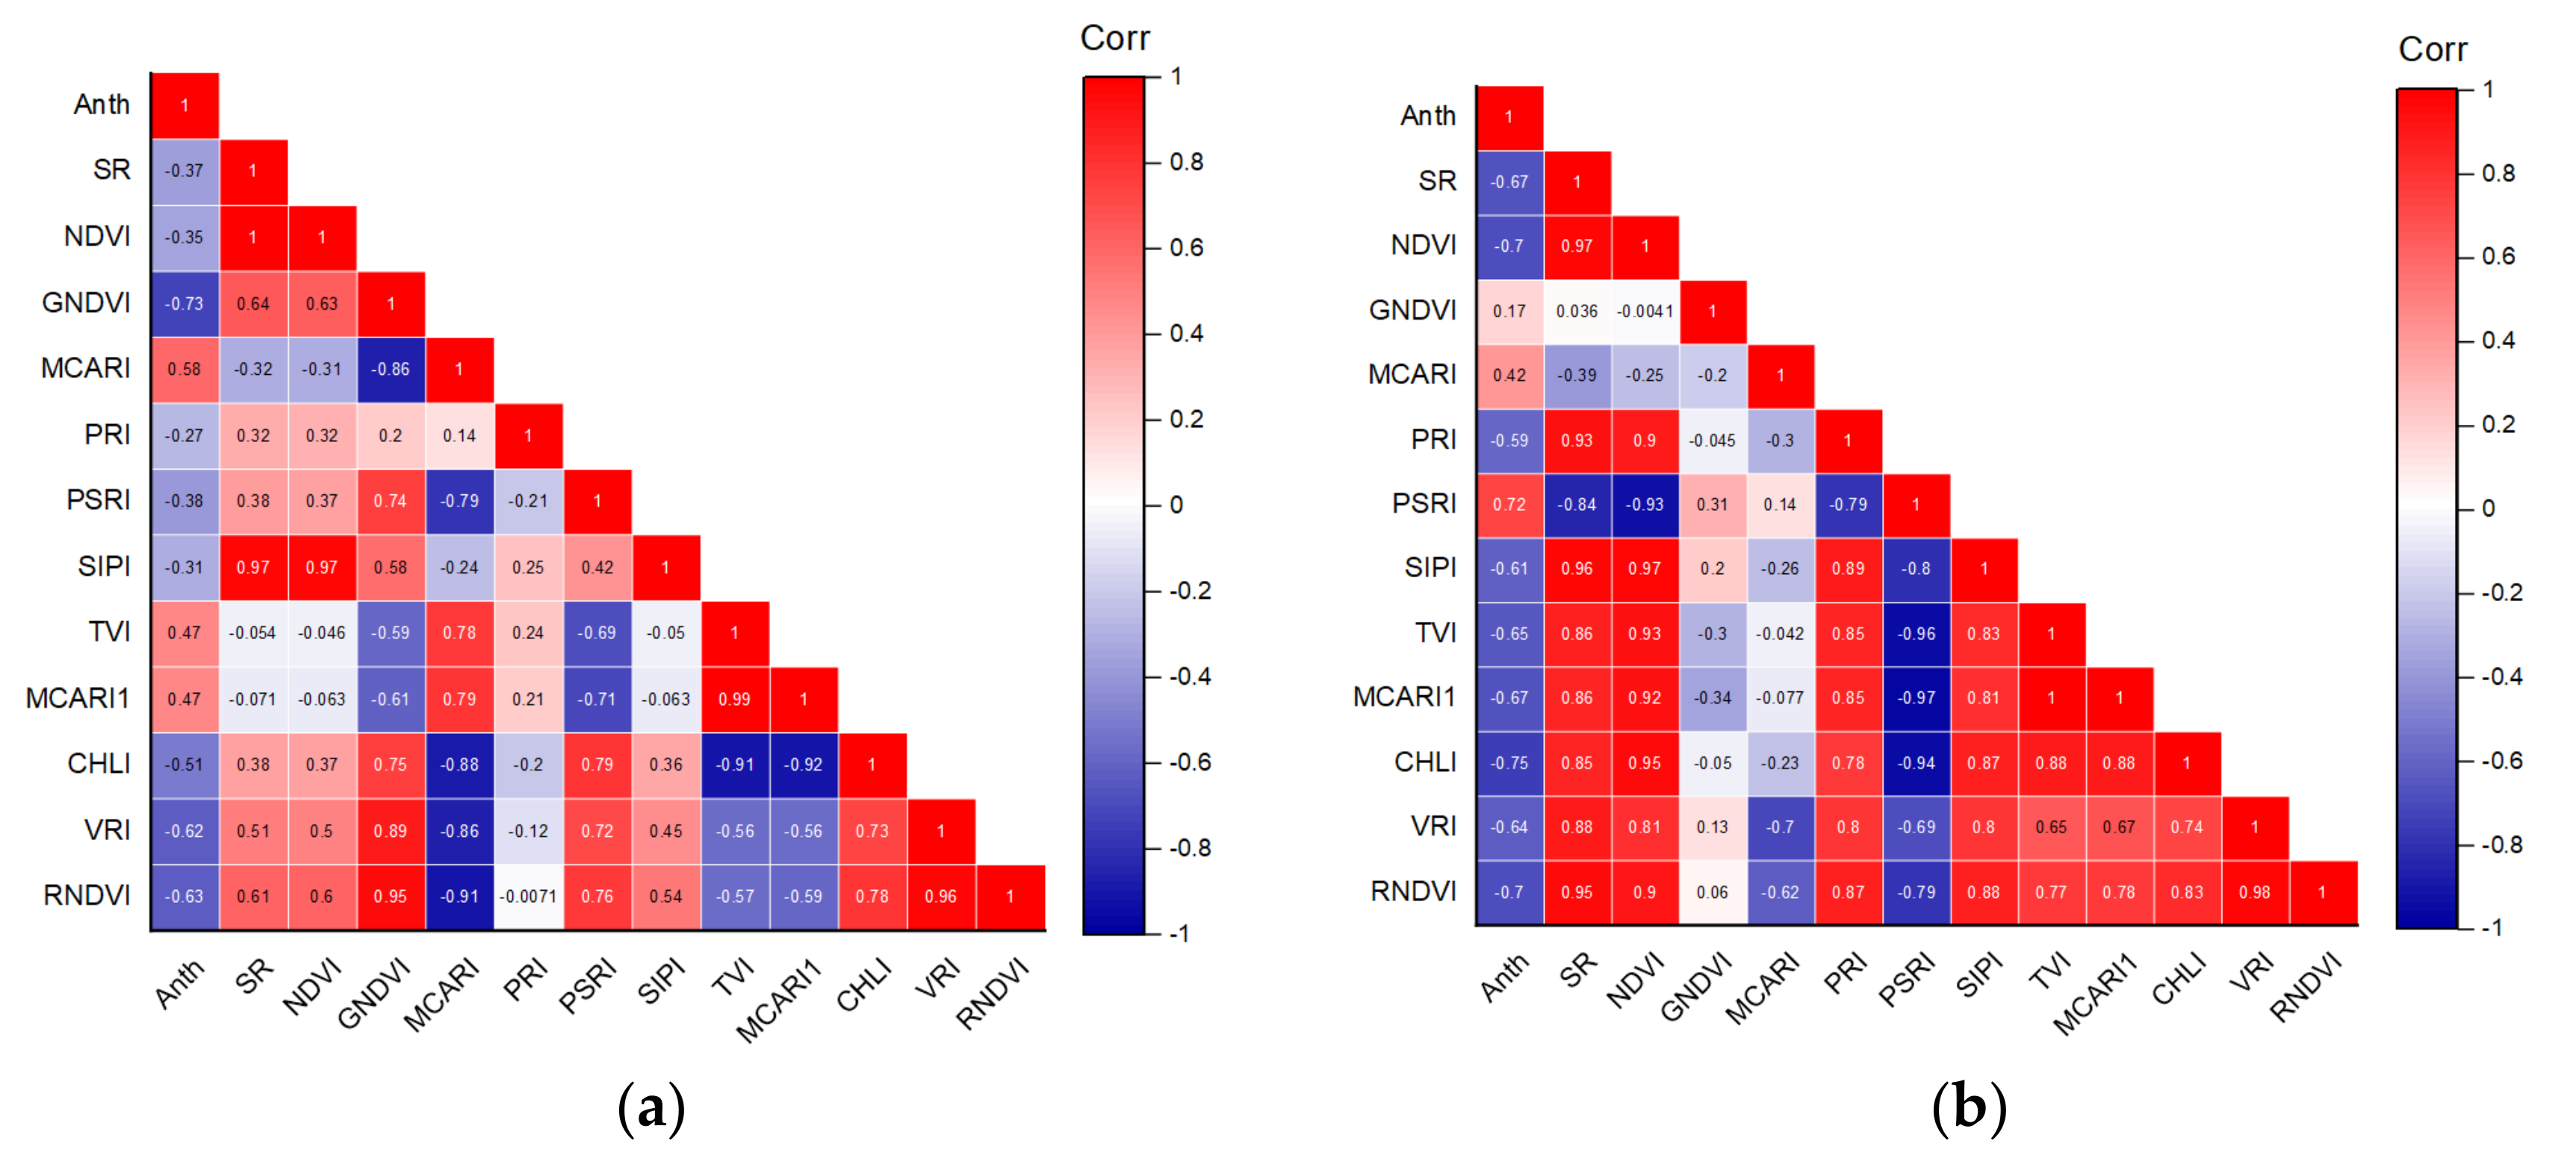
The correlations between the vegetation indices and Anth are shown in Figure 6. Among the two-band VIs, CHLI (700,710), VRI (740,720), and RNDVI (750,705) showed a strong correlation with the Anth of healthy and red leaves. Among the three-band vegetation indices, PSRI was strongly correlated with the Anth of red leaves, and MCARI was strongly correlated with the Anth of healthy leaves. There were significant correlations between the vegetation indices and Anth in healthy leaves (P< 0.01), with GNDVI achieving the highest correlation coefficient of −0.73. In red leaves, CHLI achieves the highest correlation coefficient of −0.75.
3.4.2. VIc Based on Two Arbitrary Bands
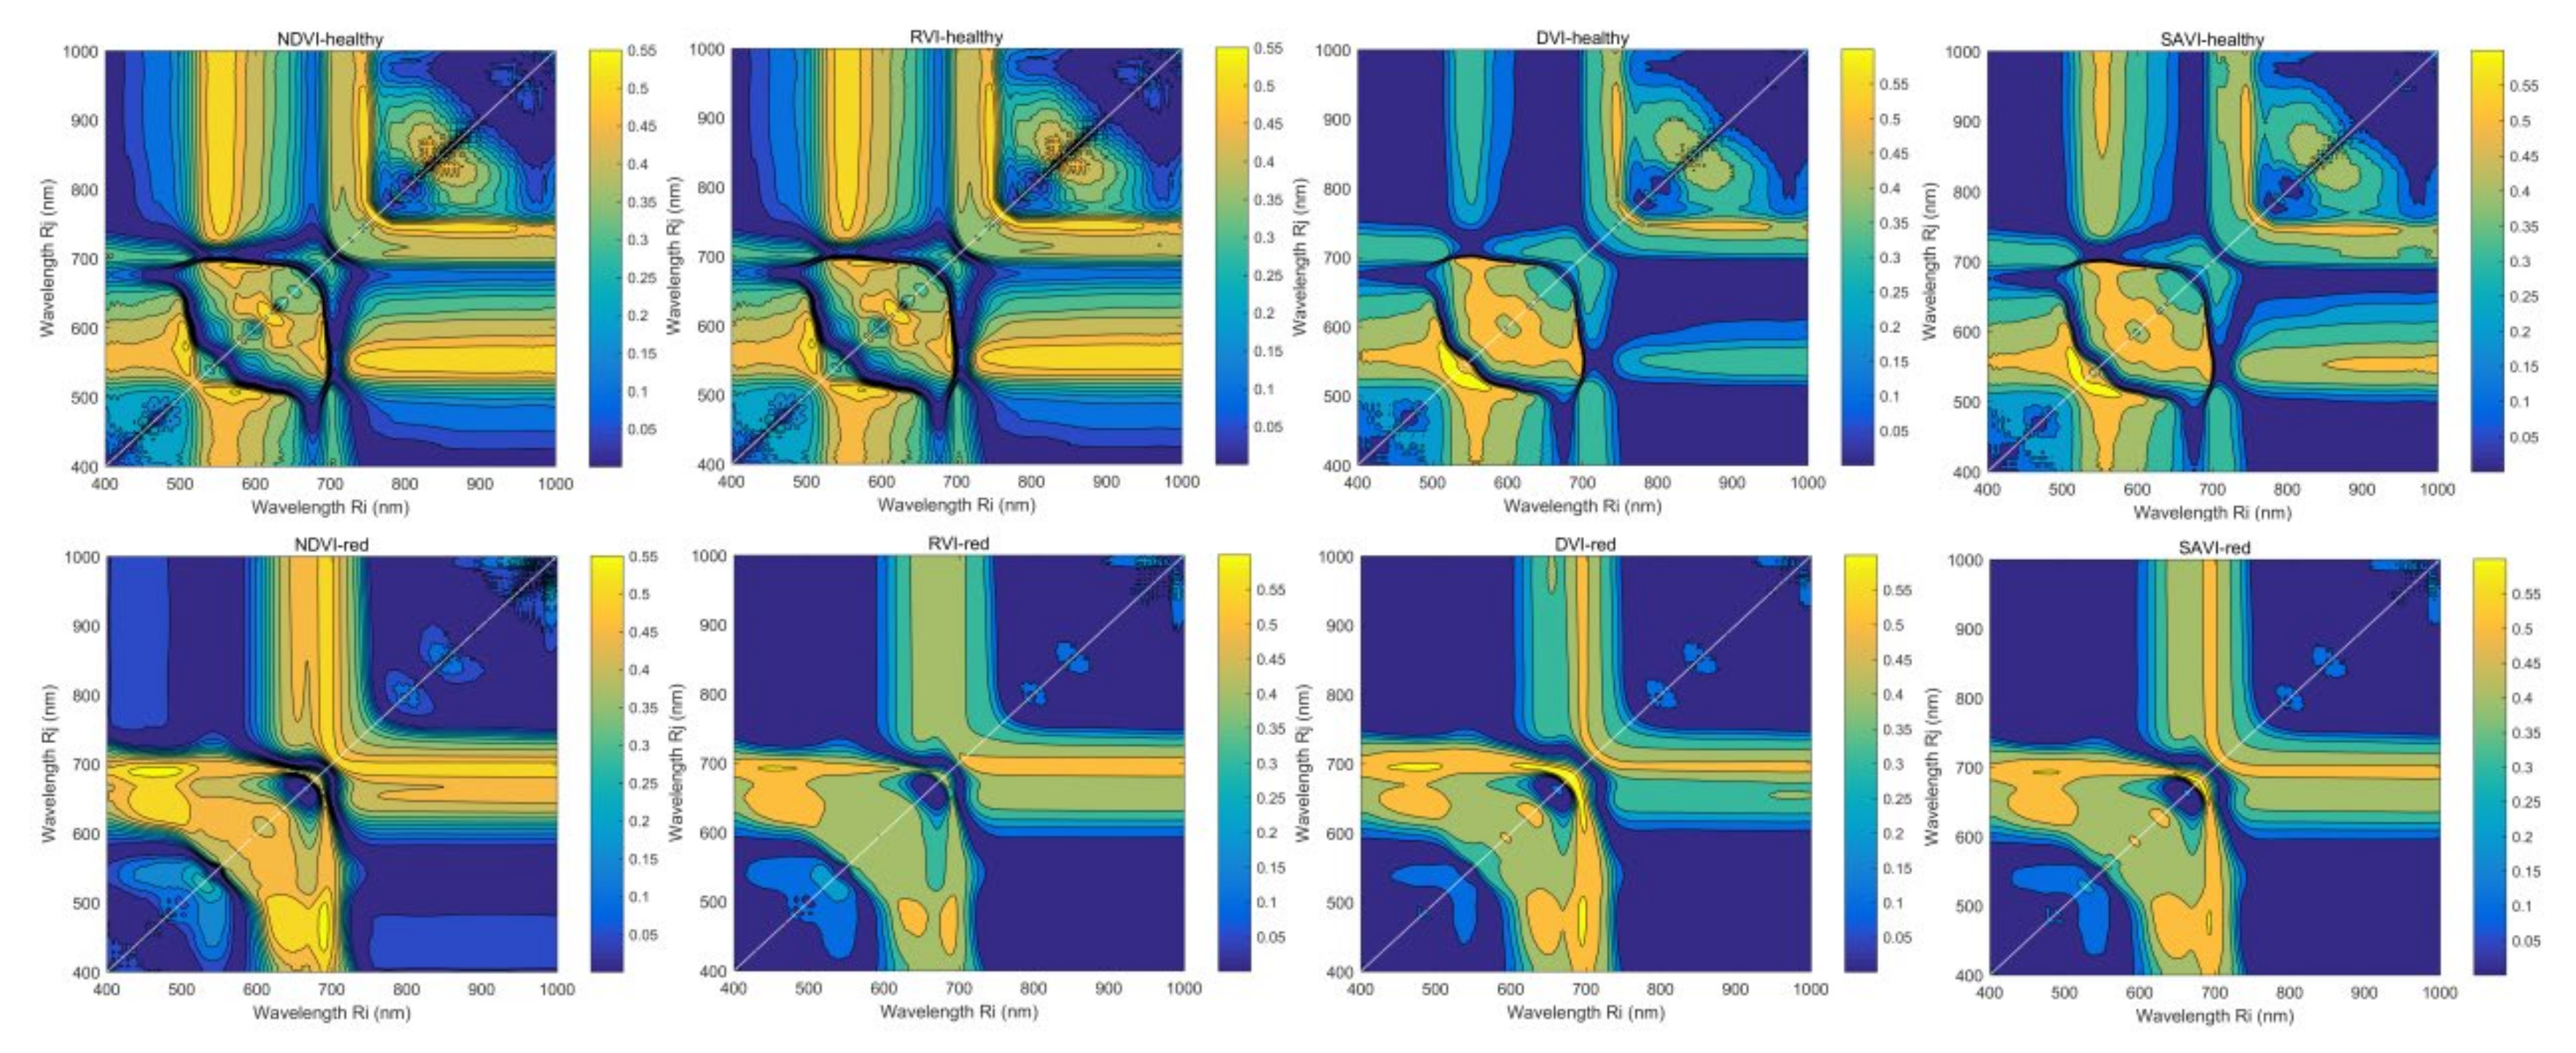
The coefficients of determination (R2) between plant-specific variables, and VIc can reflect the predictive power of two independent band combinations. Figure 7 shows the contour maps of R2 between Anth and NDVI, RVI, DVI, and SAVI using all combinations of two wavebands at i and j nm, which are very useful for selecting effective bandwidths and various combinations of wavelengths. For healthy leaves, the most significant areas noted around NDVIh, RVIh, DVIh, and SAVIh were (R573, R507), (R572, R507), (R547, R522), and (R547, R518), respectively, and DVIh was the most significant VIc with an R2 of 0.65. The contour map of NDVIh was very similar to that of RVIh, and their significant bands and maximum R2 values were close. For red leaves, the most significant areas noted around NDVIr, RVIr, DVIr, and SAVIr were (R689, R461), (R460, R692), (R690, R656), and (R685, R667), respectively, and DVIr was the most significant VIc with an R2 of 0.68. With the exception of RVIh and RVIr, the other vegetation indices showed symmetric spatial distribution patterns of R2.
3.5. MDMV Identification
The results of the LDA and SVM classification models constructed based on Rλ, VIs, and VIc are shown in Table 3. All models could identify healthy leaves, and the models primarily differed in terms of their identification accuracy of red (i.e., infected) leaves. Both LDA and SVM classification models based on Rλ showed low accuracy, and the number of red leaves identified by the LDA-Rλ model was even lower than zero. Therefore, Rλ is not suitable for the RS-based identification of MDMV-infected leaves. Based on VIs, the SVM model performed better than the LDA model, and the recognition accuracy of the calibration and validation sets exceeded 75% for the former. This is because the SVM algorithm has high classification accuracy and generalizability when the sample size is small, and it performs better in solving classification problems with high-dimensional features [54,55]. In addition, the RBF kernel function used by the SVM algorithm can be adjusted by using a grid search to obtain a better classification model [56,57]. The accuracy of both LDA and SVM classification models based on VIc was 100%, which is significantly higher than that of models based on Rλ and VIs and shows obvious superiority in the RS-based detection of MDMV. This is because the input parameter VIc is constructed based on the spectrum of normal leaf and red leaf at any two bands in the 400–1000 nm region, which has its uniqueness. Moreover, in the VIc contour maps of the red leaves, the most significant areas noted around NDVIh, RVIh, DVIh, and SAVIh were (R573, R507), (R572, R507), (R547, R522), and (R547, R518). In the VIc contour maps of the healthy leaves, the most significant areas around NDVIr, RVIr, DVIr, and SAVIr were (R689, R461), (R460, R692), (R690, R656), and (R685, R667). These bands are located in the wavelength region corresponding to the high SI value, and there is a large difference between the two leaves in this region. In addition, the difference was further enhanced by using difference and ratio calculation to construct the vegetation index, thus achieving the high-precision identification of MDMV-infected and healthy leaves.
3.6. Classic Regression Analysis Based on a Sensitive Band
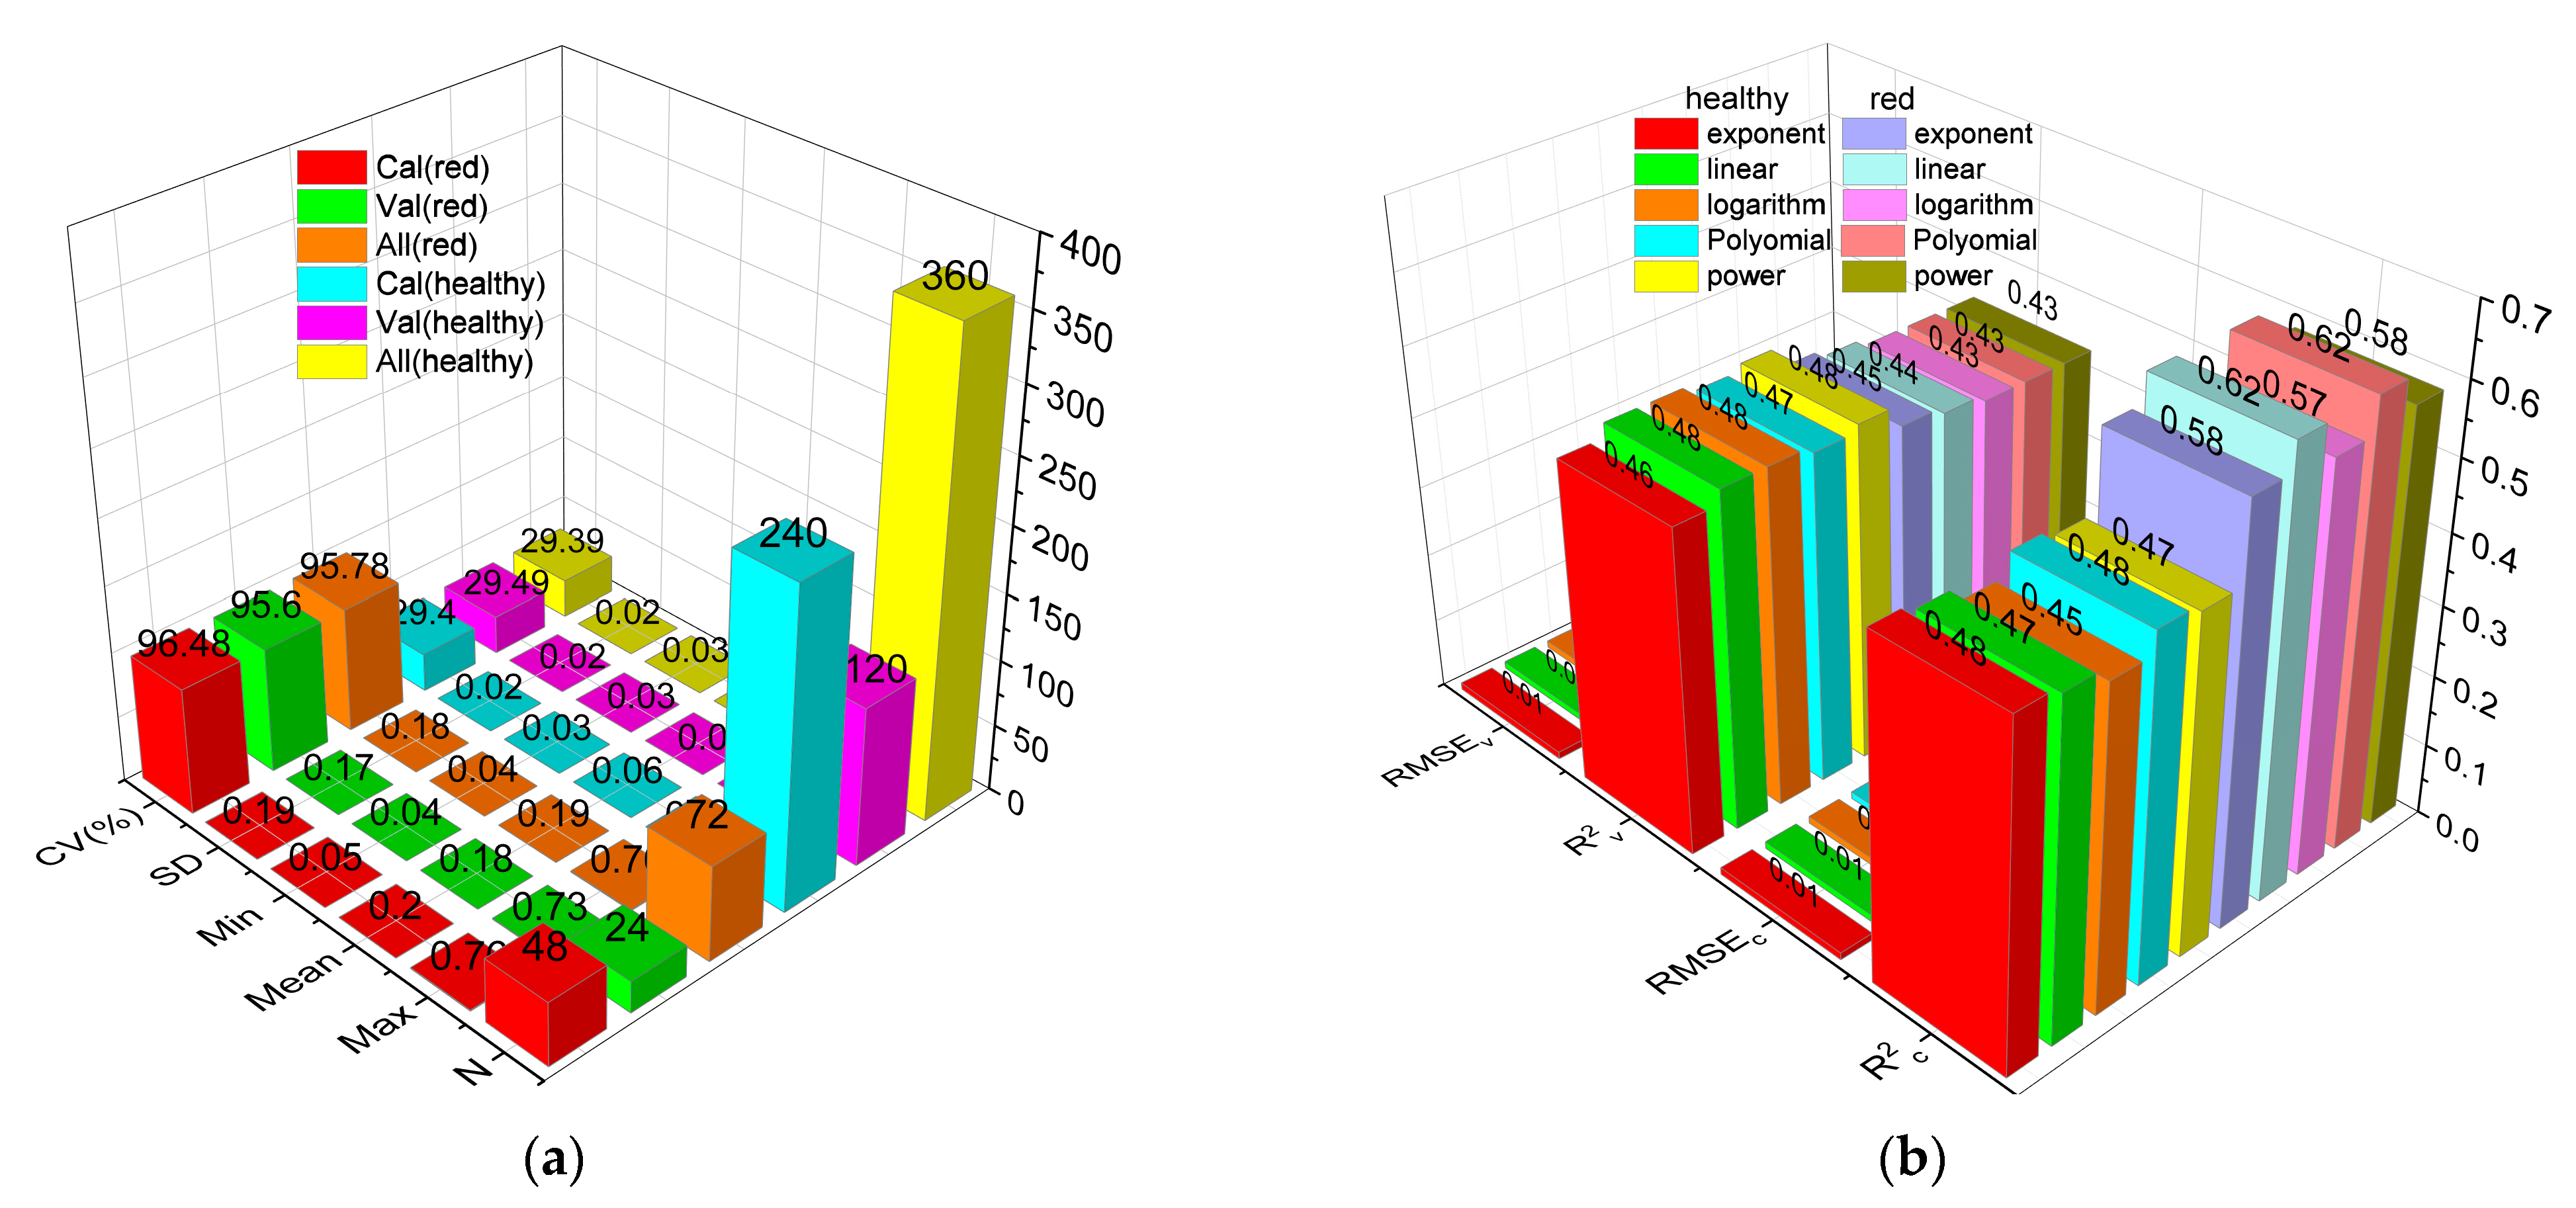
In the present study, random stratified sampling was used to divide the dataset at a ratio of 2:1 for obtaining representative samples for calibration and validation. The statistics of the calibration and validation datasets are shown in Figure 8a. The statistics of the calibration and validation datasets were similar for red leaves (max = 0.76 and 0.73; min = 0.05 and 0.04; mean = 0.20 and 0.18; SD = 0.19% and 0.17%; and CV = 96.48% and 95.60%, respectively). For healthy leaves, the maximum values of the calibration and validation datasets were 0.11 and 0.10, respectively, and the remaining statistical parameters were identical between the two datasets. Furthermore, the distribution of calibration and validation data was consistent with that of all data.
Exponent, linear, exponential, polynomial, and power regression models for Anth were built based on the spectral reflectance of red leaves at 665 nm (R695) and healthy leaves at 554 nm (R554). The R2c, R2v, RMSEc, and RMSEv for each model are shown in Figure 8b. For the same sample, while the differences in RMSEc and RMSEv were small, R2c and R2v were significantly different among the various models. Among the models for healthy leaves, the exponential and polynomial models produced reliable results (R2c = 0.48, R2v = 0.46). Among the models for red leaves, the linear model produced the most reliable results (R2c = 0.62, R2v = 0.44). The R2c and R2v values of the univariate regression (UR) model for Anth based on Rλ were high (p < 0.01); however, model accuracy remained low, and it could not accurately estimate the anthocyanin content of leaves.
3.7. Anth Regression Models Based on VIs, VIc, and VIs + VIc + Rλ
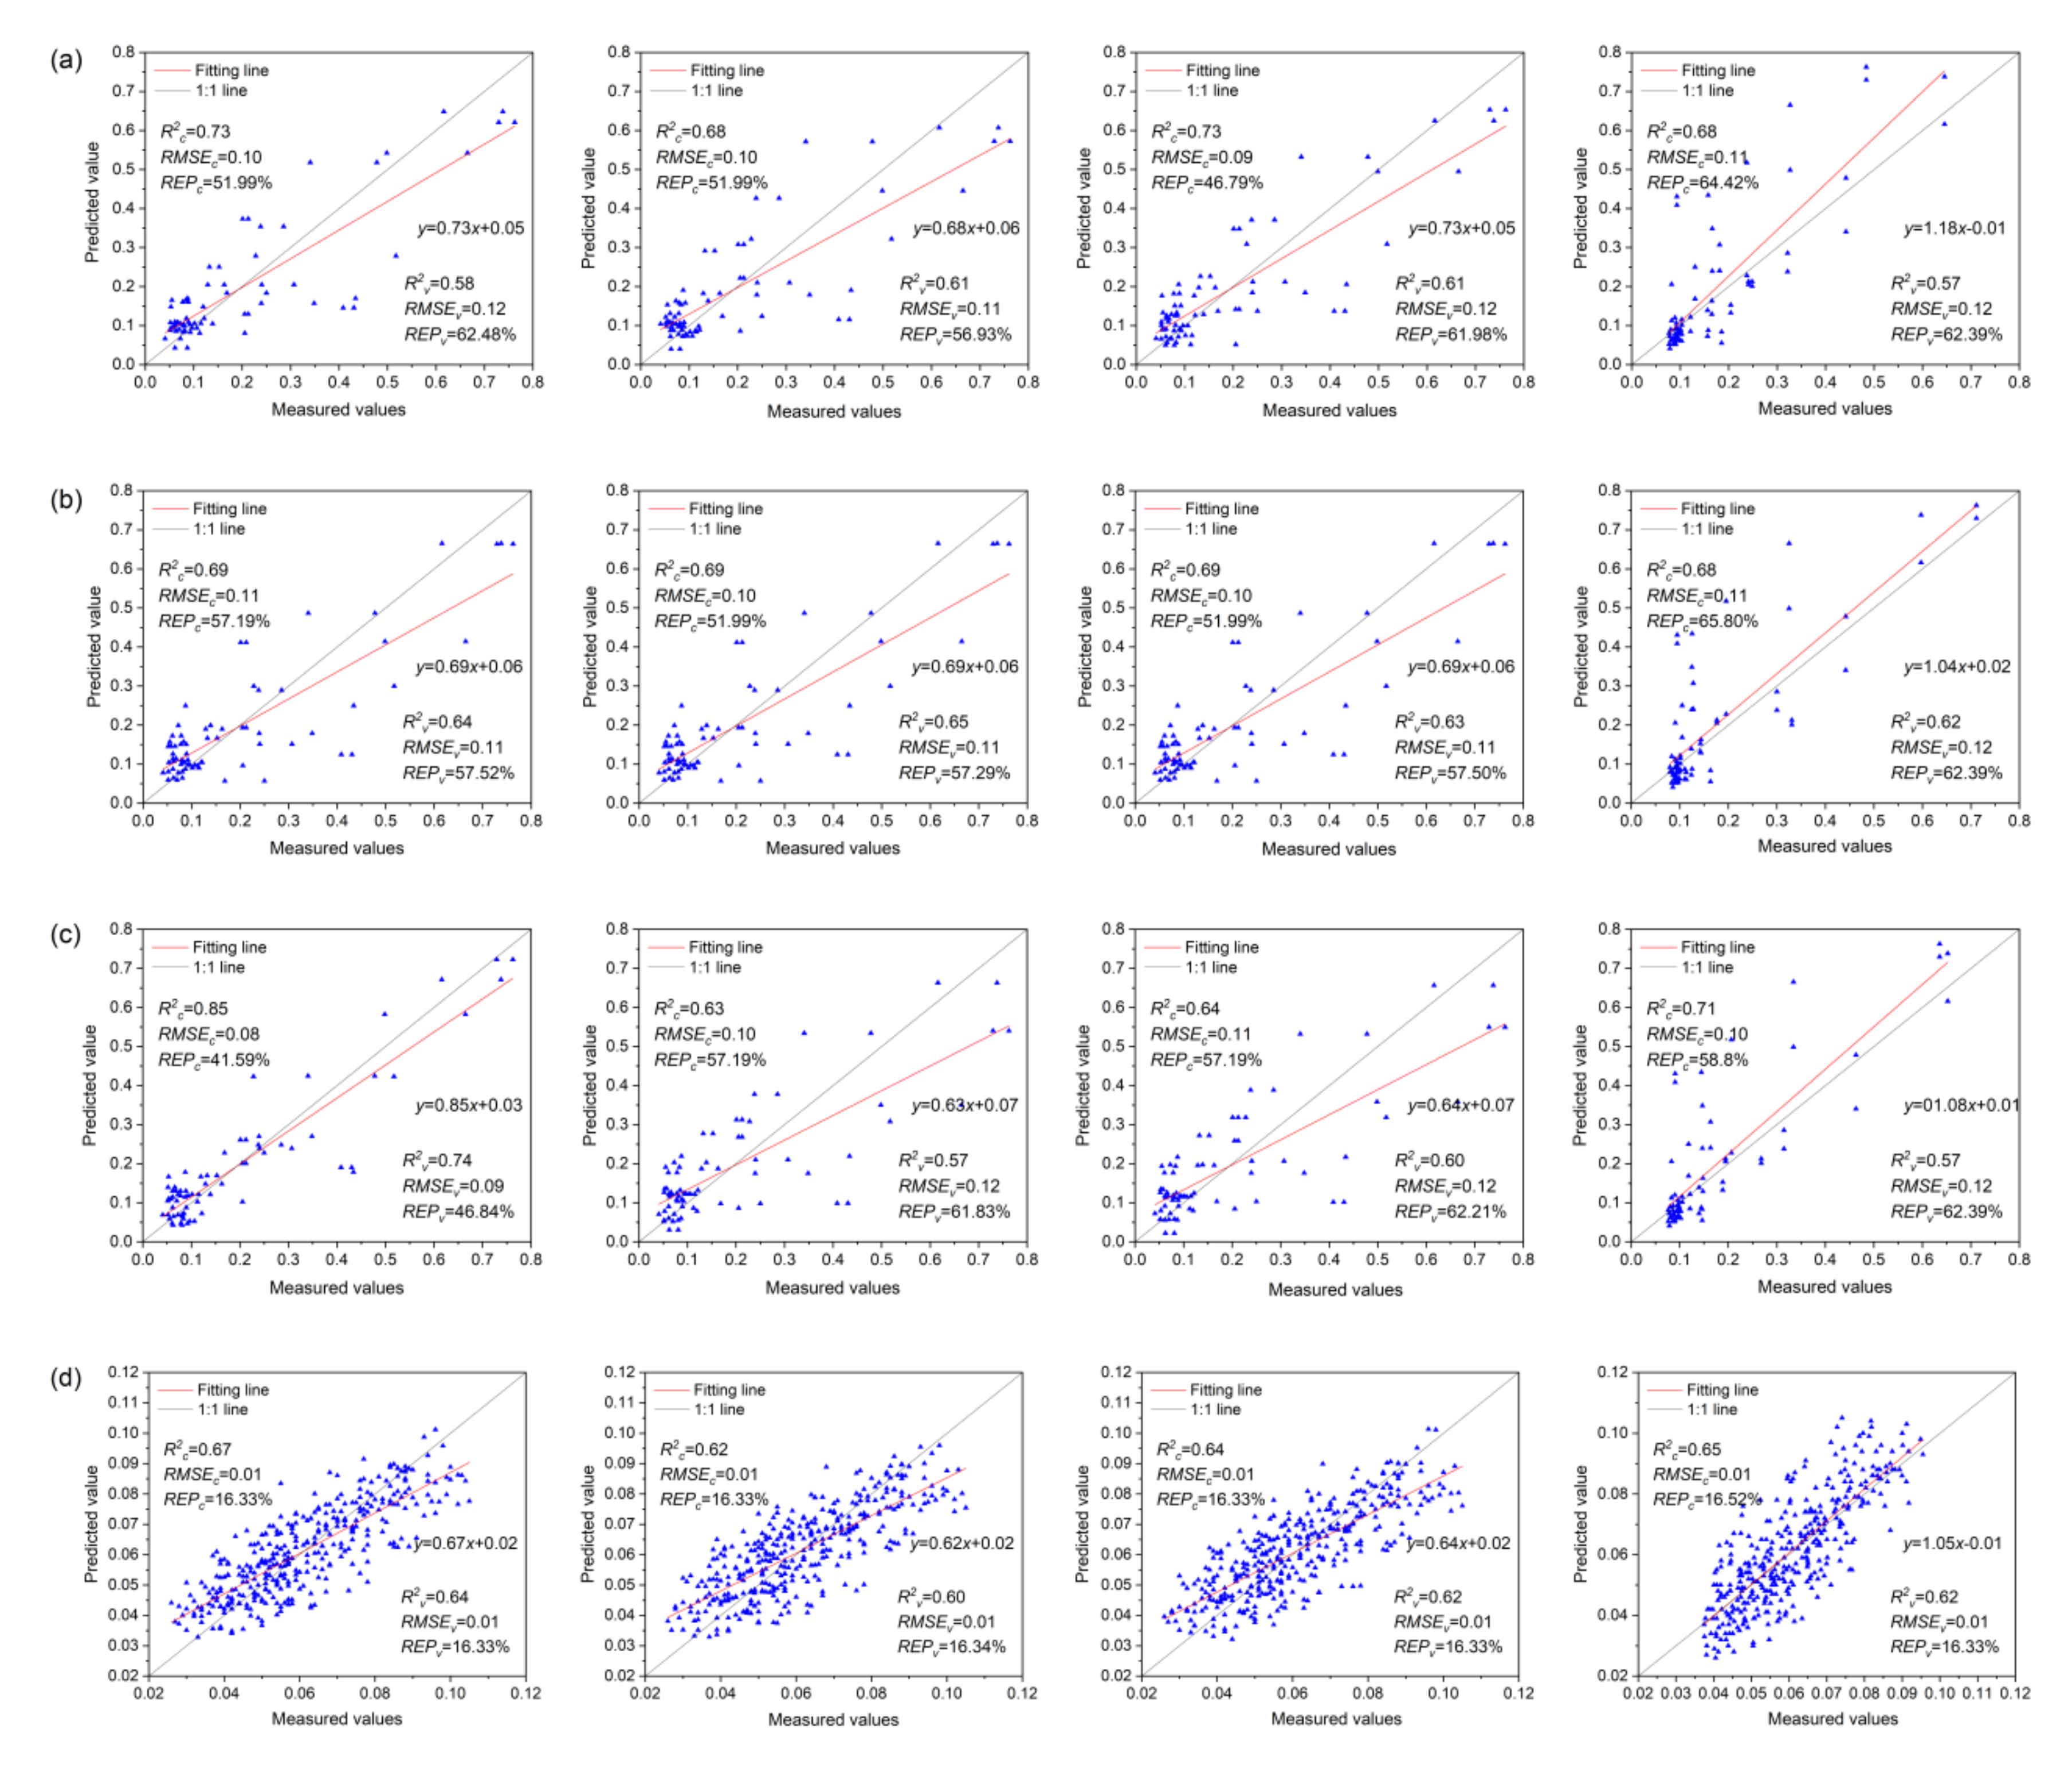
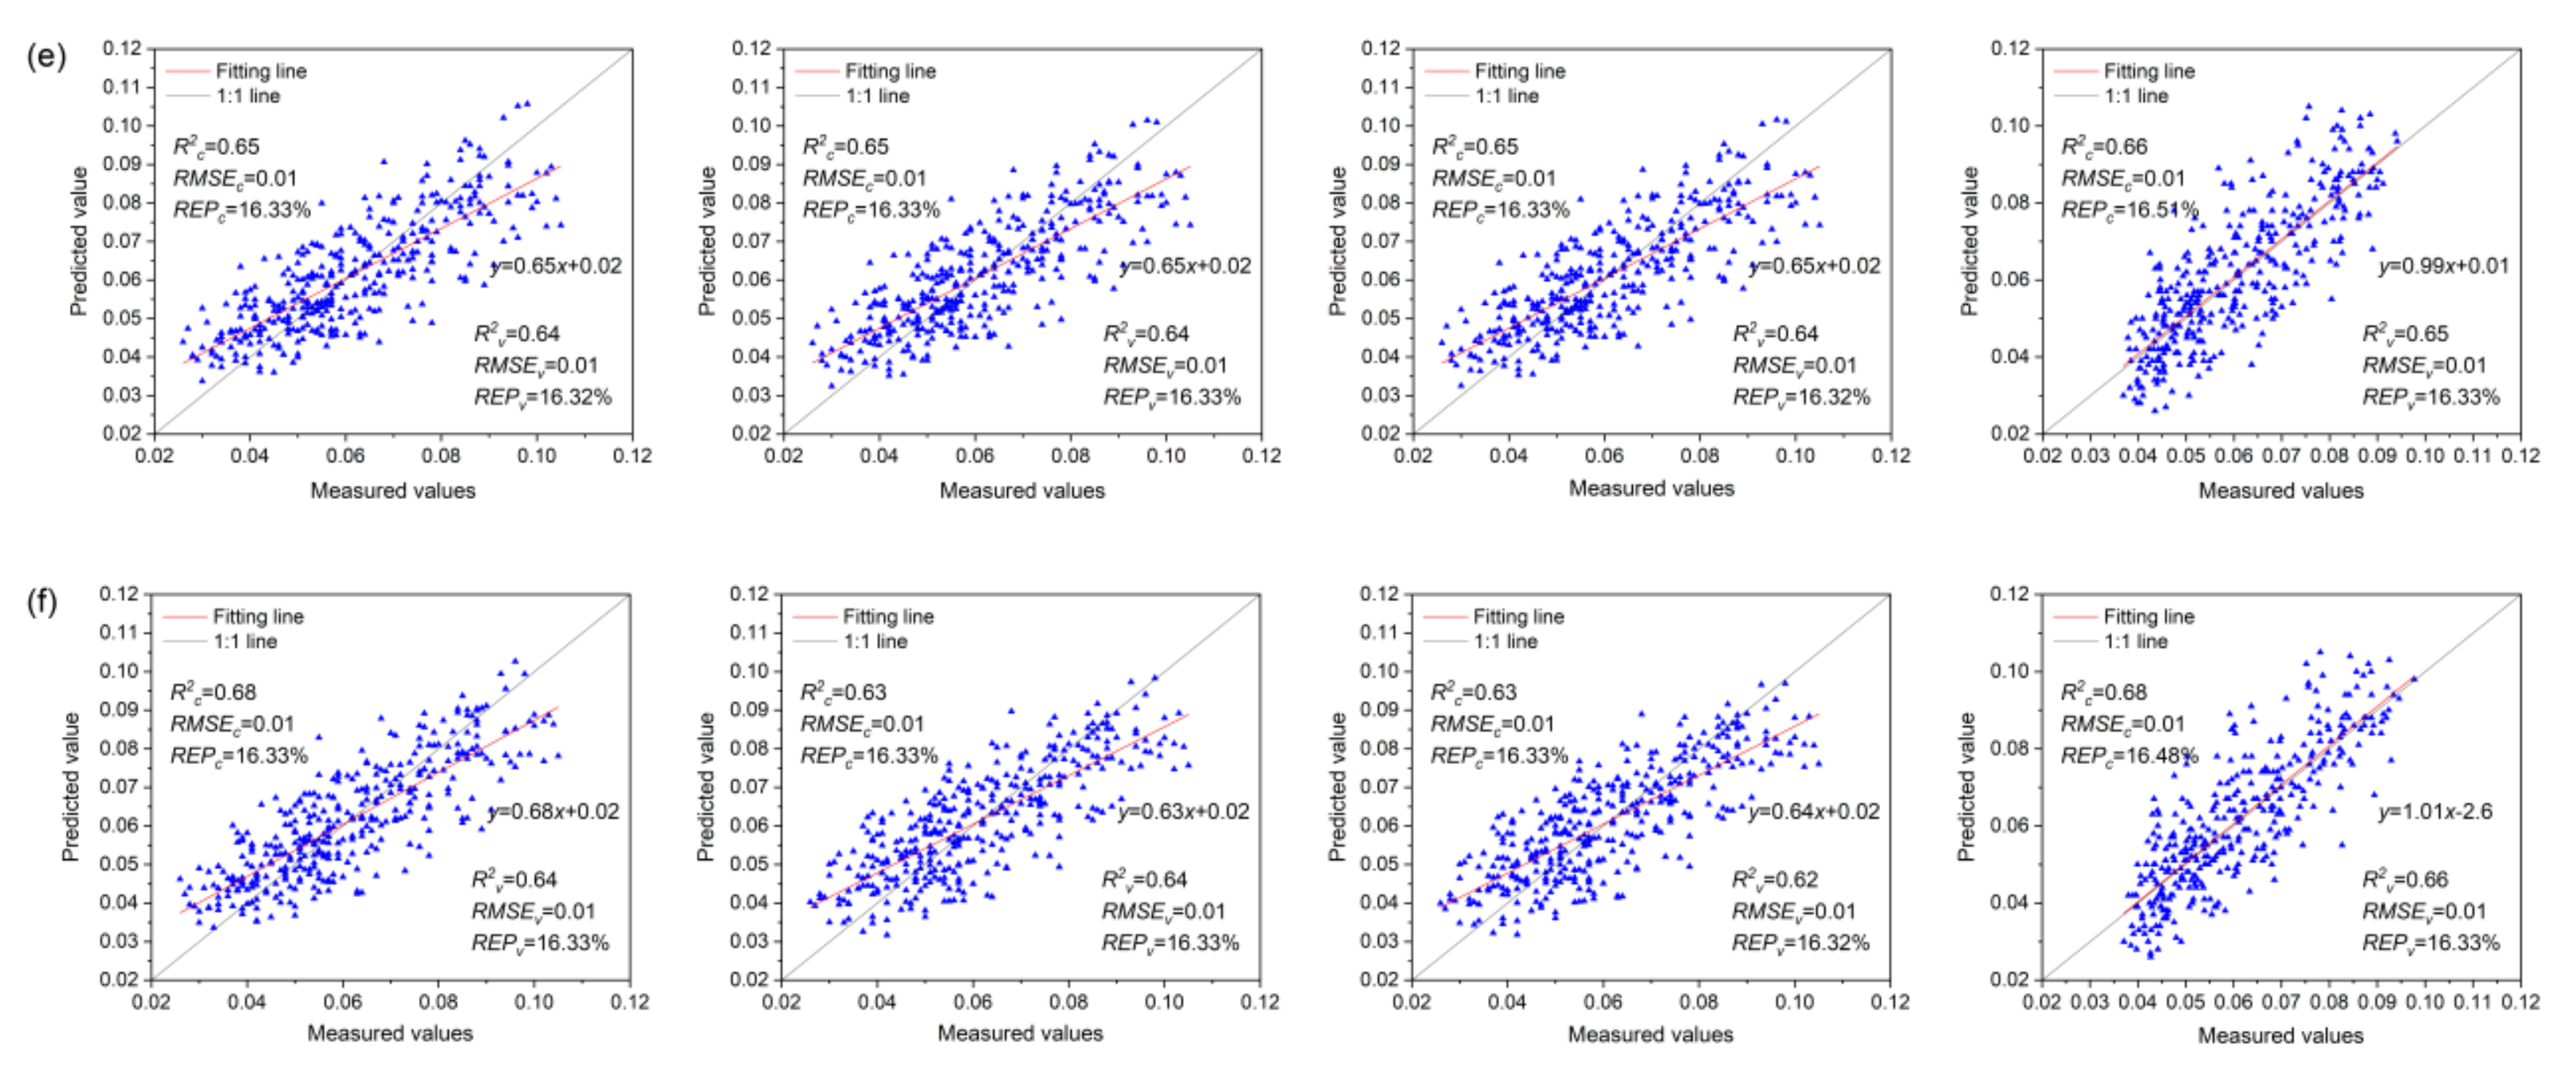
The Anth estimation models for red and healthy leaves based on VIs, VIc, and VIs + VIc + Rλ and constructed using MLR, PCR, PLSR, and SVMR are shown in Figure 9. The range of R2c and R2v values of the Anth models for red leaves was 0.63–0.85 and 0.57–0.74, respectively. Among the models based on VIs, the PLSR model (R2c = 0.73, R2v = 0.61) showed the highest accuracy, followed by the MLR model. Among the VIc-based models, the R2c of the MLR, PCA, and PLSR models was equal, and the difference in R2v was small. The SVMR model showed the highest accuracy (R2c = 0.68, R2v = 0.62). Among the models based on VIs + VIc + Rλ, the MLR model showed the highest R2c, followed by the SVMR model. However, there was overfitting in the SVMR model, with a small R2v; this can be attributed to the small number of red leaf spectra and a few outliers in the samples that affected the optimal classification hyperplane of the SVM. The most accurate Anth estimation model for red leaves was the MLR model based on VIs + VIc + Rλ (R2c = 0.85, R2v = 0.74), which can be used for the quantitative estimation of Anth in red leaves as a measure of MDMV infection severity.
The range of R2c and R2v values in the Anth models for healthy leaves was 0.62–0.68 and 0.60–0.66, respectively. Among the models based on VIs, the MLR model (R2c = 0.67, R2v = 0.64) showed the highest accuracy. Among the models based on VIc, the R2c and R2v of the MLR, PCA, and PLSR models were identical (R2c = 0.65, R2v = 0.64), and the modeling method showed little effect on accuracy. Among the models based on VIs + VIc + Rλ, the SVMR model showed the highest accuracy (R2c = 0.68, R2v = 0.66), which can be used to accurately estimate the Anth of healthy leaves for promptly monitoring the health status of maize.
In the distribution diagram of the measured and predicted values of red leaves, most points with small Anth were concentrated near the 1:1 line. However, the points with large Anth were distributed far from the 1:1 line, and the red leaf models showed satisfactory predictive performance for the small values of Anth but poor performance for large values. First of all, most of the leaf samples collected in this study were mildly infected with MDMV, and their Anth content was small. Only a few samples were seriously infected with MDMV and had high Anth. Moreover, MDMV-infected leaves were randomly collected in the entire study area, which had nothing to do with the fertilization situation in the plot and also resulted in the uneven distribution of sample data. As shown in Figure 9a, the model input parameter VIs includes a vegetation index with good effects in previous studies on the biophysical and biochemical parameters of healthy leaves (with low Anth content). It is not reconstructed for MDMV-infected leaves so that the model has a poor fitting effect on the high value of Anth. In the models of Figure 9b, only the reflectivity of 400–1000 nm was considered in the construction of the input parameter VIc, which did not make full use of all the spectral information that could be detected by the spectroradiometer. Therefore, the ability of these models to estimate Anth is limited. The model in Figure 9c uses Rλ + VIs + VIc as input to estimate Anth in red leaves. Compared with the model in Figure 9a,b, the accuracy is improved to some extent, but the good fitting effect is still a low Anth.
In the distribution diagram of the measured and predicted values of healthy leaves, all points were evenly distributed on both sides of the 1:1 line, and the healthy leaf models showed a better fit to the Anth values than the red leaf models. This is because healthy leaves were collected in plots with different fertilization; Anth data were evenly distributed and showed no obvious aggregation. Therefore, the models in Figure 9d–f had good fitting effects on both high and low values. MDMV-infected leaves were mainly distributed in the plots with 0 kg P2O5·ha−1 + 90 kg N·ha−1, 60 kg P2O5·ha−1 + 90 kgN·ha−1, 90 kg P2O5·ha−1 + 90 kg N·ha−1, and 120 kg P2O5·ha−1 + 90kg N·ha−1. It can be easily observed that the spatial distribution of MDMV-infected maize has a high degree of aggregation, but there is no obvious rule with the fertilization situation in the plots. Meanwhile, the results also ruled out the possibility that phosphorus deficiency was responsible for the reddening of leaves in the study area.
4. Discussion
4.1. Link between Spectral Reflectance and Plant Disease
Multispectral or hyperspectral RS technologies based on near-ground, low-altitude UAV and satellite platforms offer multiple opportunities to improve the productivity of agricultural production systems and provide an automatic and objective alternative to the visual assessment of plant diseases [58,59,60]. The utility of RS techniques in the field of plant disease detection has been well documented, and the potential of spectral sensors in the detection of fungal diseases has been proven [61,62,63]. In the present study, at Anth values below 0.58, the difference in the reflectance characteristics between red and healthy leaves in the visible range was small, and the spectral characteristics were similar; this result is consistent with the lack of significant differences in the spectra of MDMV-infected and healthy leaves of corn exhibiting mild mosaic symptoms in a study by Beverly [30]. At the Anth values exceeding 0.58, however, the spectra of MDMV-infected and healthy leaves differed significantly in both visible and near-infrared regions, which is also consistent with Beverly’s speculation that the near-infrared region is critical for studying MDMV [30].
However, in order to effectively use spectral reflectance measurements for disease detection, the key is to identify the most important spectral wavelengths that are closely linked to a particular disease. Only a few bands of the reflectance spectrum are of interest depending on the type of disease and the range of application. In the present study, bands closely linked to MDMV infection were mainly concentrated at 611–743 nm, with the maximum correlation coefficient of 0.76.
4.2. Application of Vegetation Indices Based on Two Arbitrary Bands
Vegetation indices have been commonly used for analyzing and detecting changes in plant physiology and biochemistry. These indices, based on information at specific wavelengths, have been developed to reflect diverse plant parameters, such as pigment content, water content, and leaf area. Moreover, vegetation indices can be used as a measure of plant diseases. However, the quantitative analysis or identification of a specific disease based on the commonly used vegetation indices is not possible at present due the lack of disease specificity of the available indices. Therefore, we combined different wavelengths to construct vegetation indices (VIc) for simplifying disease detection by using spectral sensors, since each disease influences a spectral signature in a characteristic manner. In the present study, compared with the commonly used vegetation indices, the newly developed VIc showed improved classification accuracy for the red leaf spectrum (Table 3) and enhanced monitoring accuracy for MDMV severity (Figure 9). Inoue et al. [21] constructed a vegetation index based on two-band combinations for monitoring rice canopy nitrogen content and found that the RSI (D740, D522) model constructed based on the first-order differential spectra at 740 and 522 nm showed better performance. Mahlein et al. [64] created contour maps of correlation coefficients for the disease severity of Cercospora leaf spot, rust, and powdery mildew in beet based on the NDVI of two arbitrary bands to identify and monitor plant diseases. The strongly correlated bands used for NDVI in their study were mainly concentrated at 500–500 nm, close to the optimal bands for NDVIr based on VIc in the present study.
4.3. RS-Based Identification of MDMV-Infected Leaves
In the present study, among the LDA and SVM models, the classification model based on VIc showed the highest accuracy, followed by the models based on VIs and Rλ. Additionally, in the classification models based on VIs, SVM performed better than LDA, which is consistent with the trends reported by Shi et al. in the identification of wheat stripe rust, by Shang et al. in the classification of Australian virgin forest species, and by Calderón et al. in the early identification of olive Verticillium wilt [65,66,67]. SVM classifiers are constructed based on the threshold discriminant rules, which map samples to an appropriate feature space and can solve nonlinear and small-sample classification problems well. Both LDA and SVM classification models based on Rλ showed low accuracy mainly because Rλ offers very little spectral information for accurately identifying the target.
4.4. Application of Machine Learning Algorithms in Precision Agriculture
The major RS-based estimation methods in plant physiology and biochemistry include the physical radiative transfer models and empirical statistical models [68,69,70]. The physical model simulates the reflectivity of a leaf blade based on a limited number of variables according to different mathematical and physical principles. The greatest advantages of this approach are that it is based on the radiative transmission model of electromagnetic waves and the ecological theory of vegetation and that it is not affected by vegetation type and other factors. However, despite being powerful, these models require a large amount of local perception data related to biotic and abiotic factors for calibration [71], thus limiting their applicability in the large-scale monitoring of crop growth [72].
Most empirical statistical models are constructed based on vegetation indices, and they are relatively simple and diverse in structure. However, these models are susceptible to vegetation type, light conditions, and canopy structure and are sensitive to soil background; thus, the universality of these models is poor. Among the empirical statistical models, the machine learning models have the advantage of realizing the high-precision prediction of leaf pigments by analyzing the relationship between leaf nutrient drivers and pigment content, without relying on specific crop parameters. Moreover, with the advantages of RS technology, some machine learning algorithms can assess crop growth at a regional scale from satellite images. However, the inversion results obtained by linear models are typically not reliable, and nonlinear machine learning algorithms, such as MLR, PLSR, PCA, SVM, and RF, can analyze complex relationships between vegetation indices and multiple factors of crop growth [73,74]. In the present study, the MLR, PCR, PLSR, and SVMR models based on machine learning algorithms showed significant differences in their accuracy with different modeling parameters; however, the predictive performance of the four models was satisfactory, as evidenced by the high R2c and R2v values, and their accuracy was significantly higher than that of the simple regression model.
Rapid and large-scale monitoring of crop diseases can effectively reduce the pressure on plant protectors and is an important means to prevent and control diseases and to ensure food health. In addition, such efforts have made significant contributions in eliminating hunger, ensuring global food security, improving nutrition, and achieving sustainable development goals for food proposed by the United Nations [75].
5. Conclusions
The key to the effective identification of MDMV based on spectral reflectance is to find the appropriate wavelength that is closely linked to the disease. In the present study, we first analyzed the spectral differences between red and healthy leaves and determined the band region of the observed spectral difference between the two types of leaves. Next, by comparing the spectra of leaves with different severities of MDMV infection (as indicated by different Anth values), we obtained the variation rule of the reflectance spectra for MDMV infection severity and the band with the strongest correlation with Anth (Rλ). However, single-band spectra are not sufficient for fully characterizing plants. Therefore, in order to detect plant growth statuses, we selected 12 vegetation indices that are closely correlated with Anth for MDMV monitoring. Following the construction principle of NDVI, RVI, DVI, and SAVI, we constructed VIc based on the combination two arbitrary bands. Furthermore, we constructed LDA and SVM classification models for MDMV based on Rλ, VIs, and VIc and identified a classification model that could accurately distinguish red leaves from the healthy ones. In addition, we constructed the Anth regression model based on three spectral parameters in order to accurately assess the severity of MDMV infection. The major conclusions are as follows:
- (1)
- The spectral differences between red and healthy leaves were mainly concentrated in the 493–764 nm region, and the maximum difference was recorded near 700 nm.
- (2)
- The red leaf spectrum showed bimodal characteristics in the visible range. With the aggravation of the disease (i.e., increase in Anth), the reflectance of the left peak of the spectrum (550 nm) gradually decreased until it disappeared. Simultaneously, the reflectance of the right peak increased gradually, and the absorption characteristics near 680 nm disappeared. With worsening MDMV infection, the position of the red edge of the reflectance spectrum appeared as a “blue shift.”
- (3)
- The LAD and SVM models constructed based on VIc performed better in recognizing MDMV, with the classification accuracy of 100%, followed by the models based on VIs; the models based on Rλ showed the poorest classification accuracy.
- (4)
- The MLR model based on Rλ + VIs + VIc (R2c = 0.85, R2v = 0.74) was the best for monitoring the severity of MDMV infection, while the SVMR model based on Rλ + VIs + VIc (R2c = 0.68, R2v = 0.66) was the best for the estimation of Anth in healthy maize leaves.
Author Contributions
Conceptualization, L.L.; methodology, L.L.; software, L.L.; validation, L.L., Q.C.; formal analysis, L.L.; investigation, L.L.; resources, Q.C.; data curation, L.L., Q.W. and Y.H.; writing—original draft preparation, L.L.; writing—review and editing, L.L..; visualization, L.L.; supervision, Q.C.; project administration, Q.C.; funding acquisition, Q.C. All authors have read and agreed to the published version of the manuscript.
Funding
This research was funded by the National High Technology Research and Development Program of China (863 Program), grant number 2013AA102401-2.
Institutional Review Board Statement
This study not involving humans.
Informed Consent Statement
This study not involving humans.
Data Availability Statement
Data sharing is not application to this article.
Acknowledgments
We would like to thank all the students in Chang’s team for collecting the data for us, as well as the managing editors and anonymous reviewers for their constructive comments, which greatly improved the quality of this paper.
Conflicts of Interest
The authors declare no conflict of interest.
References
- Food and Agricultural Organizations of the United Nations. Available online: https://www.fao.org/faostat/zh/#data/QCL (accessed on 3 November 2021).
- Kang, Y.; Ozdogan, M.; Zhu, X.; Ye, Z.; Hain, C.; Anderson, M. Comparative assessment of environmental variables and machine learning algorithms for maize yield prediction in the US Midwest. Environ. Res. Lett. 2020, 15, 064005. [Google Scholar] [CrossRef]
- Jiang, J.; Zhou, X. Maize dwarf mosaic disease in different regions of China is caused by Sugarcane mosaic virus. Arch. Virol. 2002, 147, 2437–2443. [Google Scholar] [CrossRef] [PubMed]
- Ali, F.; Yan, J. Disease resistance in maize and the role of molecular breeding in defending against global threat. J. Integr. Plant Biol. 2012, 54, 134–151. [Google Scholar] [CrossRef] [PubMed]
- Williams, L.E.; Alexander, L.J. Maize dwarf mosaic, a new Corn disease. Phytopathology 1965, 55, 802–804. [Google Scholar]
- Janson, B.F.; Williams, L.E.; Findley, W.R.; Dollinger, E.J.; Ellett, C.W. Maize dwarf mosaic: New corn virus disease in Ohio. Res. Circ. Ohio Agric. Exp. Station 1965, 460, 16. [Google Scholar]
- Johnson, D.M. An assessment of pre- and within-season remotely sensed variables for forecasting corn and soybean yields in the United States. Remote Sens. Environ. 2014, 141, 116–128. [Google Scholar] [CrossRef]
- Jiang, H.; Hu, H.; Zhong, R.; Xu, J.; Lin, T. A deep learning approach to conflating heterogeneous geospatial data for corn yield estimation: A case study of the US Corn Belt at the county level. Glob. Chang. Biol. 2020, 26, 1754–1766. [Google Scholar] [CrossRef]
- Guan, K.; Wu, J.; Kimball, J.S.; Anderson, M.C.; Frolking, S.; Li, B.; Hain, C.R.; .Lobell, D.B. The shared and unique values of optical, fluorescence, thermal and microwave satellite data for estimating large-scale crop yields. Remote Sens. Environ. 2017, 199, 333–349. [Google Scholar] [CrossRef] [Green Version]
- Novak, A.B.; Short, F.T. Leaf reddening in the seagrass Thalassia testudinum in relation to anthocyanins, seagrass physiology and morphology, and plant protection. Mar. Biol. 2011, 158, 1403–1416. [Google Scholar] [CrossRef]
- Brefort, T.; Tanaka, S.; Neidig, N.; Doehlemann, G.; Vincon, V.; Kahmann, R. Characterization of the largest effector gene cluster of Ustilago maydis. PLoS Pathog. 2014, 10, e1003866. [Google Scholar] [CrossRef] [Green Version]
- Wang, L.Z.; Hu, Y.B.; Zhang, H.H.; Xu, N.; Sun, G.Y. Photoprotective mechanisms of leaf anthocyanins: Research progress. Chin. J. Appl. Ecol. 2012, 23, 835–841. [Google Scholar]
- Landi, M.; Tattini, M.; Gould, K.S. Multiple functional roles of anthocyanins in plant-environment interactions. Environ. Exp. Bot. 2015, 119, 4–17. [Google Scholar] [CrossRef]
- Pietrini, F.; Iannelli, M.A.; Massacci, A.; Iannelli, M.; Iannelli, M. Anthocyanin accumulation in the illuminated surface of maize leaves enhances protection from photo-inhibitory risks at low temperature, without further limitation to photosynthesis. Plant Cell Environ. 2008, 13, 1529–1546. [Google Scholar] [CrossRef]
- Merzlyak, M.N.; Chivkunova, O.B.; Solovchenko, A.E.; Razi, N.K. Light absorption by anthocyanins in juvenile, stressed, and senescing leaves. J. Exp. Bot. 2008, 59, 3903–3911. [Google Scholar] [CrossRef] [Green Version]
- Goławska, S.; Łukasik, I. Antifeedant activity of luteolin and genistein against the pea aphid, Acyrthosiphon pisum. J. Pest Sci. 2012, 85, 443–450. [Google Scholar] [CrossRef] [PubMed] [Green Version]
- Ludmerszki, E. The beneficial effects of S-methyl-methionine in maize in the case of Maize dwarf mosaic virus infection. Acta Biol. Szeged. 2011, 55, 109–112. [Google Scholar]
- Singh, M.; Sharma, P. Rice Germplasms of Manipur: Varietal Description and Cataloguing; Plant Breeding Technical Report No. 1; Department of Plant Breeding and Genetics, Central Agriculture University: Imphal Manipur, India, 1998; Volume 1, pp. 75–88. [Google Scholar]
- Fasahat, P.; Muhammad, K.; Abdullah, A.; Ratnam, W. Proximate nutritional composition and antioxidant properties of ‘Oryza rufipogon’, a wild rice collected from Malaysia compared to cultivated rice, MR219. Aust. J. Crop Sci. 2012, 6, 1502–1507. [Google Scholar]
- Gitelson, A.A.; Keydan, G.P.; Merzlyak, M.N. Three-band model for noninvasive estimation of chlorophyll, carotenoids, and anthocyanin contents in higher plant leaves. Geophys. Res. Lett. 2006, 33, 431–433. [Google Scholar] [CrossRef] [Green Version]
- Haboudane, D.; Miller, J.R.; Pattey, E.; Zarco-Tejada, P.J.; Strachan, I.B. Hyperspectral vegetation indices and novel algorithms for predicting green LAI of crop canopies: Modeling and validation in the context of precision agriculture. Remote Sens. Environ. 2004, 90, 337–352. [Google Scholar] [CrossRef]
- Inoue, Y.; Sakaiya, E.; Zhu, Y.; Takahashi, W. Diagnostic mapping of canopy nitrogen content in rice based on hyperspectral measurements. Remote Sens. Environ. 2012, 126, 210–221. [Google Scholar] [CrossRef]
- Bongiovanni, R.; Lowenberg-DeBoer, J. Precision agriculture and sustainability. Precis. Agric. 2004, 5, 359–387. [Google Scholar] [CrossRef]
- Mirik, M.; Agrilife, T.; Vernon, F.; Price, J.A.; Agrilife, T. Satellite Remote Sensing of Wheat Infected by Wheat streak mosaic virus. Plant Dis. 2011, 95, 4–12. [Google Scholar] [CrossRef] [Green Version]
- Camino, C.; Calderón, R.; Parnell, S.; Dierkes, H.; Beck, P. Detection of Xylella fastidiosa in almond orchards by synergic use of an epidemic spread model and remotely sensed plant traits. Remote Sens. Environ. 2021, 260, 112420. [Google Scholar] [CrossRef] [PubMed]
- Martins, L.; Castro, J.; Macedo, W.; Marques, C.; Abreu, C. Assessment of the spread of chestnut ink disease using remote sensing and geostatistical methods. Eur. J. Plant Pathol. 2007, 119, 159–164. [Google Scholar] [CrossRef]
- Liu, Z.Y.; Huang, J.F.; Tao, R.X. Characterizing and Estimating Fungal Disease Severity of Rice Brown Spot with Hyperspectral Reflectance Data. Rice Sci. 2008, 15, 232–242. [Google Scholar] [CrossRef]
- Feng, W.; Shen, W.; He, L.; Duan, J.; Guo, B.; Li, Y.; Wang, C.; Guo, T. Improved remote sensing detection of wheat powdery mildew using dual-green vegetation indices. Precis. Agric. 2016, 17, 608–627. [Google Scholar] [CrossRef]
- Dhau, I.; Adam, E.; Mutanga, O.; Ayisi, K.K. Detecting the severity of maize streak virus infestations in maize crop using in situ hyperspectral data. Trans. R. Soc. S. Afr. 2018, 73, 8–15. [Google Scholar] [CrossRef]
- Huang, S.; Wang, L.; Liu, L.; Liu, E.; Hou, E.; Xiao, D.; Fan, Z. Isolation, identification and biological characters of pathogens of rice spikelet rot disease. Chin. J. Rice Sci. 2012, 26, 341–350. [Google Scholar]
- Ausmus, B.S.; Hilty, J.W. Reflectance studies of healthy, maize dwarf mosaic virus-infected, and Helminthosporium maydis-infected corn leaves. Remote Sens. Environ. 1971, 2, 77–81. [Google Scholar] [CrossRef]
- Croft, H.; Chen, J.M.; Zhang, Y.; Simic, A. Modelling leaf chlorophyll content in broadleaf and needle leaf canopies from ground, CASI, Landsat TM 5 and MERIS reflectance data. Remote Sens. Environ. 2013, 133, 128–140. [Google Scholar] [CrossRef]
- Yi, Q.; Wang, F.; Bao, A.; Jiapaer, G. Leaf and canopy water content estimation in cotton using hyperspectral indices and radiative transfer models. Int. J. Appl. Earth Obs. Geoinf. 2014, 33, 67–75. [Google Scholar] [CrossRef]
- Ferrer, M.; Echeverría, G.; Pereyra, G.; Gonzalez-Neves, G.; Pan, D.; Mirás-Avalos, J.M. Mapping vineyard vigor using airborne remote sensing: Relations with yield, berry composition and sanitary status under humid climate conditions. Precis. Agric. 2020, 21, 178–197. [Google Scholar] [CrossRef]
- Huete, A.R. A soil-adjusted vegetation index (SAVI). Remote Sens. Environ. 1988, 25, 295–309. [Google Scholar] [CrossRef]
- Ren, H.; Zhou, G.; Zhang, F. Using negative soil adjustment factor in soil-adjusted vegetation index (SAVI) for aboveground living biomass estimation in arid grasslands. Remote Sens. Environ. 2018, 209, 439–445. [Google Scholar] [CrossRef]
- Feng, W.; Yao, X.; Zhu, Y.; Tian, Y.; Cao, W. Monitoring leaf nitrogen status with hyperspectral reflectance in wheat. Eur. J. Agron. 2008, 28, 394–404. [Google Scholar] [CrossRef]
- Yuan, H.; Yang, G.; Li, C.; Wang, Y.; Liu, J.; Yu, H.; Feng, H.; Xu, B.; Zhao, X.; Yang, X. Retrieving soybean leaf area index from unmanned aerial vehicle hyperspectral remote sensing: Analysis of RF, ANN, and SVM regression models. Remote Sens. 2017, 9, 309. [Google Scholar] [CrossRef] [Green Version]
- Zhai, Y.; Cui, L.; Zhou, X.; Gao, Y.; Fei, T.; Gao, W. Estimation of nitrogen, phosphorus, and potassium contents in the leaves of different plants using laboratory-based visible and near-infrared reflectance spectroscopy: Comparison of partial least-square regression and support vector machine regression methods. Int. J. Remote Sens. 2013, 34, 2502–2518. [Google Scholar]
- Wei, G.; Hong, B.Q.; Heng, Q.Z.; Juan, J.Z.; Peng, C.P.; Ze, L.L. Cotton Aphid Damage Monitoring Using UAV Hyperspectral Data Based on Derivative of Ratio Spectroscopy. Spectrosc. Spectr. Anal. 2021, 41, 1543–1550. [Google Scholar]
- Jiang, Z.; Huete, A.R.; Didan, K.; Miura, T. Development of a two-band enhanced vegetation index without a blue band. Remote Sens. Environ. 2008, 112, 3833–3845. [Google Scholar] [CrossRef]
- Jordan, C.F. Derivation of leaf-area index from quality of light on the forest floor. Ecology 1969, 50, 663–666. [Google Scholar] [CrossRef]
- Penuelas, J.; Filella, I. Visible and near-infrared reflectance techniques for diagnosing plant physiological status. Trends Plant Sci. 1998, 3, 151–156. [Google Scholar] [CrossRef]
- Rouse, J.W.; Haas, R.W.; Schell, J.A.; Deering, D.W.; Harlan, J.C. Monitoring the Vernal Advancement and Retrogradation (Green Wave Effect) of Natural Vegetation; NASA/GSFC: Greenbelt, MD, USA, 1974; Type III, Final Report; p. 371.
- Gitelson, A.A.; Kaufman, Y.J.; Merzlyak, M.N. Use of a green channel in remote sensing of global vegetation from EOS-MODIS. Remote Sens. Environ. 1996, 58, 289–298. [Google Scholar] [CrossRef]
- Barati, S.; Rayegani, B.; Saati, M.; Sharifi, A.; Nasri, M. Comparison the accuracies of different spectral indices for estimation of vegetation cover fraction in sparse vegetated areas. Egypt. J. Remote Sens. Space Sci. 2011, 14, 49–56. [Google Scholar] [CrossRef] [Green Version]
- Daughtry, C.S.; Walthall, C.L.; Kim, M.S.; De Colstoun, E.B.; McMurtrey Iii, J.E. Estimating corn leaf chlorophyll concentration from leaf and canopy reflectance. Remote Sens. Environ. 2000, 74, 229–239. [Google Scholar] [CrossRef]
- Gitelson, A.A.; Vina, A.; Ciganda, V.; Rundquist, D.C.; Arkebauer, T.J. Remote estimation of canopy chlorophyll content in crops. Geophys. Res. Lett. 2005, 32, L08403. [Google Scholar] [CrossRef] [Green Version]
- Haboudane, D.; Miller, J.; Tremblay, N.; Pattey, E.; Vigneault, P. Estimation of leaf area index using ground spectral measurements over agriculture crops: Prediction capability assessment of optical indices. In Proceedings of the 20th ISPRS Congress: “Geo-Imagery Bridging Continents”, Istanbul, Turkey, 12–23 July 2004. [Google Scholar]
- Vogelmann, J.; Rock, B.; Moss, D. Red edge spectral measurements from sugar maple leaves. Int. J. Remote Sens. 1993, 14, 1563–1575. [Google Scholar] [CrossRef]
- Merzlyak, M.N.; Gitelson, A.A.; Chivkunova, O.B.; Rakitin, V.Y. Non-destructive optical detection of pigment changes during leaf senescence and fruit ripening. Physiol Plant. 1999, 106, 135–141. [Google Scholar] [CrossRef] [Green Version]
- Gamon, J.; Serrano, L.; Surfus, J. The photochemical reflectance index: An optical indicator of photosynthetic radiation use efficiency across species, functional types, and nutrient levels. Oecologia 1997, 112, 492–501. [Google Scholar] [CrossRef] [PubMed]
- Gitelson, A.A.; Gritz, Y.; Merzlyak, M.N. Relationships between leaf chlorophyll content and spectral reflectance and algorithms for non-destructive chlorophyll assessment in higher plant leaves. J. Plant Physiol. 2003, 160, 271–282. [Google Scholar] [CrossRef] [PubMed]
- Pal, M.; Foody, G.M. Feature selection for classification of hyperspectral data by SVM. IEEE Trans. Geosci. Remote Sens. 2010, 48, 2297–2307. [Google Scholar] [CrossRef] [Green Version]
- Neumann, J.; Schnörr, C.; Steidl, G. Combined SVM-based feature selection and classification. Mach. Learn. 2005, 61, 129–150. [Google Scholar] [CrossRef] [Green Version]
- Li, C.H.; Lin, C.T.; Kuo, B.C.; Chu, H.S. An automatic method for selecting the parameter of the RBF kernel function to support vector machines. In 2010 IEEE International Geoscience and Remote Sensing Symposium; IEEE: Piscataway, NJ, USA, 2010. [Google Scholar]
- Han, S.; Qu, B.C.; Meng, H. Parameter selection in SVM with RBF kernel function. In World Automation Congress 2012; IEEE: Piscataway, NJ, USA, 2012. [Google Scholar]
- Johansen, K.; Morton, M.J.; Malbeteau, Y.M.; Aragon, B.; Al-Mashharawi, S.K.; Ziliani, M.G.; Angel, Y.; Fiene, G.M.; Negrão, S.S.; Mousa, M.A. Unmanned aerial vehicle-based phenotyping using morphometric and spectral analysis can quantify responses of wild tomato plants to salinity stress. Front. Plant Sci. 2019, 10, 370–407. [Google Scholar] [CrossRef] [PubMed]
- Hassan, M.A.; Yang, M.; Rasheed, A.; Yang, G.; Reynolds, M.; Xia, X.; Xiao, Y.; He, Z.A. Rapid monitoring of NDVI across the wheat growth cycle for grain yield prediction using a multi-spectral UAV platform. Plant Sci. 2019, 282, 95–103. [Google Scholar] [CrossRef] [PubMed]
- Thorp, K.R.; Wang, G.; Bronson, K.F.; Badaruddin, M.; Mon, J. Hyperspectral data mining to identify relevant canopy spectral features for estimating durum wheat growth, nitrogen status, and grain yield. Comput. Electron. Agric. 2017, 136, 1–12. [Google Scholar] [CrossRef] [Green Version]
- Huang, W.; Guan, Q.; Luo, J.; Zhang, J.; Zhao, J.; Liang, D.; Huang, L.; Zhang, D. New optimized spectral indices for identifying and monitoring winter wheat diseases. IEEE J. Sel. Top. Appl. Earth Obs. Remote Sens. 2014, 7, 2516–2524. [Google Scholar] [CrossRef]
- Mahlein, A.-K.; Steiner, U.; Dehne, H.W.; Oerke, E.C. Spectral signatures of sugar beet leaves for the detection and differentiation of diseases. Precis. Agric. 2010, 11, 413–431. [Google Scholar] [CrossRef]
- Rumpf, T.; Mahlein, A.-K.; Steiner, U.; Oerke, E.C.; Dehne, H.W.; Plümer, L. Early detection and classification of plant diseases with support vector machines based on hyperspectral reflectance. Comput. Electron. Agric. 2010, 74, 91–99. [Google Scholar] [CrossRef]
- Mahlein, A.K.; Rumpf, T.; Welke, P.; Dehne, H.W.; Plümer, L.; Steiner, U.; Oerke, E.C. Development of spectral indices for detecting and identifying plant diseases. Remote Sens. Environ. 2013, 128, 21–30. [Google Scholar] [CrossRef]
- Calderón, R.; Navas-Cortés, J.A.; Zarco-Tejada, P.J. Early detection and quantification of Verticillium wilt in olive using hyperspectral and thermal imagery over large areas. Remote Sens. 2015, 7, 5584–5610. [Google Scholar] [CrossRef] [Green Version]
- Shang, X.; Chisholm, L.A. Classification of Australian native forest species using hyperspectral remote sensing and machine-learning classification algorithms. IEEE J. Sel. Top. Appl. Earth Obs. Remote Sens. 2013, 7, 2481–2489. [Google Scholar] [CrossRef]
- Shi, Y.; Huang, W.; Luo, J.; Huang, L.; Zhou, X. Detection and discrimination of pests and diseases in winter wheat based on spectral indices and kernel discriminant analysis. Comput. Electron. Agric. 2017, 141, 171–180. [Google Scholar] [CrossRef]
- Khaki, S.; Wang, L.; Archontoulis, S.V. A cnn-rnn framework for crop yield prediction. Front. Plant Sci. 2020, 10, 1750. [Google Scholar] [CrossRef]
- Yendrek, C.R.; Tomaz, T.; Montes, C.M.; Cao, Y.; Morse, A.M.; Brown, P.J.; McIntyre, L.M.; Leakey, A.D.; Ainsworth, E.A. High-throughput phenotyping of maize leaf physiological and biochemical traits using hyperspectral reflectance. Plant Physiol. 2017, 173, 614–626. [Google Scholar] [CrossRef] [PubMed]
- Maimaitijiang, M.; Sagan, V.; Sidike, P.; Hartling, S.; Esposito, F.; Fritschi, F.B. Soybean yield prediction from UAV using multimodal data fusion and deep learning. Remote Sens. Environ. 2020, 237, 111599. [Google Scholar] [CrossRef]
- Ma, Y.; Zhang, Z.; Kang, Y.; Özdoğan, M. Corn yield prediction and uncertainty analysis based on remotely sensed variables using a Bayesian neural network approach. Remote Sens. Environ. 2021, 259, 112408. [Google Scholar] [CrossRef]
- Sakamoto, T.; Gitelson, A.A.; Arkebauer, T.J. MODIS-based corn grain yield estimation model incorporating crop phenology information. Remote Sens. Environ. 2013, 131, 215–231. [Google Scholar] [CrossRef]
- Han, L.; Yang, G.; Dai, H.; Xu, B.; Yang, H.; Feng, H.; Li, Z.; Yang, X. Modeling maize above-ground biomass based on machine learning approaches using UAV remote-sensing data. Plant Methods 2019, 15, 10. [Google Scholar] [CrossRef] [PubMed] [Green Version]
- Shah, S.H.; Angel, Y.; Houborg, R.; Ali, S.; McCabe, M.F. A random forest machine learning approach for the retrieval of leaf chlorophyll content in wheat. Remote Sens. 2019, 11, 920. [Google Scholar] [CrossRef] [Green Version]
- Zheng, Q.; Ye, H.; Huang, W.; Dong, Y.; Jiang, H.; Wang, C.; Li, D.; Wang, L.; Chen, S. Integrating spectral information and meteorological data to monitor wheat yellow rust at a regional scale: A case study. Remote Sens. 2021, 13, 278. [Google Scholar] [CrossRef]
Figure 1.
Location of study area and fertilization of plot.

Figure 2.
Maize plants and leaves infected with MDMV.

Figure 3.
Analysis process of this study.

Figure 4.
(a) Spectra of healthy and red leaves and SI of red leaves; (b) spectra and red edge of red leaves with different Anth.
Figure 4.
(a) Spectra of healthy and red leaves and SI of red leaves; (b) spectra and red edge of red leaves with different Anth.

Figure 5.
Correlation between Anth and spectral reflectance of healthy and red leaves.

Figure 6.
(a) Correlation analysis of healthy leaf VIs; (b) correlation analysis of red leaf VIs.

Figure 7.
Contour maps of R2 between Anth and VIc of healthy and red leaves.

Figure 8.
(a) Statistical analysis of calibration set and validation set; (b) precision comparison of UR models based on Rλ.
Figure 8.
(a) Statistical analysis of calibration set and validation set; (b) precision comparison of UR models based on Rλ.

Figure 9.
Anth estimation models of red and healthy leaves. (a–c) represent MLR, PCR, PLSR, and SVMR models of red leaves Anth based on VIs, VIc, and Rλ + VIs + VIc, respectively. (d–f) show MLR, PCR, PLSR, and SVMR estimation models of healthy leaf Anth based on VIs, VIc, and Rλ + VIs + VIc, respectively.


Table 1.
Anth statistics of healthy and red leaves.
| Type | N | Min (μg·cm−2) | Max (μg·cm−2) | Mean (μg·cm−2) | SD | Variance | CV (%) |
|---|---|---|---|---|---|---|---|
| healthy | 360 | 0.03 | 0.11 | 0.06 | 0.02 | 3.24 × 10⁻⁴ | 29.36 |
| red | 72 | 0.04 | 0.76 | 0.19 | 0.18 | 0.03 | 94.74 |
Table 2.
Two-band and three-band vegetation indices.
| VIs | Equations | Bands | References | VIs | Equations | Band | References |
|---|---|---|---|---|---|---|---|
| SR | R800/R680 | 2 | [42] | SIPI | (R680 − R500)/R750 | 3 | [43] |
| NDVI | (R800 − R670)/(R800 + R670) | 2 | [44] | GNDVI | (R800 − R550)/(R800 + R550) | 2 | [45] |
| TVI | 0.5(120(R750 − R550) − 200(R670 − R550)) | 3 | [46] | MCARI | R700 ((R700 − R670) − 0.2(R700 − R550))/R670 | 3 | [47] |
| CHLI | R700/(R700 + R710 − 1) | 2 | [48] | MCARI1 | 1.2(2.5(R800 − R670) − 1.3(R800 − R550)) | 3 | [49] |
| VRI | R740/R720 | 2 | [50] | PSRI | (R680 − R500)/R750 | 3 | [51] |
| PRI | (R531 − R570)/(R531 + R570) | 2 | [52] | RNDVI | (R750 − R705)/(R750 + R705) | 2 | [53] |
Table 3.
LDA and SVM classification models.
| Models | Parameters | Calibration Set (nr = 48, nh = 240) | Validation Set (nr = 24, nh = 120) | ||||
|---|---|---|---|---|---|---|---|
| Red | Healthy | Accuracy/% | Red | Healthy | Accuracy/% | ||
| LDA | Rλ | 6 | 240 | 56.3 | 6 | 120 | 62.5 |
| VIs | 34 | 240 | 85.4 | 12 | 120 | 75.0 | |
| VIc | 48 | 240 | 100.0 | 24 | 120 | 100.0 | |
| SVM | Rλ | 0 | 240 | 50.0 | 0 | 120 | 50.0 |
| VIs | 36 | 240 | 87.5 | 16 | 120 | 83.3 | |
| VIc | 48 | 240 | 100.0 | 24 | 120 | 100.0 | |
Note: Rλ is the spectral reflectance of red leaves at 695 nm and healthy leaves at 554 nm; VIs is the narrow-band vegetation indices; VIc is the vegetation index constructed based on two arbitrary bands; nr and nh are the number of samples of red and healthy leaves, respectively.
Publisher’s Note: MDPI stays neutral with regard to jurisdictional claims in published maps and institutional affiliations. |
© 2021 by the authors. Licensee MDPI, Basel, Switzerland. This article is an open access article distributed under the terms and conditions of the Creative Commons Attribution (CC BY) license (https://creativecommons.org/licenses/by/4.0/).
Share and Cite
MDPI and ACS Style
Luo, L.; Chang, Q.; Wang, Q.; Huang, Y. Identification and Severity Monitoring of Maize Dwarf Mosaic Virus Infection Based on Hyperspectral Measurements. Remote Sens. 2021, 13, 4560. https://0-doi-org.brum.beds.ac.uk/10.3390/rs13224560
AMA Style
Luo L, Chang Q, Wang Q, Huang Y. Identification and Severity Monitoring of Maize Dwarf Mosaic Virus Infection Based on Hyperspectral Measurements. Remote Sensing. 2021; 13(22):4560. https://0-doi-org.brum.beds.ac.uk/10.3390/rs13224560
Chicago/Turabian StyleLuo, Lili, Qingrui Chang, Qi Wang, and Yong Huang. 2021. "Identification and Severity Monitoring of Maize Dwarf Mosaic Virus Infection Based on Hyperspectral Measurements" Remote Sensing 13, no. 22: 4560. https://0-doi-org.brum.beds.ac.uk/10.3390/rs13224560
Note that from the first issue of 2016, this journal uses article numbers instead of page numbers. See further details here.