
Flood Risk Assessment of Metro System Using Improved Trapezoidal Fuzzy AHP: A Case Study of Guangzhou
by
 ,
,
Guangpeng Wang
1,2,3 ,
,
Lianyou Liu
1,2,3,*,
Peijun Shi
1,2,3,
Guoming Zhang
1,2,3 and
Jifu Liu
1,2,3 1
Key Laboratory of Environmental Change and Natural Disaster, Ministry of Education, Beijing Normal University, Beijing 100875, China
2
Engineering Research Center of Desertification and Blown-Sand Control, Ministry of Education, Beijing Normal University, Beijing 100875, China
3
Academy of Disaster Risk Science, Faculty of Geographical Science, Beijing Normal University, Beijing 100875, China
*
Author to whom correspondence should be addressed.
Remote Sens. 2021, 13(24), 5154; https://0-doi-org.brum.beds.ac.uk/10.3390/rs13245154
Submission received: 18 November 2021
/
Revised: 14 December 2021
/
Accepted: 16 December 2021
/
Published: 18 December 2021
(This article belongs to the Special Issue Remote Sensing in Urban Natural Hazards Monitoring)
Abstract
:Metro systems have become high-risk entities due to the increased frequency and severity of urban flooding. Therefore, understanding the flood risk of metro systems is a prerequisite for mega-cities’ flood protection and risk management. This study proposes a method for accurately assessing the flood risk of metro systems based on an improved trapezoidal fuzzy analytic hierarchy process (AHP). We applied this method to assess the flood risk of 14 lines and 268 stations of the Guangzhou Metro. The risk results validation showed that the accuracy of the improved trapezoidal fuzzy AHP (90% match) outperformed the traditional trapezoidal AHP (70% match). The distribution of different flood risk levels in Guangzhou metro lines exhibited a polarization signature. About 69% (155 km2) of very high and high risk zones were concentrated in central urban areas (Yuexiu, Liwan, Tianhe, and Haizhu); the three metro lines with the highest overall risk level were lines 3, 6, and 5; and the metro stations at very high risk were mainly located on metro lines 6, 3, 5, 1, and 2. Based on fieldwork, we suggest raising exits, installing watertight doors, and using early warning strategies to resist metro floods. This study can provide scientific data for decision-makers to reasonably allocate flood prevention resources, which is significant in reducing flood losses and promoting Guangzhou’s sustainable development.
1. Introduction
Floods cause billions of dollars of damage each year [1,2,3]. Between 1980 and 2013, the global direct economic losses from floods exceeded $1 trillion (2013 values), and more than 220,000 people lost their lives [4]. In recent years, urban areas have faced global flood risk challenges due to extreme weather, rapid urbanization, and climate change, which has been increasing both in severity and frequency worldwide, increasing risks to human lives, health, properties, infrastructure, and the environment [5,6]. By 2050, the global urban population will grow from the current value of 55% to 68%, and the global urban land area will increase by more than 1.5 million km2, which means that a large number of properties will be concentrated in increasingly dense urban areas [7]. Related studies have shown that global flood risk is expected to increase about 187% by 2050 based on predicted changes in the flood peak return periods [8]. In addition, developing countries face more severe flood challenges than developed countries, especially Chinese cities undergoing rapid urbanization [9]. For example, 5 of the top 20 coastal port cities worldwide in terms of average annual flood losses are located in China [5]. Therefore, it is indispensable to understand how to live with urban floods and mitigate flood risk for sustainable development in cities [10].
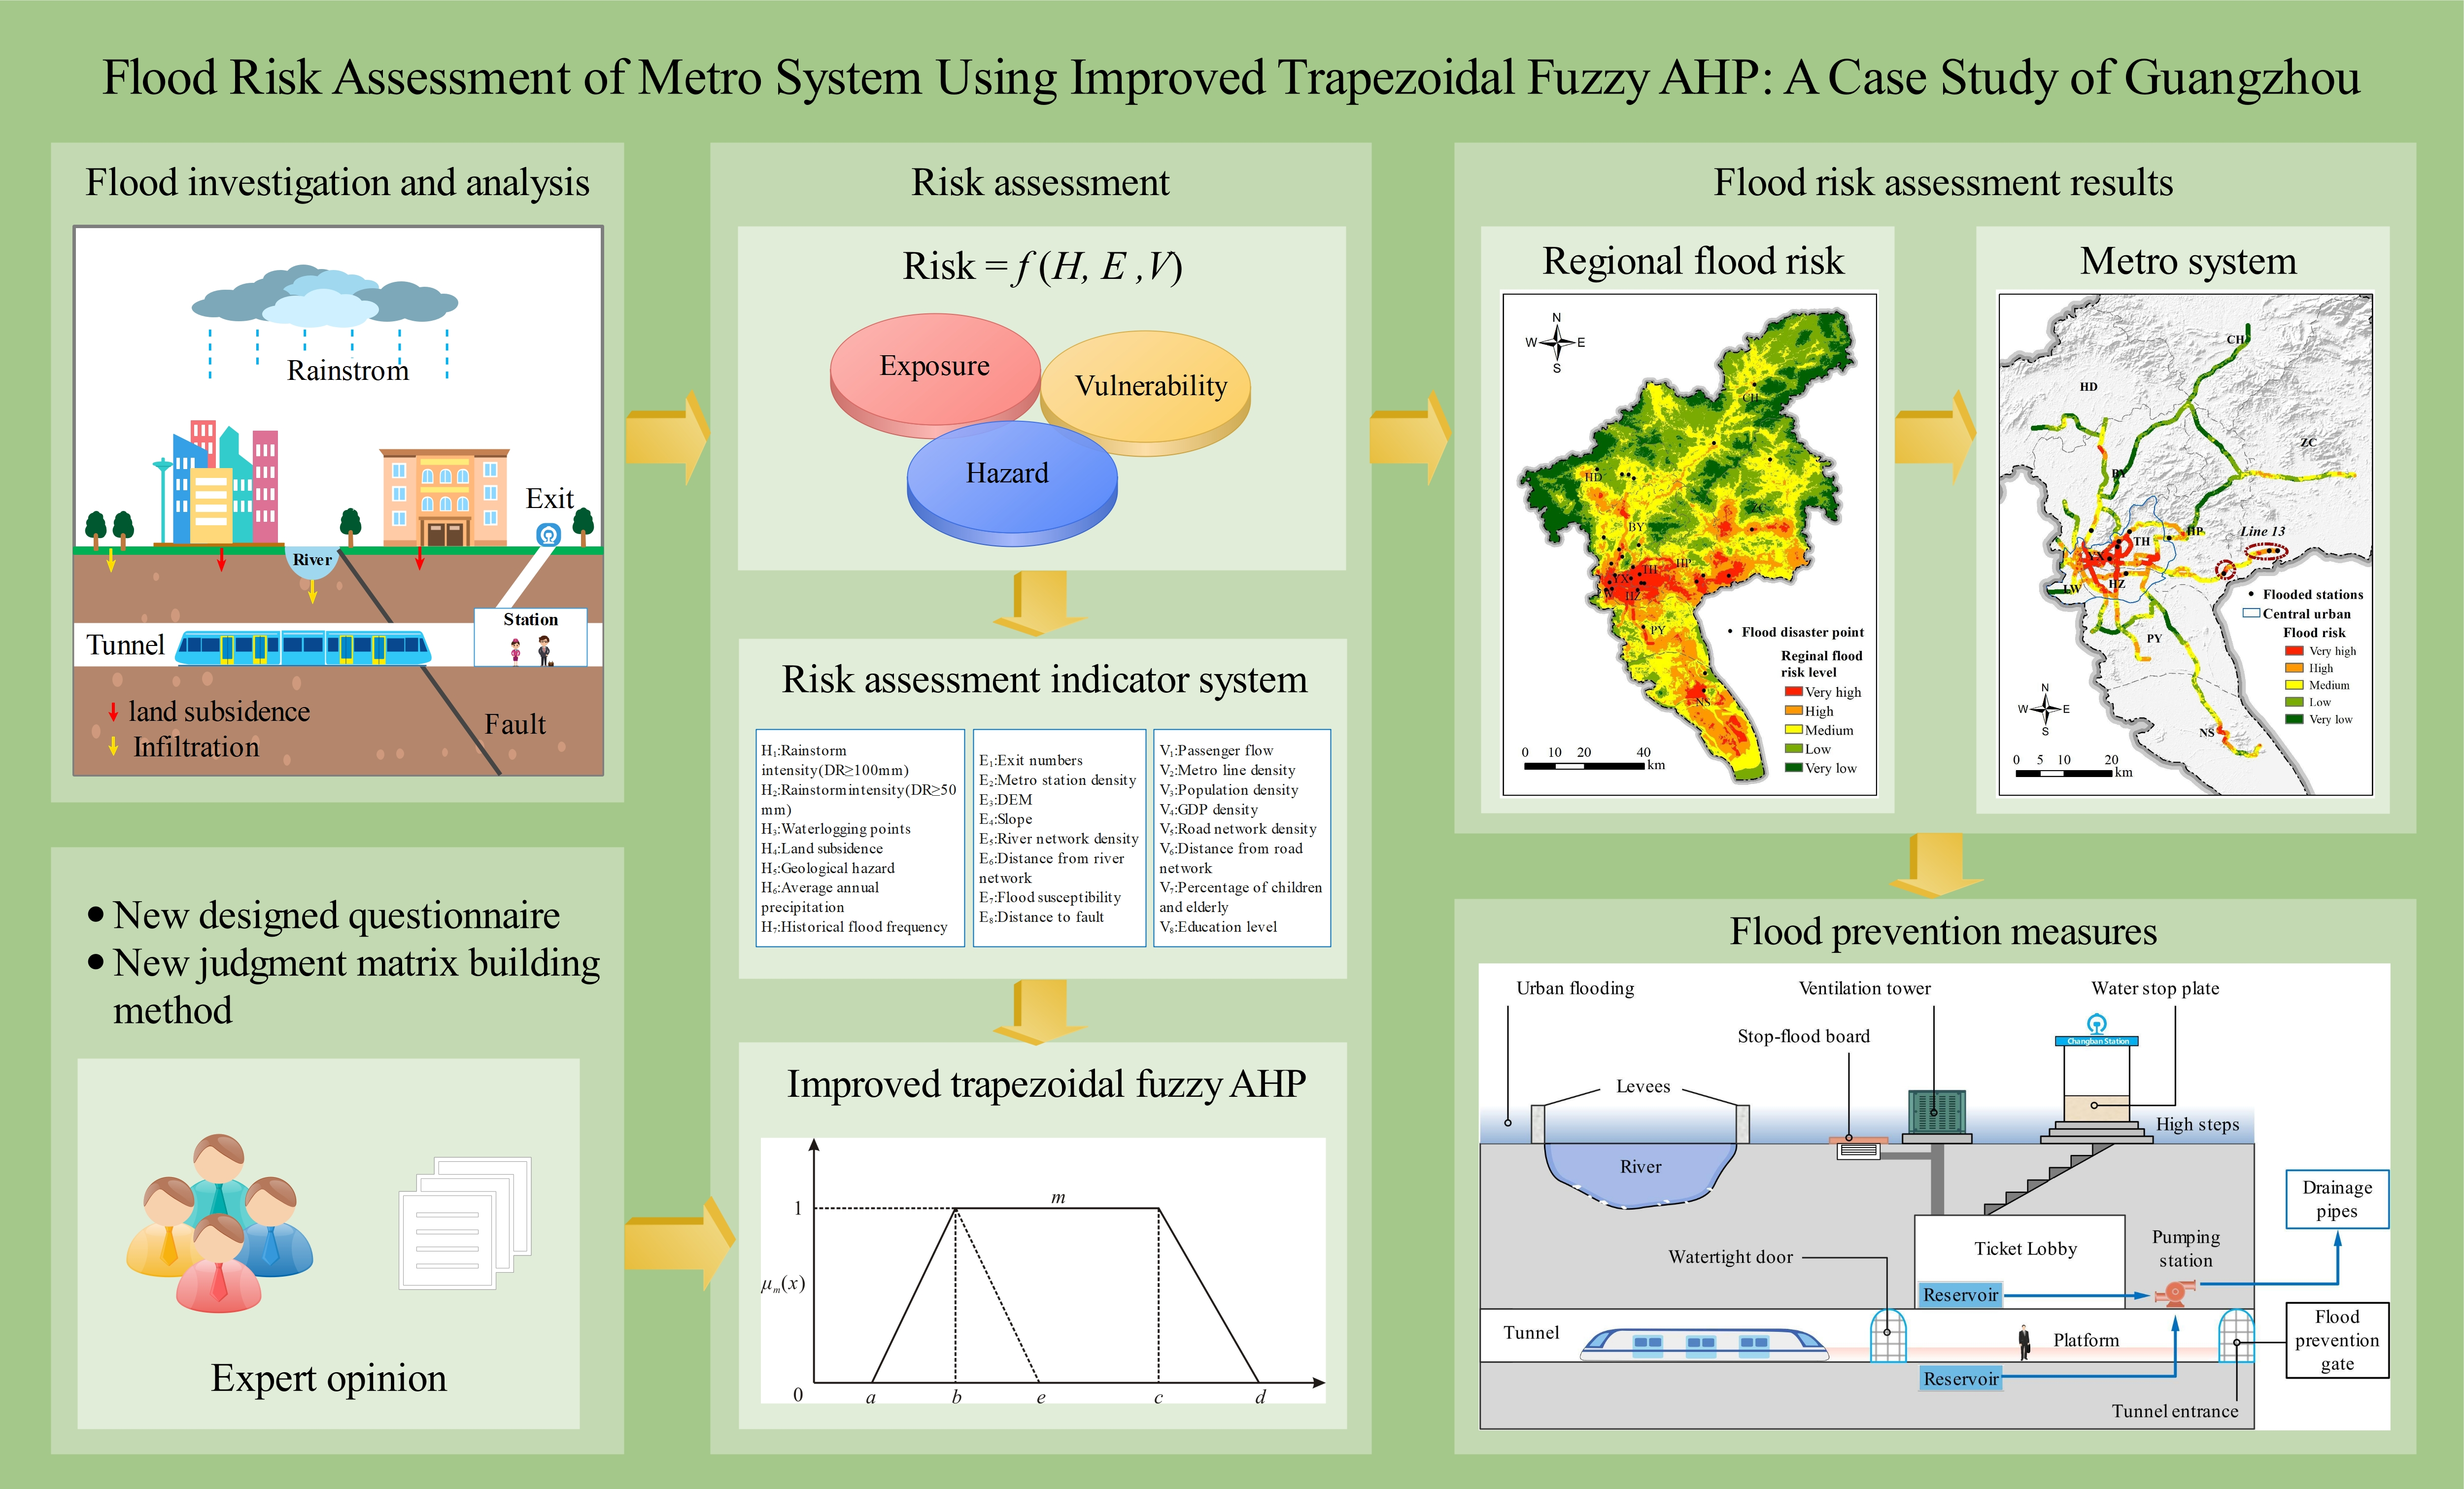
Rapid urban expansion has accelerated the development of underground space [11,12,13]. As a key underground infrastructure, metro systems play an irreplaceable role in alleviating traffic congestion in mega-cities [11]. However, increasing urban flooding not only overwhelms people and property on the ground, but also greatly threatens the safe operation of metro systems [14,15]. Recently, the frequency and intensity of metro flooding incidents have shown an aggravating trend [14]. In 2021 alone, many metropolitan areas in the world experienced severe metro flooding. For example, on July 18, floodwater caused by torrential rain encroached on the tunnel from Shakoulu and Haitansi stations on Zhengzhou metro line 5. The flood in the metro reached people’s necks, causing 14 deaths and 5 injuries among the more than 500 trapped people. On 30 July, a flood occurred at Shenzhoulu station on Guangzhou metro line 21, resulting in the suspension of operations at six metro stations for seven hours; the direct economic loss was 911,500 yuan. In London, 30 of the 270 tube stations across the network were closed 38 times in 2021 due to flooding incidents; a total of 66 stations have reported flooding incidents in the past seven years. On September 1, extreme precipitation caused by hurricane Ida flooded many subway tunnels in New York, and much of the MTA (Metropolitan Transportation Authority) system was shut down. There is no doubt that metropolitan subway systems are at high risk of urban flooding [16]. Thus, assessing the flood risk of metro systems in mega-cities is a looming challenge. Figure 1 shows real scenes of subway flooding in Zhengzhou (a), Guangzhou (b), New York (c), and London (d).
However, systematic flood risk assessment studies of metro systems in mega-cities are currently lacking. Previous research has focused on flood risk evaluation at the provincial administrative region or basin scale. For example, Wang et al. performed a study on flood risk assessment in the Beijing-Tianjin-Hebei metropolitan area using the fuzzy synthetic evaluation method [17]. Pham et al. evaluated the flood risk level in the Quang Nam province of Vietnam based on a hybrid artificial intelligence model integrated with multi-criteria decision analysis [18]. Lai et al. used an ant colony algorithm to assess the flood risk level of the Dongjiang River basin based on 14 risk indicators [19]. Furthermore, flood studies on the urban scale concentrated on road networks’ vulnerability and community inundation simulations [20]. Zhang et al. analyzed the road network’s vulnerability in the Chebei watershed in Guangzhou based on the simulated water depth of the SWMM (stormwater management model) [21]. Kittipongvises et al. analyzed the flood hazard based on the AHP-GIS method for communities near the world heritage site on Ayutthaya Island, Thailand [22]. Due to the different study subjects and spatial scales, the above studies failed to identify high-risk lines and stations; however, this is the prerequisite and basis for the risk management of metro systems [15]. Hence, there is an urgent need to develop a reasonable risk indicator system and an accurate model for flood risk assessments for metro systems.
Moreover, risk is inherently a three-dimensional concept associated with non-profitability, uncertainty, and complexity [23]. In risk science, the geographic, meteorological, remote sensing, and statistical information employed to present these hazards is characterized by multiplicity, complexity, uncertainty, and a diversity of assessment approaches, making risk assessment a worldwide challenge in the fields of natural sciences and technology [17,23]. At present, the analytic hierarchy process (AHP) is widely applied in many fields and has proven to be a helpful method for assigning weight to risk indicators [24,25,26]. However, pairwise comparisons between indicators in the traditional AHP are limited to single crisp numbers, which ignores the uncertainty and ambiguity of experts’ judgment [17,23,27]. In addition, the traditional AHP features two apparent shortcomings in real applications: (a) the complexity of pairwise comparisons and (b) the inconsistency of the judgment matrix. More intuitively, the risk assessment process requires 45 pairwise comparisons for 10 indicators and 190 repetitions for 20 indicators. Experts are therefore prone to making important judgments that are incorrect. Of course, the indicator weights derived from incorrect judgment matrices are not true. These issues are the main obstacles to obtaining accurate risk level maps.
Based on the above analysis, the main objectives of this paper are (1) to propose an accurate flood risk assessment method for metro systems based on improved trapezoidal fuzzy AHP, (2) to address two significant drawbacks in the application of the traditional AHP mentioned above, (3) to assess the flood risk of the Guangzhou metro system employing the proposed assessment method, and (4) to verify the accuracy and feasibility of the proposed method based on historical flood records and field survey data and to suggest flood prevention measures. This study is expected to provide a reference for flood prevention and risk management for metro systems in the study area and beyond.
2. Materials and Methods
2.1. Study Area
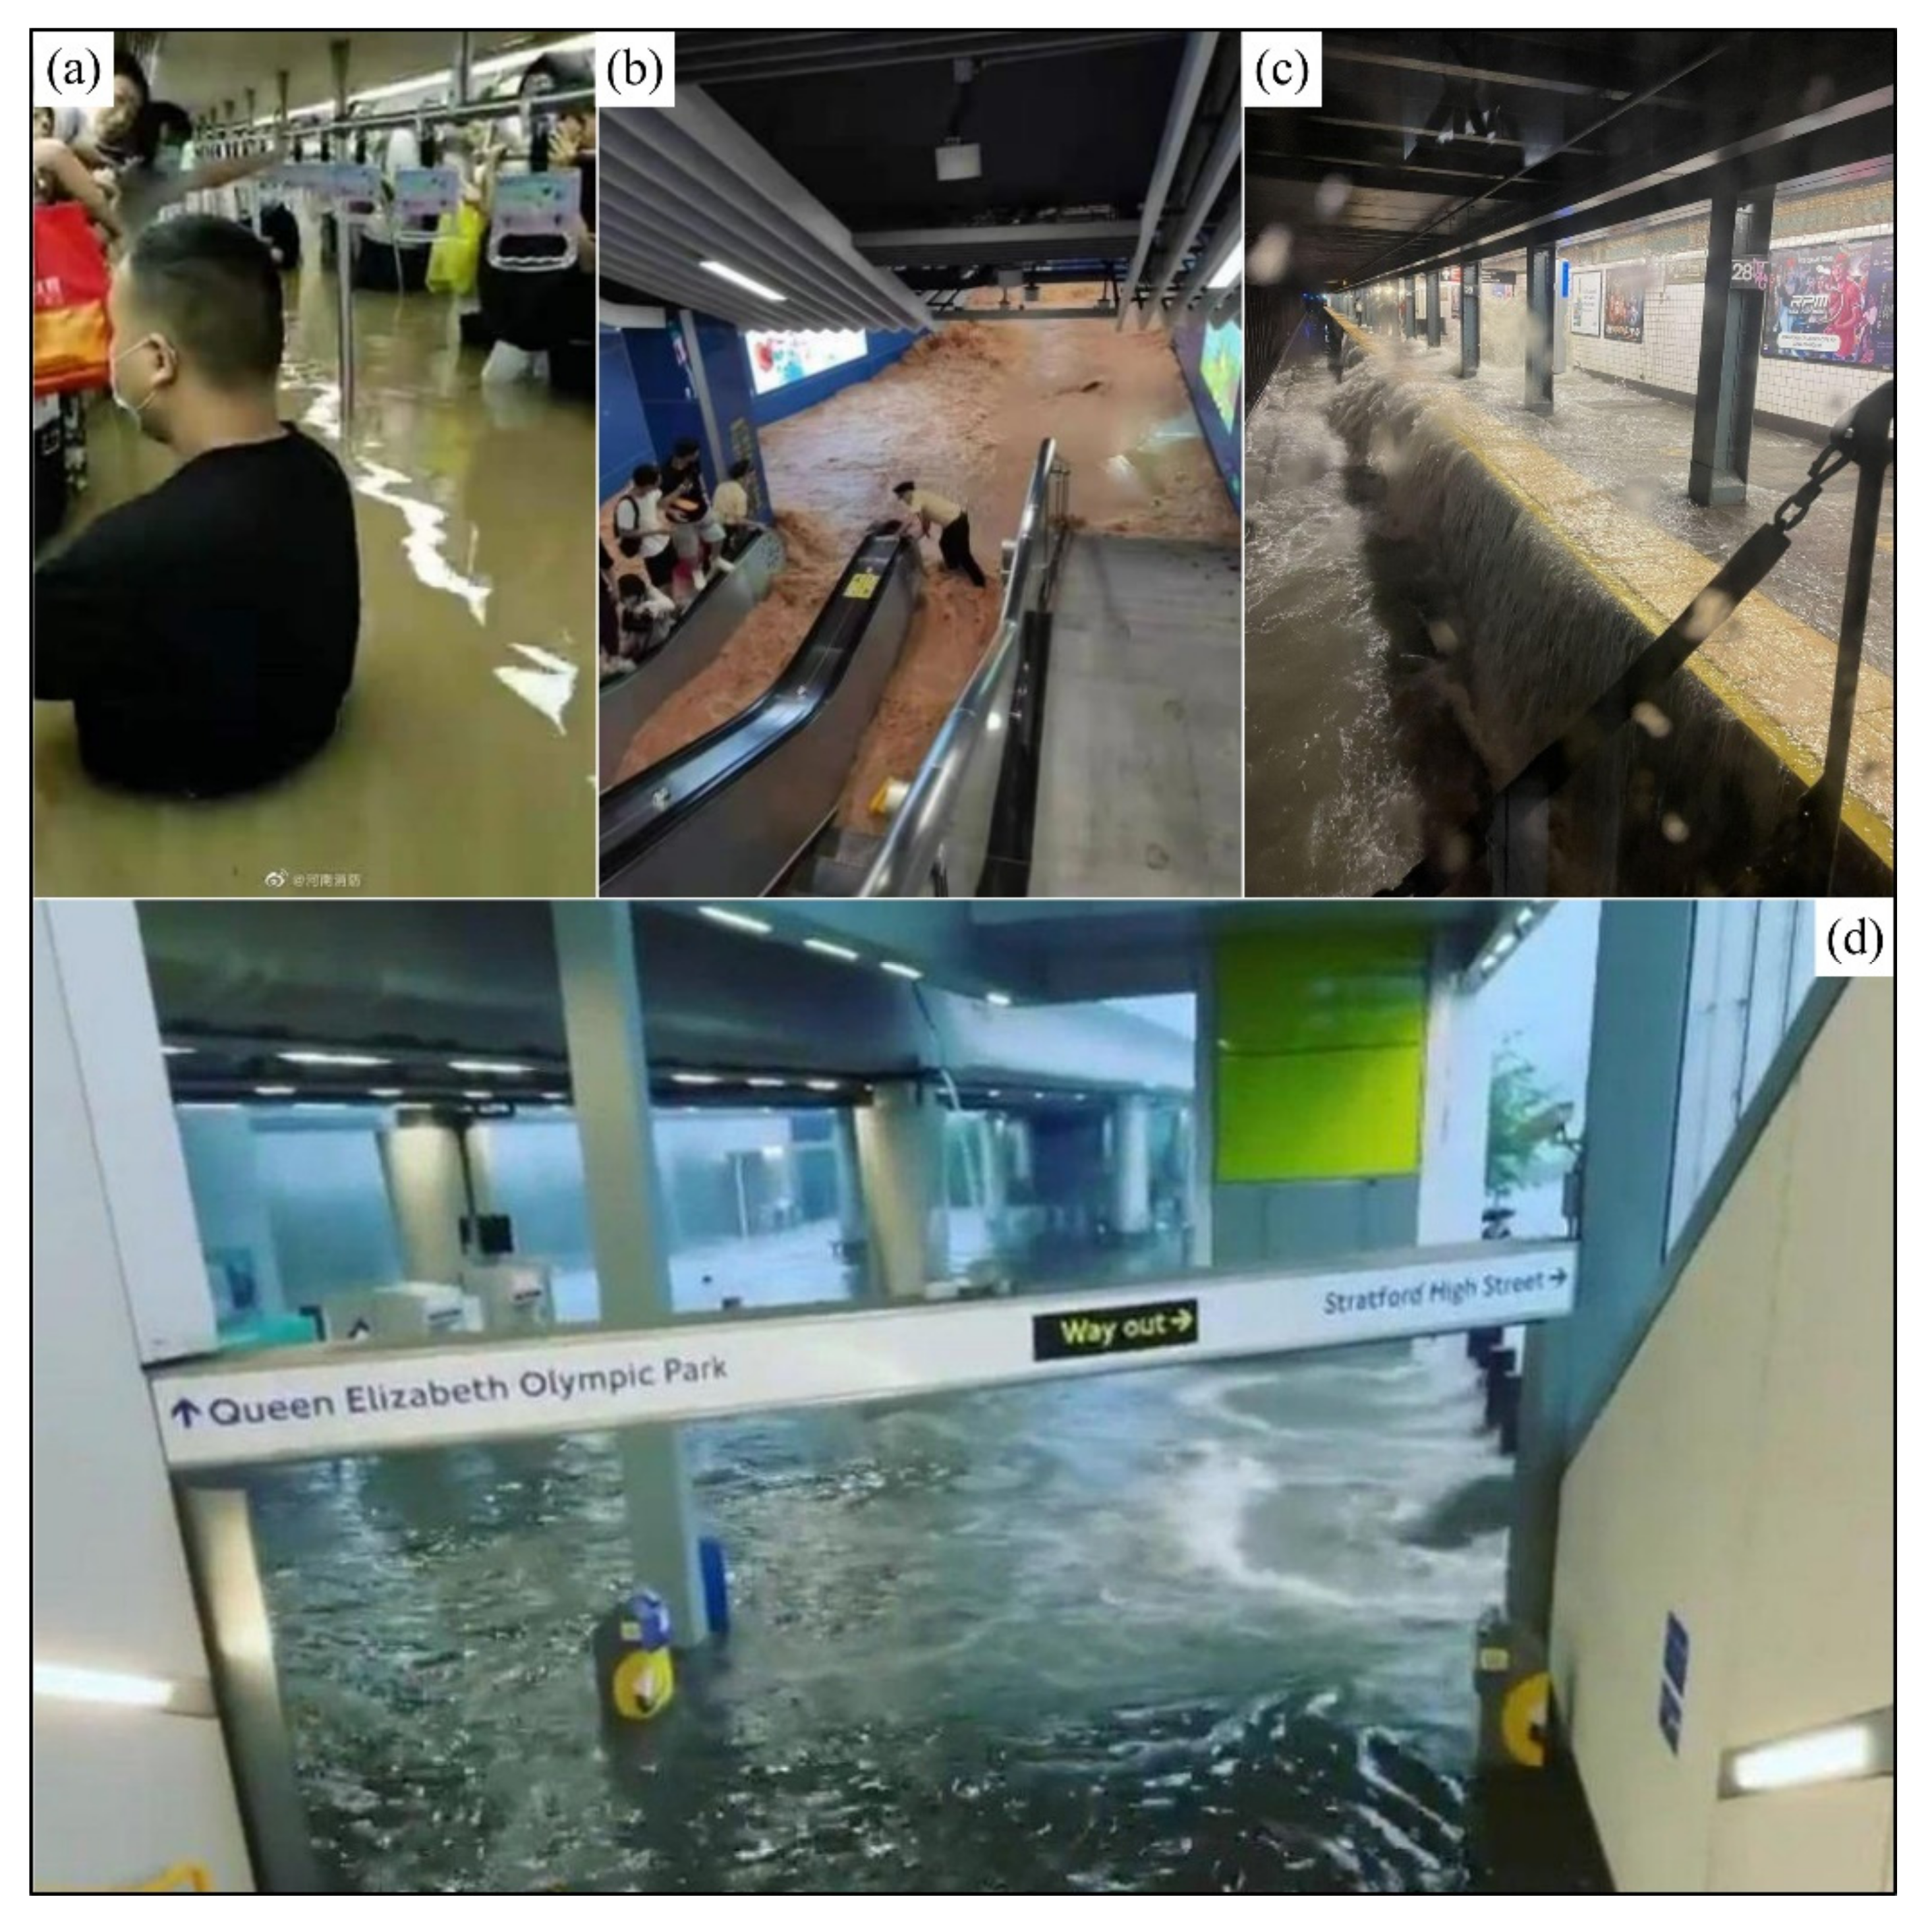
Guangzhou is located on the southeast coast of China and is the core city of the Greater Bay Area (Figure 2) [28]. It comprises 11 districts, covering an area of 7434 km2, with a population of 16.68 million in 2020 [29]. The city features a maritime subtropical monsoon climate [28]. The average annual precipitation ranges from 1600 to 1900 mm, of which 80% is concentrated in April–September. This feature makes Guangzhou highly susceptible to urban floods. Guangzhou is surrounded by low mountains to the north and coastal alluvial plains to the south. Moreover, the widespread distribution of active faults, karst landform, and Quaternary sediments (soft soil layers) triggers severe land subsidence and frequent geological disasters (e.g., collapse, landslides) in Guangzhou [30].
Rapid urbanization has accelerated the construction of the Guangzhou metro system. As of 2020, the Guangzhou metro consisted of 14 lines and 268 stations and operated 589.4 km of lines (Figure 2). There were 11 metro lines under construction, with a total mileage exceeding 270 km. Recently, Guangzhou suffered several major urban floods, which resulted in severe metro flooding. For example, surface flooding poured into Shenzhoulu station on 30 July 2021 (Figure 1b). This incident resulted in the suspension of operations at six stations on metro line 21 for seven hours, with direct economic losses of 915,000 yuan. On 22 May 2020, surface flooding invaded the metro tunnels of line 13 from Guanhu, Nangang, and Xinsha stations, resulting in the shutdown of the entire line. The metro stations that experienced flooding are marked with red dots in Figure 2. Thus, metro flooding has become a major obstacle to sustainable development in metropolitan areas, and its risk assessment is a significant factor in minimizing losses.
2.2. Flood Risk Assessment Model
There is no consistent definition of the concept of risk, even though it is a globally used concept [31,32]. Risks are described in many different ways in previously published studies. For example, some definitions of risk are based on mathematical concepts, such as probability, chance, expected values, or exceedance probability [33]. According to the Fifth Assessment Report (AR5) of the Intergovernmental Panel on Climate Change (IPCC), we consider the metro flood risk as a function of hazard, exposure, and vulnerability, which results from the interaction of these three factors [34,35]. Therefore, metro flood risk is expressed as follows:
where hazard indicates natural and human-induced physical events that may cause damage to the metro system; exposure refers to livelihoods, assets, and other resources that are adversely affected; and vulnerability encompasses a variety of concepts, including sensitivity or susceptibility to harm and lack of capacity to cope and adapt.
Due to the varying importance of the different indicators, metro flood risk is redefined as a combination of different indicators and their weights (Equation (2)).
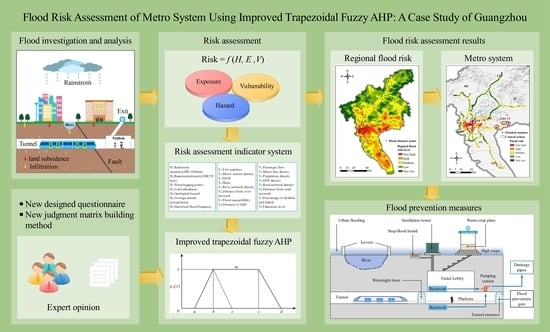
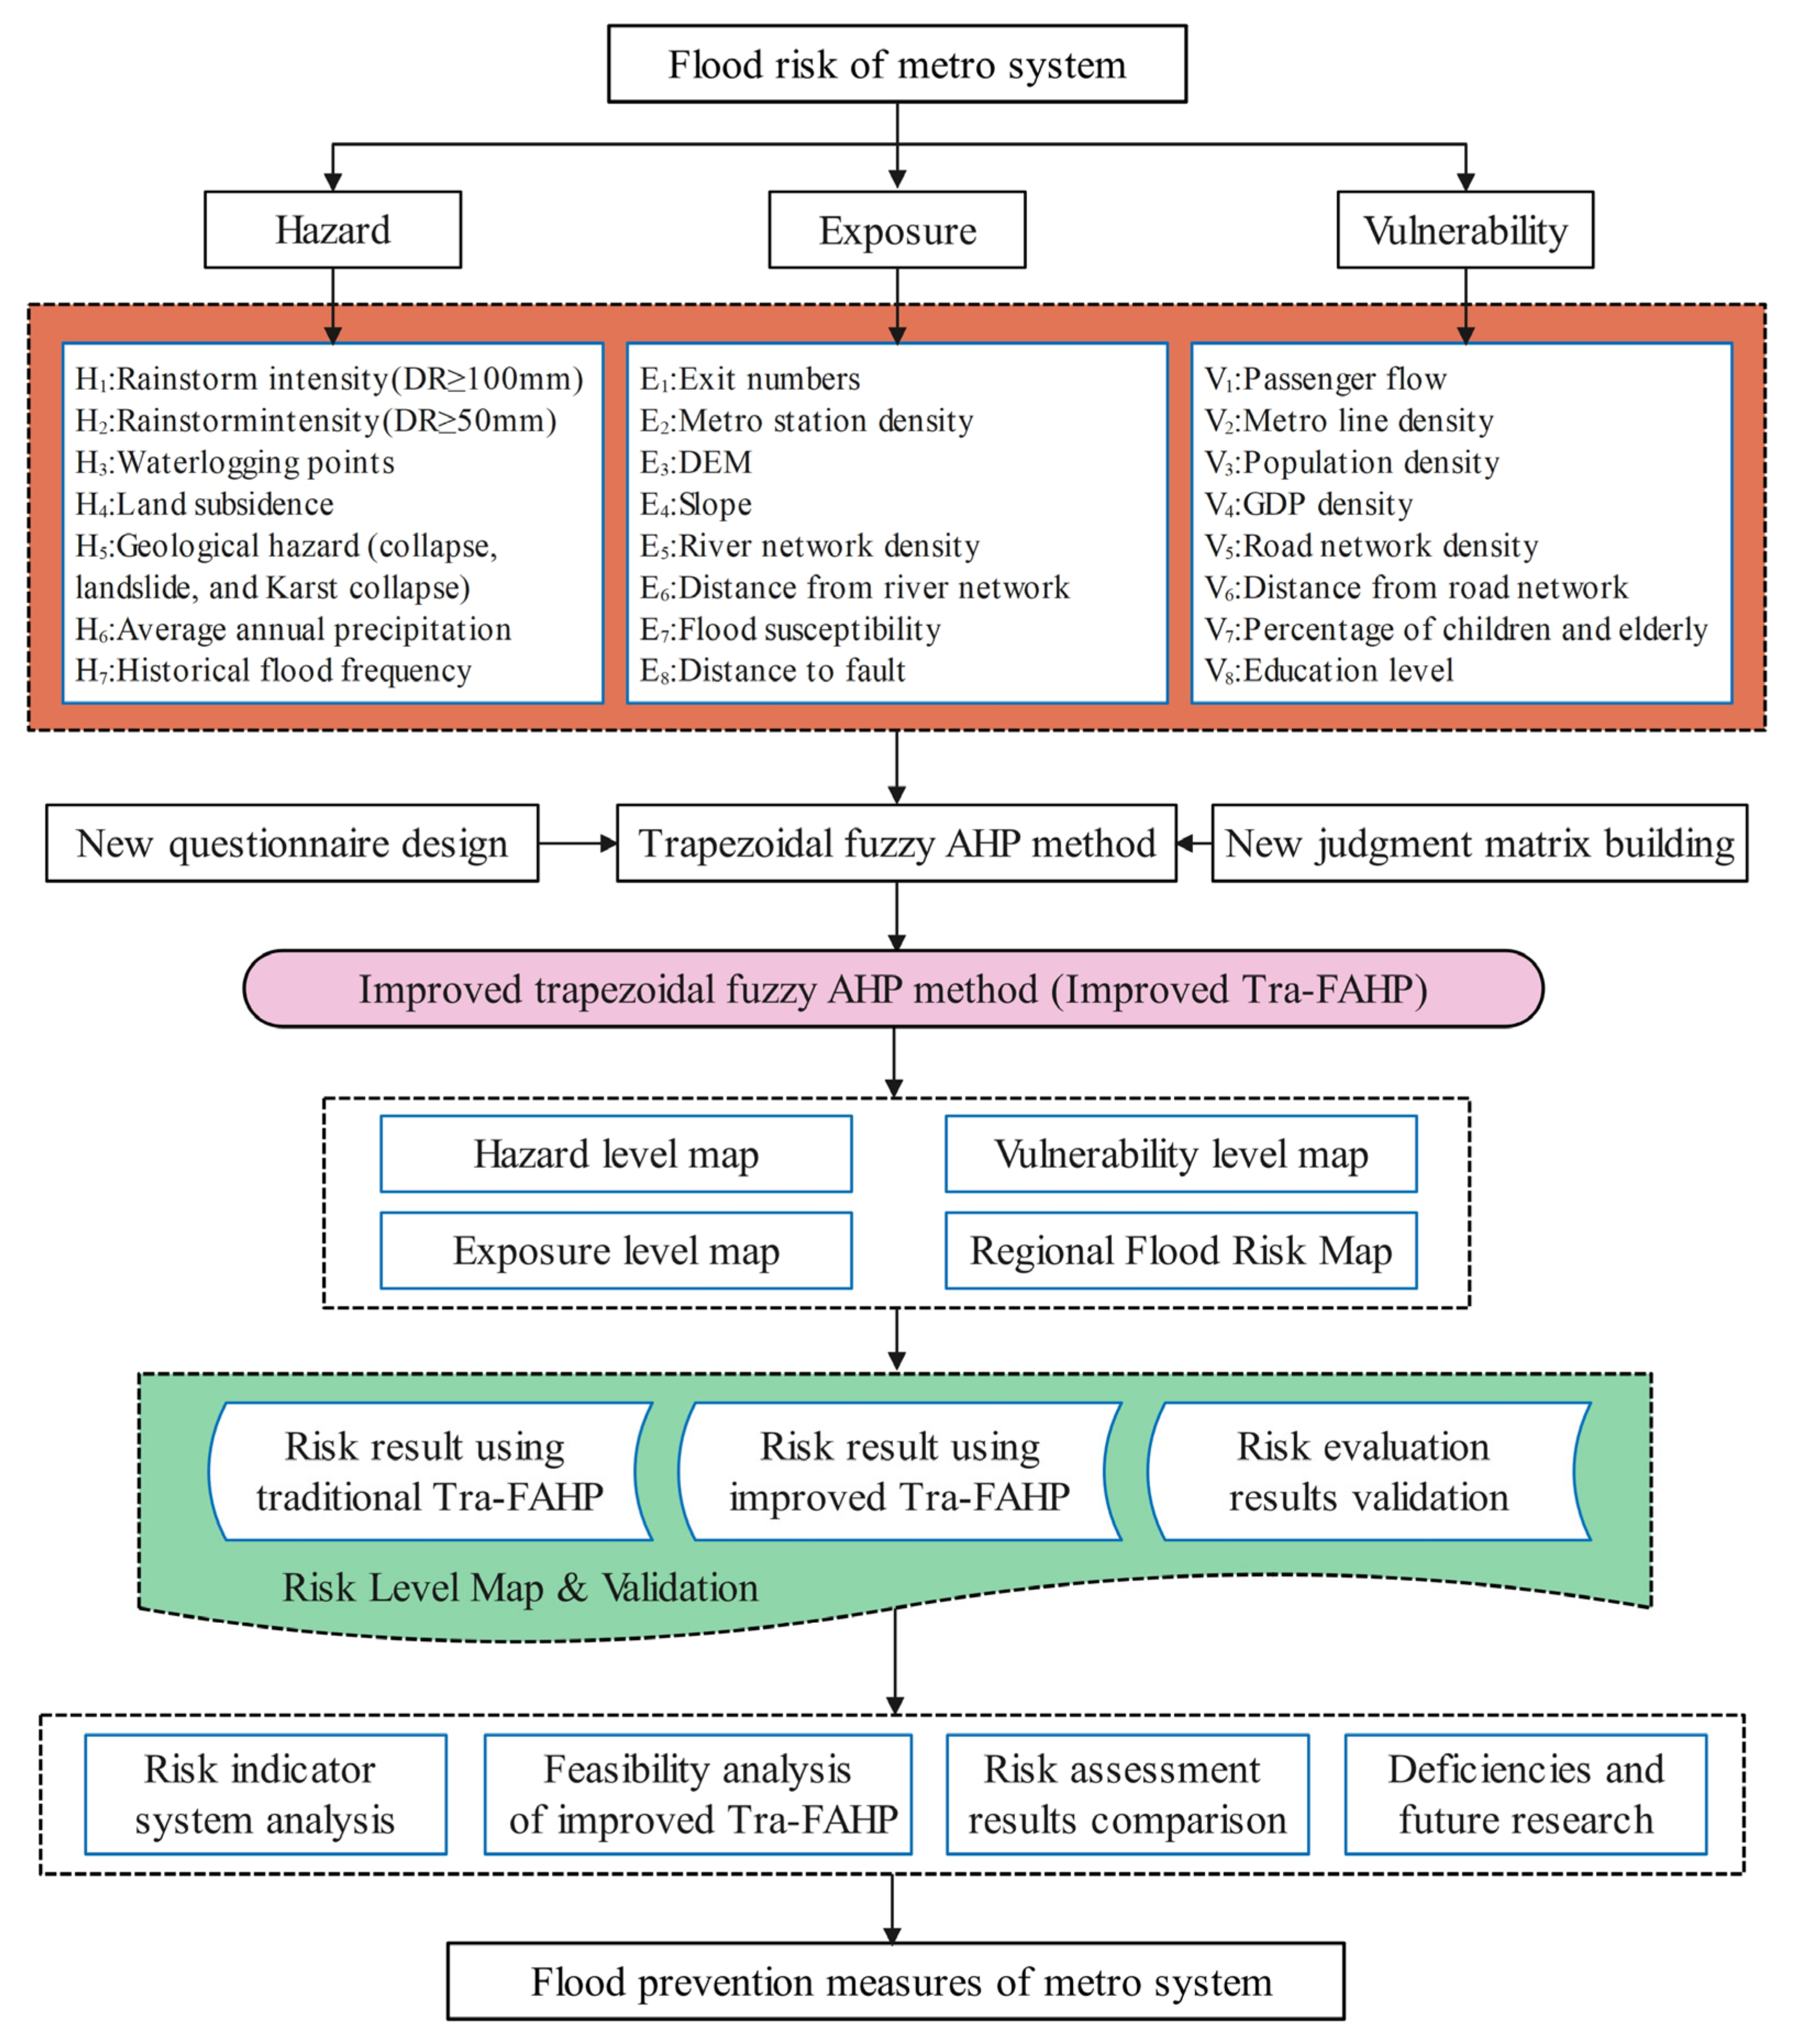
where MFR represents metro flood risk. The values α, β, and γ are the weights of hazard, exposure, and vulnerability factors, respectively. The values Hi, Ej, and Vk denote the hazard, exposure, and vulnerability indicators’ secondary indicators. The values Wh, We, and Wv indicate the weights of the secondary indicators. The weight of each indicator is determined based on the improved trapezoidal fuzzy AHP proposed in this paper. Next, the regional flood risk map is generated based on the weights and normalized indicator layers (raster layers with a resolution of 100 × 100 m) and, eventually, produce the flood risk map of the metro system. Figure 3 presents the procedure of flood risk assessment for metro systems.
2.3. Risk Indicator System and Data
Based on the risk model and field survey, we selected 23 risk indicators from hazard, exposure, and vulnerability to establish a risk assessment indicator system for metro systems. The detailed data sources for these indicators are shown in Table A1.
2.3.1. Hazard Indicator
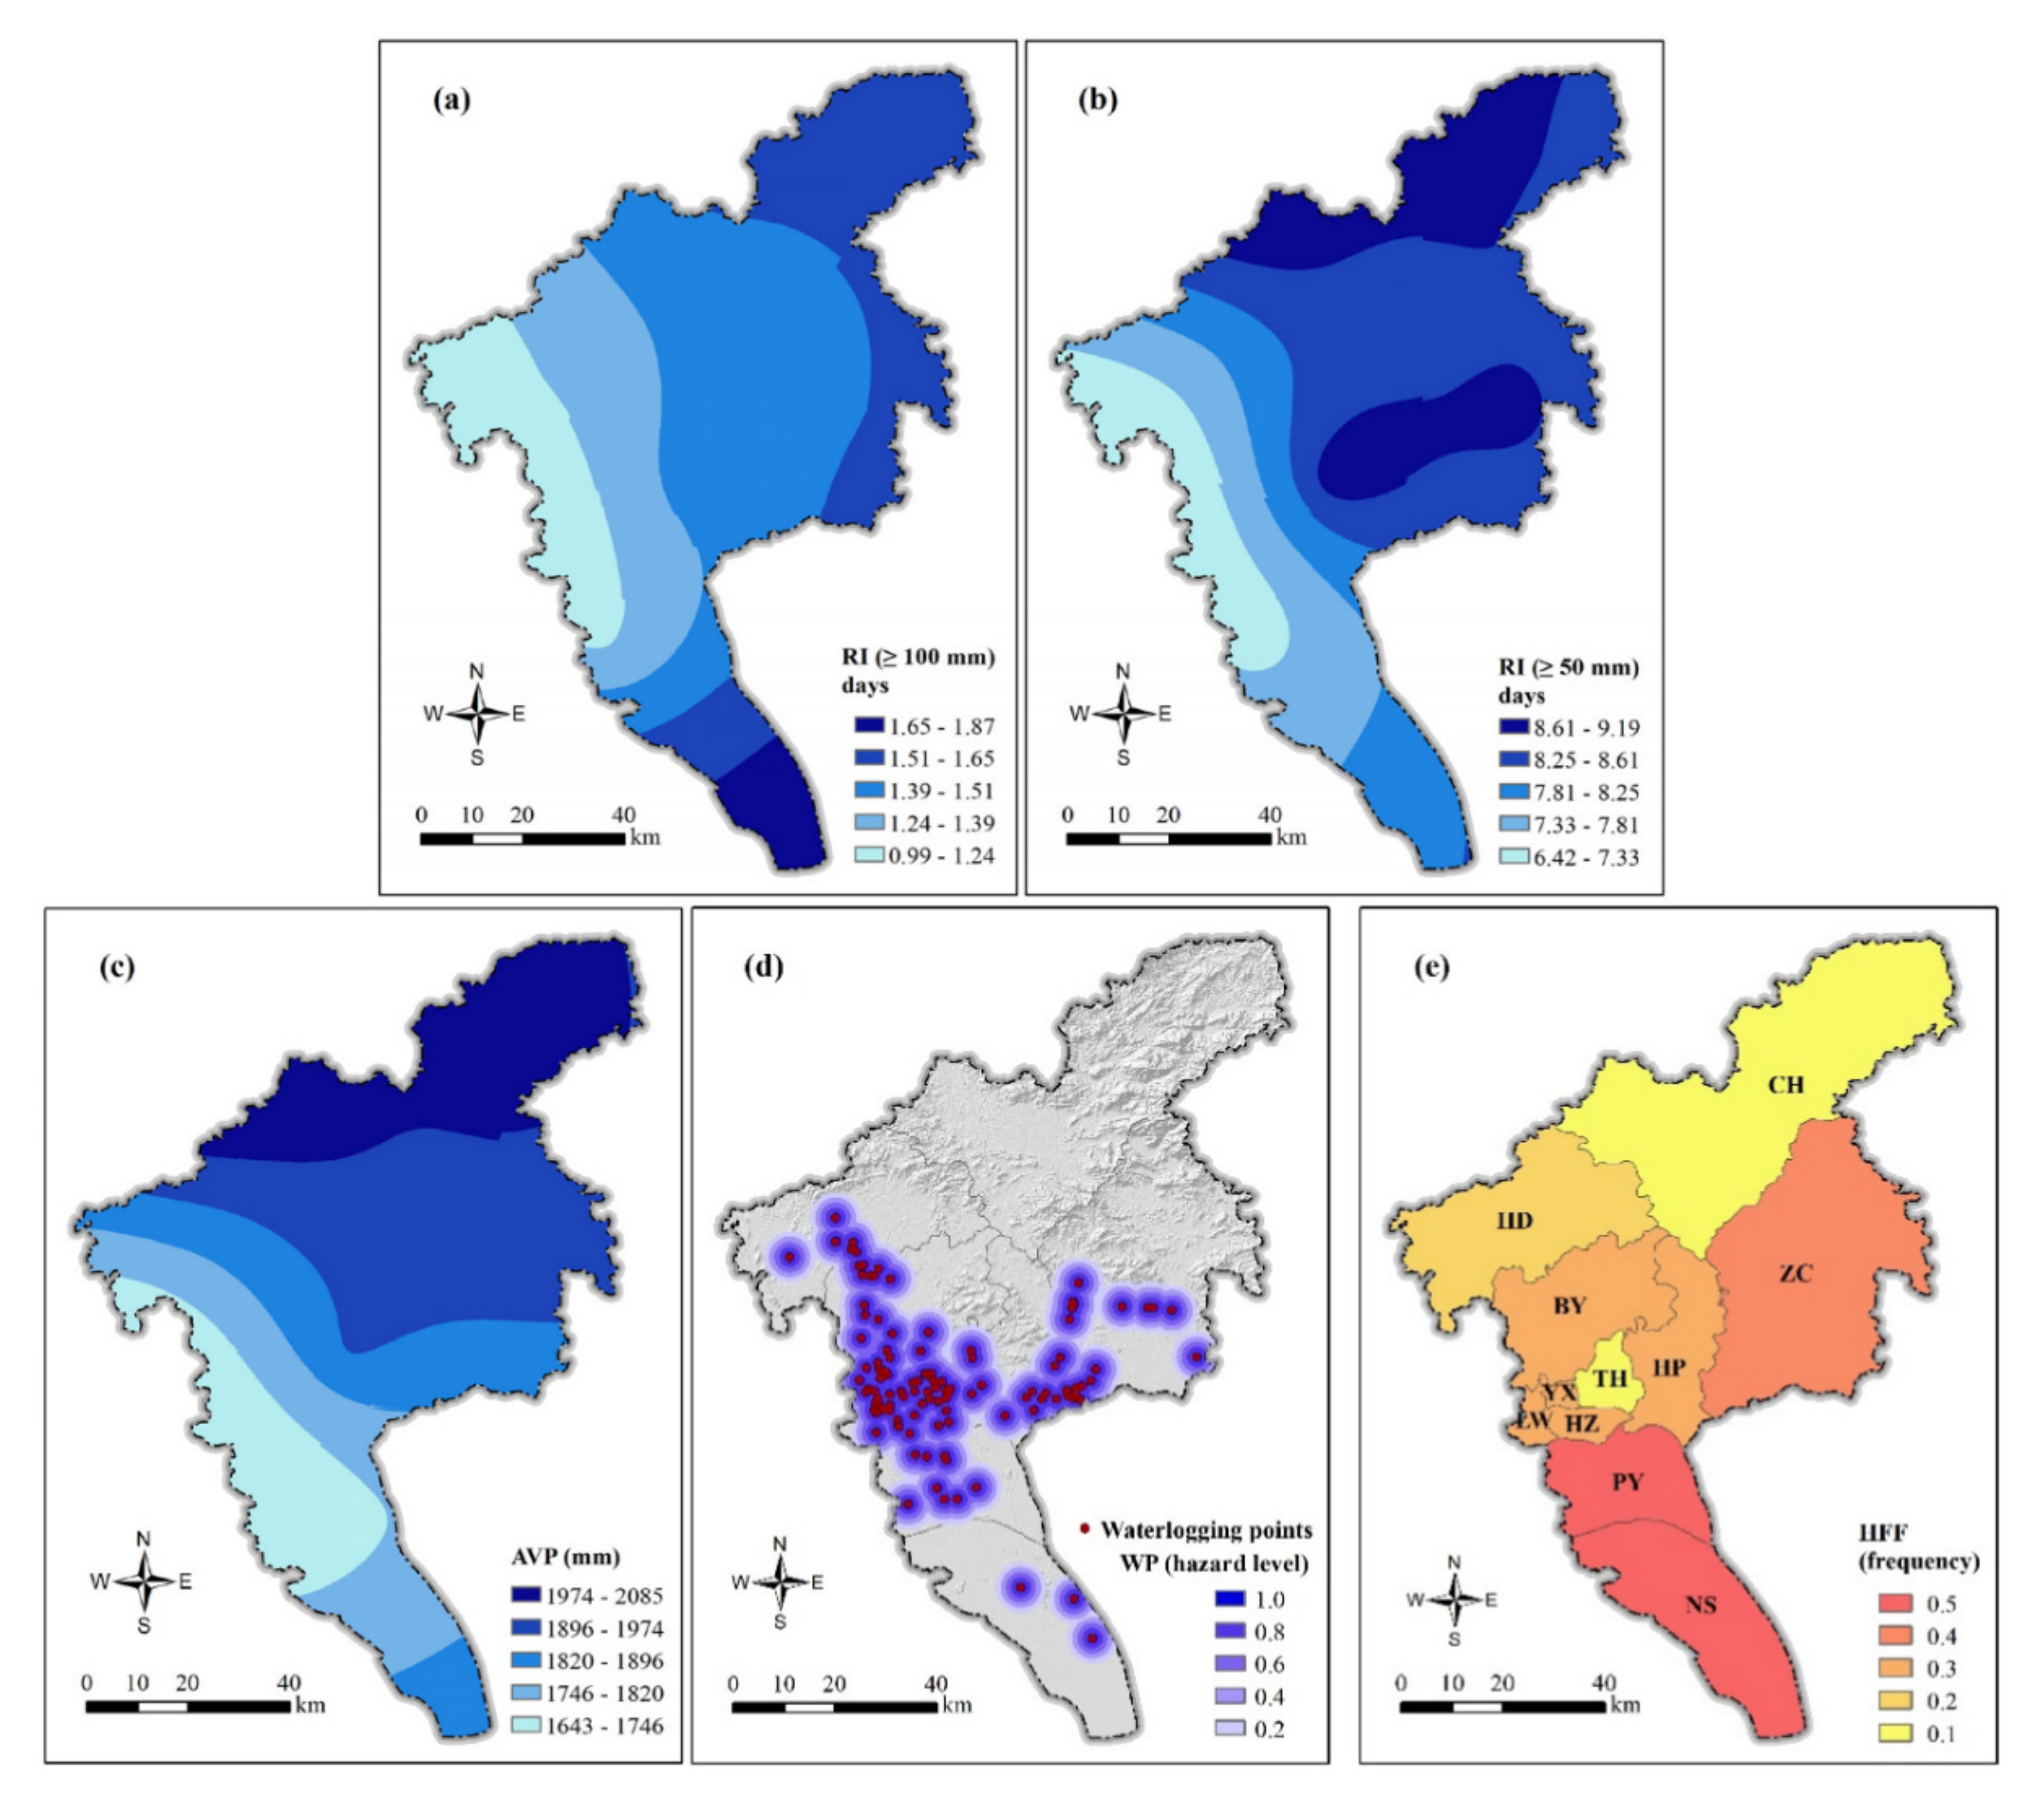
The hazard assessment comprised seven indicators. The rainstorm intensities (H1 and H2) and average annual precipitation (H6) were generated from the daily precipitation data provided by the Guangzhou Meteorological Bureau. We created raster layers of rainstorm intensities and average annual precipitation using kriging interpolation in ArcGIS (Figure 4a–c). The 128 waterlogging points (H3) were derived from historical flood records and the People’s Government of Guangzhou Municipality (Figure 4d). The frequency of major floods in Guangzhou during 975-2017 C.E. was counted through the Historical Materials of Natural Disasters in Guangdong Province and the Yearbook of Disaster Prevention and Mitigation of Guangdong Province. Figure 4e and Table 1 show the spatial distribution of the historical flood frequency (H7) and its danger rating.
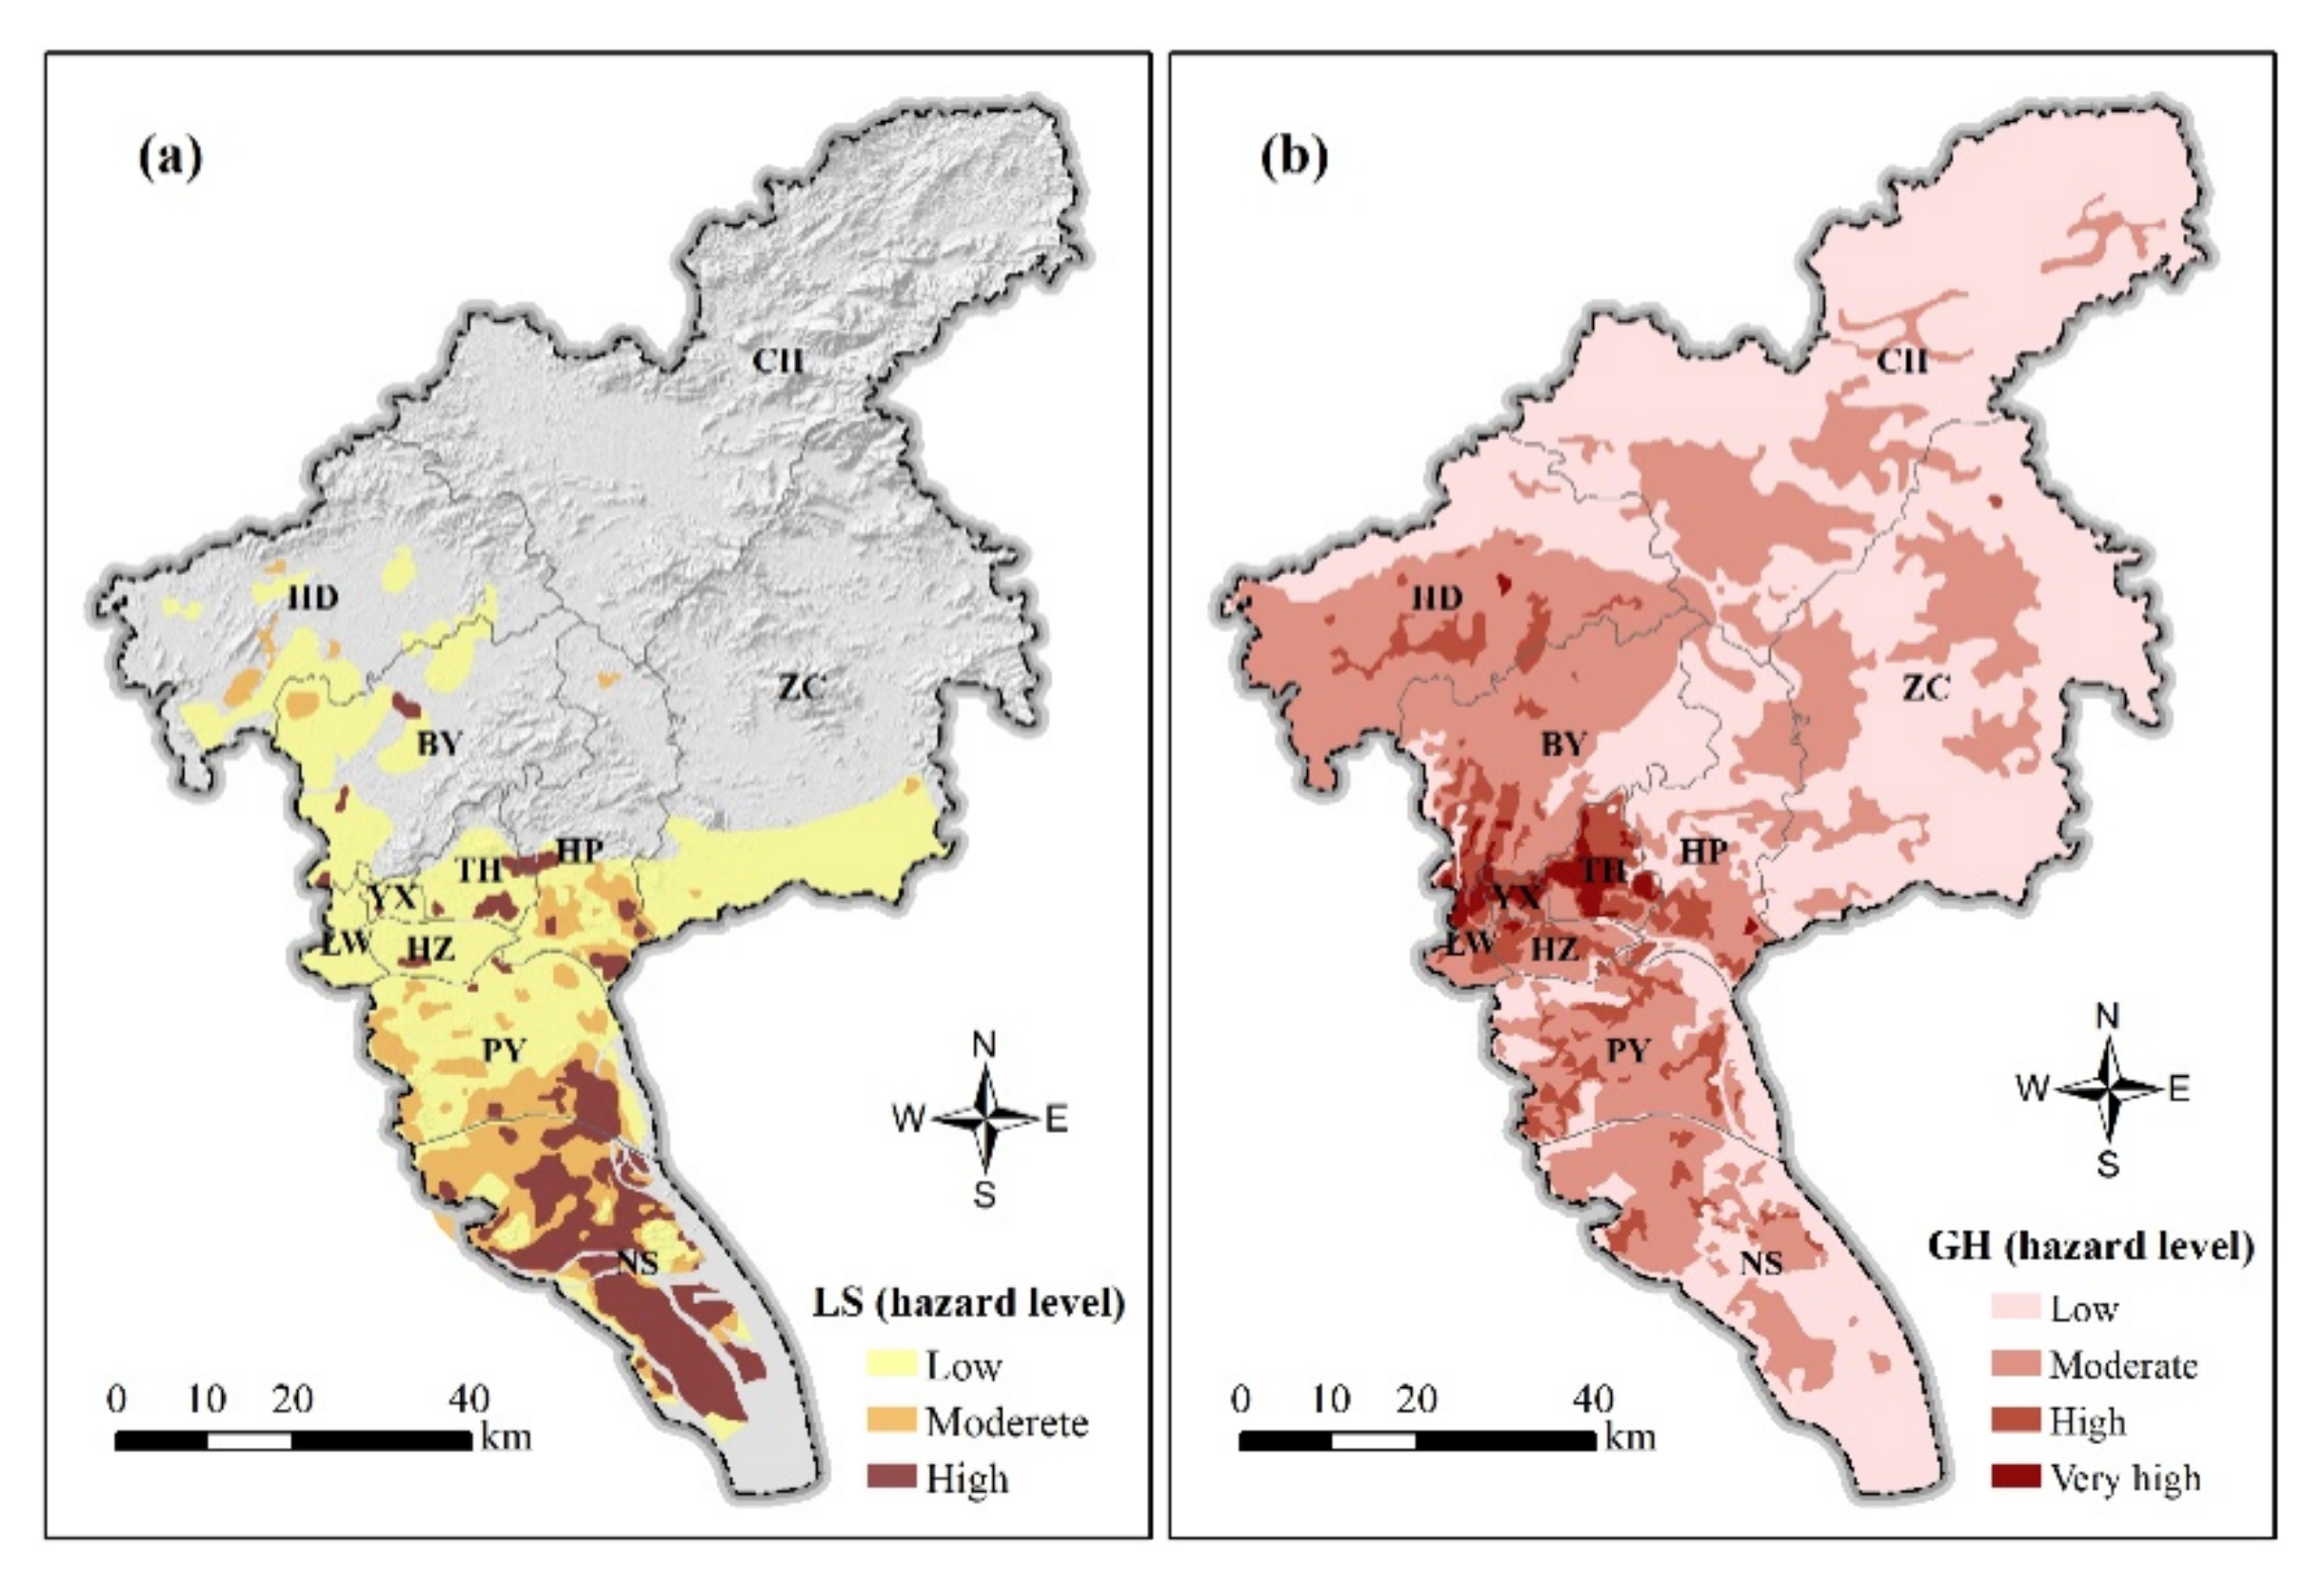
The land subsidence (H4) and other geological hazard (H5) data were obtained from GeoCloud. The hazard level of the land subsidence was graded according to the deposition thickness of the Quaternary soft soil layer. According to the analysis of geological boreholes, soft soils were mainly distributed in the delta plain to the south of Guangzhou, i.e., along both sides of the Pearl River (≤10 m), Panyu (10–20 m), and Nansha district (20–40 m). The geological hazard data included collapse, landslide, and Karst collapse in our study, among which karst collapse exerts the most significant effect on the safety of metro tunnels [8,30]. Figure 5a,b show the hazard level distribution of the land subsidence and other geological hazards.
2.3.2. Exposure Indicator
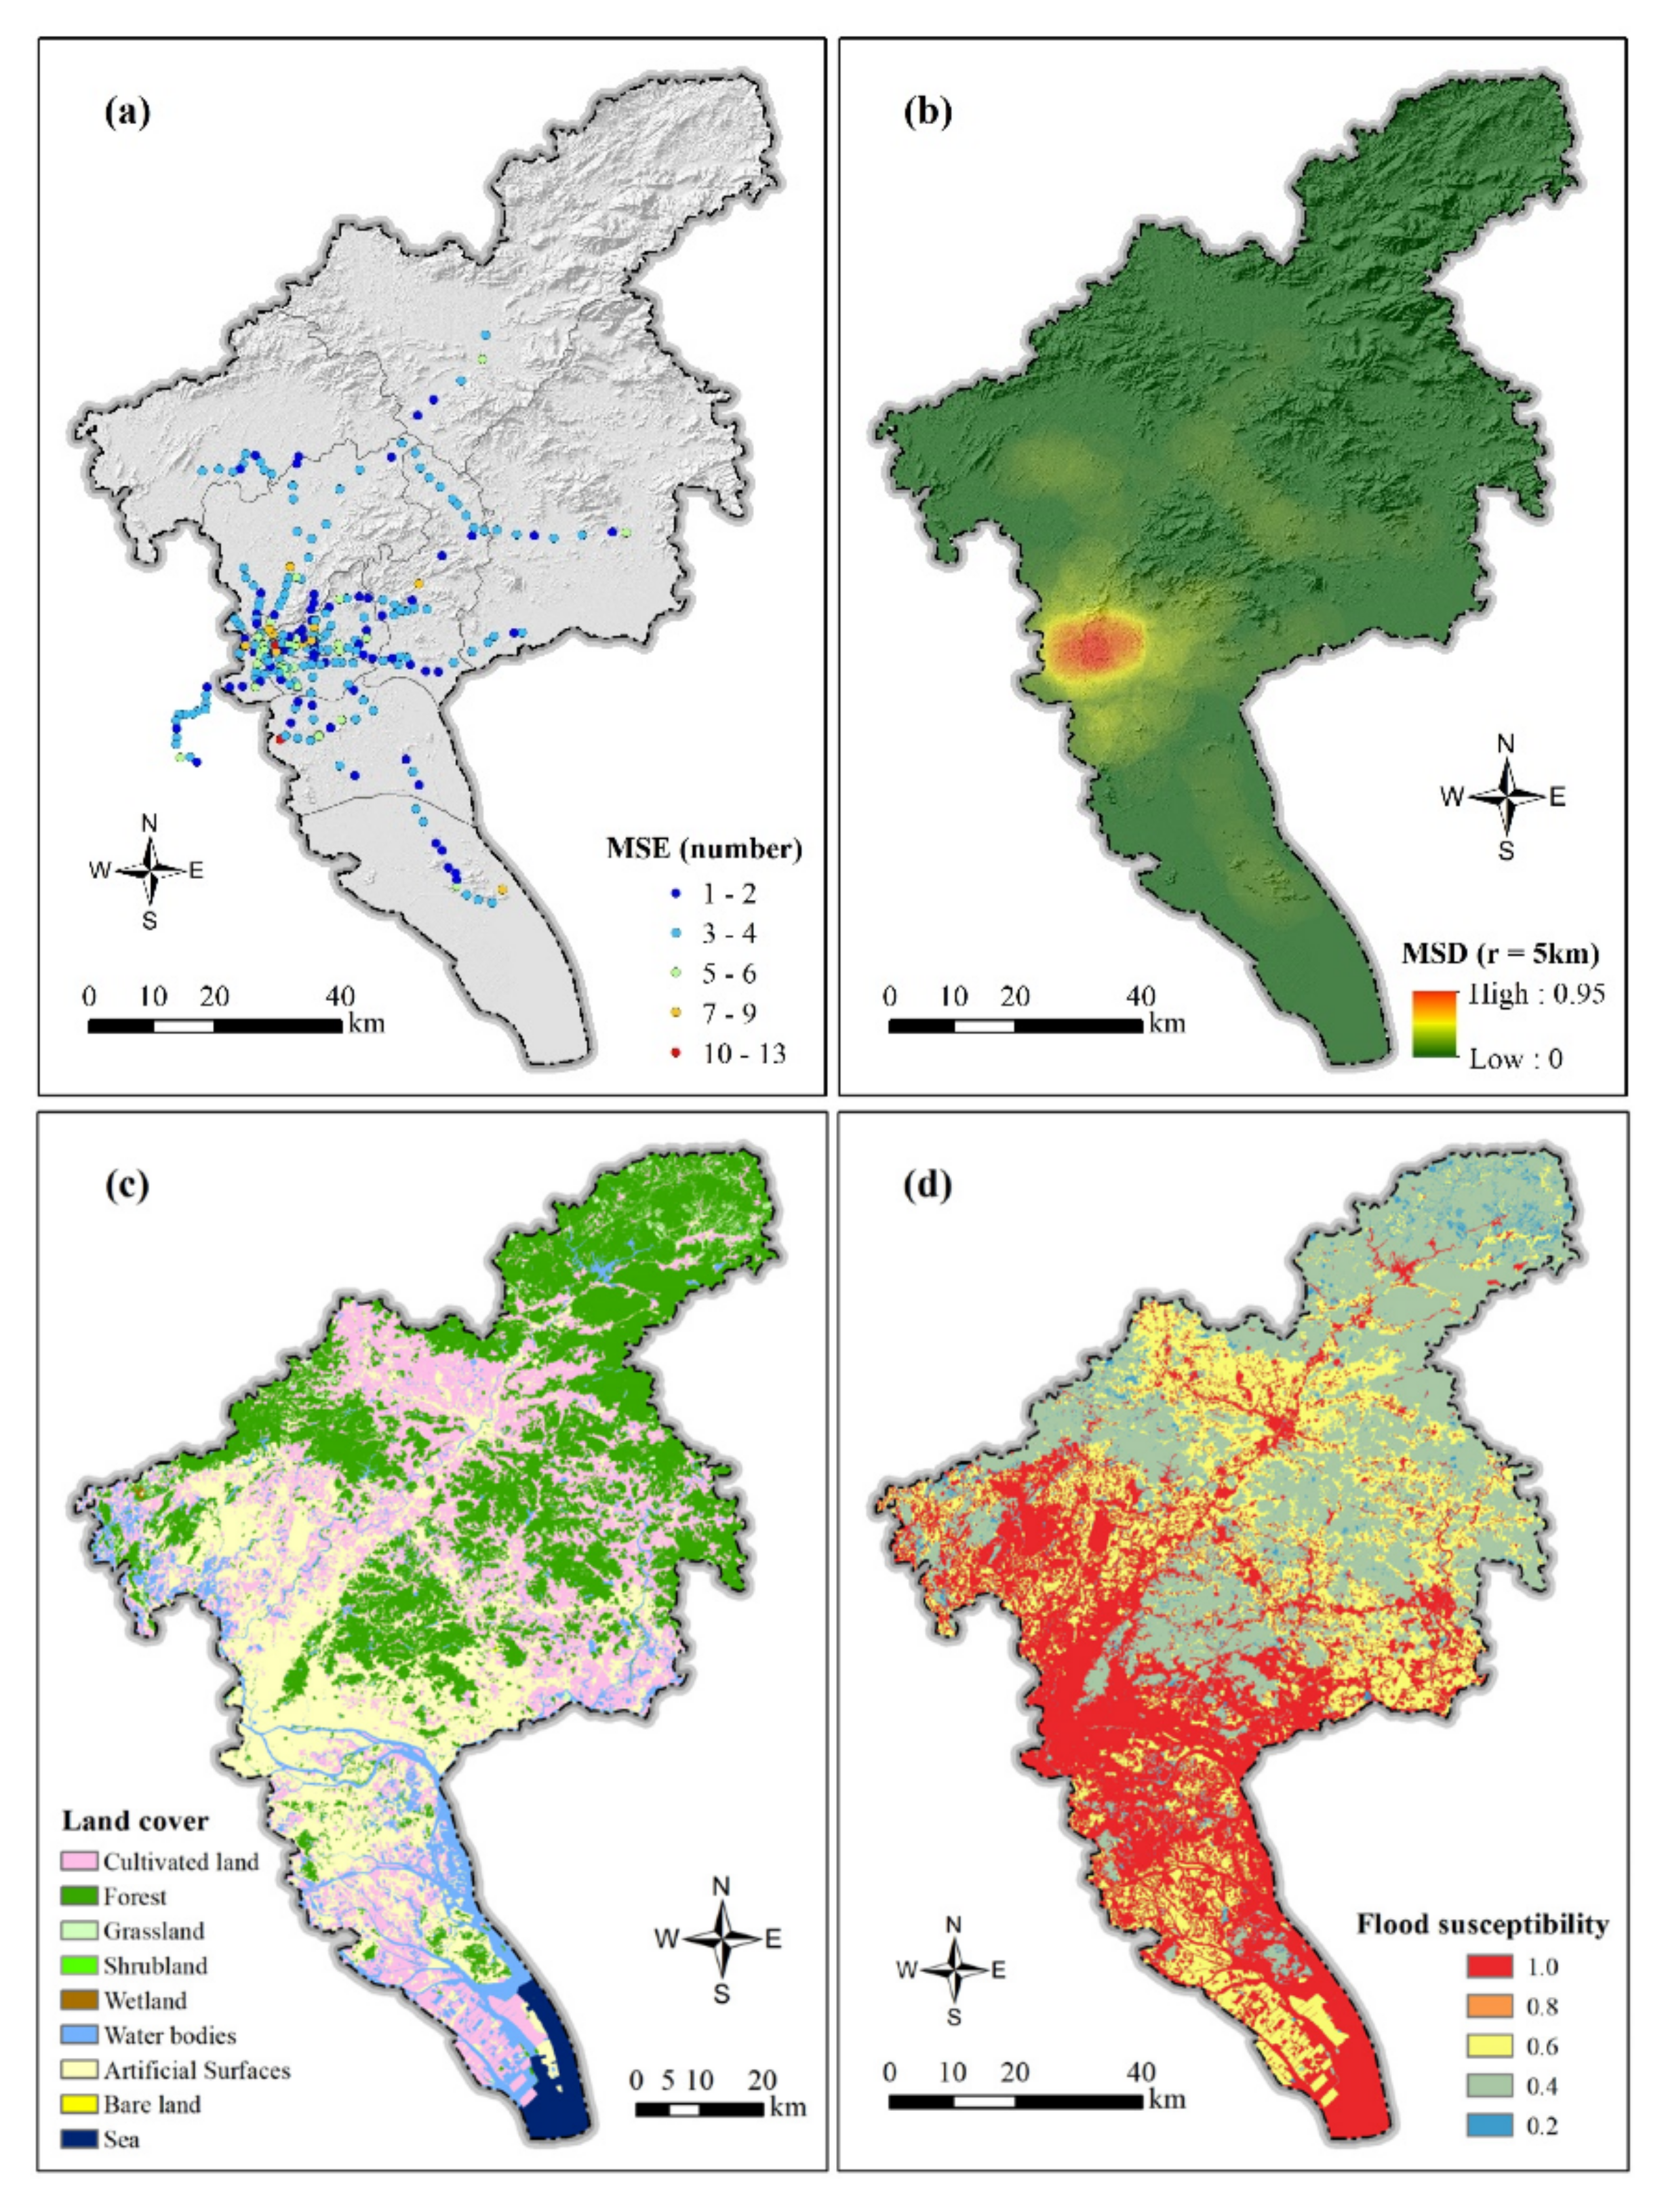
Eight indicators were employed to analyze the exposure level of the Guangzhou metro system. The station exit numbers (E1) are from the official website of Guangzhou Metro. The metro station density (E2) layer was generated using the point density analysis in ArcGIS with a search radius of 5 km [36]. Figure 6a,b show the spatial distribution of the density and exit numbers of Guangzhou metro stations. The land cover (Figure 6c) in 2020 was extracted from the GlobeLand30 dataset. Subsequently, the flood susceptibility levels (E7) (Figure 6d) were ranked according to the runoff coefficients of different land-use types [37,38].
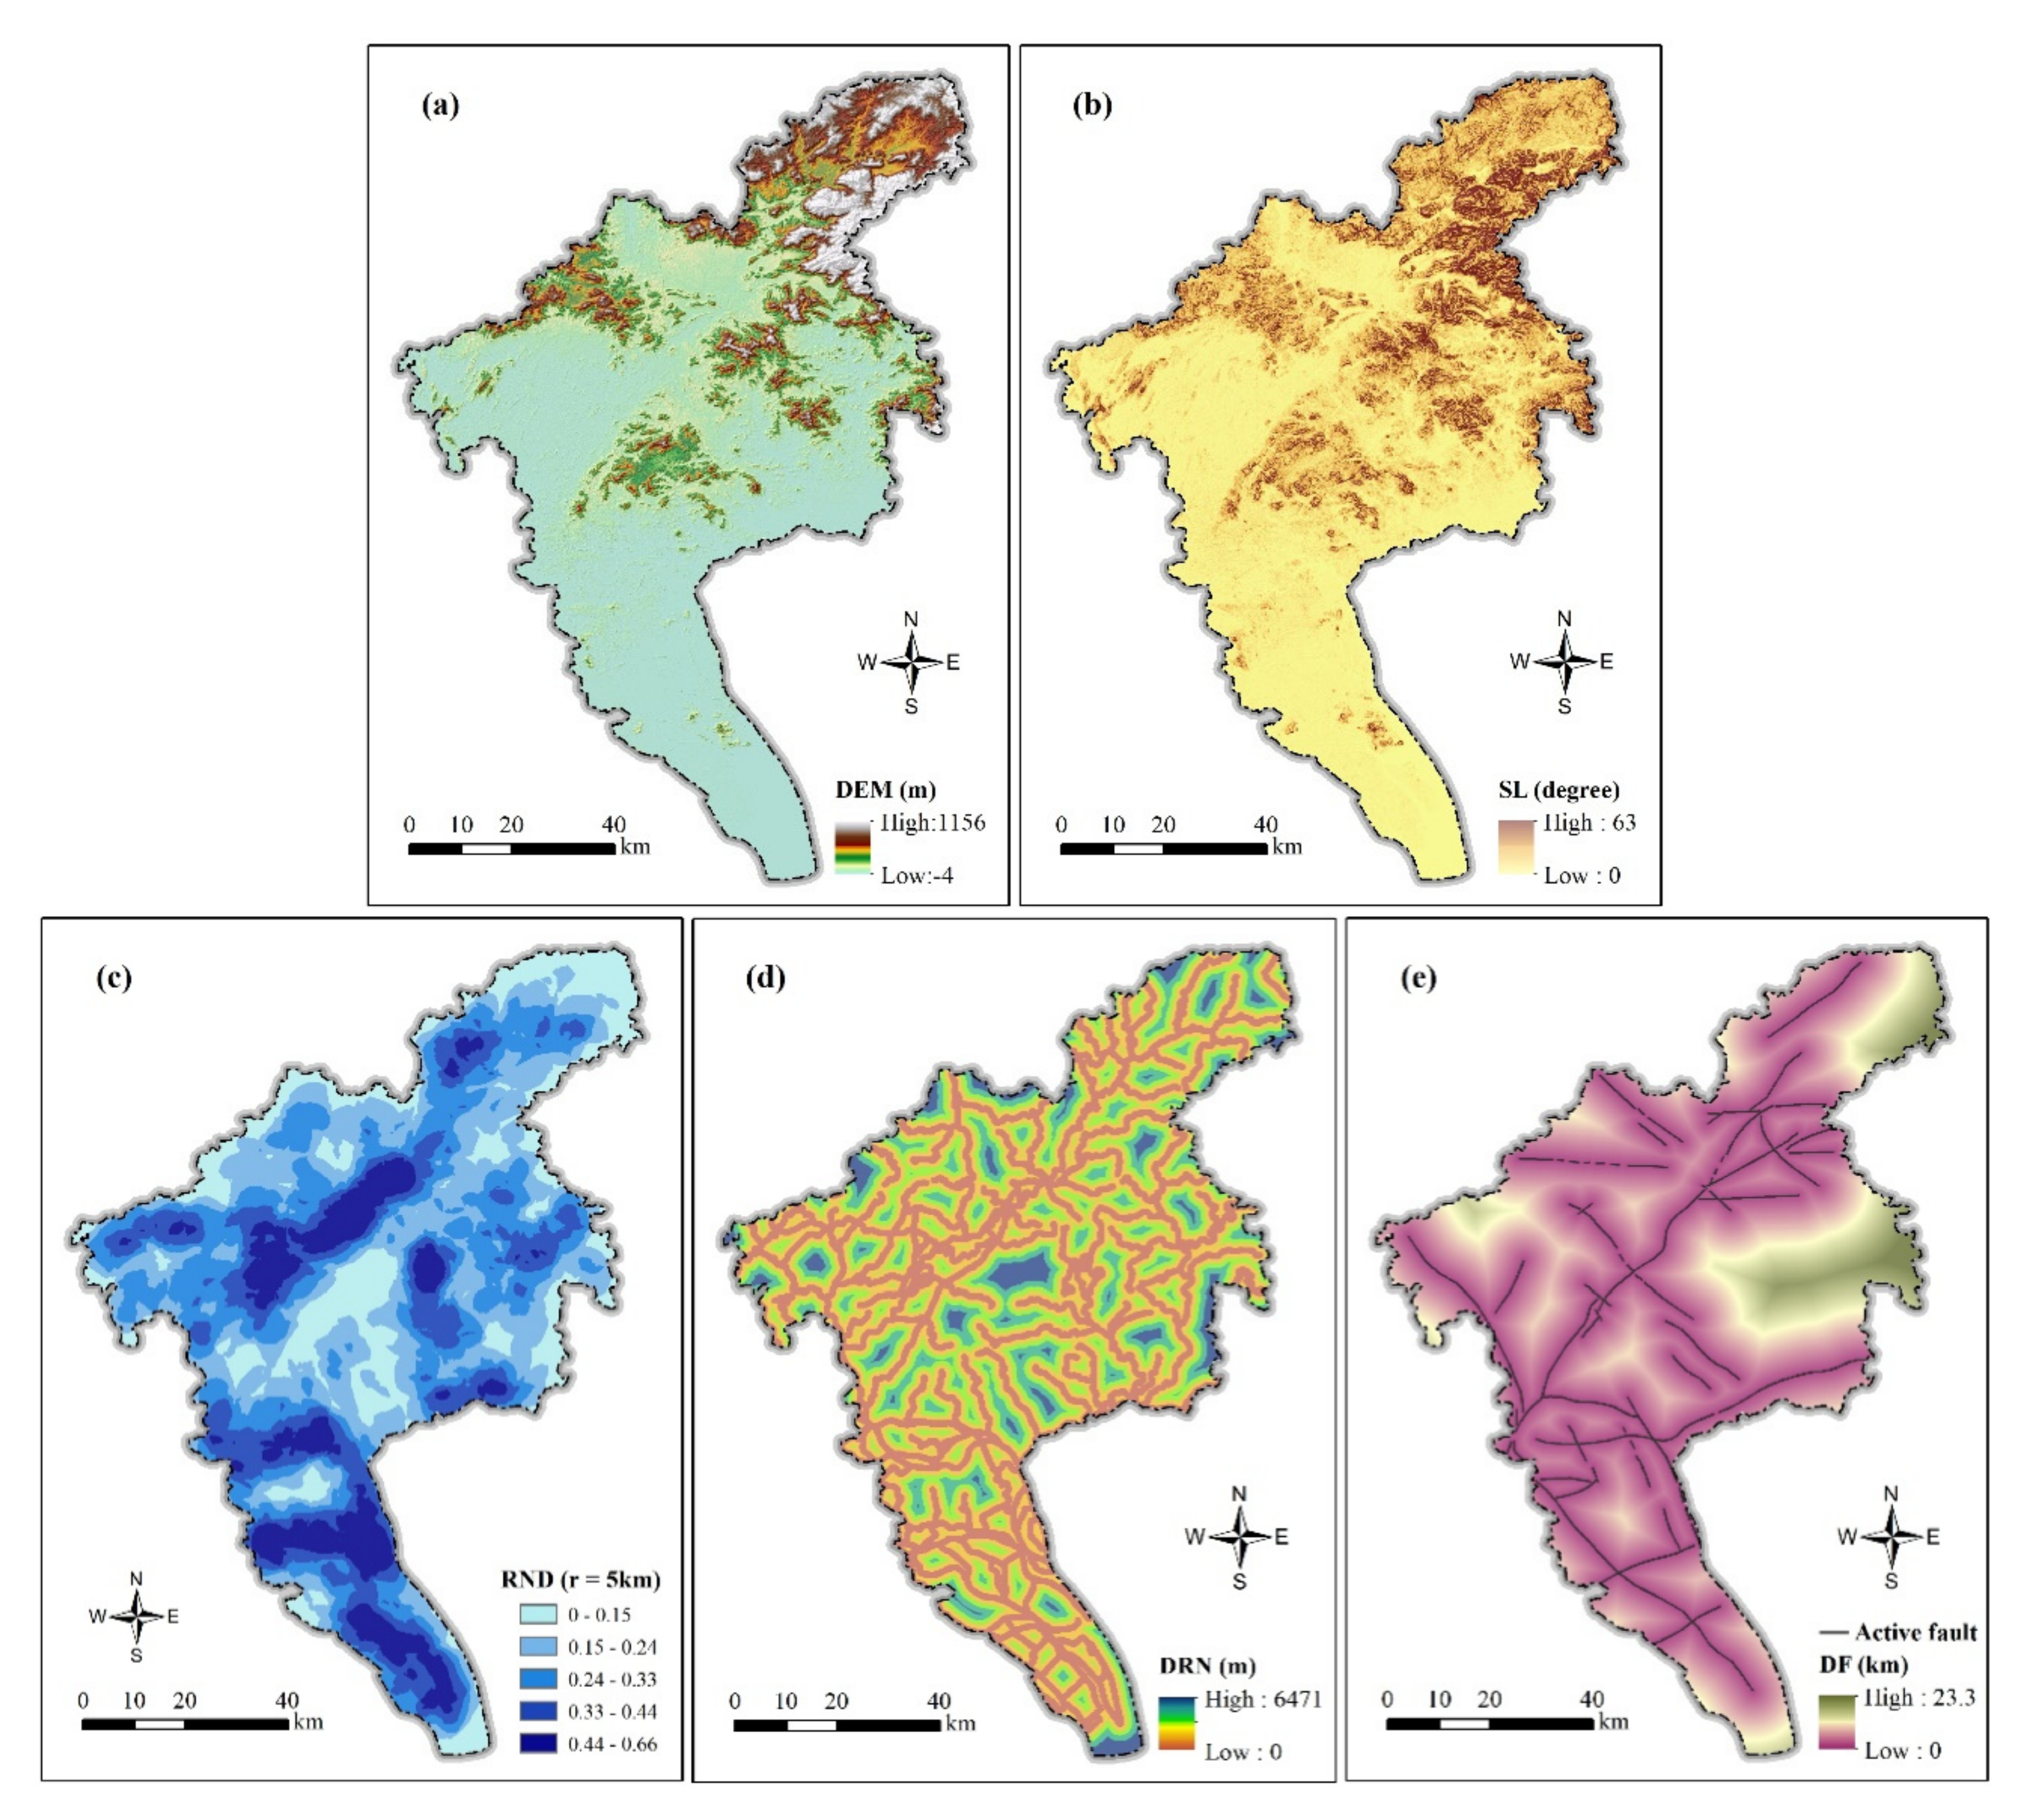
The elevation data originated in the Geospatial Data Cloud. We performed a slope analysis and resampling of the raw data using ArcGIS to obtain the DEM (E3) and slope (E4) raster layers with a spatial resolution of 100 × 100 m (Figure 7a,b). The river network was obtained from the basic geographic data of the National Geomatics Center of China with a scale of 1:250,000 (2017 version). Employing the line density and proximity analysis of ArcGIS, the river network density (E5) and distance-to-river (E6) layers were created [17] (Figure 7c,d). The fault data, including active fracture zones during the Late Pleistocene and Quaternary, were provided by GeoCloud. The raster layer of the distance to fault (E8) (Figure 7e) was generated using ArcGIS proximity analysis [31].
2.3.3. Vulnerability Indicator
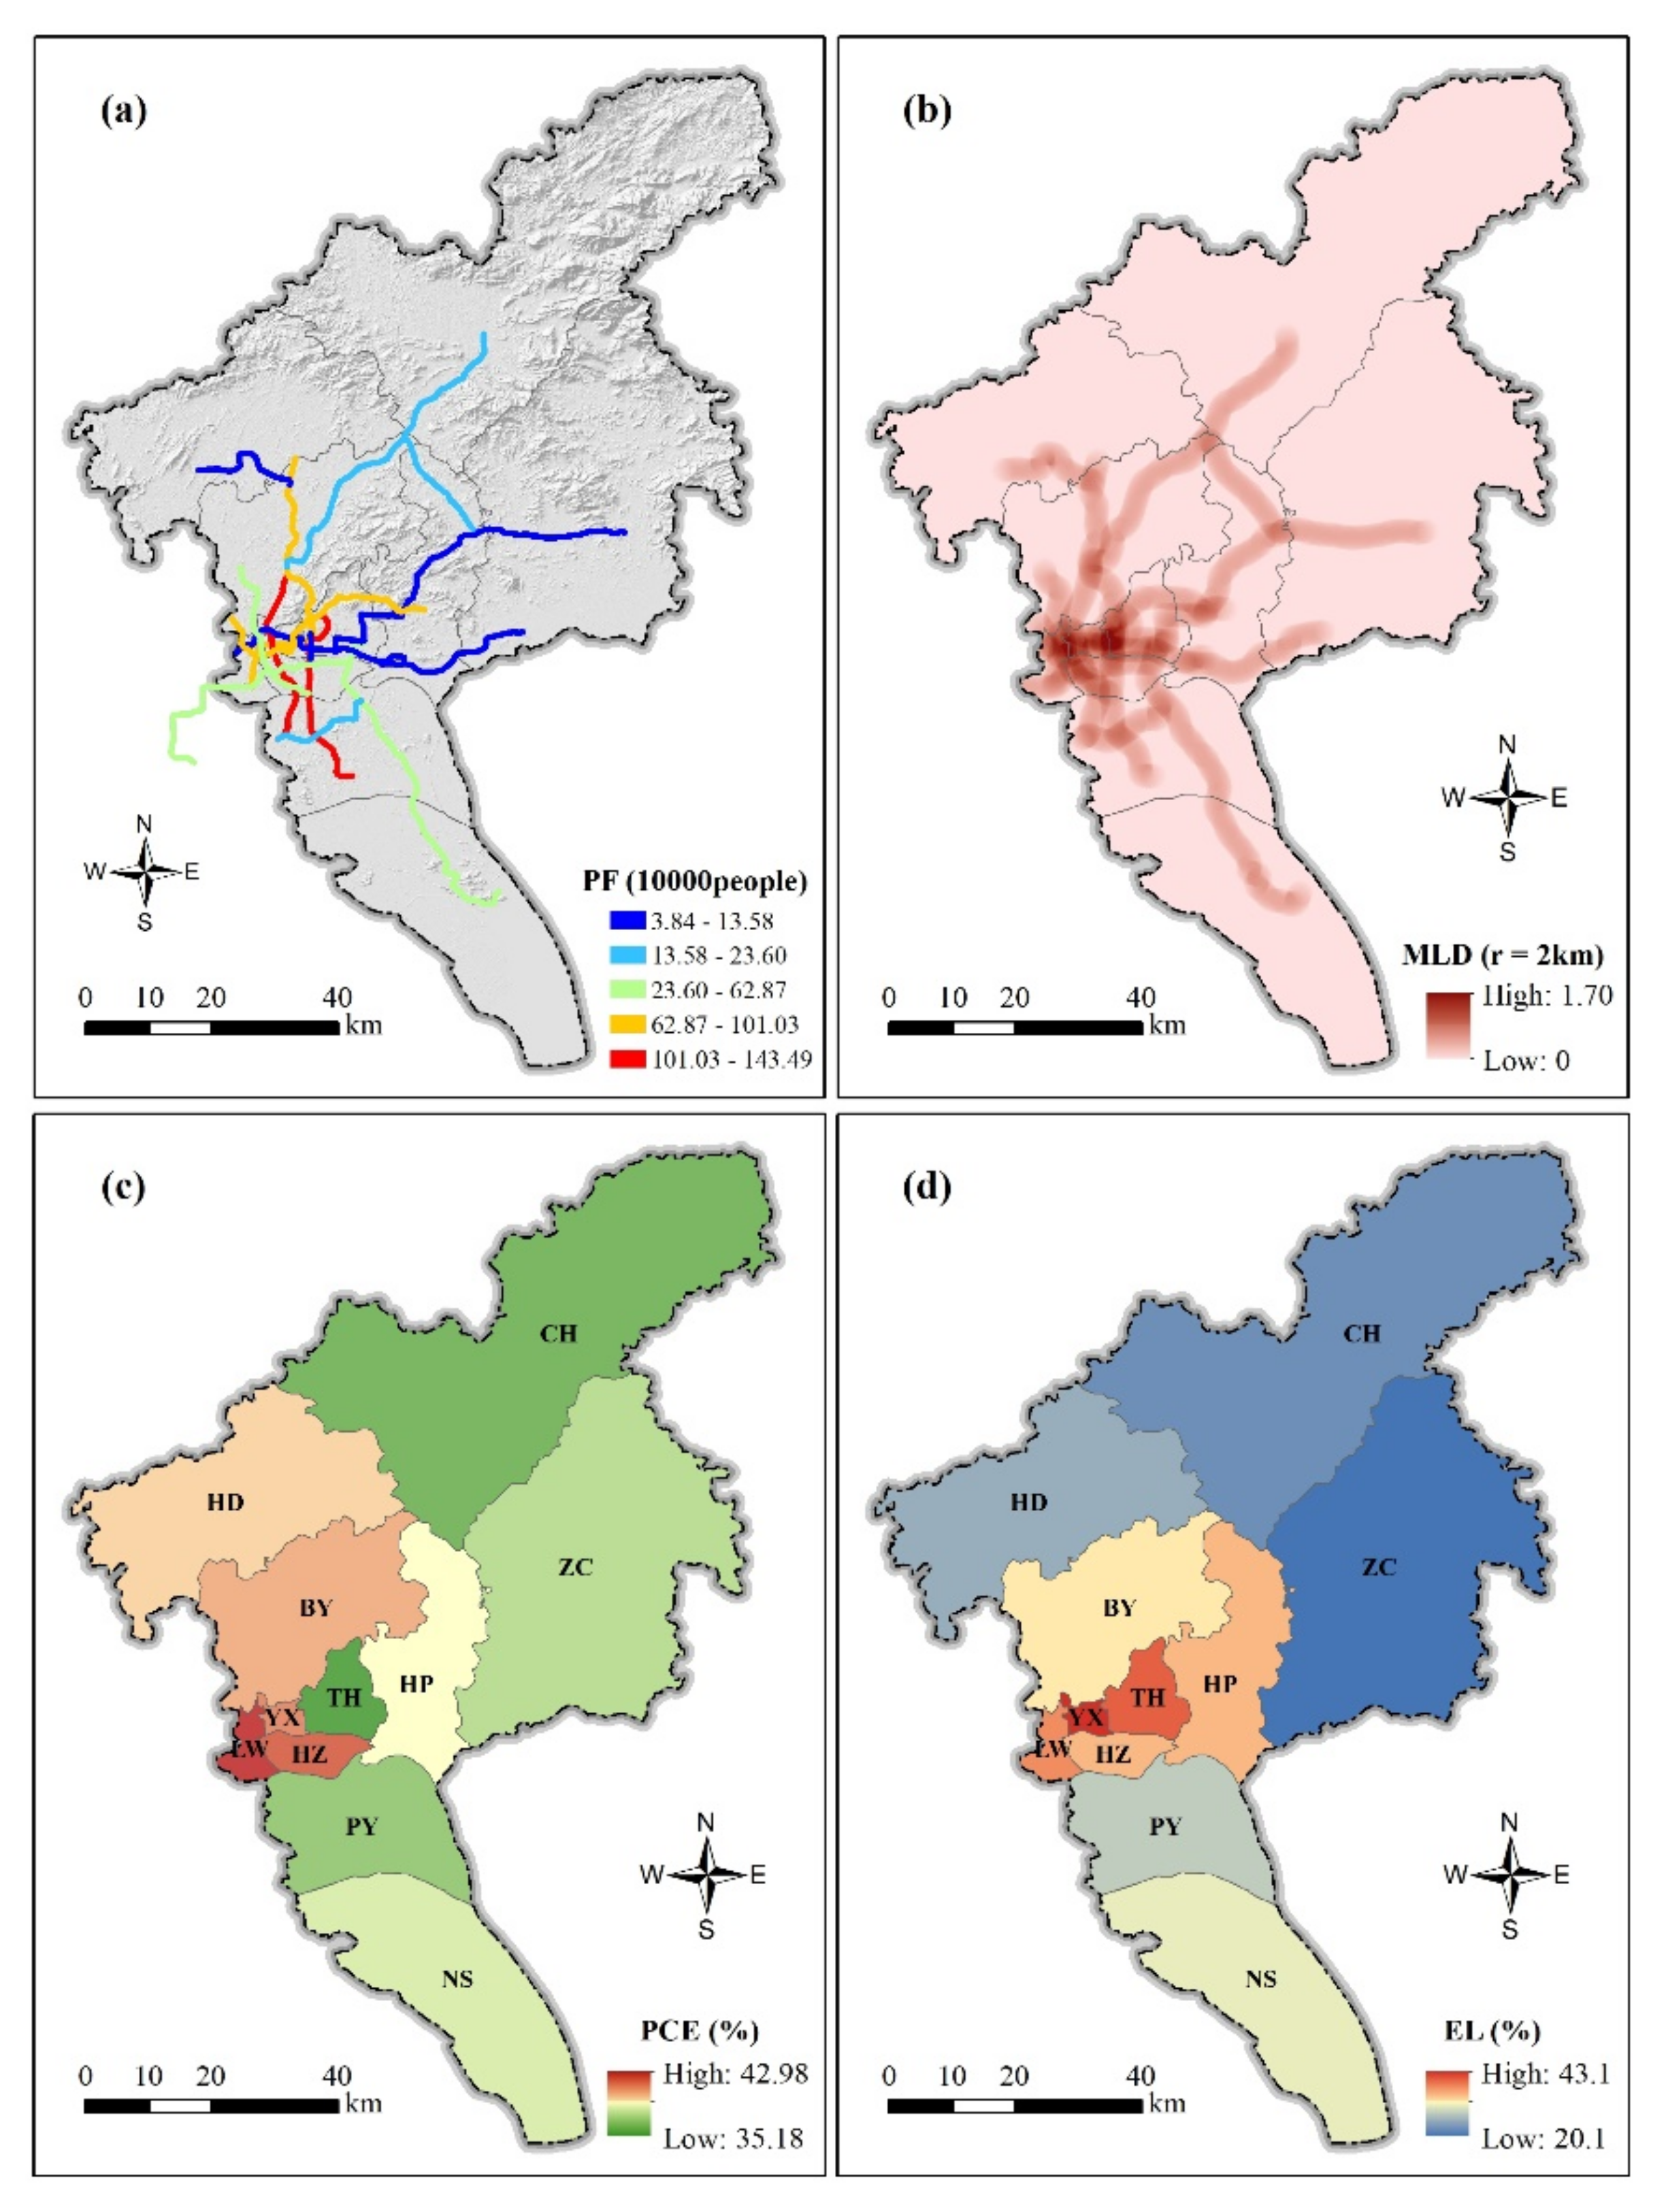
The vulnerability assessment includes eight indicators. The daily passenger flow (V1) and metro lines were from the official website of the Guangzhou Metro (Figure 8a,b). The metro line density (V2) layer was created using the line density analysis in ArcGIS with a search radius of 2 km (Figure 8b). The data on the proportion of elderly and children (older than 60 or younger than 18, V7) were obtained from the Guangzhou Statistical Yearbook (2020) (Figure 8c). The education level (V8) data were sourced from the sixth population census from 2010. Figure 8d shows the percentage of the population with an education level of high school degree or higher.
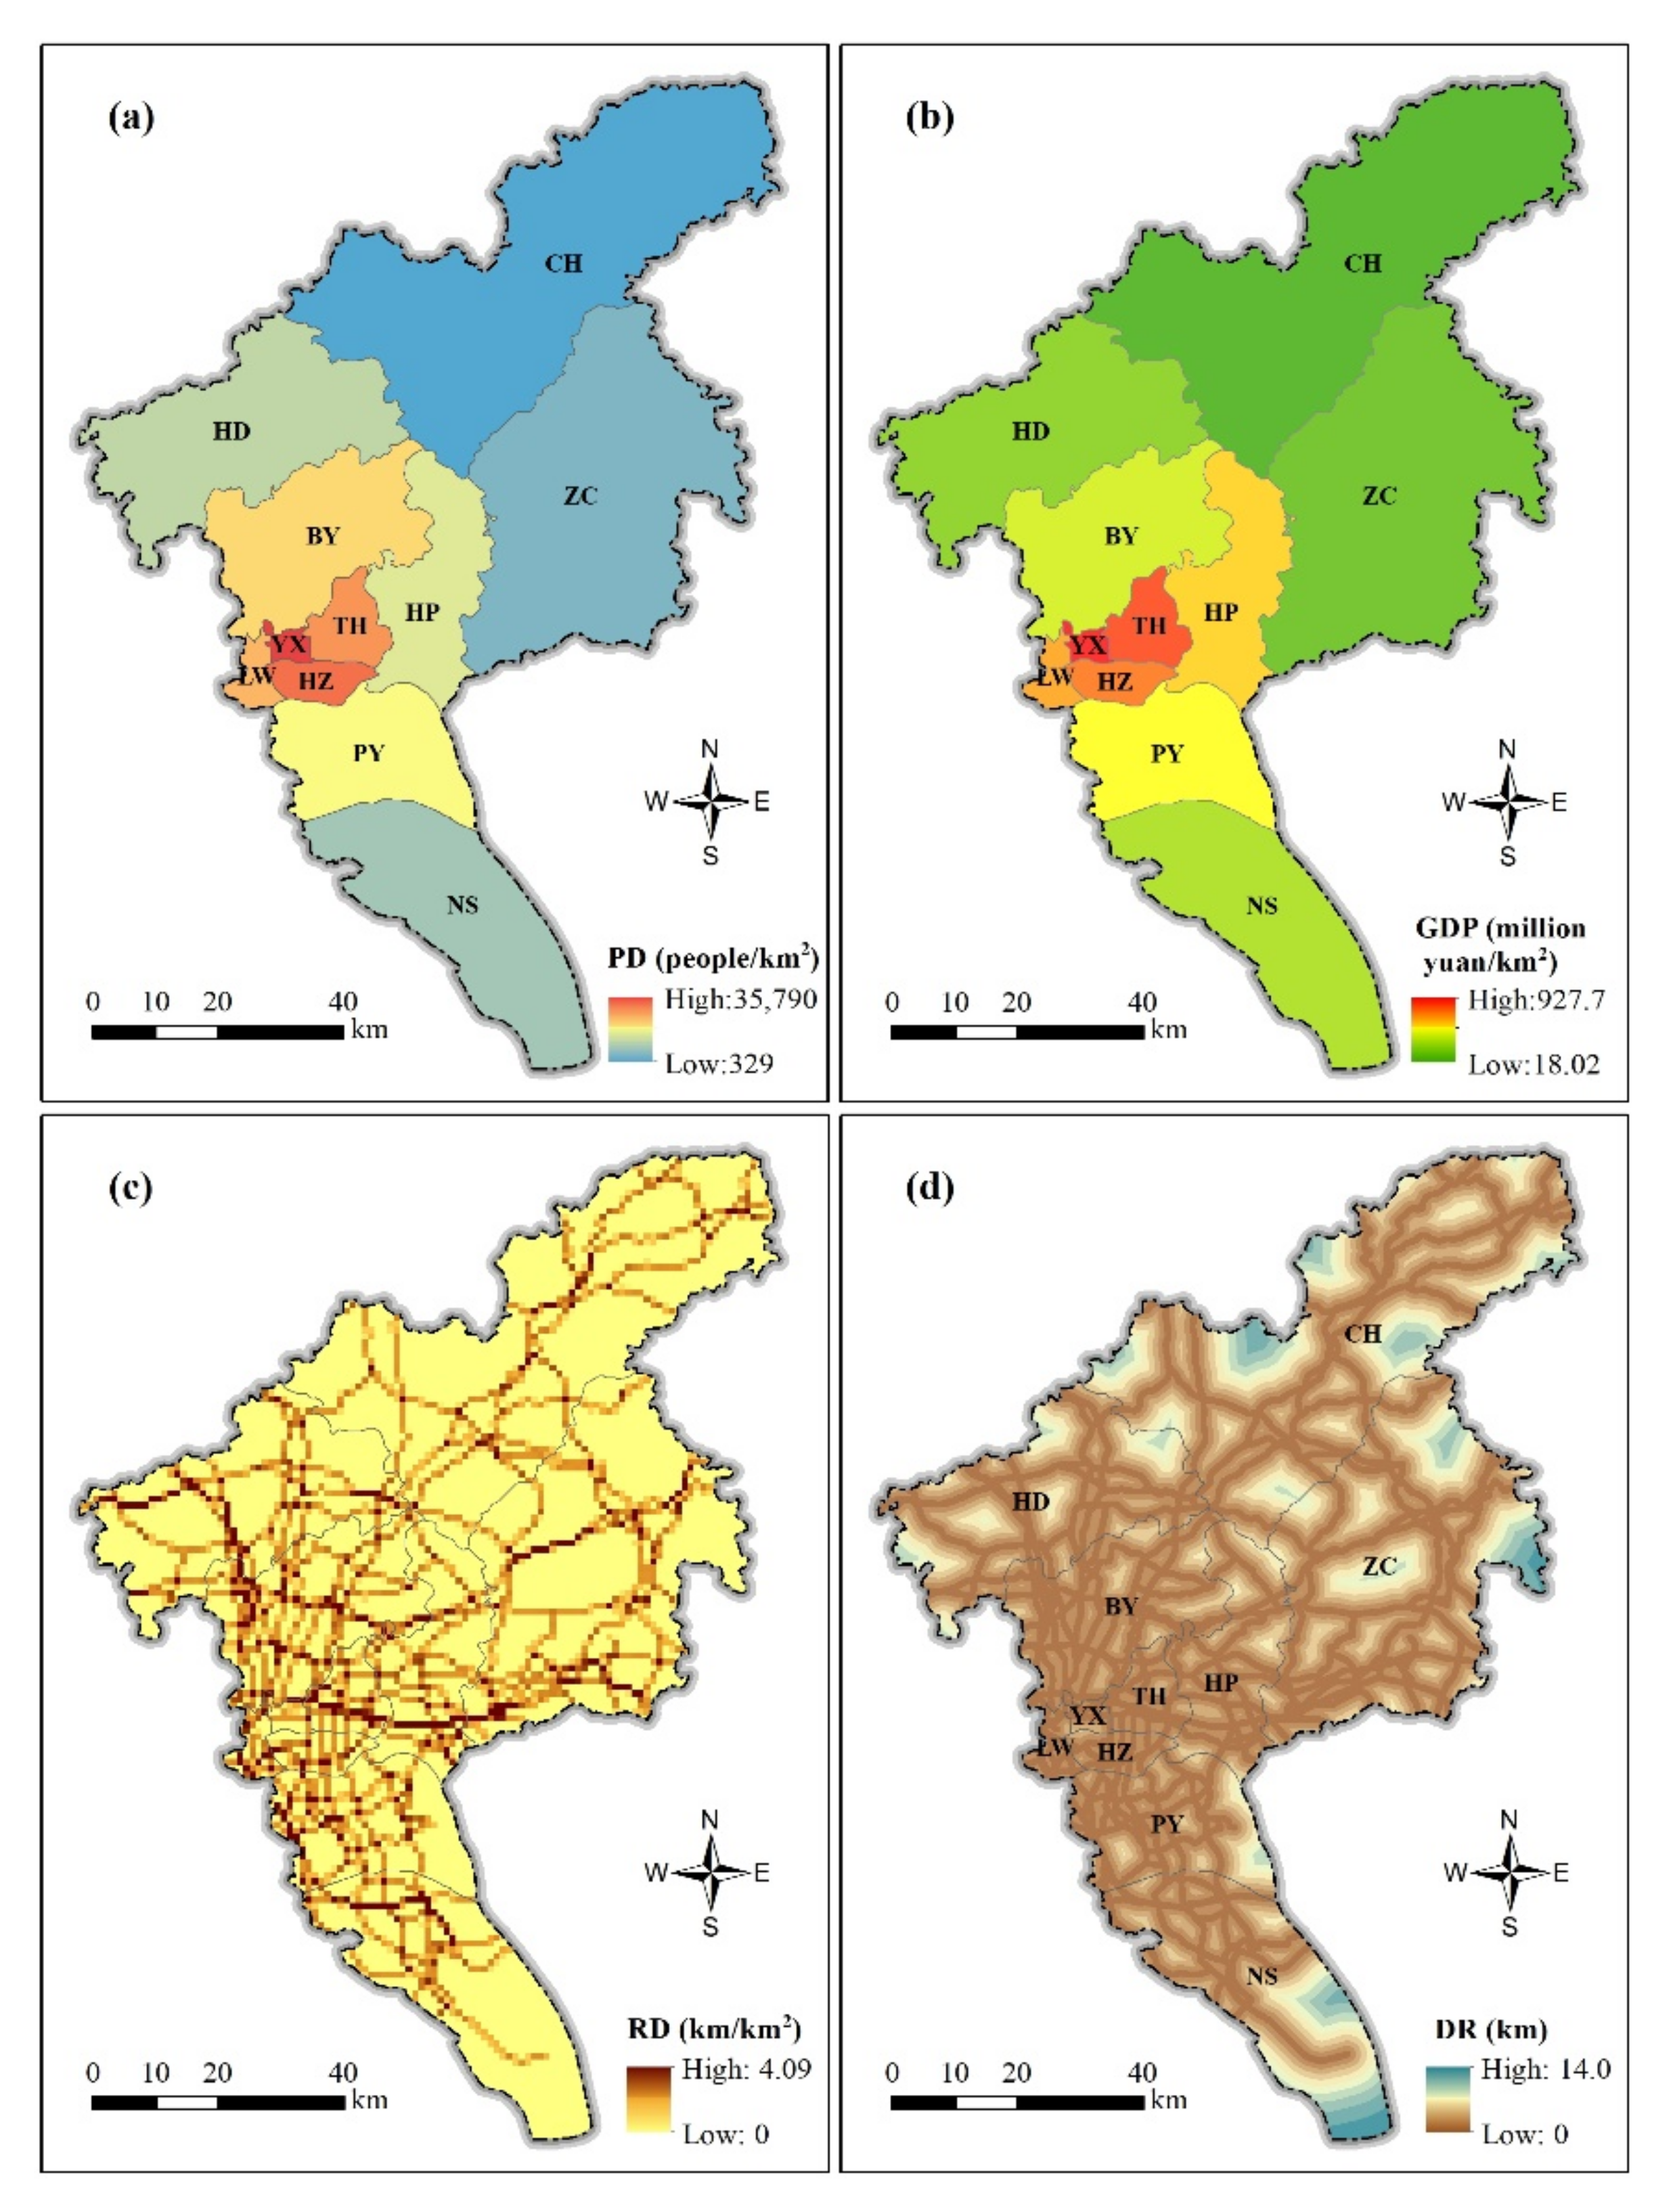
The population and gross domestic product (GDP) data were derived from the Guangzhou Statistical Yearbook (2020). Figure 9a,b demonstrate the spatial distribution of the permanent population density (V3) and GDP density (V4). The road network data were obtained from the basic geographic data of the National Geomatics Center of China at a scale of 1:250,000 (2017 version). As shown in Figure 9c, we calculated the length of the roads using a 1 × 1 km fishnet and eventually created the road network density layer (V5). The distances to the road network (V6) shown in Figure 9d were generated using proximity analysis in ArcGIS [31].
2.4. Improved Trapezoidal Fuzzy AHP
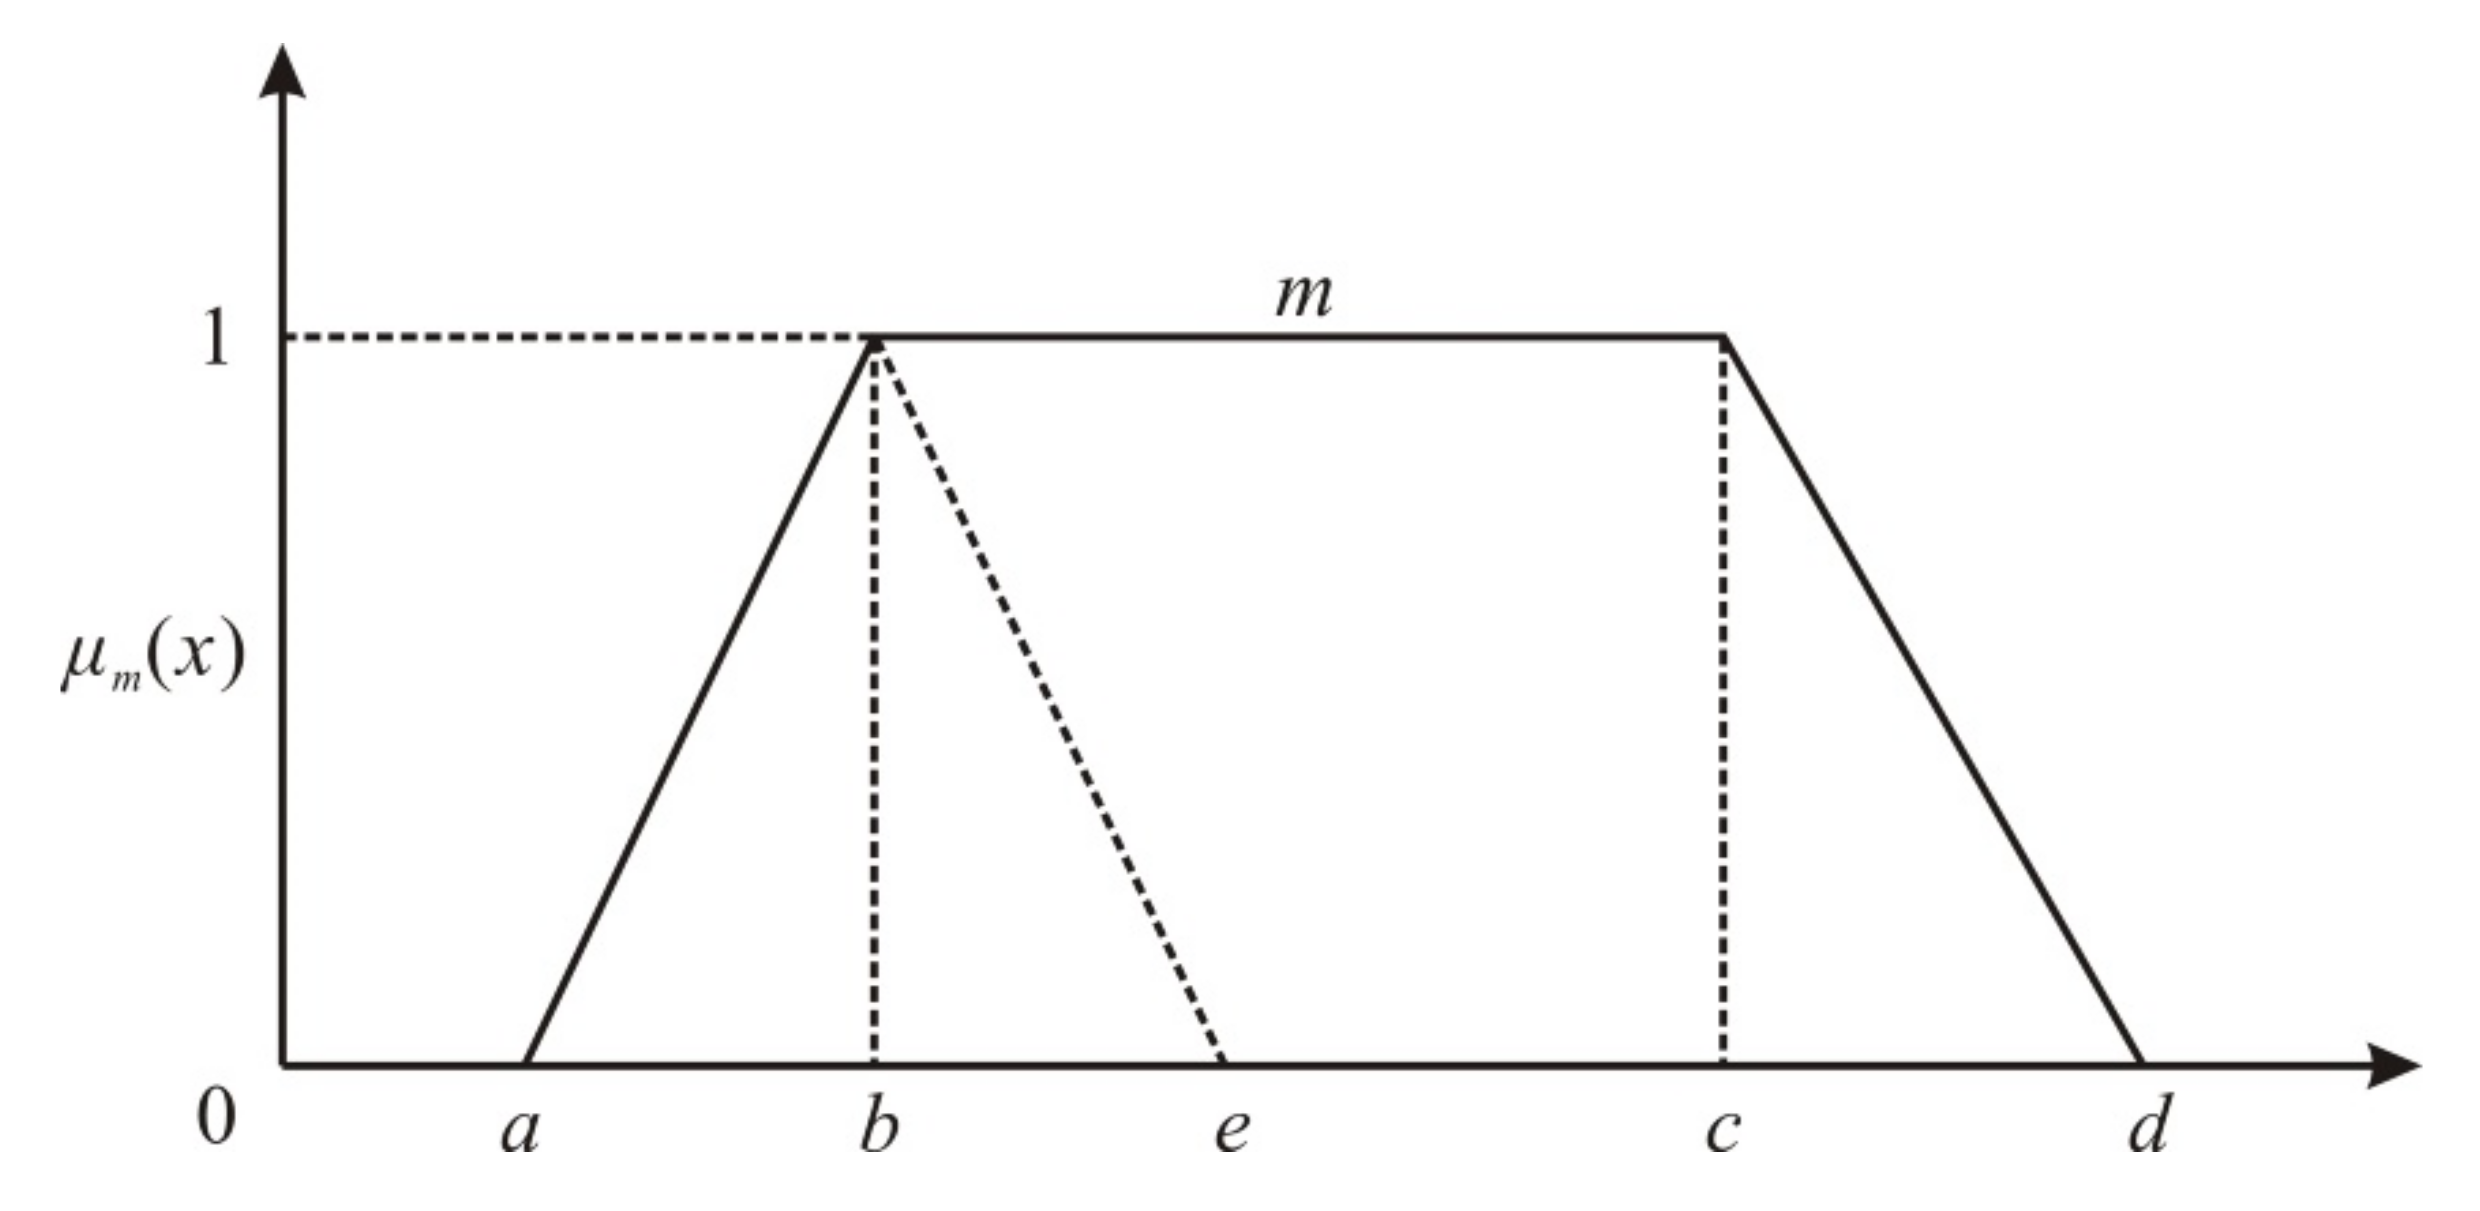
Fuzzy set theory is a generalization of classical set theory, which provides a powerful tool for dealing with uncertainty in a decision-making system [23]. This paper used trapezoidal fuzzy numbers to collect expert opinions and construct indicators’ judgment matrix [27]. The trapezoidal fuzzy number can be defined as m = (a, b, c, d), and its membership function μm is expressed as follows:
where a and b are the lower and upper limits of m, and b and c are the interval variables of m. As shown in Figure 10, the crisp values, interval numbers, and triangular fuzzy numbers are special cases of trapezoidal fuzzy numbers [39]. Therefore, the trapezoidal fuzzy numbers feature more extensive adaptability in decision-making for complex problems.
2.4.1. New Questionnaire and Judgment Matrix Building Method
The collection of valuable expert opinions is a key step in the AHP approach. However, two significant drawbacks in the traditional AHP questionnaire (complexity of pairwise comparisons and judgment matrix inconsistency) hamper the availability of accurate risk assessment results. Based on this, we designed a new questionnaire to enable researchers to collect experts’ opinions and construct a consistent judgment matrix effectively (Table A2). Significantly different from the traditional AHP (Table A3), the numbers 1–9 in the new questionnaire are defined as an indicator’s direct contribution or importance to the risk results of this criterion. The new questionnaire asks experts to score indicators within the criterion using numbers 1–9 instead of providing the relative importance between any two indicators. In addition, the fine increments in the scoring system enable experts to capture subtle changes in an indicator’s contribution to flood risk.
The new questionnaire needs to abide by two fundamental rules. First, experts are required to use whole numbers in the range of 1–9 when scoring the indicators. Second, it is suggested that each expert assign different scores to different indicators in the same criterion. The latter is to distinguish the different importance levels between indicators adequately. If an expert assigns the same score to two or even more indicators in a criterion, researchers need to make appropriate adjustments based on the scoring of other experts, except, of course, for special cases in which all the indicators in the criteria are equally important. Therefore, if the number of indicators in the criterion is less than 10, experts are encouraged to assign different scores to different indicators; if there are less than 19, experts can award the same score to both indicators, and so on.
We extended the new questionnaire to the trapezoidal fuzzy AHP. Next, fuzzy judgment matrices were established according to the collected questionnaires and trapezoidal fuzzy linguistic variables (Table A4). Due to the differences in risk perception, a threshold exists for multiple experts to score the importance of the same indicator. As shown in Table A5, the scores for H1 (rainstorm intensity, daily precipitation ≥ 100 mm) and H3 (waterlogging points) are 7–9 and 4–7, respectively. Based on this, the relative importance of H1 to H2 can be calculated by the interval numbers, i.e., . Furthermore, it should be noted that the number of votes for each score in the questionnaire also affects the weight calculation. Taking the scoring threshold for indicator H1 (7–9) as an example, 17 experts (70.83%) in the questionnaire scored 9, and only two experts (8.33%) scored 7.
To adequately account for the majority of the experts’ ratings (as this may be more reasonable), we proposed the synthetic importance index of indicators, which is expressed in Equation (4):
where SI represents the indicator’s synthetic importance index; x indicates all scores appearing in the rating interval for an indicator and is integers belonging to 1–9; and rx refers to the ratio of the number of expert votes at score x to the number of valid votes. Next, we defined the relative importance of the indicator Ii to Ij using Equation (5).
where RIij′ indicates the relative importance of indicator Ii to Ij. We constructed the judgment matrix by selecting the trapezoidal fuzzy number based on the value of RIij′. If RIij′ is a fraction, then the trapezoidal fuzzy number adjacent to the left and right of RIij′ was chosen. SI is the synthetic importance indices derived from Equation (4).
2.4.2. Steps of Improved Trapezoidal Fuzzy AHP
Based on the new questionnaire and judgment matrix building method proposed in this paper, the steps of the improved trapezoidal fuzzy AHP are as follows.
Step 1: The relative importance of the indicators is calculated based on the expert questionnaire results (Table A5) using Equations (4) and (5). Next, the trapezoidal fuzzy judgment matrix (Fij)n×n (Equation (6)) is established by replacing the RIij′ values using the trapezoidal fuzzy linguistic variables in Table A4:
Step 2: The trapezoidal fuzzy matrix is converted into a concise matrix using the center of gravity method proposed by Delgado et al. [40]. Subsequently, the consistency ratio is used to test the concise matrix’s consistency. It can be expressed by Equations (7) and (8) [17,27]:
where CR is the consistency ratio. The trapezoidal judgment matrix is consistent if CR of the concise matrix is less than 0.1. The values CI and RI indicate the consistency index and average random consistency index, respectively. λmax is the maximum eigenvalue of the concise judgment matrix. n is the number of evaluation indicators.
Step 3: According to the trapezoidal fuzzy judgment matrix, the fuzzy weight vector of the indicators is calculated using Equations (9)–(11):
where
The values aij, bij, cij, and dij are the fuzzy judgment matrix elements.
Step 4: The fuzzy weight vectors of the indicators are defuzzified using Equation (12) and then normalized by Equation (13) [40]:
Finally, the weights of the indicators W = (w1, w2, …, wi).
2.4.3. Application
In this study, 38 questionnaires were distributed and 33 questionnaires were successfully returned, of which 24 were valid and 9 were invalid. The objects of the questionnaire distribution included professors, engineering geology experts, designers, engineers, construction workers, and emergency managers. We use the hazard criterion layer as an example to elucidate the weight calculation process of the improved trapezoidal fuzzy AHP. According to Table A5, the trapezoidal fuzzy judgment matrix of the hazard indicators was built (Equation (14)):
The relative importance between the indicators was calculated using Equations (4)–(6). The trapezoidal fuzzy numbers from Table A4 were employed to replace the relative importance values (Equation (15)):
Subsequently, we converted the Fhazard into a concise matrix using the center of gravity method [40]. The consistency ratio of the concise matrix was 0.0347 < 0.1. The fuzzy weight vectors of the hazard indicators were calculated using Equations (9)–(11). Ultimately, we defuzzified the fuzzy weight vectors employing Equations (12) and (13) and obtained the hazard indicators’ weights. Similarly, the weights of the exposure and vulnerability indicators were calculated using the same process (Table 2). We also calculated the weights of the indicators using the traditional trapezoidal fuzzy AHP method.
3. Results
3.1. Regional Flood Risk Level of Guangzhou
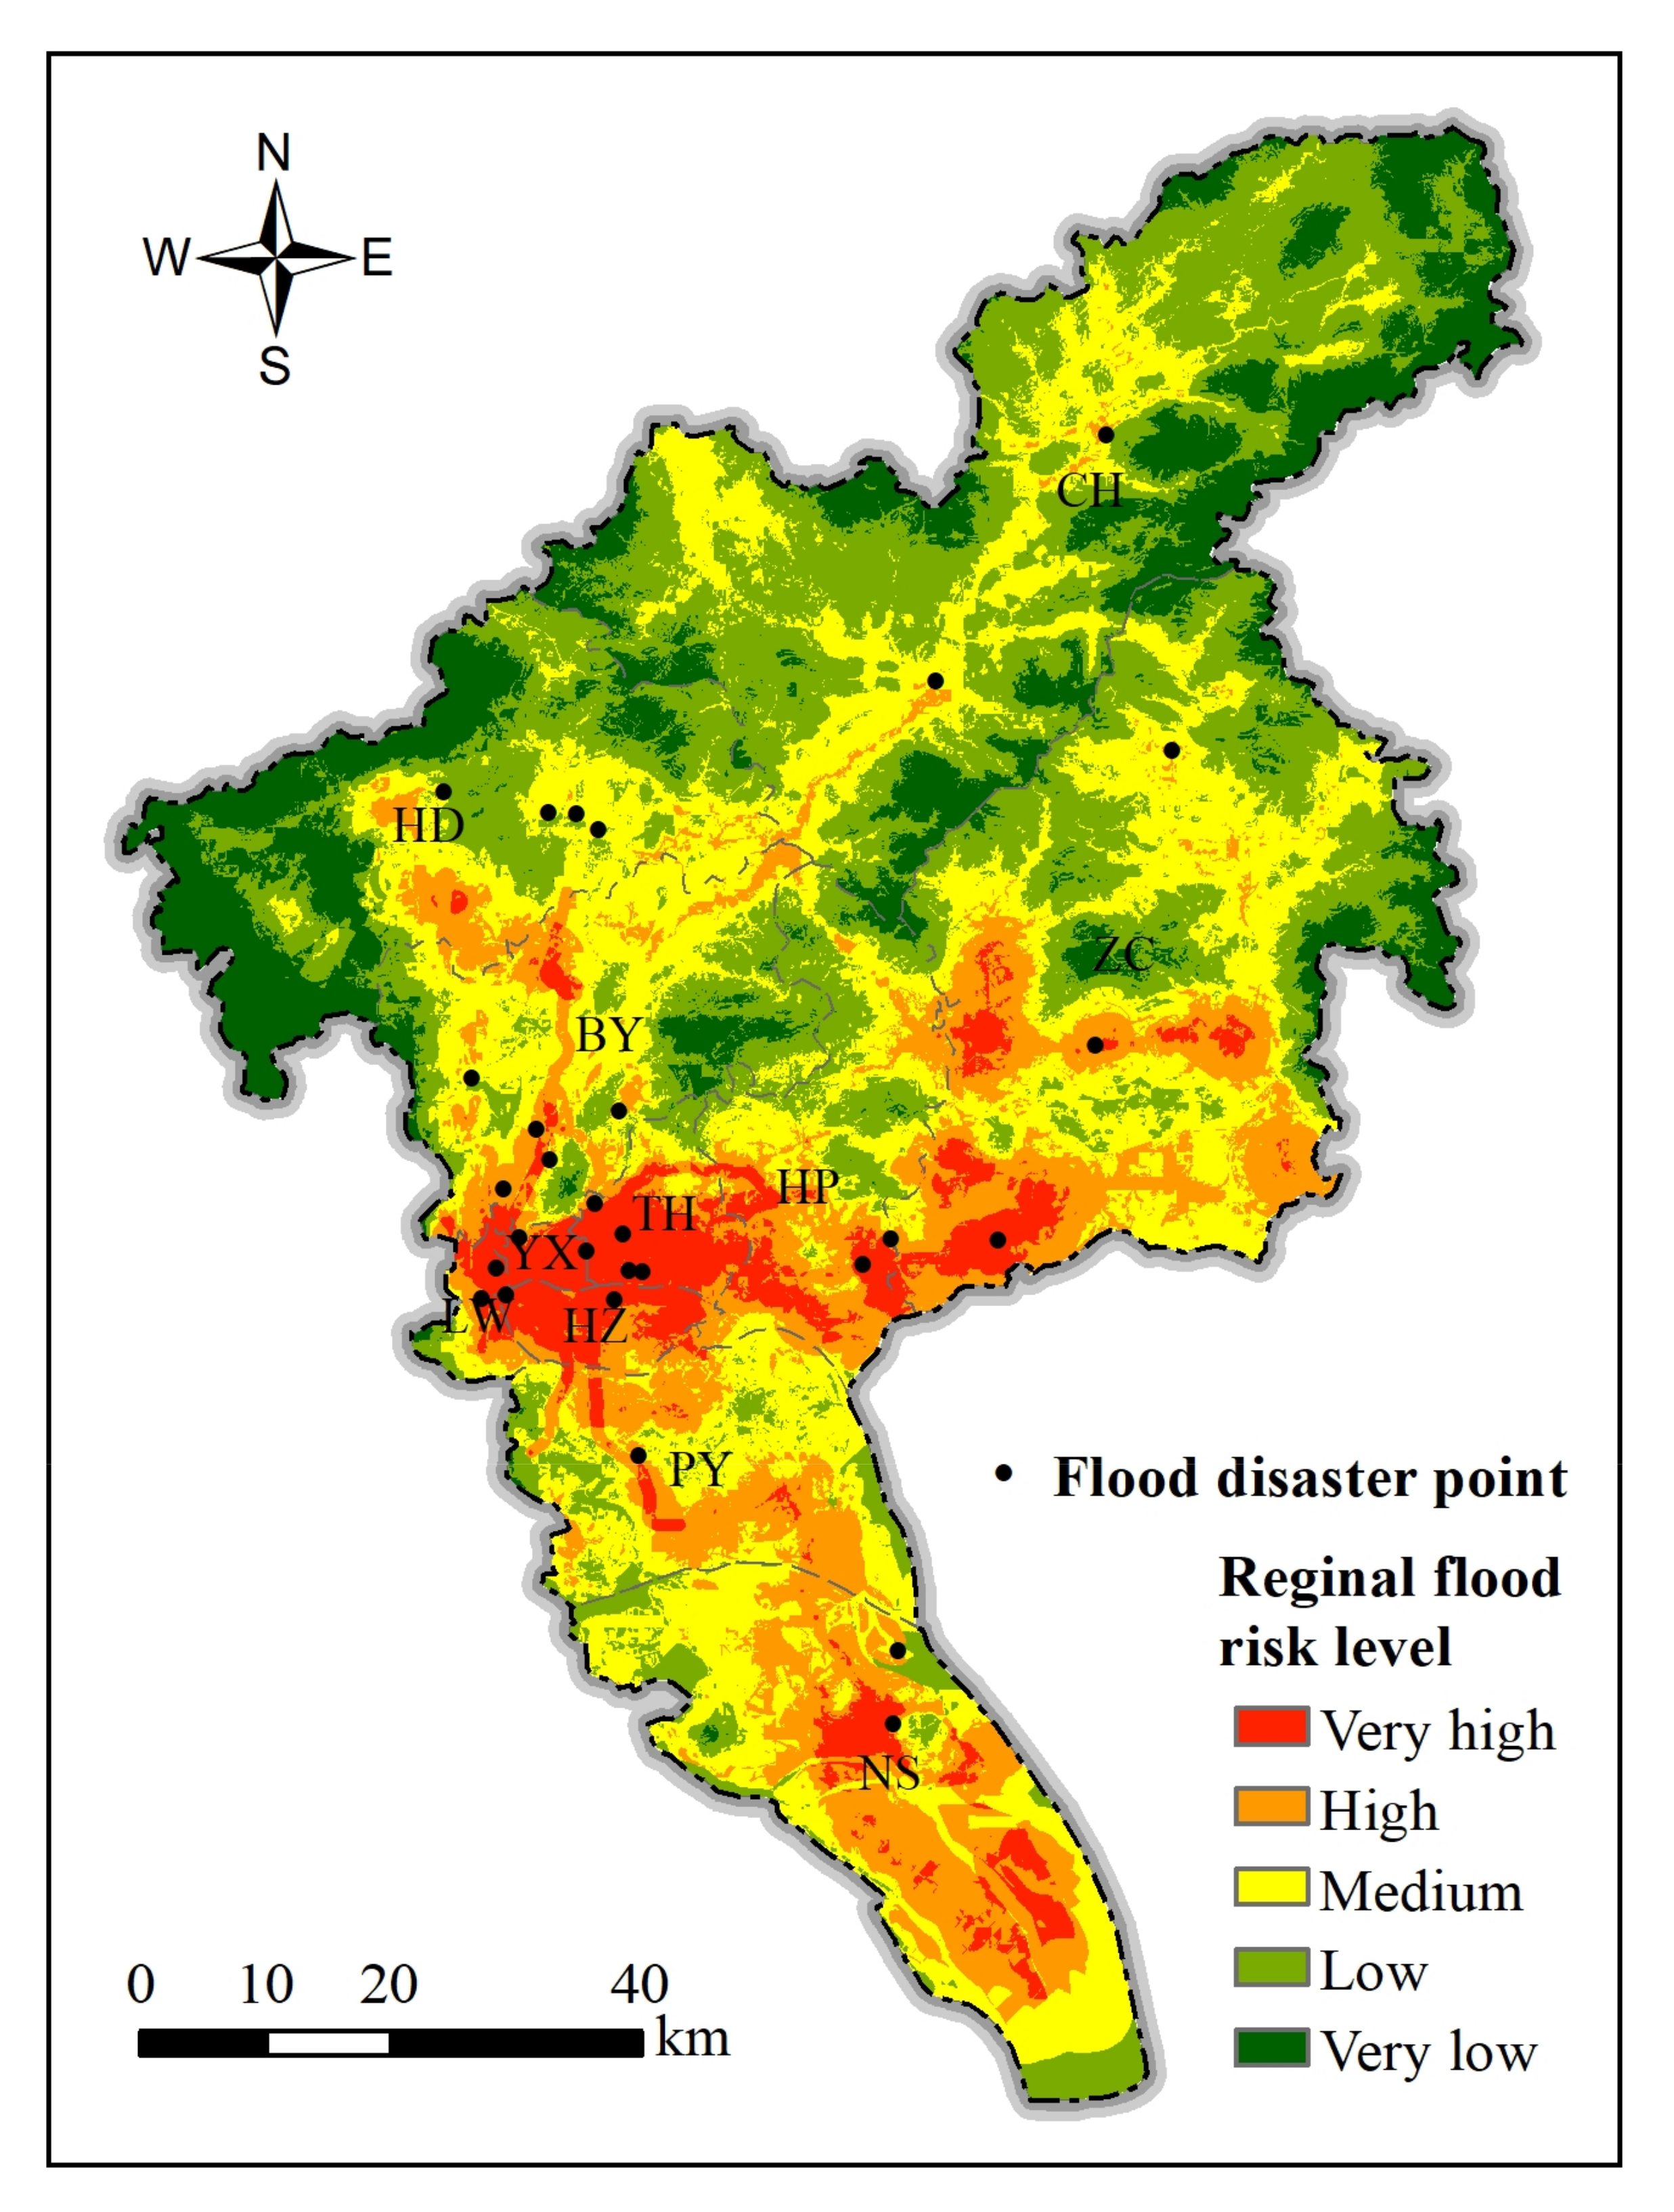
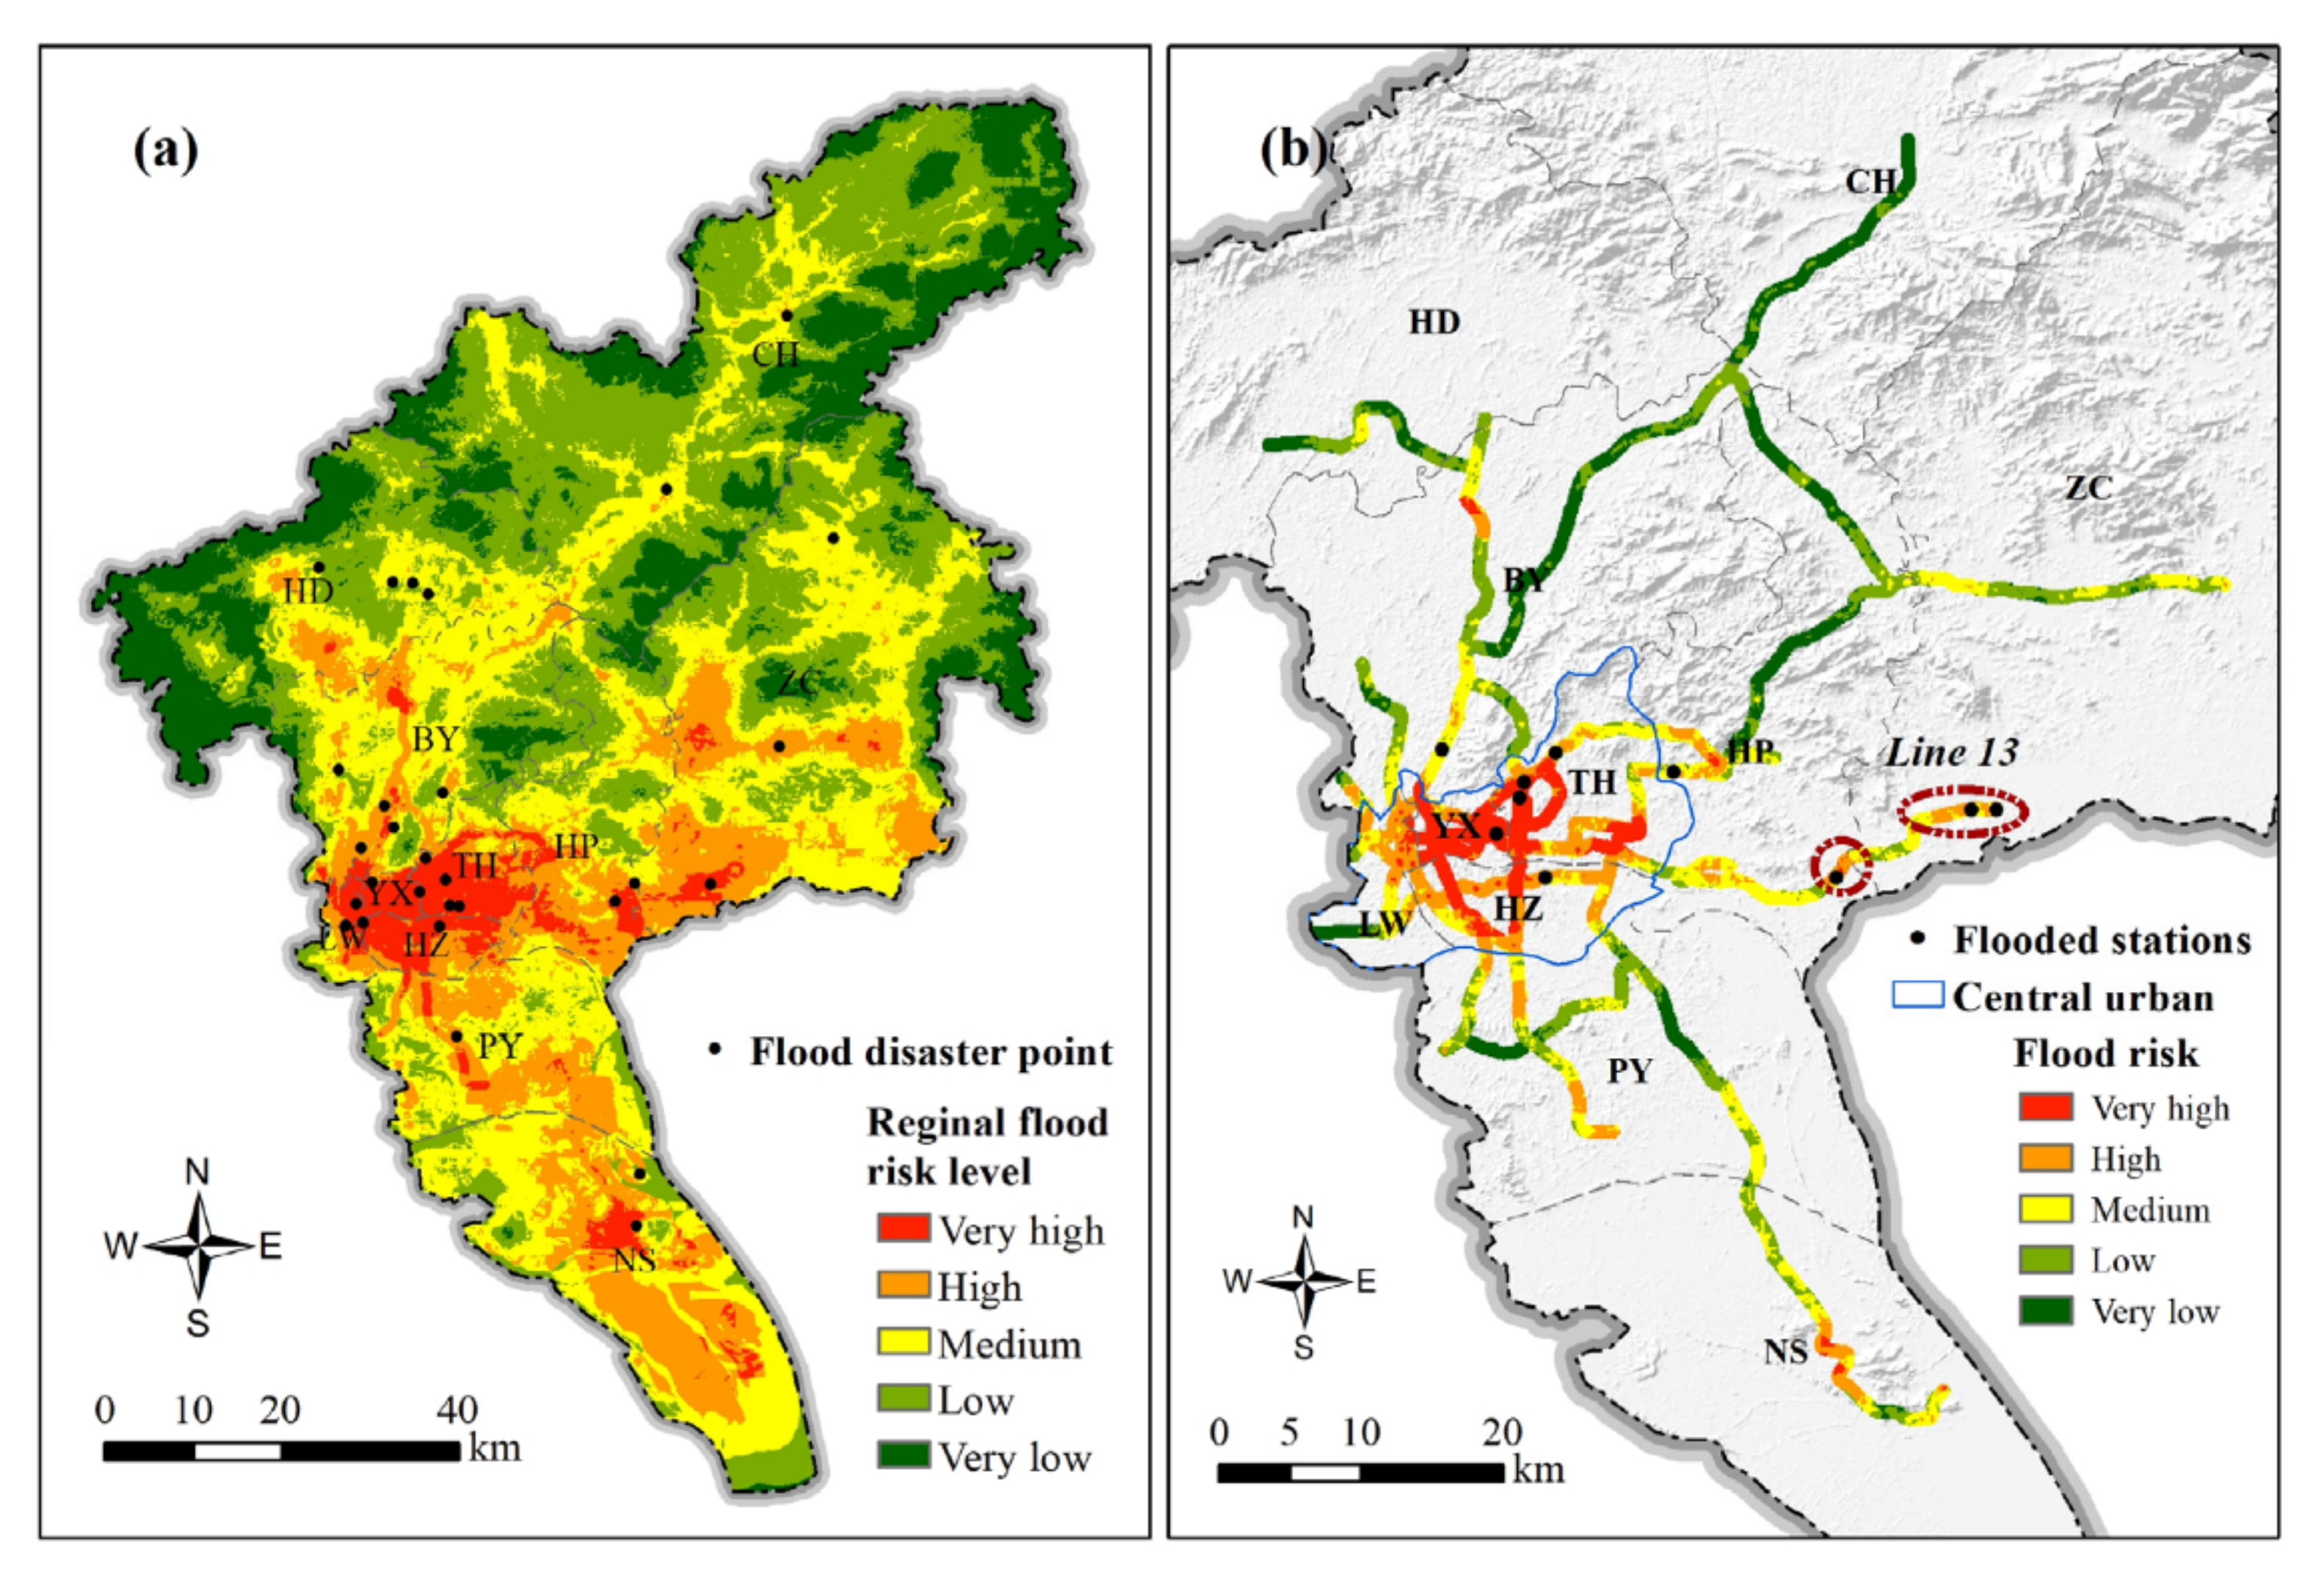
The regional flood risk level was eventually generated based on the normalized indicators indices and weights obtained using the improved trapezoidal fuzzy AHP. Figure 11 shows the overall spatial pattern of the regional flood risk level in Guangzhou: a high level in the south and a low level in the north. Specifically, the very high and high risk levels were mainly located in the central urban areas (Yuexiu, Liwan, Tianhe, and Haizhu), the center and south of Zengcheng, the south of Huangpu, and the central part of Nansha. With the exception of these areas, the spatial distribution of the very high and high risk levels in other districts was affected by the road network and presented ribbon features, such as in Baiyun, Huadu, Conghua, and Panyu. The medium risk was distributed around the very high and high risk areas and featured the most extensive area. The very low and low risk areas were mainly situated in the mountainous areas of Huadu, Conghua, Zengcheng, and Baiyun, of which Conghua featured the maximum area.
Forty surveyed historical flood disaster points were employed for the validation of the regional flood risk map. We spent 14 days investigating these disaster sites and checked the locations using high-precision GPS. These disaster points included human casualties, building collapses, flooded communities, and submerged infrastructure. The collected flood point data were then overlain with the risk assessment results in ArcGIS for analysis [36]. By comparison, 36 (90%) of the 40 surveyed flood sites matched the assessment results’ very high and high risk levels; the remaining four points were located in the medium risk zone. This comparison indicates that regional risk assessment results based on the improved trapezoidal fuzzy AHP are accurate. It also demonstrates that the indicator system we selected is reasonable.
3.2. Flood Risk Level of the Guangzhou Metro System
3.2.1. Overall Spatial Pattern of Flood Risk
Flooding in metro stations and tunnels is mainly due to the encroachment of surface flooding in the vicinity of metro lines. Accordingly, we determined a 500 m buffer range around the metro line to represent the metro system’s flood risk. The flood risk level of the metro system was extracted from the regional risk level map of Guangzhou. In addition, the Jenks optimization method was used to categorize the flood risk levels of the metro system [41,42]. This method is a data clustering approach that reduces intra-class variances and maximizes inter-class variances according to data attributes. To meet the need for flood prevention and mitigation, we finally classified the flood risk of the Guangzhou metro system into five levels: very high, high, medium, low, and very low.
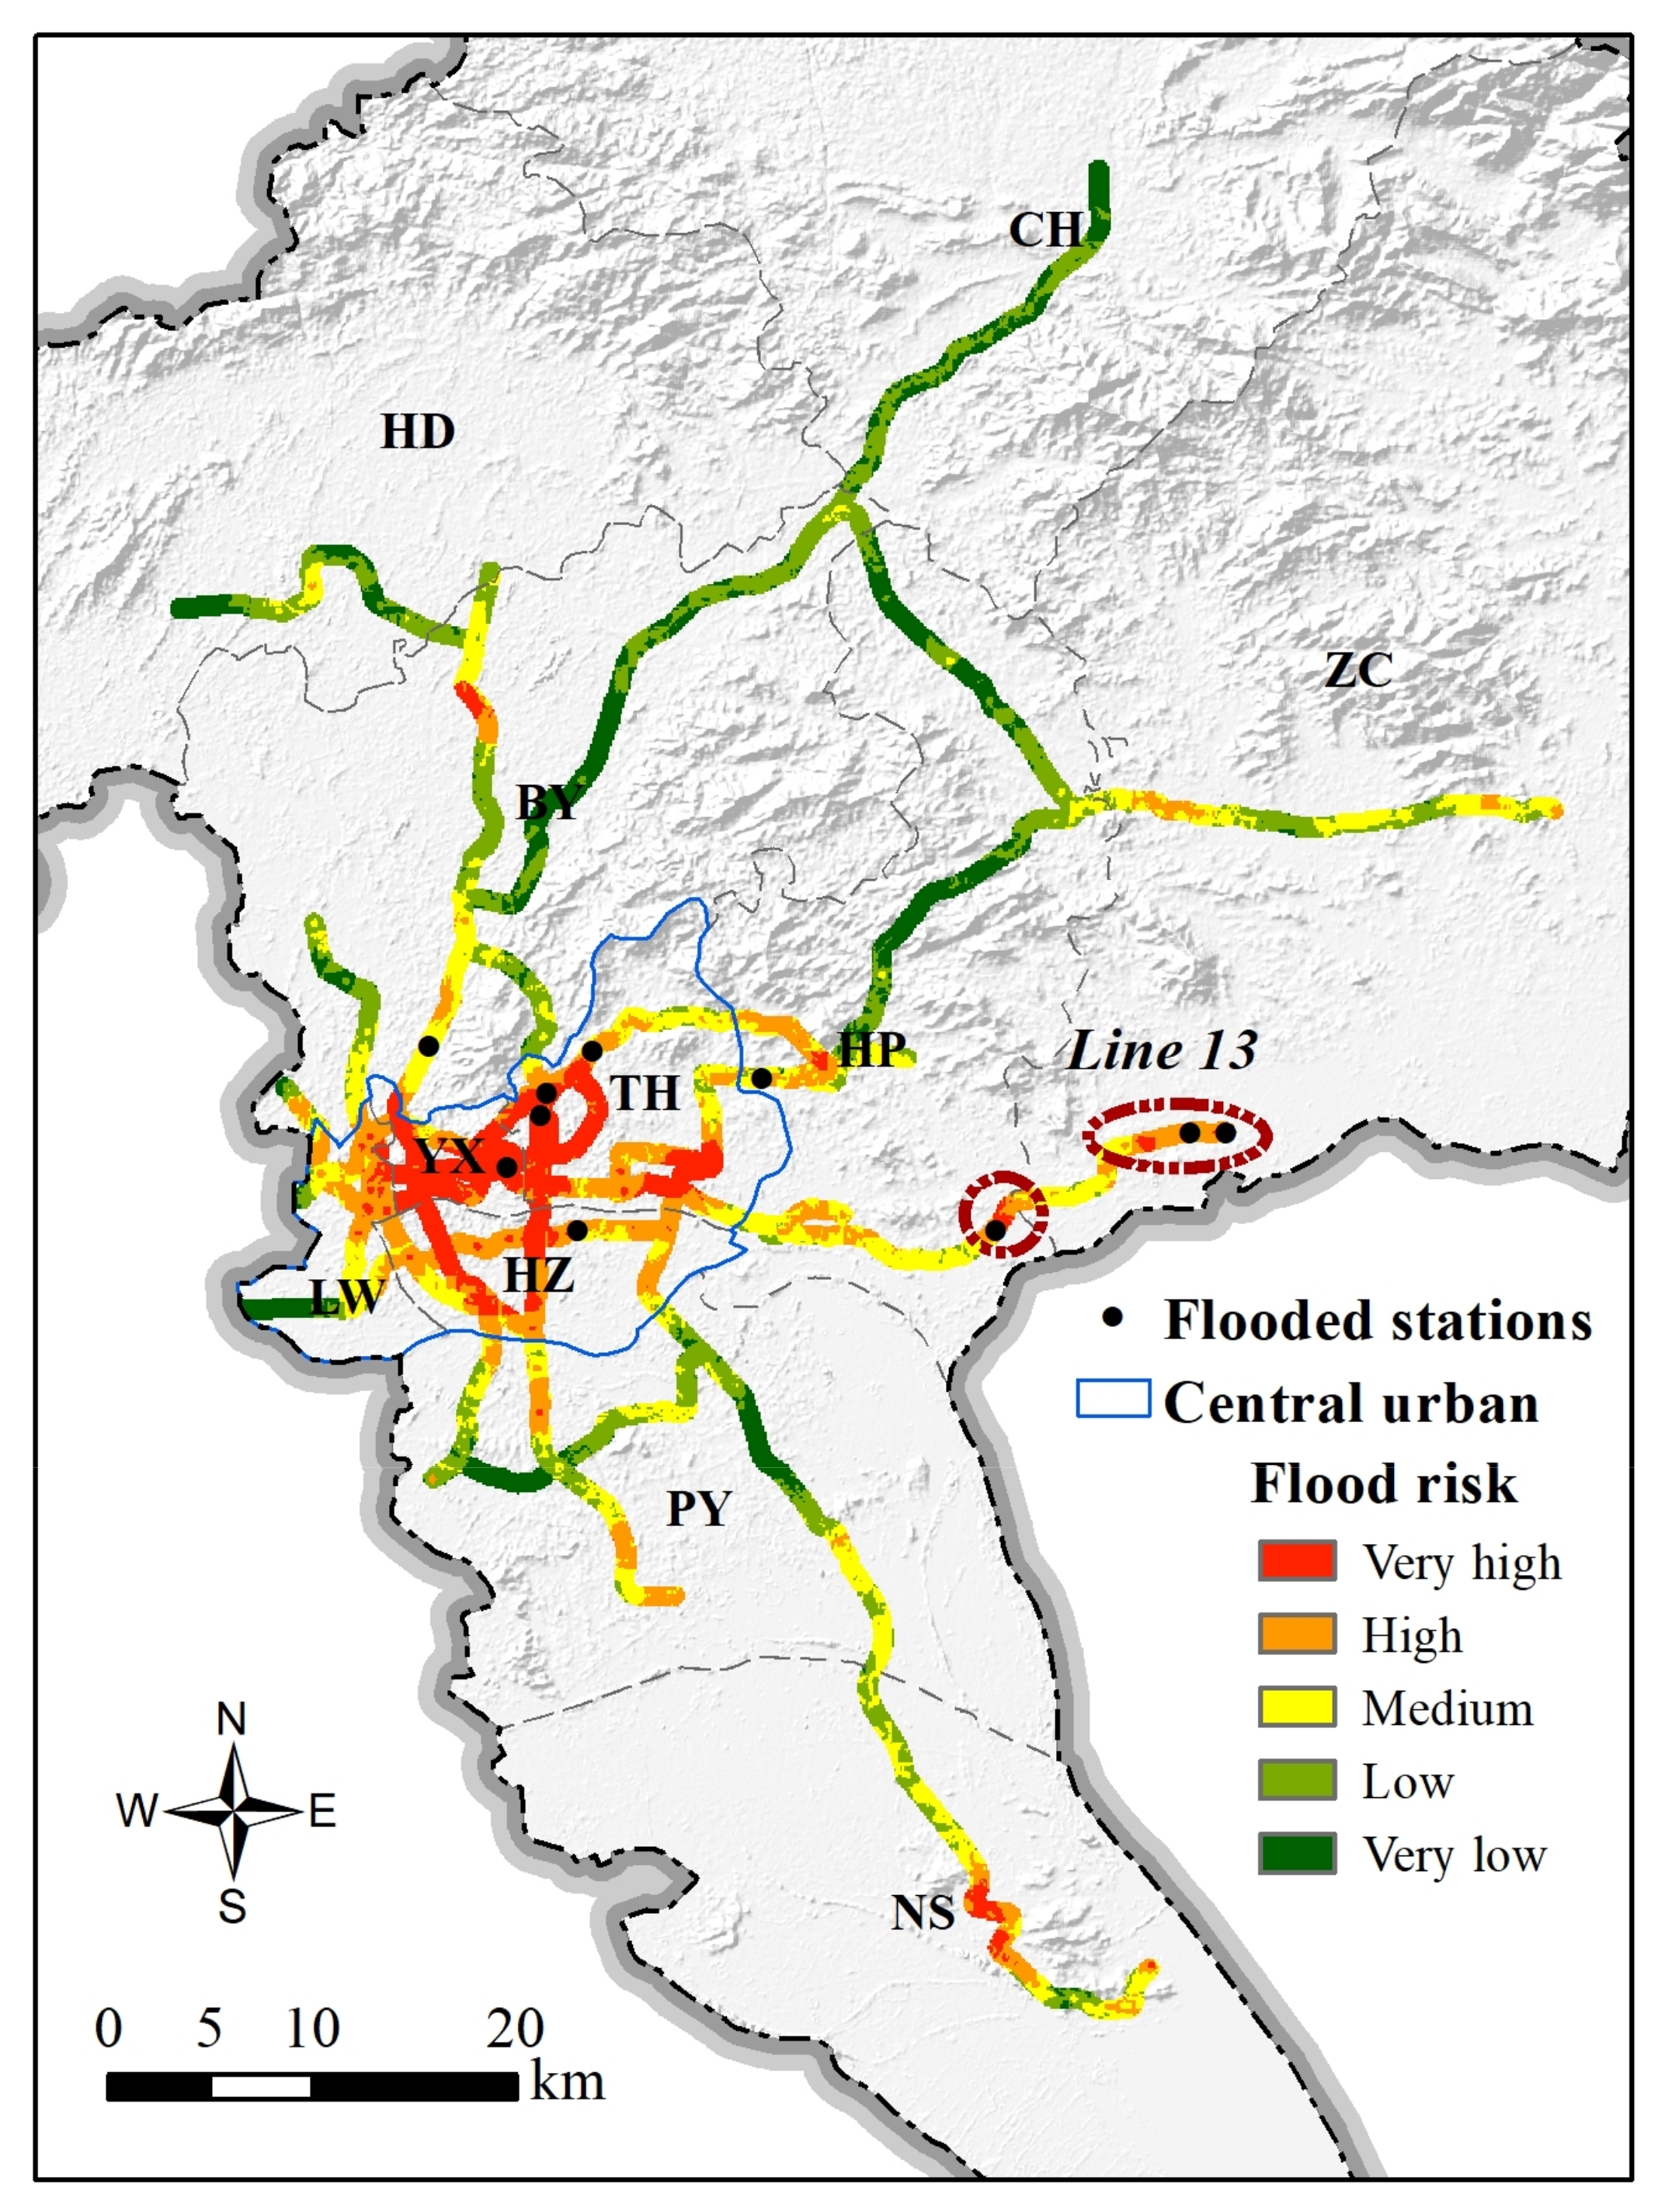
As shown in Figure 12, the flood risk level of the Guangzhou metro system shows a distribution pattern of high in the middle and low in the north and south. The very high risk level was mainly concentrated in central urban areas (Yuexiu, Liwan, Tianhe, Haizhu), which covered 54.47 km2, accounting for 88.66% of the Guangzhou metro system’s total very-high-risk zones (61.44 km2). The other districts demonstrated a spotty distribution pattern of very high risk levels, with an area of 6.97 km2, occupying only 11.34% of the total area of very high risk in the Guangzhou metro system. There were no very high risk zones distributed in Huadu and Conghua. The high risk zone in the central urban area was 51.96 km2, comprising 55.80% of the total high-risk area of the Guangzhou metro. The high-risk levels in the other districts exhibited a patchy distribution pattern with an area of 41.16 km2 (44.20% of the total high-risk zone). It should be emphasized that 74.11% of the central urban area (106.43 km2) is at very high and high risk, which constitutes 68.86% of the total very high and high risk area (154.56 km2) in the Guangzhou metro system. Hence, there is a high potential flood threat in the central urban area of Guangzhou.
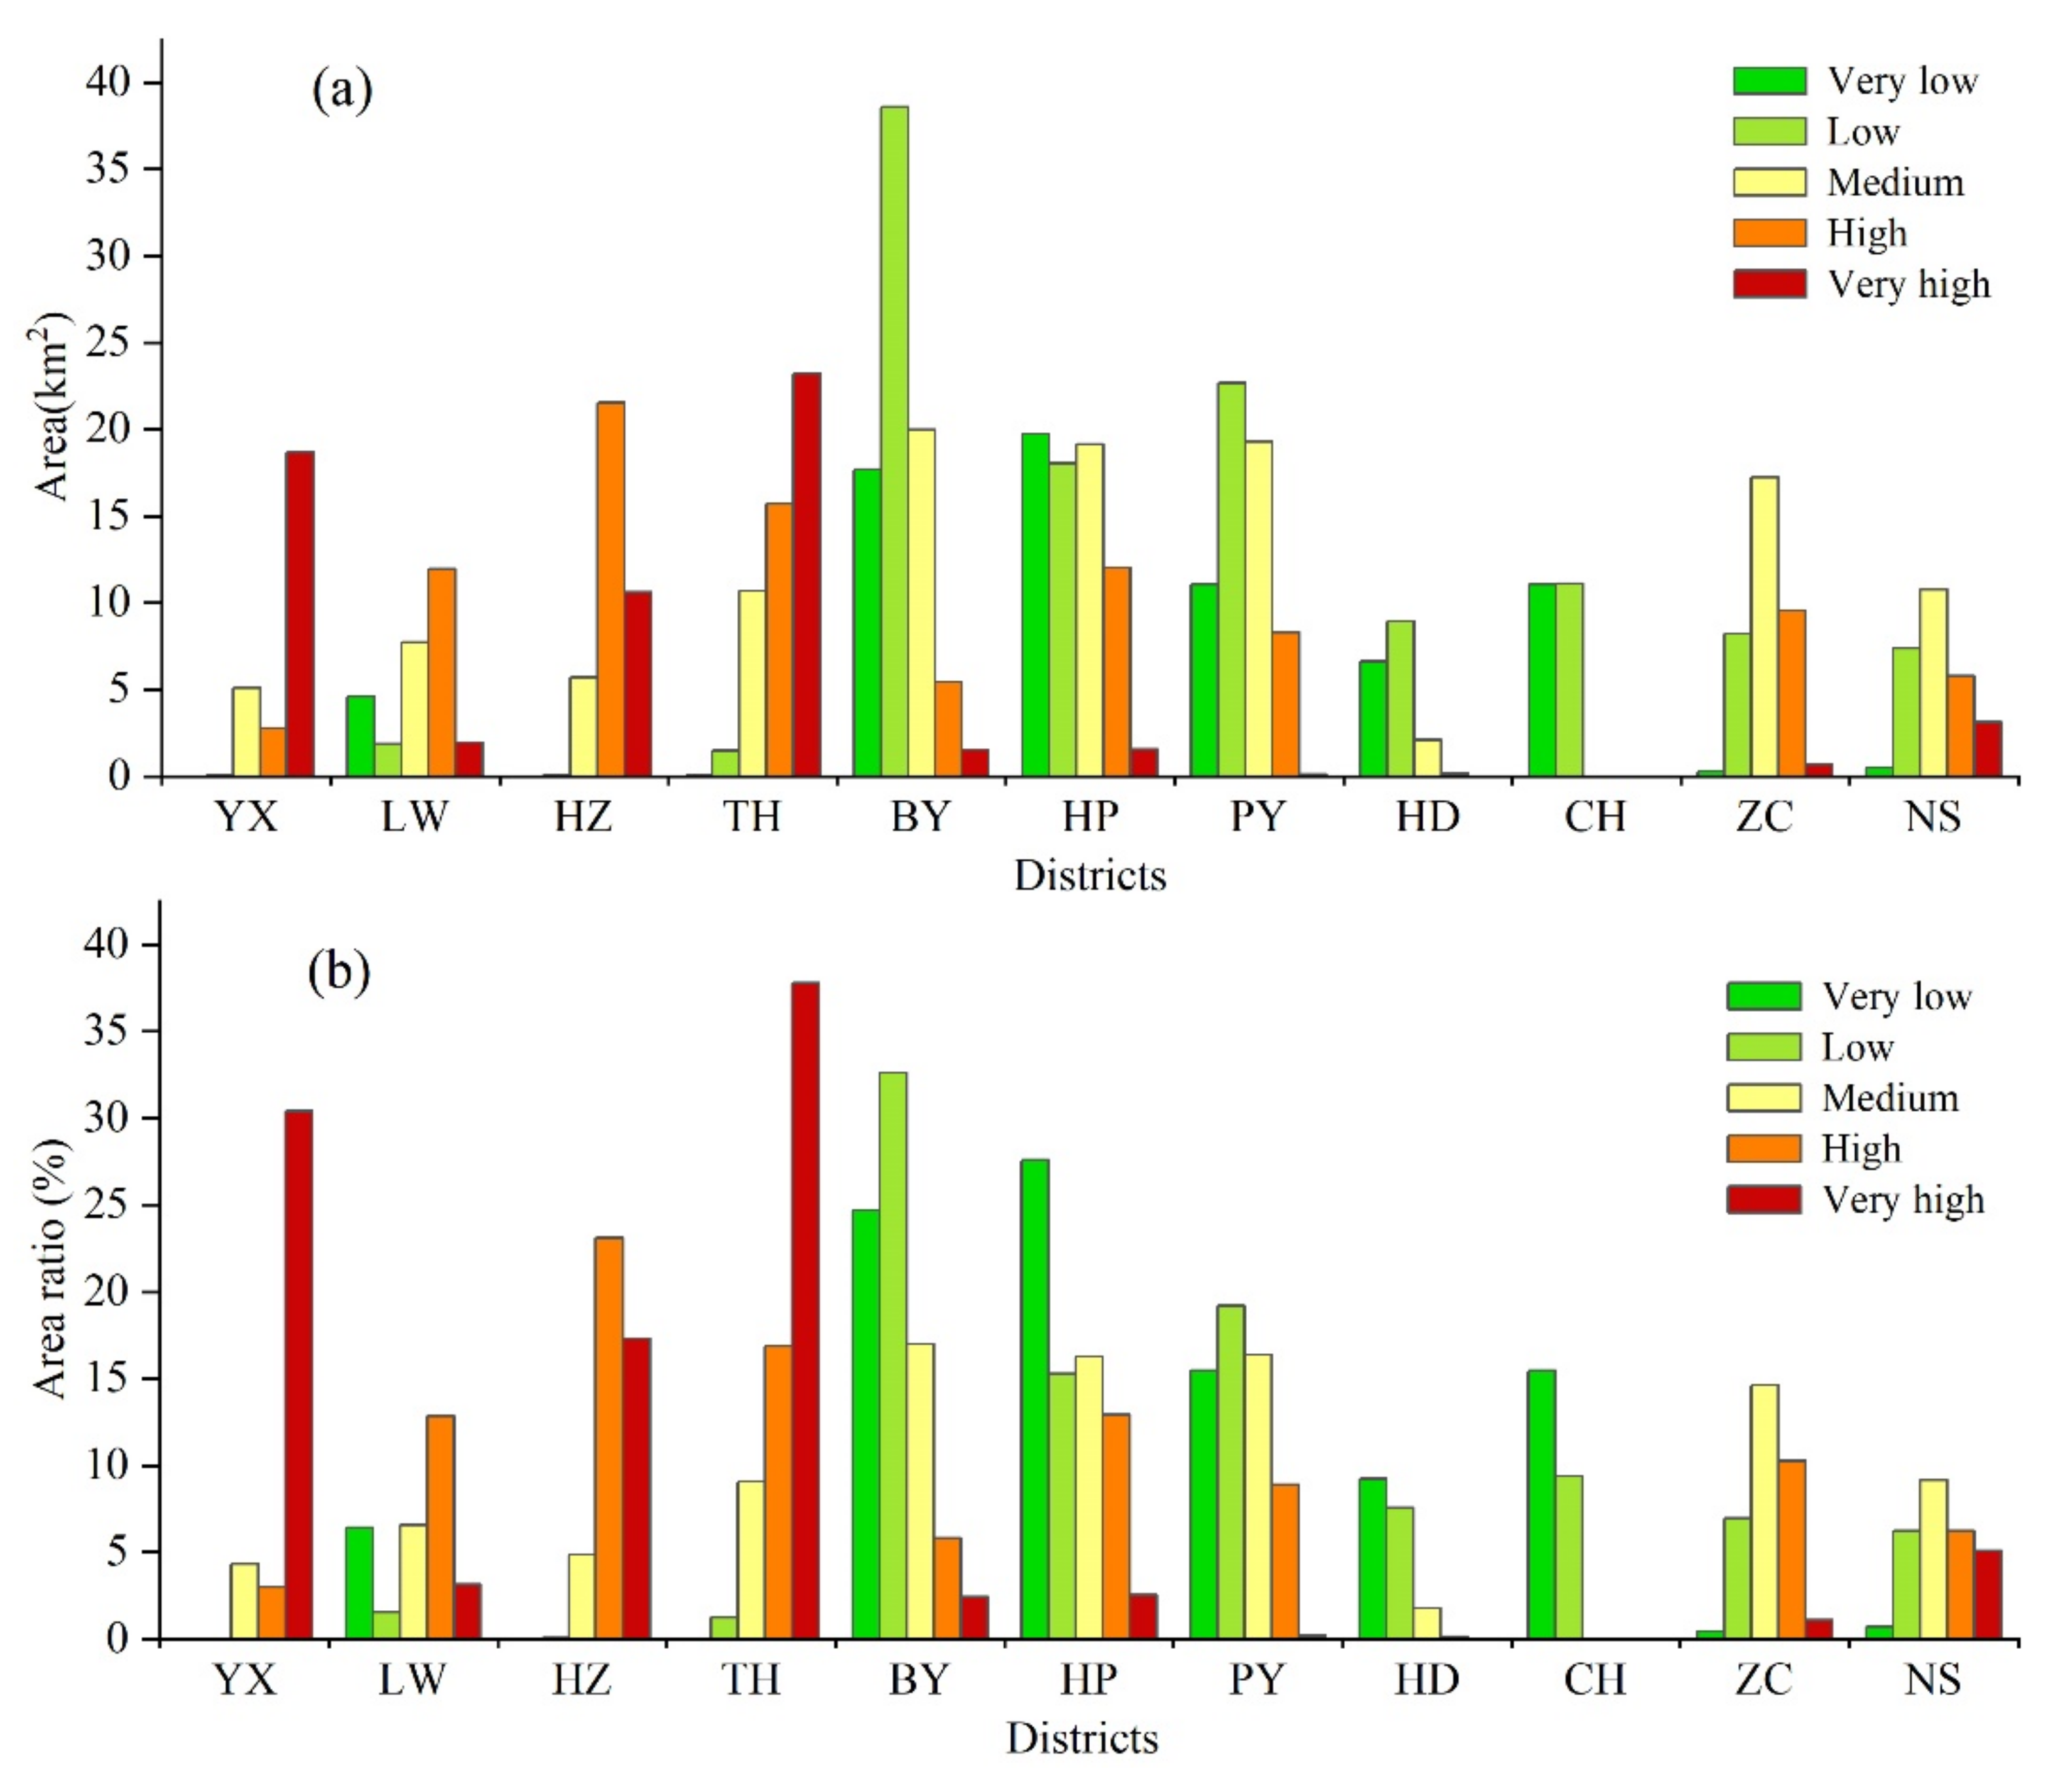
The medium risk was widely distributed in all Guangzhou’s districts, except for Conghua. Four districts, Baiyun, Huangpu, Panyu, and Zengcheng, accounted for 64.26% (75.60 km2) of the total medium-risk area in the Guangzhou metro system. The Very low and low risk distribution was concentrated in suburban districts, such as Baiyun, Huangpu, Panyu, Conghua, and Huadu. These five districts of very low and low risk covered 165.55 km2, making up 87.16% of the Guangzhou metro system’s total very low and low risk area. For clarity, we plotted the area distribution of different flood risk levels in each district of Guangzhou (Figure 13a). Furthermore, we calculated the proportional area of different risk levels in each district to the total area of the corresponding level in the Guangzhou metro system (Figure 13b). The overall flood risk pattern of the metro system is a critical reference for urban planning and the preparation of emergency plans, which is of great practical importance for flood mitigation in urban areas.
3.2.2. Flood Risk Level of Metro Lines
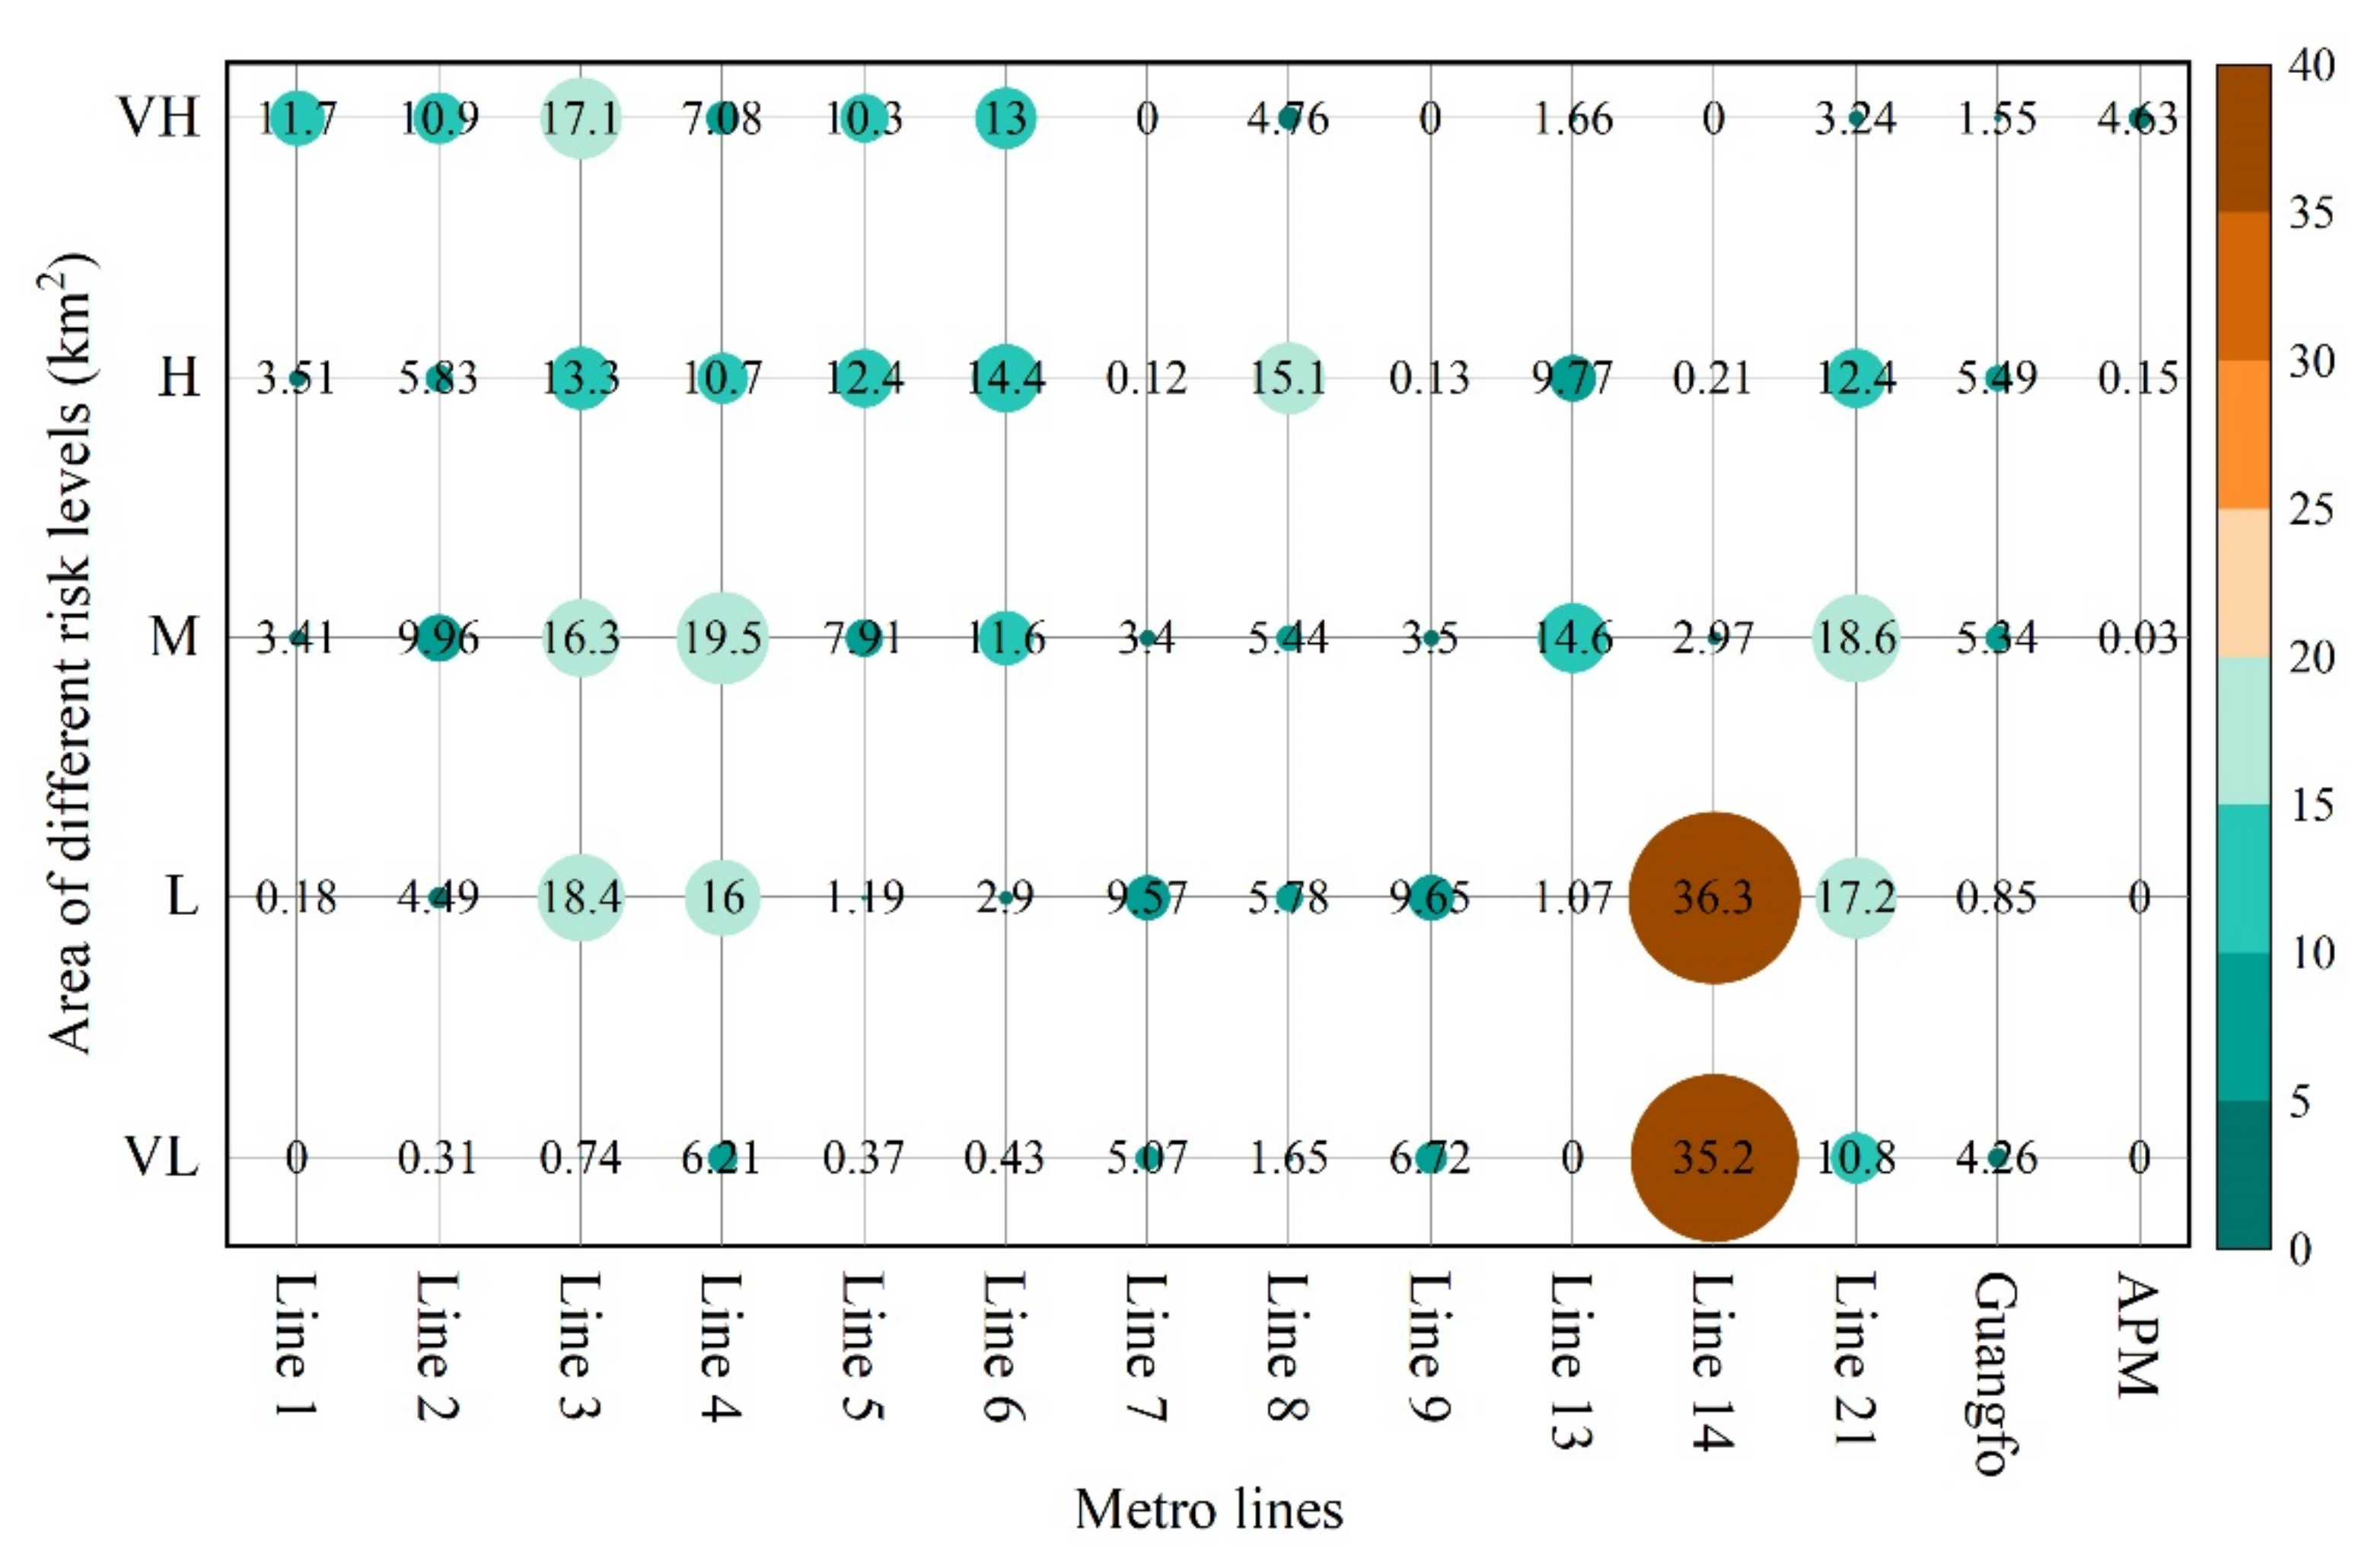
To support decision makers to better implement flood risk management, we determined the flood risk levels of 14 metro lines in Guangzhou. Overall, the areas of the Guangzhou metro system’s very high, high, medium, low, and very low flood risk levels were 85.97 (16.95%), 103.45 (20.40%), 122.55 (24.16%), 123.54 (24.36%), and 71.74 km2 (14.14%), respectively. The medium-to-very-high-risk zone covered 61.51% of the total area, indicating a severe flood threat to the Guangzhou metro system. At this point, it should be pointed out that we double-counted the flood risk area of the transfer stations as it is contained in different metro lines simultaneously.
Figure 14 reveals the area composition of the different flood risk levels for each metro line in Guangzhou. The area distribution of the different flood risk levels in the metro lines exhibits a polarization signature. This characteristic is mainly manifested in two aspects: (a) a certain flood risk level tends to be concentrated on one or several metro lines; (b) the area of different flood risk levels for each metro line is also unevenly distributed. For example, the very-low-risk zone of line 14 occupied 49.02% of the total area of the corresponding risk level in the Guangzhou metro system. Regarding the risk components on line 14, the total area of very low and low risk was 95.70% of this metro line, whereas the area of very high and high risk levels was close to zero. In addition, the very high flood risk level was concentrated on metro lines 1–6, which comprised a total area of 70.13 km2, accounting for 81.60% of the very-high-risk level area of the entire metro system.
The high flood risk level was mainly distributed in metro lines 3–6, 8, 13, and 21, making up 85.10% of the metro system’s total area of this risk level. Although a medium risk level was observed on all metro lines, its area distribution was also consistent with the two characteristics described above. The medium risk aggregated on metro lines 3, 4, 6, 13, and 21. The total area of very high and high risk plays a dominant role in the overall risk level of a metro line. Thus, we ranked the overall risk level of metro lines based on the ratio of the sum of each metro line’s very high and high risk to the total area of the corresponding risk in the Guangzhou metro system. The three metro lines with the highest overall risk were lines 3, 6, and 5. By contrast, metro lines 7, 9, and 14 featured the lowest overall risk level. The analysis of the flood risk level of each metro line enables timely emergency response and the implementation of flood prevention measures to reduce casualties and losses before the onset of heavy rainfall and floods.
3.2.3. Flood Risk Level of Metro Stations
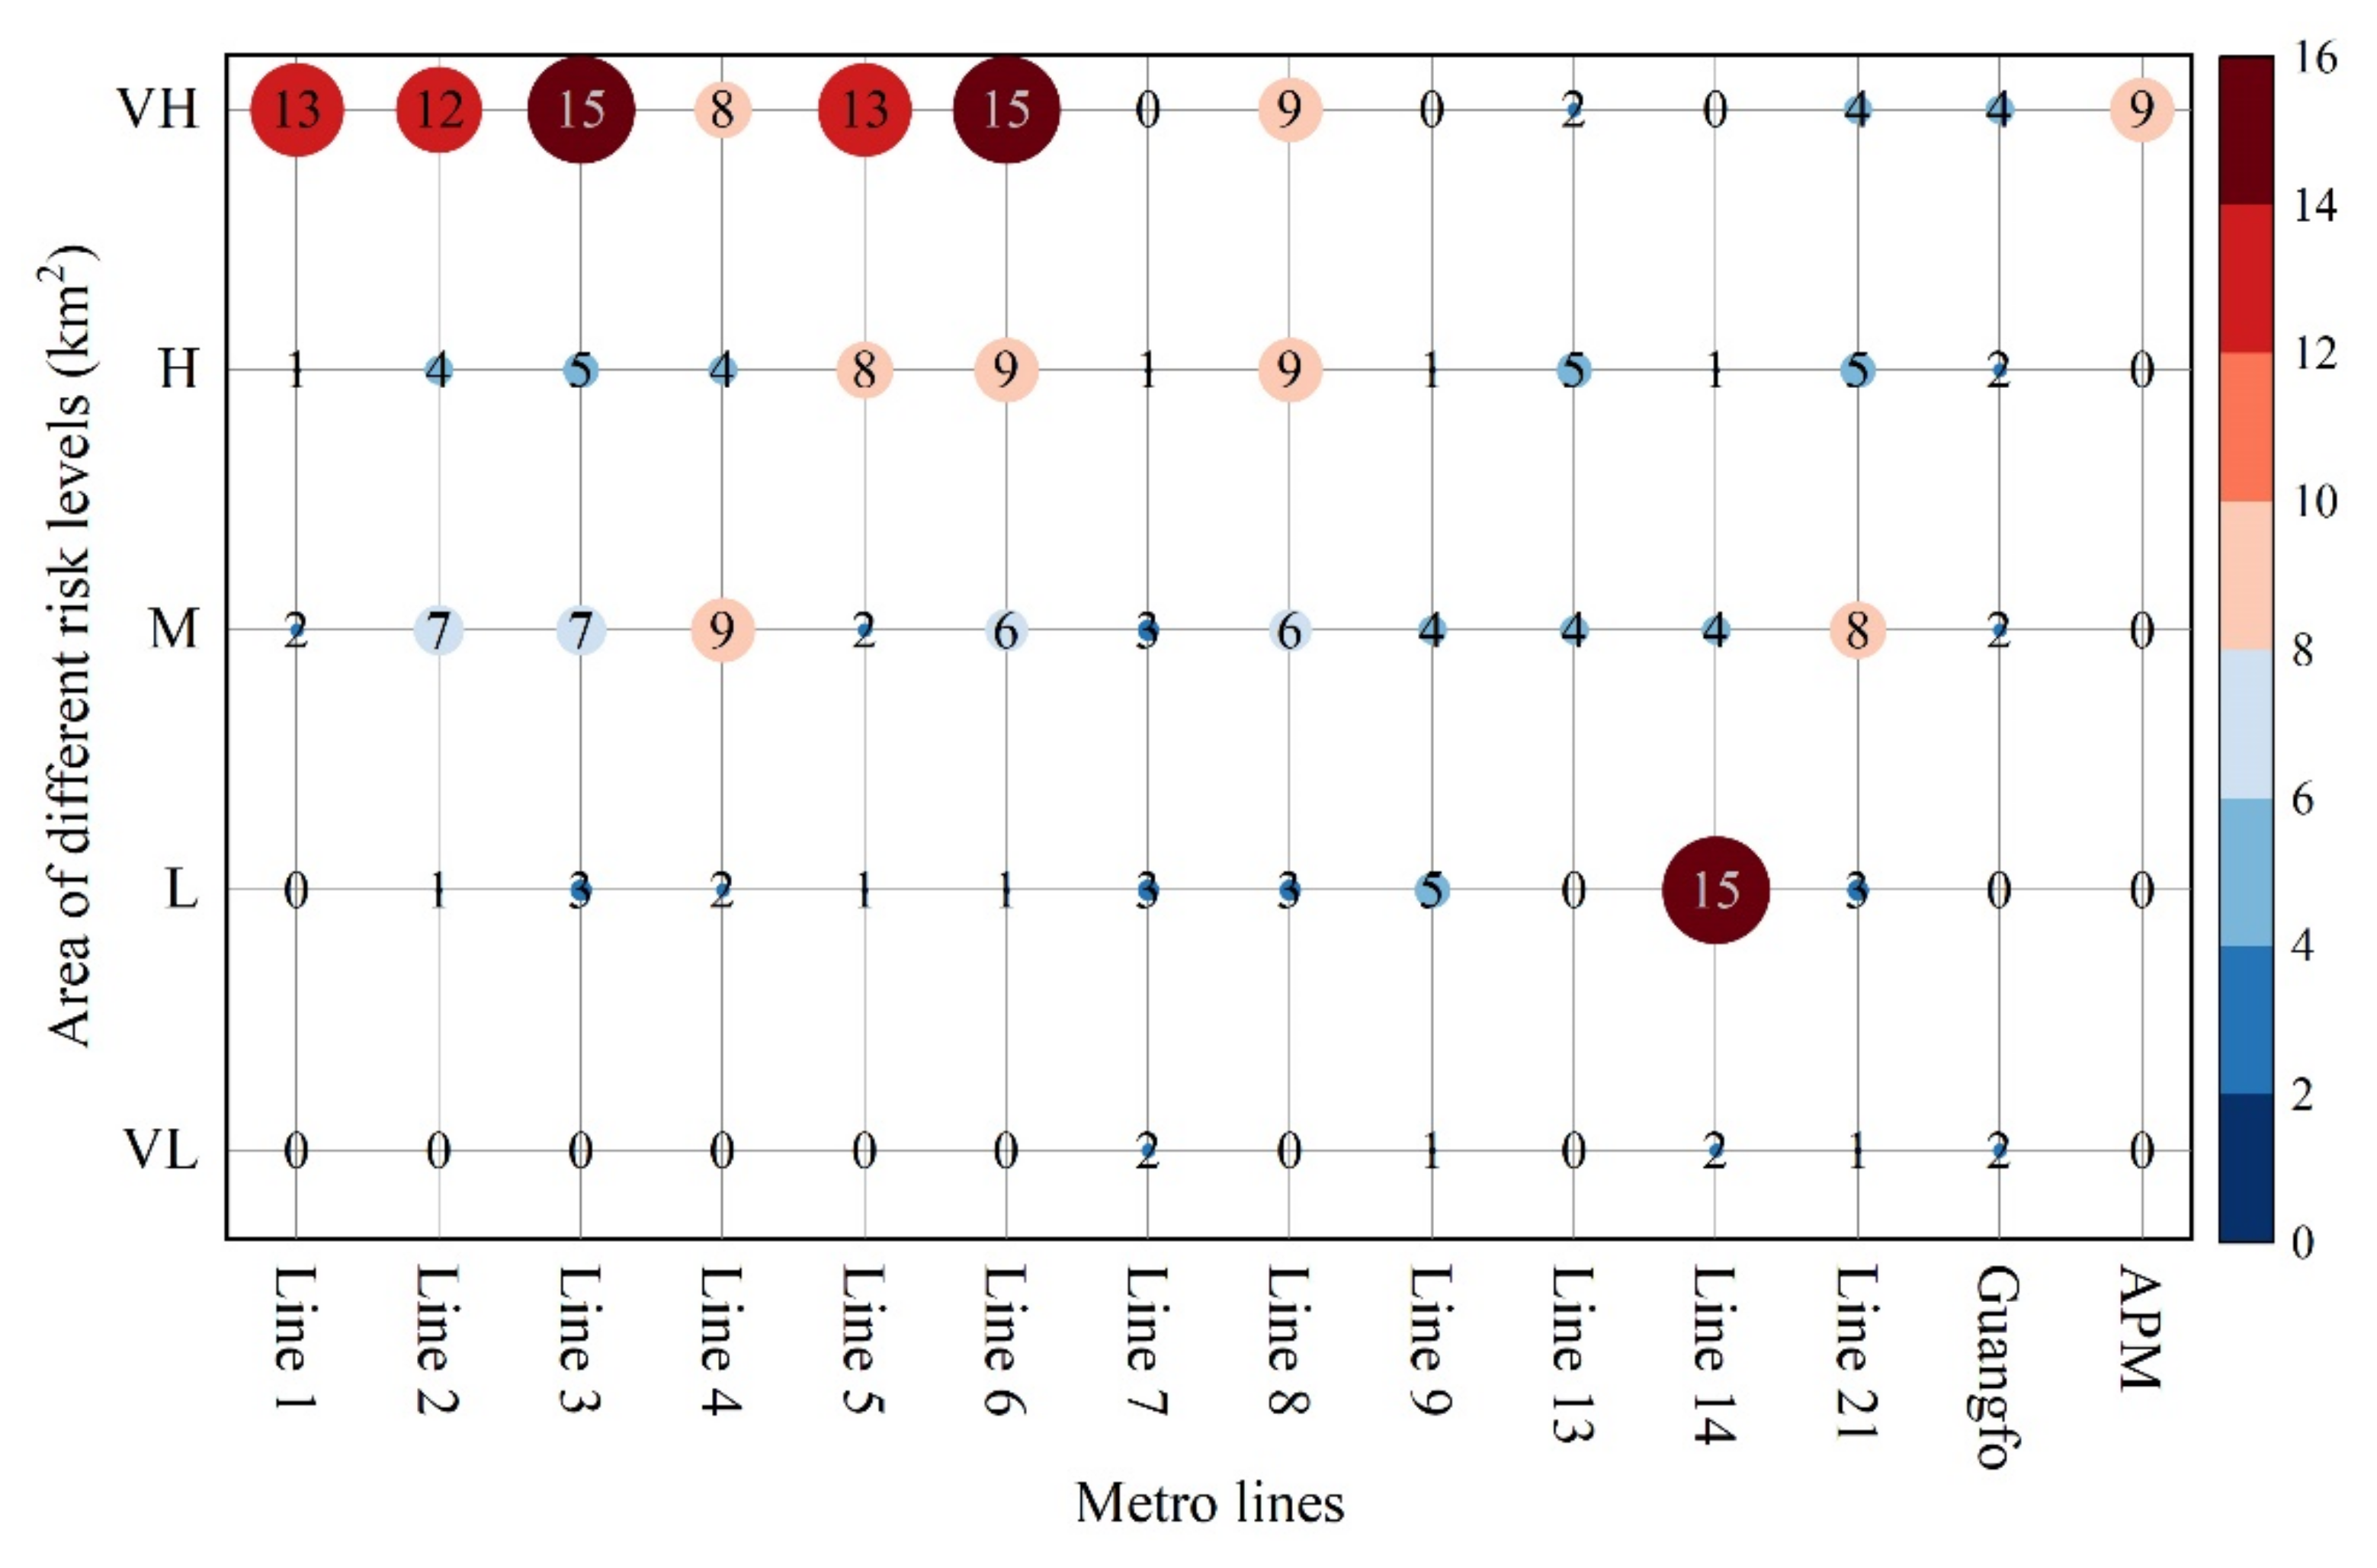
In addition to the 15 stations of the Guangfo line (Xinchengdong to Financial Hi-Tech Zone) in Foshan city, Guangzhou features 268 metro stations, including 192 regular stations and 38 transfer stations (https://www.gzmtr.com/, accessed on 11 December 2021). Except for Jiahewanggang (the transfer station for lines 2, 3, and 14) and Xinhe (the transfer stations for two sections of line 14), the remaining transfer stations are the intersections of two different metro lines. Figure 15 illustrates the flood risk level distribution of stations on each metro line in Guangzhou. The number of metro stations with very high, high, medium, low, and very low flood risk levels in the Guangzhou metro system were 104 (38.81%), 55 (20.52%), 64 (23.88%), 37 (13.81%), and 8 (2.99%), respectively. Specifically, the metro stations at very high risk were mainly located on line 6 (15), line 3 (15), line 5 (13), line 1 (13), and line 2 (12). Although the APM line featured fewer very high risk stations than the above lines, all of its stations were very-high-risk. The high-risk stations were primarily distributed on metro line 8 (9), line 6 (9), and line 5 (8). Moreover, the low-risk stations were concentrated on metro line 14 (15), accounting for 40.54% of the Guangzhou metro system’s total low risk stations. The number of very-low-risk stations was relatively small and was distributed exclusively on metro line 7 (2), line 14 (2), Guangfo line (2), line 9 (1), and line 21 (1).
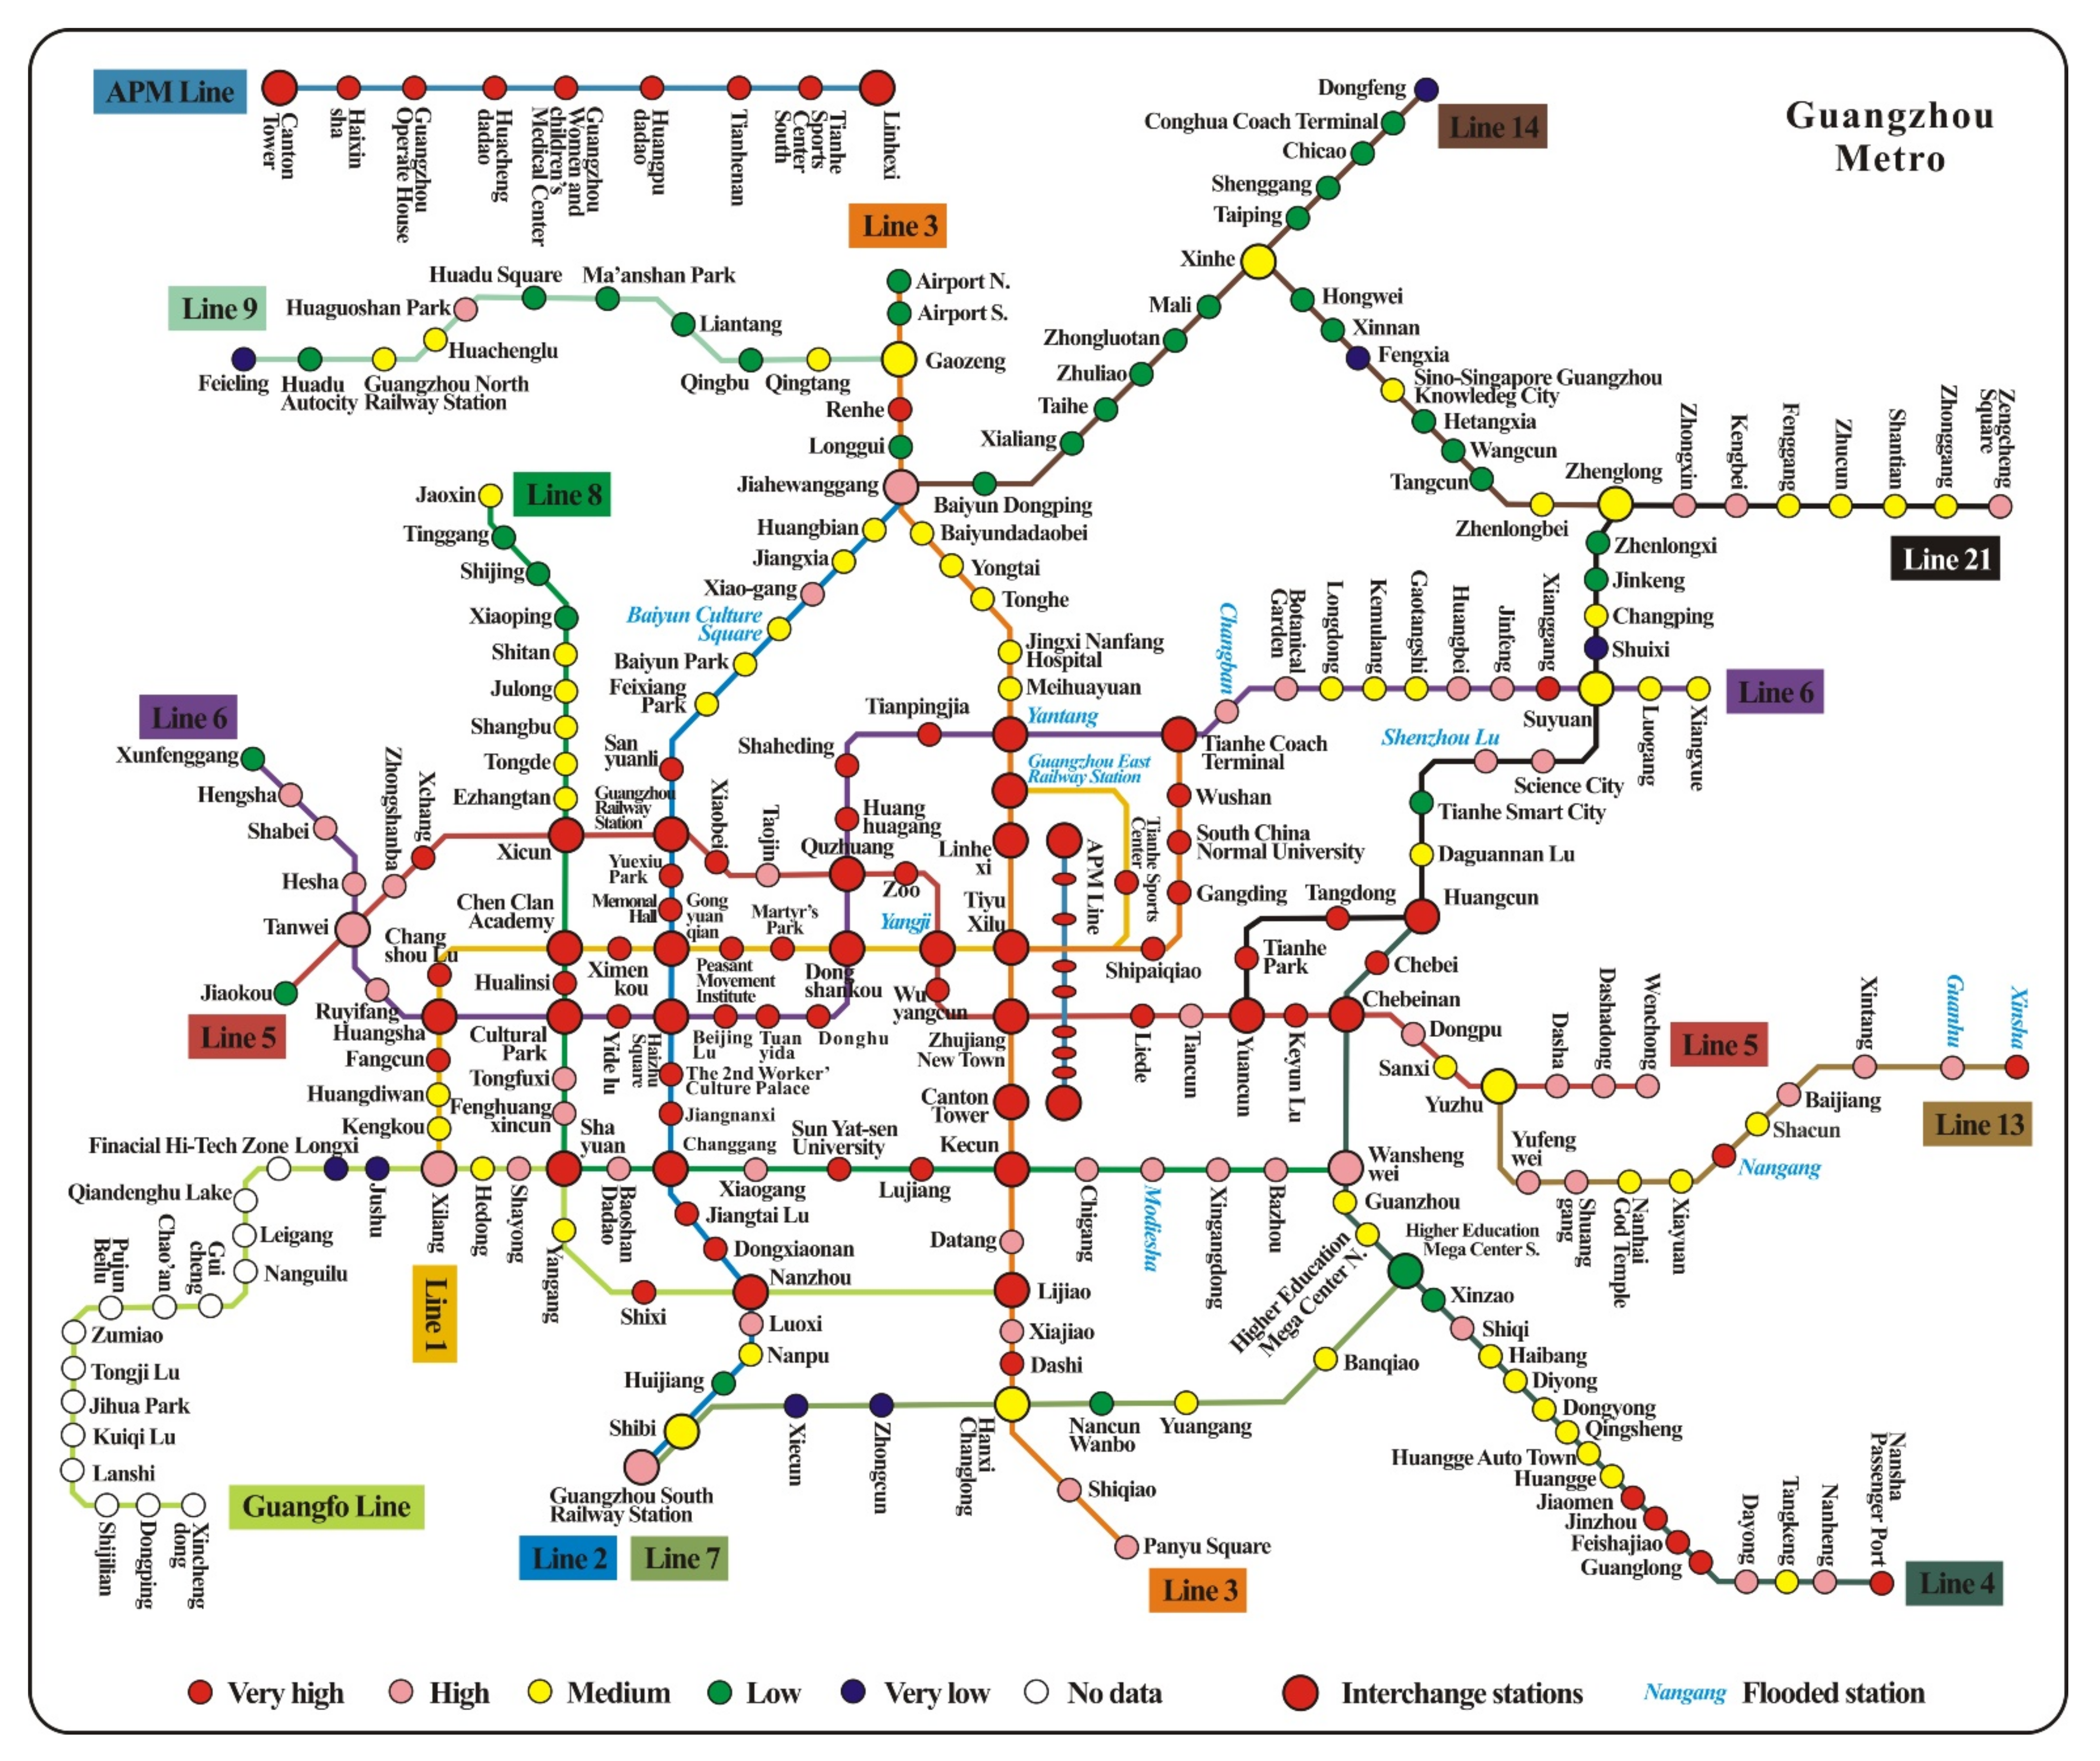
To facilitate the assessment of the risk results and flood risk management, we marked the flood risk levels of 268 stations on the latest Guangzhou metro map, which was from the official website of the Guangzhou Metro (https://www.gzmtr.com/, accessed on 11 December 2021). This map is strictly a schematic diagram of metro lines and not a geographical map. As shown in Figure A1, the flood risk levels of the metro stations were roughly distributed in a circular pattern, with a decreasing trend of risk levels from the center (central urban area) to the periphery. Moreover, the transfer stations featured relatively high flood risk levels. For example, 30 (78.94%) of the 38 transfer stations were very-high- or high-risk, and 37 (97.37%) fell in the very-high- and medium-risk categories. Therefore, we inferred that the increasing complexity of the metro system due to rapid construction will significantly exacerbate its flood risk level in the future. Historical metro flooding incidents have also demonstrated that when flooding occurs at a regular station, it usually influences adjacent stations on that line; if metro flooding occurs in a transfer station, it may impact multiple metro lines and stations and cause greater losses. Identifying the risk level of metro stations is recommended for the reasonable configuration of flood prevention facilities.
3.3. Result Verification
The risk assessment results were validated using reported historical metro floods and flood marks from field surveys. The ten flooded metro stations were superimposed on the risk assessment results in ArcGIS [17]. The locations of these metro stations are marked in Figure 12 (black dots) and Figure A1 (blue italics). The comparative analysis found that five of the ten flooded metro stations coincided with very high risk in the assessment results; four stations were consistent with the high risk level; one station fell in the medium risk zone. That is, 90% of the ten flooded metro stations matched the assessment results’ very high and high risk levels.
The assessment results not only identified flooded metro stations in the central urban, but, more importantly, they improved the screening of the flooded suburban metro sections and stations. For example, extreme precipitation occurred in Huangpu and Zengcheng during 21–22 May 2020, with maximum rainfall intensities of 245.2 and 302.2 mm in 180 min, respectively, and their recurrence periods exceeded 100 years [43]. Surface flooding rushed into the tunnels of metro line 13 from Guanhu, Xinsha, and Nangang stations. As a result, parts of the tunnels from Nangang to Xinsha were submerged, and the whole of line 13 was shut down. As shown in Figure 12, our risk assessment results accurately identified sections of metro line 13 from Nangang to Xinsha as very-high- and high-risk zones (dark red circles). Three stations with very high and high risk, Nangang, Xinsha, and Guanhu, were also identified. The above analysis fully demonstrates that the flood risk assessment results of the Guangzhou metro system based on the trapezoidal fuzzy AHP is accurate and reliable.
4. Discussion
4.1. Risk Indicator System Analysis
The hazards associated with disaster-causing factors are essential drivers of risk. In particular, extreme precipitation is a direct cause of metro flooding. In this study, we used different rainstorm intensities (H1 and H2) to analyze the impact of extreme rainfall on metro flood risk. Additionally, our field surveys found that flooding occurs in low-lying metro stations, even without extreme precipitation. Accordingly, the average annual precipitation was also incorporated into the hazard indicator system. Urban flooding and waterlogging are the primary causes of metro flooding [44]. We also considered the effect of waterlogging points in the risk assessment process. Historical flood frequency is the possibility of floods in an area, and its higher frequency may indicate greater damage caused.
Guangzhou is located in the Pearl River delta, which features relatively thick Quaternary sediments and karstic geomorphic development [45]. The deformation and collapse of metro tunnels caused by land subsidence (including karst subsidence) seriously affect the safe operation of Guangzhou metro [8,42]. For example, water and sand gushed into the Culture Park station of metro line 6 due to land subsidence on 28 Jan 2013. Moreover, geological hazards caused by heavy precipitation (disaster chains) and the simultaneous occurrence of heavy rainfall and geological hazards (disaster compound occurrences) can significantly increase the flood risk of the metro system [46]. As a result, we selected indicators related to precipitation and geology to comprise the indicator system for hazard evaluation.
The exposure indicators used in risk assessments mainly comprise disaster-causing environmental factors [46]. Field surveys and historical metro flooding incidents indicate that stations are the main channels for surface flooding into metro tunnels [44,47]. In other words, the more stations and exits on a metro line, the greater the likelihood of a metro flooding. In addition, the spatial distribution of metro stations can also impact the flood risk level of metro systems. If a rainstorm is heavy enough, floodwater entering a metro station may follow the tunnel into other stations and lines. For example, on 7 May 2010, flooding at Yantang station (line 3) affected the adjacent Linhexi and Guangzhou East railway stations. Therefore, the higher the density of a metro station, the greater the potential range of flooding. Low-lying topography is a determinant of the formation of waterlogging sites. Hence, elevation and slope were used as exposure indicators.
In addition to providing cities with essential freshwater resources, rivers play an important role in flow concentration and drainage channels [17]. Metro lines and stations in dense river networks or close to rivers are exposed to higher flood risks. Active faults can lead to deformation or groundwater seepage in metro tunnels. Moreover, rapid urbanization has led to an increase in impervious surfaces that severely impede the infiltration of surface rainwater, which dramatically aggravates urban flooding and waterlogging [48,49,50]. Therefore, land cover has an essential impact on urban flooding. We classified flood susceptibility according to the effect of different land cover types on runoff generation [38]. Based on the above analyses, we eventually selected the metro station density, exit numbers, elevation and slope, density and proximity of rivers, flood susceptibility according to land cover, and distance to faults to construct the exposure indicator system.
The vulnerability indicator refers to the resistance of a disaster-bearing body [46]. The volume of users is the most intuitive indicator of a metro’s vulnerability, as it reflects the potential casualties in the metro facing flooding. The density and complexity of metro lines may impact the scope of flooding. For example, flooding at transfer stations may pose a more significant threat than in regular stations because it may influence several stations on multiple lines. Dense populations and properties can amplify flood hazards and cause more severe damage, since areas with these features are more vulnerable. When rainfall intensity exceeds the capacity of an underground drainage system, roads become temporary floodways [15,44]. However, metro exits and vents are generally located on both sides of the road or are connected to crosswalks, which increases the possibility of street flooding into metro stations and tunnels. Previous flood incidents have demonstrated that the elderly and children are more vulnerable to flooding due to their physiological characteristics. Consequently, the age structure of the population impacts metro flood vulnerability. Education can raise flood awareness and is considered a vulnerability assessment indicator.
In summary, we selected 23 risk evaluation indicators from hazard, exposure, and vulnerability based on the risk model and field investigations. The results validation also proved the rationality of the risk indicator system we established.
4.2. Feasibility Analysis of Improved Trapezoidal Fuzzy AHP
The drawbacks of the traditional questionnaire fall mainly into two categories: (a) the complexity of pairwise comparisons among risk indicators and (b) the inconsistency of the judgment matrix. According to Miller’s Law, the average person can only keep seven (plus or minus two) items in their working memory [51]. That is, the maximum amount of information that the human brain can process simultaneously in a short period is seven (plus or minus two). However, risk is inherently a three-dimensional concept associated with uncertainty and complexity [23]. Risk assessment often involves multiple criterion layers, and each criterion layer comprises multiple sub-criteria or indicators, which poses a serious challenge for pairwise comparisons between indicators. Based on experts’ feedback, the pairwise comparison of indicators in the traditional questionnaires was both time-consuming and tiring. In addition, traditional questionnaires usually feature multiple pages because they must cover pairwise comparison options for any two indicators, which hinders the expert’s grasp of the overall picture to some extent. This approach may yield inconsistent judgment matrices.
The advantages of the new questionnaires for collecting information and building judgment matrices were examined by comparing the time taken to complete the traditional and new questionnaires. As shown in Table 3, the average time spent on the new questionnaire (11 min 29 s) was less than on the traditional questionnaire (18 min 5 s), regardless of which was filled out first. Specifically, the new questionnaire saved 33.40% of the time spent per person compared to the traditional questionnaire. Additionally, we found that the filling sequence affected the total time taken to complete both questionnaires. When the traditional questionnaires were filled out first, the per capita time for the new questionnaire was higher in group A (12 min 1 s) than in group B (10 min 57 s) compared with when the new questionnaires were completed first. Conversely, when the new questionnaires were completed first, the time per capita for the traditional questionnaires in group B (14 min 2 s) was significantly less than in group A (22 min 8 s) compared with when the traditional questionnaires were filled out first.
We further explored the reasons for the above phenomenon. According to the experts’ feedback, the new questionnaire’s indicator scores provide the basis for completing the traditional questionnaire. By contrast, filling out the traditional questionnaire first did not provide significantly helpful information for the new questionnaire. To some extent, the confusion caused by the complexity of the pairwise comparisons of the traditional questionnaires increased the time required to fill out the new questionnaires. This could explain why the average time spent on the new questionnaire was slightly higher for group A than for group B. Moreover, the 97.92% recommendation rate confirms that the new questionnaire is better than the traditional questionnaire.
To eliminate the effect of the filling sequence on the time required, we calculated the time-saving ratio of the new questionnaire using the time of the questionnaire completed first in both groups. As shown in Table 4, the average time-saving ratio per person for the new questionnaire was 50.08% after excluding the impact of the filling sequence. In addition, 21 inconsistencies in pairwise comparisons were found during our checking of the traditional questionnaires. However, these inconsistencies were not present in the new questionnaire, which asked the experts to score the indicators instead of pairwise comparisons. Essentially, scoring was the process of ranking the importance of the indicators in the criterion. Thus, the use of expert scoring and the new judgment matrix construction method proposed in this paper (Equations (4)–(6)) ensured the consistency of the established judgment matrix. This goal is not easy to achieve in a traditional questionnaire.
To further verify the reliability of the proposed method, we compared the risk assessment results of the traditional and the improved trapezoidal fuzzy AHP. Figure 16 presents the regional and metro system’s flood risk level using the traditional trapezoidal fuzzy AHP. Compared with Figure 11, Figure 16a also identified the very high and high risk in the central urban areas, but it featured certain shortcomings in recognizing high risk levels in the suburban areas. For example, nine historical flood points in Baiyun, Huadu, Conghua, and Zengcheng were identified as medium- or even low-risk, which contradicts our field survey results. Figure 16b shows that only 70% of the historically flooded metro stations matched with very high and high risk, and this accuracy is significantly lower than the improved trapezoidal fuzzy AHP (90% match). More importantly, the flooded Xinsha-to-Guanhu tunnel of line 13 was identified as very-high- and high-risk (dark red circles in Figure 12) in the improved trapezoidal fuzzy risk results. However, this section was identified as medium- and high-risk in the risk results based on the traditional trapezoidal fuzzy AHP (dark red circles in Figure 16b), which underestimated the actual flooding risk level. Consequently, the risk result based on the improved trapezoidal fuzzy AHP outperformed the traditional method.
4.3. Flood Prevention Measures of Metro System
Severe urban flooding and waterlogging are direct causes of metro flooding [52]. As of 2020, 90% of the drainage network in the central urban of Guangzhou can only resist a two-year return period flood [43]. However, average annual precipitation and short-duration extreme precipitation in Guangzhou have increased significantly in the past few decades [53]. In addition, the aging and disrepair of the underground drainage system is also a major cause of metro flooding. Therefore, increasing the capacity of street gutters and the sewer system to take up the runoff water from streets is the key to solving urban and metro flooding. Another essential measure against urban flooding is the development of sponge cities [52,54]. Sponge cities are sustainable urban developments that encompass flood control, water conservation, water quality improvement, and the protection of natural ecosystems [55]. Essential measures for building sponge cities include building sunken green areas, permeable pavements, water storage ponds, and restoring the natural ecological environment of rivers and lakes. These measures reduce urban flooding by increasing the infiltration of surface rainwater.
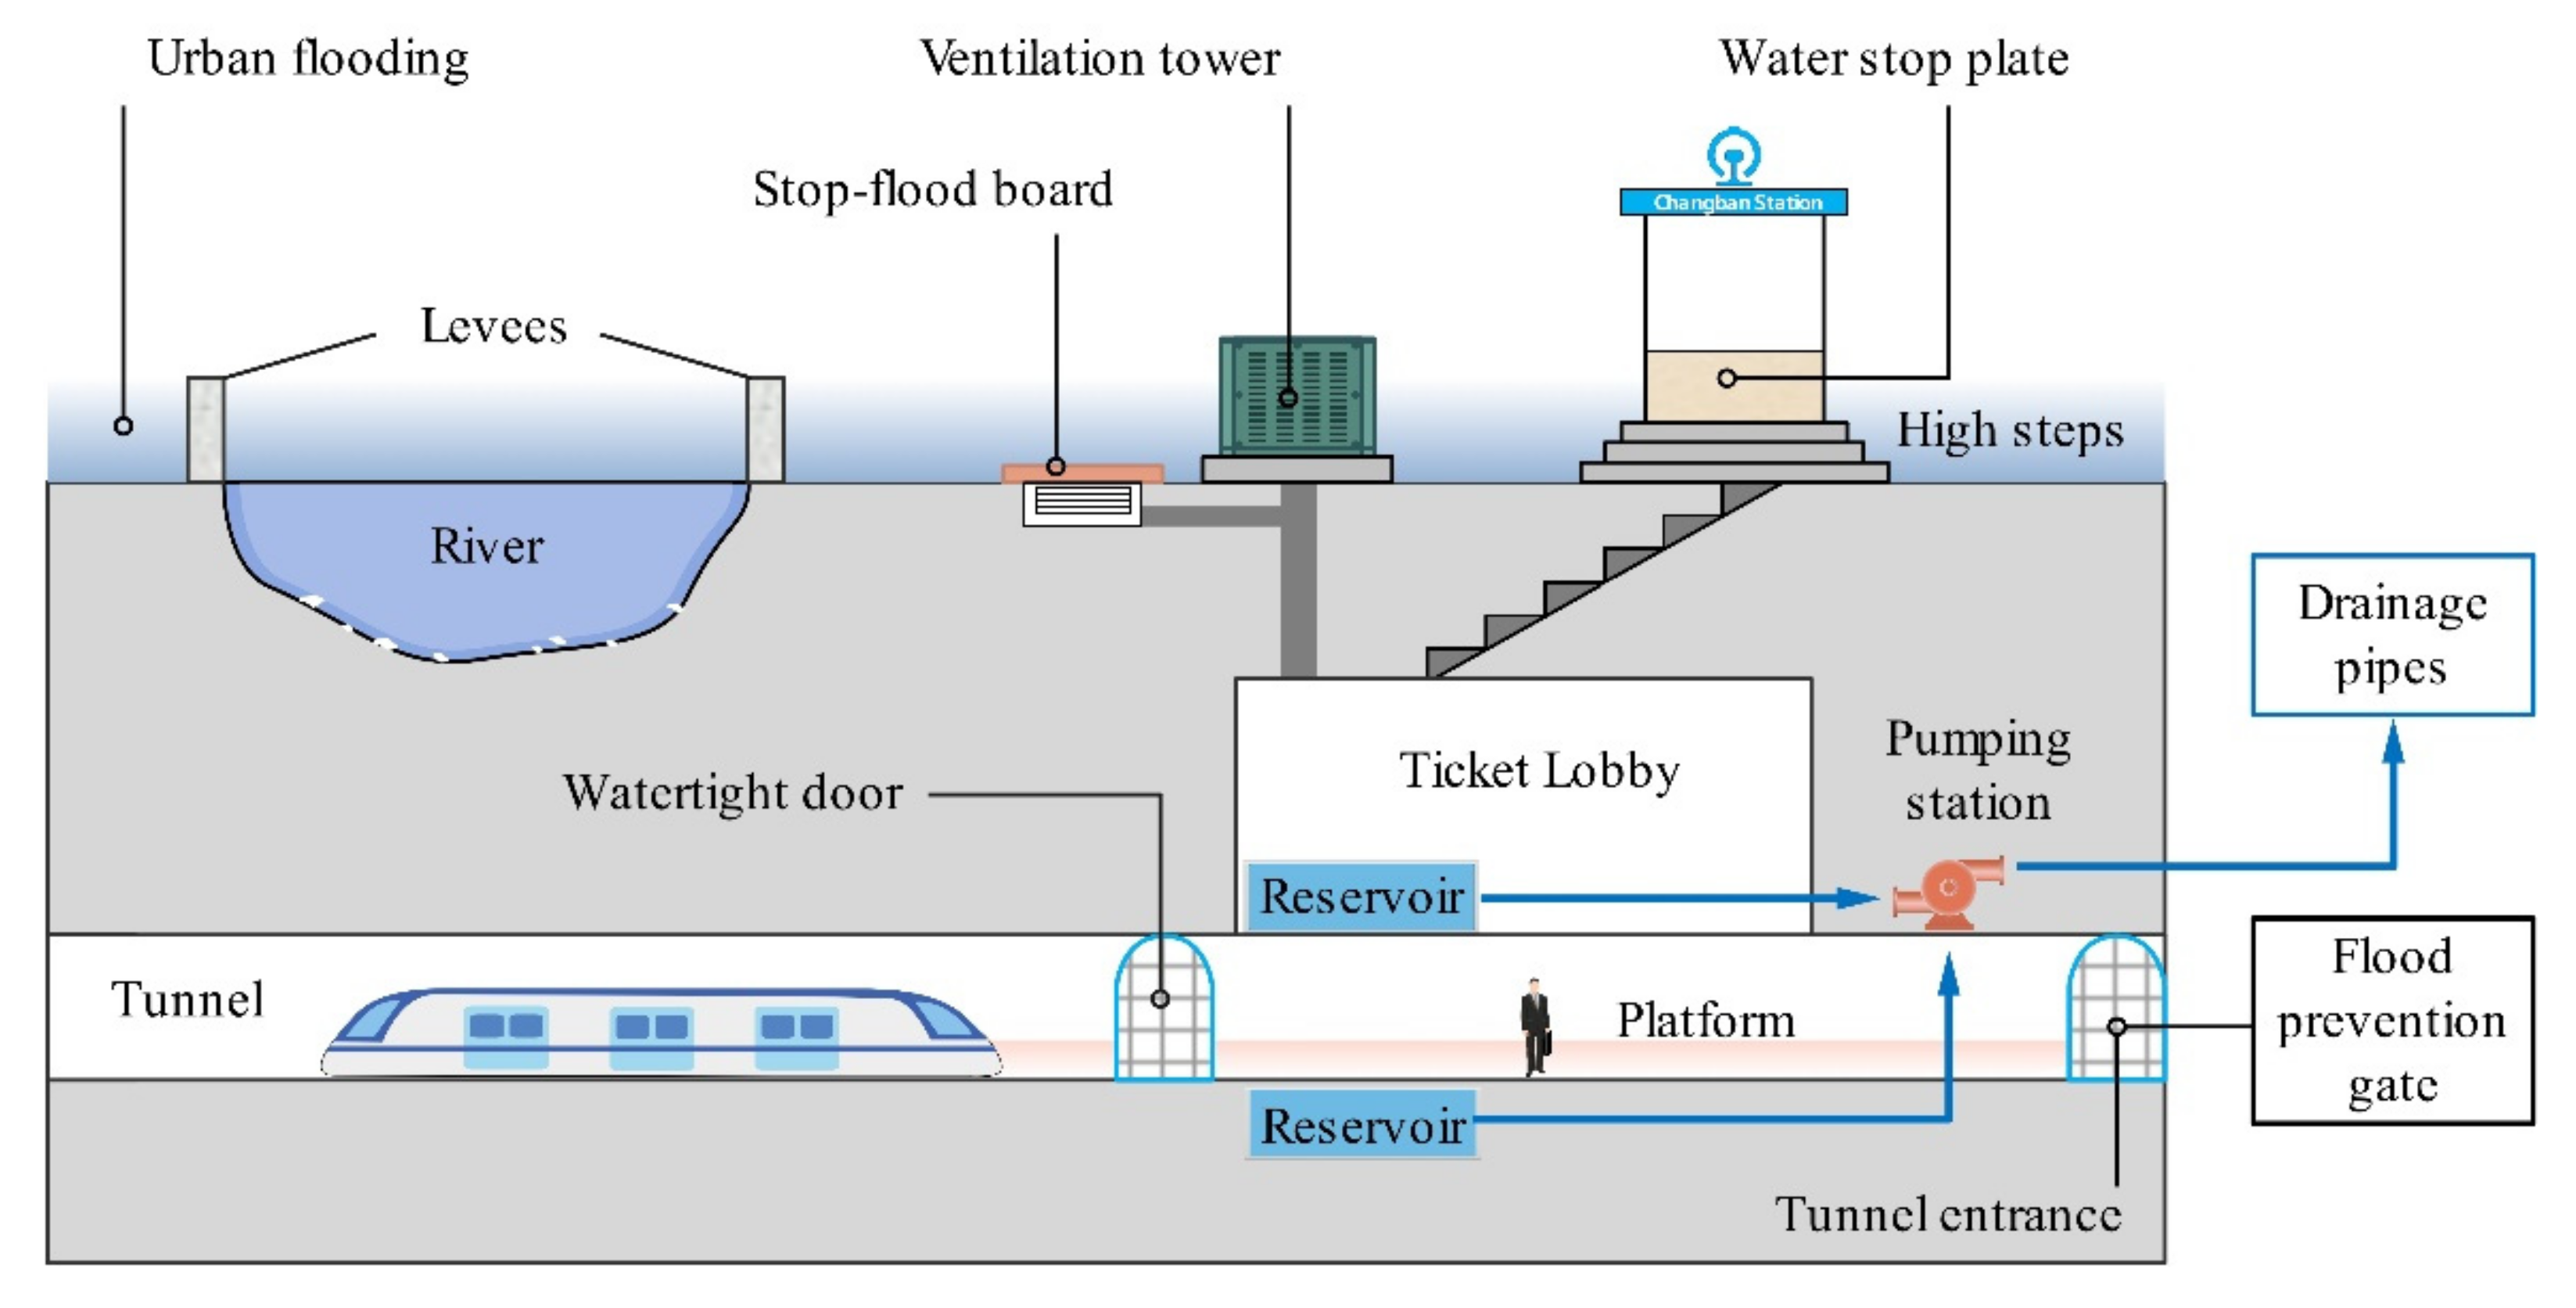
Figure 17 shows the proposed structural flood prevention measures for the Guangzhou metro system. Our field survey found that the exit height of some metro stations was decreased because of the elevated road surface. Therefore, raising exits is an effective measure to stop surface water intrusion into metro stations [56]. However, for low-lying metro stations, such as Xinsha (line 13), Guanhu (line 13), and Shiqiao (line 3), even if the exit is 45 cm higher (three steps) than the ground surface, it cannot effectively prevent the surface from flooding. It is necessary to install water-stop plates at these low-lying stations [15,56]. Given the dense river network in Guangzhou, watertight doors and flood prevention gates should be installed at stations (e.g., Shenzhoulu station) and tunnel entrances adjacent to rivers to prevent channel seepage and overflow. Watertight doors should also be installed at transfer stations to prevent flooding into other tunnels. In addition, the height of ventilation towers should be raised; stop-flood boards are required if the vents are connected to the ground. These structural measures are primarily recommended to prevent urban flooding from rushing into metro stations. If surface flooding already rushes into metro stations and tunnels, then timely drainage becomes especially important. Thus, installing reservoirs and pumping stations at very-high- and high-risk stations is of great importance to withstand metro flooding.
Moreover, soft adaptation strategies play an important role in flood control [10]. Compared to hard strategies (structural measures), soft adaptations exhibit the advantages of low cost, high benefit, and flexibility in flood prevention [9,15]. Accordingly, we propose to improve the drainage network’s capacity to withstand flooding through explicit legislation in the new urban plan. Regularly checking the underground drainage network before the rainy season could help to ensure its proper operation during torrential floods. We suggest developing a metro flood monitoring and warning system and delivering risk information to citizens in a timely manner through communication companies. With the support of this system, high-risk metro stations should be shut down during torrential flooding, and structural measures should be immediately activated to withstand flooding. Conducting flood risk assessments of the metro system and identifying high-risk sections and stations are key steps in flood risk management. Furthermore, this risk information provides an important scientific basis for decision makers to reasonably allocate flood control resources. The emergency management department should strengthen the dissemination of flooding education to raise public awareness regarding flood prevention.
4.4. Limitations
There are some drawbacks to this study. First, the underground drainage system was not involved in the risk indicator system due to data acquisition limitations. However, ninety percent of the drainage system in the central urban of Guangzhou can only resist a two-year return period flood [43]. This design standard is severely inconsistent with the precipitation intensity of Guangzhou. Therefore, we speculate that the drainage system may impact the local flood risk level of the metro system, while the overall risk pattern should not change significantly. Second, although the new questionnaire and matrix construction approach significantly shorten the time taken by experts to complete the questionnaire and ensure the consistency of the judgment matrix, they do not seem to reduce the total time taken to achieve the risk results. This is because the steps after collecting questionnaires are not omitted, such as building judgment matrices and calculating the maximum eigenvalue. In addition, the metro flood risk in this paper was presented using regional flood risk results from a buffer zone within 500 m of the metro line. This indirect risk assessment may introduce some uncertainty into the risk outcome. Future studies should employ hydrologic-hydrodynamic models to simulate the inundation of the metro system under different precipitation scenarios [14]. On this basis, researchers could combine precipitation, river levels, waterlogging points, drainage systems, historical flood information, and real-time monitoring to conduct a comprehensive flood risk evaluation of the metro system.
5. Conclusions
Underground transit plays an irreplaceable role in alleviating traffic congestion in metropolitan areas. However, frequent urban flooding poses a serious threat to the safe operation of metro systems. This paper constructed a risk indicator system for metro systems based on 23 indicators selected from hazard, exposure, and vulnerability. The flood risk level maps of the metro system were generated by employing an improved trapezoidal fuzzy AHP. We validated the risk assessment results using historical flood records and field survey data and then proposed flood prevention measures for the metro system. The main conclusions are as follows.
- (1)
- This study proposed a method for accurately assessing the flood risk levels of metro systems based on an improved trapezoidal fuzzy AHP. According to the established risk assessment indicator system and its corresponding weights, the flood risk level of the Guangzhou metro system was presented using the regional risk within a 500 m buffer zone of the metro line. The results validation found a 90% match between historical metro flood incidents and the very high and high risk in the risk assessment. This study provides a new approach to and technical support for the flood risk assessment of mega-city metro systems.
- (2)
- An improved trapezoidal fuzzy AHP method was proposed based on the newly designed questionnaire and judgment matrix building approach. The method solved the problems posed by the complexity of pairwise comparisons and the inconsistency of the judgment matrices in the traditional AHP. The new questionnaire shortens the time spent per expert by 50.3% compared to the traditional questionnaire; the 97.92% expert recommendation rate proved its superiority. Furthermore, the new matrix building approach ensures judgment matrix consistency for assessment indicators. The comparison of the risk assessment results demonstrates that the improved trapezoidal fuzzy AHP significantly outperformed the traditional trapezoidal fuzzy AHP. This method is also applicable to decision-making for related problems in other research fields.
- (3)
- The flood risk levels of 14 metro lines and 268 stations in Guangzhou were identified. The distribution of different flood risk levels in the metro lines exhibited a polarization signature. About 69% (155 km2) of very-high- and high-risk areas were concentrated in central urban areas (Yuexiu, Liwan, Tianhe, and Haizhu). The three metro lines with the highest overall risk level were lines 3, 6, and 5. The metro stations at very high risk were mainly located on metro lines 6, 3, 5, 1, and 2. This study can provide scientific data for decision makers to reasonably allocate flood prevention resources, which is significant in reducing flood losses and promoting Guangzhou’s sustainable development.
- (4)
- It should be noted that there were some limitations to our study. We failed to consider the effect of the underground drainage system on the flood risk results due to data acquisition limitations. Additionally, the risk assessment in this paper is an indirect method because the flood risk level of the metro system is derived from the regional risk results. Future studies should employ hydrologic-hydrodynamic models to simulate the inundation of the metro system under different precipitation scenarios. On this basis, a comprehensive risk assessment of the metro system could be conducted by combining topographic, hydrological, and socio-economic data. This method would further improve the accuracy of flood risk assessment for the metro system.
Author Contributions
Conceptualization, G.W. and L.L.; data curation and investigation, G.W., L.L., P.S., G.Z. and J.L.; methodology, G.W., L.L. and P.S.; writing—original draft, G.W.; writing—review and editing, G.W. and L.L. All authors have read and agreed to the published version of the manuscript.
Funding
This research was funded by the National Key Research and Development Project (Research and demonstration of key technologies for comprehensive prevention of multiple major natural disasters in metropolitan areas); the grant number is 2017YFC1503000.
Data Availability Statement
The sources of the flood risk assessment data for the Guangzhou metro system are listed in Appendix A (Table A1). In addition, the government investigation report on the water ingress at Shenzhou Road Station on Guangzhou Metro Line 21 can be found at http://yjglj.gz.gov.cn/zwgk/zdlyxxgk/scaqsgdcbgxx/content/post_7791816.html (accessed on 24 October 2021).
Acknowledgments
The authors would like to thank the anonymous reviewers for their valuable comments and the editors’ help with this article.
Conflicts of Interest
The authors declare no conflict of interest.
Appendix A

Table A1.
Data sources for flood risk evaluation of the Guangzhou metro system.
| Data Description | Data Source | |
|---|---|---|
| Hazard | Daily precipitation | http://gd.cma.gov.cn/gzsqxj/ (accessed on 11 December 2021) |
| Waterlogging points | https://data.gz.gov.cn/ (accessed on 11 December 2021) | |
| Land subsidence | https://geocloud.cgs.gov.cn/ (accessed on 11 December 2021) | |
| Geological hazards | https://geocloud.cgs.gov.cn/ (accessed on 11 December 2021) | |
| Historical Flood Frequency | Historical Materials of Natural Disasters in Guangdong Province and Yearbook of Disaster Prevention and Mitigation of Guangdong Province | |
| Exposure | Metro stations and exits | https://www.gzmtr.com/ (accessed on 11 December 2021) |
| Elevation and slope | http://www.gscloud.cn/ (accessed on 11 December 2021) | |
| River network (2017) | http://www.ngcc.cn/ngcc/ (accessed on 11 December 2021) | |
| Land cover | http://www.globallandcover.com/ (accessed on 11 December 2021) | |
| Fault | http://geocloud.cgs.gov.cn (accessed on 11 December 2021) | |
| Vulnerability | Metro lines | https://www.gzmtr.com/ (accessed on 11 December 2021) |
| Passenger flow | https://www.gzmtr.com/ (accessed on 11 December 2021) | |
| Population and GDP | Guangzhou Statistical Yearbook (2020) | |
| Road network (2017) | http://www.ngcc.cn/ngcc/ (accessed on 11 December 2021) | |
| Proportion of elderly and children | Guangzhou Statistical Yearbook (2020) | |
| Education level | The Sixth Population Census in 2010 | |
| Administrative divisions of Guangzhou (2017) | http://www.ngcc.cn/ngcc/ (accessed on 11 December 2021) | |
Appendix B
Table A2.
Newly designed questionnaire in improved trapezoidal fuzzy AHP.
| Indicators | Importance of Indicators under Different Criterions | ||||||||
|---|---|---|---|---|---|---|---|---|---|
| 1 | 2 | 3 | 4 | 5 | 6 | 7 | 8 | 9 | |
| Criterion 1 | |||||||||
| Indicator 1 | |||||||||
| Indicator 2 | |||||||||
| …… | |||||||||
| Indicator i | |||||||||
| Criterion 2 | |||||||||
| Indicator 1 | |||||||||
| Indicator 2 | |||||||||
| …… | |||||||||
| Indicator j | |||||||||
| …… | |||||||||
| Criterion n | |||||||||
| Indicator 1 | |||||||||
| Indicator 2 | |||||||||
| …… | |||||||||
| Indicator k | |||||||||
| Draw “√” in the appropriate box | |||||||||
Note: The numbers 1–9 (from lowest importance to highest importance) denote an indicator’s direct contribution or importance to the criterion’s risk results.
Table A3.
Pairwise comparison questionnaire in the traditional AHP method.
| Indicator | Scales of Indicators under Different Criterion Layers | Indicator | ||||||||
|---|---|---|---|---|---|---|---|---|---|---|
| 9 | 7 | 5 | 3 | 1 | 1/3 | 1/5 | 1/7 | 1/9 | ||
| Indicator 1 compared to other indicators | ||||||||||
| Indicator 1 | Indicator 2 | |||||||||
| Indicator 1 | Indicator 3 | |||||||||
| …… | …… | |||||||||
| Indicator 1 | Indicator i | |||||||||
| Indicator 2 compared to other indicators | ||||||||||
| Indicator 2 | Indicator 3 | |||||||||
| Indicator 2 | Indicator 4 | |||||||||
| …… | …… | |||||||||
| Indicator 2 | Indicator i | |||||||||
| …… | ||||||||||
| Indicator i − 1 compared to indicator i | ||||||||||
| Indicator I − 1 | Indicator i | |||||||||
| Draw “√” in the appropriate box | ||||||||||
Note: The numbers 1, 3, 5, 7, and 9 indicate that the former is equally important, moderately important, strongly important, very strongly important, and extremely important compared to the latter, respectively; the numbers 2, 4, 6, and 8 are intermediate values between two adjacent judgments. The numbers 1/3, 1/5, 1/7, 1/9 are the reciprocals of the numbers 3, 5, 7, and 9. If indicator i is 3 compared to indicator j, then indicator j is 1/3 compared to indicator i.
Appendix C
Table A4.
Linguistic variables for trapezoidal fuzzy numbers.
| Linguistic Variable | AHP Method | Trapezoidal Fuzzy Number |
|---|---|---|
| Equally important | 1 | 1′ = (1,1,1,1) |
| Moderately important | 3 | 3′ = (1,11/9,13/7,7/3) |
| Strongly important | 5 | 5′ = (3/2,13/7,3,4) |
| Very strongly important | 7 | 7′ = (7/3,3,17/3,9) |
| Extremely important | 9 | 9′ = (4,17/3,9,9) |
Note: The numbers 2′, 4′, 6′, and 8′ are intermediate values between two adjacent judgments.
Table A5.
Votes under different scores for hazard, exposure, and vulnerability indicators.
| Flood Risk | Indicator | Importance Level of Hazard, Exposure, and Vulnerability Indicator | ||||||||
|---|---|---|---|---|---|---|---|---|---|---|
| 1 | 2 | 3 | 4 | 5 | 6 | 7 | 8 | 9 | ||
| Hazard | H1 | 2 | 5 | 17 | ||||||
| H2 | 2 | 11 | 8 | 2 | 1 | |||||
| H3 | 3 | 8 | 9 | 4 | ||||||
| H4 | 5 | 10 | 7 | 2 | ||||||
| H5 | 5 | 11 | 7 | 1 | ||||||
| H6 | 6 | 10 | 5 | 3 | ||||||
| H7 | 12 | 6 | 5 | 1 | ||||||
| Exposure | E1 | 2 | 8 | 14 | ||||||
| E2 | 5 | 7 | 12 | |||||||
| E3 | 2 | 7 | 10 | 5 | ||||||
| E4 | 3 | 8 | 7 | 6 | ||||||
| E5 | 3 | 8 | 6 | 7 | ||||||
| E6 | 4 | 6 | 9 | 5 | ||||||
| E7 | 3 | 13 | 4 | 4 | ||||||
| E8 | 8 | 11 | 5 | |||||||
| Vulnerability | V1 | 3 | 5 | 16 | ||||||
| V2 | 5 | 9 | 6 | 4 | ||||||
| V3 | 4 | 8 | 9 | 3 | ||||||
| V4 | 7 | 9 | 7 | 1 | ||||||
| V5 | 2 | 4 | 12 | 4 | 1 | |||||
| V6 | 3 | 6 | 9 | 6 | ||||||
| V7 | 8 | 9 | 5 | 1 | 1 | |||||
| V8 | 11 | 8 | 3 | 2 | ||||||
Note: The second row of Roman numerals represents scores 1–9 (importance measure of the indicator); the other Roman numerals indicate the number of expert votes for an indicator under that score. H1–H7, E1–E8, and V1–V8 represent hazard, exposure, and vulnerability indicators, respectively, and their meanings are illustrated in Figure 3.
Appendix D
Figure A1.
Flood risk levels of 268 stations in the Guangzhou metro system.

References
- Ward, P.J.; Jongman, B.; Aerts, J.C.; Bates, P.D.; Botzen, W.J.; Loaiza, A.D.; Hallegatte, S.; Kind, J.M.; Kwadijk, J.; Scussolini, P. A global framework for future costs and benefits of river-flood protection in urban areas. Nat. Clim. Chang. 2017, 7, 642–646. [Google Scholar] [CrossRef]
- Merz, B.; Blöschl, G.; Vorogushyn, S.; Dottori, F.; Aerts, J.C.; Bates, P.; Bertola, M.; Kemter, M.; Kreibich, H.; Lall, U. Causes, impacts and patterns of disastrous river floods. Nat. Rev. Earth Environ. 2021, 2, 592–609. [Google Scholar] [CrossRef]
- Wang, Z.; Lai, C.; Chen, X.; Yang, B.; Zhao, S.; Bai, X. Flood hazard risk assessment model based on random forest. J. Hydrol. 2015, 527, 1130–1141. [Google Scholar] [CrossRef]
- Winsemius, H.C.; Aerts, J.C.; Van Beek, L.P.; Bierkens, M.F.; Bouwman, A.; Jongman, B.; Kwadijk, J.C.; Ligtvoet, W.; Lucas, P.L.; Van Vuuren, D.P. Global drivers of future river flood risk. Nat. Clim. Chang. 2016, 6, 381–385. [Google Scholar] [CrossRef]
- Hallegatte, S.; Green, C.; Nicholls, R.J.; Corfee-Morlot, J. Future flood losses in major coastal cities. Nat. Clim. Chang. 2013, 3, 802–806. [Google Scholar] [CrossRef]
- Wang, P.; Li, Y.; Yu, P.; Zhang, Y. The analysis of urban flood risk propagation based on the modified Susceptible Infected Recovered model. J. Hydrol. 2021, 603, 127121. [Google Scholar] [CrossRef]
- UN. 68% of the World Population Projected to Live in Urban Areas by 2050, Says UN. 2018. Available online: https://www.un.org/development/desa/en/news/population/2018-revision-of-world-urbanization-prospects.html (accessed on 31 December 2018).
- Arnell, N.W.; Gosling, S.N. The impacts of climate change on river flood risk at the global scale. Clim. Chang. 2016, 134, 387–401. [Google Scholar] [CrossRef] [Green Version]
- Yin, J.; Ye, M.; Yin, Z.; Xu, S. A review of advances in urban flood risk analysis over China. Stoch. Environ. Res. Risk Assess. 2015, 29, 1063–1070. [Google Scholar] [CrossRef]
- Du, S.; Scussolini, P.; Ward, P.J.; Zhang, M.; Wen, J.; Wang, L.; Koks, E.; Diaz-Loaiza, A.; Gao, J.; Ke, Q. Hard or soft flood adaptation? Advantages of a hybrid strategy for Shanghai. Glob. Environ. Chang.-Hum. Policy Dimens. 2020, 61, 102037. [Google Scholar] [CrossRef]
- Chen, Z.-L.; Chen, J.-Y.; Liu, H.; Zhang, Z.-F. Present status and development trends of underground space in Chinese cities: Evaluation and analysis. Tunn. Undergr. Space Technol. 2018, 71, 253–270. [Google Scholar] [CrossRef]
- Sterling, R.; Admiraal, H.; Bobylev, N.; Parker, H.; Godard, J.-P.; Vähäaho, I.; Rogers, C.D.; Shi, X.; Hanamura, T. Sustainability issues for underground space in urban areas. Proc. Inst. Civ. Eng.-Urban Des. Plan. 2012, 165, 241–254. [Google Scholar] [CrossRef]
- Xie, H.; Zhang, Y.; Chen, Y.; Peng, Q.; Liao, Z.; Zhu, J. A case study of development and utilization of urban underground space in Shenzhen and the Guangdong-Hong Kong-Macao Greater Bay Area. Tunn. Undergr. Space Technol. 2021, 107, 103651. [Google Scholar] [CrossRef]
- Lyu, H.-M.; Shen, S.-L.; Yang, J.; Yin, Z.-Y. Inundation analysis of metro systems with the storm water management model incorporated into a geographical information system: A case study in Shanghai. Hydrol. Earth Syst. Sci. 2019, 23, 4293–4307. [Google Scholar] [CrossRef] [Green Version]
- Wang, G.; Liu, Y.; Hu, Z.; Zhang, G.; Liu, J.; Lyu, Y.; Gu, Y.; Huang, X.; Zhang, Q.; Liu, L. Flood Risk Assessment of Subway Systems in Metropolitan Areas under Land Subsidence Scenario: A Case Study of Beijing. Remote Sens. 2021, 13, 637. [Google Scholar] [CrossRef]
- Lyu, H.-M.; Shen, S.-L.; Zhou, A.; Yang, J. Perspectives for flood risk assessment and management for mega-city metro system. Tunn. Undergr. Space Technol. 2019, 84, 31–44. [Google Scholar] [CrossRef]
- Wang, G.; Liu, Y.; Hu, Z.; Lyu, Y.; Zhang, G.; Liu, J.; Liu, Y.; Gu, Y.; Huang, X.; Zheng, H. Flood risk assessment based on fuzzy synthetic evaluation method in the Beijing-Tianjin-Hebei metropolitan area, China. Sustainability 2020, 12, 1451. [Google Scholar] [CrossRef] [Green Version]
- Pham, B.T.; Luu, C.; Van Phong, T.; Nguyen, H.D.; Van Le, H.; Tran, T.Q.; Ta, H.T.; Prakash, I. Flood risk assessment using hybrid artificial intelligence models integrated with multi-criteria decision analysis in Quang Nam Province, Vietnam. J. Hydrol. 2021, 592, 125815. [Google Scholar] [CrossRef]
- Lai, C.; Shao, Q.; Chen, X.; Wang, Z.; Zhou, X.; Yang, B.; Zhang, L. Flood risk zoning using a rule mining based on ant colony algorithm. J. Hydrol. 2016, 542, 268–280. [Google Scholar] [CrossRef]
- Darabi, H.; Choubin, B.; Rahmati, O.; Haghighi, A.T.; Pradhan, B.; Kløve, B. Urban flood risk mapping using the GARP and QUEST models: A comparative study of machine learning techniques. J. Hydrol. 2019, 569, 142–154. [Google Scholar] [CrossRef]
- Zhang, M.; Xu, M.; Wang, Z.; Lai, C. Assessment of the vulnerability of road networks to urban waterlogging based on a coupled hydrodynamic model. J. Hydrol. 2021, 603, 127105. [Google Scholar] [CrossRef]
- Kittipongvises, S.; Phetrak, A.; Rattanapun, P.; Brundiers, K.; Buizer, J.L.; Melnick, R. AHP-GIS analysis for flood hazard assessment of the communities nearby the world heritage site on Ayutthaya Island, Thailand. Int. J. Disaster Risk Reduct. 2020, 48, 101612. [Google Scholar] [CrossRef]
- Akter, M.; Jahan, M.; Kabir, R.; Karim, D.S.; Haque, A.; Rahman, M.; Salehin, M. Risk assessment based on fuzzy synthetic evaluation method. Sci. Total Environ. 2019, 658, 818–829. [Google Scholar] [CrossRef] [PubMed]
- Toosi, A.S.; Calbimonte, G.H.; Nouri, H.; Alaghmand, S. River basin-scale flood hazard assessment using a modified multi-criteria decision analysis approach: A case study. J. Hydrol. 2019, 574, 660–671. [Google Scholar] [CrossRef]
- Lappas, I.; Kallioras, A. Flood susceptibility assessment through GIS-based multi-criteria approach and analytical hierarchy process (AHP) in a river basin in Central Greece. Int. Res. J. Eng. Technol 2019, 6, 738–751. [Google Scholar]
- Cabrera, J.S.; Lee, H.S. Flood risk assessment for Davao Oriental in the Philippines using geographic information system-based multi-criteria analysis and the maximum entropy model. J. Flood Risk Manag. 2020, 13, e12607. [Google Scholar] [CrossRef] [Green Version]
- Zheng, G.; Zhu, N.; Zhe, T.; Ying, C.; Sun, B. Application of a trapezoidal fuzzy AHP method for work safety evaluation and early warning rating of hot and humid environments. Saf. Sci. 2012, 50, 228–239. [Google Scholar] [CrossRef]
- Li, Y.; Wang, W.; Chang, M.; Wang, X. Impacts of urbanization on extreme precipitation in the Guangdong-Hong Kong-Macau Greater Bay Area. Urban Clim. 2021, 38, 100904. [Google Scholar] [CrossRef]
- Ruan, J.; Chen, Y.; Yang, Z. Assessment of temporal and spatial progress of urban resilience in Guangzhou under rainstorm scenarios. Int. J. Disaster Risk Reduct. 2021, 66, 102578. [Google Scholar] [CrossRef]
- Ren, D.-J.; Shen, S.-L.; Cheng, W.-C.; Zhang, N.; Wang, Z.-F. Geological formation and geo-hazards during subway construction in Guangzhou. Environ. Earth Sci. 2016, 75, 1–14. [Google Scholar] [CrossRef]
- Mishra, K.; Sinha, R. Flood risk assessment in the Kosi megafan using multi-criteria decision analysis: A hydro-geomorphic approach. Geomorphology 2020, 350, 106861. [Google Scholar] [CrossRef]
- Aven, T. Risk assessment and risk management: Review of recent advances on their foundation. Eur. J. Oper. Res. 2016, 253, 1–13. [Google Scholar] [CrossRef] [Green Version]
- Kaplan, S.; Garrick, B.J. On the quantitative definition of risk. Risk Anal. 1981, 1, 11–27. [Google Scholar] [CrossRef]
- Pachauri, R.K.; Allen, M.R.; Barros, V.R.; Broome, J.; Cramer, W.; Christ, R.; Church, J.A.; Clarke, L.; Dahe, Q.; Dasgupta, P. Climate Change 2014: Synthesis Report. Contribution of Working Groups I, II and III to the Fifth Assessment Report of the Intergovernmental Panel on Climate Change; IPCC: Copenhagen, Denmark, 2014. [Google Scholar]
- Mach, K.J.; Mastrandrea, M.D.; Bilir, T.E.; Field, C.B. Understanding and responding to danger from climate change: The role of key risks in the IPCC AR5. Clim. Chang. 2016, 136, 427–444. [Google Scholar] [CrossRef] [Green Version]
- Hu, S.; Cheng, X.; Zhou, D.; Zhang, H. GIS-based flood risk assessment in suburban areas: A case study of the Fangshan District, Beijing. Nat. Hazards 2017, 87, 1525–1543. [Google Scholar] [CrossRef]
- Huang, Z.; Chen, L.; Fu, B.; Lu, Y.; Huang, Y.; Gong, J. The relative efficiency of four representative cropland conversions in reducing water erosion: Evidence from long-term plots in the Loess hilly area, China. Land Degrad. Dev. 2006, 17, 615–627. [Google Scholar] [CrossRef]
- Wei, W.; Chen, L.; Fu, B.; Huang, Z.; Wu, D.; Gui, L. The effect of land uses and rainfall regimes on runoff and soil erosion in the semi-arid loess hilly area, China. J. Hydrol. 2007, 335, 247–258. [Google Scholar] [CrossRef]
- Lyu, H.-M.; Shen, S.-L.; Zhou, A.; Yang, J. Risk assessment of mega-city infrastructures related to land subsidence using improved trapezoidal FAHP. Sci. Total Environ. 2020, 717, 135310. [Google Scholar] [CrossRef]
- Delgado, M.; Herrera, F.; Herrera-Viedma, E.; Martinez, L. Combining numerical and linguistic information in group decision making. Inf. Sci. 1998, 107, 177–194. [Google Scholar] [CrossRef]
- Ziarh, G.F.; Asaduzzaman, M.; Dewan, A.; Nashwan, M.S.; Shahid, S. Integration of catastrophe and entropy theories for flood risk mapping in peninsular Malaysia. J. Flood Risk Manag. 2021, 14, e12686. [Google Scholar] [CrossRef]
- Arabameri, A.; Saha, S.; Roy, J.; Chen, W.; Blaschke, T.; Tien Bui, D. Landslide susceptibility evaluation and management using different machine learning methods in the Gallicash River Watershed, Iran. Remote Sens. 2020, 12, 475. [Google Scholar] [CrossRef] [Green Version]
- Wang, T.; Hu, L.; Shen, Z. The causes and solutions of the flooding of Guangzhou Metro caused by the “5·22” rainstorm in 2020. Guangdong Meteorol. 2020, 42, 52–55. [Google Scholar]
- Vermeij, D. Flood Risk Reduction Interventions for the New York City Subway System: A Research on the Impact of Storm Surge and Sea Level Rise on the Safety against Flooding in Urban Delta’s. Master’s Thesis, Delft University of Technology, Delft, The Netherlands, 2016. [Google Scholar]
- Hou, Q.; Yang, Z.; Yu, T.; You, Y.; Dou, L.; Li, K. Impacts of parent material on distributions of potentially toxic elements in soils from Pearl River Delta in South China. Sci. Rep. 2020, 10, 17394. [Google Scholar]
- Shi, P. Disaster Risk Science; Springer: Berlin/Heidelberg, Germany, 2019. [Google Scholar]
- Wang, G.-F.; Lyu, H.-M.; Shen, J.S.; Lu, L.-H.; Li, G.; Arulrajah, A. Evaluation of environmental risk due to metro system construction in Jinan, China. Int. J. Environ. Res. Public Health 2017, 14, 1114. [Google Scholar] [CrossRef] [Green Version]
- Wang, G.; Hu, Z.; Liu, Y.; Zhang, G.; Liu, J.; Lyu, Y.; Gu, Y.; Huang, X.; Zhang, Q.; Tong, Z. Impact of Expansion Pattern of Built-Up Land in Floodplains on Flood Vulnerability: A Case Study in the North China Plain Area. Remote Sens. 2020, 12, 3172. [Google Scholar] [CrossRef]
- Arnold, C.L., Jr.; Gibbons, C.J. Impervious surface coverage: The emergence of a key environmental indicator. J. Am. Plan. Assoc. 1996, 62, 243–258. [Google Scholar] [CrossRef]
- Du, S.; Shi, P.; Van Rompaey, A.; Wen, J. Quantifying the impact of impervious surface location on flood peak discharge in urban areas. Nat. Hazards 2015, 76, 1457–1471. [Google Scholar] [CrossRef]
- Miller, G.A. The magical number seven, plus or minus two: Some limits on our capacity for processing information. Psychol. Rev. 1956, 63, 81. [Google Scholar] [CrossRef] [PubMed] [Green Version]
- Xia, J.; Zhang, Y.; Xiong, L.; He, S.; Wang, L.; Yu, Z. Opportunities and challenges of the Sponge City construction related to urban water issues in China. Sci. China-Earth Sci. 2017, 60, 652–658. [Google Scholar] [CrossRef]
- Zhou, X.; Bai, Y.; Li, Q. Frequency, intensity statistics and cyclical analysis of rainstorm in the flood season in Guangzhou. Meteorol. Environ. Res. 2011, 2, 63–66. [Google Scholar]
- Li, H.; Ding, L.; Ren, M.; Li, C.; Wang, H. Sponge city construction in China: A survey of the challenges and opportunities. Water 2017, 9, 594. [Google Scholar] [CrossRef] [Green Version]
- Nguyen, T.T.; Ngo, H.H.; Guo, W.; Wang, X.C.; Ren, N.; Li, G.; Ding, J.; Liang, H. Implementation of a specific urban water management-Sponge City. Sci. Total Environ. 2019, 652, 147–162. [Google Scholar] [CrossRef] [PubMed]
- Aoki, Y.; Yoshizawa, A.; Taminato, T. Anti-inundation measures for underground stations of Tokyo Metro. Procedia Eng. 2016, 165, 2–10. [Google Scholar] [CrossRef]
Figure 1.
Real pictures of flooding in metro stations and tunnels. (a) The tunnel from Shakoulu and Haitansi station of Zhengzhou metro line 5 (18 July 2021); (b) Shenzhoulu station of Guangzhou metro line 21 (30 July 2021); (c) the 28th Street station on the Lexington Avenue line in Manhattan, New York (2 September 2021); (d) Pudding Mill Lane station of London Docklands Light Rail (26 July 2021).

Figure 2.
Terrain of Guangzhou and its metro system.

Figure 3.
Modeling and procedure of flood risk assessment for metro systems.

Figure 4.
Spatial distribution of hazard indicators in Guangzhou. (a) Rainstorm intensity (≥100 mm); (b) rainstorm intensity (≥50 mm); (c) annual average precipitation; (d) waterlogging points; (e) historical flood frequency. The letters are the abbreviations of the districts in Guangzhou; YX: Yuexiu; TH: Tianhe; LW: Liwan; HZ: Haizhu; BY: Baiyun; HP: Huangpu; PY: Panyu; NS: Nansha; HD: Huadu; ZC: Zengceng; CH: Conghua. These abbreviations will not be explained repeatedly in the rest of the paper.

Figure 5.
Spatial distribution of land subsidence (a) and other geological hazards (b) in Guangzhou.
Figure 5.
Spatial distribution of land subsidence (a) and other geological hazards (b) in Guangzhou.

Figure 6.
Spatial distribution of metro station exits (a), station density (b), and land cover (c) and their flood susceptibility (d) in Guangzhou.
Figure 6.
Spatial distribution of metro station exits (a), station density (b), and land cover (c) and their flood susceptibility (d) in Guangzhou.

Figure 7.
Spatial distribution of exposure indicators in Guangzhou. (a) DEM; (b) slope; (c); river network density; (d) distance to river network; (e) distance to fault.
Figure 7.
Spatial distribution of exposure indicators in Guangzhou. (a) DEM; (b) slope; (c); river network density; (d) distance to river network; (e) distance to fault.

Figure 8.
Spatial distribution of vulnerability indicators of Guangzhou. (a) Passenger flow; (b) metro line density; (c) proportion of elderly and children; (d) education level.
Figure 8.
Spatial distribution of vulnerability indicators of Guangzhou. (a) Passenger flow; (b) metro line density; (c) proportion of elderly and children; (d) education level.

Figure 9.
Spatial distribution of vulnerability indicators of Guangzhou. (a) Population density; (b) GDP density; (c) road network density; (d) distance to road network.
Figure 9.
Spatial distribution of vulnerability indicators of Guangzhou. (a) Population density; (b) GDP density; (c) road network density; (d) distance to road network.

Figure 10.
Trapezoidal fuzzy number m. When a = b, the trapezoidal fuzzy number becomes a triangular fuzzy number; when a = b and c = d, the trapezoidal fuzzy number becomes an interval number; when a = b = c = d, the trapezoidal fuzzy number becomes a crisp value.
Figure 10.
Trapezoidal fuzzy number m. When a = b, the trapezoidal fuzzy number becomes a triangular fuzzy number; when a = b and c = d, the trapezoidal fuzzy number becomes an interval number; when a = b = c = d, the trapezoidal fuzzy number becomes a crisp value.

Figure 11.
Regional flood risk level map of Guangzhou and its results validation.

Figure 12.
Flood risk level map of Guangzhou metro system.

Figure 13.
Area distribution (a) and proportion (b) of different flood risk levels in each district’s metro in Guangzhou. The proportion is the ratio of the area of different flood risk levels in each district to the total area of the corresponding level in the Guangzhou metro system.
Figure 13.
Area distribution (a) and proportion (b) of different flood risk levels in each district’s metro in Guangzhou. The proportion is the ratio of the area of different flood risk levels in each district to the total area of the corresponding level in the Guangzhou metro system.

Figure 14.
Area distribution of different flood risk levels for each metro line in Guangzhou. VH, H, M, L, and VL denote very high, high, medium, low, and very low flood risk levels, respectively; the larger the circle and number and the redder the color, the greater the area of the risk level.
Figure 14.
Area distribution of different flood risk levels for each metro line in Guangzhou. VH, H, M, L, and VL denote very high, high, medium, low, and very low flood risk levels, respectively; the larger the circle and number and the redder the color, the greater the area of the risk level.

Figure 15.
Flood risk level distribution of stations on each metro line in Guangzhou. VH, H, M, L, and VL denote very high, high, medium, low, and very low flood risk levels, respectively; the larger the circle and number and the redder the color, the greater the number of stations at this risk level.

Figure 16.
Flood risk level maps for the region (a) and metro system (b) using traditional trapezoidal fuzzy AHP.
Figure 16.
Flood risk level maps for the region (a) and metro system (b) using traditional trapezoidal fuzzy AHP.

Figure 17.
Flood prevention measures for the Guangzhou metro system.

Table 1.
Ranking of flood frequencies and their danger ratings.
| Flood Frequency | Danger Rating | Districts |
|---|---|---|
| ≤70 | 0.1 | Tianhe, Conghua |
| 70–80 | 0.2 | Huadu |
| 80–90 | 0.3 | Baiyun, Huangpu, Liwan, Yuexiu, Haizhu |
| 90–100 | 0.4 | Zengcheng |
| ≥100 | 0.5 | Panyu, Nansha |
Table 2.
Indicator weights for flood risk assessment of Guangzhou metro.
| Criterion | WTra-FAHP | WImproved Tra-FAHP | Indicator | WTra-FAHP | WImproved Tra-FAHP |
|---|---|---|---|---|---|
| Hazard | 0.370 | 0.411 | H1 | 0.1975 | 0.2105 |
| H2 | 0.1518 | 0.1769 | |||
| H3 | 0.1518 | 0.1595 | |||
| H4 | 0.1518 | 0.1361 | |||
| H5 | 0.1225 | 0.1208 | |||
| H6 | 0.1225 | 0.1070 | |||
| H7 | 0.1022 | 0.0892 | |||
| Exposure | 0.290 | 0.325 | E1 | 0.1807 | 0.1668 |
| E2 | 0.1807 | 0.1668 | |||
| E3 | 0.1420 | 0.1385 | |||
| E4 | 0.1103 | 0.1385 | |||
| E5 | 0.1103 | 0.1121 | |||
| E6 | 0.1103 | 0.1121 | |||
| E7 | 0.0903 | 0.0908 | |||
| E8 | 0.0754 | 0.0744 | |||
| Vulnerability | 0.290 | 0.264 | V1 | 0.1720 | 0.1925 |
| V2 | 0.1720 | 0.1566 | |||
| V3 | 0.1352 | 0.1301 | |||
| V4 | 0.1352 | 0.1301 | |||
| V5 | 0.1091 | 0.1087 | |||
| V6 | 0.1091 | 0.1087 | |||
| V7 | 0.0894 | 0.0903 | |||
| V8 | 0.0780 | 0.0829 |
Note: WTra-FAHP and WImproved Tra-FAHP denote the weights calculated by traditional and improved trapezoidal fuzzy AHP.
Table 3.
Expert background and time spent completing the traditional and new questionnaires.
| Group | Occupation (Number) | Average Work Experience (Year) | Average Time Spent | Time-Saving Ratio (%) | New Questionnaire Recommendation Rate (%) | |
|---|---|---|---|---|---|---|
| Traditional (Ts) | New (Ns) | |||||
| Group A (traditional first) | PF(3) | 26 | 25′18″ | 13′33″ | 46.31 | 100 |
| EG(1) | 31 | 18′54″ | 11′09″ | 41.01 | 100 | |
| DG(2) | 16 | 21′19″ | 10′52″ | 49.02 | 100 | |
| ER(3) | 21 | 16′36″ | 9′43″ | 41.47 | 100 | |
| CW(1) | 9 | 23′00″ | 12′00″ | 47.83 | 100 | |
| EM(3) | 13 | 27′44″ | 14′44″ | 46.88 | 100 | |
| Average | - | - | 22′08″ | 12′01 | 45.42 | 100 |
| Group B (new first) | PF(2) | 19 | 14′28″ | 10′35″ | 26.84 | 100 |
| EG(1) | 28 | 10′43″ | 9′12″ | 14.15 | 100 | |
| DG(1) | 24 | 14′51″ | 10′21″ | 30.30 | 100 | |
| ER(4) | 13 | 11′03″ | 8′58″ | 18.85 | 75 | |
| CW(1) | 11 | 18′23″ | 14′00″ | 23.84 | 100 | |
| EM(2) | 8 | 14′45″ | 12′38″ | 14.35 | 100 | |
| Average | - | - | 14′02″ | 10′57″ | 21.39 | 95.83 |
| Total average | - | - | 18′05″ | 11′29″ | 33.40 | 97.92 |
Note: Time-saving ratio is calculated by the formula (Ts − Ns)/Ts; Ts and Ns indicate the time spent of each expert to complete the traditional and new questionnaires; the abbreviated letters mean professor (PF), engineering geologist (EG), designer (DG), engineer (ER), construction worker (CW), and emergency manager (EM), respectively; the symbols ′ and ″ indicate minutes and seconds.
Table 4.
The time-saving ratio for new questionnaires after eliminating the effect of the sequence of filling out questionnaires.
Table 4.
The time-saving ratio for new questionnaires after eliminating the effect of the sequence of filling out questionnaires.
| Occupation (Traditional, New) | Average Time Spent | Time-Saving Ratio (%) | |
|---|---|---|---|
| Traditional First (Ts) | New First (Ns) | ||
| Professor (3,2) | 25′18″ | 10′35″ | 58.17 |
| Engineering geologist (1,1) | 18′54″ | 9′12″ | 51.32 |
| Designer (2,1) | 21′19″ | 10′21″ | 51.45 |
| Engineer (3,4) | 16′36″ | 8′58″ | 45.98 |
| Construction worker (1,1) | 23′00″ | 14′00″ | 39.13 |
| Emergency manager (3,2) | 27′44″ | 12′38″ | 54.45 |
| Average | 22′08″ | 10′57″ | 50.08 |
Note: Time-saving ratio is calculated by the formula (Ts − Ns)/Ts; Ts and Ns indicate the time spent of each expert to complete the traditional and new questionnaires; professor (3,2) indicates that three people in the professor group completed the traditional questionnaire first and two people filled out the new questionnaire first; the symbols ′ and ″ indicate minutes and seconds.
Publisher’s Note: MDPI stays neutral with regard to jurisdictional claims in published maps and institutional affiliations. |
© 2021 by the authors. Licensee MDPI, Basel, Switzerland. This article is an open access article distributed under the terms and conditions of the Creative Commons Attribution (CC BY) license (https://creativecommons.org/licenses/by/4.0/).
Share and Cite
MDPI and ACS Style
Wang, G.; Liu, L.; Shi, P.; Zhang, G.; Liu, J. Flood Risk Assessment of Metro System Using Improved Trapezoidal Fuzzy AHP: A Case Study of Guangzhou. Remote Sens. 2021, 13, 5154. https://0-doi-org.brum.beds.ac.uk/10.3390/rs13245154
AMA Style
Wang G, Liu L, Shi P, Zhang G, Liu J. Flood Risk Assessment of Metro System Using Improved Trapezoidal Fuzzy AHP: A Case Study of Guangzhou. Remote Sensing. 2021; 13(24):5154. https://0-doi-org.brum.beds.ac.uk/10.3390/rs13245154
Chicago/Turabian StyleWang, Guangpeng, Lianyou Liu, Peijun Shi, Guoming Zhang, and Jifu Liu. 2021. "Flood Risk Assessment of Metro System Using Improved Trapezoidal Fuzzy AHP: A Case Study of Guangzhou" Remote Sensing 13, no. 24: 5154. https://0-doi-org.brum.beds.ac.uk/10.3390/rs13245154
Note that from the first issue of 2016, this journal uses article numbers instead of page numbers. See further details here.