
Radiative Transfer Model Simulations for Ground-Based Microwave Radiometers in North China
by

Wenying He
1,2,*, 
Yunchu Cheng
1,2,
Rongshi Zou
1,
Pucai Wang
1,2,
Hongbin Chen
1,
Jun Li
1 and
Xiangao Xia
1,2
1
Key Laboratory of Middle Atmosphere and Global Environment Observation (LAGEO), Institute of Atmospheric Physics, Chinese Academy of Sciences, Beijing 100029, China
2
University of Chinese Academy of Sciences, Beijing 100049, China
*
Author to whom correspondence should be addressed.
Remote Sens. 2021, 13(24), 5161; https://0-doi-org.brum.beds.ac.uk/10.3390/rs13245161
Submission received: 15 October 2021
/
Revised: 10 December 2021
/
Accepted: 14 December 2021
/
Published: 19 December 2021
(This article belongs to the Special Issue Feature Papers of Section Atmosphere Remote Sensing)
Abstract
:Ground-based microwave radiometer profilers (MWRPs) are widely used to provide high-temporal resolution atmospheric temperature and humidity profiles. The quality of the observed brightness temperature (TB) from MWRPs is key for retrieving accurate atmospheric profiles. In this study, TB simulations derived from a radiative transfer model (RTM) were used to assess the quality of TB observations. Two types of atmospheric profile data (conventional radiosonde and ERA5 reanalysis) were combined with the RTM to obtain TB simulations, then compared with corresponding observations from three MWRPs located in different places in North China to investigate the influence of input atmospheric profiles on TB simulations and evaluate the quality of TB observations from the three MWRPs. The comparisons of the matching samples under clear-sky conditions showed that TB simulations derived from both radiosonde and ERA5 profiles were very close to the TB observations from most of the MWRP channels; however, the correlation was lower and the bias was obvious at 51.26 GHz and 52.28 GHz, which indicates that the oxygen absorption component in the RTM needs to be improved for lower-frequency temperature channels. The difference in location of the radiosonde and MWRP sites affected the TB simulations for the water vapor channels, but had little impact on temperature channels that are insensitive to humidity. Comparisons of both simulations (ERA5 and Radiosonde) and the corresponding TB observations from the three sites indicated that the water vapor channels observation quality for the MWRP located in southern Beijing needs improvement. For the two types of profile data, ERA5 profiles have a more positive effect on TB simulations in the water vapor channels, such as enhanced consistence, reduced bias and standard deviation between simulations and observations for those MWRPs located away from the radiosonde station. Therefore, hourly ERA5 data are an optimal option in terms of compensating for limited radiosonde measurements and enhancing the monitoring quality of MWRP observations within 24 h.
1. Introduction
Ground-based microwave radiometer profilers (MWRPs) can obtain atmospheric temperature and humidity profiles based on microwave signals, which are influenced by water vapor and oxygen molecules in the atmosphere [1,2,3]. With their advanced technology and scientific design, MWRPs can be operated unattended in almost all weather conditions to provide continuous observations on the second time scale. Currently, MWRPs are widely used for monitoring extreme weather, such as intense convective events, thick fog, and air pollution [4,5,6,7], and for studying local atmospheric vertical structure changes [8,9,10].
As is well known, atmospheric temperature and humidity profiles can be retrieved based on MWRP multichannel microwave brightness temperature (TB) observations using statistical methods, such as multiple linear regression and nonlinear neural networks, and physical methods [11,12,13]. Therefore, the quality of TB observations is key to retrieving atmospheric profiles. Various studies reported significant TB offsets or drift in individual channels and over the whole range, which was then normalized after absolute calibration with liquid nitrogen [10,14].
Currently, there are more than 100 MWRPs in China. To maintain MWRP performance, a regular absolute calibration using liquid nitrogen is required roughly every 6 months. Liquid nitrogen at a very low temperature must be stored in a special tank and specialized protective gloves must be worn during calibration. For MWRPs located in remote areas, it is difficult to assure regular absolute calibration because it is inconvenient to obtain liquid nitrogen, which potentially reduces the quality of TB observations for those MWRPs.
The radiative transfer model (RTM) is a bridge that connects observations and theoretical radiation and is based on the radiative transfer equation; as a result, RTMs are widely used in atmospheric remote sensing, such as the calibration of satellite observations, inversion algorithms, and data assimilation [15,16,17]. Clough et al. [18] assessed several publicly available RTMs and their improvements, noting that RTMs can be well applied to the development of inversion algorithms and weather forecast models. The consistency of TB simulations and observations can be used to evaluate the quality of satellite observation data [15,16]. Hewison et al. [19] compared the simulation ability of four commonly used microwave absorption models for ground-based microwave radiometer observations and suggested that these models offer a high accuracy for MWRP calibration. Hence, the RTM has been used as an auxiliary tool to evaluate the data quality of TB observations for MWRPs located in China [20,21,22,23]. Moreover, Wang et al. [14] found that TB observations in certain MWRP channels exhibited significant drift by comparing them with simulated TB observations derived from an RTM. These then reverted to their normal state after an absolute calibration with liquid nitrogen.
The RTM is independent from the MWRP calibration process; thus, the simulated microwave TB can be regarded as an independent reference with which to check the quality of the observed TB from an MWRP. To obtain a more accurate TB simulation, the input parameters for the model are key. Generally, the RTM inputs, including atmospheric pressure, temperature, and humidity profiles, derive from conventional radiosonde measurements, which take place twice a day. Relative to second-level TB MWRP observations, it is difficult to continually monitor the operational state of an MWRP within 24 h solely using the limited spatial-temporal radiosonde profile. With the development of computer and numerical models, an increasing amount of reanalysis data with a high spatial–temporal resolution is available, such as ECMWF hourly ERA5 with a lat-lon grid of 0.25°.
In this paper, in order to better understand the performance of the RTM in MWRP TB simulations, we combined a microwave radiative transfer model with both radiosonde and ERA5 profiles to obtain simulated TB data for an MWRP. We then compared these with TB observations to investigate the influence of atmospheric profile inputs on TB simulations and analyze the quality of the observed TBs for three MWRPs located in North China. The data and model used in this paper are introduced in Section 2. Section 3 presents the comparisons of the simulated and observed TB data for the three MWRPs. Various discussions are presented in Section 4, and finally, the summary is presented in Section 5.
2. Data and Model
2.1. Data
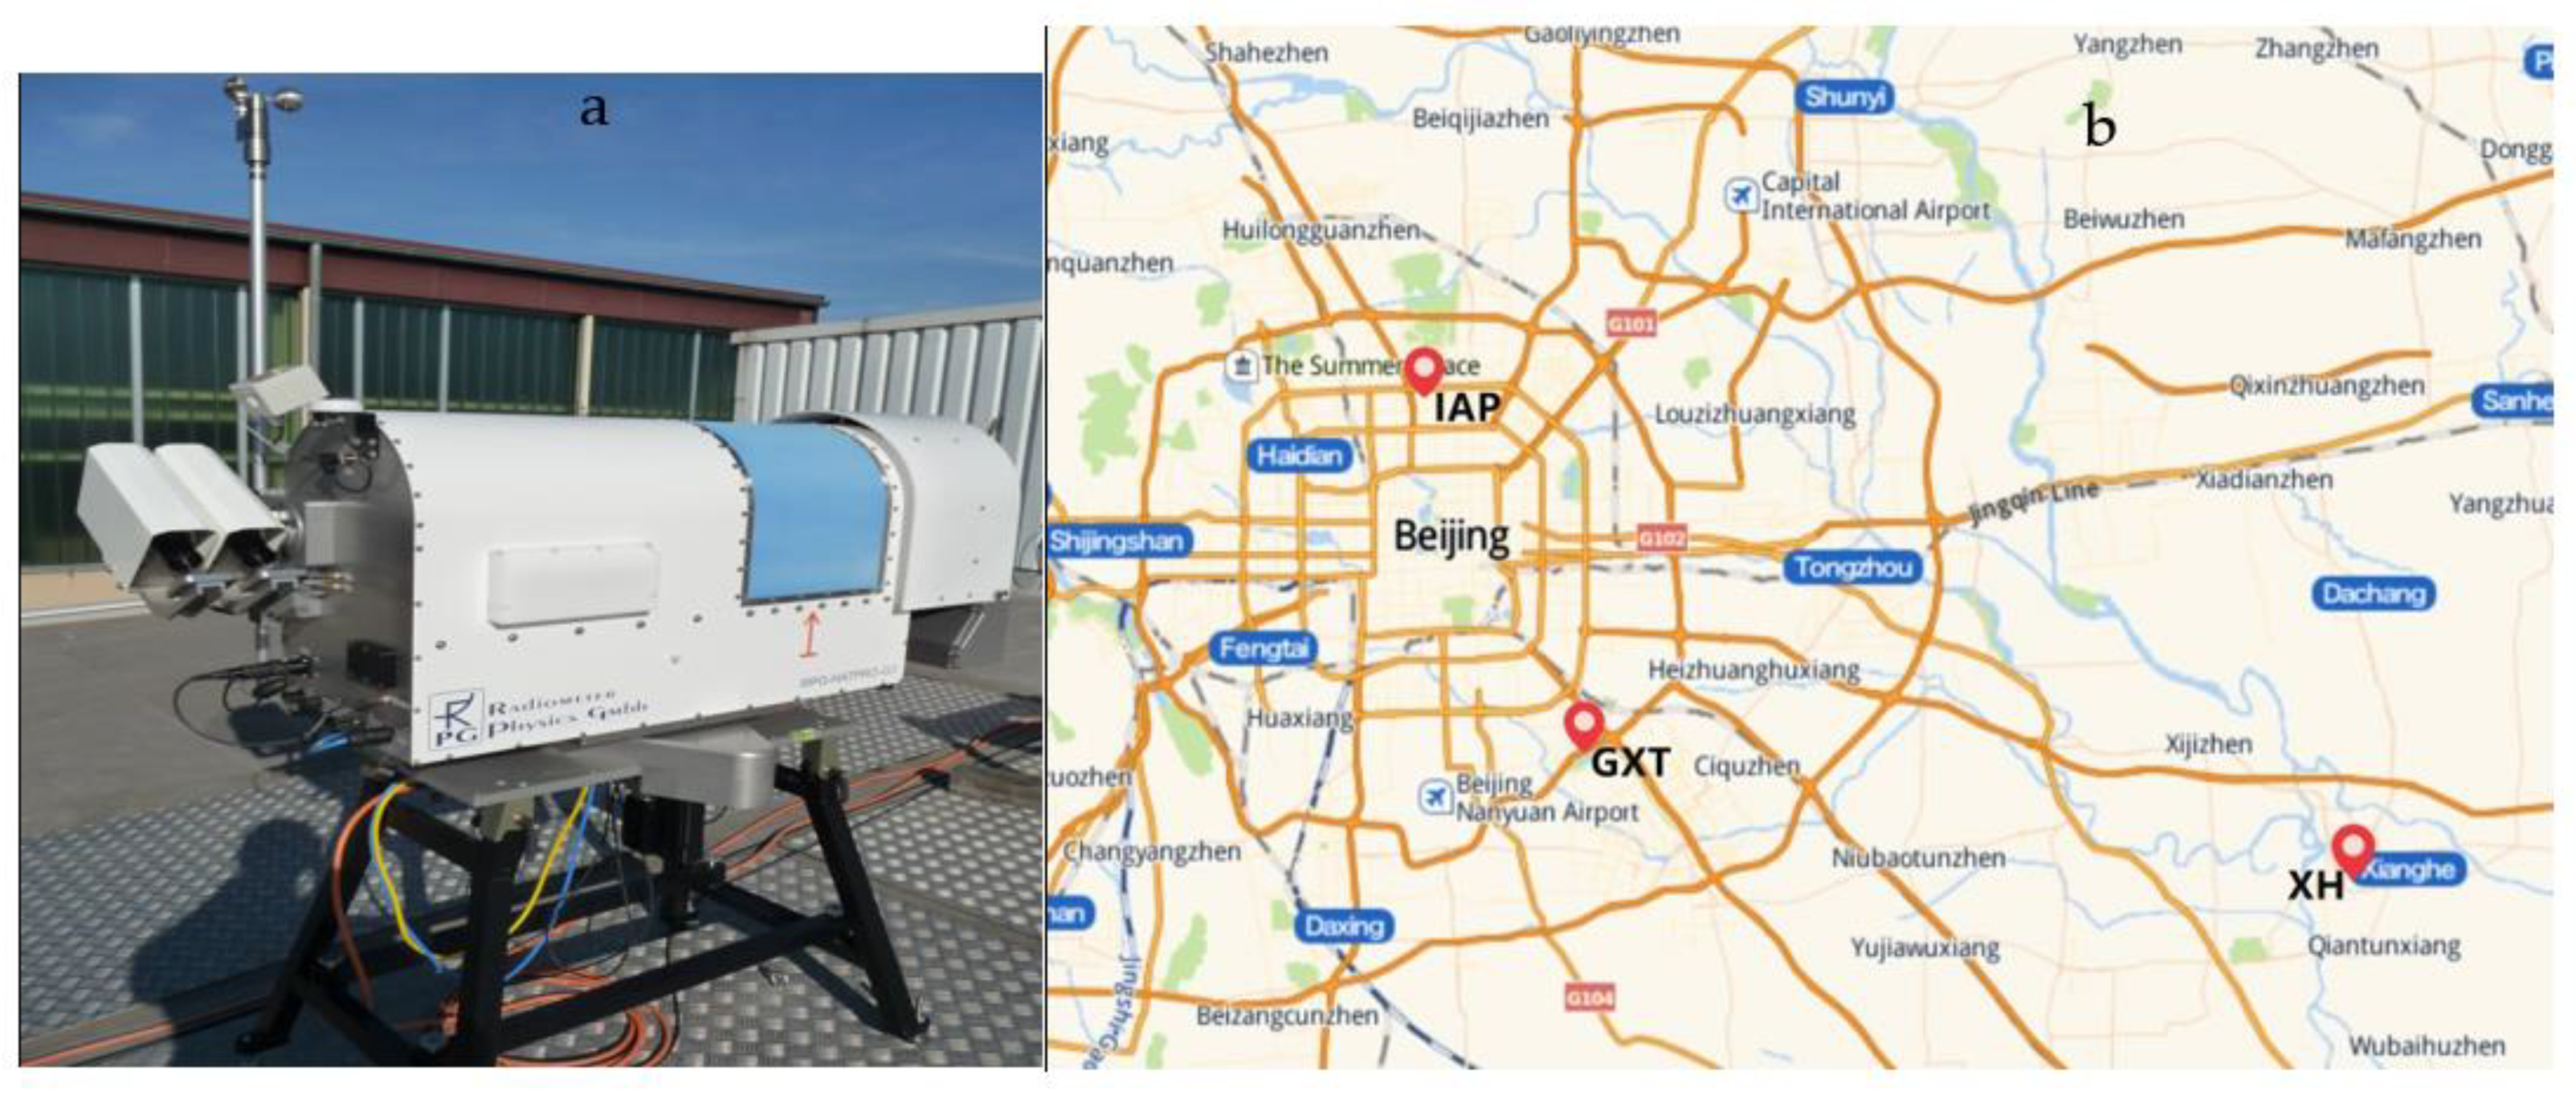
The multichannel TB observations from 2019 were obtained from three MWRPs located in North China. The three MWRPs are of the same type: the RPG-HATPPRO, produced by Radiometer Physics GmbH (RPG), Meckenheim, Germany. An RPG-HATPPRO (as shown in Figure 1a) is a ground-based profiling radiometer [24] that mainly uses the microwave absorption of water vapor and oxygen in the atmosphere to retrieve atmospheric humidity and temperature profiles. The RPG-HATPPRO features 14 channels. The central frequency range of the first seven channels is 22.24–31.4 GHz, which is the water vapor absorption line/window band. The channels in this range are known as the water vapor channels and are used to retrieve the humidity profile. The other seven channels cover the frequency range 51.26–58 GHz, i.e., the oxygen line band. These are known as the temperature channels and are mainly used to retrieve the atmospheric temperature profile. The instrument requires absolute calibration using liquid nitrogen once every 6 months to ensure the quality of the TB data. Generally, the ground-based radiometer adopts a vertical observation mode in the zenith direction, receiving a set of TB data every 1–2 s and generating retrieved atmospheric temperature and humidity profiles approximately every 10 s. Such high temporal-resolution atmospheric profiles can compensate for the lack of conventional radiosonde profile data, which are obtained twice a day; thus, these profiles are crucial for monitoring temporal variations in the vertical structure of atmospheric temperature and humidity.
As Figure 1b shows, the three MWRPs used in this paper are located as follows: at the national comprehensive meteorological observation and test base (GXT) (116.47°E, 39.80°N) in southern Beijing; the Institute of Atmospheric Physics, Chinese Academy of Sciences (IAP) (116.38° E, 39.98° N) located in northern Beijing; and Xianghe Observatory of Whole Atmosphere (XH) (116.96°E, 39.75°N) located in Xianghe town, Hebei Province, China. Among them, the IAP in urban areas is approximately 20 km from the GXT, and the XH in suburban areas is approximately 42 km from the GXT.
In this paper, we mainly used MWPR observations from 2019, including multichannel TB data from the MWPR at the IAP and XH sites from January to December 2019. The TB observations from the GXT site ran from January to July 2019 as the MWPR moved site in August 2019. It is important to note that, during the TB observations in 2019, each MWPR was calibrated twice using liquid nitrogen: once at the end of 2018 and again in the middle of 2019, as a period of approximately 6 months is required.
In order to obtain TB simulations, atmospheric profiles including pressure, temperature, and humidity profiles must be provided as inputs for the radiative transfer model. In this study, we used atmosphere profiles from both radiosonde and reanalysis data. The Beijing radiosonde (No.54511) is launched at the GXT site twice a day, which is also the nearest operational radiosonde measurement to the XH and IAP sites. Therefore, only the Beijing radiosonde measurement was used as an input profile for the model. Considering the limited atmospheric profiles from the radiosonde, the hourly reanalysis data and 0.25° gridded ERA5 from ECMWF were used to provide more atmospheric profiles. The ERA5 data were obtained from the ECMWF climate data store website (https://cds.climate.copernicus.eu/cdsapp#!/dataset/reanalysis-era5-pressure-levels?tab=overview, accessed on 15 October 2021) [25].
Combining these atmospheric profiles with a radiative transfer model, we were able to obtain simulated TBs for 14 RPG-HATPPRO channels. Thereafter, the simulated TBs were matched and compared with the observed TBs from three sites to analyze the influence of atmosphere profiles on the simulation and evaluate the quality of the observed TBs at different locations.
2.2. Model
To enhance the calculation efficiency of the simulated TBs for the MWRP, a fast microwave transfer model, known as the MWRT and developed by Liu [26], was used in this study. The MWRT uses the four-stream discrete ordinate method (DOM) process radiative transfer equation, including the water vapor and oxygen absorption models described by Rosenkranz [27,28] and Liebe et al. [29]. Generally, a DOM with a large number of streams can calculate the radiation transfer process accurately and stably, but the corresponding calculation is huge, especially when it includes the processing of Mie-scattering and phase function, which greatly affect the calculation efficiency of the model and hinder the practical application of the RTM. In a previous model study, Liu [26] mentioned that the MWRT is sufficiently fast and accurate for practical use compared with 32 stream polarized RTMs. Currently, the MWRT can effectively resolve microwave signals in cloudy conditions and precipitation, and can even operate in snow with large non-spherical ice particles [30].
The required input variables for the MWRT are frequency, the incident angle of microwave devices, and atmospheric parameters, including the atmospheric temperature, the humidity profile, and the hydrometer profile for the cloud and precipitation; the outputs are the simulated microwave TBs at the given frequency.
3. Results
In order to quantitatively describe the difference between the simulated and observed TBs, conventional statistical parameters were introduced, i.e., mean bias (MB), standard deviation (STD), and correlation coefficient (CC). As is well known, MB can reflect the total differences between the simulation and observation for matching samples, STD can reflect the variation or dispersion of the simulation and observation, and CC can describe the linear consistency of the simulation and observation of all matching samples.
To match the simulated TBs derived from the radiosonde (RS) and ERA5 profiles, we selected the average value of 15 min TB observations before and after the profile times. In order to avoid the influence of cloud and precipitation, matching pairs under clear-sky conditions were chosen for the comparisons in this study. The rain sensor mounted on the MWPR was used to identify precipitation, and humidity profiles from the radiosonde and ERA5 were used to detect cloud when the relative humidity in the air was greater than 85% [31]. Thereafter, the matching pairs from clear-sky conditions were formed after removing approximately 5% of samples with a TB difference bias greater than the mean bias ±3σ, where σ is the standard deviation.
3.1. Comparison of Simulated and Observed Brightness Temperatures
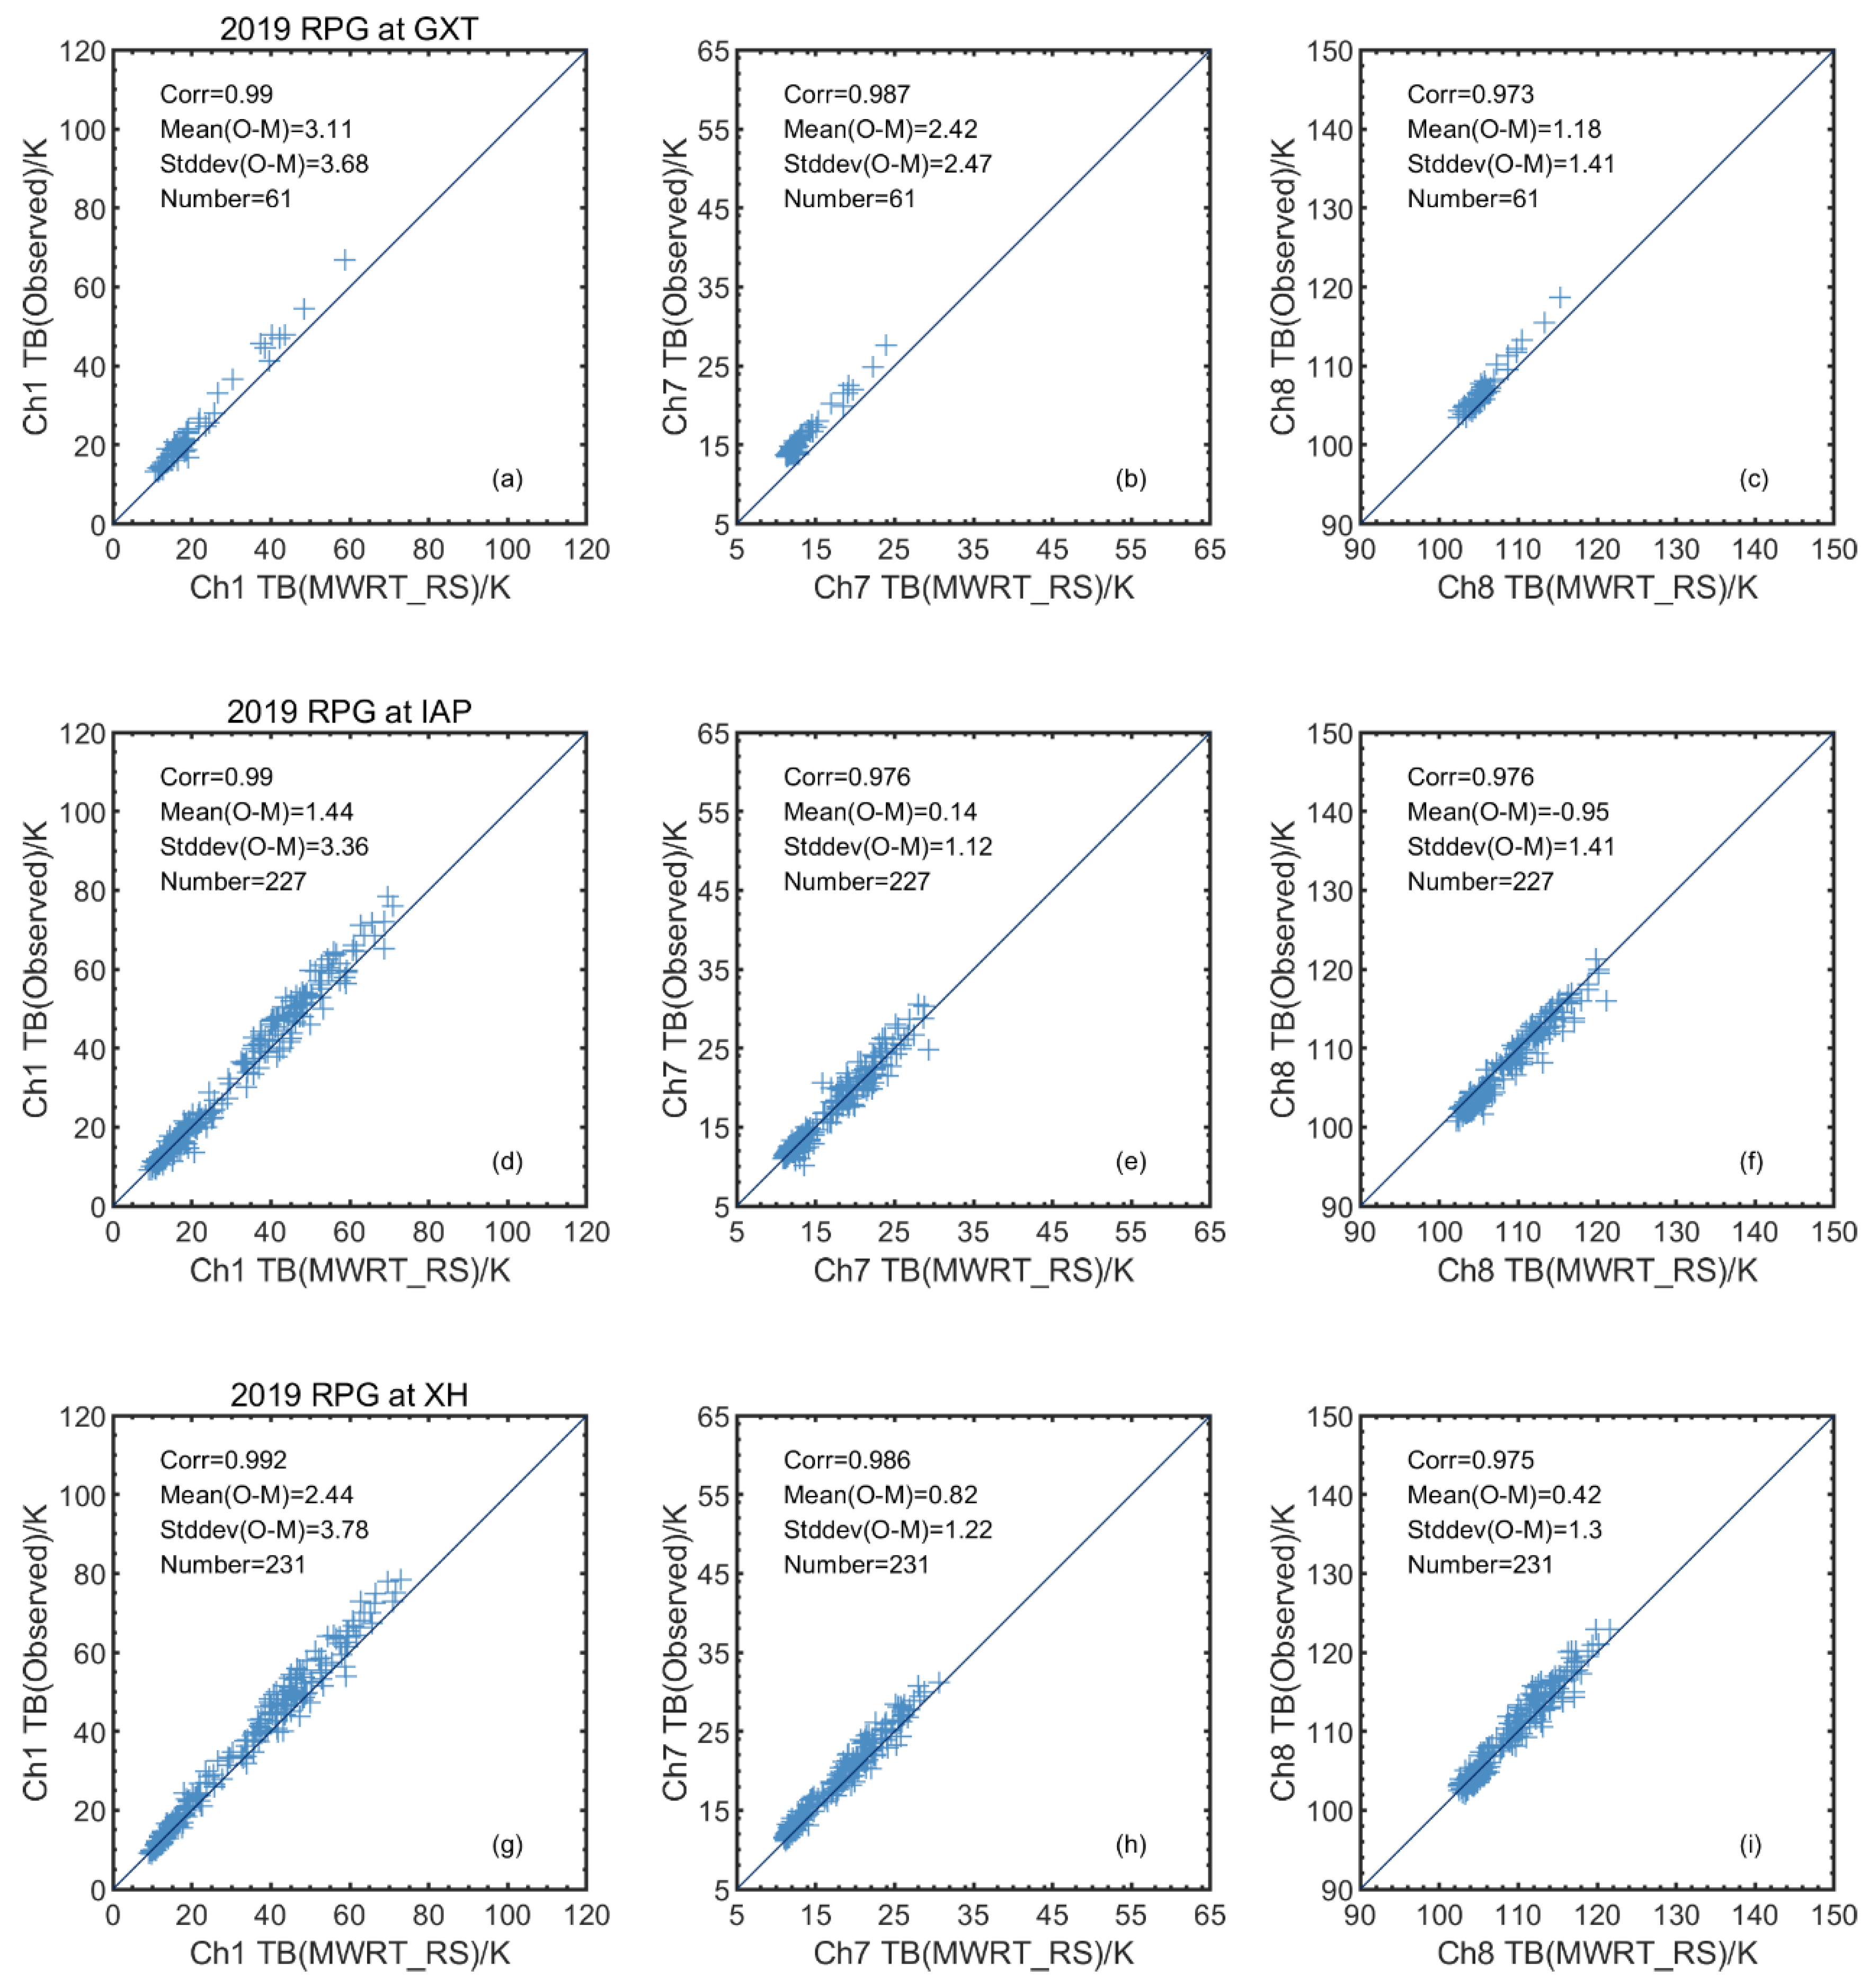
Firstly, the scattering plots of the observed TBs from the three MWRPs at the GXT, IAP, and XH sites and the corresponding simulations using the radiosonde profiles are presented in Figure 2. The corresponding statistical parameters are also provided. Herein, water vapor channel 1 (Ch1, 22.24 GHz) and 7 (Ch7, 31.4 GHz), and temperature channel 8 (Ch8, 51.26 GHz) were chosen for comparison and are shown from left to right in Figure 2. Because discontinuous MWPR observations often occurred at the GXT site, there were far fewer available matching samples with the radiosonde measurements at the GXT site than at the IAP and XH sites. In general, the scattering plots at the three sites demonstrate that the simulation and observation were fairly consistent in the three channels. This is especially clear in the correlation coefficient of up to 0.99 in Ch1, and in the fact that most of the matching samples were concentrated on the blue symmetry axis of Y = X for the IAP and XH sites, except for the slight systemic bias for Ch1 and Ch7 at the GXT site.
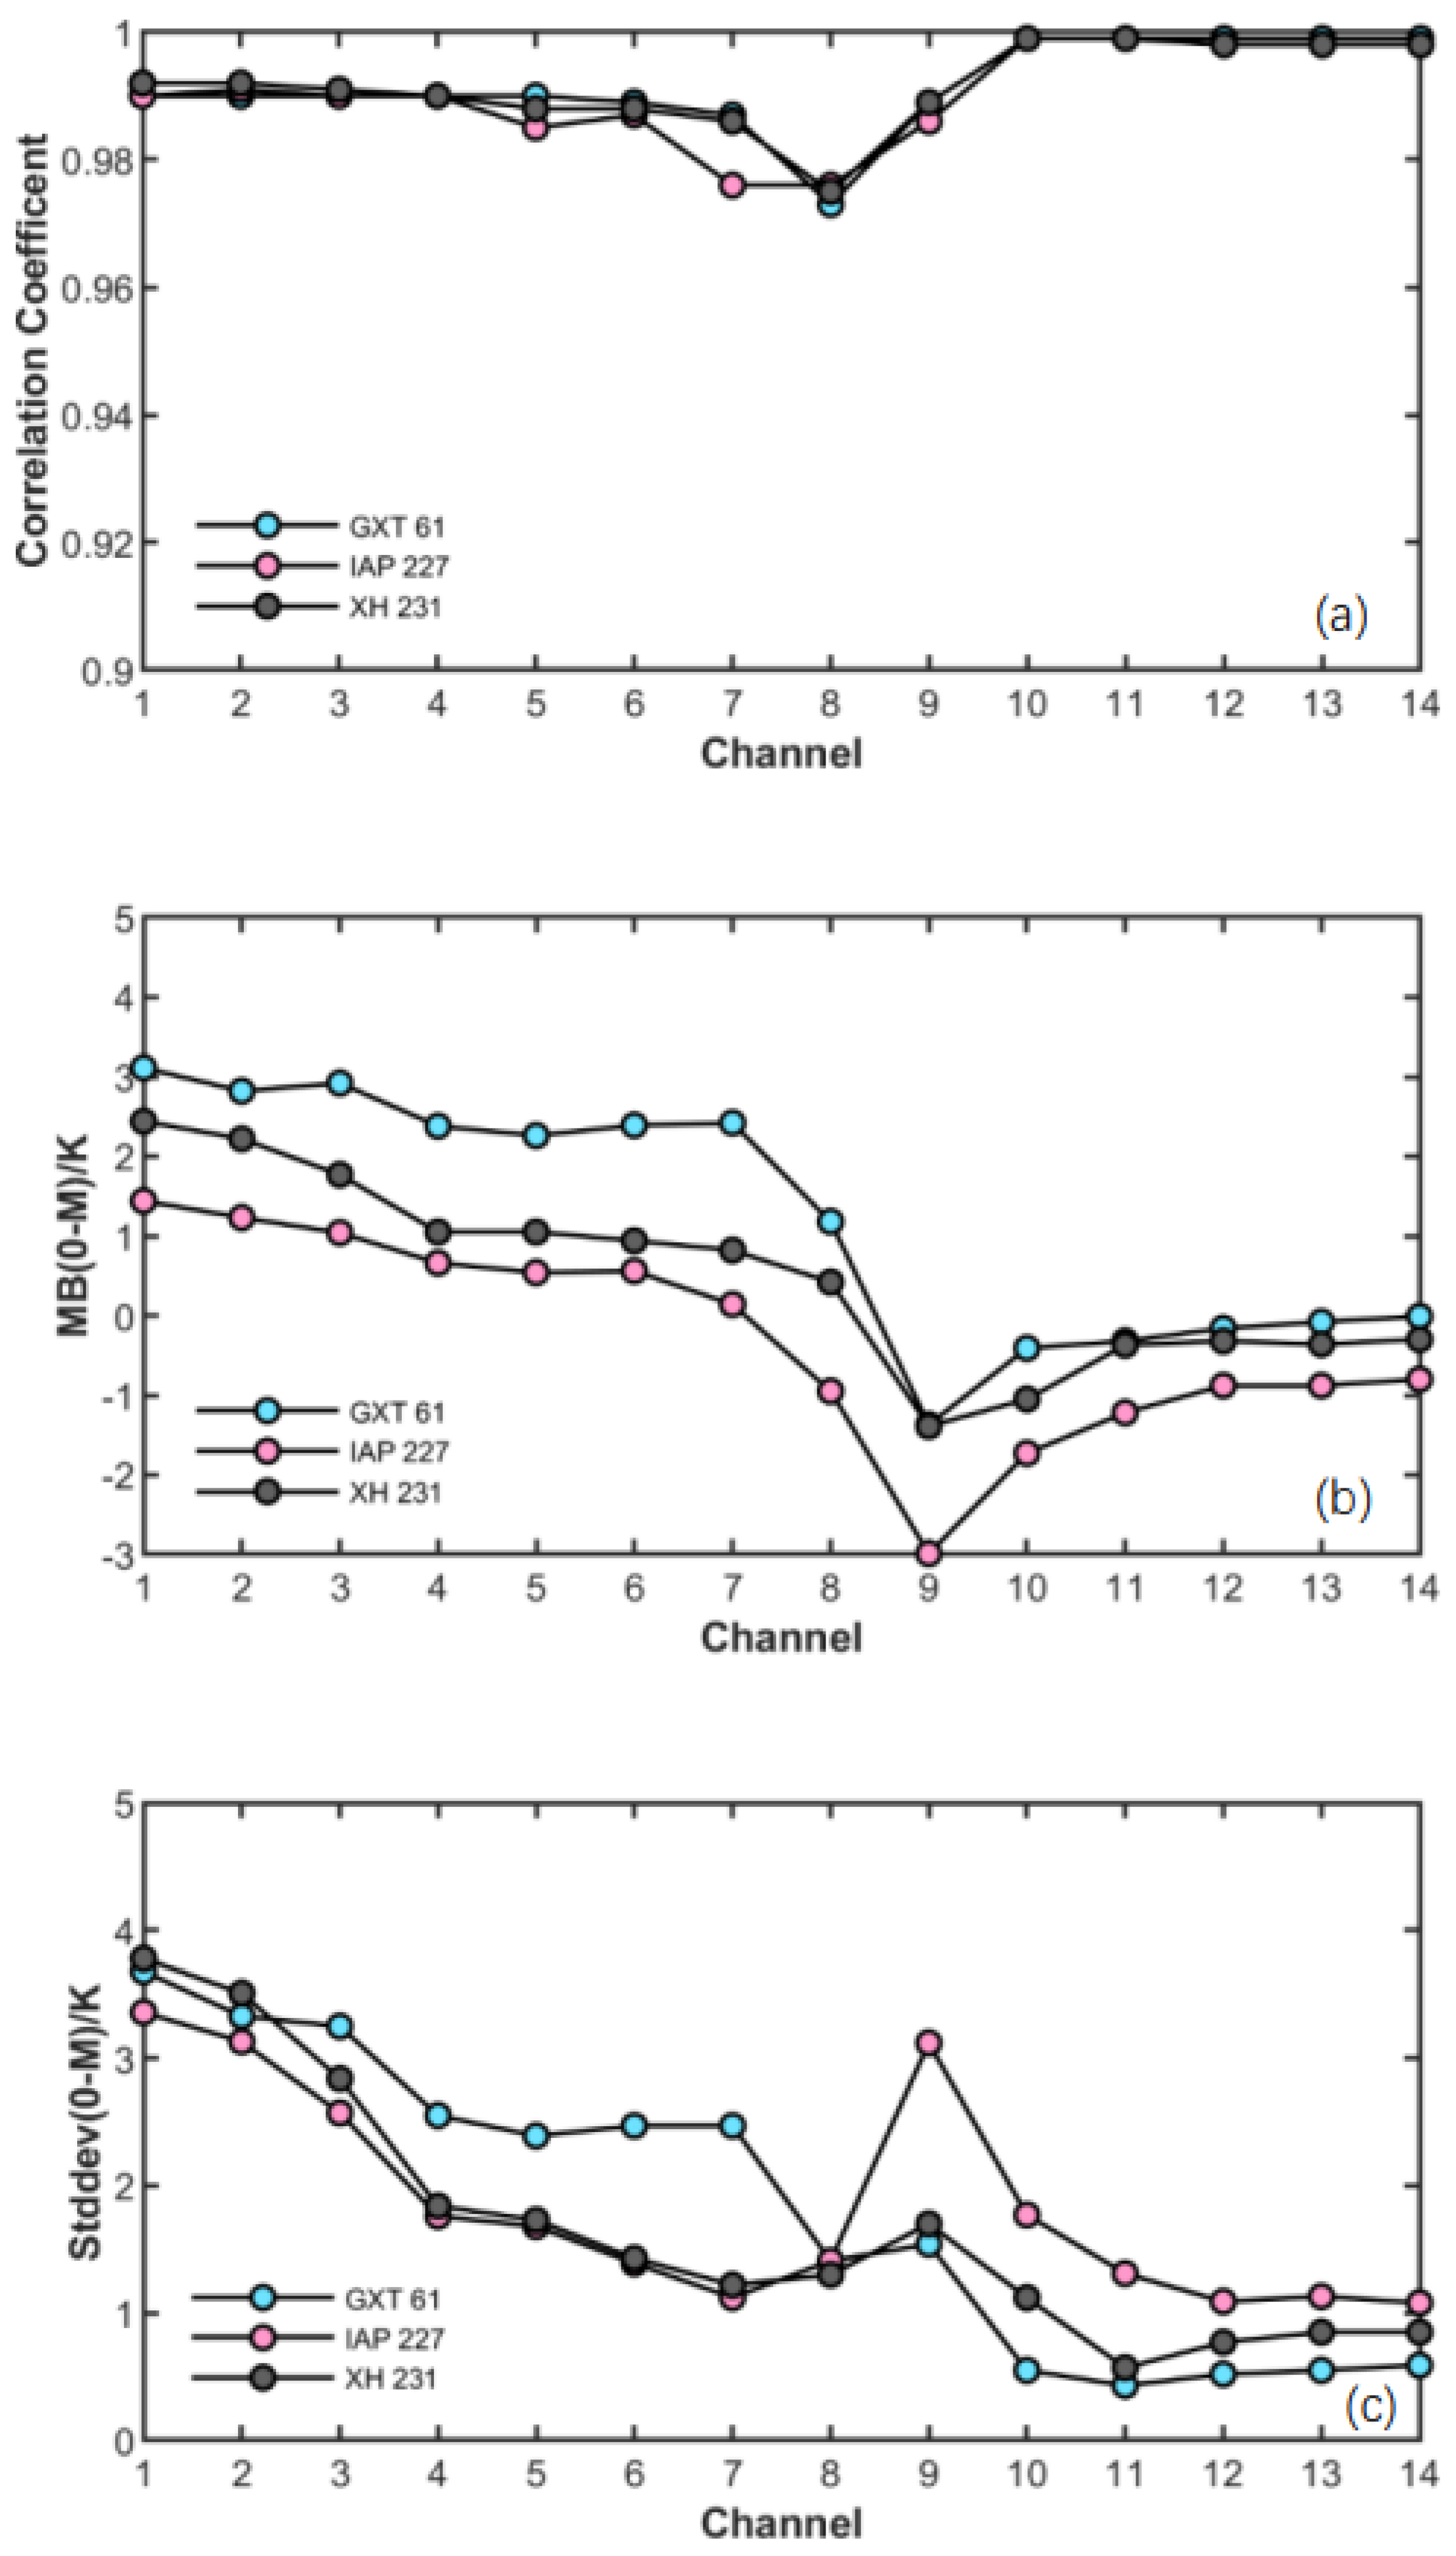
To quantitatively describe the difference between the simulation and observation TBs at the three sites, the statistical parameters for the 14 channels of the MWRP are compared in Figure 3. The correlation coefficient (CC) in Figure 3a firstly shows that the simulations were more consistent with the observation in the water vapor channels Ch1–Ch4 and temperature channels Ch10–Ch14, with an almost identical CC close to 1.0 at the three sites, excepting the slight decreased CC in Ch7 and Ch8. The Beijing radiosonde was the closest to providing actual atmospheric profiles for the three MWRPs sites, and the TB simulations for the GXT MWRP was in approximately the same place, with the IAP or XH sites being located around 20 km and 42 km away, respectively. The high level of consistency between the simulated TBs derived from the radiosonde profiles and the observed TBs at the three sites implies that the MWRT model performs well in terms of describing MWPR observations.
The temperature channels at a lower frequency, such as Ch8 (51.26 GHz) and Ch9 (52.28 GHz), exhibited slightly lower CCs at the three sites. Cimini et al. [32] reported that the larger uncertainty in the 50–54 GHz channel TBs (up to 2 K) was due to the line-mixing parameter uncertainties in the microwave absorption model. Such discrepancies in Ch8 and Ch9 were noted in our previous assessments of three RTMs on the MWRP, indicating that the simulation ability of the models in both Ch8 and Ch9 needs to be improved [20]. Temperature channels at higher frequencies, such as Ch10 to Ch14, are in the opaque oxygen region and are not sensitive to absorption parameters; thus, the consistency of the simulated and observed TBs were relatively good, with CCs close to 1.0 at the three sites.
Figure 3b presents the mean bias (MB) of the simulated and observed TBs at the three sites. Firstly, the MB of the TB difference for the water vapor channels (Ch1–Ch7) at the XH and IAP sites were smaller than those at the GXT site; for instance, the MBs at the XH and IAP sites were essentially within 2 K, and were even close to zero at the IAP site, while the simulations were somewhat lower than the corresponding observations (by 2–3 K) at the GXT site. The corresponding scattering plots in Figure 2a,b also show that the observed TBs in Ch1 and Ch7 were systematically higher than the simulation results at the GXT site, while the corresponding comparisons at the XH and IAP sites were more concentrated on the blue symmetry axis of Y = X.
For the temperature channels, the MB of the TB difference at the GXT site was smallest, which was very close to that of the XH site; however, this value was somewhat larger at the IAP site. The most significant MB values were found in Ch9, i.e., a clearly negative MB of around 3 K at the IAP site and 1 K at the XH and GXT sites; this then gradually decreased to zero for Ch11–Ch14 at the XH and GXT sites, although the IAP simulations remained higher than the observation by approximately 1 K.
From the STD distribution in Figure 3c, it can be seen that the STDs in the water vapor channels decreased with increasing frequency, and the STDs in the temperature channels were essentially within 1~2 K, except for the significant increase in Ch9. For the three sites, the STDs of the seven temperature channels for the MWRP at the GXT site were obviously lower than those at the XH and IAP sites, which is related to the simulation results being derived from radiosonde profiles at the GXT site. The higher STDs and larger MBs in the water vapor channels of the MWPR at the GXT site demonstrate that the observation quality in those channels needs improvement.
3.2. Influence of Atmospheric Profiles on Simulation Results
The conventional radiosonde provides atmospheric profiles twice a day; thus, there is a limited quantity of samples that match with the second-level TB observations from the MWRP. To better understand the influence of the input atmospheric profiles on the TB simulation, we introduced ECMWF hourly reanalysis ERA5 data with a 0.25° grid to provide more atmospheric profiles for the MWRP simulations. As compared with the radiosonde, ERA5 can supply hourly data 24 times a day thus providing more matching TB observations. In addition, using 0.25° grid data can provide closer atmospheric profiles for the three MWRPs at different locations, instead of solely using single-point atmospheric profiles from the Beijing radiosonde at the GXT site. The temperature and humidity profiles provided from the ERA5 hourly data cover the vertical altitude from 1000 hPa to 1 hPa with 37 pressure levels.
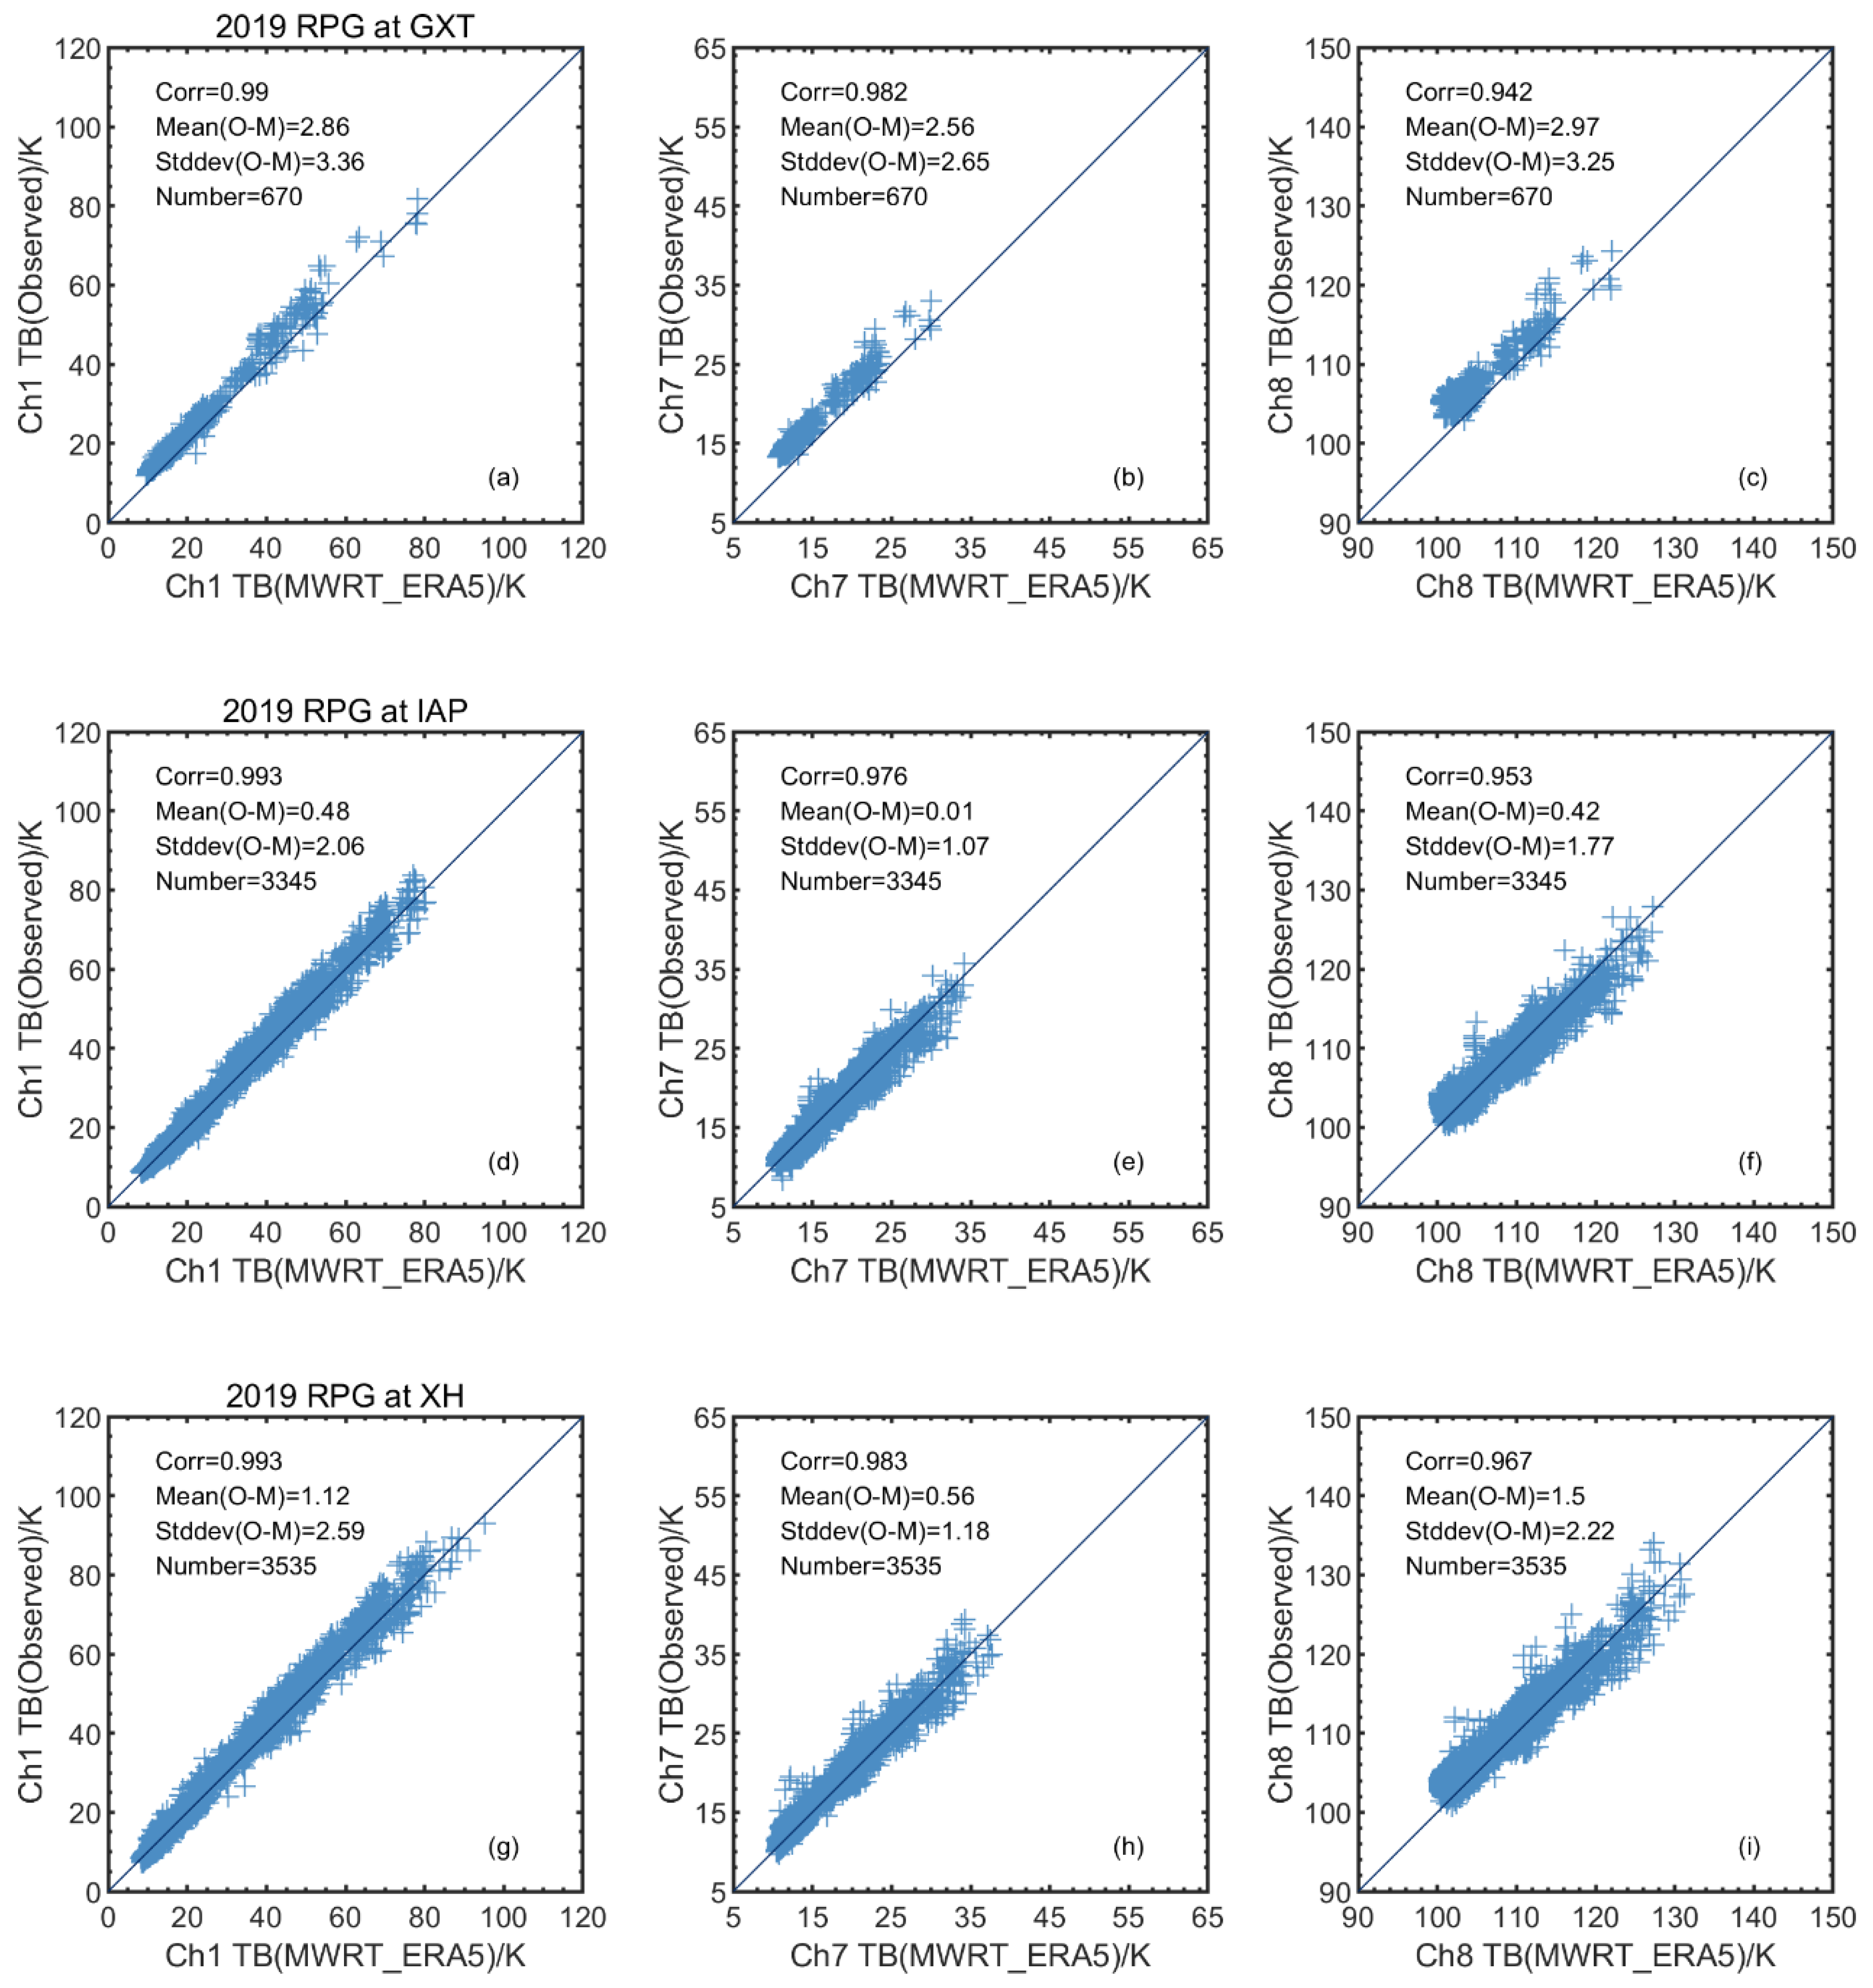
By combining the ERA5 profiles with the MWRT model, we can obtain simulated TBs for the 14 channels of the MWRP. Similar to Figure 2, Figure 4 shows the scattering plots of the simulated TBs using ERA5 profiles and the observed TBs in Ch1, Ch7, and Ch8 of the MWRPs at the GXT, IAP, and XH sites. Notably, only the matching samples under clear-sky condition are compared. The most obvious difference is that there are 10 times the amount of available matching samples in Figure 4 than in Figure 2; despite this, the corresponding statistical parameters and distributions of the simulated and observed TBs in Figure 4 are relatively close to those in Figure 2, which indicates that the simulations derived from ERA5 are more consistent and can better monitor the MWRP observations on all days. In addition, the simulations and observations are more concentrated on the blue symmetry axis of Y = X for the IAP and XH sites, while there was a systemic bias for Ch1 and Ch7 at the GXT site, which is a similar pattern to that seen in Figure 2.
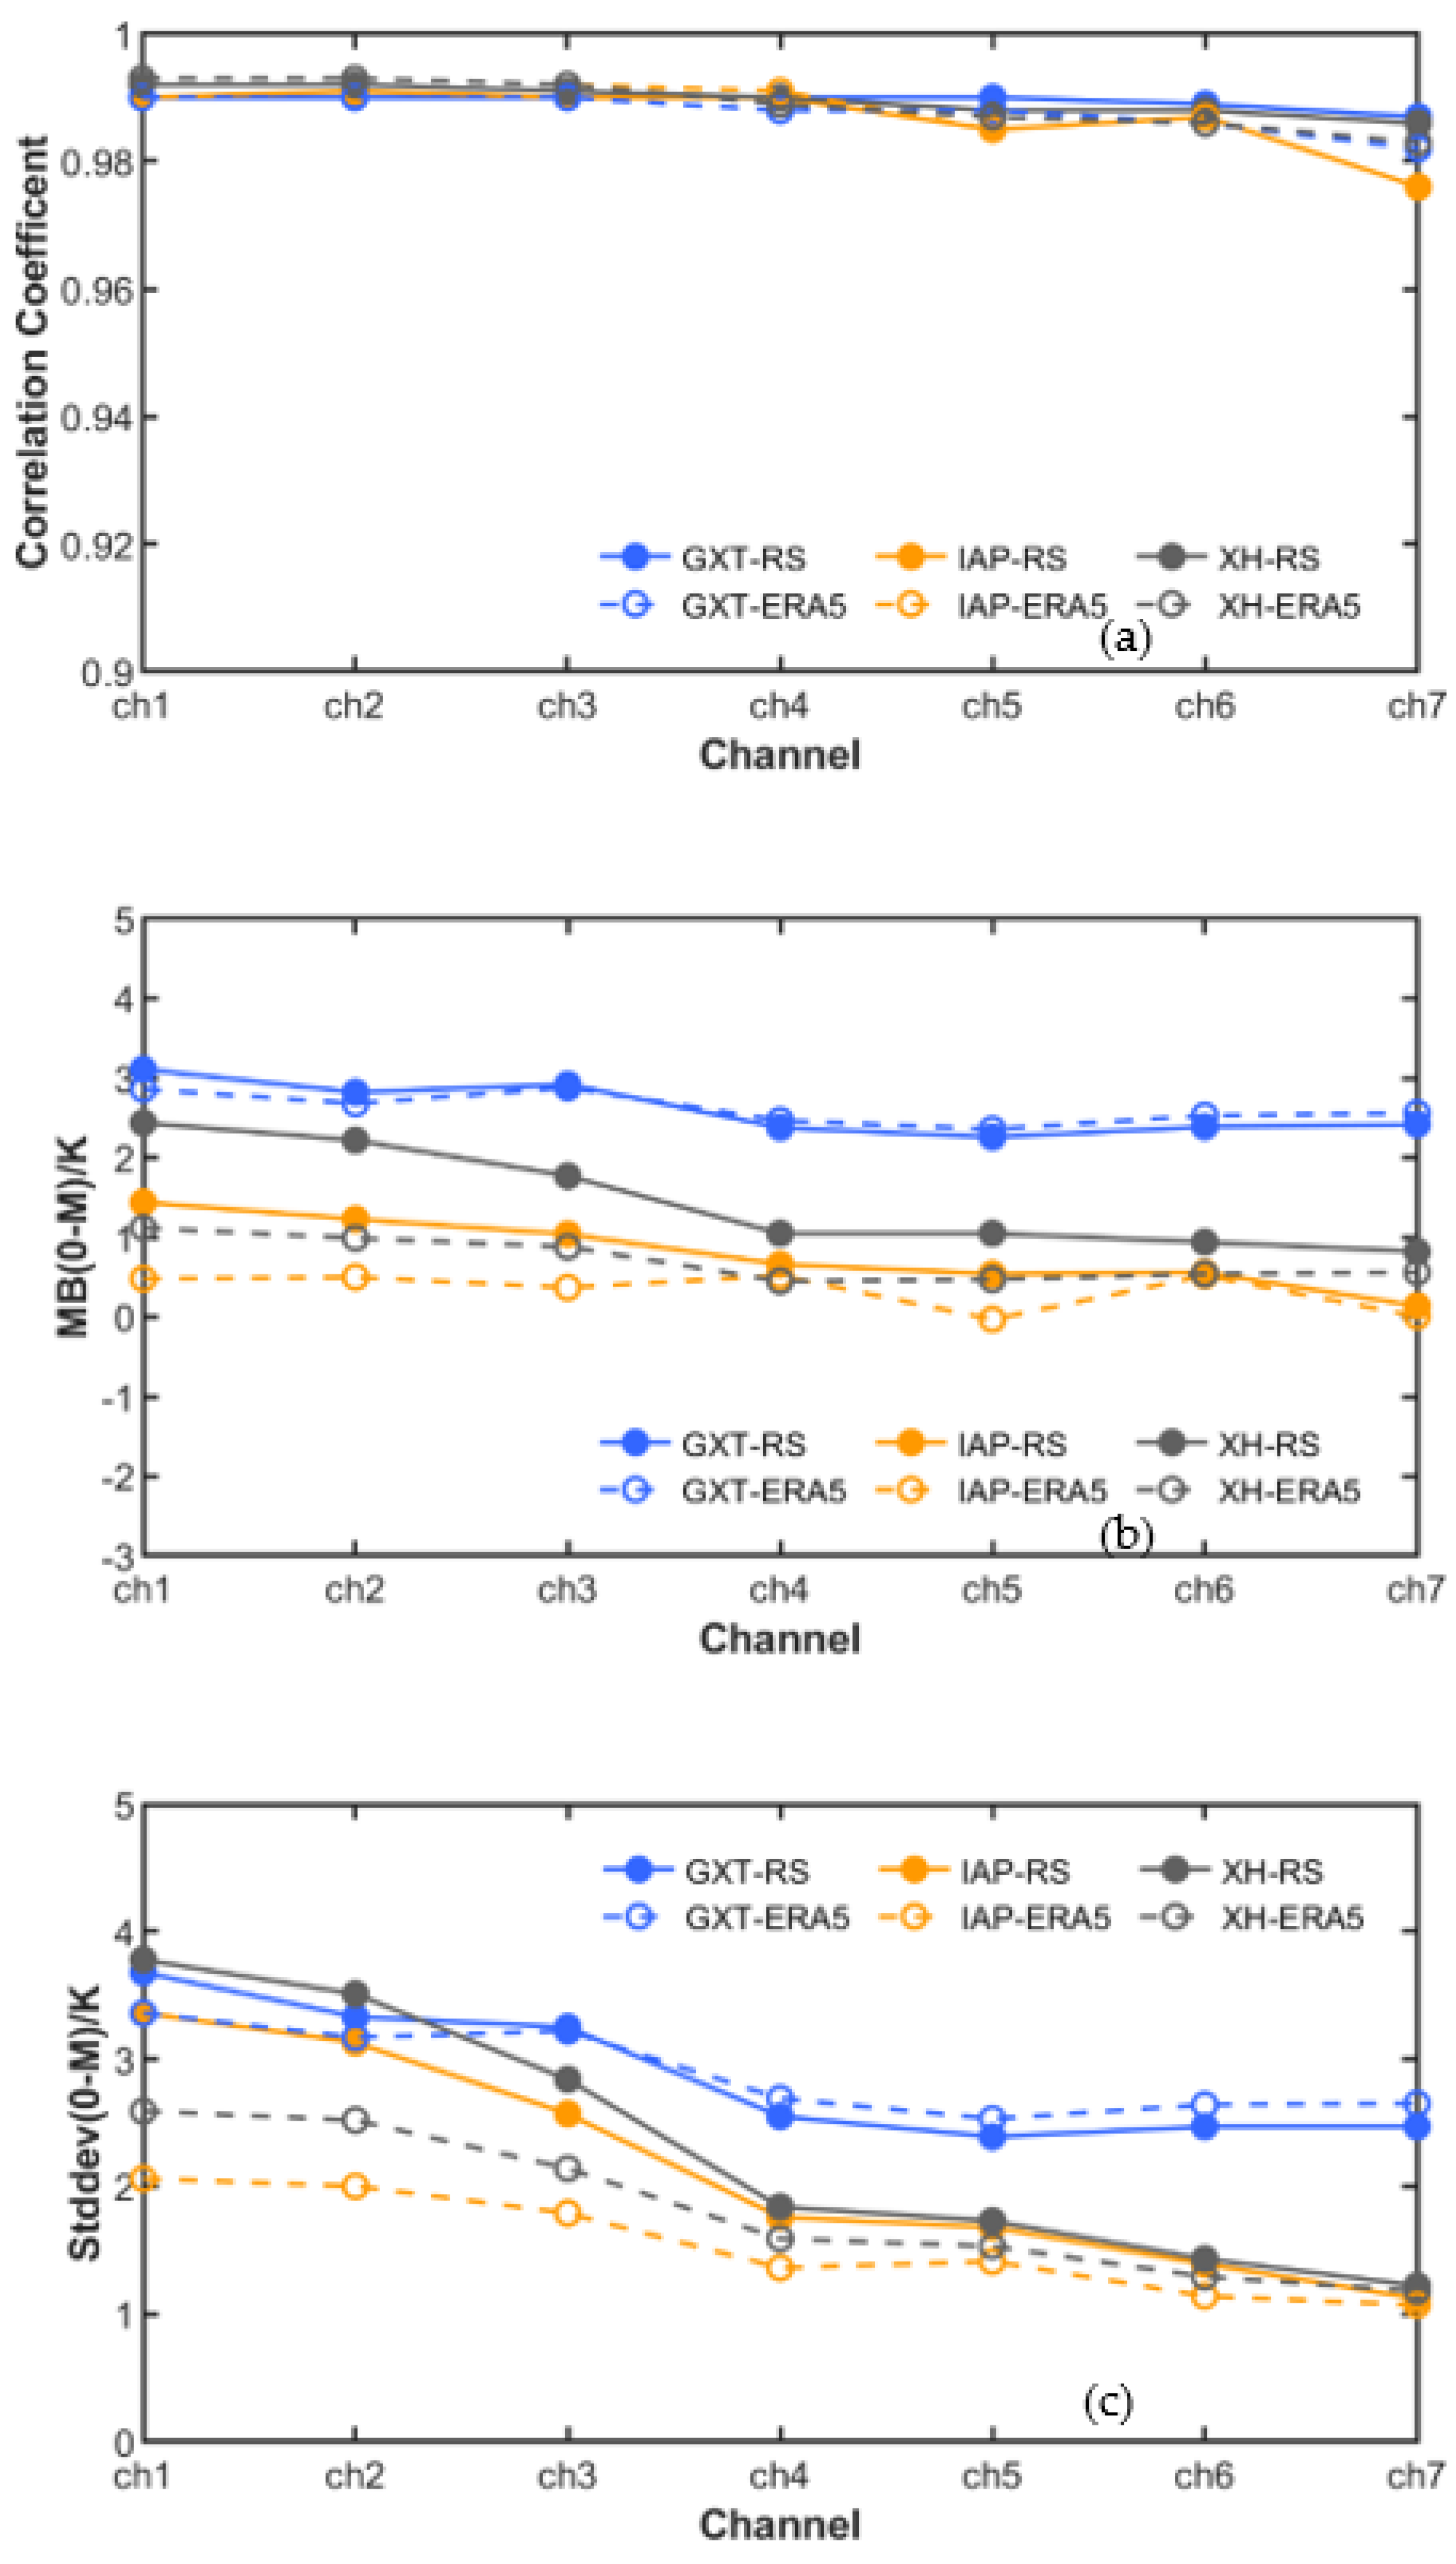
In order to directly understand the influence of the atmospheric profile on the simulated TB, the statistical parameters for the simulated TBs derived both from the radiosonde and ERA5 profiles with the corresponding observed TBs at the three sites are further compared in Figure 5. Considering that the ERA5 profiles can provide more accurate humidity information than when solely using data from the radiosonde at the XH and IAP sites, here, we focus on the comparisons of the water vapor channels (Ch1–Ch7) of the MWRPs located at the GXT, IAP, and XH sites.
Firstly, the CCs of the observations and ERA5 simulations (shorted to ERA5 hereafter) and those of the radiosonde simulations (shorted to RS hereafter) are compared in Figure 5a. It can be seen that, at the three sites, both CCs are almost identical and close to 0.99 in the seven channels, except for the obvious reduction in Ch7 for the IAP MWPR. In addition, it can be seen that the CC decreased slightly with increasing frequency. At the GXT site, the CCs for ERA5 were relatively close to the corresponding CCs for the RS, which is reasonable because the ERA5 data are assimilated into the radiosonde measurements at the GXT site. AT the XH and IAP sites, the CCs for EAR5 were slightly more positive than those for the RS, especially in Ch7 for the IAP MWPR, which demonstrates the benefits of the space-closer humidity profiles provided by ERA5.
The MB variations for both simulations (ERA5 and RS) and observations from the seven MWRP channels from three sites are shown in Figure 5b. At the GXT site, the MB for ERA5 was almost identical to the corresponding MB for the RS, which exhibited the largest MB, close to 3 K. At the XH and IAP sites, the MB for ERA5 was smaller than for the RS in seven channels; in particular, this was reduced by around 1 K in Ch1 to Ch3, which reflects the positive influence of the ERA5 profiles on the TB simulations in the water vapor channels for the XH and IAP sites, which are located away from radiosonde sites. In conclusion, similar to Figure 3b, the MBs for ERA5 at the XH and IAP sites were clearly lower than those at the GXT site; for example, the MBs at the XH and IAP sites were essentially within 1 K, and were even close to zero at the IAP site, while the MB at the GXT site was close to 3 K. The corresponding distributions of the simulated and observed TBs shown in Figure 4a,b clearly demonstrate that the observed TBs for Ch1 and Ch7 were systematically higher than the simulation results at the GXT site.
Finally, the STD comparisons for both simulations (ERA and RS) and observations at the three sites are shown in Figure 5c. In the seven channels, the STD for ERA5 was smaller than for the RS, especially at the XH and IAP sites, which demonstrates the contribution of the space-closer ERA5 profiles to water vapor channels simulations for MWRPs located away from the radiosonde stations.
To better understand the temporal variability of the TB differences of the simulation and observations and the influence of absolute calibration using liquid nitrogen on TB observations, monthly mean statistical parameters (MB and STD) at the three sites are compared in Figure 6. Because there were far fewer matching samples for the TB simulation from the radiosonde profile, we used matching pairs from simulations from the ERA5 profile and the observations in 2019 for the three MWPRs. On the basis of the absolute calibration history, the MWPR at the GXT site was calibrated on 11 November 2018 and 21 May 2019, and the MWPRs at the XH and IAP sites were calibrated on 14 December 2018 and 20 June 2019. Herein, we focused on the monthly variation in TB difference in water vapor channel 7 (Ch7). The changes in the MB at the three sites, shown in Figure 6a, indicate that the MB at the GXT site was the largest and was more consistent at 3 K from January to July, while the MBs at the IAP and XH sites were closer and lower, and varied within 1 K. In addition, there were small reduced MBs after June, 2019 at three sites, which might be attribute to the second absolute calibration of the MWPRs in 2019. A similar variation is seen for STD in Figure 6b, i.e., the STD at the GXT site was greater than those at the IAP and XH sites, and there was a slight increase in the summer and decreased in fall and winter, which might be related the humidity change across seasons.
4. Discussions
In this paper, we firstly used radiosonde profiles as the RTM input to obtain TB simulations. The Beijing radiosonde (No. 54511) located at the GXT site was the closest to providing accurate profiles for the MWRPs located at the XH and IAP sites; hence, the simulated TBs for the MWRPs at the three sites were the same, and were compared with the corresponding MWRP TB observations. Theoretically, the model simulations should be closer to the MWRP TB observations at the GXT site; however, the TB differences in the water vapor channel shown in Figure 2 and Figure 3 demonstrate a more obvious mean bias variation (2~3 K) at the GXT site than at the other two sites. Hewison et al. [19] assessed the performance of microwave absorption models for a ground-based microwave radiometer under clear-sky conditions and reported that there was a simulation bias of approximately 0.5 K in the water vapor channels (22–31.5 GHz), which mainly resulted from the model itself. The TB differences between the simulations and observations in the water vapor channels for the MWRPs at the XH and IAP sites in this paper are essentially within 1 K. After taking model bias (~0.5 K) into account, the remaining bias might have been caused by the difference in geographical location between the MWRP sites and the radiosonde launch site. There was essentially no difference between the positions of the radiosonde and the MWRP at the GXT site; therefore, the significant bias of approximately 2–3 K between the simulations and observations in the water vapor channels for the MWRP at the GXT site indicates that the biased estimation was the result of the observation data themselves (except for the 0.5 K model bias), which means that the observation quality of the water vapor channels for the MWRP at the GXT site needs to be further improved. When using the ERA5 profiles as the RTM input, we also found similar bias issues, i.e., the TB bias at the GXT site was more pronounced than those at the XH and IAP sites. Hence, the comparisons of both simulations (ERA5 and RS) and the corresponding TB observations at the three sites indicate that the observation quality of the water vapor channels for the MWRP located at the GXT site needs be improved.
In addition, from the difference in the TB simulations using the radiosonde profiles and observations at the three sites, it was found that the location differences at the radiosonde and MWRP sites affect the TB simulations in water vapor channels, but have little impact on the temperature channels that are insensitive to humidity. To overcome the limited coverage of the radiosonde profiles, we adopted reanalysis ERA5 data with an improved spatial-temporal resolution to obtain more TB simulations. From the comparisons of both TB simulations (RS and ERA5) with the corresponding observed TBs in the water vapor channels of the MWRPs located at the three sites, the benefits of hourly ERA5 profiles can clearly be seen. These include both enlarging matching samples by multiple orders of magnitude and reducing the bias and standard deviation of those MWRPs located away from the radiosonde station.
Therefore, for both atmospheric profile datasets used in this paper, space-closer ERA5 profiles exert a more positive effect on TB simulations in the water vapor channels of the MWRP, and hourly ERA5 profiles can better monitor TB observations over 24 h. This demonstrates that ERA5 hourly profiles can effectively compensate for limited radiosonde profiles and enhance the monitoring ability in terms of the quality of MWRP TB observations, especially for those MWRPs located far from radiosonde stations.
5. Conclusions
Ground-based microwave radiometer profilers (MWRPs) are widely used to provide high-temporal resolution atmospheric temperature and humidity profiles and total water vapor and cloud water contents. The quality of MWRP TB observations is key to retrieving accurate atmospheric profiles. The radiative transfer model is a useful tool to connect TB observations and theoretical radiation, so simulated TBs derived from the model can be used as an independent reference to check the quality of the observed TB.
In this paper, in order to better understand the model performance and the influence of the input atmospheric profile on TB simulations, we combined the RTM with two types of atmospheric profile data: conventional radiosonde data, which are gathered twice a day, and hourly ERA5 reanalysis data. We then compared both TB simulations with the corresponding TB observations from three MWRPs located at the GXT, IAP, and XH sites to investigate the influence of the input atmospheric profiles on the TB simulations and assess the quality of the TB observations for the three MWRPs in 2019.
The distributions and quantitative comparison of the statistical parameters (including correlation coefficient, mean bias, absolute bias, and standard deviation) between the model simulations and the observed brightness temperature revealed the following:
- (1)
- The TB simulations derived from both the radiosonde and ERA5 profiles were very close to the observations in most channels of the MWRPs that we used in this paper (i.e., CC up to 0.99). However, in the temperature channels Ch8 (51.26 GHz) and Ch9 (52.28 GHz), the correlation was weakened and the TB difference bias was obvious, which indicates that the oxygen absorption component in the MWRT needs to be improved for the lower-frequency temperature channels.
- (2)
- The difference in location between the radiosonde and MWRP sites affected the TB simulations in the water vapor channels to a greater extent, but had little impact on the temperature channels with high opacity. The observation quality of the water vapor channels for the MWRP located at the GXT site needs be improved from January to March 2019.
- (3)
- The differences in both TB simulations obtained from the radiosonde and ERA5 profiles and the corresponding observations in Ch1–Ch7 of the MWRPs located at the three sites clearly reflect the benefits of ERA5 hourly profiles. These include enlarging matching samples, and reducing the bias and standard deviation for those MWRPs located away from the radiosonde station.
Compared with the TB observations from the three MWRPs in North China, the preliminary results demonstrate that the radiative transfer model has the potential to monitor the observation quality of MWRPs, especially MWRPs located in rural and isolated areas that cannot rely on regular absolute calibration using liquid nitrogen. The influence of the radiosonde and ERA5 profiles on the TB simulations indicates that ERA5 profiles can compensate for limited radiosonde measurements and enhance the monitoring quality of MWRP observations over 24 h. The work reported in this paper mainly focused on MWPR observations in 2019, and the application effects of both profiles (ERA5 and radiosonde) need further investigation using longer MWRP observation records.
Author Contributions
Conceptualization, W.H. and H.C.; Methodology, W.H. and Y.C.; Software, Y.C. and R.Z.; Validation, W.H. and Y.C.; Formal Analysis, W.H.; Investigation, W.H.; Resources, X.X.; Data Curation, Y.C. and J.L.; Writing—Original Draft Preparation, W.H.; Writing—Review & Editing, W.H. and H.C.; Visualization, Y.C.; Supervision, W.H.; Project Administration, W.H. and P.W.; Funding Acquisition, P.W. All authors have read and agreed to the published version of the manuscript.
Funding
This research was funded by the National Key Research and Development Program of China [2017YFC1501700] and the National Natural Science Foundation of China [No. 41575033, 41775005] and the Instrument Function Development Project of Chinese Academy of Sciences (Project No. E066193601).
Data Availability Statement
The TB observation data from MWPR at IAP and XH can be made available upon request from the corresponding author.
Acknowledgments
This work was supported by National Key Research and Development Program of China (2017YFC1501700) and National Natural Science Foundation of China (No. 41575033). The meteorological observation center of China’s meteorological administration provided radiosonde data and ground-based microwave radiometer observations at GXT. The Xianghe Observatory of Whole Atmosphere provided ground-based microwave radiometer observations at Xianghe. We thank the staff at the Xianghe site for the maintenance of the microwave radiometer, Liu Guosheng at Florida State University for providing the MWRT model, and ECMWF for providing hourly and 0.25° ERA5 data.
Conflicts of Interest
The authors declare no conflict of interest.
References
- Ulaby, F.T.; Moore, R.K.; Fung, A.K. Microwave Remote Sensing, Active and Passive. In Microwave Remote Sensing Fundamentals and Radiometry; Addison-Wesley Publishing Company: Reading, MA, USA, 1981; Volume 1. [Google Scholar]
- Westwater, E.R.; Crewell, S.; Mätzler, C.; Cimini, D. Principles of surface-based microwave and millimeter wave radiometric remote sensing of the troposphere. Quad. Soc. Ital. Elettromagn. 2005, 1, 50–90. [Google Scholar]
- Ware, R.; Carpenter, R.; Güldner, J.; Liljegren, J.; Nehrkorn, T.; Solheim, F.; Vandenberghe, F. A multichannel radiometric profiler of temperature, humidity, and cloud liquid. Radio Sci. 2003, 38, 8079. [Google Scholar] [CrossRef] [Green Version]
- Chan, P.W.; Hon, K.K. Application of ground-based, multi-channel microwave radiometer in the nowcasting of intense convective weather through instability indices of the atmosphere. Meteorol. Z. 2011, 20, 423–429. [Google Scholar] [CrossRef]
- Gultepe, I.; Zhou, B.; Milbrandt, J.; Bott, A.; Li, Y.; Heymsfield, A.J.; Ferrier, B.; Ware, R.; Pavolonis, M.; Kuhn, T.; et al. A review on ice fog measurements and monitoring. Atmos. Res. 2015, 151, 2–19. [Google Scholar] [CrossRef] [Green Version]
- Güldner, J.; Spänkuch, D. Remote sensing of the thermodynamic state of the atmospheric boundary layer by ground-based microwave radiometry. J. Atmos. Ocean. Technol. 2001, 18, 925–933. [Google Scholar] [CrossRef] [Green Version]
- Cimini, D.; De Angelis, F.; Dupont, J.C.; Pal, S.; Haeffelin, M. Mixing layer height retrievals by multichannel microwave radiometer observations. Atmos. Meas. Tech. 2013, 6, 4971–4998. [Google Scholar] [CrossRef] [Green Version]
- Cimini, D.; Campos, E.; Ware, R.; Albers, S.; Graziano, G.; Oreamuno, J.; Joe, P.; Koch, S.; Cober, S.; Westwater, E. Thermodynamic atmospheric profiling during the 2010 winter Olympics using ground-based microwave radiometry. IEEE Trans. Geosci. Remote Sens. 2011, 49, 4959–4969. [Google Scholar] [CrossRef]
- Cimini, D.; Nelson, M.; Güldner, J.; Ware, R. Forecast indices from a ground-based microwave radiometer for operational meteorology. Atmos. Meas. Tech. 2015, 8, 315–333. [Google Scholar] [CrossRef] [Green Version]
- Löhnert, U.; Maier, O. Operational profiling of temperature using ground-based microwave radiometry at Payerne: Prospects and challenges. Atmos. Meas. Tech. 2012, 5, 1121–1134. [Google Scholar] [CrossRef] [Green Version]
- Cimini, D.; Hewison, T.J.; Martin, L.; Güldner, J.; Gaffard, C.; Marzano, F. Temperature and humidity profile retrievals from ground-based microwave radiometers during TUC. Meteorol. Z. 2006, 15, 45–56. [Google Scholar] [CrossRef]
- Hewison, T. 1D-VAR retrievals of temperature and humidity profiles from a ground-based microwave radiometer. IEEE Trans. Geosci. Remote Sens. 2007, 45, 2163–2168. [Google Scholar] [CrossRef]
- Löhnert, U.; Crewell, S.; Simmer, C. An integrated approach towards retrieving physically consistent profiles of temperature, humidity, and cloud liquid water. J. Appl. Meteorol. 2004, 43, 1295–1307. [Google Scholar] [CrossRef] [Green Version]
- Wang, Z.H.; Cao, X.; Huang, J.; Chu, Y.; Li, Q. Analysis on the working state of a ground-based microwave radiometer based on radiative transfer model and meteorological data variation features. Trans. Atmos. Sci. 2014, 37, 1–8. (In Chinese) [Google Scholar] [CrossRef]
- Goldberg, M.D.; Crosby, D.S.; Zhou, L.H. The limb adjustment of AMSU-A observations: Methodology and validation. J. Appl. Meteorol. 2001, 40, 70–83. [Google Scholar] [CrossRef]
- Lu, Q.; Bell, W.; Bauer, P.; Bormann, N.; Peubey, C. An evaluation of FY-3A satellite data for numerical weather prediction. Q. J. R. Meteor. Soc. 2011, 137, 1298–1311. [Google Scholar] [CrossRef]
- Weng, F. Advances in radiative transfer modeling in support of satellite data assimilation. J. Atmos. Sci. 2007, 64, 3799–3807. [Google Scholar] [CrossRef]
- Clough, S.A.; Shephard, M.W.; Mlawer, E.J.; Delamere, J.S.; Iacono, M.J.; Cady-Pereira, K.; Boukabara, S.; Brown, P.D. Atmospheric radiative transfer modeling: A summary of the AER codes. J. Quant. Spectrosc. Radiat. Transf. 2005, 91, 233–244. [Google Scholar] [CrossRef]
- Hewison, T.J.; Cimini, D.; Martin, L.; Gaffard, C.; Nash, J. Validating clear air absorption model using ground-based microwave radiometers and vice-versa. Meteorol. Z. 2006, 15, 27–36. [Google Scholar] [CrossRef] [Green Version]
- Li, Q.; Hu, F.; Chu, Y.; Wang, Z.H.; Huang, J.; Wang, Y.; Zhu, Y. A consistency analysis and correction of the brightness temperature data observed with a ground-based microwave radiometer in Beijing. Remote Sens. Technol. Appl. 2014, 29, 547–556. [Google Scholar] [CrossRef]
- Mao, J.; Zhang, X.; Wang, Z.; Yang, R.; Pan, X.; Ji, C.; Guo, R. Comparison of brightness temperature of multi-type ground-based microwave radiometers. J. Appl. Meteorol. Sci. 2018, 29, 724–736. (In Chinese) [Google Scholar] [CrossRef]
- Huang, X.Y.; Zhang, X.; Leng, L.; Li, F.; Fan, Y.W. Study on retrieval methods with MonoRTM for microwave radiometer measurements. J. Meteorol. Sci. 2013, 33, 138–145. (In Chinese) [Google Scholar] [CrossRef]
- Zou, R.S.; He, W.Y.; Wang, P.C.; Mao, J.J.; Chen, H.B.; Li, J.; Nan, W.D.; Chang, Y. Assessment of Radiative Transfer Models Based on Observed Brightness Temperature from Ground-Based Microwave Radiometer. Chin. J. Atmos. Sci. 2021, 45, 1–12. [Google Scholar] [CrossRef]
- Rose, T.; Crewell, S.; Löhnert, U.; Simmer, C. A network suitable microwave radiometer for operational monitoring of the cloudy atmosphere. Atmos. Res. 2005, 75, 183–200. [Google Scholar] [CrossRef]
- Hersbach, H.; Bell, B.; Berrisford, P.; Hirahara, S.; Horányi, A.; Muñoz-Sabater, J.; Nicolas, J.; Peubey, C.; Radu, R.; Schepers, D.; et al. The ERA5 global reanalysis. Q. J. R. Meteorol. Soc. 2020, 146, 1999–2049. [Google Scholar] [CrossRef]
- Liu, G.S. A fast and accurate model for microwave radiance calculations. J. Meteorol. Soc. Jpn. 1998, 76, 335–343. [Google Scholar] [CrossRef] [Green Version]
- Rosenkranz, P.W. Absorption of Microwaves by Atmospheric Gases, Chapter 2. In Atmospheric Remote Sensing by Microwave Radiometry; Janssen, M.A., Ed.; John Wiley & Sons, Inc.: Hoboken, NJ, USA, 1993; pp. 37–90. [Google Scholar]
- Rosenkranz, P.W. Water vapor microwave continuum absorption: A comparison of measurements and models. Radio Sci. 1998, 33, 919–928. [Google Scholar] [CrossRef]
- Liebe, H.J.; Rosenkranz, P.W.; Hufford, G.A. Atmospheric 60-GHz oxygen spectrum: New laboratory measurements and line parameters. J. Quant. Spectrosc. Radiat. Transf. 1992, 45, 629–643. [Google Scholar] [CrossRef]
- Liu, G.S. Approximation of single scattering properties of ice and snow particles for high microwave frequencies. J. Atmos. Sci. 2004, 61, 2441–2456. [Google Scholar] [CrossRef]
- Poore, K.D.; Wang, J.H.; Rossow, W.B. Cloud layer thicknesses from a combination of surface and upper-air observations. J. Clim. 1995, 8, 550–568. [Google Scholar] [CrossRef] [Green Version]
- Cimini, D.; Rosenkranz, P.W.; Tretyakov, M.Y.; Koshelev, M.A.; Romano, F. Uncertainty of atmospheric microwave absorption model: Impact on ground-based radiometer simulations and retrievals. Atmos. Chem. Phys. 2018, 18, 15231–15259. [Google Scholar] [CrossRef] [Green Version]
Figure 1.
The ground-based MWRPs used (a) and the location of three sites, as indicated by the red markers on the map (b). IAP is approximately 20 km from GXT and XH is approximately 42 km from GXT. Beijing radiosonde (No.54511) is launched from the GXT site.
Figure 1.
The ground-based MWRPs used (a) and the location of three sites, as indicated by the red markers on the map (b). IAP is approximately 20 km from GXT and XH is approximately 42 km from GXT. Beijing radiosonde (No.54511) is launched from the GXT site.

Figure 2.
The scattering plots of the simulated TBs using radiosonde profiles and observed TBs in channel 1 (Ch1), Ch7, and Ch8 of the MWRPs at the GXT (a–c), IAP (d–f), and XH (g–i) sites in 2019.
Figure 2.
The scattering plots of the simulated TBs using radiosonde profiles and observed TBs in channel 1 (Ch1), Ch7, and Ch8 of the MWRPs at the GXT (a–c), IAP (d–f), and XH (g–i) sites in 2019.

Figure 3.
Comparisons of TB difference ((a) CC; (b) MB; (c) STD) between the observations and simulations using the Beijing radiosonde profiles at the three sites.
Figure 3.
Comparisons of TB difference ((a) CC; (b) MB; (c) STD) between the observations and simulations using the Beijing radiosonde profiles at the three sites.

Figure 4.
Comparisons of TB difference between the observations and simulations using the ERA5 profiles in Ch1, Ch7, and Ch8 of the MWRPs at the GXT (a–c), IAP (d–f), and XH (g–i) sites in 2019.
Figure 4.
Comparisons of TB difference between the observations and simulations using the ERA5 profiles in Ch1, Ch7, and Ch8 of the MWRPs at the GXT (a–c), IAP (d–f), and XH (g–i) sites in 2019.

Figure 5.
Comparisons of the statistical parameters ((a) CC; (b) MB; (c) STD) of the simulated TBs derived from both the radiosonde and ERA5 profiles with corresponding observed TBs in the water vapor channels of the MWRPs located at the GXT, IAP, and XH sites.
Figure 5.
Comparisons of the statistical parameters ((a) CC; (b) MB; (c) STD) of the simulated TBs derived from both the radiosonde and ERA5 profiles with corresponding observed TBs in the water vapor channels of the MWRPs located at the GXT, IAP, and XH sites.

Figure 6.
Monthly mean statistical parameters, MB (a) and STD (b), for the TB difference between the simulated TBs derived from ERA5 profiles and the observed TBs in Ch 7 of the MWRPs located at the GXT, IAP, and XH sites in 2019.
Figure 6.
Monthly mean statistical parameters, MB (a) and STD (b), for the TB difference between the simulated TBs derived from ERA5 profiles and the observed TBs in Ch 7 of the MWRPs located at the GXT, IAP, and XH sites in 2019.

Publisher’s Note: MDPI stays neutral with regard to jurisdictional claims in published maps and institutional affiliations. |
© 2021 by the authors. Licensee MDPI, Basel, Switzerland. This article is an open access article distributed under the terms and conditions of the Creative Commons Attribution (CC BY) license (https://creativecommons.org/licenses/by/4.0/).
Share and Cite
MDPI and ACS Style
He, W.; Cheng, Y.; Zou, R.; Wang, P.; Chen, H.; Li, J.; Xia, X. Radiative Transfer Model Simulations for Ground-Based Microwave Radiometers in North China. Remote Sens. 2021, 13, 5161. https://0-doi-org.brum.beds.ac.uk/10.3390/rs13245161
AMA Style
He W, Cheng Y, Zou R, Wang P, Chen H, Li J, Xia X. Radiative Transfer Model Simulations for Ground-Based Microwave Radiometers in North China. Remote Sensing. 2021; 13(24):5161. https://0-doi-org.brum.beds.ac.uk/10.3390/rs13245161
Chicago/Turabian StyleHe, Wenying, Yunchu Cheng, Rongshi Zou, Pucai Wang, Hongbin Chen, Jun Li, and Xiangao Xia. 2021. "Radiative Transfer Model Simulations for Ground-Based Microwave Radiometers in North China" Remote Sensing 13, no. 24: 5161. https://0-doi-org.brum.beds.ac.uk/10.3390/rs13245161
Note that from the first issue of 2016, this journal uses article numbers instead of page numbers. See further details here.