Estimating Forest Structure from UAV-Mounted LiDAR Point Cloud Using Machine Learning


1
Geomatics Unit, Université de Liège (ULiege), Quartier Agora, 19 Allée du Six-Août, 4000 Liège, Belgium
2
Institute of Bio- and Geosciences, Forschungszentrum Jülich, Wilhelm-Johnen-Straße, 52428 Jülich, Germany
*
Author to whom correspondence should be addressed.
Remote Sens. 2021, 13(3), 352; https://0-doi-org.brum.beds.ac.uk/10.3390/rs13030352
Submission received: 4 January 2021
/
Revised: 14 January 2021
/
Accepted: 18 January 2021
/
Published: 20 January 2021
(This article belongs to the Special Issue Individual Tree Detection and Characterisation from UAV Data)
Abstract
:Monitoring the structure of forest stands is of high importance for forest managers to help them in maintaining ecosystem services. For that purpose, Unmanned Aerial Vehicles (UAVs) open new prospects, especially in combination with Light Detection and Ranging (LiDAR) technology. Indeed, the shorter distance from the Earth’s surface significantly increases the point density beneath the canopy, thus offering new possibilities for the extraction of the underlying semantics. For example, tree stems can now be captured with sufficient detail, which is a gateway to accurately locating trees and directly retrieving metrics—e.g., the Diameter at Breast Height (DBH). Current practices usually require numerous site-specific parameters, which may preclude their use when applied beyond their initial application context. To overcome this shortcoming, the machine learning Hierarchical Density-Based Spatial Clustering of Application of Noise (HDBSCAN) clustering algorithm was further improved and implemented to segment tree stems. Afterwards, Principal Component Analysis (PCA) was applied to extract tree stem orientation for subsequent DBH estimation. This workflow was then validated using LiDAR point clouds collected in a temperate deciduous closed-canopy forest stand during the leaf-on and leaf-off seasons, along with multiple scanning angle ranges. The results show that the proposed methodology can correctly detect up to 82% of tree stems (with a precision of 98%) during the leaf-off season and have a Maximum Scanning Angle Range (MSAR) of 75 degrees, without having to set up any site-specific parameters for the segmentation procedure. In the future, our method could then minimize the omission and commission errors when initially detecting trees, along with assisting further tree metrics retrieval. Finally, this research shows that, under the study conditions, the point density within an approximately 1.3-meter height above the ground remains low within closed-canopy forest stands even during the leaf-off season, thus restricting the accurate estimation of the DBH. As a result, autonomous UAVs that can both fly above and under the canopy provide a clear opportunity to achieve this purpose.
Keywords:
UAV; LiDAR; point cloud; machine learning; HDBSCAN; PCA; tree stem segmentation; tree diameter
1. Introduction
1.1. Context
Forests are critical natural resources for human life and wildlife, as they sustain and protect biodiversity, supply multiple ecosystem services, and mitigate the impacts of climate change [1,2,3,4,5]. Hence, monitoring this terrestrial ecosystem is of utmost importance, as deforestation releases significant amounts of greenhouse gases, alters the surface energy and the water balance, and causes a loss of species diversity [6]. To ensure the preservation of such habitats, their monitoring and management have been of public interest for both political decision-makers and conservationists in the assessment of implemented measures along with resource-dependent companies and localities (in the quantitative estimation of harvests) [7].
In that respect, remote sensing (since the middle of the 20th century) has been a tremendous asset, as it drastically reduces fieldwork, which is inherently labor- and cost-intensive [8]. Furthermore, it goes beyond the sampling plot-based measurement strategy and therefore ensures a spatially continuous forest monitoring [9]. Afterwards, it provides information across a wide range of temporal and spatial scales through the great variety of sensors and carrying platforms [10]. Thereon, the Unmanned Aerial Vehicle (UAV), commonly referred to as a “drone”, is a promising technology in more than one respect. First of all, it can use both active and passive sensors [11]. Then, it delivers data with a very high spatial resolution due to the low altitude at which the aircraft flies [12]. This is even emphasized with a higher flexibility in data acquisition, as UAV supports lower flying speeds and accommodates almost any trajectory requirements (especially with its single and multi-rotor configurations) [13]. In addition, it paves the way to analyses with a very high temporal resolution, since it reduces operational and legal flying constraints, thus increasing the data acquisition frequency [14,15]. Finally, UAVs are a relatively low-cost solution and can therefore meet a wide diversity of application fields [16].
1.2. Challenges and Research Objectives
In the past ten years, several scientific studies have been conducted to optimize UAV flight planning (e.g., for the detection and avoidance of physical obstacles, increasing a 3D object’s coverage, taking into account airplane restrictions and drone energy consumption [17,18,19,20,21,22,23]) and to assess the feasibility and accuracy of UAV-mounted sensors for multiple research fields (e.g., forest inventory and management [24,25,26,27,28]). In this particular context, UAV-mounted LiDAR technology is a promising solution, since it can go deeper into the canopy, thus opening new prospects for detecting and characterizing 3D objects. Furthermore, having a closer distance between the scanner and the reflected points as compared to manned aircraft and satellite LiDAR solutions reduces the transverse width of the pulse, which can provide more accurate metrics from the point cloud [29,30]. Additionally, this allows the signal to pass through smaller gaps. As a result, tree trunks can now be captured with sufficient detail, which is a gateway to accurately locate trees and directly estimate the Diameter at Breast Height (DBH) without the need for allometric equations [31,32,33,34,35,36].
As a result, UAV laser scanning can now compete with Terrestrial Laser Scanning (TLS) [37,38,39,40,41,42] and ground-based Mobile Laser Scanning (MLS) (including smartphone [43,44], handheld [45,46,47], backpack [48,49,50], and vehicle-based [48,51,52,53,54,55] laser scanning methods) in retrieving the DBH, while being less time- and labor-consuming. In that respect, the study of [56] was the first to directly estimate the DBH from UAV-mounted LiDAR, followed by [57,58,59,60,61]. Recently, the study of Hyypä [62] compared a total of six ground-based MLS and UAV-mounted LiDAR technologies for tree height, DBH, tree stem curve, and volume estimation, thus providing a comprehensive assessment of such laser scanning systems for field reference data collection.
However, we noted that the conventional practices used to segment tree trunks usually require numerous site-specific parameters—e.g., the a priori knowledge of the DBH (Hough transformation) [61,63,64,65]; the flatness criterion (Eigen decomposition) [66,67]; the predefined number of clusters (k-means) [60]; the radius and density thresholds of clustering with the Density-Based Spatial Clustering of Application of Noise (DBSCAN)—namely, the neighborhood parameters [50,62,68,69]. Additionally, some methods are more sensitive to point density and gaps in the data [70,71,72,73]. This can lead to data containing a high proportion of outliers (from nearby understory vegetation) or segmented tree stems, thus affecting the completeness and accuracy of the estimated DBHs.
Therefore, this research project aims to segment tree stems. reckoning that (1) the user may have little knowledge of the study site, (2) tree stems may be surveyed with large gaps, and (3) the understory vegetation cover may interfere with tree trunks (Figure 1). For that, this study benefits from the machine learning Hierarchical Density-Based Spatial Clustering of Application of Noise (HDBSCAN) clustering algorithm proposed by [74], which is further improved to segment tree stems without having to set up any site-specific parameters. In summary, the main contributions of this research are:
- The design and implementation of a workflow that segment tree stems without the need for site-specific parameters;
- A solution which is both suitable for tree stems surveyed with gaps in the data and nearby understory vegetation;
- A method that could further minimize the omission and commission errors when detecting trees along with assisting further tree metrics extraction (e.g., tree stem curve).
This paper is structured as follows. Section 2 describes the study site and the data acquisition procedure. Section 3 deals with the methodological framework used to detect and segment tree stems. The results are then presented in Section 4 and discussed in Section 5 along with the research limitations. Ultimately, perspectives are addressed for further studies.
2. Study Area and Data Acquisition
2.1. Study Area and Data Acquisition
The study was carried out within a temperate deciduous closed-canopy forest located at the Research Centre Jülich in Germany (WGS84 geographic coordinates: 50°54′23′′N, 6°24′14′′E). The study site of a total area of around one hectare was mainly composed of beech and birch trees on a relatively smooth terrain, with elevations ranging from approximately 88 to 91 m. In September 2020, 110 trees were surveyed with the Leica TPS1200 total station and georeferenced (in UTM 32N) with ground control points using a Trimble R10 GNSS receiver. The DBH at approximately 1.3 m in height above the ground of all surveyed trees was measured in order to assess the DBH estimation from the LiDAR point cloud. Figure 2 illustrates the spatial distribution of trees, their recorded attributes (tree species and DBH), and a photograph of the study site.
2.2. Sensor, Flight Parameters, and Data Processing
The study site was flown over with the YellowScan® Surveyor LiDAR sensor mounted on a battery-driven DJI® Matrice 600 Pro hexacopter with the assistance of DJI (Shenzhen, China) Ground Station Pro as the flight planning software. Two series of flights were conducted during the leaf-on (September) and leaf-off (November) seasons in a double-grid survey at a mean altitude of 50 m Above Ground Level (AGL) and a 3 m/s flying speed. The overlapping percentage among swaths was set at 70% considering a Maximum Scanning Angle Range (MSAR) of 12 degrees from the nadir on one side, thus creating a total Field of View (FOV) of 24 degrees.
Then, the Applanix’s POSPac software was employed to create two Smooth Best Estimated Trajectory (SBET) files (one per season) using the Virtual Reference Station (VRS) technology from Trimble. Afterwards, YellowScan’s CloudStation software was used for strip alignment and georeferencing purposes, thus applying corrections for GNSS offset (lever-arms), angles (boresight), and GNSS observation post-processing (using the SBET file) [75]. Ultimately, four point-clouds per season were produced considering returns of up to 12° MSAR (24° FOV), 25° MSAR (50° FOV), 50° MSAR (100° FOV), and 75° MSAR (150° FOV). Table 1 summarizes the above specifications.
3. Methodology
3.1. Introduction
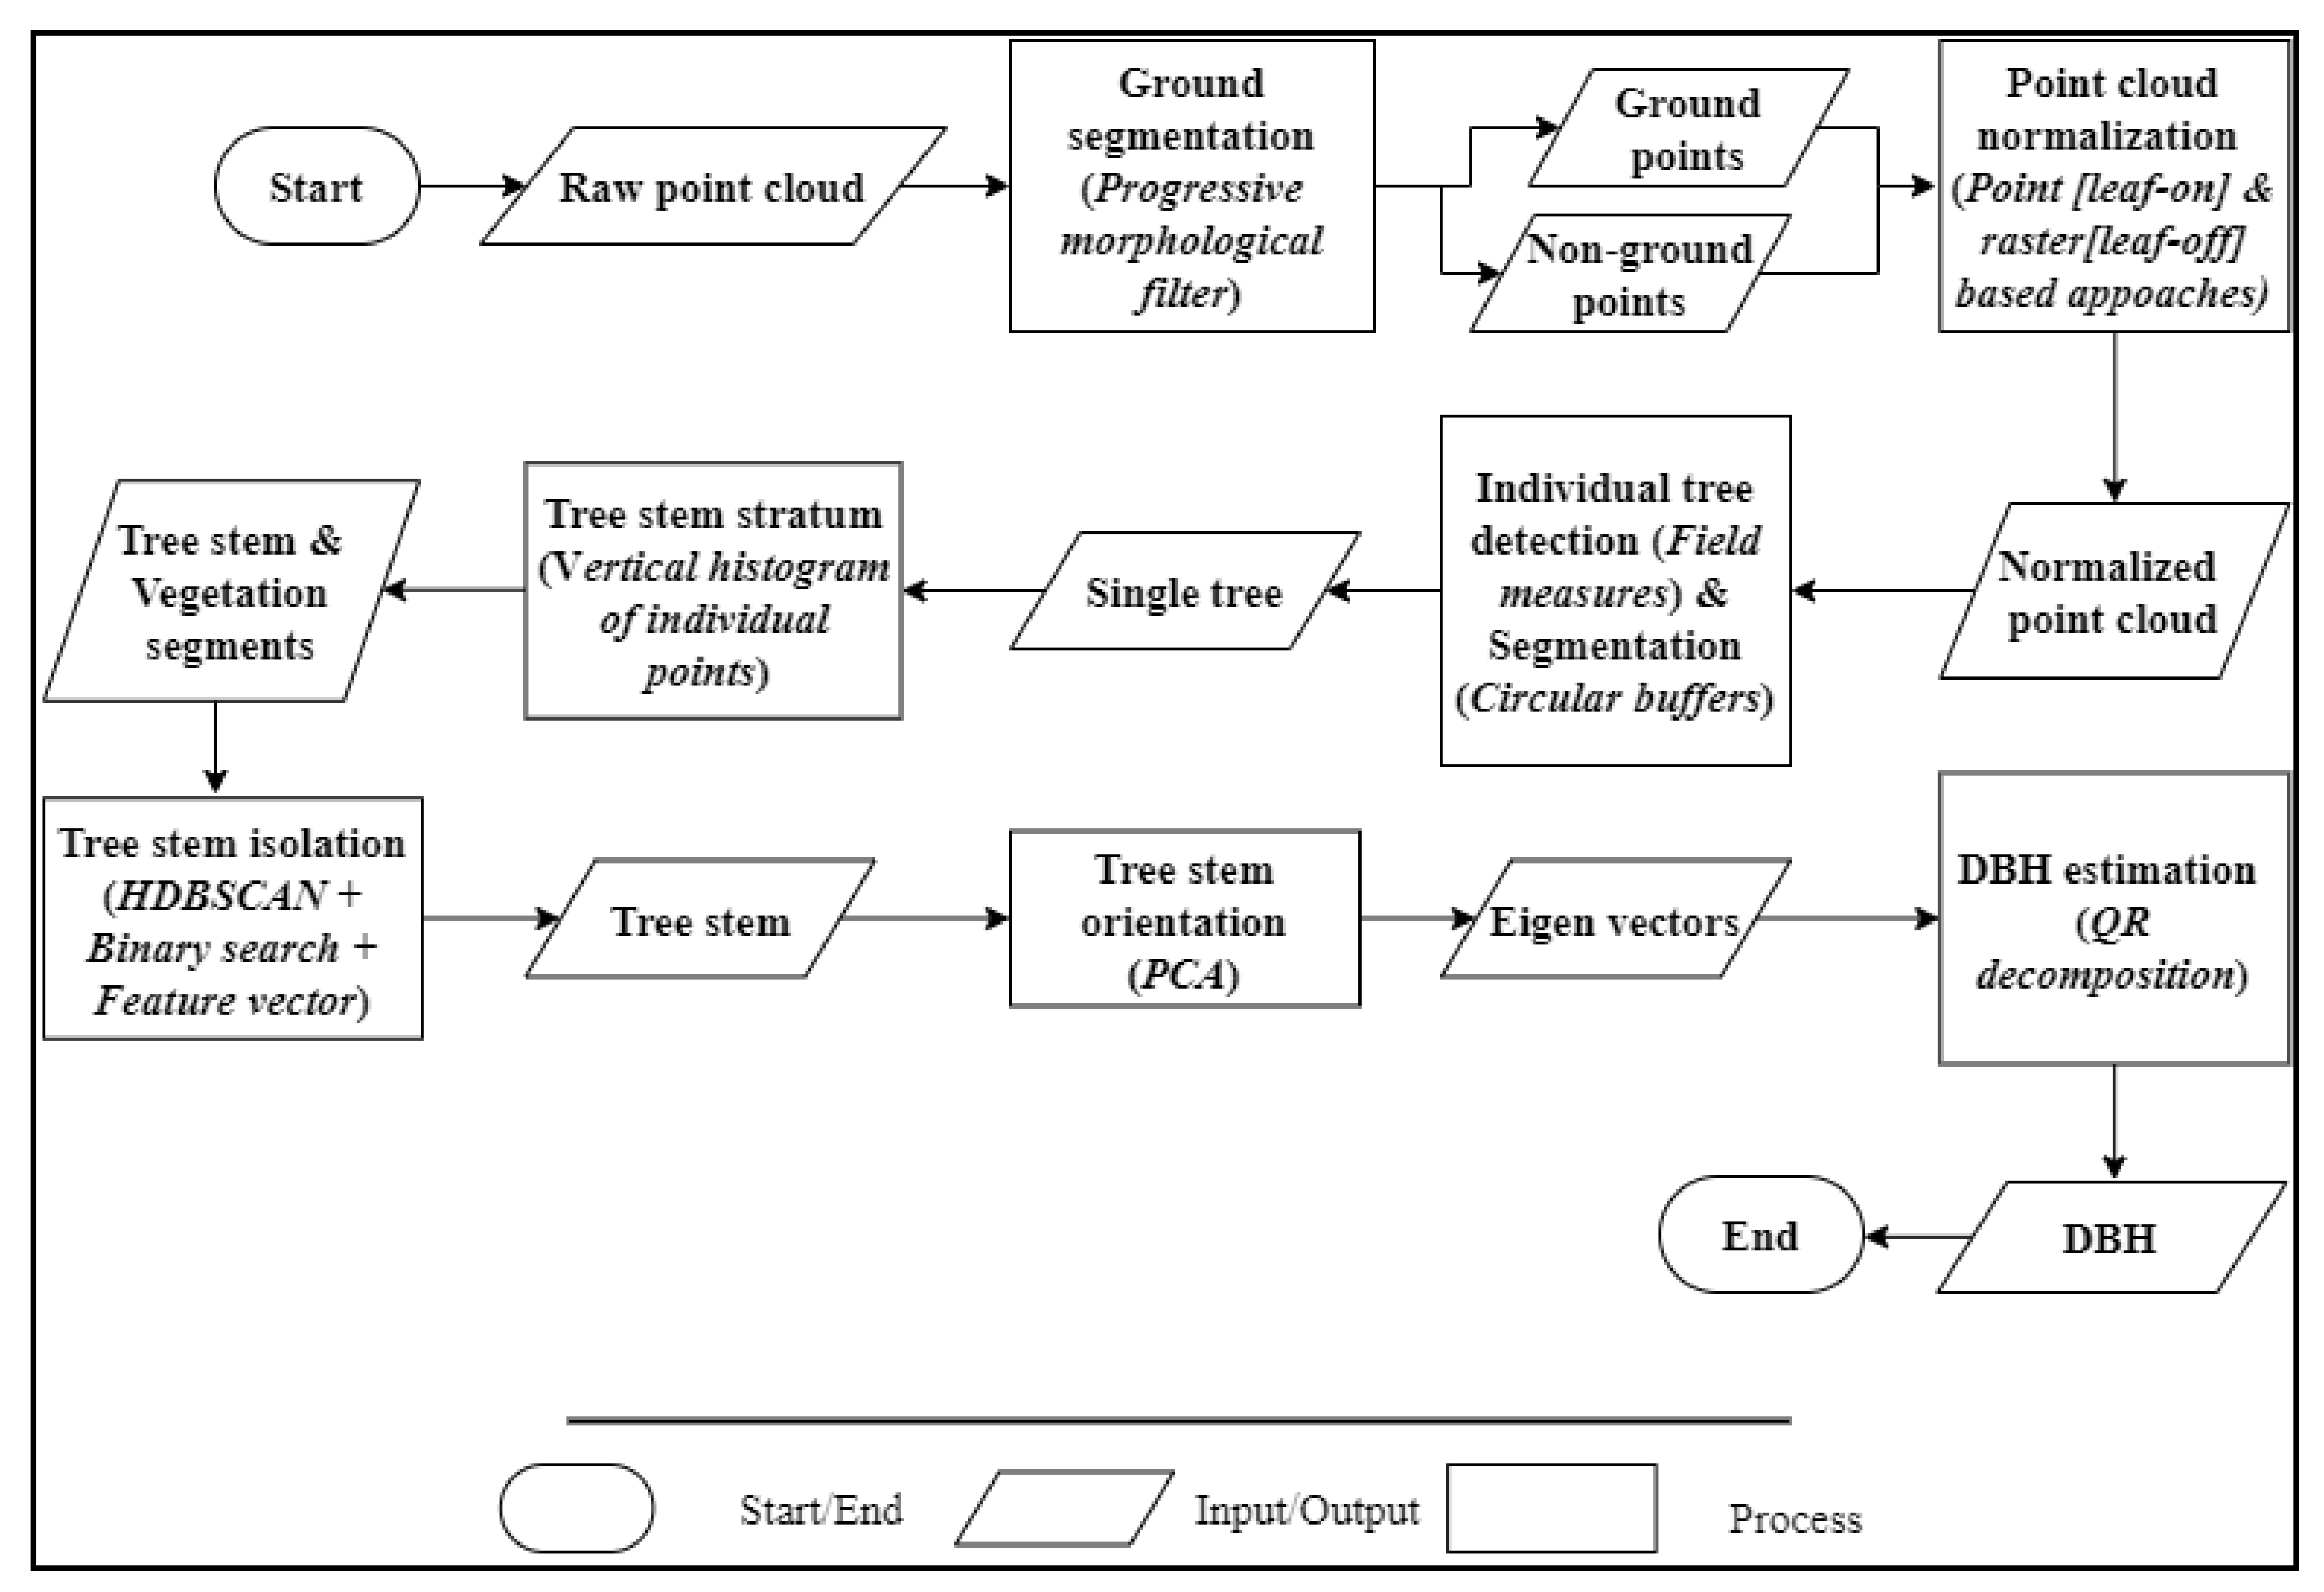
This section gives an overview of the methodological framework for segmenting and classifying tree stems along with estimating the DBH. As summarized in Figure 3, points were firstly classified into ground and non-ground points through the Progressive Morphological Filter (PMF) [76]. Then, a normalized point cloud (i.e., converting Z coordinates into heights above the ground) was created and used to individually detect and delineate trees based on the field measures and buffer zones. Section 3.2 explains this process in more detail. Next, the tree stem stratum was retrieved for each tree and used to segment and classify the tree trunk using the machine learning HDBSCAN clustering algorithm paired with a binary search and a feature vector. Finally, Principal Components Analysis (PCA) was applied to extract the tree stem orientation and estimate the DBH. Section 3.3 fully explains these procedures.
3.2. Normalized Point Cloud
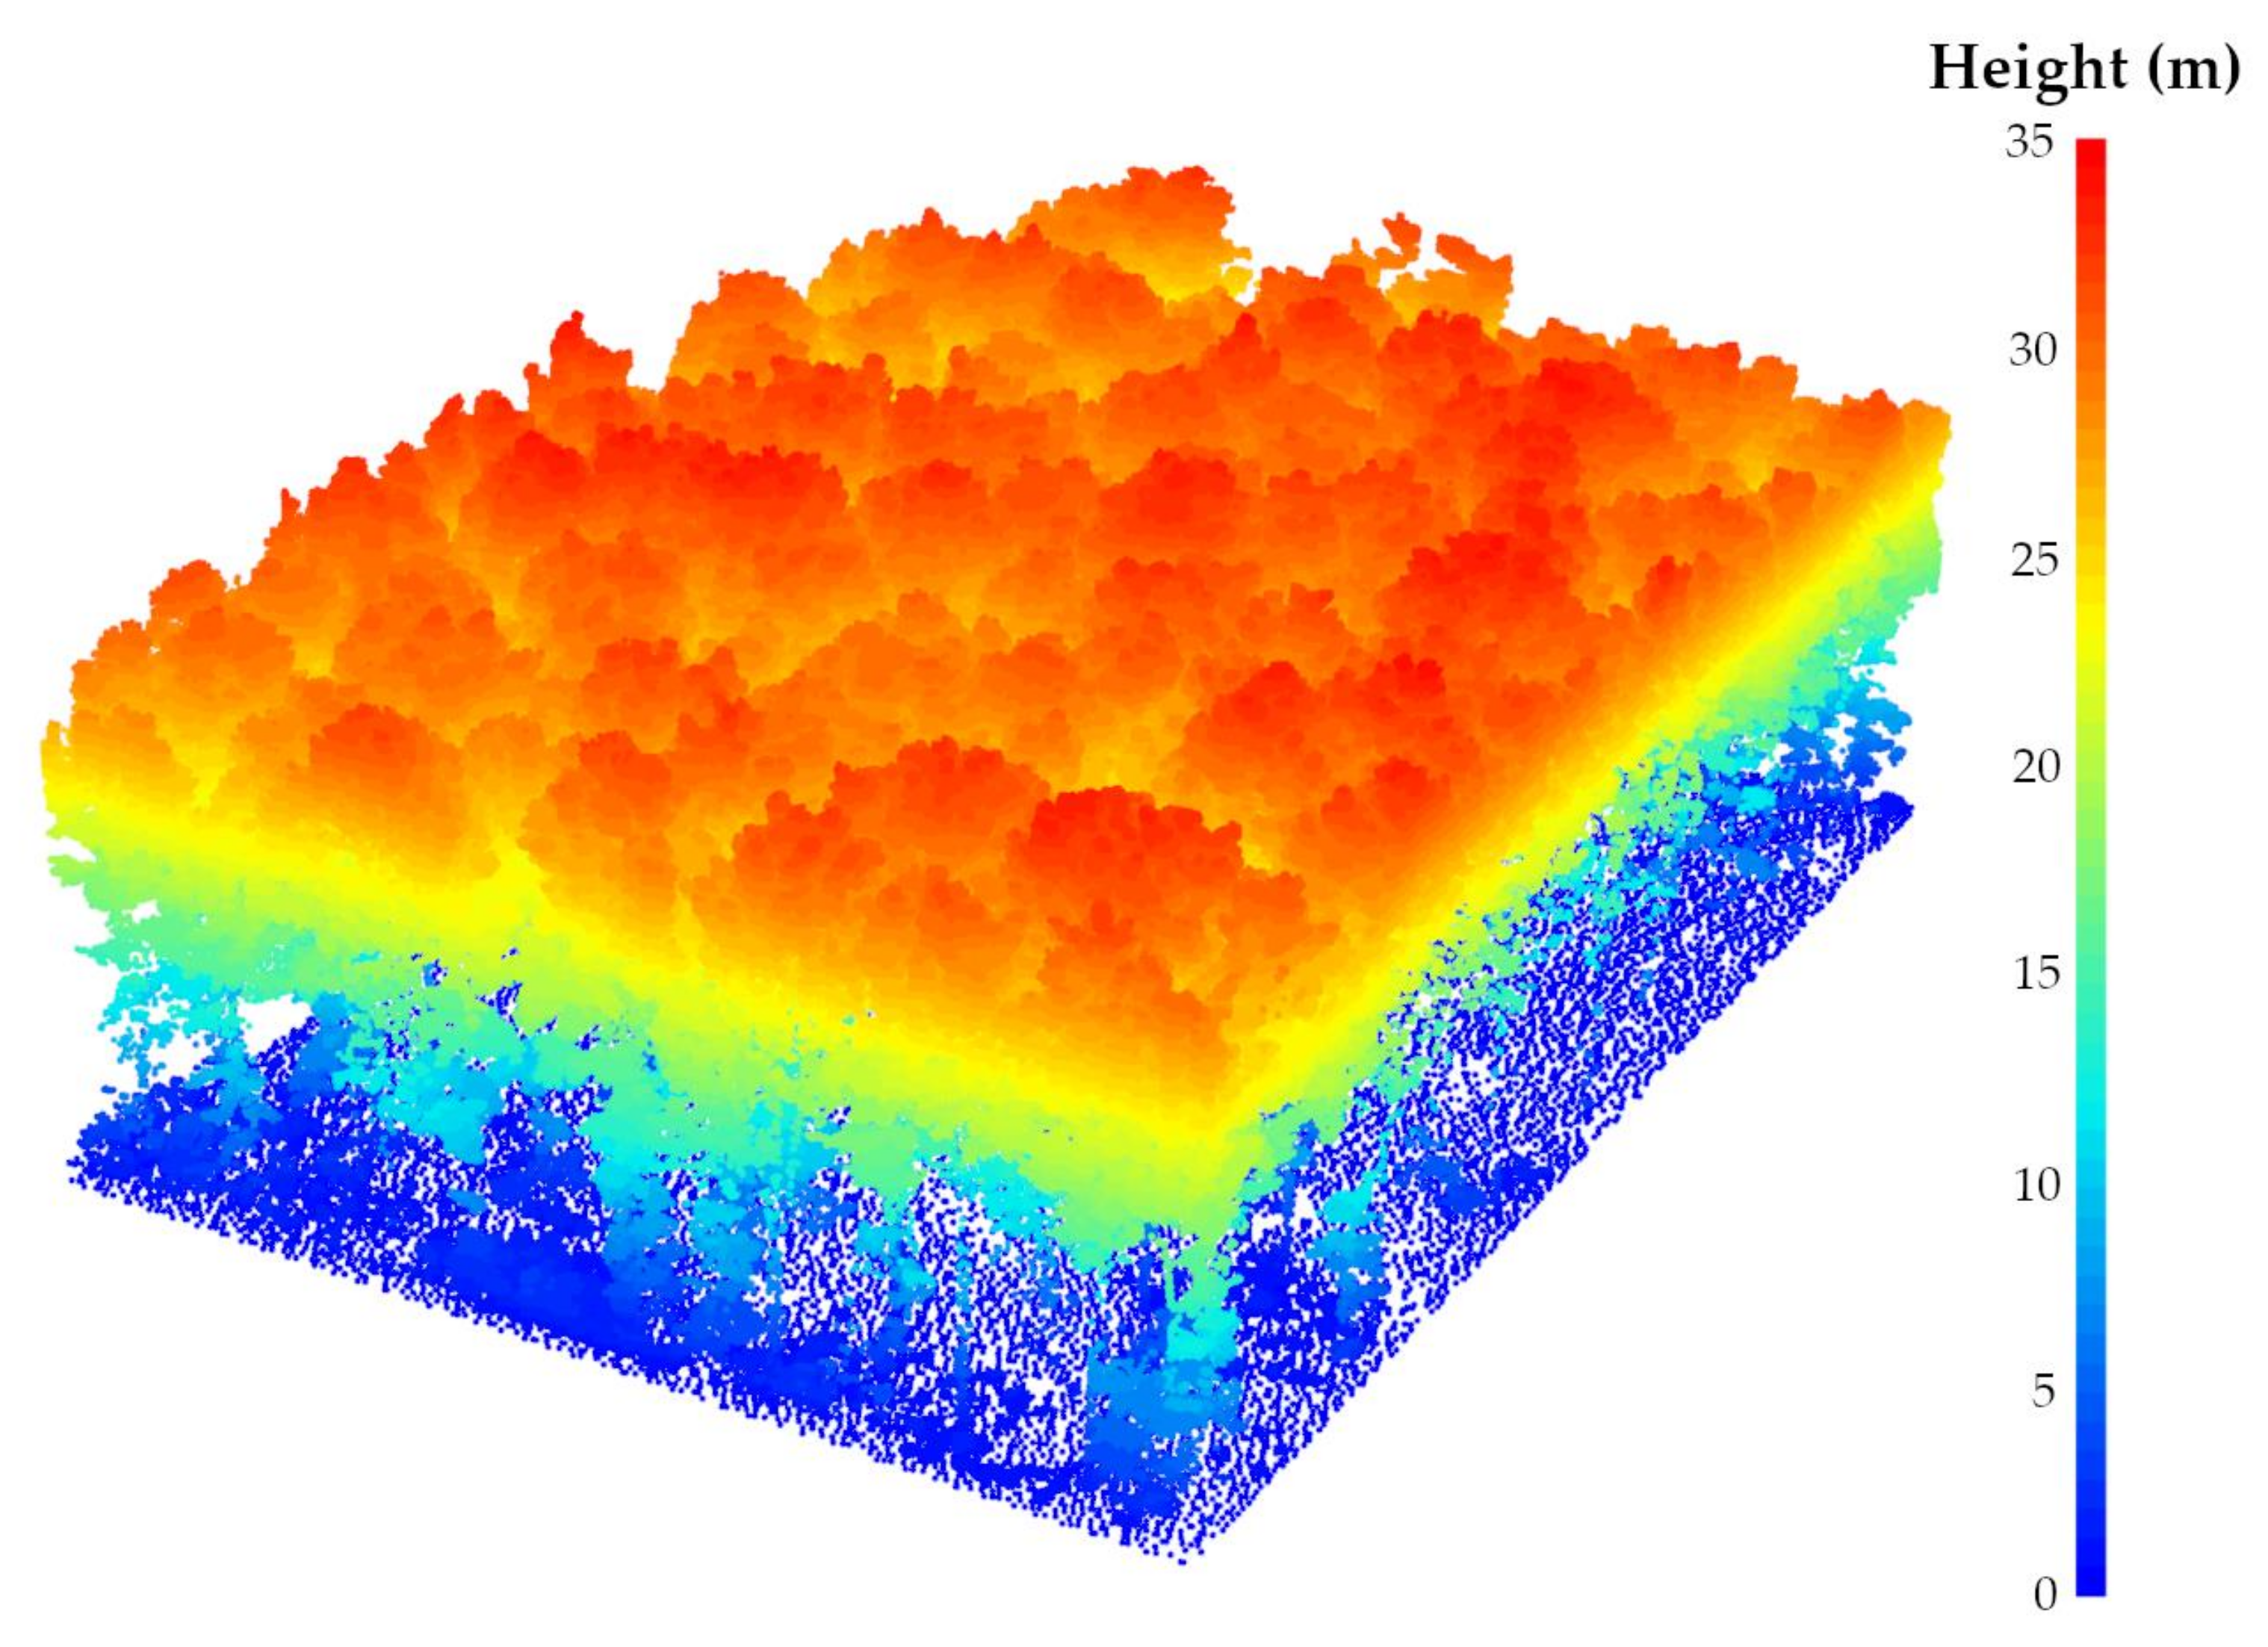
Segmenting the LiDAR dataset into ground and non-ground points is a crucial step for both individual tree detection and structural height-based metrics assessment [77]. To this end, many data filtering methods have already been proposed to successfully deal with the variety of natural and urban landscapes [76,78,79,80,81,82]. In this paper, PMF was used, as it is well suited for smooth terrains and is more time-efficient compared to the Cloth Simulation Filter (CSF). Note that the following PMF parameters were used: the sequences of windows sizes of the filter and threshold heights above the parametrized ground surface (to be considered as ground returns) were, respectively, set to 0.5 m and 2.5 m and 0.1 m and 0.5 m. Then, the dataset was normalized to transform the point’s elevation (i.e., the Z coordinate) into height above the ground using the spatial Triangular Irregular Network (TIN) interpolation method due to the nature and the size of the surface to be modeled along with the absence of large discontinuities [83,84,85,86,87,88,89,90,91] (Figure 4). It is also noteworthy that, in order to remove the inaccuracy owing to the discrete nature of a digital elevation model (DEM) [92], the point-based normalization approach was applied during the leaf-on season. However, a high proportion of data artifacts attributed to multipath was observed during the leaf-off season, thus requiring an external DEM (raster-based approach) from the leaf-on season to remove falsely located underground points. The DEM was generated at a resolution of 0.1 meters using the point cloud acquired during the leaf-on season and a 75° MSAR. Figure 5 shows the distribution of ground points after the DEM normalization using the point cloud acquired during the leaf-on season and a 75°MSAR, where 95% of ground points fall between −0.06 m and 0.06 m.
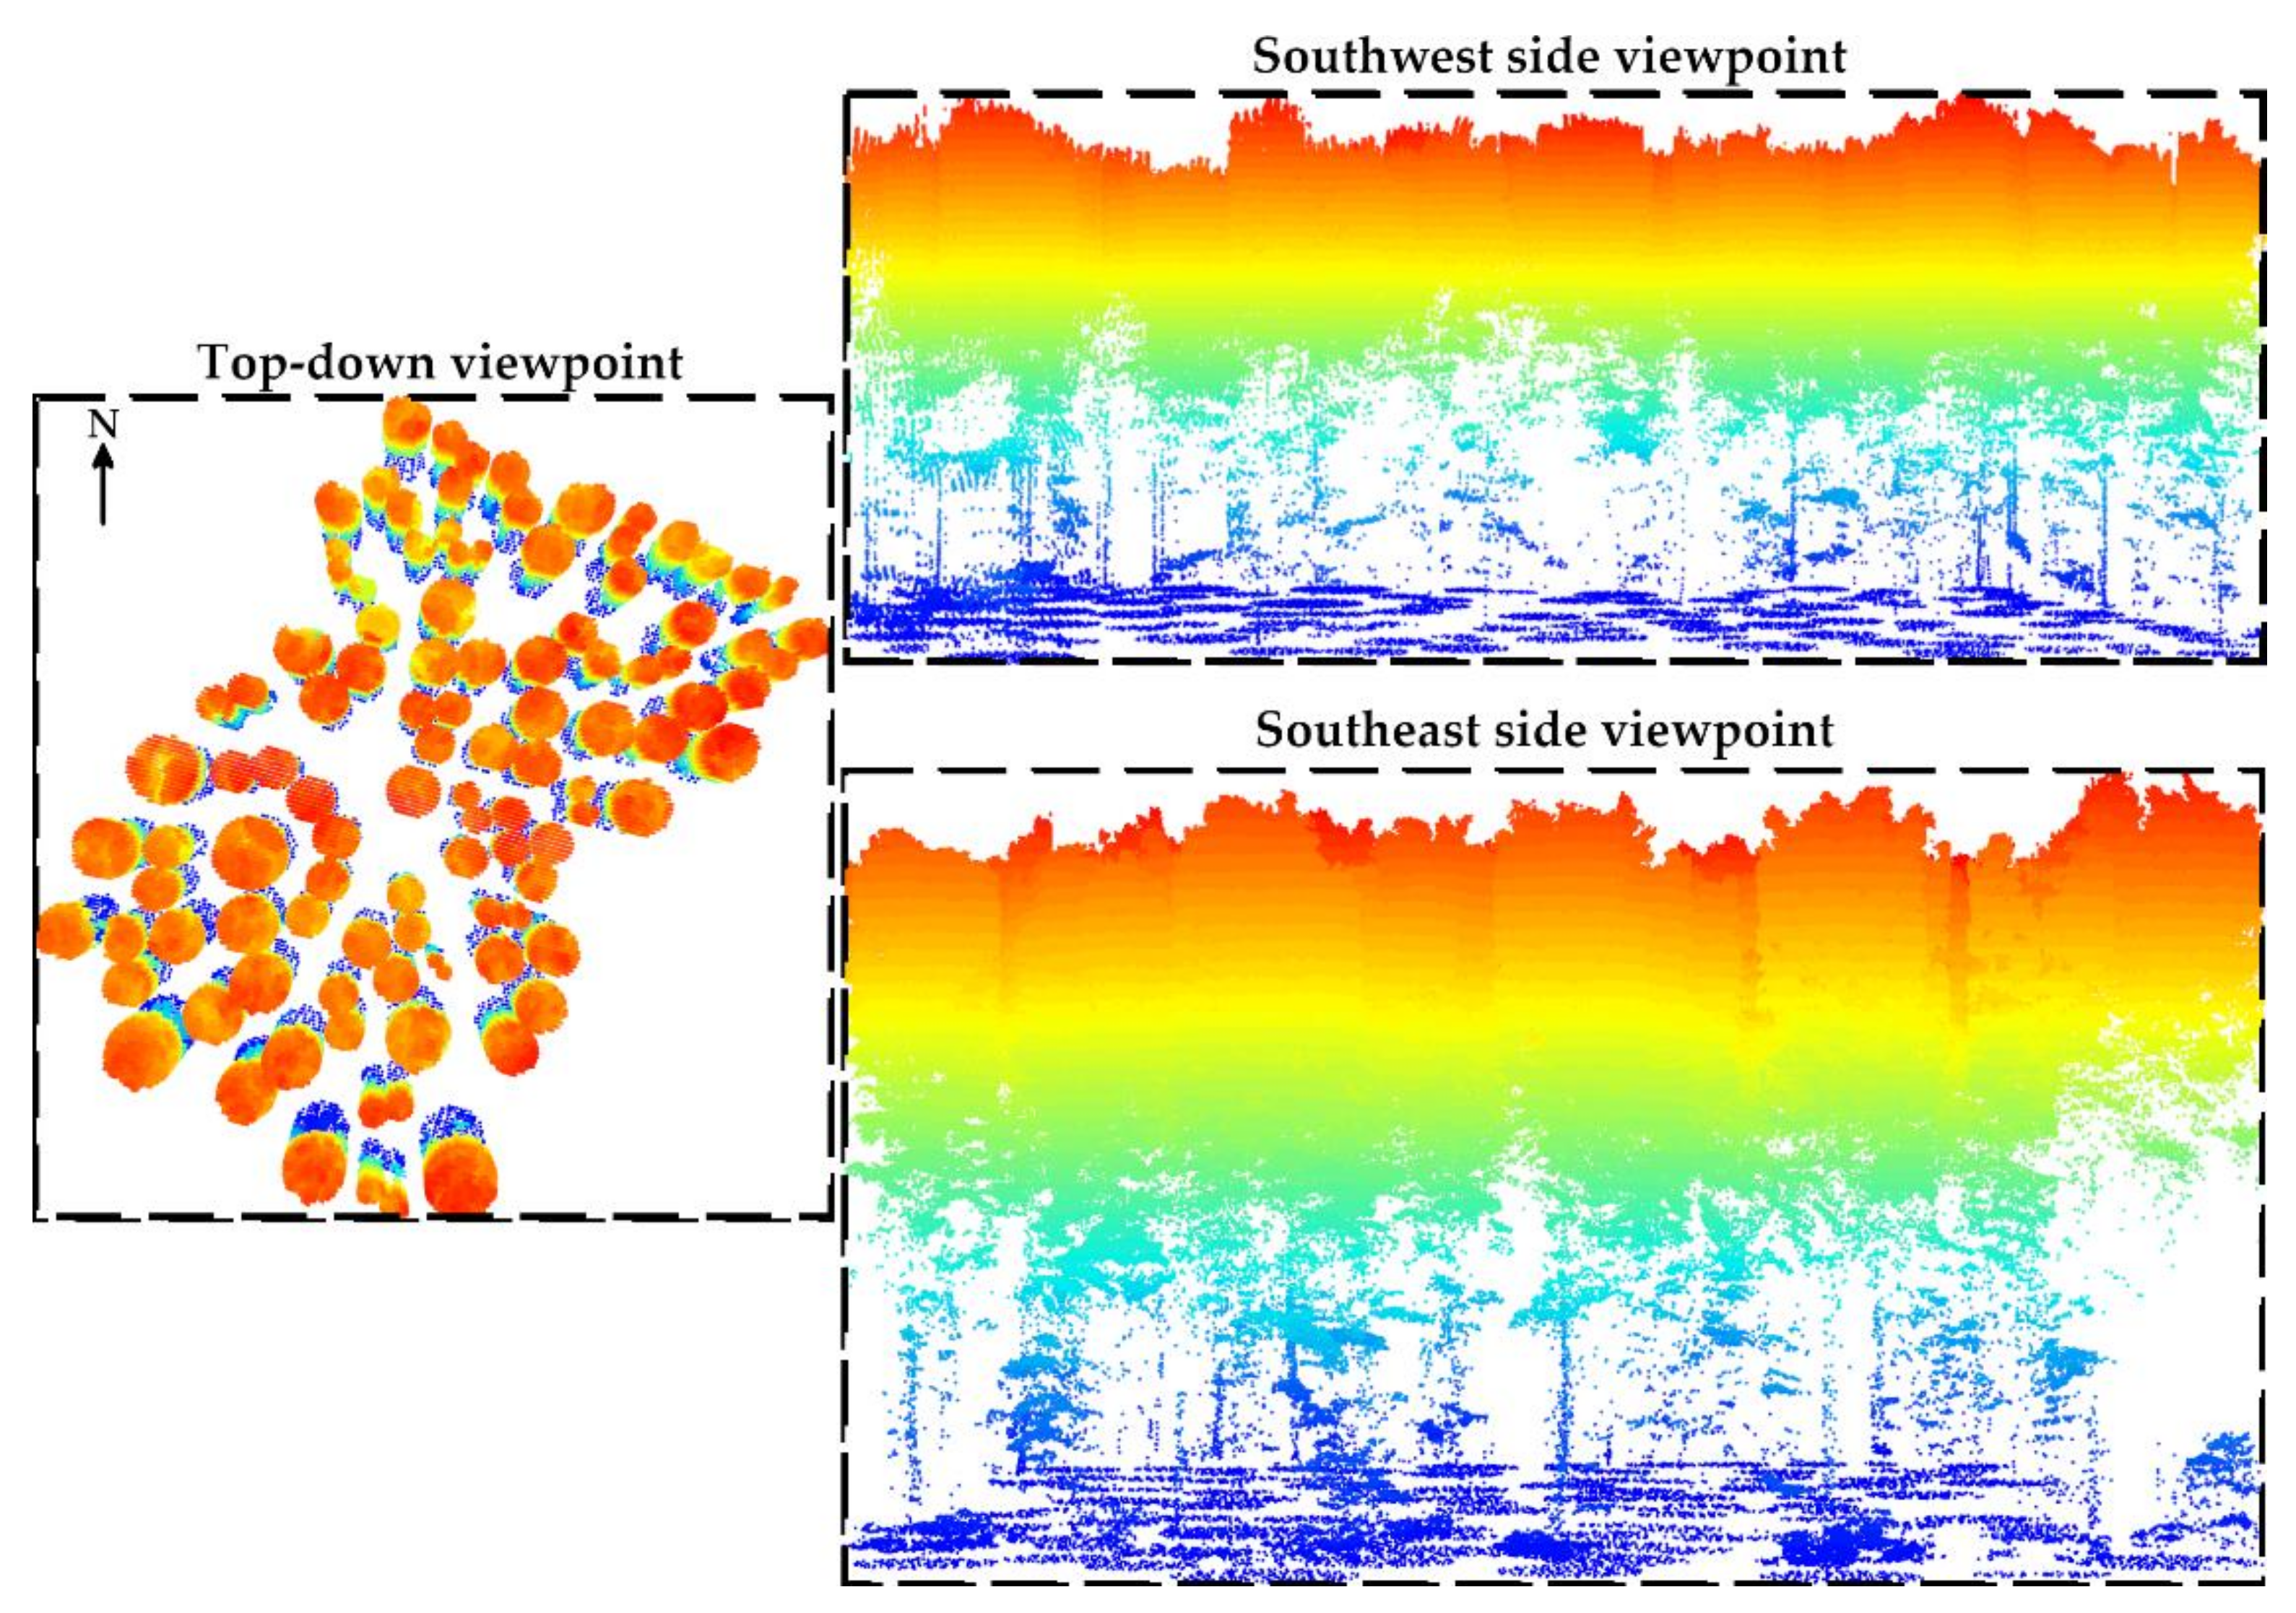
Then, tree locations obtained using the total station and the GNSS receiver were used to generate circular buffer zones for segmenting trees. For each tree, the radius threshold was set to half the distance among its nearest neighbors (Figure 6).
3.3. Tree Stem Segmentation and Classification
3.3.1. Clustering from Machine Learning
The aim of clustering is to split a finite unlabeled dataset into a finite and discrete set of underlying data structures—i.e., clusters [93]. It therefore belongs to the unsupervised learning from machine learning in the same way as the dimensionality reduction purpose [94]. Data clustering is a central task in artificial intelligence as it serves many applications such as data compression and supervised classification to create subsequent labeled datasets [95,96]. In this study, clustering is of utmost importance since it will directly affect the further tree stem classification along with the metrics estimation.
In this context, previous studies have already benefited from machine learning to cluster tree stems, such as k-means [60] and the traditional DBSCAN [50,62,68,69]. However, their application requires to set a series of parameters, which are either unknown (e.g., the predefined number of clusters with k-means) or complex to define (DBSCAN)—e.g., the maximum distance between two points to be considered as part of the same cluster, the ε distance, and the minimum number of points within a cluster, the cluster size. These settings rely heavily on the study site and must therefore be reviewed when applied to untested environments and/or sensors.
To avoid the previous limitations, this research takes advantage of the machine learning HDBSCAN clustering algorithm [74]. Compared to conventional DBSCAN, HDSCAN does not require the definition of the ε distance, thus allowing to cluster a higher variability of tree stems within the study site—i.e., surveyed with different densities. However, the cluster size remains a critical parameter as it may under- or oversegment the tree stem if not correctly configured. Additionally, since the point density may vary for each tree stem, this parameter should be uniquely set up. In the next section, we therefore propose a novel approach that aims to remove this issue by proposing an iterative procedure.
3.3.2. Theory of the Proposed HDSCAN Implementation
First, each tree is vertically split into N layers of one-meter height in order to produce vertical histograms of individual points [51]. Then, starting from the bottom, all layers that fall under the 30th percentile are kept and classified into continuous series. The longest series of layers is retained and assumed to contain the bole while also including some understory vegetation and tree crown sections. Note that the 30th threshold was chosen to facilitate the tree stem segmentation and classification on the bole—i.e., the lowest point density stratum, thus removing as many as branches from the tree crown. This value was adopted after some visual inspection of the dataset, thus fitting the tree species from the study area. Depending on the features of the forest, this threshold can be easily changed.
Secondly, the machine learning HDBSCAN clustering algorithm is applied into the planimetric space (i.e., using the x and y coordinates) in order to segment the tree stem. To overcome the definition of the minimum number of points within a cluster, an iterative procedure using a binary search is performed to find the upper limit from which a cluster is removed, thus avoiding tree stem over-segmentation. Then, three criteria must be met to classify this cluster as a tree stem based a feature vector:
- 1.
- The maximum 2D spatial extension in each layer is lower than 1.5 m, which is considered to be the maximum realistic DBH within the study area.
- 2.
- The height of the highest point is greater than 4 meters to avoid the understory vegetation.
- 3.
- The cluster contains less than 50% of void with respect to the height of the 3D analyzed space—i.e., the bole section of the tree.
If no cluster simultaneously satisfies these three conditions, then the process continues by removing these points from the dataset. However, if a cluster meets the second and third condition, then all points outside the 1.5 m threshold are removed using the center of the cluster computed from the layers with less than 1.5 m wide. Finally, the cluster with the greatest continuity regarding the vertical histogram of individual points is classified as the tree stem.
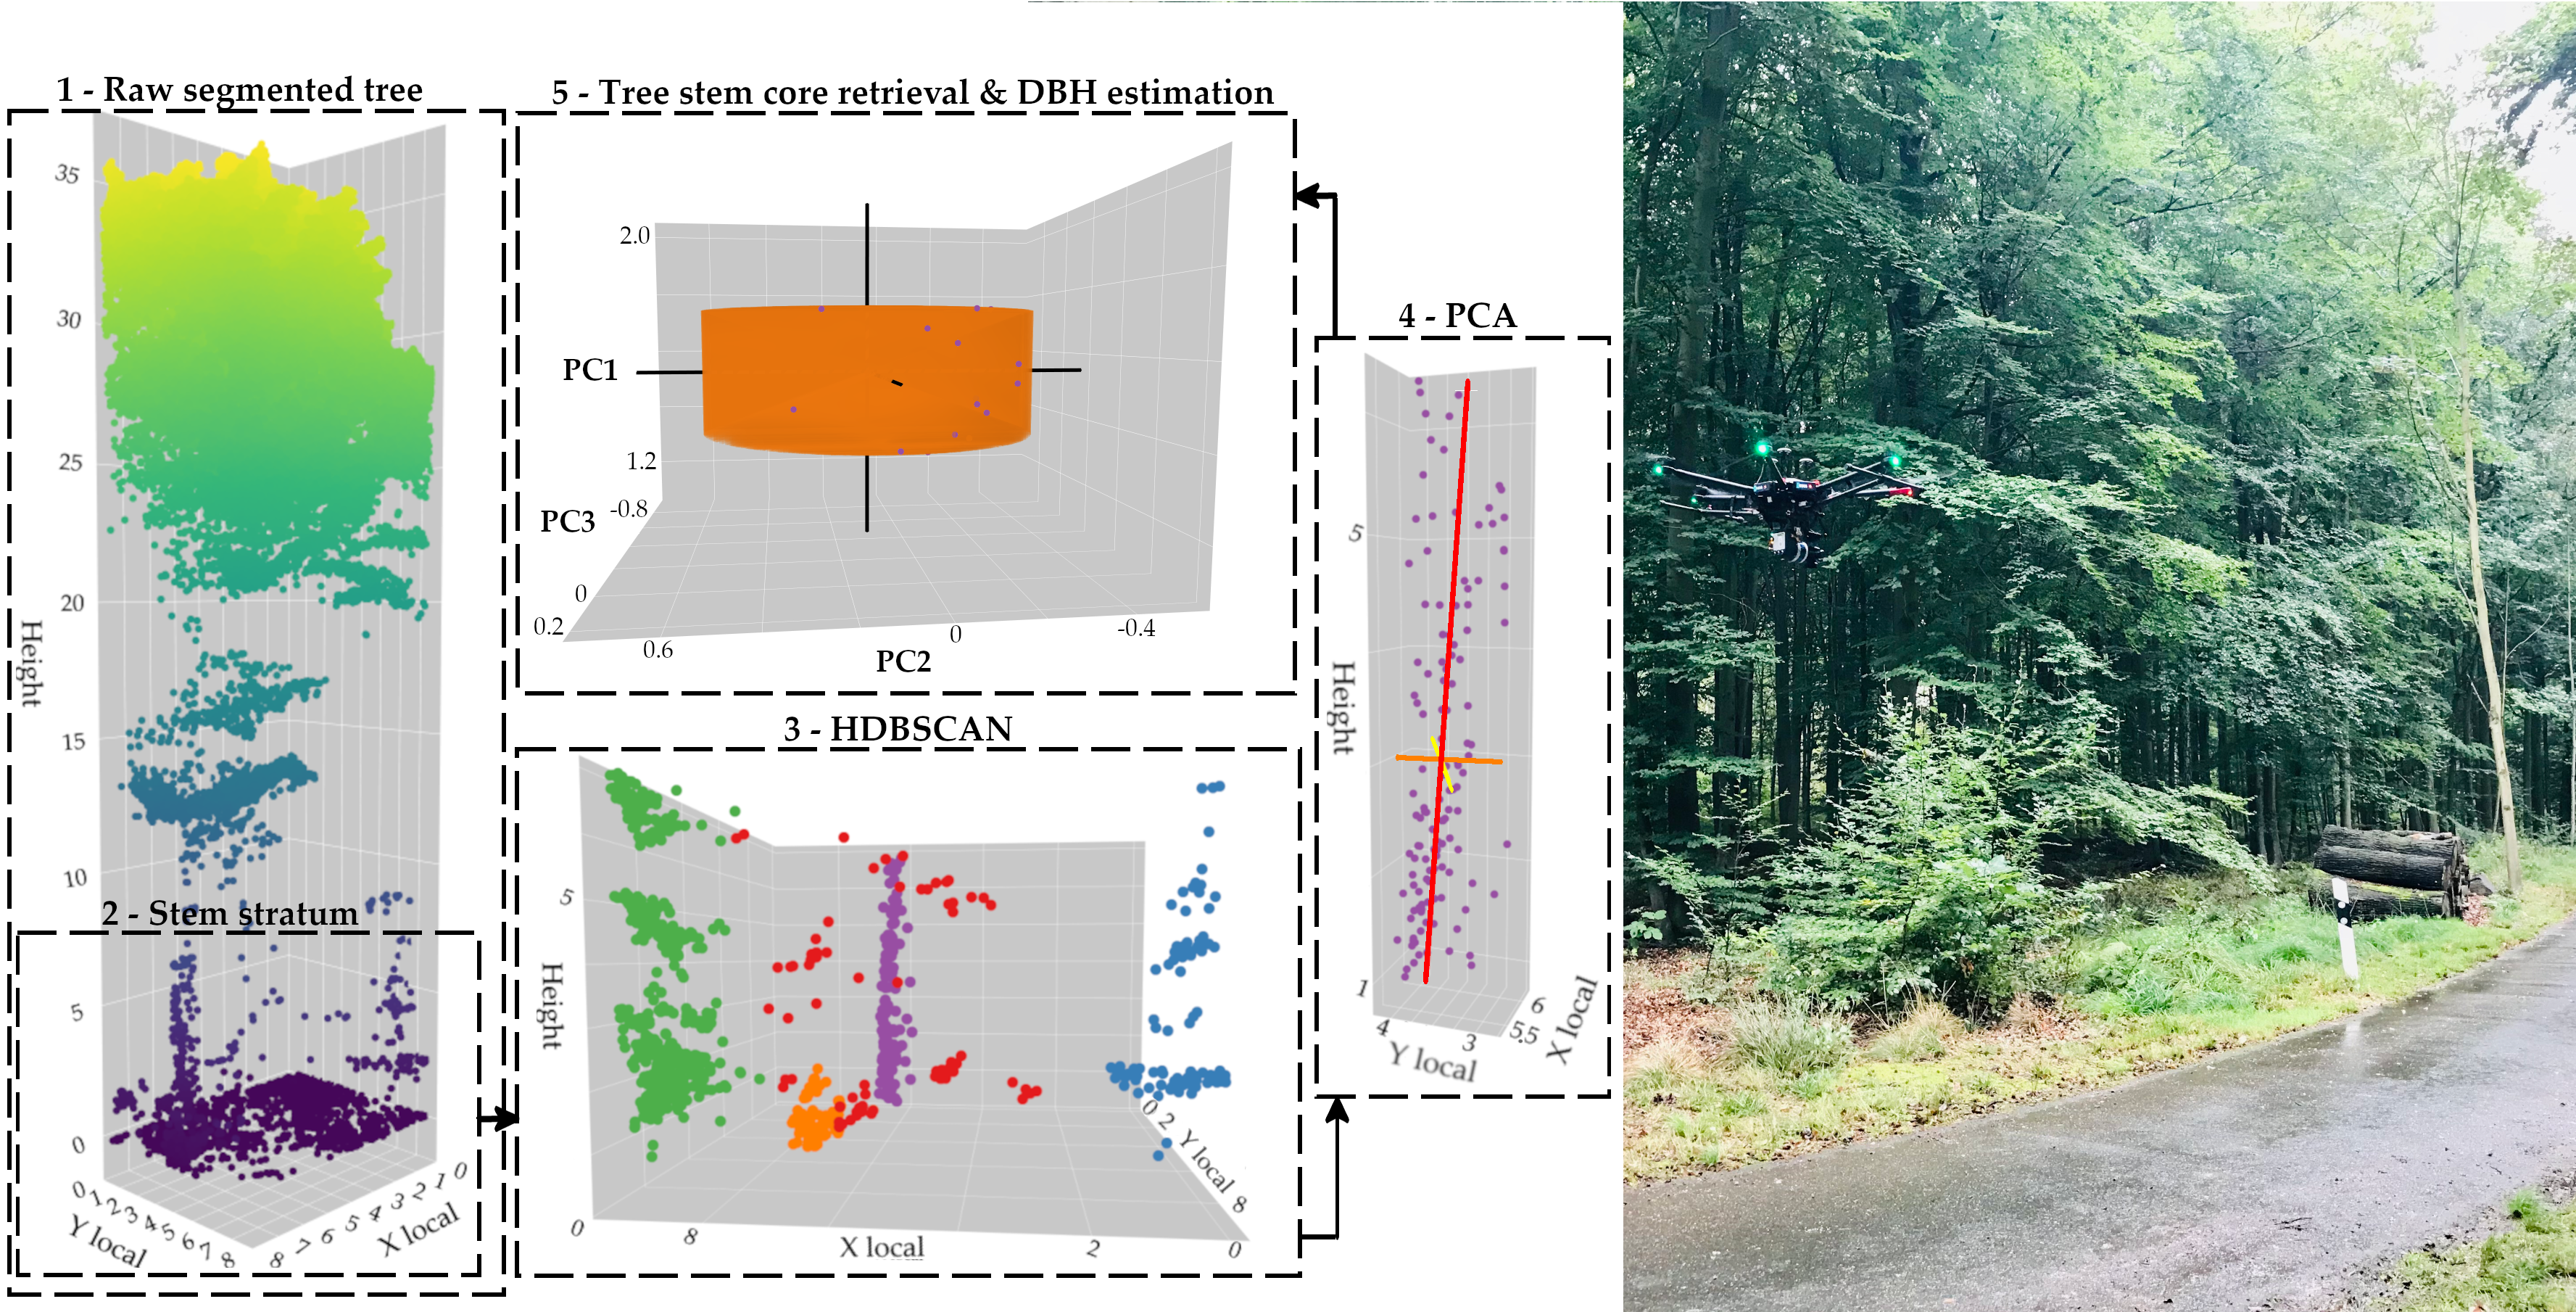
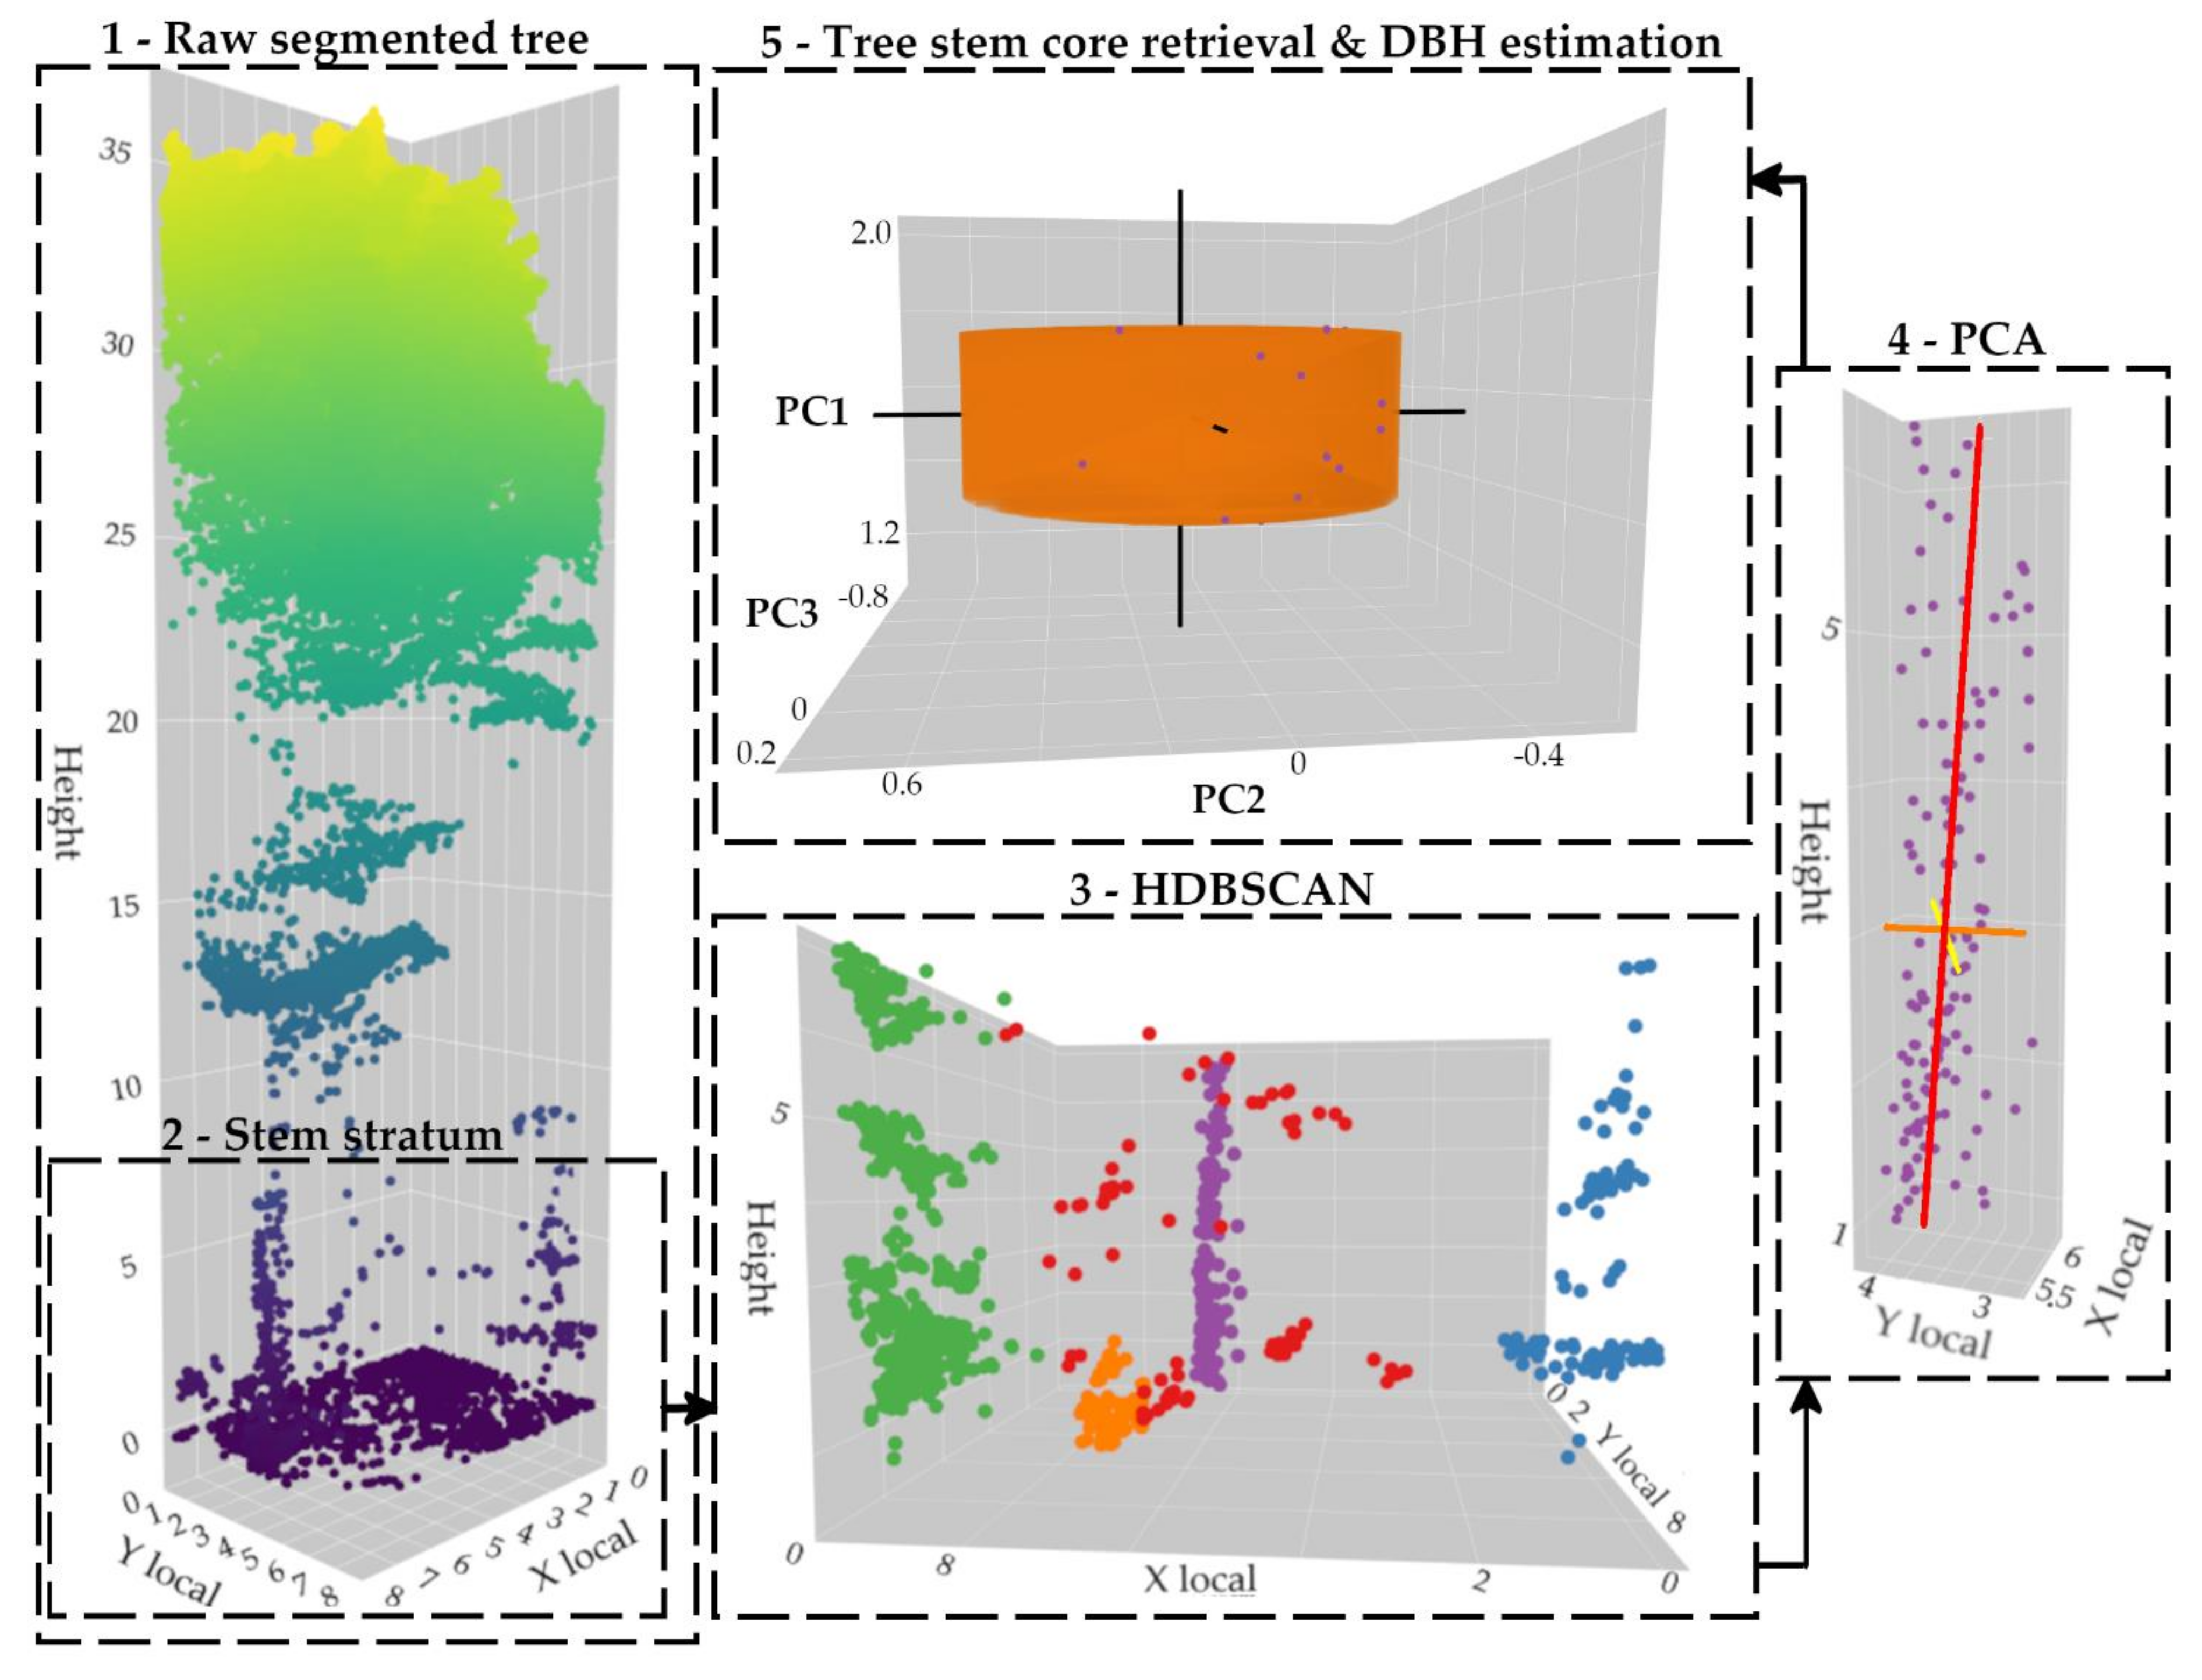
When the tree stem is segmented and classified, the PCA method is applied to determine its growth direction [50,59,97]. As a result, the first principal component (PC1) is mainly oriented towards the vertical direction of the tree trunk; the second (PC2) and the third (PC3) components are oriented into a perpendicular plan. Finally, points between 1.2- and 1.4-m heights are used to estimate the DBH. For that purpose, a circle is fit in a least squares fashion by applying the QR decomposition (using an orthogonal matrix Q and an upper triangular matrix R), which is a suitable (i.e., fast) solution for relatively noise free input data [98,99]. Figure 7 summarizes the processing chain.
4. Results
4.1. Introduction
From a methodological and technical point of view, the validation procedure was validated using field measures as ground truth (similarly to [100,101]) within the R software environment and using several packages for point cloud processing (e.g., lidR, TreeLS, and dbscan) and data visualization (plotly). Note that additional verification methods exist, such as the manual delineation from the LiDAR dataset [102,103].
4.2. Tree Trunk Detection & Segmentation
The accuracy assessment for individual tree detection was carried out with three indicators—recall (r), precision (p), and F-score (F)—using the following equations [104,105]:
where TP stands for true positive, FP for false positive, and FN false positive, which respectively depict correct segmentation, over-segmentation, and under-segmentation. Note that FP is also called commission error (i.e., when a tree stem is segmented but does actually fit another object) and FN is called omission error (i.e., when a tree stem is not segmented while it actually exists). With this in mind, recall (r) quantifies the completeness of detected tree stems regarding the reference dataset; precision (p) represents the correctness of detected tree trunks with respect to the set of found tree stems; and F-score is an overall indicator, taking both commission and omission errors into account [106]. Note that all these indicators vary from 0 to 1, and that the higher the value, the more accurate the segmentation.
As shown in Table 2, the ratio of correctly detected tree stems (i.e., the recall factor) varies from 18% (leaf-on season with a MSAR of 12°) to 82% (leaf-off season with a MSAR of 75°) of the dataset. Overall, independently of the season, the wider the processing scanning angle range, the higher the detection rate. Furthermore, it is noteworthy that the number of correctly detected tree trunks is greater during the leaf-off season with the lowest MSAR (12°) compared to the highest MSAR (75°) acquired during the leaf-on season. Finally, we also note that the highest precision scores are usually observed at low (12°) and high (75°) scanning angle ranges.
4.3. DBH
The assessment of estimated DBHs was determined by computing the bias and the Root Mean Square Error (RMSE). They were computed as follows [50]:
where N is the number of trees for which a DBH value is estimated (i.e., with at least three points); and respectively, denote the reference (i.e., measured in the field) and estimated (i.e., from the point cloud) DBHs. Note that DBHs beyond the expected limit values (i.e., larger than 1.5 m within the study area) were removed from the analysis (only one DBH in this study).
First of all, the number of estimated DBHs ranges from eight (leaf-on season using a 12° MSAR) to 66 (leaf-off season with a 75° MSAR), which is, respectively, 7% to 60% of the dataset. The bias varies from −0.07 m (leaf-off season using a 75° MSAR) to −0.38 m (leaf-off season using a 12° MSAR), while the RMSE varies from 0.15 m (leaf-on season using a 75° MSAR) to 0.42 m (leaf-off season and 12° MSAR). Overall, the estimations become more accurate and precise when increasing the MSAR regardless of the season. It is also noteworthy that despite a higher number of estimated DBHs, the bias and RMSE significantly increased when shifting from the leaf-on with a 75° MSAR to the leaf-off season with a 12° MSAR. Figure 8 illustrates the most relevant results from the leaf-on and leaf-off seasons—i.e., using a 50° and 75° MSAR.
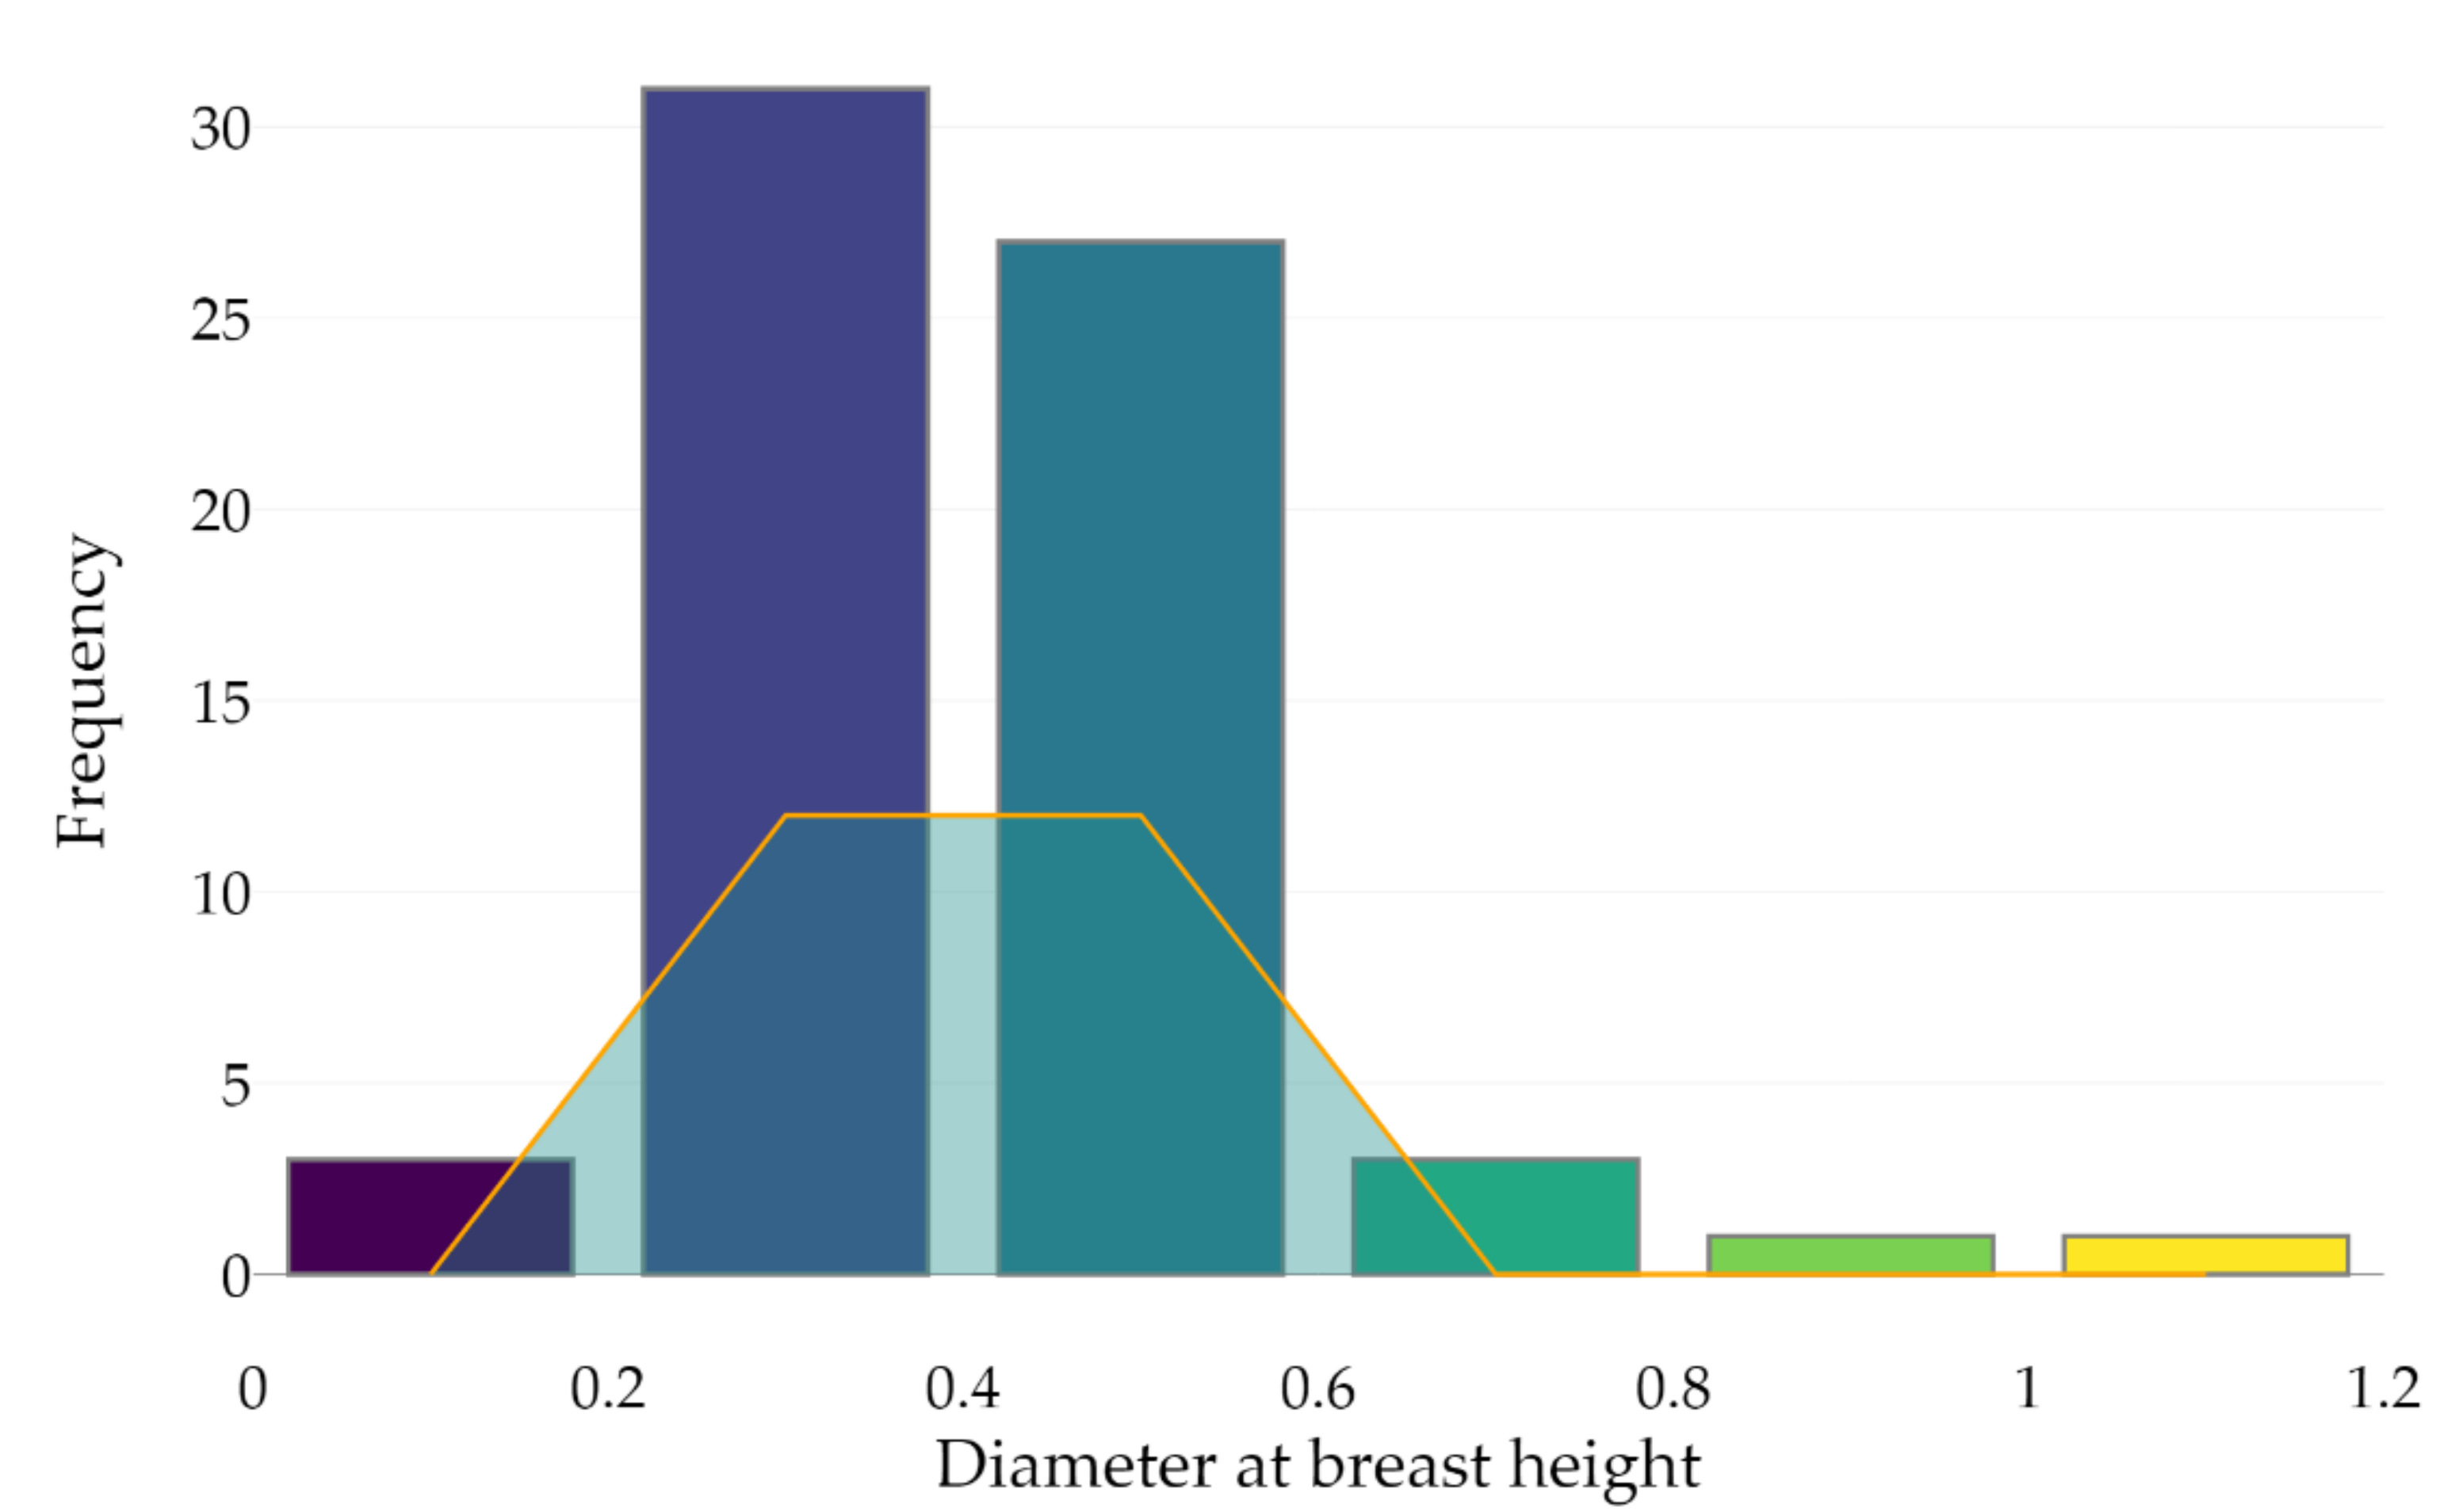
A deeper analysis of the outcomes shows that the leaf-off season with a 75° MSAR correctly detected 66 out of 90 points that were used to estimate the DBH, meaning that 24 trunks were captured with less than three points at approximately 1.2 and 1.4 m heights above the ground (minimum required number to assess the DBH). As shown in Figure 9, 24 out of 66 tree stems (22% of the dataset) were classified into the right category of DBH (considering a 0.2 m boundary); 42 trunks were then misclassified.
5. Discussion
5.1. Back to the Research Objectives
The purpose of this research was to develop a complete workflow that does not rely on the definition of site-specific parameters in segmenting tree stems. This concern arose from the high complexity in settings that must be configured. For that matter, the machine learning HDBSCAN clustering algorithm was applied to cluster points. This hierarchical version of DBSCAN has the advantage of getting rid of the maximum distance parameter between two points to be considered as part of the same cluster. However, this algorithm preserves the minimum number of points within a cluster, which was overcome by an iterative procedure paired to a binary search. As a result, the user’s involvement in extracting tree trunks is limited to the bole and tree stem classification with respect to the canopy and understory.
Then, this workflow was validated within a deciduous forest stand during the leaf-on and leaf-off seasons while using various MSARs. The results firstly show a high detection robustness with a precision score higher than 90% for all tested configurations. This study also points out that, within the studied forest stand, the tree stem detection was better achieved during the leaf-off season along when incorporating beams from a wide scanning angle range. For that matter, this latter setup also greatly influences the accuracy and precision of the DBH estimation, as the larger the MSAR, the higher the point density is over the trunk surface at around a 1.3 m height above the ground. However, this configuration has some pitfalls, since data artefacts due to multipath simultaneously increase (also mentioned in [107]), especially during the leaf-off season. Indeed, the high foliage density during the leaf-on season reduces the likelihood of receiving reflected pulses. As such, the use of an external DEM from the leaf-on season was required to remove falsely located underground points.
5.2. Limitations and Perspectives
This paper only investigates the tree stem delineation and DBH estimation within a single temperate deciduous forest stand. Supplementary tests are thus required to increase the confidence in the methodology and generalize it—for instance, within additional deciduous (of different species composition and structure) and also coniferous forests. Furthermore, it should be noted that the data acquisition for the leaf-off season was conducted during the autumn with some remaining leaves. Additional flights should thus be carried out during the winter to remove this constraint.
Additionally, this research shows, under the study conditions, the limits of the UAV-mounted LiDAR solution within temperate deciduous closed-canopy forest stands, especially for accurate DBH estimation. This conclusion is also drawn in [67], where the accuracy of above-canopy UAV-mounted LiDAR systems was found to be unsatisfactory to estimate the tree stem attributes for accurate field reference data. In this study, only 60% of our dataset could be used (at best) for further DBH estimation—i.e., with at least three points at approximately 1.2 and 1.4 m in height above the ground. This may be explained by the high proportion of occluded areas (unlike open stands) and the tree stem direction regarding the incoming pulse direction. Furthermore, only 22% of the tree stems were classified into the right category of DBH. This low proportion may result from the small number of points at around a 1.3 m height along with the circle fitting method (the QR decomposition) [46,108]. Additionally, the positional drift of the scanner may have affected the modeling accuracy of the tree stem and subsequently the DBH. Thereupon, methods that match displaced tree stem models corresponding to a single tree could be used in the future to alleviate this issue [50,108,109]. As a result, autonomous drones that can both operate above and beneath the canopy are a promising solution for accurately estimating the DBH in such environments. Indeed, their capacity to fly at the same height as the tree stem stratum guarantees a spatially more continuous coverage of the tree stem surface. This would thus allow to combine the advantages of UAV-mounted LiDAR and TLS. For that matter, manually piloted UAVs beneath the canopy have already been tested for DBH estimation along with the tree stem volume estimation if coupled with above-canopy laser scanning [69,110].
Furthermore, from a methodological perspective this study simply takes advantage of the ordinary PCA to extract the tree stem orientation. While it is suitable for tilted tree trunks, this assumption cannot be made for bent tree stems, which would require a nonlinear PCA adjustment to improve the tree stem orientation extraction along with the DBH estimation. However, it is noteworthy that the current proposed tree stem detection method can already improve the individual tree detection accuracy if combined with top-down-based methods (as shown in [68]), along with assisting further tree metrics retrieval (e.g., tree stem curve). In this context, additional hierarchical clustering could also be carried out to link false positives to their mother tree along with splitting clusters that are too large into its children.
6. Conclusions
This paper proposes a method to segment tree stems in a deciduous forest stand that does not rely on any site-specific parameters. To achieve that, this research benefits from the HDBSCAN clustering algorithm from machine learning, which was implemented in a way to avoid the definition of the minimum number of points within a cluster. The workflow was then validated in a temperate deciduous closed-canopy forest during the leaf-on and leaf-off seasons. The outcomes of this study show that the proposed methodology can correctly detect up to 82% of tree stems with a precision of 98% (leaf-off season and an MSAR of 75°). Additionally, this research points out that the over-canopy UAV laser scanning has limitations in segmenting tree trunks with closed canopy forests during the leaf-on season. During this season, it is therefore recommended to keep beams from a wide scanning angle range in order to maximize the point density over the tree stem. The same is also true during the leaf-off season, except that data artefacts due to multipaths are clearly observed. However, this can be partially solved using a DEM from the leaf-on season, thus removing returns that are falsely located under the ground.
Additionally, this research shows that, inside closed-canopy forest stands and under the study conditions, the point density remains low within an approximately 1.3 m height above the ground even during the leaf-off season, which prevents the use of over-canopy UAV laser scanning to accurately estimate the DBH in such environments. As a result, it might be interesting to fly under the canopy to increase the tree stem coverage. Autonomous drones that can both operate above and under the canopy are a promising solution to tackle this issue, and will be further investigated along with deep neural network methods for clustering and dimensionality purposes.
Author Contributions
R.N. conceived the research question, assisted with data acquisition, designed and implemented the proposed methodology, validated and discussed the results, and wrote the manuscript; F.J. also developed the research question, assisted with data acquisition and the interpretation of results, and revised and edited the manuscript; J.S.B. participated in the LiDAR data acquisition process, produced the raw LiDAR datasets, and revised and edited the manuscript. All authors have read and agreed to the published version of the manuscript.
Funding
This study was funded in part by the Fonds de la Recherche Scientifique (FRS-FNRS), Belgium, and in part by the Deutsche Forschungsgemeinschaft (DFG, German Research Foundation) under Germany’s Excellence Strategy-EXC 2070-390732324 and the Helmholtz Association Modular Observation solutions for Earth Systems (MOSES) Initiative.
Institutional Review Board Statement
Not applicable.
Informed Consent Statement
Not applicable.
Acknowledgments
We want to thank the anonymous reviewers for their relevant and in-depth comments.
Conflicts of Interest
The authors declare no conflict of interest. The funders had no role in the design of the study; in the collection, analysis, or interpretation of data; in the writing of the manuscript; or in the decision to publish the results.
References
- Banskota, A.; Kayastha, N.; Falkowski, M.J.; Wulder, M.A.; Froese, R.E.; White, J.C. Forest Monitoring Using Landsat Time Series Data: A Review. Can. J. Remote Sens. 2014, 40, 362–384. [Google Scholar] [CrossRef]
- Bastin, J.-F.; Finegold, Y.; Garcia, C.; Mollicone, D.; Rezende, M.; Routh, D.; Zohner, C.M.; Crowther, T.W. The Global Tree Restoration Potential. Science 2019, 365, 76–79. [Google Scholar] [CrossRef]
- Jonard, F.; André, F.; Ponette, Q.; Vincke, C.; Jonard, M. Sap Flux Density and Stomatal Conductance of European Beech and Common Oak Trees in Pure and Mixed Stands during the Summer Drought of 2003. J. Hydrol. 2011, 409, 371–381. [Google Scholar] [CrossRef]
- Trumbore, S.; Brando, P.; Hartmann, H. Forest Health and Global Change. Science 2015, 349, 814–818. [Google Scholar] [CrossRef] [Green Version]
- Lewis, S.L.; Wheeler, C.E.; Mitchard, E.T.A.; Koch, A. Restoring Natural Forests Is the Best Way to Remove Atmospheric Carbon. Nature 2019, 568, 25–28. [Google Scholar] [CrossRef] [PubMed]
- Romijn, E.; Lantican, C.B.; Herold, M.; Lindquist, E.; Ochieng, R.; Wijaya, A.; Murdiyarso, D.; Verchot, L. Assessing Change in National Forest Monitoring Capacities of 99 Tropical Countries. For. Ecol. Manag. 2015, 352, 109–123. [Google Scholar] [CrossRef] [Green Version]
- Palmer Fry, B. Community Forest Monitoring in REDD+: The ‘M’ in MRV? Environ. Sci. Policy 2011, 14, 181–187. [Google Scholar] [CrossRef]
- Ke, Y.; Quackenbush, L.J. A Review of Methods for Automatic Individual Tree-Crown Detection and Delineation from Passive Remote Sensing. Int. J. Remote Sens. 2011, 32, 4725–4747. [Google Scholar] [CrossRef]
- Almeida, D.R.A.; Broadbent, E.N.; Zambrano, A.M.A.; Wilkinson, B.E.; Ferreira, M.E.; Chazdon, R.; Meli, P.; Gorgens, E.B.; Silva, C.A.; Stark, S.C.; et al. Monitoring the Structure of Forest Restoration Plantations with a Drone-Lidar System. Int. J. Appl. Earth Obs. Geoinf. 2019, 79, 192–198. [Google Scholar] [CrossRef]
- Boyd, D.S.; Danson, F.M. Satellite Remote Sensing of Forest Resources: Three Decades of Research Development. Prog. Phys. Geogr. Earth Environ. 2005, 29, 1–26. [Google Scholar] [CrossRef]
- He, H.; Yan, Y.; Chen, T.; Cheng, P. Tree Height Estimation of Forest Plantation in Mountainous Terrain from Bare-Earth Points Using a DoG-Coupled Radial Basis Function Neural Network. Remote Sens. 2019, 11, 1271. [Google Scholar] [CrossRef] [Green Version]
- Goodwin, N.R.; Coops, N.C.; Culvenor, D.S. Assessment of Forest Structure with Airborne LiDAR and the Effects of Platform Altitude. Remote Sens. Environ. 2006, 103, 140–152. [Google Scholar] [CrossRef]
- Pajares, G. Overview and Current Status of Remote Sensing Applications Based on Unmanned Aerial Vehicles (UAVs). Photogramm. Eng. Remote Sens. 2015, 81, 281–330. [Google Scholar] [CrossRef] [Green Version]
- Jaakkola, A.; Hyyppä, J.; Kukko, A.; Yu, X.; Kaartinen, H.; Lehtomäki, M.; Lin, Y. A Low-Cost Multi-Sensoral Mobile Mapping System and Its Feasibility for Tree Measurements. ISPRS J. Photogramm. Remote Sens. 2010, 65, 514–522. [Google Scholar] [CrossRef]
- Toth, C.; Jóźków, G. Remote Sensing Platforms and Sensors: A Survey. ISPRS J. Photogramm. Remote Sens. 2016, 115, 22–36. [Google Scholar] [CrossRef]
- Goodbody, T.R.H.; Coops, N.C.; Tompalski, P.; Crawford, P.; Day, K.J.K. Updating Residual Stem Volume Estimates Using ALS- and UAV-Acquired Stereo-Photogrammetric Point Clouds. Int. J. Remote Sens. 2017, 38, 2938–2953. [Google Scholar] [CrossRef]
- Roberts, M.; Shah, S.; Dey, D.; Truong, A.; Sinha, S.; Kapoor, A.; Hanrahan, P.; Joshi, N. Submodular Trajectory Optimization for Aerial 3D Scanning. In Proceedings of the 2017 IEEE International Conference on Computer Vision (ICCV); IEEE: Venice, Italy, 2017; pp. 5334–5343. [Google Scholar]
- Hepp, B.; Nießner, M.; Hilliges, O. Plan3D: Viewpoint and Trajectory Optimization for Aerial Multi-View Stereo Reconstruction. ACM Trans. Graph. 2018, 38, 1–17. [Google Scholar] [CrossRef]
- Cheng, P.; Keller, J.; Kumar, V. Time-Optimal UAV Trajectory Planning for 3D Urban Structure Coverage. In Proceedings of the 2008 IEEE/RSJ International Conference on Intelligent Robots and Systems, Nice, France, 22–26 September 2008; IEEE: Piscataway, NJ, USA, 2008; pp. 2750–2757. [Google Scholar]
- Chakrabarty, A.; Langelaan, J. Energy Maps for Long-Range Path Planning for Small- and Micro- UAVs. In Proceedings of the AIAA Guidance, Navigation, and Control Conference, Chicago, IL, USA, 10–13 August 2009; American Institute of Aeronautics and Astronautics: Chicago, IL, USA, 2009; p. 13. [Google Scholar]
- Di Franco, C.; Buttazzo, G. Coverage Path Planning for UAVs Photogrammetry with Energy and Resolution Constraints. J. Intell. Robot. Syst. 2016, 83, 445–462. [Google Scholar] [CrossRef]
- Koch, T.; Körner, M.; Fraundorfer, F. Automatic and Semantically-Aware 3D UAV Flight Planning for Image-Based 3D Reconstruction. Remote Sens. 2019, 11, 1550. [Google Scholar] [CrossRef] [Green Version]
- Pestana, J.; Maurer, M.; Muschick, D.; Hofer, M.; Fraundorfer, F. Overview Obstacle Maps for Obstacle-Aware Navigation of Autonomous Drones. J. Field Robot. 2019, 36, 734–762. [Google Scholar] [CrossRef]
- Wallace, L.O.; Lucieer, A.; Watson, C.S. Assessing the Feasibility of Uav-Based Lidar for High Resolution Forest Change Detection. ISPRS Int. Arch. Photogramm. Remote Sens. Spat. Inf. Sci. 2012, 39, 499–504. [Google Scholar] [CrossRef] [Green Version]
- Wallace, L.; Lucieer, A.; Watson, C.S. Evaluating Tree Detection and Segmentation Routines on Very High Resolution UAV LiDAR Data. IEEE Trans. Geosci. Remote Sens. 2014, 52, 7619–7628. [Google Scholar] [CrossRef]
- Wallace, L.; Lucieer, A.; Malenovský, Z.; Turner, D.; Vopěnka, P. Assessment of Forest Structure Using Two UAV Techniques: A Comparison of Airborne Laser Scanning and Structure from Motion (SfM) Point Clouds. Forests 2016, 7, 62. [Google Scholar] [CrossRef] [Green Version]
- Yin, D.; Wang, L. Individual Mangrove Tree Measurement Using UAV-Based LiDAR Data: Possibilities and Challenges. Remote Sens. Environ. 2019, 223, 34–49. [Google Scholar] [CrossRef]
- Wallace, L.; Musk, R.; Lucieer, A. An Assessment of the Repeatability of Automatic Forest Inventory Metrics Derived From UAV-Borne Laser Scanning Data. IEEE Trans. Geosci. Remote Sens. 2014, 52, 7160–7169. [Google Scholar] [CrossRef]
- Kukko, A.; Hyyppä, J. Laser Scanner Simulator for System Analysis and Algorithm Development: A Case with Forest Measurements. In Proceedings of the ISPRS Workshop on Laser Scanning 2007 and SilviLaser 2007, Espoo, Finland, 12–14 September 2007; p. 7. [Google Scholar]
- Forsman, M.; Börlin, N.; Olofsson, K.; Reese, H.; Holmgren, J. Bias of Cylinder Diameter Estimation from Ground-Based Laser Scanners with Different Beam Widths: A Simulation Study. ISPRS J. Photogramm. Remote Sens. 2018, 135, 84–92. [Google Scholar] [CrossRef]
- Jucker, T.; Caspersen, J.; Chave, J.; Antin, C.; Barbier, N.; Bongers, F.; Dalponte, M.; van Ewijk, K.Y.; Forrester, D.I.; Haeni, M.; et al. Allometric Equations for Integrating Remote Sensing Imagery into Forest Monitoring Programmes. Glob. Change Biol. 2017, 23, 177–190. [Google Scholar] [CrossRef]
- Muhairwe, C.K. Taper Equations for Eucalyptus Pilularis and Eucalyptus Grandis for the North Coast in New South Wales, Australia. For. Ecol. Manag. 1999, 113, 251–269. [Google Scholar] [CrossRef]
- Williams, M.S.; Schreuder, H.T. Guidelines for Choosing Volume Equations in the Presence of Measurement Error in Height. Can. J. For. Res. 2000, 30, 306–310. [Google Scholar] [CrossRef]
- Lovell, J.L.; Jupp, D.L.B.; Newnham, G.J.; Coops, N.C.; Culvenor, D.S. Simulation Study for Finding Optimal Lidar Acquisition Parameters for Forest Height Retrieval. For. Ecol. Manag. 2005, 214, 398–412. [Google Scholar] [CrossRef]
- Condit, R. Tropical Forest Census Plots: Methods and Results from Barro Colorado Island, Panama and a Comparison with Other Plots; Springer: Berlin/Heidelberg, Germany; R. G. Landes Company: Georgetown, TX, USA, 1998. [Google Scholar]
- Ferraz, A.; Saatchi, S.S.; Longo, M.; Clark, D.B. Tropical Tree Size–Frequency Distributions from Airborne Lidar. Ecol. Appl. 2020, 30. [Google Scholar] [CrossRef] [PubMed]
- Hamraz, H.; Contreras, M.A.; Zhang, J. Vertical Stratification of Forest Canopy for Segmentation of Understory Trees within Small-Footprint Airborne LiDAR Point Clouds. ISPRS J. Photogramm. Remote Sens. 2017, 130, 385–392. [Google Scholar] [CrossRef] [Green Version]
- Brede, B.; Lau, A.; Bartholomeus, H.; Kooistra, L. Comparing RIEGL RiCOPTER UAV LiDAR Derived Canopy Height and DBH with Terrestrial LiDAR. Sensors 2017, 17, 2371. [Google Scholar] [CrossRef]
- Maas, H.-G.; Bienert, A.; Scheller, S.; Keane, E. Automatic Forest Inventory Parameter Determination from Terrestrial Laser Scanner Data. Int. J. Remote Sens. 2008, 29, 1579–1593. [Google Scholar] [CrossRef]
- Henning, J.G.; Radtke, P.J. Detailed Stem Measurements of Standing Trees from Ground-Based Scanning Lidar. For. Sci. 2006, 52, 67–80. [Google Scholar]
- Liu, G.; Wang, J.; Dong, P.; Chen, Y.; Liu, Z. Estimating Individual Tree Height and Diameter at Breast Height (DBH) from Terrestrial Laser Scanning (TLS) Data at Plot Level. Forests 2018, 9, 398. [Google Scholar] [CrossRef] [Green Version]
- Liang, X.; Hyyppä, J.; Kaartinen, H.; Lehtomäki, M.; Pyörälä, J.; Pfeifer, N.; Holopainen, M.; Brolly, G.; Francesco, P.; Hackenberg, J.; et al. International Benchmarking of Terrestrial Laser Scanning Approaches for Forest Inventories. ISPRS J. Photogramm. Remote Sens. 2018, 144, 137–179. [Google Scholar] [CrossRef]
- Hyyppä, J.; Virtanen, J.-P.; Jaakkola, A.; Yu, X.; Hyyppä, H.; Liang, X. Feasibility of Google Tango and Kinect for Crowdsourcing Forestry Information. Forests 2017, 9, 6. [Google Scholar] [CrossRef] [Green Version]
- Fan, Y.; Feng, Z.; Mannan, A.; Khan, T.; Shen, C.; Saeed, S. Estimating Tree Position, Diameter at Breast Height, and Tree Height in Real-Time Using a Mobile Phone with RGB-D SLAM. Remote Sens. 2018, 10, 1845. [Google Scholar] [CrossRef] [Green Version]
- Bauwens, S.; Bartholomeus, H.; Calders, K.; Lejeune, P. Forest Inventory with Terrestrial LiDAR: A Comparison of Static and Hand-Held Mobile Laser Scanning. Forests 2016, 7, 127. [Google Scholar] [CrossRef] [Green Version]
- Del Perugia, B.; Giannetti, F.; Chirici, G.; Travaglini, D. Influence of Scan Density on the Estimation of Single-Tree Attributes by Hand-Held Mobile Laser Scanning. Forests 2019, 10, 277. [Google Scholar] [CrossRef] [Green Version]
- Marselis, S.M.; Yebra, M.; Jovanovic, T.; van Dijk, A.I.J.M. Deriving Comprehensive Forest Structure Information from Mobile Laser Scanning Observations Using Automated Point Cloud Classification. Environ. Model. Softw. 2016, 82, 142–151. [Google Scholar] [CrossRef]
- Liang, X.; Kukko, A.; Hyyppä, J.; Lehtomäki, M.; Pyörälä, J.; Yu, X.; Kaartinen, H.; Jaakkola, A.; Wang, Y. In-Situ Measurements from Mobile Platforms: An Emerging Approach to Address the Old Challenges Associated with Forest Inventories. ISPRS J. Photogramm. Remote Sens. 2018, 143, 97–107. [Google Scholar] [CrossRef]
- Liang, X.; Kukko, A.; Kaartinen, H.; Hyyppä, J.; Yu, X.; Jaakkola, A.; Wang, Y. Possibilities of a Personal Laser Scanning System for Forest Mapping and Ecosystem Services. Sensors 2014, 14, 1228–1248. [Google Scholar] [CrossRef] [PubMed]
- Hyyppä, E.; Kukko, A.; Kaijaluoto, R.; White, J.C.; Wulder, M.A.; Pyörälä, J.; Liang, X.; Yu, X.; Wang, Y.; Kaartinen, H.; et al. Accurate Derivation of Stem Curve and Volume Using Backpack Mobile Laser Scanning. ISPRS J. Photogramm. Remote Sens. 2020, 161, 246–262. [Google Scholar] [CrossRef]
- Wu, J.; Yao, W.; Polewski, P. Mapping Individual Tree Species and Vitality along Urban Road Corridors with LiDAR and Imaging Sensors: Point Density versus View Perspective. Remote Sens. 2018, 10, 1403. [Google Scholar] [CrossRef] [Green Version]
- Čerňava, J.; Tuček, J.; Koreň, M.; Mokroš, M. Estimation of Diameter at Breast Height from Mobile Laser Scanning Data Collected under a Heavy Forest Canopy. J. For. Sci. 2017, 63, 433–441. [Google Scholar] [CrossRef]
- Bienert, A.; Georgi, L.; Kunz, M.; Maas, H.-G.; von Oheimb, G. Comparison and Combination of Mobile and Terrestrial Laser Scanning for Natural Forest Inventories. Forests 2018, 9, 395. [Google Scholar] [CrossRef] [Green Version]
- Zhao, Y.; Hu, Q.; Li, H.; Wang, S.; Ai, M. Evaluating Carbon Sequestration and PM2.5 Removal of Urban Street Trees Using Mobile Laser Scanning Data. Remote Sens. 2018, 10, 1759. [Google Scholar] [CrossRef] [Green Version]
- Wu, B.; Yu, B.; Yue, W.; Shu, S.; Tan, W.; Hu, C.; Huang, Y.; Wu, J.; Liu, H. A Voxel-Based Method for Automated Identification and Morphological Parameters Estimation of Individual Street Trees from Mobile Laser Scanning Data. Remote Sens. 2013, 5, 584–611. [Google Scholar] [CrossRef] [Green Version]
- Chisholm, R.A.; Cui, J.; Lum, S.K.Y.; Chen, B.M. UAV LiDAR for Below-Canopy Forest Surveys. J. Unmanned Veh. Syst. 2013, 01, 61–68. [Google Scholar] [CrossRef] [Green Version]
- Wieser, M.; Mandlburger, G.; Hollaus, M.; Otepka, J.; Glira, P.; Pfeifer, N. A Case Study of UAS Borne Laser Scanning for Measurement of Tree Stem Diameter. Remote Sens. 2017, 9, 1154. [Google Scholar] [CrossRef] [Green Version]
- Dalla Corte, A.P.; Rex, F.E.; Almeida, D.R.A.; de Sanquetta, C.R.; Silva, C.A.; Moura, M.M.; Wilkinson, B.; Zambrano, A.M.A.; Cunha Neto, E.M.; da Veras, H.F.P.; et al. Measuring Individual Tree Diameter and Height Using GatorEye High-Density UAV-Lidar in an Integrated Crop-Livestock-Forest System. Remote Sens. 2020, 12, 863. [Google Scholar] [CrossRef] [Green Version]
- Jaakkola, A.; Hyyppä, J.; Yu, X.; Kukko, A.; Kaartinen, H.; Liang, X.; Hyyppä, H.; Wang, Y. Autonomous Collection of Forest Field Reference—The Outlook and a First Step with UAV Laser Scanning. Remote Sens. 2017, 9, 785. [Google Scholar] [CrossRef] [Green Version]
- Puliti, S.; Breidenbach, J.; Astrup, R. Estimation of Forest Growing Stock Volume with UAV Laser Scanning Data: Can It Be Done without Field Data? Remote Sens. 2020, 12, 19. [Google Scholar] [CrossRef] [Green Version]
- Kuželka, K.; Slavík, M.; Surový, P. Very High Density Point Clouds from UAV Laser Scanning for Automatic Tree Stem Detection and Direct Diameter Measurement. Remote Sens. 2020, 12, 1236. [Google Scholar] [CrossRef] [Green Version]
- Hyyppä, E.; Yu, X.; Kaartinen, H.; Hakala, T.; Kukko, A.; Vastaranta, M.; Hyyppä, J. Comparison of Backpack, Handheld, Under-Canopy UAV, and Above-Canopy UAV Laser Scanning for Field Reference Data Collection in Boreal Forests. Remote Sens. 2020, 12, 3327. [Google Scholar] [CrossRef]
- Rabbani, T. Efficient Hough Transform for Automatic Detection of Cylinders in Point Clouds. In Proceedings of the ISPRS Workshop Laser Scanning, Enschede, The Netherlands, 12–15 September 2005; pp. 60–65. [Google Scholar]
- Simonse, M.; Aschoff, T.; Spiecker, H.; Thies, M. Automatic Determination of Forest Inventory Parameters Using Terrestrial Laser Scanning. In Proceedings of the Scandlaser Scientific Workshop on Airborne Laser Scanning of Forests; Sveriges Lantbruksuniversitet: Umeå, Sweden, 2003; pp. 251–257. [Google Scholar]
- Olofsson, K.; Holmgren, J.; Olsson, H. Tree Stem and Height Measurements Using Terrestrial Laser Scanning and the RANSAC Algorithm. Remote Sens. 2014, 6, 4323–4344. [Google Scholar] [CrossRef] [Green Version]
- Liang, X.; Litkey, P.; Hyyppa, J.; Kaartinen, H.; Vastaranta, M.; Holopainen, M. Automatic Stem Mapping Using Single-Scan Terrestrial Laser Scanning. IEEE Trans. Geosci. Remote Sens. 2012, 50, 661–670. [Google Scholar] [CrossRef]
- Xia, S.; Wang, C.; Pan, F.; Xi, X.; Zeng, H.; Liu, H. Detecting Stems in Dense and Homogeneous Forest Using Single-Scan TLS. Forests 2015, 6, 3923–3945. [Google Scholar] [CrossRef] [Green Version]
- Wang, X.; Zhang, Y.; Luo, Z. Combining Trunk Detection With Canopy Segmentation to Delineate Single Deciduous Trees Using Airborne LiDAR Data. IEEE Access 2020, 8, 99783–99796. [Google Scholar] [CrossRef]
- Hyyppä, E.; Hyyppä, J.; Hakala, T.; Kukko, A.; Wulder, M.A.; White, J.C.; Pyörälä, J.; Yu, X.; Wang, Y.; Virtanen, J.-P.; et al. Under-Canopy UAV Laser Scanning for Accurate Forest Field Measurements. ISPRS J. Photogramm. Remote Sens. 2020, 164, 41–60. [Google Scholar] [CrossRef]
- Picos, J.; Bastos, G.; Míguez, D.; Alonso, L.; Armesto, J. Individual Tree Detection in a Eucalyptus Plantation Using Unmanned Aerial Vehicle (UAV)-LiDAR. Remote Sens. 2020, 12, 885. [Google Scholar] [CrossRef] [Green Version]
- Gorte, B.; Pfeifer, N. Structuring Laser-Scanned Trees Using 3d Mathematical Morphology. Nternational Arch. Photogramm. Remote Sens. 2004, 35, 929–933. [Google Scholar]
- Raumonen, P.; Kaasalainen, M.; Åkerblom, M.; Kaasalainen, S.; Kaartinen, H.; Vastaranta, M.; Holopainen, M.; Disney, M.; Lewis, P. Fast Automatic Precision Tree Models from Terrestrial Laser Scanner Data. Remote Sens. 2013, 5, 491–520. [Google Scholar] [CrossRef] [Green Version]
- Vonderach, C.; Voegtle, T.; Adler, P. Voxel-Based Approach for Estimating Urban Tree Volume from Terrestrial Laser Scanning Data. ISPRS Int. Arch. Photogramm. Remote Sens. Spat. Inf. Sci. 2012, 39, 451–456. [Google Scholar] [CrossRef] [Green Version]
- Campello, R.J.; Moulavi, D.; Zimek, A.; Sander, J. ACM Transactions on Knowledge Discovery from Data; University of Illinois at Urbana-Champaign: Champaign, IL, USA, 2015; pp. 1–51. [Google Scholar]
- Bakuła, K.; Salach, A.; Zelaya Wziątek, D.; Ostrowski, W.; Górski, K.; Kurczyński, Z. Evaluation of the Accuracy of Lidar Data Acquired Using a UAS for Levee Monitoring: Preliminary Results. Int. J. Remote Sens. 2017, 38, 2921–2937. [Google Scholar] [CrossRef]
- Zhang, K.; Chen, S.-C.; Whitman, D.; Shyu, M.-L.; Yan, J.; Zhang, C. A Progressive Morphological Filter for Removing Nonground Measurements from Airborne LIDAR Data. IEEE Trans. Geosci. Remote Sens. 2003, 41, 872–882. [Google Scholar] [CrossRef] [Green Version]
- Montealegre, A.; Lamelas, M.; Riva, J. Interpolation Routines Assessment in ALS-Derived Digital Elevation Models for Forestry Applications. Remote Sens. 2015, 7, 8631–8654. [Google Scholar] [CrossRef] [Green Version]
- Zhao, X.; Guo, Q.; Su, Y.; Xue, B. Improved Progressive TIN Densification Filtering Algorithm for Airborne LiDAR Data in Forested Areas. ISPRS J. Photogramm. Remote Sens. 2016, 117, 79–91. [Google Scholar] [CrossRef] [Green Version]
- Zhang, W.; Qi, J.; Wan, P.; Wang, H.; Xie, D.; Wang, X.; Yan, G. An Easy-to-Use Airborne LiDAR Data Filtering Method Based on Cloth Simulation. Remote Sens. 2016, 8, 501. [Google Scholar] [CrossRef]
- Evans, J.S.; Hudak, A.T. A Multiscale Curvature Algorithm for Classifying Discrete Return LiDAR in Forested Environments. IEEE Trans. Geosci. Remote Sens. 2007, 45, 1029–1038. [Google Scholar] [CrossRef]
- Kraus, K.; Pfeifer, N. Determination of terrain models in wooded areas with airborne laser scanner data. ISPRS J. Photogramm. Remote Sens. 1998, 53, 193–203. [Google Scholar] [CrossRef]
- Ioki, K.; Imanishi, J.; Sasaki, T.; Song, Y.; Morimoto, Y.; Hasegawa, H. Estimating Vertical Distribution of Vegetation Cover in Temperate Heterogeneous Forests Using Airborne Laser Scanning Data. Open J. For. 2012, 02, 89–96. [Google Scholar] [CrossRef] [Green Version]
- Zhang, W.; Montgomery, D.R. Digital Elevation Model Grid Size, Landscape Representation, and Hydrologic Simulations. Water Resour. Res. 1994, 30, 1019–1028. [Google Scholar] [CrossRef]
- Arundel, S.T.; Archuleta, C.-A.M.; Phillips, L.A.; Roche, B.L.; Constance, E.W. 1-Meter Digital Elevation Model Specification. In U.S. Geological Survey Techniques and Methods Collection and Delineation of Spatial Data; U.S. Geological Survey: Reston, VA, USA, 2015; p. 25. [Google Scholar]
- Rognant, L.; Goze, S.; Planès, J.G.; Chassery, J.M. Triangulated Digital Elevation Model: Definition of a New Representation. Int. Arch. Photogramm. Remote Sens. 1998, 32, 494–500. [Google Scholar]
- Walker, J.P.; Willgoose, G.R. On the Effect of Digital Elevation Model Accuracy on Hydrology and Geomorphology. Water Resour. Res. 1999, 35, 2259–2268. [Google Scholar] [CrossRef] [Green Version]
- Kienzle, S. The Effect of DEM Raster Resolution on First Order, Second Order and Compound Terrain Derivatives. Trans. GIS 2004, 8, 83–111. [Google Scholar] [CrossRef]
- Guo, Q.; Li, W.; Yu, H.; Alvarez, O. Effects of Topographic Variability and Lidar Sampling Density on Several DEM Interpolation Methods. Photogramm. Eng. Remote Sens. 2010, 76, 701–712. [Google Scholar] [CrossRef] [Green Version]
- Caruso, C.; Quarta, F. Interpolation Methods Comparison. Comput. Math. Appl. 1998, 35, 109–126. [Google Scholar] [CrossRef] [Green Version]
- Cressie, N. Spatial Prediction and Ordinary Kriging. Math. Geol. 1988, 20, 17. [Google Scholar] [CrossRef]
- Zimmerman, D.; Pavlik, C.; Ruggles, A.; Armstrong, M.P. An Experimental Comparison of Ordinary and Universal Kriging and Inverse Distance Weighting. Math. Geol. 1999, 31, 375–390. [Google Scholar] [CrossRef]
- Roussel, J.-R. Quantification Théorique Des Effets Du Paramétrage Du Système d’acquisition Sur Les Variables Descriptives Du Nuage de Points LiDAR. Ph.D. Thesis, Université Laval, Québec, QC, Canada, 2018. [Google Scholar]
- Xu, R.; WunschII, D. Survey of Clustering Algorithms. IEEE Trans. Neural Netw. 2005, 16, 645–678. [Google Scholar] [CrossRef] [Green Version]
- Dey, A. Machine Learning Algorithms: A Review. Int. J. Comput. Sci. Inf. Technol. 2016, 7, 6. [Google Scholar]
- Hamerly, G. Learning Structure and Concepts in Data Using Data Clustering. Ph.D. Thesis, University of California, San Diego, CA, USA, 2003. [Google Scholar]
- Omran, M.G.H.; Engelbrecht, A.P.; Salman, A. An Overview of Clustering Methods. Intell. Data Anal. 2007, 11, 583–605. [Google Scholar] [CrossRef]
- Lamprecht, S.; Stoffels, J.; Dotzler, S.; Haß, E.; Udelhoven, T. ATrunk—An ALS-Based Trunk Detection Algorithm. Remote Sens. 2015, 7, 9975–9997. [Google Scholar] [CrossRef] [Green Version]
- Gander, W.; Strebel, R.; Golub, G.H. Fitting of circles and ellipses least squares solution. In SVD and Signal Processing III; Elsevier: Amsterdam, The Netherlands, 1995; pp. 349–356. ISBN 978-0-444-82107-2. [Google Scholar]
- Gander, W.; Golub, G.H.; Strebel, R. Least-Squares Fitting of Circles and Ellipses. BIT 1994, 34, 558–578. [Google Scholar] [CrossRef]
- Wang, Y.; Weinacker, H.; Koch, B.; Stere, K. LiDAR Point Cloud Based Fully Automatic 3d Single Tree Modelling in Forest and Evaluations of the Procedure. Int. Arch. Photogramm. Remote Sens. Spat. Inf. Sci. 2008, 36, 45–51. [Google Scholar]
- Reitberger, J.; Schnörr, C.; Krzystek, P.; Stilla, U. 3D Segmentation of Single Trees Exploiting Full Waveform LIDAR Data. ISPRS J. Photogramm. Remote Sens. 2009, 64, 561–574. [Google Scholar] [CrossRef]
- Rahman, M.Z.A.; Gorte, B.G.H. Tree Crown Delineation from High Resolution Airborne Lidar Based on Densities of High Points. Int. Arch. Photogramm. Remote Sens. 2014, 38, 123–128. [Google Scholar]
- Jing, L.; Hu, B.; Li, J.; Noland, T. Automated Delineation of Individual Tree Crowns from Lidar Data by Multi-Scale Analysis and Segmentation. Photogramm. Eng. Remote Sens. 2012, 78, 1275–1284. [Google Scholar] [CrossRef]
- Goutte, C.; Gaussier, E. A Probabilistic Interpretation of Precision, Recall and F -Score, with Implication for Evaluation. In Proceedings of the Advances in Information Retrieval; Springer: Berlin/Heidelberg, Germany, 2005; Volume 3408, pp. 345–359. [Google Scholar]
- Sokolova, M.; Japkowicz, N.; Szpakowicz, S. Beyond Accuracy, F-Score and ROC: A Family of Discriminant Measures for Performance Evaluation. In AI 2006: Advances in Artificial Intelligence; Sattar, A., Kang, B., Eds.; Lecture Notes in Computer Science; Springer: Berlin, Heidelberg, Germany, 2006; Volume 4304, pp. 1015–1021. ISBN 978-3-540-49787-5. [Google Scholar]
- Lu, X.; Guo, Q.; Li, W.; Flanagan, J. A Bottom-up Approach to Segment Individual Deciduous Trees Using Leaf-off Lidar Point Cloud Data. ISPRS J. Photogramm. Remote Sens. 2014, 94, 1–12. [Google Scholar] [CrossRef]
- Gatziolis, D.; Andersen, H.-E. A Guide to LIDAR Data Acquisition and Processing for the Forests of the Pacific Northwest; U.S. Department of Agriculture, Forest Service, Pacific Northwest Research Station: Portland, OR, USA, 2008; p. PNW-GTR-768.
- Čerňava, J.; Mokroš, M.; Tuček, J.; Antal, M.; Slatkovská, Z. Processing Chain for Estimation of Tree Diameter from GNSS-IMU-Based Mobile Laser Scanning Data. Remote Sens. 2019, 11, 615. [Google Scholar] [CrossRef] [Green Version]
- Holmgren, J.; Tulldahl, M.; Nordlöf, J.; Willén, E.; Olsson, H. Mobile Laser Scanning for Estimating Tree Stem Diameter Using Segmentation and Tree Spine Calibration. Remote Sens. 2019, 11, 2781. [Google Scholar] [CrossRef] [Green Version]
- Krisanski, S.; Taskhiri, M.S.; Turner, P. Enhancing Methods for Under-Canopy Unmanned Aircraft System Based Photogrammetry in Complex Forests for Tree Diameter Measurement. Remote Sens. 2020, 12, 1652. [Google Scholar] [CrossRef]
- Hoeser, T.; Kuenzer, C. Object Detection and Image Segmentation with Deep Learning on Earth Observation Data: A Review-Part I: Evolution and Recent Trends. Remote Sens. 2020, 12, 1667. [Google Scholar] [CrossRef]
- Pleșoianu, A.-I.; Stupariu, M.-S.; Șandric, I.; Pătru-Stupariu, I.; Drăguț, L. Individual Tree-Crown Detection and Species Classification in Very High-Resolution Remote Sensing Imagery Using a Deep Learning Ensemble Model. Remote Sens. 2020, 12, 2426. [Google Scholar] [CrossRef]
- Aljalbout, E.; Golkov, V.; Siddiqui, Y.; Strobel, M.; Cremers, D. Clustering with Deep Learning: Taxonomy and New Methods. arXiv 2018, arXiv:1801.07648. [Google Scholar]
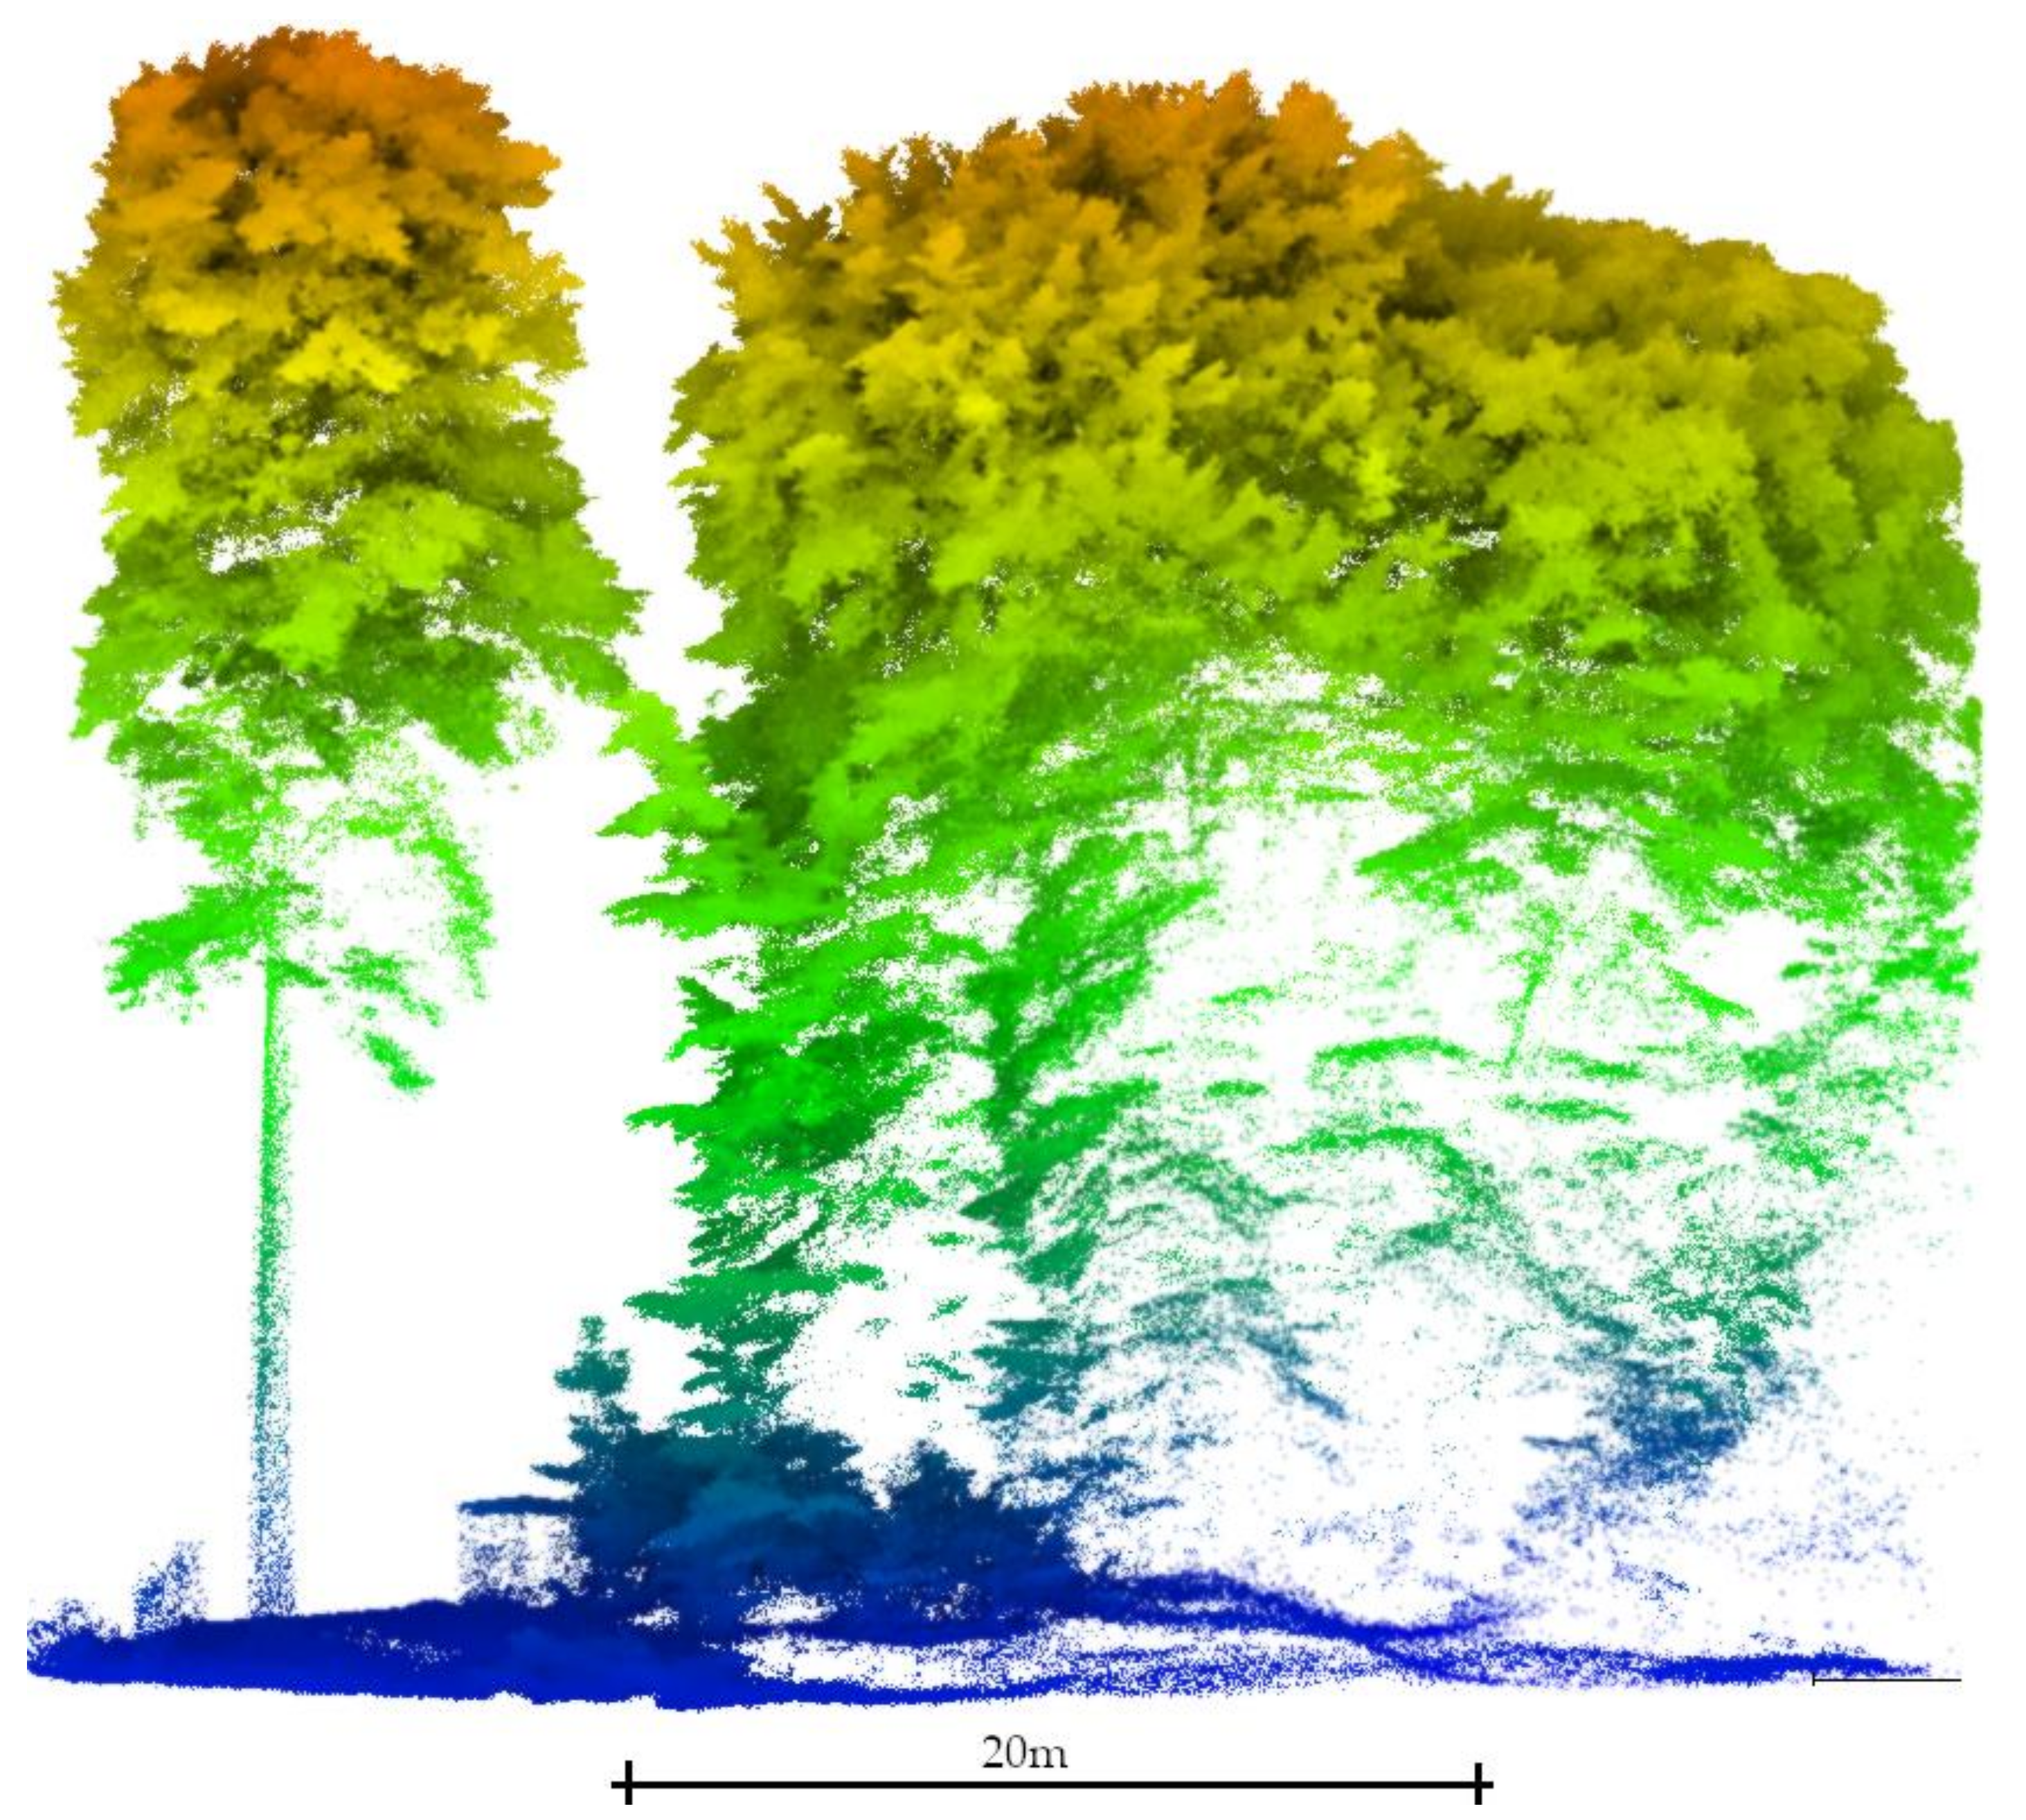
Figure 1.
Difference in the point cloud signature between an isolated tree (left) and close trees with a high proportion of understory vegetation (right). The point density over the tree stem surface significantly decreases within the closed canopy patch and gaps in the data appear. This last situation depicts the conditions in which this study was carried out.

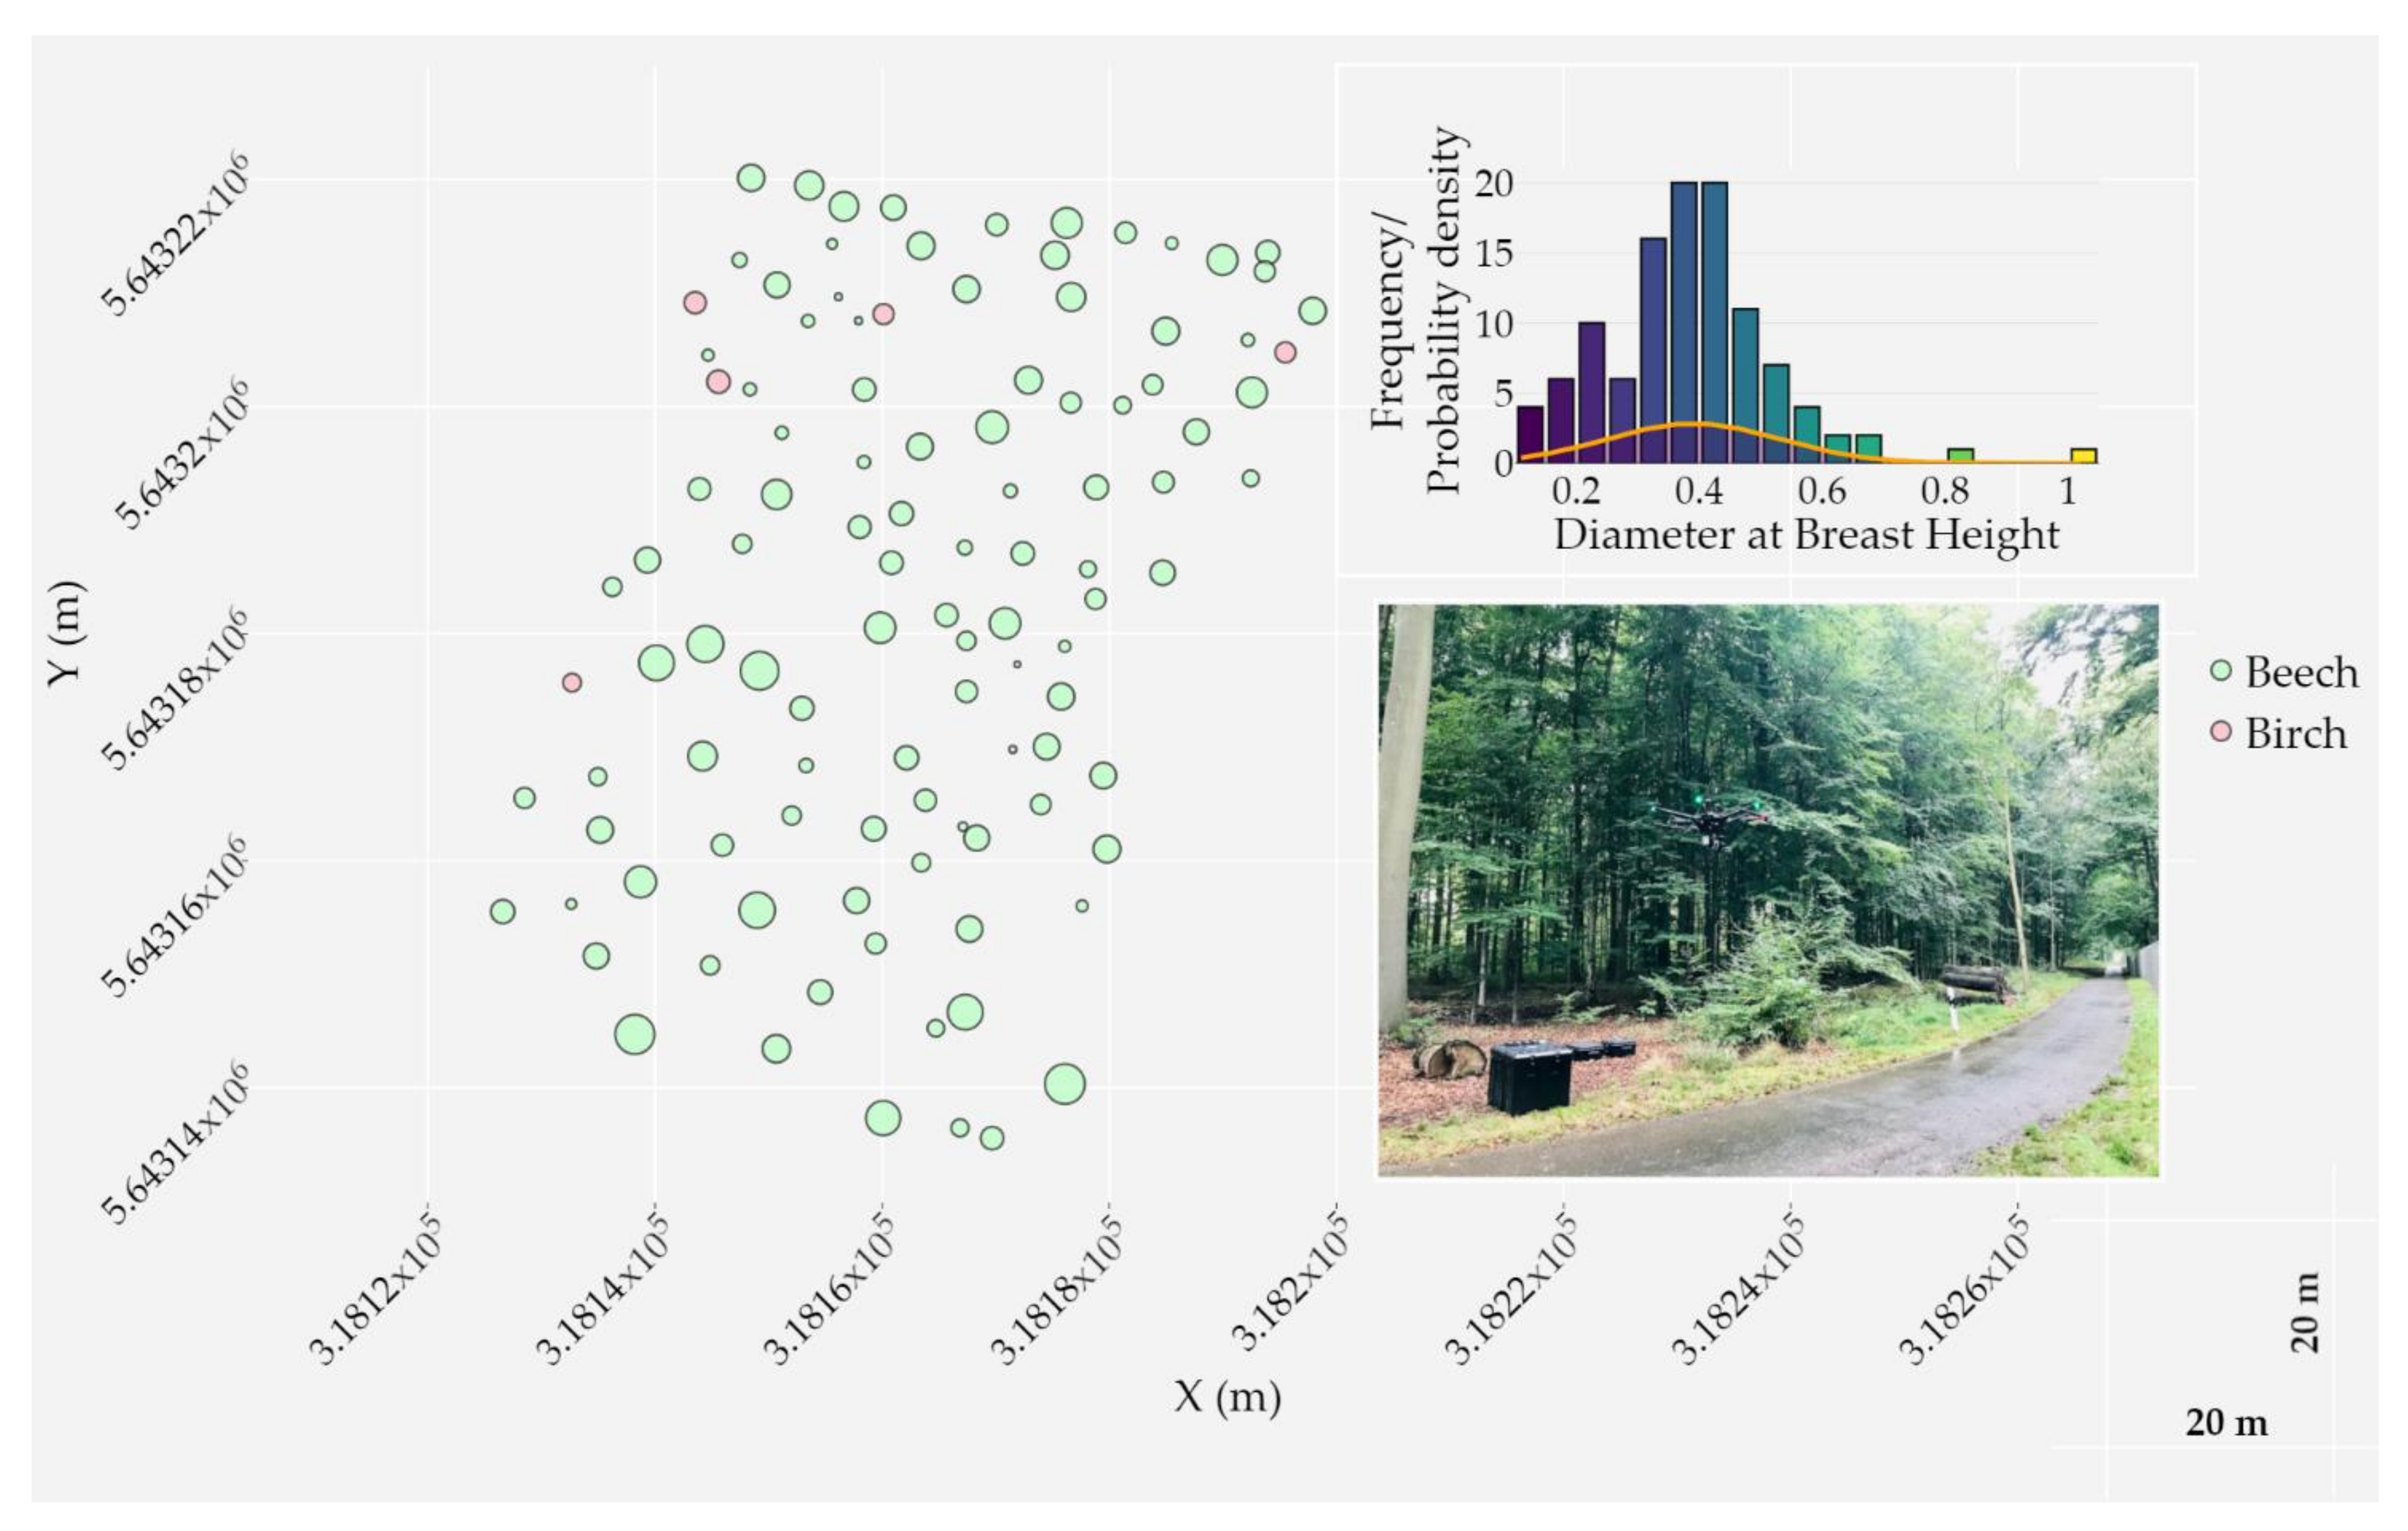
Figure 2.
Spatial distribution of surveyed trees inside the main study area; two trees are not visualized for the sake of visibility. Trees are classified by species and the Diameter at Breast Height (DBH) is displayed using a proportional circle marker. Cartesian coordinates are expressed in UTM 32N. A histogram of DBH frequency for both species along with a probability density distribution are shown (top right). A photograph of the plot is shown on the bottom right; the study area is located across the road in a temperate deciduous closed-canopy forest stand.

Figure 3.
Point cloud processing workflow (ISO 5807) for estimating the Diameter at Breast Height (DBH). HDBSCAN: Hierarchical Density-Based Spatial Clustering of Applications with Noise; PCA: Principal Components Analysis.
Figure 3.
Point cloud processing workflow (ISO 5807) for estimating the Diameter at Breast Height (DBH). HDBSCAN: Hierarchical Density-Based Spatial Clustering of Applications with Noise; PCA: Principal Components Analysis.

Figure 4.
Normalized dataset (leaf-on season and 12° MSAR) using a point-based approach and the spatial TIN interpolation method.
Figure 4.
Normalized dataset (leaf-on season and 12° MSAR) using a point-based approach and the spatial TIN interpolation method.

Figure 5.
Histogram of ground points’ height (bins of 0.01 m) after the DEM normalization using the point cloud acquired during the leaf-on season and a 75° MSAR. The removal of falsely located underground points (i.e., with a negative height value) is illustrated for a single tree (leaf-off season and 75° MSAR) on the right side of the figure.

Figure 6.
Individual trees detection and segmentation based on the field measures and using circular buffers. For each tree, the radius threshold was set to half the distance among its nearest neighbors. Note that each cross-section is at a different scale in order to increase the visibility of the study site.

Figure 7.
Tree-level point cloud processing flow for segmenting and classifying the tree stem and estimating the DBH. HDBSCAN: Hierarchical Density-Based Spatial Clustering of Applications with Noise; PCA: Principal Components Analysis. The tree stem is modeled as a cylinder created from the DBH estimation with a height of 0.2 m.

Figure 8.
Measured versus estimated diameters at breast height from four point-clouds acquired at two different seasons (leaf-on ad leaf-off) and using two MSARs (50° and 75°). The bias, RMSE, and correlation coefficient (r) are shown on the plots as well as the 1:1 line (dotted line) and the regression line (solid line). Additionally, the number of data points (N) is different for each plot. Note that outliers were removed from the analysis.

Figure 9.
Tree stem classification according to the DBH estimation (bins of 0.2 m) from the point cloud acquired during the leaf-off season using a 75° MSAR. The orange line indicates the number of correctly classified tree stems per category.
Figure 9.
Tree stem classification according to the DBH estimation (bins of 0.2 m) from the point cloud acquired during the leaf-off season using a 75° MSAR. The orange line indicates the number of correctly classified tree stems per category.


Table 1.
Technical specifications of the sensor, flight parameters, and point cloud processing.
| YellowScan Surveyor Sensor | |
|---|---|
| Pulse width (ns) | 6 |
| Peak power (W) | 31 |
| Wavelength (nm) | 903 |
| Pulse repetition frequency (kHz) | 21.7 |
| Scan frequency (Hz) | 10 |
| Beam divergence (°) | 0.1 × 0.4 |
| Flight parameters | |
| Mean flying altitude AGL (m) | 50 |
| Flying speed (m/s) | 3 |
| Overlapped swath (%) | 70 |
| Flying pattern | Double grid survey |
| Data processing | |
| MSAR (°) | 12, 25, 50, 75 |
Table 2.
Statistical analysis of the tree stem segmentation and classification procedures as a function of the season (leaf-on versus leaf-off) and the MSAR (12°, 25°, 50°, and 75°).
Table 2.
Statistical analysis of the tree stem segmentation and classification procedures as a function of the season (leaf-on versus leaf-off) and the MSAR (12°, 25°, 50°, and 75°).
| Season | MSAR (°) | Detected Trunks (TP + FP) | Correctly Detected Trunks (TP) | Falsely Detected Trunks (FP) | Missed Trunks (FN) | Recall (r-%) | Precision (p-%) | F-Score (F-%) |
|---|---|---|---|---|---|---|---|---|
| Leaf-on | 12 | 21 | 20 | 1 | 90 | 0.18 | 0.95 | 0.30 |
| 25 | 30 | 27 | 3 | 83 | 0.25 | 0.90 | 0.39 | |
| 50 | 56 | 53 | 3 | 57 | 0.48 | 0.95 | 0.64 | |
| 75 | 58 | 57 | 1 | 53 | 0.52 | 0.98 | 0.68 | |
| Leaf-off | 12 | 69 | 68 | 1 | 42 | 0.62 | 0.99 | 0.76 |
| 25 | 84 | 78 | 5 | 31 | 0.72 | 0.94 | 0.81 | |
| 50 | 91 | 85 | 6 | 25 | 0.77 | 0.93 | 0.84 | |
| 75 | 92 | 90 | 2 | 20 | 0.82 | 0.98 | 0.89 |
Publisher’s Note: MDPI stays neutral with regard to jurisdictional claims in published maps and institutional affiliations. |
© 2021 by the authors. Licensee MDPI, Basel, Switzerland. This article is an open access article distributed under the terms and conditions of the Creative Commons Attribution (CC BY) license (http://creativecommons.org/licenses/by/4.0/).
Share and Cite
MDPI and ACS Style
Neuville, R.; Bates, J.S.; Jonard, F. Estimating Forest Structure from UAV-Mounted LiDAR Point Cloud Using Machine Learning. Remote Sens. 2021, 13, 352. https://0-doi-org.brum.beds.ac.uk/10.3390/rs13030352
AMA Style
Neuville R, Bates JS, Jonard F. Estimating Forest Structure from UAV-Mounted LiDAR Point Cloud Using Machine Learning. Remote Sensing. 2021; 13(3):352. https://0-doi-org.brum.beds.ac.uk/10.3390/rs13030352
Chicago/Turabian StyleNeuville, Romain, Jordan Steven Bates, and François Jonard. 2021. "Estimating Forest Structure from UAV-Mounted LiDAR Point Cloud Using Machine Learning" Remote Sensing 13, no. 3: 352. https://0-doi-org.brum.beds.ac.uk/10.3390/rs13030352
Note that from the first issue of 2016, this journal uses article numbers instead of page numbers. See further details here.