Geodetic and UAV Monitoring in the Sustainable Management of Shallow Landslides and Erosion of a Susceptible Urban Environment

 ,
,  ,
,  ,
,  ,
,  and
and 
Abstract
:
1. Introduction
2. Materials and Methods
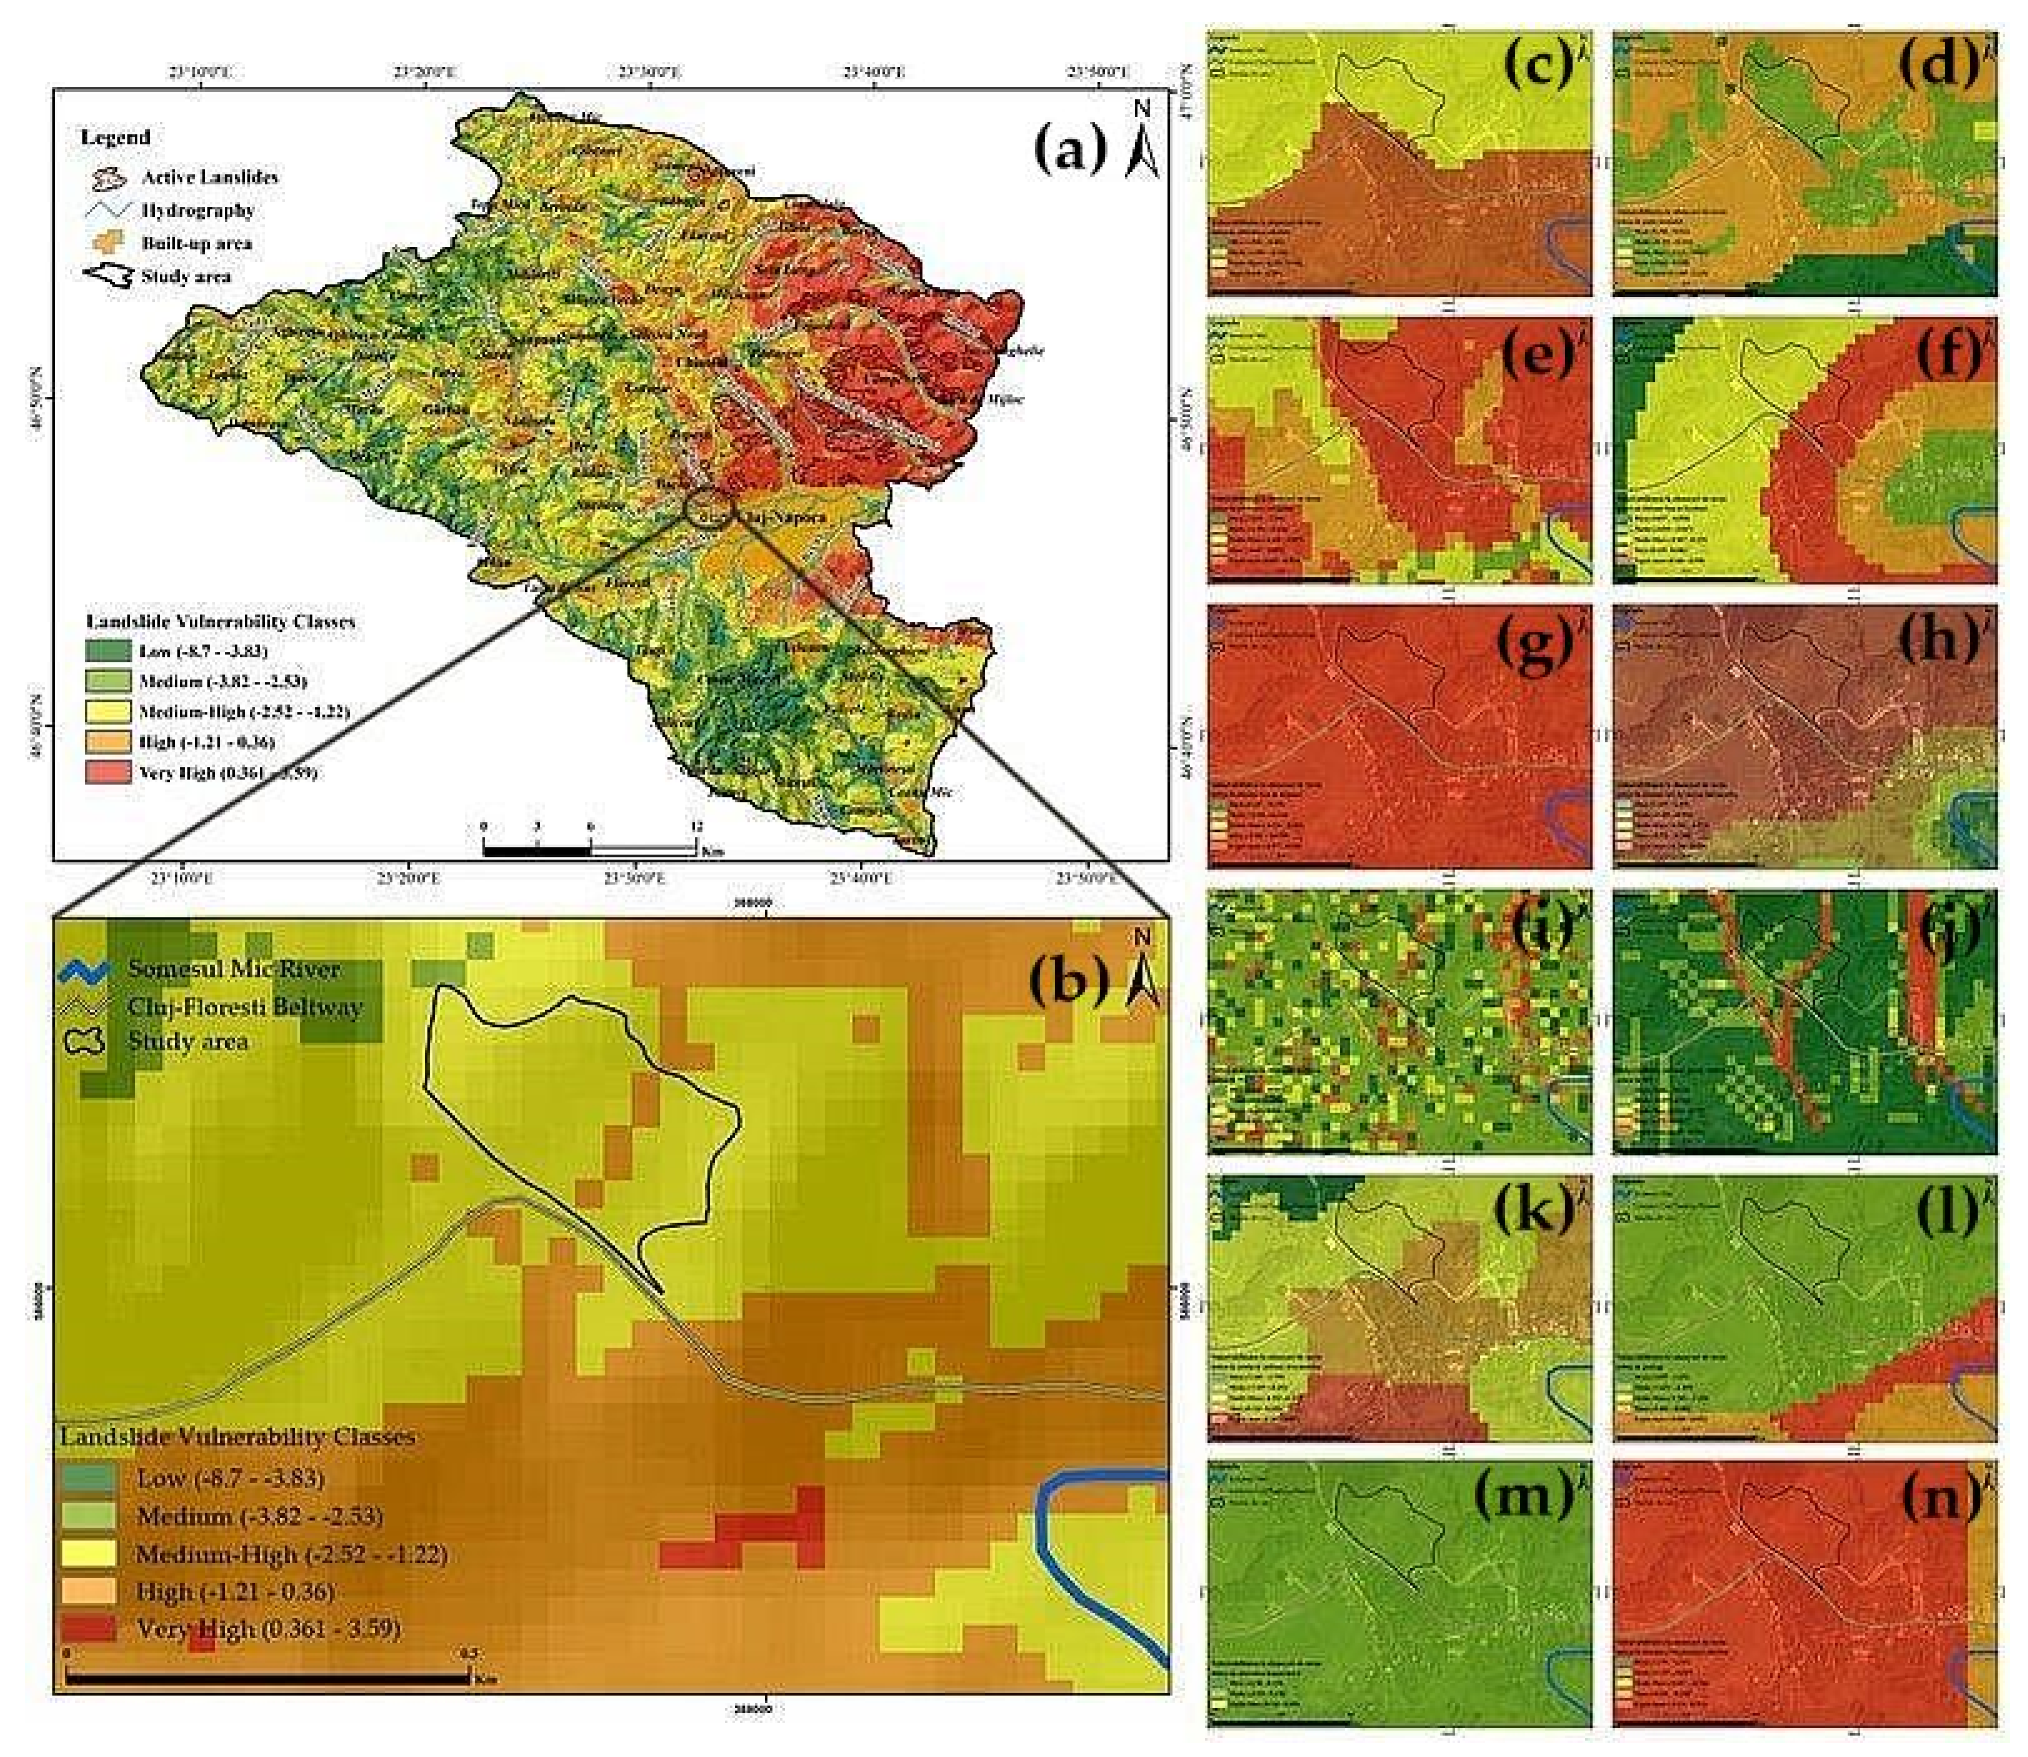
2.1. Study Area
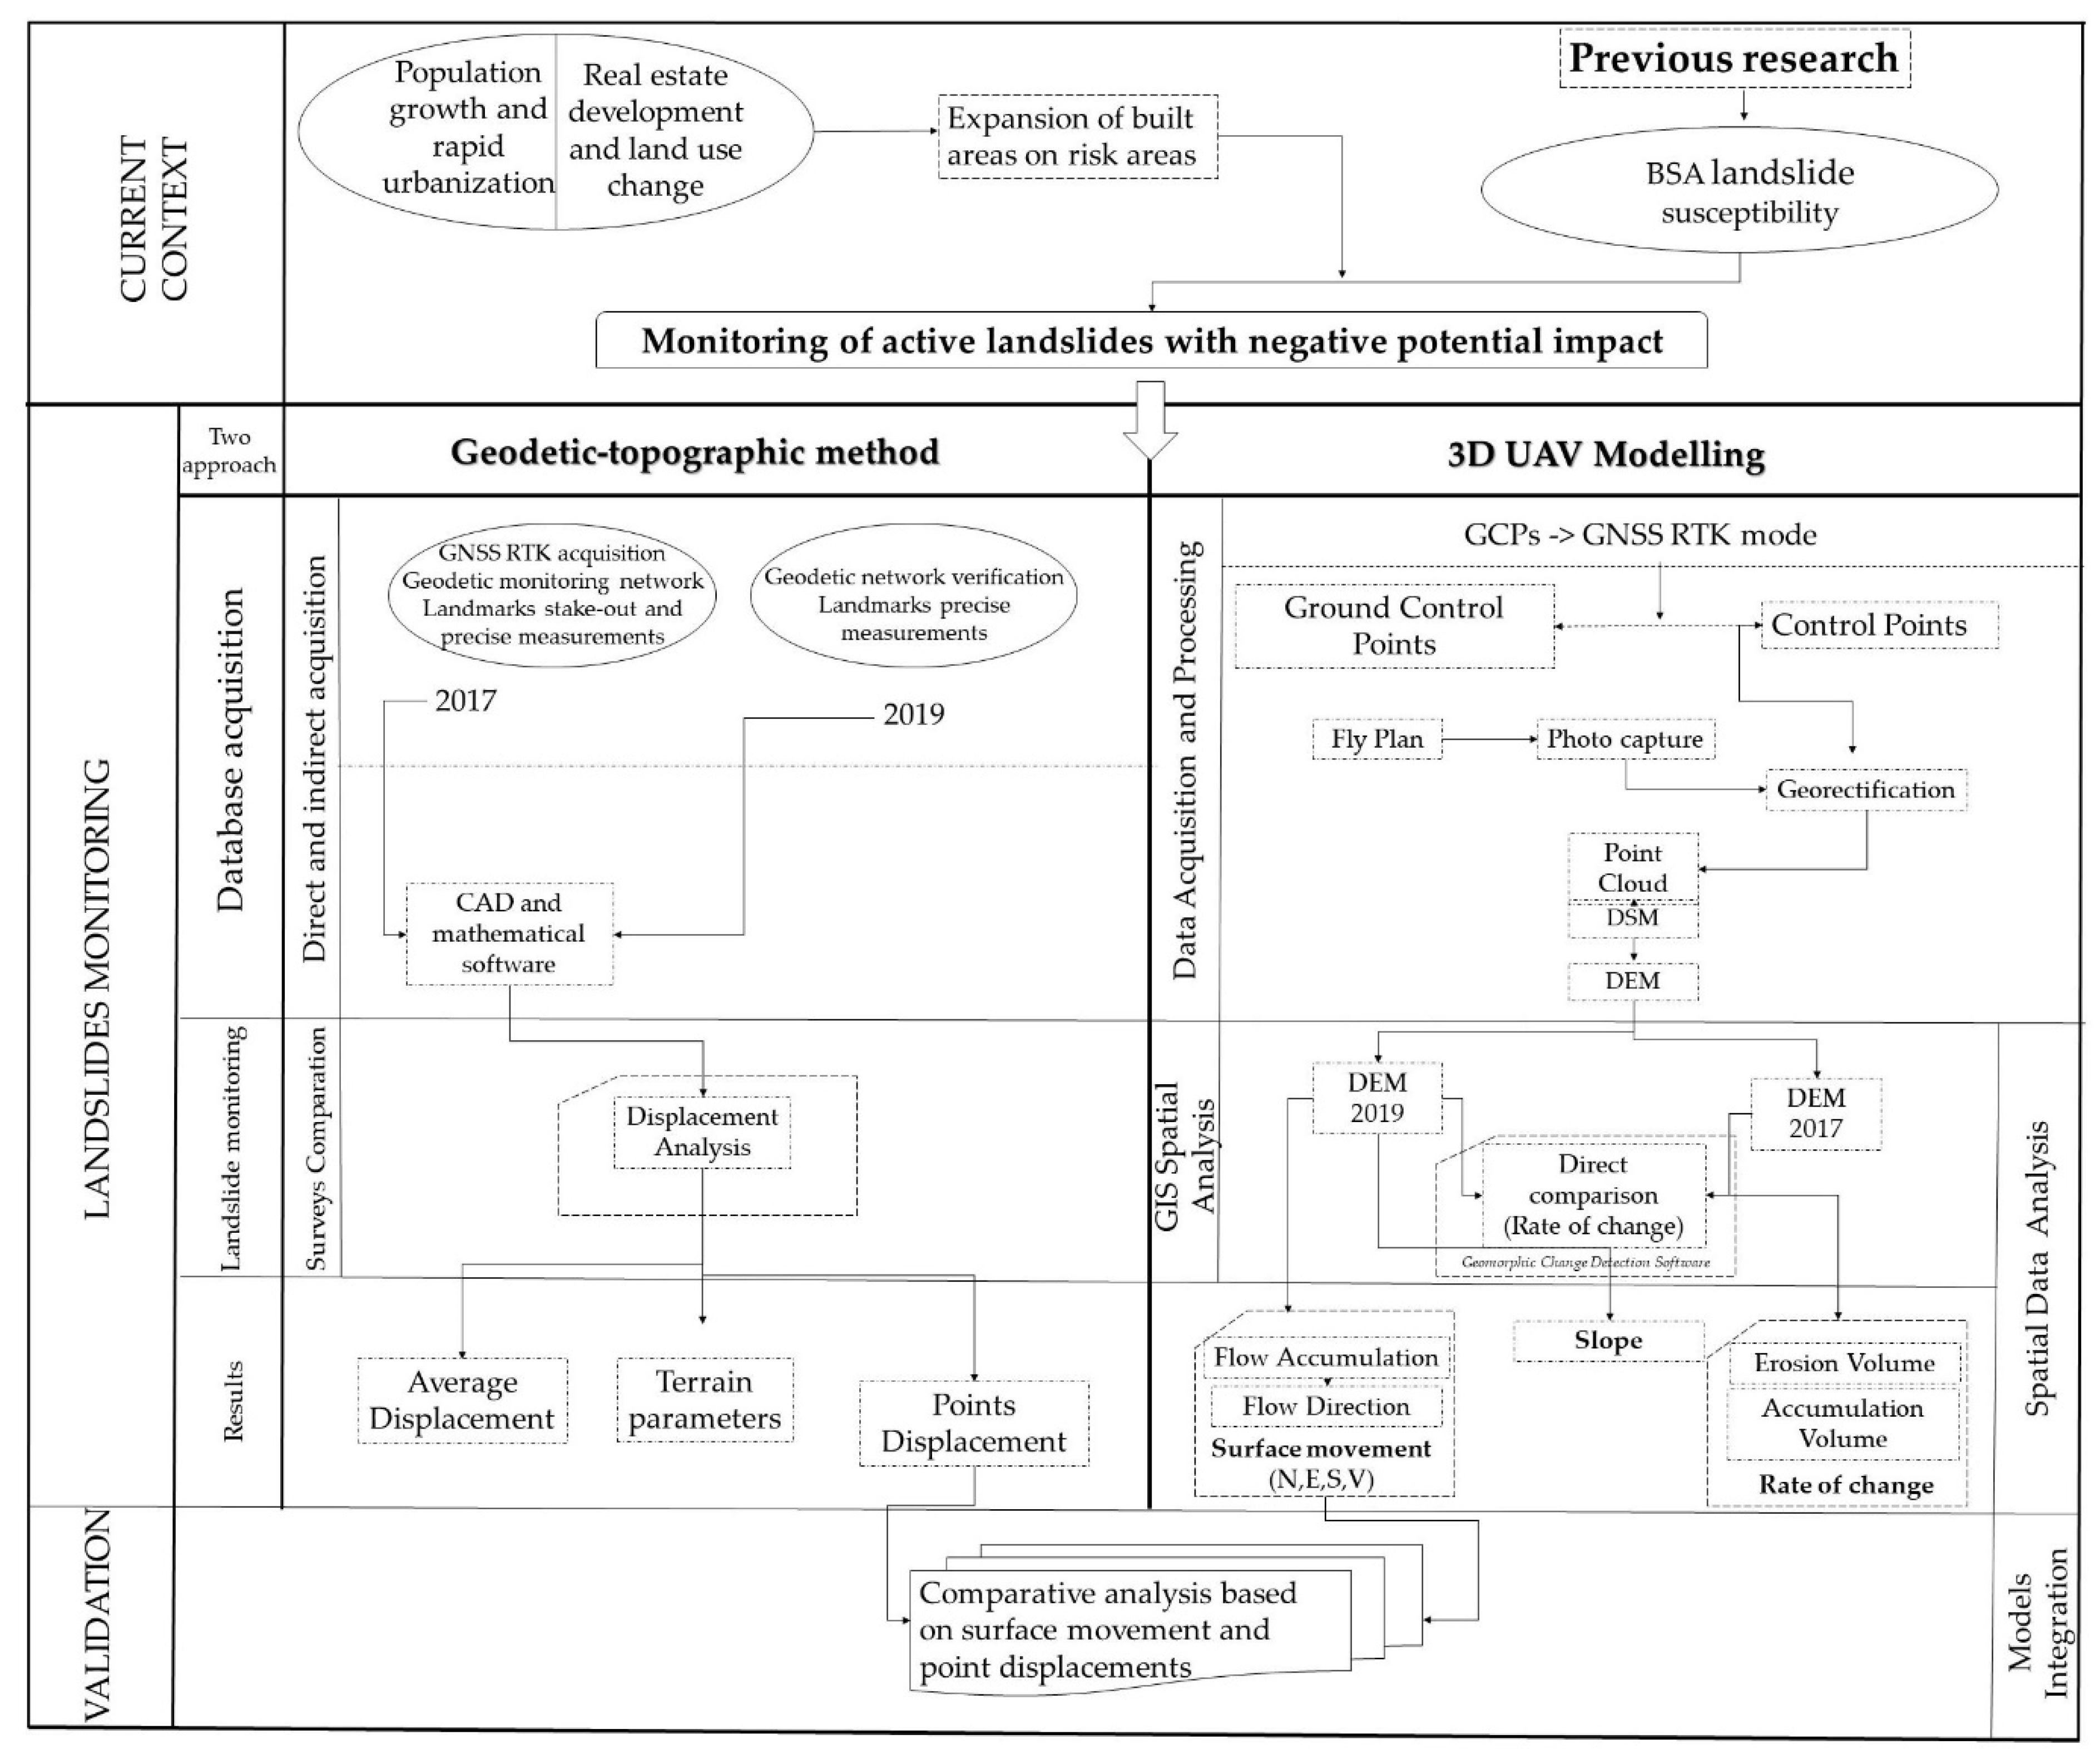
2.2. Methodological Approach and Geological Background
2.3. BSA
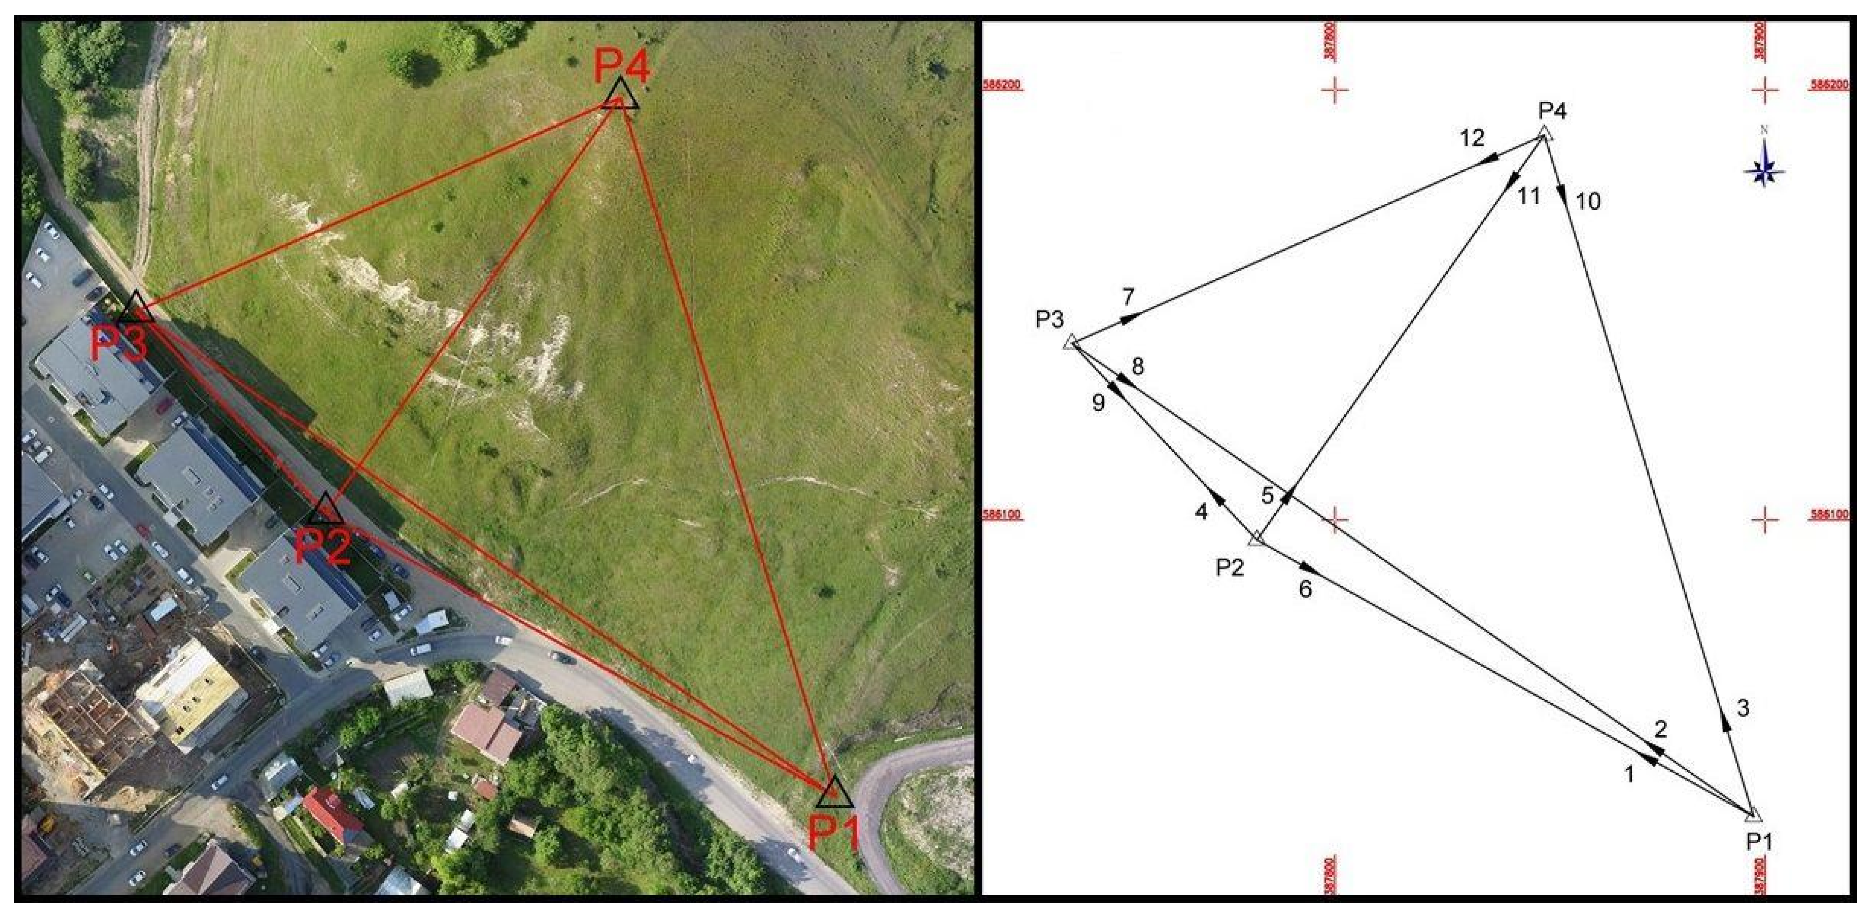
2.4. Established Geodetic Network
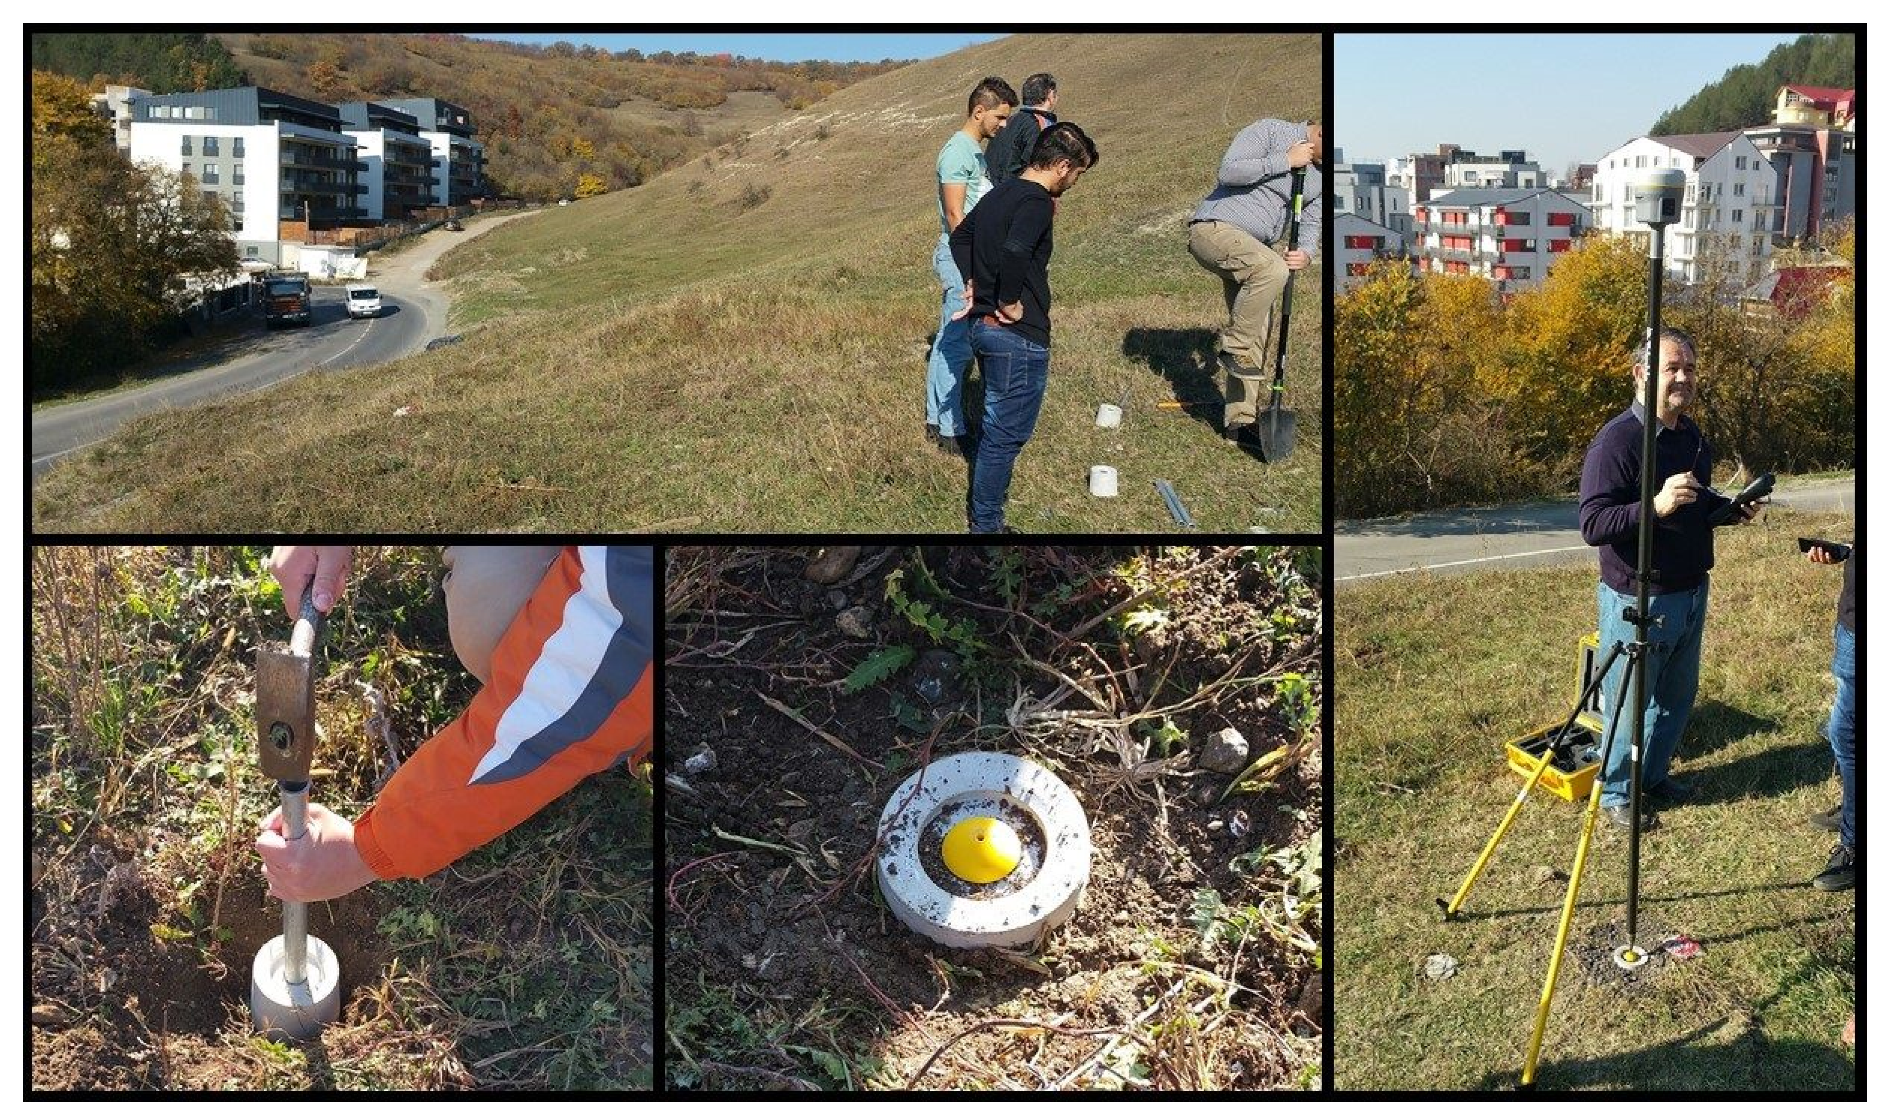
2.5. Land Survey Data Aquisition
2.6. UAV Implementation and Flight Metrics
3. Results
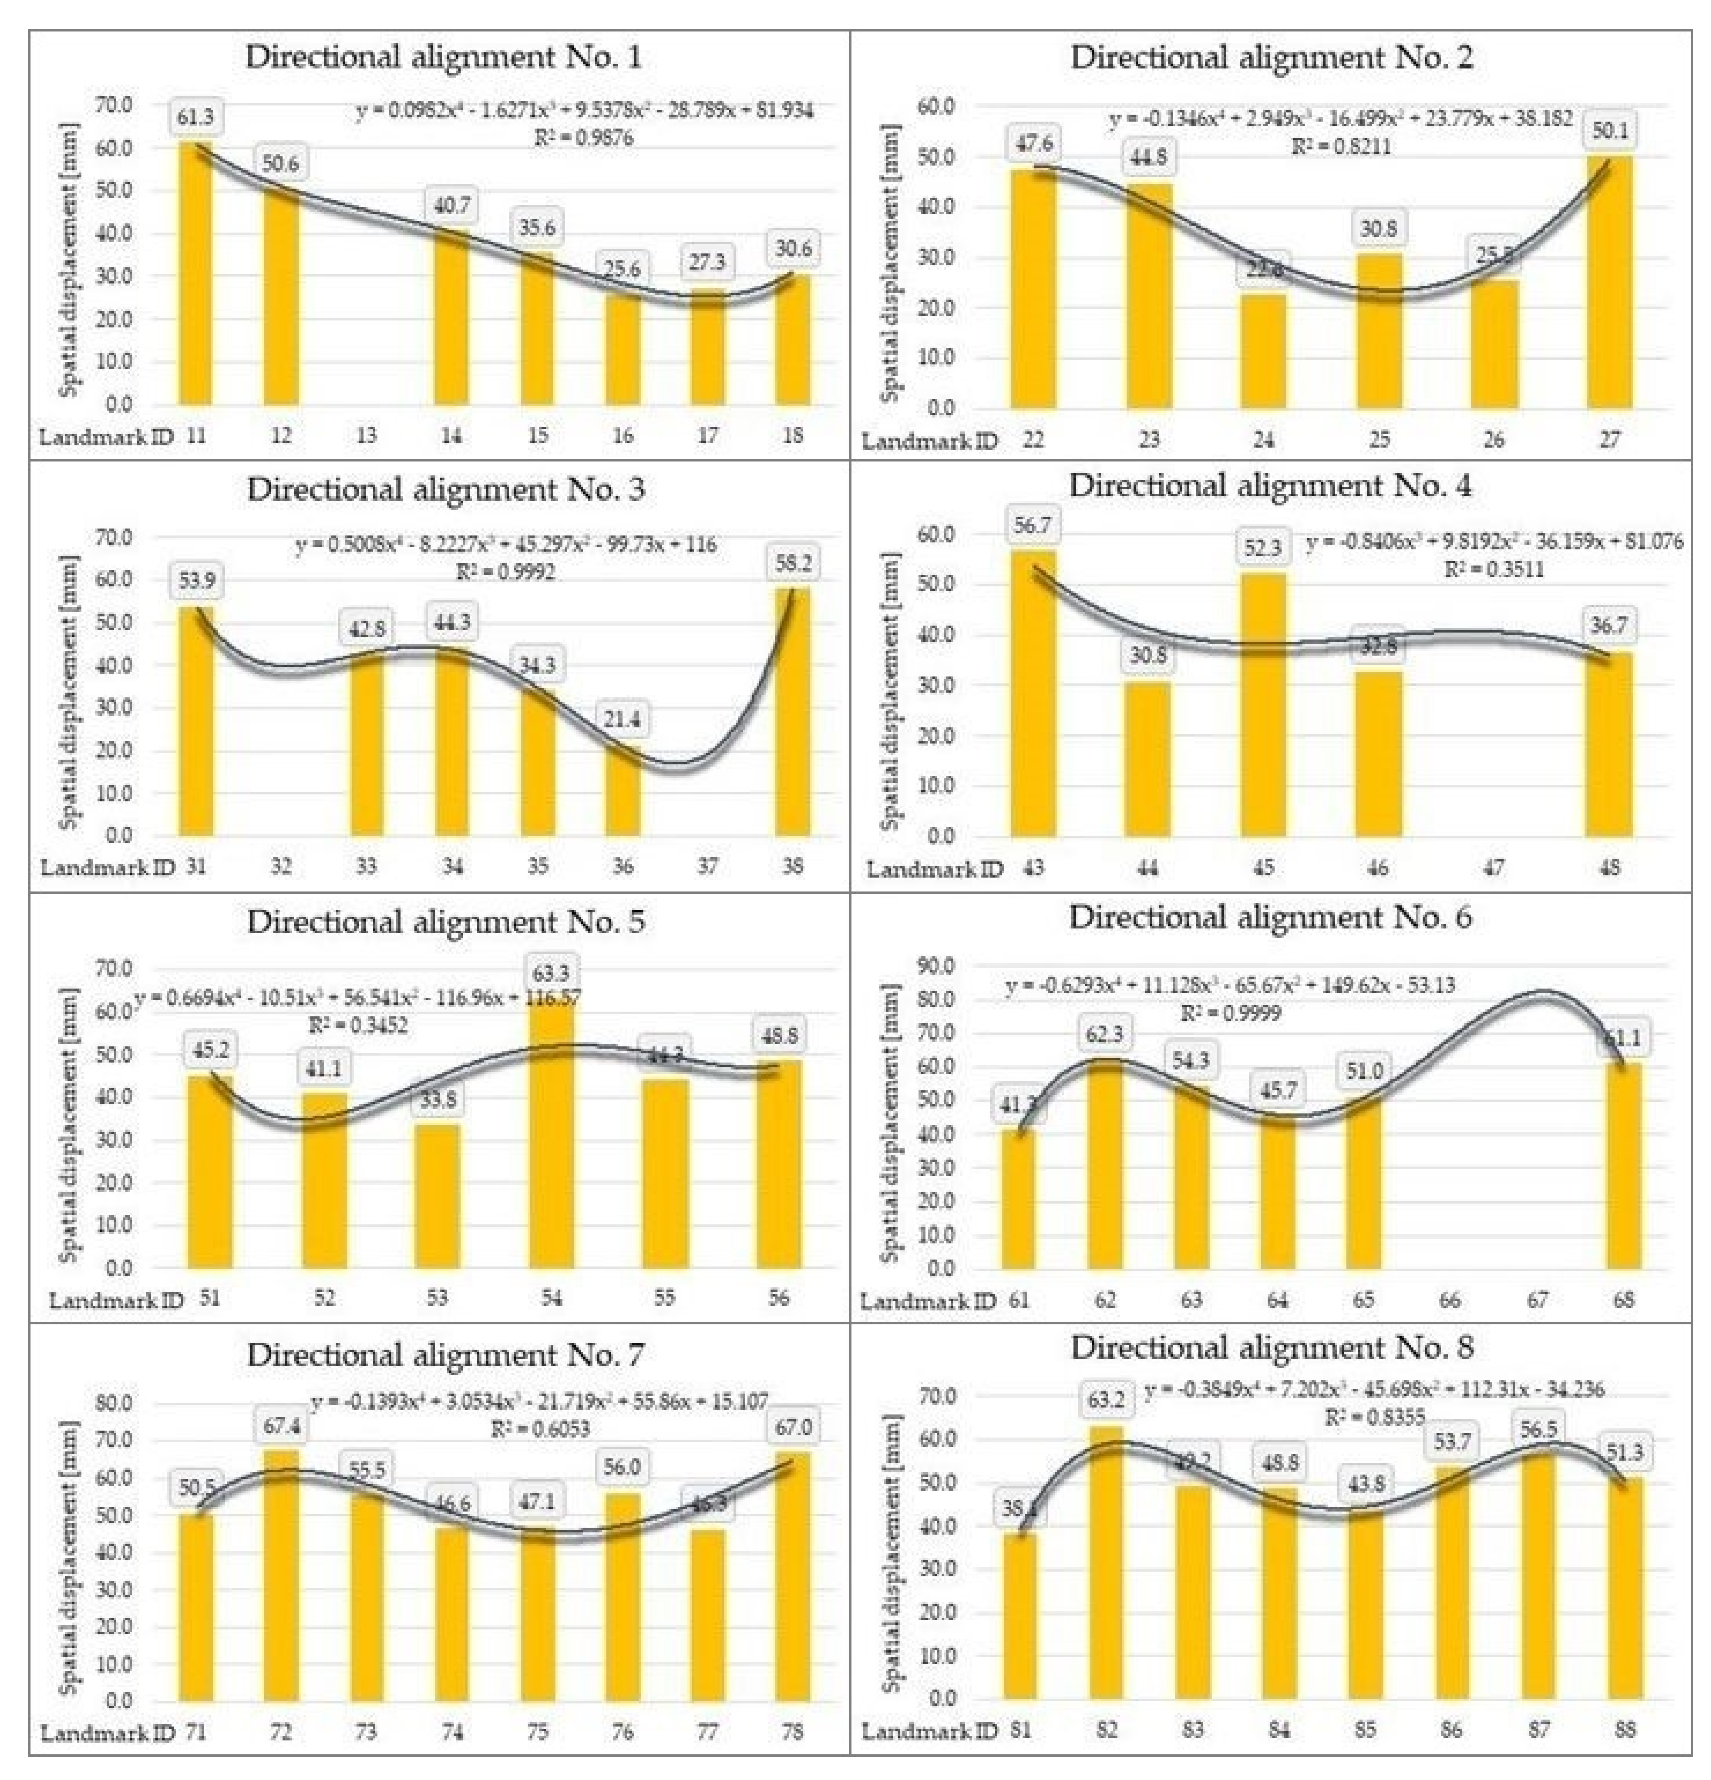
3.1. Results and Discussions Following the Geodetic-Topographic Measurements
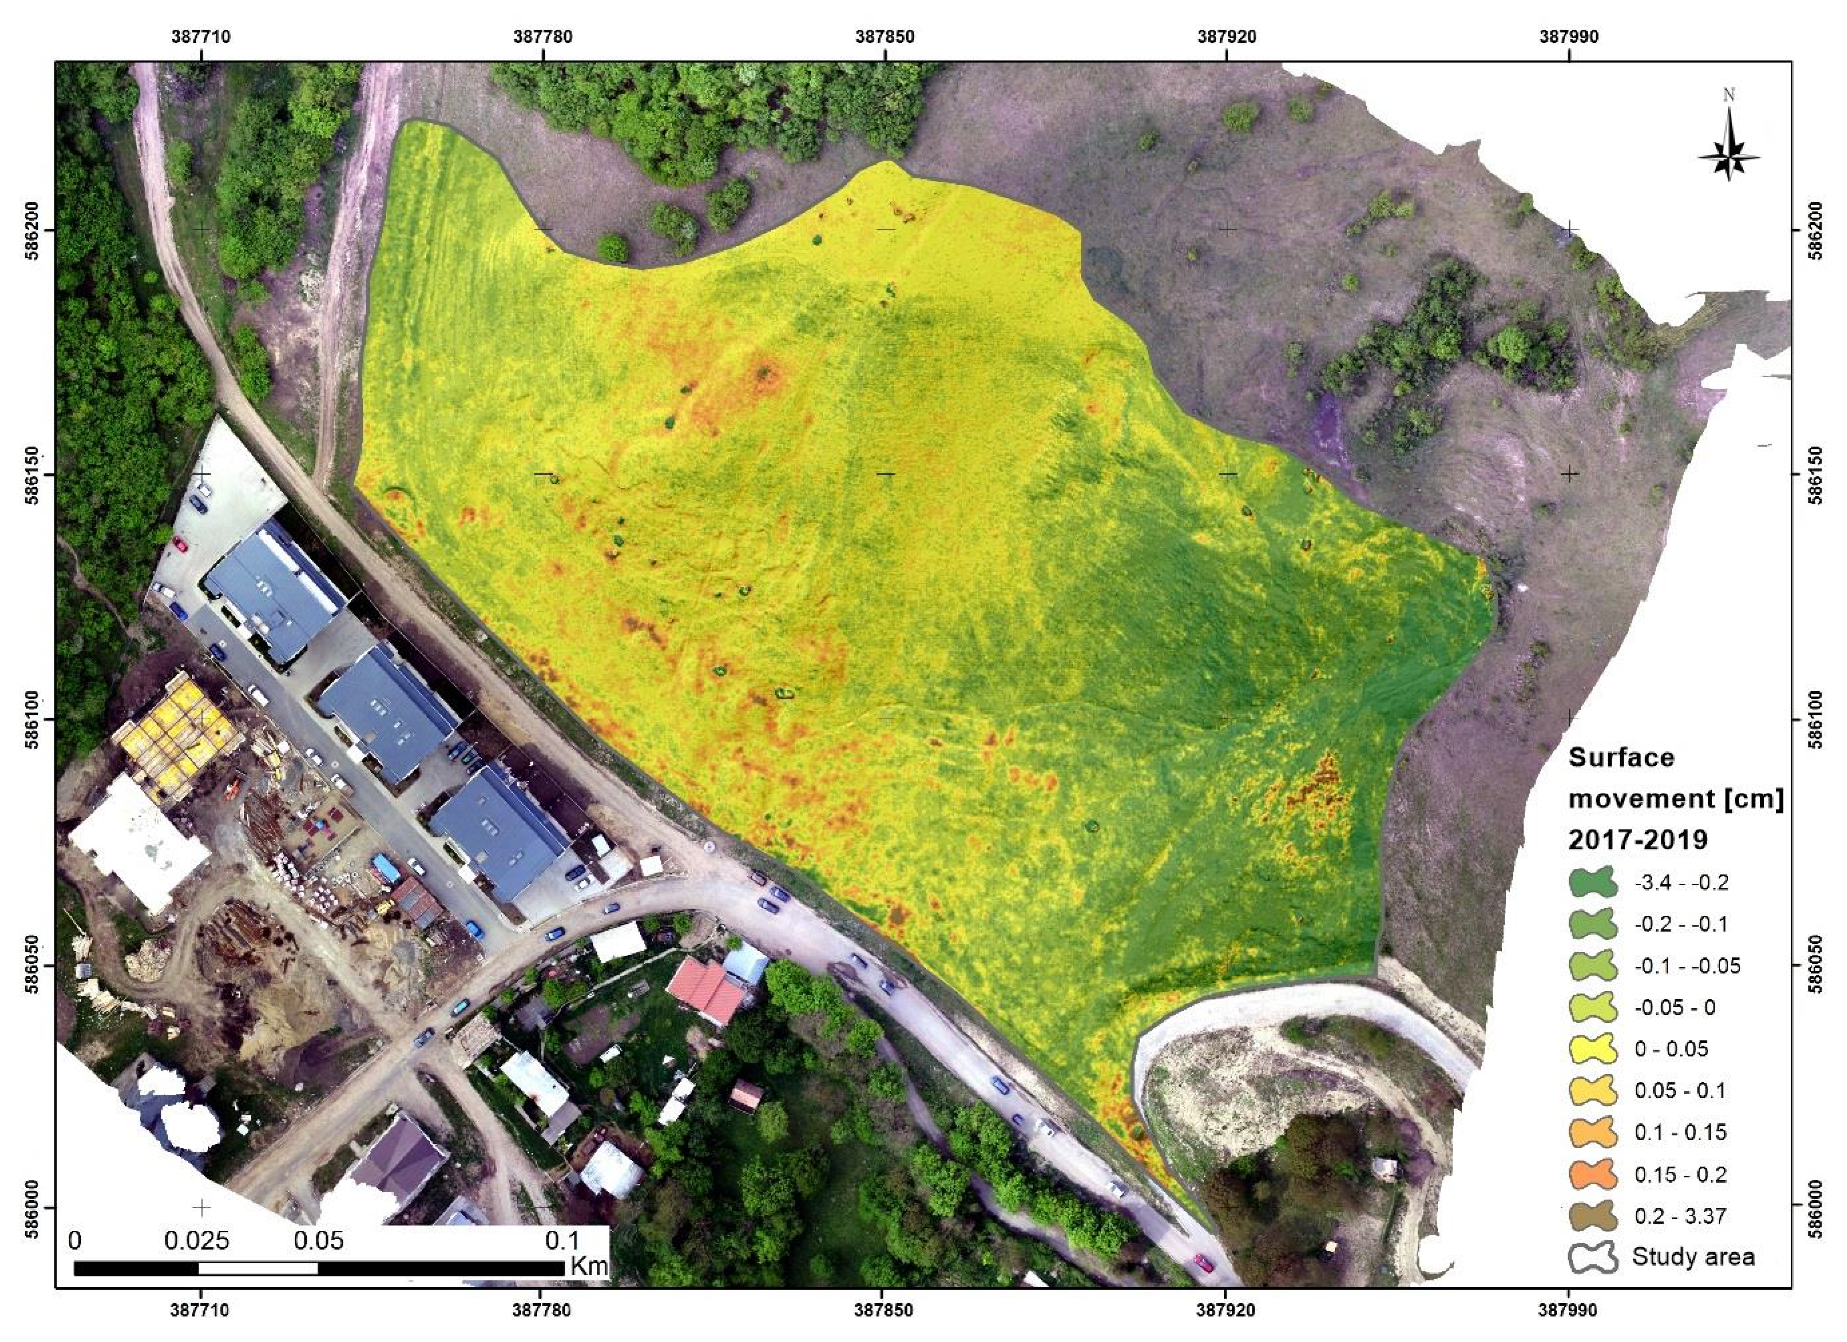
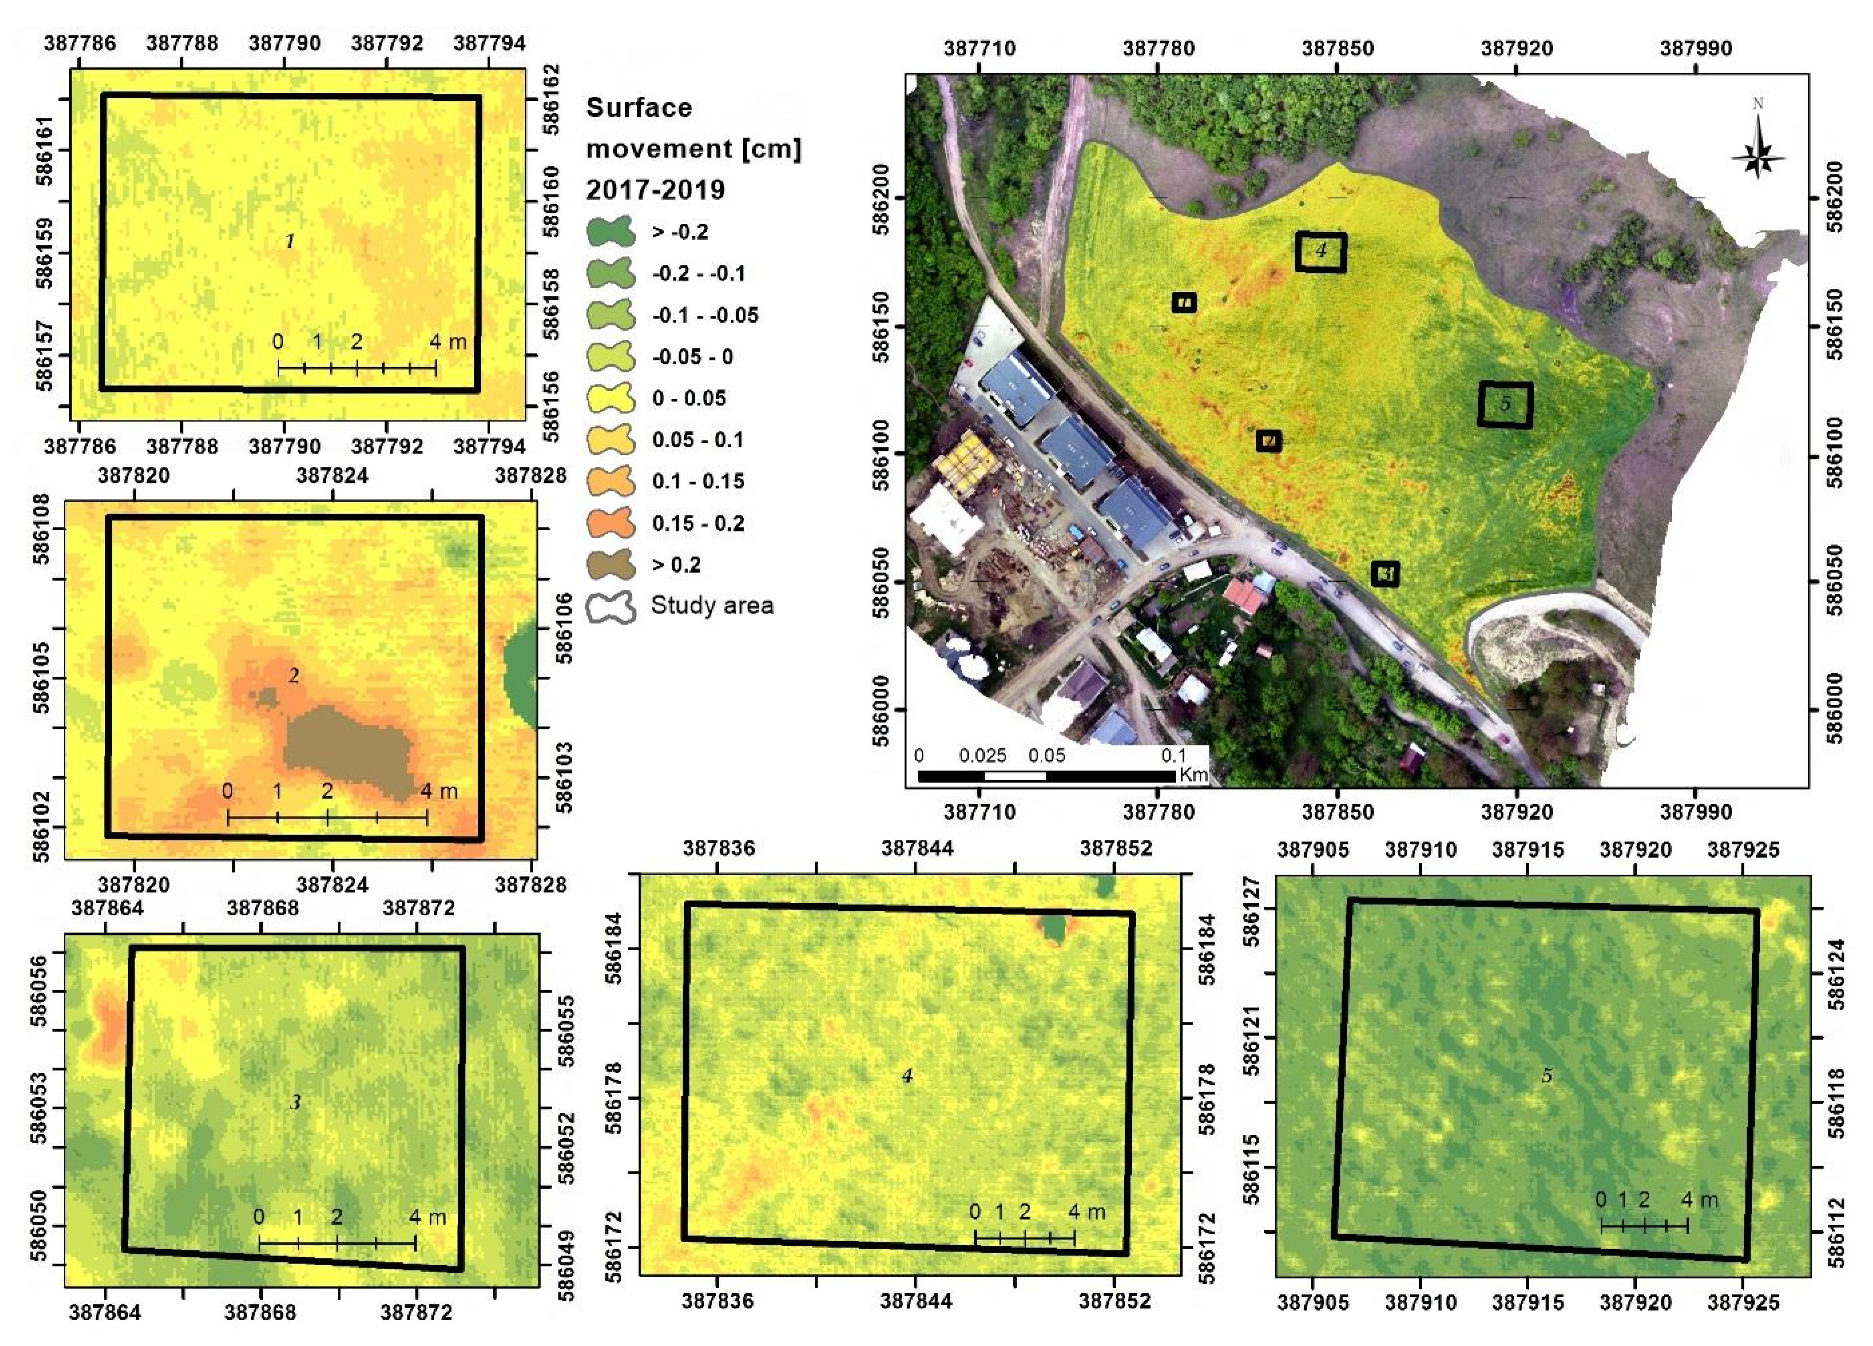
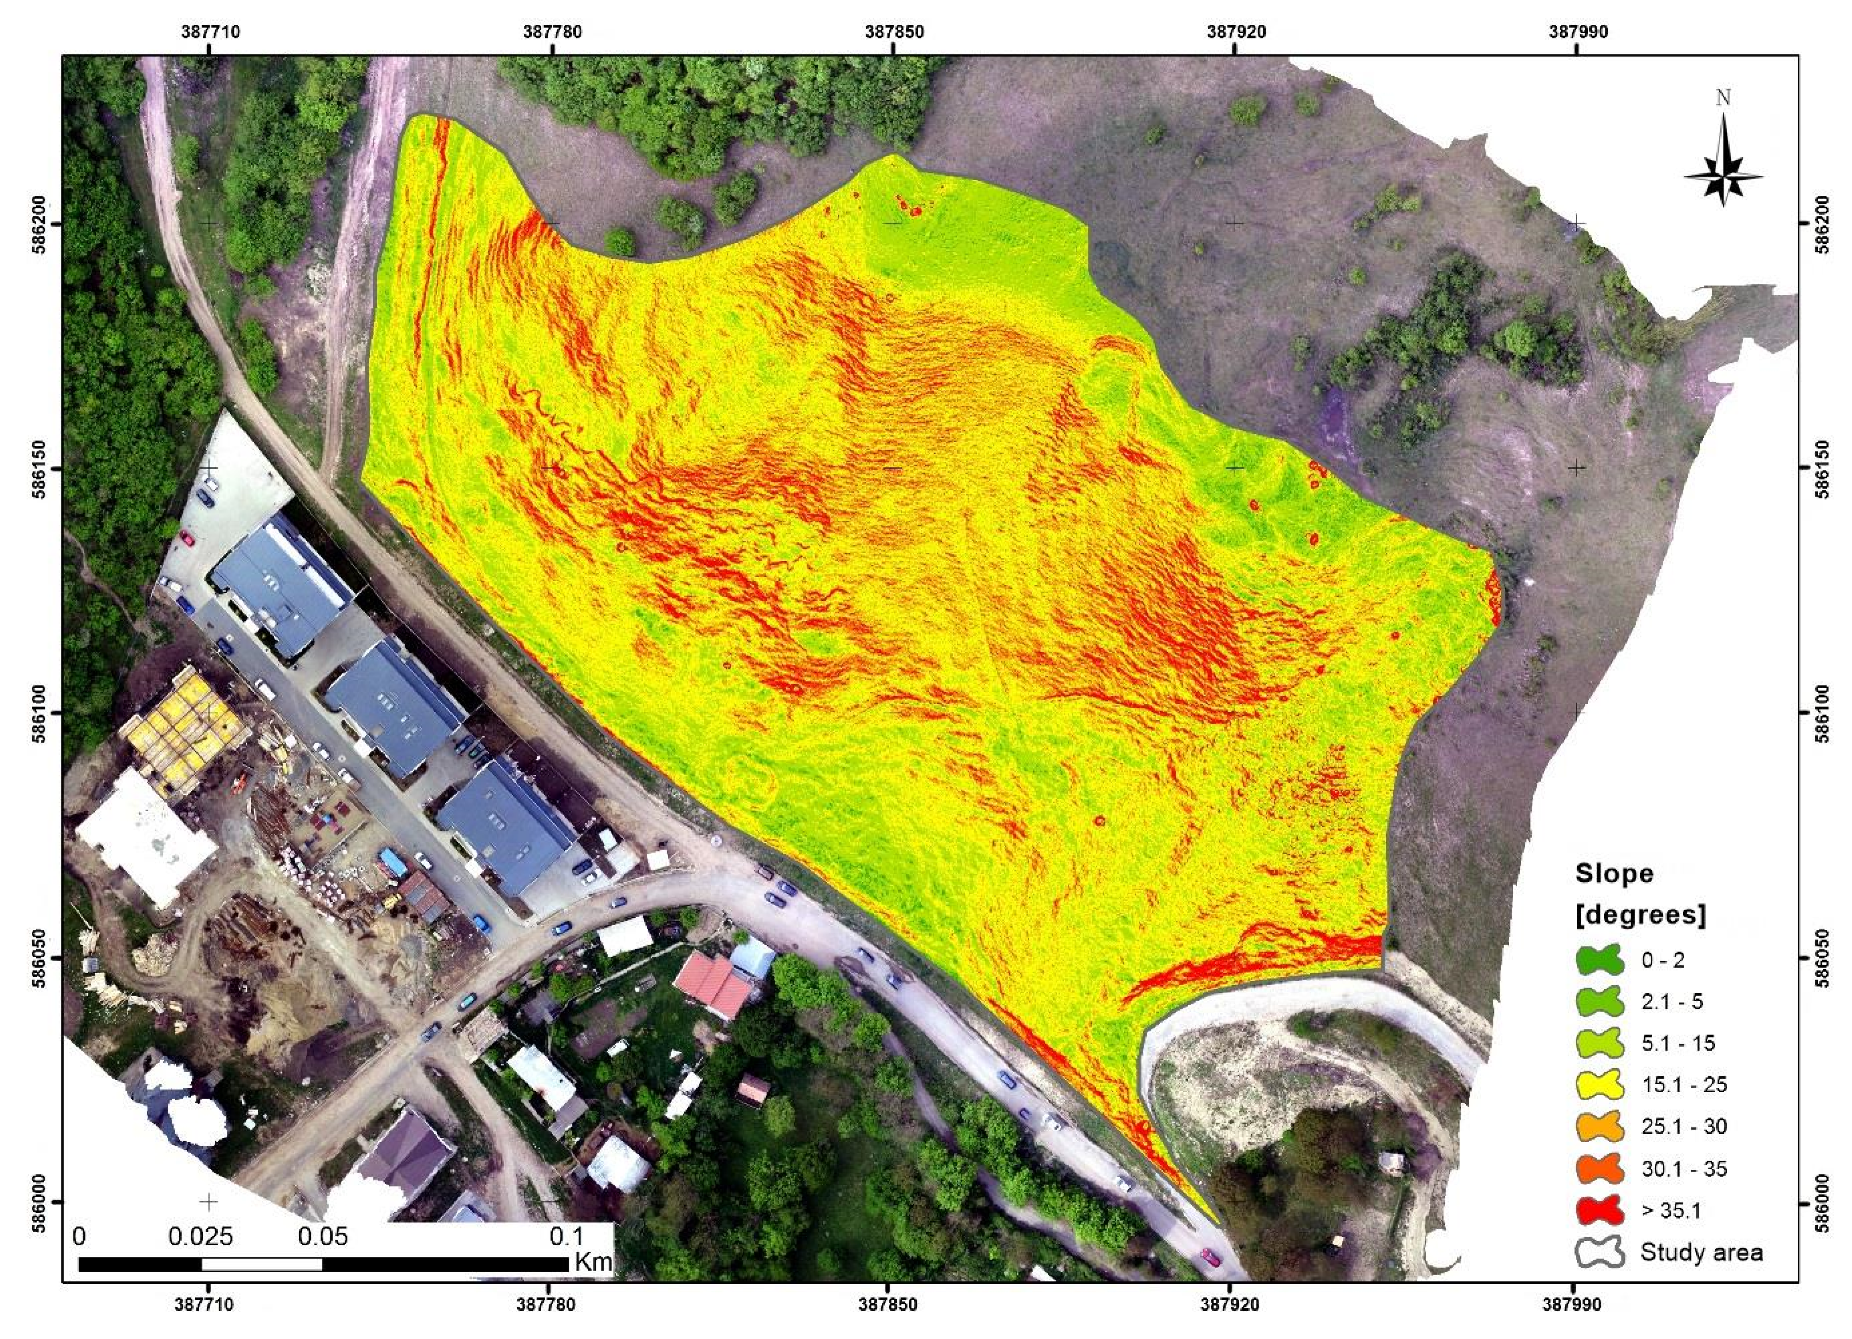
3.2. Results and Discussions Following the 3D UAV Modelling
4. Discussion
5. Conclusions
Author Contributions
Funding
Institutional Review Board Statement
Informed Consent Statement
Data Availability Statement
Acknowledgments
Conflicts of Interest
Appendix A
References
- Corpade, C.; Man, T.; Petrea, D.; Corpade, A.-M.; Moldovan, C. Changes in landscape structure induced by transportation projects in Cluj-Napoca periurban area using GIS. Carpathian J. Earth Environ. Sci. 2014, 9, 177–184. [Google Scholar]
- Dolean, B.-E.; Bilașco, Ș.; Petrea, D.; Moldovan, C.; Vescan, I.; Roșca, S.; Fodorean, I. Evaluation of the Built-Up Area Dynamics in the First Ring of Cluj-Napoca Metropolitan Area, Romania by Semi-Automatic GIS Analysis of Landsat Satellite Images. Appl. Sci. 2020, 10, 7722. [Google Scholar] [CrossRef]
- Cebotari, S.; Cristea, M.; Moldovan, C.; Zubașcu, F. Renewable Energy’s Impact on Rural Development in Northwestern Romania. Energy Sustain. Dev. 2017, 37, 110–123. [Google Scholar] [CrossRef]
- Sestraş, P.; Sălăgean, T.; Bilașco, S.; Bondrea, M.V.; Naș, S.; Fountas, S.; Cîmpeanu, S.M. Prospect of a GIS based digitization and 3D model for a better management and land use in a specific micro-areal for crop trees. Environ. Eng. Manag. J. 2019, 18, 1269–1277. [Google Scholar] [CrossRef]
- Kil, J.; Kowalczyk, C.; Moldovan, C. Comparison of changes in urbanized area in Poland and Romania. Transylv. Rev. 2018, 17, 56–72. [Google Scholar]
- Sestras, P.; Bilasco, S.; Roşca, S.; Naș, S.; Bondrea, M.; Gâlgău, R.; Vereş, I.; Salagean, T.; Spalevic, V.; Cimpeanu, S. Landslides Susceptibility Assessment Based on GIS Statistical Bivariate Analysis in the Hills Surrounding a Metropolitan Area. Sustainability 2019, 11, 1362. [Google Scholar] [CrossRef] [Green Version]
- Bilaşco, Ş.; Roşca, S.; Fodorean, I.; Vescan, I.; Filip, S.; Petrea, D. Quantitative evaluation of the risk induced by dominant geomorphological processes on different land uses, based on GIS spatial analysis models. Front. Earth Sci. 2018, 12, 311–324. [Google Scholar]
- Roşca, S.; Bilaşco, Ş.; Petrea, D.; Fodorean, I.; Vescan, I.; Filip, S. Application of landslide hazard scenarios at annual scale in the Niraj River basin (Transylvania Depression, Romania). Nat. Hazards 2015, 77, 1573–1592. [Google Scholar]
- Galli, M.; Ardizzone, F.; Cardinali, M.; Guzzetti, F.; Reichenbach, P. Comparing landslide inventory maps. Geomorphology 2008, 94, 268–289. [Google Scholar] [CrossRef]
- Cruden, D.M.; Varnes, D.J. Landslides: Investigation and mitigation. Chapter 3-Landslide types and processes. Transp. Res. Board Spec. Rep. 1996, 247, 36–75. [Google Scholar]
- Roy, J.; Saha, S. Landslide susceptibility mapping using knowledge driven statistical models in Darjeeling District, West Bengal, India. Geoenviron. Disasters 2019, 6, 11. [Google Scholar] [CrossRef] [Green Version]
- Corominas, J.; van Westen, C.; Frattini, P.; Cascini, L.; Malet, J.-P.; Fotopoulou, S.; Catani, F.; Van Den Eeckhaut, M.; Mavrouli, O.; Agliardi, F.; et al. Recommendations for the quantitative analysis of landslide risk. Bull. Eng. Geol. Environ. 2014, 73, 209–263. [Google Scholar] [CrossRef]
- Fell, R.; Corominas, J.; Bonnard, C.; Cascini, L.; Leroi, E.; Savage, W.Z. Guidelines for landslide susceptibility, hazard and risk zoning for land use planning. Eng. Geol. 2008, 102, 85–98. [Google Scholar] [CrossRef] [Green Version]
- Ahmed, B. Landslide Susceptibility Modelling Applying User-Defined Weighting and Data-Driven Statistical Techniques in Cox’s Bazar Municipality, Bangladesh. Nat. Hazards 2015, 79, 1707–1737. [Google Scholar] [CrossRef]
- Carabella, C.; Miccadei, E.; Paglia, G.; Sciarra, N. Post-Wildfire Landslide Hazard Assessment: The Case of the 2017 Montagna Del Morrone Fire (Central Apennines, Italy). Geosciences 2019, 9, 175. [Google Scholar] [CrossRef] [Green Version]
- Akca, D. Photogrammetric monitoring of an artificially generated shallow landslide. Photogramm. Rec. 2013, 28, 178–195. [Google Scholar] [CrossRef] [Green Version]
- Dewitte, O.; Jasselette, J.C.; Cornet, Y.; Van Den Eeckhaut, M.; Collignon, A.; Poesen, J.; Demoulin, A. Tracking landslide displacements by multi-temporal DTMs: A combined aerial stereophotogrammetric and LIDAR approach in western Belgium. Eng. Geol. 2008, 99, 11–22. [Google Scholar] [CrossRef]
- Guzzetti, F.; Mondini, A.C.; Cardinali, M.; Fiorucci, F.; Santangelo, M.; Chang, K.T. Landslide inventory maps: New tools for an old problem. Earth Sci. Rev. 2012, 112, 42–66. [Google Scholar] [CrossRef] [Green Version]
- Althuwaynee, O.F.; Pradhan, B.; Lee, S. A novel integrated model for assessing landslide susceptibility mapping using CHAID and AHP pair-wise comparison. Int. J. Remote Sens. 2016, 37, 1190–1209. [Google Scholar] [CrossRef]
- Ayalew, L.; Yamagishi, H. The application of GIS-based logistic regression for landslide susceptibility mapping in the Kakuda-Yahiko Mountains, Central Japan. Geomorphology 2005, 65, 15–31. [Google Scholar] [CrossRef]
- Dikshit, A.; Sarkar, R.; Pradhan, B.; Acharya, S.; Alamri, A.M. Spatial Landslide Risk Assessment at Phuentsholing, Bhutan. Geosciences 2020, 10, 131. [Google Scholar] [CrossRef] [Green Version]
- Martha, T.R.; Kerle, N.; Jetten, V.; van Westen, C.J.; Kumar, K.V. Landslide volumetric analysis using cartosat-1-derived dems. IEEE Geosci. Remote Sens. Lett. 2010, 7, 582–586. [Google Scholar] [CrossRef]
- Westoby, M.J.; Brasington, J.; Glasser, N.F.; Hambrey, M.J.; Reynolds, J.M. “Structure-from-motion” photogrammetry: A low-cost, effective tool for geoscience applications. Geomorphology 2012, 179, 300–314. [Google Scholar] [CrossRef] [Green Version]
- Cigna, F.; Bianchini, S.; Casagli, N. How to assess landslide activity and intensity with persistent scatterer interferometry (PSI): The PSI-based matrix approach. Landslides 2012, 10, 267–283. [Google Scholar] [CrossRef] [Green Version]
- Lu, P.; Catani, F.; Tofani, V.; Casagli, N. Quantitative hazard and risk assessment for slow-moving landslides from persistent Scatterer interferometry. Landslides 2014, 11, 685–696. [Google Scholar] [CrossRef]
- Peduto, D.; Oricchio, L.; Nicodemo, G.; Crosetto, M.; Ripoll, J.; Buxó, P.; Janeras, M. Investigating the kinematic features of an unstable urban slope and the effects on the exposed facilities by merging conventional and GBSAR monitoring data: Case of Barberà de la Conca (Catalonia, Spain). Landslides 2020. [Google Scholar] [CrossRef]
- Artese, S.; Perrelli, M. Monitoring a Landslide with High Accuracy by Total Station: A DTM-Based Model to Correct for the Atmospheric Effects. Geosciences 2018, 8, 46. [Google Scholar] [CrossRef] [Green Version]
- Kasperski, J.; Delacourt, C.; Allemand, P.; Potherat, P.; Jaud, M.; Varrel, E. Application of a Terrestrial Laser Scanner (TLS) to the Study of the Séchilienne Landslide (Isère, France). Remote Sens. 2010, 2, 2785–2802. [Google Scholar] [CrossRef] [Green Version]
- Afeni, T.B.; Cawood, F.T. Slope Monitoring using Total Station: What are the Challenges and How Should These be Mitigated? S. Afr. J. Geomat. 2013, 2, 41–53. [Google Scholar]
- Lichun, S.; Wang, X.; Zhao, D.; Qu, J. Application of 3D laser scanner for monitoring of landslide hazards. Int. Arch. Photogramm. Remote Sens. 2008, 37, 277–281. [Google Scholar]
- Stiros, S.C.; Vichas, C.; Skourtis, C. Landslide Monitoring Based on Geodetically Derived Distance Changes. J. Surv. Eng. 2004, 130, 156–162. [Google Scholar] [CrossRef]
- Tsaia, Z.; Youa, G.J.Y.; Leea, H.Y.; Chiub, Y.J. Use of a total station to monitor post-failure sediment yields in landslide sites of the Shihmen reservoir watershed. Geomorphology 2012, 139–140, 438–451. [Google Scholar] [CrossRef]
- Simeoni, L.; Ferro, E.; Tombolato, S. Reliability of Field Measurements of Displacements in Two Cases of Viaduct-Extremely Slow Landslide Interactions. Eng. Geol. Soc. Territ. 2015, 2, 125–128. [Google Scholar]
- Turner, D.; Lucieer, A.; De Jong, S.M. Time Series Analysis of Landslide Dynamics Using an Unmanned Aerial Vehicle (UAV). Remote Sens. 2015, 7, 1736–1757. [Google Scholar] [CrossRef] [Green Version]
- Al-Rawabdeh, A.; Moussa, A.; Foroutan, M.; El-Sheimy, N.; Habib, A. Time Series UAV Image-Based Point Clouds for Landslide Progression Evaluation Applications. Sensors 2017, 17, 2378. [Google Scholar] [CrossRef] [PubMed] [Green Version]
- Devoto, S.; Macovaz, V.; Mantovani, M.; Soldati, M.; Furlani, S. Advantages of Using UAV Digital Photogrammetry in the Study of Slow-Moving Coastal Landslides. Remote Sens. 2020, 12, 3566. [Google Scholar] [CrossRef]
- Sestras, P.; Roșca, S.; Bilașco, Ș.; Naș, S.; Buru, S.M.; Kovacs, L.; Spalević, V.; Sestras, A.F. Feasibility Assessments Using Unmanned Aerial Vehicle Technology in Heritage Buildings: Rehabilitation-Restoration, Spatial Analysis and Tourism Potential Analysis. Sensors 2020, 20, 2054. [Google Scholar] [CrossRef] [Green Version]
- Bilasco, S.; Roşca, S.; Petrea, D.; Vescan, I.; Fodorean, I.; Filip, S. 3D Reconstruction of Landslides for the Acquisition of Digital Databases and Monitoring Spatiotemporal Dynamics of Landslides Based on GIS Spatial Analysis and UAV Techniques. In Spatial Modeling in GIS and R for Earth and Environmental Sciences; Pourghasemi, H.R., Gokceoglu, C., Eds.; Elsevier: Amsterdam, The Netherlands, 2019; pp. 451–465. [Google Scholar]
- Ghorbanzadeh, O.; Didehban, K.; Rasouli, H.; Kamran, K.V.; Feizizadeh, B.; Blaschke, T. An Application of Sentinel-1, Sentinel-2, and GNSS Data for Landslide Susceptibility Mapping. ISPRS Int. J. Geo Inf. 2020, 9, 561. [Google Scholar] [CrossRef]
- Matei, I.; Pacurar, I.; Rosca, S.; Bilasco, S.; Sestras, P.; Rusu, T.; Jude, E.T.; Tăut, F.D. Land Use Favourability Assessment Based on Soil Characteristics and Anthropic Pollution. Case Study Somesul Mic Valley Corridor, Romania. Agronomy 2020, 10, 1245. [Google Scholar] [CrossRef]
- Bilaşco, S.; Govor, C.; Roşca, S.; Vescan, I.; Filip, S.; Fodorean, I. GIS model for identifying urban areas vulnerable to noise pollution: Case study. Front. Earth Sci. 2016, 11, 214–228. [Google Scholar] [CrossRef]
- Petrea, D.; Bilasco, S.; Rosca, S.; Vescan, I.; Fodorean, I. The determination of the landslide occurrence probability by GIS spatial analysis of the land morphometric characteristics (Case Study: The Transylvanian Plateau). Carpathian J. Earth Environ. Sci. 2014, 9, 91–102. [Google Scholar]
- Sestras, P.; Bondrea, M.; Cetean, H.; Sălăgean, T.; Bilaşco, Ş.; Naș, S.; Spalevic, V.; Fountas, S.; Cîmpeanu, S. Ameliorative, ecological and landscape roles of Făget Forest, Cluj-Napoca, Romania, and possibilities of avoiding risks based on GIS landslide susceptibility map. Not. Bot. Horti Agrobo. 2018, 46, 292–300. [Google Scholar] [CrossRef] [Green Version]
- Bălteanu, D.; Micu, M.; Jurchescu, M.; Malet, J.-P.; Sima, M.; Kucsicsa, G.; Dumitrică, C.; Petrea, D.; Mărgărint, M.C.; Bilaşco, S.T.; et al. National-scale landslide susceptibility map of Romania in a European methodological framework. Geomorphology 2020, 371, 107432. [Google Scholar] [CrossRef]
- Irimuș, I.-A.; Roșca, S.; Rus, M.-I.; Marian, F.L.; Bilașco, S. Landslide susceptibility assessment in Almas Basin by means of the frequency rate and GIS techniques. Geogr. Technol. 2017, 12, 97–109. [Google Scholar] [CrossRef] [Green Version]
- Jaedicke, C.; Van Den Eeckhaut, M.; Nadim, F.; Hervás, J.; Kalsnes, B.; Vangelsten, B.V.; Smith, J.T.; Tofani, V.; Ciurean, R.; Winter, M.G. Identification of landslide hazard and risk ‘hotspots’ in Europe. Bull. Eng. Geol. Environ. 2014, 73, 325–339. [Google Scholar] [CrossRef] [Green Version]
- Jebur, M.N.; Pradhan, B.; Shafri, H.Z.M.; Yusoff, Z.M.; Tehrany, M.S. An integrated user-friendly ArcMAP tool for bivariate statistical modelling in geoscience applications. Geosci. Model Dev. 2015, 8, 881–891. [Google Scholar] [CrossRef] [Green Version]
- Borrelli, L.; Ciurleo, M.; Gullà, G. Shallow Landslide Susceptibility Assessment in Granitic Rocks Using Gis-Based Statistical Methods: The Contribution of the Weathering Grade Map. Landslides 2018, 15, 1127–1142. [Google Scholar] [CrossRef]
- Ciurleo, M.; Cascini, L.; Calvello, M. A comparison of statistical and deterministic methods for shallow landslide susceptibility zoning in clayey soils. Eng. Geol. 2017, 223, 71–81. [Google Scholar] [CrossRef]
- Bilaşco, Ş.; Roşca, S.; Păcurar, I.; Moldovan, N.; Boţ, A.; Negrușier, C.; Sestras, P.; Bondrea, M.; Naș, S. Identification of Land Suitability for Agricultural Use by Applying Morphometric and Risk Parameters Based on GIS Spatial Analysis. Not. Bot. Horti Agrobo. 2016, 44, 302–312. [Google Scholar] [CrossRef] [Green Version]
- Chalkias, C.; Ferentinou, M.; Polykretis, C. GIS Supported Landslide Susceptibility Modeling at Regional Scale: An Expert-Based Fuzzy Weighting Method. ISPRS Int. J. Geo Inf. 2014, 3, 523–539. [Google Scholar] [CrossRef] [Green Version]
- Vakhshoori, V.; Zare, M. Is the ROC curve a reliable tool to compare the validity of landslide susceptibility maps? Geomat. Nat. Hazards Risk 2018, 9, 249–266. [Google Scholar] [CrossRef] [Green Version]
- Kerekes, A.-H.; Poszet, S.L.; Gál, A. Landslide susceptibility assessment using the maximum entropy model in a sector of the Cluj-Napoca Municipality, Romania. Rev. Geomorf. 2018, 20, 130–146. [Google Scholar] [CrossRef]
- Akturk, E.; Altunel, A.O. Accuracy assesment of a low-cost UAV derived digital elevation model (DEM) in a highly broken and vegetated terrain. Measurement 2019, 136, 382–386. [Google Scholar] [CrossRef]
- Gong, C.; Lei, S.; Bian, Z.; Liu, Y.; Zhang, Z.; Cheng, W. Analysis of the development of an erosion gully in an open-cast coal mine dump during a winter freeze-thaw cycle by using low-cost UAVs. Remote Sens. 2019, 11, 1356. [Google Scholar] [CrossRef] [Green Version]
- Han, X.; Thomasson, J.A.; Xiang, Y.; Gharakhani, H.; Yadav, P.K.; Rooney, W.L. Multifunctional Ground Control Points with a Wireless Network for Communication with a UAV. Sensors 2019, 19, 2852. [Google Scholar] [CrossRef] [Green Version]
- Lendzioch, T.; Langhammer, J.; Jenicek, M. Estimating Snow Depth and Leaf Area Index Based on UAV Digital Photogrammetry. Sensors 2019, 19, 1027. [Google Scholar] [CrossRef] [Green Version]
- Okeson, T.J.; Barrett, B.J.; Arce, S.; Vernon, C.A.; Franke, K.W.; Hedengren, J.D. Achieving Tiered Model Quality in 3D Structure from Motion Models Using a Multi-Scale View-Planning Algorithm for Automated Targeted Inspection. Sensors 2019, 19, 2703. [Google Scholar] [CrossRef] [Green Version]
- Cignetti, M.; Godone, D.; Wrzesniak, A.; Giordan, D. Structure from Motion Multisource Application for Landslide Characterization and Monitoring: The Champlas du Col Case Study, Sestriere, North-Western Italy. Sensors 2019, 19, 2364. [Google Scholar] [CrossRef] [Green Version]
- Oniga, V.-E.; Pfeifer, N.; Loghin, A.-M. 3D Calibration Test-Field for Digital Cameras Mounted on Unmanned Aerial Systems (UAS). Remote Sens. 2018, 10, 2017. [Google Scholar] [CrossRef] [Green Version]
- Oniga, V.-E.; Breaban, A.-I.; Pfeifer, N.; Chirila, C. Determining the Suitable Number of Ground Control Points for UAS Images Georeferencing by Varying Number and Spatial Distribution. Remote Sens. 2020, 12, 876. [Google Scholar] [CrossRef] [Green Version]
- Spalevic, V.; Barovic, G.; Vujacic, D.; Curovic, M.; Behzadfar, M.; Djurovic, N.; Dudic, B.; Billi, P. The Impact of Land Use Changes on Soil Erosion in the River Basin of Miocki Potok, Montenegro. Water 2020, 12, 2973. [Google Scholar] [CrossRef]
- Chalise, D.; Kumar, L.; Spalevic, V.; Skataric, G. Estimation of Sediment Yield and Maximum Outflow Using the IntErO Model in the Sarada River Basin of Nepal. Water 2019, 11, 952. [Google Scholar] [CrossRef] [Green Version]
- Hazbavi, Z.; Sadeghi, S.H.; Gholamalifard, M. Dynamic analysis of soil erosion-based watershed health. Geogr. Environ. Sustain. 2019, 12, 43–59. [Google Scholar] [CrossRef] [Green Version]
- Nikolic, G.; Spalevic, V.; Curovic, M.; Khaledi Darvishan, A.; Skataric, G.; Pajic, M.; Kavian, A.; Tanaskovik, V. Variability of Soil Erosion Intensity Due to Vegetation Cover Changes: Case Study of Orahovacka Rijeka, Montenegro. Not. Bot. Horti Agrobot. Cluj Napoca 2018, 47, 237–248. [Google Scholar] [CrossRef] [Green Version]
- Gocić, M.; Dragićević, S.; Radivojević, A.; Martić Bursać, N.; Stričević, L.; Đorđević, M. Changes in Soil Erosion Intensity Caused by Land Use and Demographic Changes in the Jablanica River Basin, Serbia. Agriculture 2020, 10, 345. [Google Scholar] [CrossRef]
- Wessa, P. Free Statistics Software, Office for Research Development and Education. Version (v1.2.1). 2020. Available online: https://www.wessa.net/ (accessed on 4 January 2021).
- Tosic, R.; Dragicevic, S.; Zlatic, M.; Todosijevic, M.; Kostadinov, S. The impact of socio-demographic changes on land use and soil erosion (case study: Ukrina River catchment). Geogr. Rev. 2012, 46, 69–78. [Google Scholar]
- Čurović, Ž.; Čurović, M.; Spalević, V.; Janic, M.; Sestras, P.; Popović, S.G. Identification and Evaluation of Landscape as a Precondition for Planning Revitalization and Development of Mediterranean Rural Settlements—Case Study: Mrkovi Village, Bay of Kotor, Montenegro. Sustainability 2019, 11, 2039. [Google Scholar] [CrossRef] [Green Version]
- Spalevic, V.; Barovic, G.; Fikfak, A.; Kosanovic, S.; Djurovic, M.; Popovic, S. Sediment yield and Land use changes in the Northern Montenegrin Watersheds: Case study of Seocki Potok of the Polimlje Region. J. Environ. Prot. Ecol. 2016, 17, 990–1002. [Google Scholar]


| Control Point | Geodetic Coordinates WGS84 | Stereographic 1970 Coordinates | ||||
|---|---|---|---|---|---|---|
| Geodetic Latitude | Geodetic Longitude | Ellipsoidal Altitude | X [m] | Y [m] | Normal Altitude [m] (Quasigeoid) | |
| P1 | 46°45′52.08593″N | 23°31′50.01769″E | 442.299 | 586,030.984 | 387,897.331 | 401.273 |
| P2 | 46°45′54.10074″N | 23°31′44.52045″E | 438.808 | 586,095.348 | 387,781.876 | 397.779 |
| P3 | 46°45′55.55597″N | 23°31′42.45429″E | 442.286 | 586,141.087 | 387,738.883 | 401.257 |
| P4 | 46°45′57.19164″N | 23°31′47.58694″E | 484.077 | 586,189.558 | 387,848.699 | 443.053 |
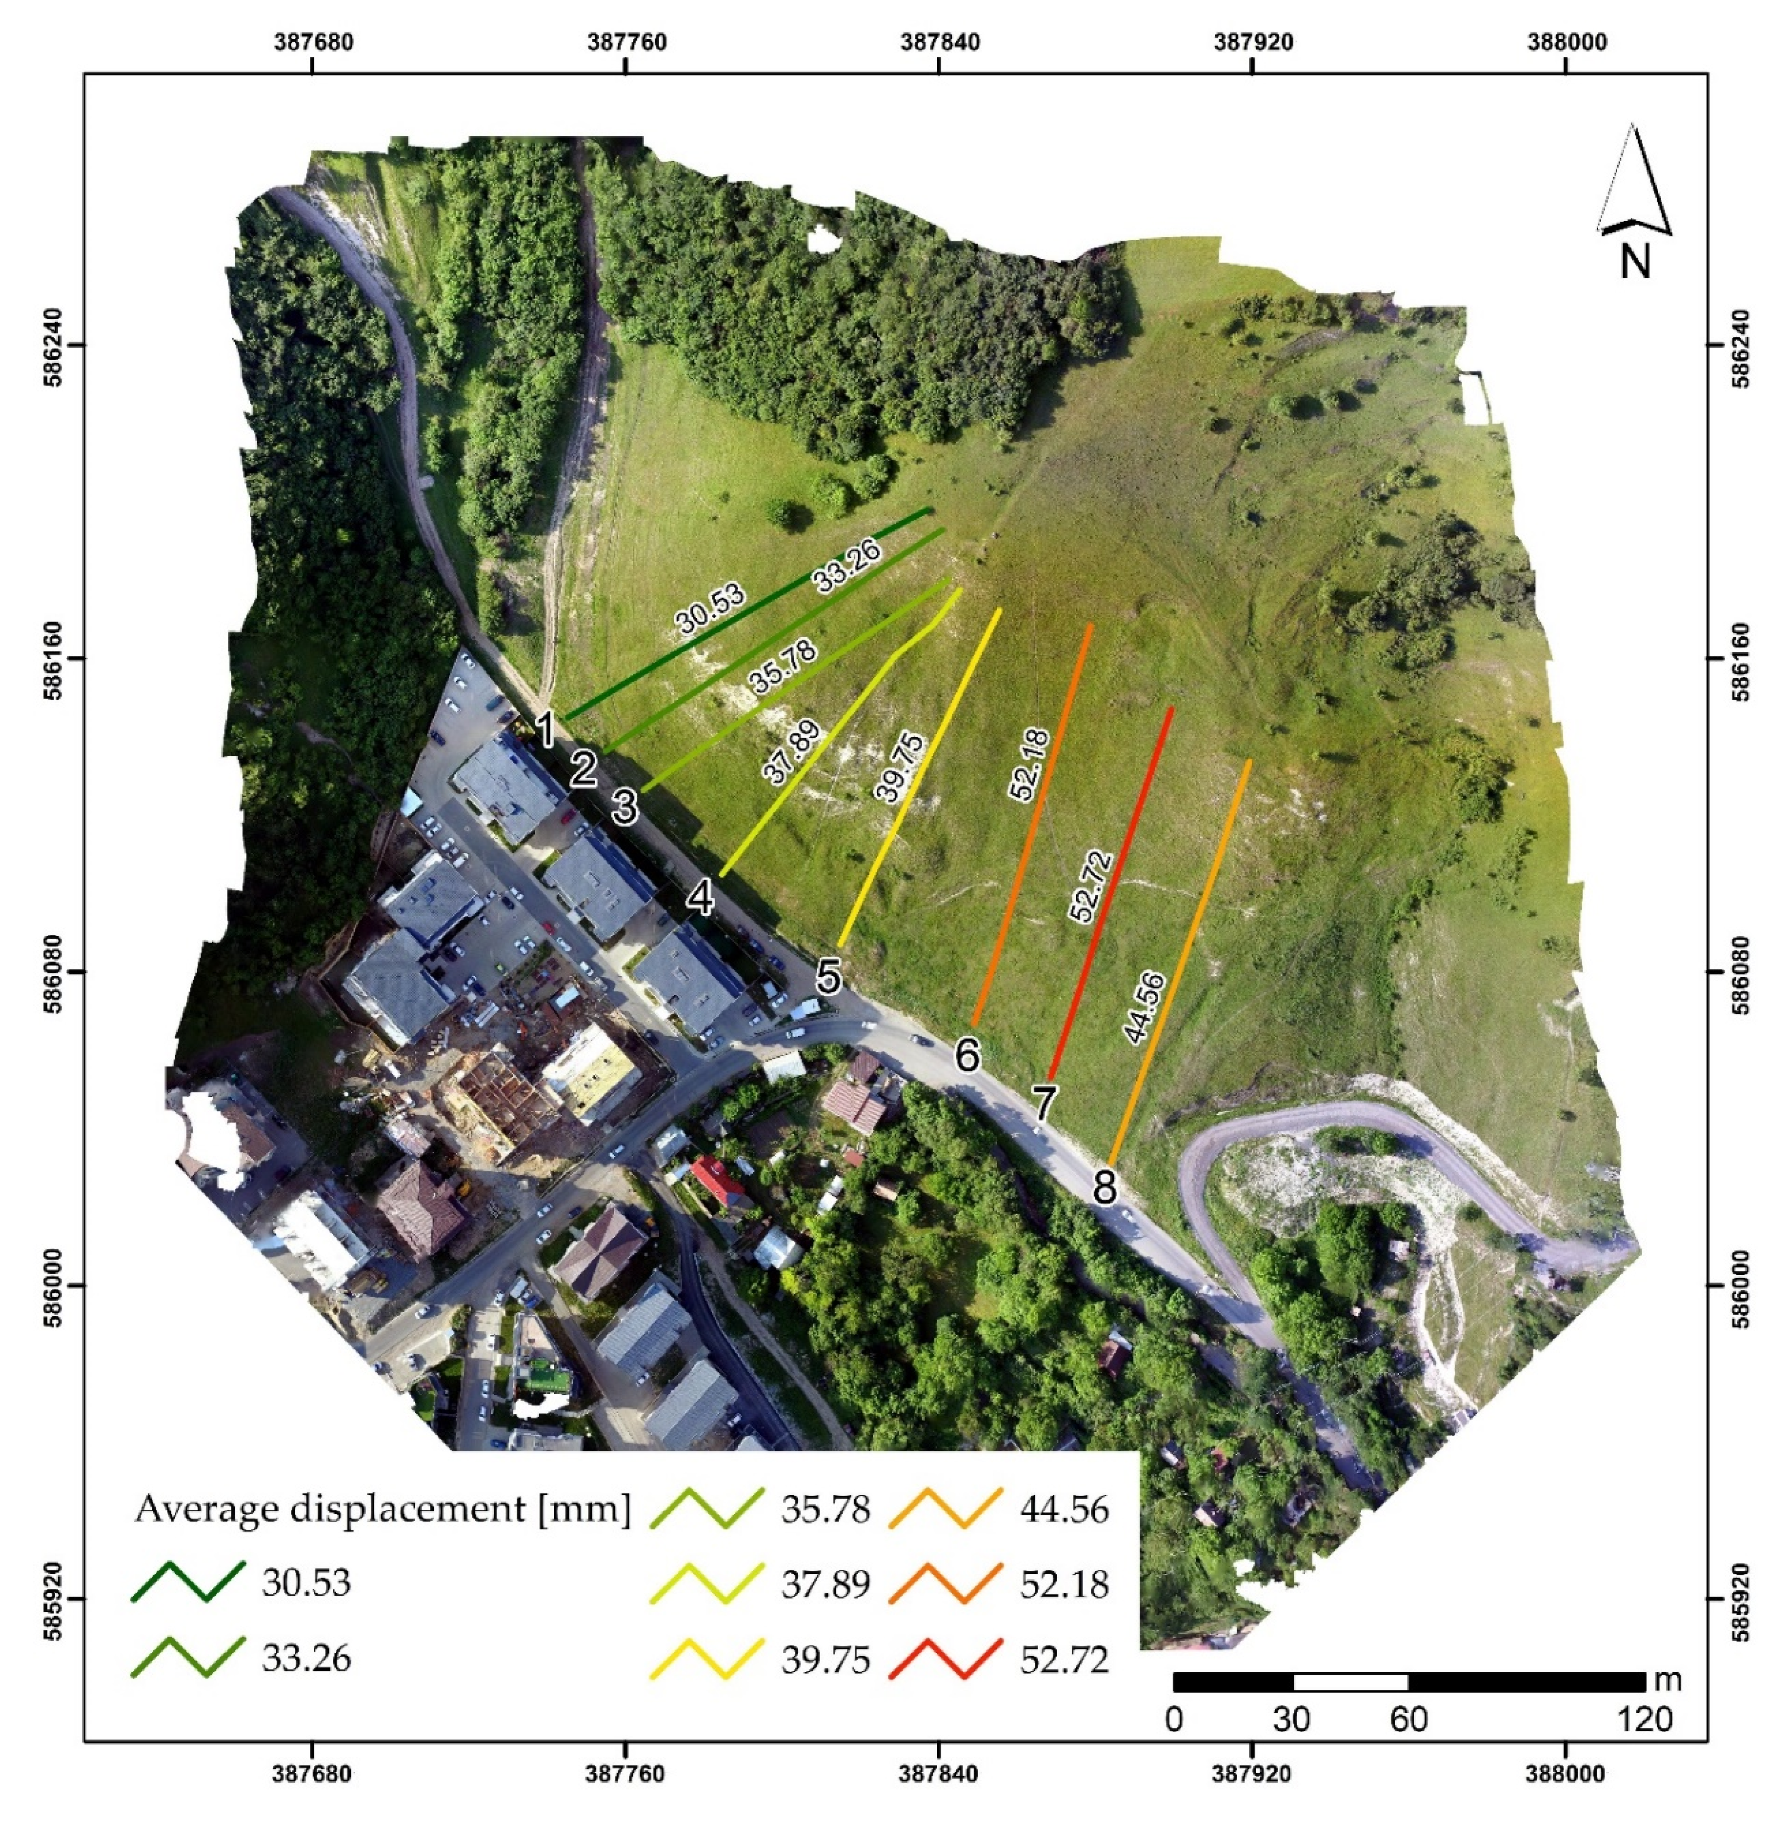
| Alignment | Elevation Diff. [m] | Alignment Length [m] | Tilt Angle [gon] | Slope [%] | Av. Displacement [mm] |
|---|---|---|---|---|---|
| 1 | 40.108 | 106.026 | 23.0189 | 36.16 | 33.26 |
| 2 | 40.310 | 102.915 | 23.7661 | 37.33 | 30.53 |
| 3 | 37.223 | 94.763 | 23.8260 | 37.43 | 35.78 |
| 4 | 39.930 | 95.029 | 25.3239 | 39.78 | 37.89 |
| 5 | 39.792 | 94.528 | 25.3653 | 39.84 | 39.75 |
| 6 | 39.039 | 105.919 | 22.4760 | 35.31 | 52.18 |
| 7 | 34.730 | 98.921 | 21.4950 | 33.76 | 52.72 |
| 8 | 35.871 | 108.580 | 20.3124 | 31.91 | 44.56 |
Publisher’s Note: MDPI stays neutral with regard to jurisdictional claims in published maps and institutional affiliations. |
© 2021 by the authors. Licensee MDPI, Basel, Switzerland. This article is an open access article distributed under the terms and conditions of the Creative Commons Attribution (CC BY) license (http://creativecommons.org/licenses/by/4.0/).
Share and Cite
Sestras, P.; Bilașco, Ș.; Roșca, S.; Dudic, B.; Hysa, A.; Spalević, V. Geodetic and UAV Monitoring in the Sustainable Management of Shallow Landslides and Erosion of a Susceptible Urban Environment. Remote Sens. 2021, 13, 385. https://0-doi-org.brum.beds.ac.uk/10.3390/rs13030385
Sestras P, Bilașco Ș, Roșca S, Dudic B, Hysa A, Spalević V. Geodetic and UAV Monitoring in the Sustainable Management of Shallow Landslides and Erosion of a Susceptible Urban Environment. Remote Sensing. 2021; 13(3):385. https://0-doi-org.brum.beds.ac.uk/10.3390/rs13030385
Chicago/Turabian StyleSestras, Paul, Ștefan Bilașco, Sanda Roșca, Branislav Dudic, Artan Hysa, and Velibor Spalević. 2021. "Geodetic and UAV Monitoring in the Sustainable Management of Shallow Landslides and Erosion of a Susceptible Urban Environment" Remote Sensing 13, no. 3: 385. https://0-doi-org.brum.beds.ac.uk/10.3390/rs13030385